THE EFFECTS OF PRIVATE EQUITY AND VENTURE CAPITAL...
64
Electronic copy available at: http://ssrn.com/abstract=2479574 THE EFFECTS OF PRIVATE EQUITY AND VENTURE CAPITAL ON SALES AND EMPLOYMENT GROWTH IN SMALL AND MEDIUM- SIZED BUSINESSES John K. Paglia 1 Associate Professor of Finance Graziadio School of Business and Management Pepperdine University E-mail: [email protected] and Maretno A. Harjoto Associate Professor of Finance Graziadio School of Business and Management Pepperdine University E-mail: [email protected] Original Version: July 31, 2012 This Version: June 5, 2014 Please do not quote without permission ABSTRACT We study the effects private equity (PE) and venture capital (VC) financing have on small and mid-sized single entity business establishments from 1995-2009. We focus on single entity establishments to cleanly examine the impact of PE and VC financing on establishments’ organic growth. This study reveals that PE and VC financing have positive impacts on single entity business establishments’ net sales and employment growth. The impact of PE financing on establishments’ growth is slower and smaller than VC financing. However, we find that the benefit of PE financing lasts longer than VC financing. We also find that ethnic minority, female, and foreign business owners are less likely to receive PE and VC financing. Finally, we find evidence that although establishments with government contracts are more likely to receive PE and VC financing, those contracts fail to produce marginal post-funding growth and employment benefits. JEL Classifications: G24; J23; J15; J16; L25 Keywords: private equity; venture capital; growth; employment; sales 1 We would like to thank The Institute for Exceptional Growth Companies (IEGC) for the data and generous support. The IEGC is a partnership between the Edward Lowe Foundation and the NASDAQ OMX Educational Foundation. We would also like to thank Nancy Dodd and Chanel Curry-Brooks for their research assistance.
Transcript of THE EFFECTS OF PRIVATE EQUITY AND VENTURE CAPITAL...

Electronic copy available at: http://ssrn.com/abstract=2479574
THE EFFECTS OF PRIVATE EQUITY AND VENTURE CAPITAL ON SALES AND EMPLOYMENT GROWTH IN SMALL AND MEDIUM-
SIZED BUSINESSES
John K. Paglia1 Associate Professor of Finance
Graziadio School of Business and Management Pepperdine University
E-mail: [email protected]
and
Maretno A. Harjoto Associate Professor of Finance
Graziadio School of Business and Management Pepperdine University
E-mail: [email protected]
Original Version: July 31, 2012 This Version: June 5, 2014
Please do not quote without permission
ABSTRACT
We study the effects private equity (PE) and venture capital (VC) financing have on small and mid-sized single entity business establishments from 1995-2009. We focus on single entity establishments to cleanly examine the impact of PE and VC financing on establishments’ organic growth. This study reveals that PE and VC financing have positive impacts on single entity business establishments’ net sales and employment growth. The impact of PE financing on establishments’ growth is slower and smaller than VC financing. However, we find that the benefit of PE financing lasts longer than VC financing. We also find that ethnic minority, female, and foreign business owners are less likely to receive PE and VC financing. Finally, we find evidence that although establishments with government contracts are more likely to receive PE and VC financing, those contracts fail to produce marginal post-funding growth and employment benefits. JEL Classifications: G24; J23; J15; J16; L25 Keywords: private equity; venture capital; growth; employment; sales
1 We would like to thank The Institute for Exceptional Growth Companies (IEGC) for the data and generous support. The IEGC is a partnership between the Edward Lowe Foundation and the NASDAQ OMX Educational Foundation. We would also like to thank Nancy Dodd and Chanel Curry-Brooks for their research assistance.

Electronic copy available at: http://ssrn.com/abstract=2479574
1
I. Introduction
Private equity, and to a larger extent, venture capital funds are often criticized for not
producing sufficient returns to limited partners. Venture capital has returned just a 6.07%
average annual return for the 10-year period ended September 30, 2012, while private equity
averaged 13.71%.2 Meanwhile, over the same time frame, the NASDAQ averaged 10.27% per
year. Despite the weak performance, the number of private equity funds has grown considerably.
Given the generally weak returns, one may wonder if private equity and venture capital investing
play significant roles to provide capital to privately owned businesses to grow. Do private equity
and venture capital provide capital for diverse groups of business owners? Do they contribute to
increased revenue and employment? Recent studies have examined the relationships between
private equity leveraged buyouts and job creation/destruction (Davis, Haltiwanger, Jarmin,
Lerner, and Miranda, 2011; Amess and Wright, 2012) and offer somewhat mixed views.
However, these studies are focused on large firms where the opportunities for cost cutting are
significant and access to capital, mostly via public sources where costs are relatively cheap, is
almost guaranteed. Existing studies also fail to examine organic growth as they do not utilize
single entity establishment level data.
This study takes a closer look at two main roles of private equity (PE) and venture capital
(VC) financing: (1) What types of business owners’ characteristics are more likely to receive PE
and VC financing? (2) What is the differential impact of private equity (PE) and venture capital
(VC) financing on small and medium-sized business establishments’ net sales and employment
growth? We focus on single entity establishments to closely examine the impact of PE and VC
2 Cambridge Associates LLC U.S. Venture Capital Index and Selected Benchmark Statistics, September 30, 2012. http://www.cambridgeassociates.com/pdf/Venture%20Capital%20Index.pdf. And Cambridge Associates LLC U.S. Private Equity Index and Selected Benchmark Statistics, September 30, 2012. http://www.cambridgeassociates.com/pdf/Private%20Equity%20Index.pdf.

2
financing on business establishments’ organic growth. By examining data at the single
establishment level, we are better able to isolate the impacts of receiving capital on the single
business entity that is the beneficiary of such financing. This approach reduces the confounding
noise associated with investigating acquisition and divestiture activities within a corporate entity
with multiple business units and aggregated firm level data. This differentiates our study from
other research in this area. For example, compared to Davis, Haltiwanger, Jarmin, Lerner, and
Miranda (2011), our study examines the impact of both PE and VC on single entity
establishment sales growth in addition to employment growth. Compare to Puri and Zarutskie
(2012) as well as Chemmanur, Krishnan and Nandy (2011), our study covers smaller business
entities with lower numbers of employees and smaller revenues. Relative to Guo, Hotchkiss and
Song (2011), our business establishments are significantly smaller than $100 million.
Furthermore, our sample covers more recent private equity transactions--those occurring after
2006. More importantly, our study compares the timing and long lasting impact of PE and VC
financing on net sales and employment growth at the single entity establishments level.
Neumark, Wall and Zhang (2011) find that small businesses create more jobs than the
rest of their sample. Still, the benefits of private equity investment in small and mid-sized
businesses are not completely understood, in part because access to private equity capital for
most small and mid-sized businesses is elusive and, as a result, data are sparse.3 In fact,
according to a recent report by the Pepperdine Private Capital Markets Project, just 15% of
businesses that attempted to tap private equity in the second quarter of 2012 were successful.4
For small and mid-sized companies, obtaining capital from private equity and venture capital
3 The Small Business Association defines small and mid-sized businesses as businesses with the average annual sales of $12 million with less than 500 employees. http://www.sba.gov/content/table-small-business-size-standards. 4 Private Capital Access Survey Responses, Q2 2012. http://bschool.pepperdine.edu/appliedresearch/research/pcmsurvey/content/Q2_2012_PCA.pdf.
3
often determines whether or not these business establishments survive. The consequences to
those not successful raising capital are often severe. Citing the same Pepperdine research, for
those businesses seeking capital, a failed attempt is expected to yield the following results:
slower revenue growth (71%); hiring fewer employees than planned (54%); and reducing the
number of employees (23%). These data suggest that private equity and venture capital play
more important roles regarding growth and job creation in the small and medium-sized business
space than for large businesses.
Several studies report on the impacts of venture capital (VC) financing on firms’ growth
and efficiency. Engel and Keilbach (2002), Davila, Foster, and Gupta (2003), and Alemany and
Marti (2005) empirically show that VC-backed firms have significantly higher revenues and
employment growth rates than non-VC-backed firms. Chemmanur, Krishnan and Nandy (2011)
also find that VC-backed firms have higher operating efficiency than non-VC-backed firms due
to screening and monitoring. Puri and Zarutskie (2012) report a performance gap between VC
and non-VC financed firms. However, little is known about the scarce allocation of venture
capital among various types of business owners. According to the Pepperdine Private Capital
Markets Project, just 9% of businesses that attempted to tap into venture capital in the second
quarter of 2012 were successful.5
In this study, we utilize the Institute for Exceptional Growth Companies (IEGC) or
National Establishment Time-Series (NETS) database, which includes employment time series
data on over 44 million business establishments during 1990-2009. The NETS database is
coupled with private equity and venture capital transaction information from the Pitchbook
database, as well as financial data from Dun & Bradstreet from 1995-2009. Because our research
5 Private Capital Access Survey Responses, Q2 2012. http://bschool.pepperdine.edu/appliedresearch/research/pcmsurvey/content/Q2_2012_PCA.pdf.

4
focuses on the establishment level, these databases allow us to clearly investigate the impacts of
PE and VC on organic growth of small and mid-sized businesses, which are vital to the
economy.6 To better understand their roles, our study investigates two relationships: 1) The
owners’ characteristics displayed that result in increased rates of successfully securing PE or VC
financing; and 2) The revenue and employment growth (or destruction) that occurs with PE
versus VC financing at these establishments.
In order to investigate, we begin by constructing matched pair samples between single
entity establishments that received PE or VC financing with those that never received PE or VC
financing (control group). We further refine our sample by selecting single entity establishments
that have only grown organically. That is, our sample excludes those businesses that have
engaged in acquisitions or divestitures. We also analyze and present the results for
establishments that received only one round of PE or VC financing instead of those with multiple
rounds of financing. We find consistent evidence that minority (non-Caucasian), women, and
foreign business owners’ establishments are significantly less likely to receive PE and VC
financing. This finding is consistent with the existing literature (Carter and Allen, 1997; Robb
and Fairlie, 2007; Cole and Mehran, 2011).
We also find that PE financing is not immediately impactful, either negatively or
positively, in affecting the establishments’ sales and employment growth rates in the year of
financing. However, we do find that PE financing increases establishments’ sales and
employment growth rates for three consecutive years after funding. This finding suggests it takes
some time to develop and execute on new strategies. By contrast, we find that VC financing
immediately increases establishments’ sales and employment growth rates indicating that a VC
6 Small businesses represent 63% of net new private-sector jobs, 48.5% of private sector employment, and 46% of private-sector output. SBA Office of Advocacy, Frequently Asked Question, March 2014. http://www.sba.gov/sites/default/files/FAQ_March_2014_0.pdf..

5
capital infusion is crucial for these businesses to execute their strategies. These findings indicate
that PE and VC financing provide different impacts in terms of timing and sustainability of
growth for small and mid-sized single entity business establishments. Our analysis also shows
that business establishments with the government contracts are more likely to secure PE or VC
financing. However, establishments with government contracts do not necessarily have higher
sales and employment growth. While government contracts provide certifications and stable cash
flows that allow business owners to secure funding from PE or VC, government contracts
themselves do not provide growth. Our findings are robust throughout all additional tests.
The rest of this paper is organized as follows. In section II, we discuss existing literature
that is relevant to our study. Section III describes the database comprised of IEGC (NETS), Dun
& Bradstreet (D&B), and Pitchbook data, matching process, sample distribution, and univariate
analysis. Section IV explains the methodology of regression estimations, hypotheses, and
structural regression models. Section V discusses the first stage and second stage regression
results. We examine the results from additional tests and robustness checks in section VI.
Finally, section VII concludes with a summary of the main contributions of this study.
II. Literature review
Several studies have examined the impact of business owners’ access to capital and
demographics on firms’ growth. Although the growth of women- and minority-owned businesses
are increasing at a rapid rate, it has been shown that both demographics are less likely to access
venture capital. Each demographic group experiences their own set of complications that has
fostered varying ideologies on their competency, affected their firms’ leverage, and has further
altered their confidence in their ability to secure external financing.

6
Bates and Bradford (2008) report that minority-owned firms are capital constrained,
which could be attributed to their differential treatment in financial markets. Robb (2012) reports
minority-owned businesses experience higher loan denial probabilities and pay higher interest
rates than non-minority-owned businesses. Hedge and Tumlinson (2011) identifies that VCs on
average are more likely to invest in a startup when the VC and company have top level personnel
of the same ethnicity, and co-ethnicity’s predictive power is highest for early-round investments.
Interestingly, Hedge and Tumlinson (2011) also finds that VCs tend to invest in geographically
close companies, because collocation, like co-ethnicity, arguably facilitates superior monitoring
and management of investments (Lerner 1995; Sorenson and Stuart 2005). The tendency of
individuals to associate with others based on similar ascriptive characteristics is frequently
referred to as homophily (Becker-Blease and Sohl 2007). These facts further reveal the
disadvantage that minorities experience when seeking external financing. However, these
financial restraints are not restricted to minorities only, but affect women entrepreneurs as well.
Women-owned businesses faced greater credit constraints than did similar startups owned
by men and were slightly less likely to have high credit scores, compared with men (Robb 2012).
Cole and Mehran (2011) further explain this in their findings that female business owners’ firms
are more likely to be credit constrained because they are more likely to be discouraged from
applying for credit and more likely to be denied credit when they do apply. After conducting a
study on the availability of credit to entrepreneurs of both genders, Marlow and Patton (2005)
determined that women reported fewer problems with bank finance because they were less
inclined to apply for such funding in the first instance as they presupposed failure.
Becker, Blease, and Sohl (2007) determine that women business owners are more likely
to use angel capital financing rather than venture capital, but still receive a smaller amount of

7
external financing than their male colleagues. Unlike venture capital transactions, PE backed
buyouts are much less likely to involve multiple rounds of financing (Valkama et al., 2013). This
could further explain why women and minorities receive less capital to start and manage their
ventures.
Studies have correlated the potential success of a start-up with the amount of equity
financing it secures during the early stages of the process (Becker-Blease and Sohl, 2007). Robb
(2012) establishes that Blacks and Hispanics start their firms with about half the capital that
Whites use and women start their firms with a little over half of what men invest. Fairlie and
Robb (2009) find that women-owned businesses prove to be less successful because they have
less startup capital, less business human capital, and less prior work experience. If women are
actively discriminated against or, due to lack of business experience or bargaining acumen, are in
inherently weaker bargaining positions, women-owned businesses may receive capital
investments at relatively unattractive rates compared to male-owned businesses (Becker-Blease
and Sohl, 2007). Carter elaborates upon this argument to suggest that female-owned firms
underperform in almost every respect in comparison to those owned by men and this can be
linked directly to the issue of undercapitalization (Marlow and Patton 2005). This implies that
the demand for external capital is higher for women and ethnic minority business owners.
However, they are facing greater constraints to obtain external financing.
Lower levels of access to start-up capital frequently results in lower sales and profits, less
employment, and higher business failure rates. In the first several years after receiving VC, VC-
financed firms typically grow rapidly in terms of employment and sales relative to non-VC-
financed firms and have lower failure rates relative to matched non-VC-financed firms (Puri and
Zarutskie 2012). Carter and Allen (1997) find that the focus on the financial aspects of the

8
business amount and effort required to obtain financial resources overwhelms the women
entrepreneurs’ lifestyle intentions and, thus, their chances for growth.
Based on the strand of these existing studies, we expect that owners’ demographic
characteristics significantly influence the likelihood of a business establishment to secure
funding from VC and PE. In the first stage, our study examines the likelihood of female, ethnic
minority, and business owners with foreign status7 to successfully obtain PE or VC financing.
Unlike other studies, however, we investigate at the establishment level.
The literature on the role of private equity continues to evolve with growth in the
industry. Much of the research concerns performance, governance and ownership structure,
operations, and value; however, more recently there has been increased focus on the intersection
of jobs and financing, in part because of more plentiful data for analysis. Guo, Hotchkiss and
Song (2011) examine 192 leveraged buyouts (LBOs) transactions with at least $100 million from
1990 to 2006 and compare it with the buyouts in the 1980s. They find that recent LBOs are more
conservatively priced and use less leverage. They also find that LBOs provide significantly
higher pre- and post-buyout returns while the impact on firms’ operating performance is
somewhat positive. Amess and Wright (2012) examine a data set of 533 LBOs from 1993-2004
and conclude that LBOs have no net employment effects. However, these LBO studies mostly
focus on large firms and do not examine the impact of PE financing at the establishment level. A
recent study by Davis, Haltiwanger, Jarmin, Lerner, and Miranda (2011) (DHJLM 2011
hereafter) examined this topic more thoroughly by analyzing 3,200 targets and their 150,000
establishments from Capital IQ, Dealogic, Thomson Reuters SDC, VentureXpert, and the
Longitudinal Business Database (LBD) at the U.S. Census Bureau. They conclude that LBOs
7 Existing literature has been salient about the ability of small business owners with foreign status to raise capital. Because business owners with foreign status face greater regulatory scrutiny, we believe that foreign business owners also face constraints when raising capital from PE or VC.

9
result in significant job creation and destruction, which ultimately creates a loss of less than one
percent of initial employment. However, their study does not examine the impact of LBOs on
establishments’ net sales growth.
Boucly, Sraer, Thesmar (2011) examine the impacts of LBOs on French firms and find
that corporate behavior is affected. Targets become more profitable and grow faster than their
peer group. They also increase capital expenditures. This research contrasts with previous studies
that report less investment and/or downsizing. Tykvova and Borell (2012) examine a sample of
European companies and report that LBO targets operate at reasonable debt limits, suggesting
capacity for increased capital expenditures and growth opportunities. Lerner, Sorensen, and
Stromberg (2011) investigate whether LBOs affect the firm’s focus on long-term innovations.
They find that patents applied for by firms in private equity transactions are more cited and show
no significant shifts in the fundamental growth of innovations.
The literature on venture capital (VC) is largely concentrated on the role of the VC to
generate information and to act as an intermediary between business owners and external
investors. Puri and Zarutskie (2012) discern that venture capitalists might push their companies
hard to grow quickly, deciding relatively rapidly which firms have the best chance of achieving a
successful exit and terminating those that do not in the interest of allocating more capital to the
likely winners in their portfolios. Gompers and Lerner (1999a) examine the role of venture
capital firms on certifying initial public offerings (IPOs) of firms in which they invest. The role
of venture capitalists is to generate information about these privately held firms prior to going
public.8 Existing studies also examine the role of VC on corporate governance of the firms
8 Gompers and Lerner (1999b) and Metrick (2007) provide complete coverage of characteristics, investment behavior, and roles venture capitalists play in private firms. Lerner and Schoar (2004) investigate the liquidity of private equity and venture capital investments. Phalippou and Gottschalg (2009) point out that private equity funds underperform the S&P 500 by 3%. Metrick and Yasuda (2010) contrast the performance and fee structure in private

10
beyond its traditional financial intermediary role. Hellmann and Puri (2002) indicate that VCs
play an important role in firms’ management including replacing founder CEOs with external
CEOs. Kaplan and Stromberg (2003) show that VCs set extensive corporate governance and
incentive structures at the time of their initial investments. Recent studies on venture capital
(VC) financing focus on the impact of VCs on firms’ growth and operating performance.
Chemanur, Krishnan, and Nandy (2011) find that venture capitalists contribute to firms’
efficiency by screening the firms with higher efficiency prior to financing and by monitoring the
firms during VC financing. They find that efficiency gains come from both increase in sales and
lower production costs. Puri and Zarutskie (2012) find that VC-financed firms have lower failure
rates and are larger but not more profitable than non-VC firms. However, these studies have not
examined the impact of VC financing at the establishments level.
A few studies examine the role of VC on firms’ sales and employment growth. Engel and
Keilbach (2002) find that German firms that receive venture capital (VC) financing display
higher sales growth rates. They find that VC helps business owners commercialize their products
rather than to foster new innovations. Davila, Foster, and Gupta (2003) examine 193 VC-backed
firms and compare them with 301 non-VC-backed U.S. firms and discover the positive impact of
VC financing on firms’ subsequent valuation and employment growth. Alemany and Marti
(2005) examine the role of VC on small businesses in Spain and find that employment, sales,
gross margin, total assets, intangible assets, and corporate taxes grow faster in VC-backed firms
than non-VC-backed firms over three consecutive years. Puri and Zarutskie (2012) studied this
further and found that after VC financing, companies saw a very rapid growth in the employment
equity funds from buyouts versus venture capital. Lerner (2011) indicates a declining trend of private equity in recent years. Ivashina and Kovner (2011) find that firms that received private equity financing also receive favorable loan terms. Demiroglu and James (2010) find that the reputation of the private equity group determines the success of LBO transactions.

11
of VC-financed firms relative to non-VC-financed firms. While VC-financed and non-VC-
financed firms are matched at an average of 26 employees each, three years later VC-financed
firms have on average 55 employees while non-VC-financed firms have 38 employees (Puri and
Zarutskie 2012). Therefore, growth in variables such as sales, gross margin, and employment
should be related to the increase in assets that results from both VC funding and an easier access
to other external sources of funds (Martí, Menéndez-Requejo, and Rottke 2013).
Beck, Demirgüç-Kunt, and Maksimovic (2008) report that firms that undergo more
financial obstacles tend to use more external financing. Commonly, this results in a cycle of
more financial obstacles and the need for more external financing. With a study conducted in 48
countries, Beck et al. (2008) concluded that firm size, financial development, and property rights
protection were important factors in explaining the observed variation in financing patterns. By
comparison, larger firms are able to rely on different sources of external financing in order to
increase capital with more ease than small firms.
Overall, the existing literature indicates that the impact of both PE and VC on firms’
growth and operating performance is still mixed. More importantly, the literature has not made a
direct comparison between the timing and long lasting impact of PE versus VC financing on the
single entity establishment level for small and mid-sized businesses. Therefore, there still exists a
significant knowledge gap with regard to understanding the role of private equity and venture
capital on small and mid-sized establishments’ growth and employment where access to capital
is unlikely for most. Our research fills this gap.
III. Sample data
This study utilizes the Institute for Exceptional Growth Companies (IEGC) database,
which includes the National Establishment Time-Series (NETS) data provided from Walls &

12
Associates.9 Walls & Associates in collaboration with Dun & Bradstreet (D&B) marketing
information created the entire NETS database, which contains 350 longitudinal data variables
such as annual net sales, employment, business owners’ demographic, and geographic locations
for 44,241,504 business establishments between January 1990 and January 2010.10 Several
studies have utilized and have validated the accuracy of the NETS database (Neumark, Wall, and
Zhang, 2011; Toffel and Short, 2011; Levine and Toffel, 2010).11 We compare the NETS
database with U.S. Census data. Panel A of Appendix A presents a comparison of total
employment from the Business Dynamic Statistics data from the U.S. Census with the NETS
database. We find that NETS contains a higher number of establishments and therefore reports
larger employment numbers from 1995 to 2010.12 Neumark, Wall, and Zhang (2011) explain that
employment from the NETS database is larger than U.S. Census data because NETS counts each
job in each business establishment and the NETS has better coverage of small business owners
than the U.S. Census.
We also compare the total net sales receipts between the Statistics of U.S. Businesses and
NETS for 1997, 2002, and 2007.13 Panel B of Appendix A shows that the total sales receipts
from NETS is smaller than sales receipts from the Statistics of U.S. Businesses despite NETS
containing more establishments. These findings suggest that the NETS database may
9 Information for the NETS database variables is available online from the Institute for Exceptional Growth Companies (IEGC) at http://143.235.14.134/downloads/NETSDatabaseDescription2013.pdf. 10 Walls & Associates estimates establishment sales by using the firm-level reported sales (when available) and employment to allocate sales to all of the firm’s establishments (even though some may be “intermediate production and distribution facilities”). The point is that these establishments will not directly have sales; but the estimates are intended to capture their overall contribution to revenue of the firm. Employment for each establishment in the NETS database is an actual number of employees rather than an estimated number of employees. January 1990 represents 1989 calendar year data and January 2010 represents 2009 calendar year data. 11 See http://143.235.14.134/insights.iegc for a complete list of existing studies that utilize the NETS and D&B database. 12 The Business Dynamic Statistics data from the U.S. Census is compiled every mid-March while the NETS database is compiled every January. 13 The Statistics of U.S. Businesses collects total sales receipts every 5 years. The first year collected relevant to our study is 1992.

13
overestimate the numbers of employment and/or it may underestimate the net sales receipt per
establishment. To address these concerns, we conduct two additional robustness tests to verify
our results in Section IV.
The IEGC merged the NETS database with data from Pitchbook, which contains
information on whether these establishments received private equity (PE) or venture capital (VC)
investment, was acquired by other firms, or is in the process of going public.14 The Pitchbook
data consists of private financing deals on over 35,000 establishments during 1995 to 2009 and it
indicates whether a business establishment receives PE or VC financing (see Appendix B).
The Pitchbook and NETS merged (“POF” data) is provided directly from the Institute for
Exceptional Growth Companies (IEGC).15 It consists of 26,838 observations across 16,482
establishments because some establishments received multiple rounds of financing (see Panel A
of Table 1). We find 16,802 observations are financed from private equity and 7,555
observations are financed from venture capital from 1995 to 2009. The rest of the 2,481
observations are either acquired or are in the process of going public. Panel B of Table 1
indicates that over 57% of these establishments are privately held companies and 23% were
acquired or merged with other firms.
3.1 Matching process
We merge the POF data back to the IEGC data to find matched establishments (control
establishments) for these 16,802 establishments that received PE financing and 7,555
14 Information for the Pitchbook data is available at http://pitchbook.com/PitchBook_Research.html. 15 Walls and Associates merged NETS and Pitchbook data based on the establishment name, location, and HQDUNS (headquarter DUNS number). They also matched based on the timing of the NETS and Pitchbook data (i.e. January 1996 NETS data is merged with 1995 year-end Pitchbook data since the NETS data is updated every January and the Pitchbook data is updated at the end of the calendar year). The merging process is explained and available at http://growtheconomy.org/data.lasso and http://growtheconomy.org/faq.lasso.

14
establishments that received VC financing. We select single entity business establishments that
never engaged in acquisitions and/or sales or purchases of business entities, over the entire
sample periods. We define single entity business establishments as establishments with no
branches, subsidiaries, or establishments in other locations.16 To be included, the control
(matching) establishments must not have received PE or VC financing during the entire period of
1995 to 2009. Therefore, the control establishments are not found in the Pitchbook database. The
control establishments also never engaged in acquisitions, sale, or purchase of business entities,
and also meet our criteria as single entity establishments. The matching process is conducted
each year at the establishment level rather than at the parent companies level given both the
NETS and Pitchbook data are at the establishment level. DHJLM (2011) indicate that the
establishment level data provides a clean analysis for organic job creation or destruction at each
business establishment by separating it from the acquisitions and sale of operating units. The
matching process is conducted with replacements because the control establishments have
similar opportunities to obtain PE or VC financing as the PE or VC-financed establishments.
We create matches for the PE-financed establishments with the control establishments
based on the 2-digit Standard Industrial Classification (SIC) code, annual net sales, and number
of employees during the same corresponding years when the establishments received PE
financing. We match-pair the VC financing establishments with non-VC financing (control)
establishments based on the 2-digit SIC code, annual net sales, number of employees, and state
where establishments are located during the same corresponding years when establishments
received VC financing. We include states as one of the matching criteria for VC because VC-
investment portfolio companies and similar technologies are usually regionally confined while
16 The NETS (IEGC) database contains information regarding subsidiaries (Subsidiary) and number of establishments (Kids). We define single entity establishments as establishments with zero Subsidiary and zero Kids.

15
PE portfolio companies are more likely to be distributed nationwide. We require both PE and VC
control establishments to have different D-U-N-S headquarters numbers indicating that the
control establishments are different from the PE and VC-financed establishments. This produces
our match-pair sample.
[Insert Table 1 here]
Table 1 indicates that we find 13,538 (80%) matches for PE financing and 6,800 (90%)
for VC financing. However, 40% of PE matches and 53% of VC matches have missing data such
as net sales, number of employees, and other important variables. We also applied a 1% right tail
truncation due to outliers from annual sales growth and employment growth. There are 4,138 of
PE matches with multiple establishments and 811 VC matches with multiple establishments.
Since we restrict our sample based on our definition of single entity establishments to cleanly
examine the impact of PE and VC financing on establishments’ organic growth and other sample
selection criteria stated above, the final sample consists of 3,874 establishments that received PE
financing and 3,074 of these establishments received only one round of PE financing. These
establishments that received PE financing also never received VC financing. Similarly, we find
2,291 establishments received VC financing and 756 of these establishments received VC
financing once. These establishments never received PE financing. In panel D of Table 1, we
show that over 31% of establishments received multiple rounds of PE and over 69% of
establishments received multiple rounds of VC financing. This implies that VC tends to provide
more rounds of financing to these establishments than PE.

16
[Insert Table 2 here]
3.2 Sample distribution
Table 2 provides a description of our final match-pair sample and 44,241,504 business
establishments from the whole IEGC (NETS) database across 48 Fama-French industry
classifications (Fama and French, 1997). The majority of establishments that received PE and
VC financing are classified under business services (SIC 73)17 and wholesale (SIC 50) industries,
which is consistent with the entire IEGC database. Private equity tends to finance wholesale,
retail, transportation, and other establishments that generate consistent cash flows and produce
machinery while venture capital tends to finance establishments that produce new innovations
such as computers, computer chips, and medical equipment. Business establishments from the
IEGC (NETS) database are also highly concentrated in business services (SIC 73).
Table 3 indicates that there is geographic clustering for most establishments that received
PE or VC financing. The highest concentrations of establishments that received PE financing are
located in California (12.85%), Texas (9.19%), New York (7.49%), and Florida (5.63%).
Similarly, establishments from the entire IEGC (NETS) database are also concentrated in
California, Texas, Florida, and New York. Most establishments that received VC financing
reside in California (43.13%), Massachusetts (12.53%), Texas (4.89%), and New York (5.06%).
Overall, the match-pair sample for both PE and VC-financed are consistent with the IEGC
(NETS) database.
17 SIC 73 is defined as establishments that primarily engaged in rendering services to business establishments on a contract or fee basis, such as advertising, credit reporting, collection of claims, mailing, reproduction, stenographic, news syndicates, computer programming, photocopying, duplicating, data processing, services to buildings, and supply services.

17
[Insert Table 3 here]
Table 4 presents the Pearson correlation coefficients among variables that are relevant in
this study for the match-pair sample. The correlation coefficients are examined for both
establishments that received financing and their corresponding control establishments that never
received financing. Panel A of Table 4 presents the correlations for PE financing establishments
relative to their corresponding control establishments. We find that there is positive and
significant correlations between receiving PE financing (PEFUNDED) and annual employment
growth on the corresponding year (EMPGR0) and sales growth (SALEGR0).We find business
owners who are considered minority (non-Caucasian), female gender, and foreign status are
negatively correlated with PE financing. We also find that a decrease in Dun & Bradstreet credit
rating (CHGDBR-) increases the likelihood of PE financing and vice versa. This evidence
suggests that there may be a substitution effect between bank loans and PE financing. The Dun
& Bradstreet change in maximum Paydex scores (CHGPAYDEX) are positively related with
receiving PE financing indicating that establishments with slower payments are less likely to
obtain PE financing. We also find that higher levels of unemployment rates in the county
(UNEMP) where the establishment resides is negatively related to PE financing. We find
establishments with government contracts (GCONTRACT) are positively related with PE
financing while establishments with a legal status of a corporation (CORP) and older
establishments (FIRMAGE) are negatively related with PE financing. We find no significant
correlations for PE financing across different major states, except Texas.
[Insert Table 4 here]

18
Panel B of Table 4 presents the correlations for VC financing establishments relative to
their corresponding control establishments. We find a positive and significant correlation
between receiving VC financing (VCFUNDED) and annual sales (SALEGR0) and employment
growth (EMPGR0) on the corresponding year. We also find that business owners who are
considered minority (non-Caucasian), female gender, and foreign status are negatively correlated
with obtaining VC financing. We find that the previous year changes in establishments’ net sales
and employment are positively related with receiving VC financing. This indicates that VCs are
searching for establishments with high growth in the prior year. We also find that the higher
level of unemployment rate in the county where the establishment resides is negatively related
with VC financing. We find establishment with government contracts and corporations are
positively related to VC financing while older establishments are negatively related with VC
funding. VC financing is positively correlated with California and Massachusetts (CA and MA)
and negatively related with New York and Texas (NY and TX). We also do not find significantly
high correlations among the independent variables that are used in our regressions for both PE
and VC. Therefore, we do not expect multicollinearity issues on our analysis.
[Insert Table 5 here]
3.3 Univariate analysis
Table 5 provides the univariate analysis for establishments that received PE or VC
financing compared to their corresponding control group that never received PE or VC financing.
Panel A of Table 5 indicates that PE financing is less likely to be accessed by minority owners,

19
female owners, and owners with foreign status. Establishments with PE financing have a larger
reduction in their Paydex score than their control group. We also find establishments with PE
financing have the change in their D&B rating toward lower ratings suggesting PE financing
may act as a substitute for bank loans. We find that establishments with PE financing reside in
the counties with lower unemployment rates than their control group. Corporations and older
establishments have a lower likelihood of obtaining PE financing while establishments with
government contracts tend to have a higher likelihood of PE funding.
Prior to a financing event, the annual net sales and number of employees are not
statistically significant, which indicates that our matching process yields a very close control
entity for each establishment that received PE financing. On average, the annual net sales of our
sample companies with PE financing are $8.96 million and the average number of employees is
95.18 Comparing our sample with DHJLM (2011), we find that our sample firms have a
significantly lower numbers of employees.19 This difference in firms’ sizes between our sample
and DHJLM (2011) yields different results when we compare our results with theirs.
Panel B of Table 5 presents the univariate analysis for VC financing versus
establishments that never received any financing from PE or VC. VC financing is less likely to
be given to minority owners, female owners, and foreign owners. We also find establishments
with VC financing have a change in their D&B rating toward lower rating suggesting VC
financing may act as a substitute for bank loans. We find that the change in annual net sales and
the change in number of employees in one year prior to VC financing are higher than the control
group. This indicates that VCs are funding establishments with higher growth in the year prior to
their financing. We find that most establishments with VC financing are corporations, younger,
18 The untabulated median annual net sales is only $3.5 million and the median for number of employees is only 40 employees. 19 Figure 4 of Davis et al. (2011) shows that over 90% of private equity target firms’ buyouts have 500+ employees.

20
and those with government contracts. The untabulated average annual sales on the VC sample
are $6 million (median $2.9 million) and the average number of employees is 45 (median 30)
employees.
We also compare the samples of PE and VC-funded establishments with all
establishments in the NETS (IEGC) database. The third column of Table 5 presents the summary
statistics for all establishments in the NETS database. We find that owners’ demographics of our
PE-funded sample are not statistically different from the entire NETS database, except for the
percentage of women CEOs (WCEO). We find that NETS has a higher average of WCEO than
our PE-funded sample. We find the VC-funded sample has significantly lower percentages of
foreign owners (FOREIGN) and women CEOs (WCEO) compared to NETS. We also find that
the VC-funded sample has a larger change in employment (CHGEMP) than NETS. We find that
there are significant differences in the percentage of corporations (CORP), firm age
(FIRMAGE), and percentage of government contracts (GCONTRACT) between PE and VC-
funded samples within the entire NETS database. Therefore, we advise readers to interpret and to
generalize our results with caution.
[Insert Table 6 here]
Table 6 presents the univariate analysis for differences-in-differences to examine the
impact of PE and VC financing on establishments’ annual sales and employment during one year
prior versus one year after financing and compares those establishments with the control
establishments that never received PE or VC financing during the same periods. We find that the
change in annual net sales for establishments with PE financing is $1.443 million higher than

21
those without PE financing during the year prior to one year after financing. We also find that
establishments with PE financing create five more employees during one year prior to one year
after financing compared to their control group. Compared to PE financing, VC financing has a
smaller impact on the establishment change in net sales ($1.167 million), but a higher impact on
change in employment (15 employees). Overall, we find that the change in net sales and the
change in employment for those establishments with PE or VC financing are significantly higher
than their control group during post-PE or VC financing relative to the pre-financing period.
[Insert Figure 1 here]
We trace the impact of PE financing on the level of annual net sales (inflation adjusted to
1984 dollars) and number of employees starting from five years prior to five years after
receiving financing. Figure 1 presents the average annual net sales for establishments that
received PE or VC financing relative to their control establishments. The average net sales for
establishments that receive PE financing are lower than their control establishments during five
years prior to receiving financing. However, net sales for establishments that receive PE
financing surpass their control establishments during the period over which they are PE-backed.
The average increase in net sales for establishments with PE financing during the entire five
years after financing is approximately $8.4 million compared to a $6.4 million increase in sales
for control establishments without PE financing. This implies that establishments with PE
financing achieve 31% more net sales growth than their control establishments over the 5-year
period following a PE investment.

22
The average net sales for establishments with VC financing for five years prior to
financing is lower than their control establishments. However, net sales for establishments that
receive VC financing surpass their control establishments during the VC financing period.
During the five-year period after a financing event, establishments with VC financing experience
an average increase of $11.5 million in their net sales compared to an average increase of $5.2
million for their control establishments. Establishments with VC financing have approximately
$6.3 million higher annual net sales per establishment relative to their control establishments five
years after their financing event. The result for VC is as expected as the growth trajectories of
smaller firms, particularly with funding, are higher than other firms. VC funds typically target
start-up or early-stage businesses that are engaged in the development and production of new
technologies and medical advances. New investments in these establishments often accelerate
commercialization and growth opportunities. These aggressive ramp-ups, which often involve
significant jobs and revenue increases, build on relatively small asset bases as compared to the
targets of PE firms. Thus, VC investment is more impactful than PE investment. Overall, this
highlights the role of PE and VC financing for small and medium-sized establishments to
generate higher annual net sales.
Figure 2 presents the number of employees for establishments that received PE or VC
financing relative to their control establishments from five years prior to five years after
financing. We find that the number of employees for both PE and VC-funded samples during 5
to 3 years prior to PE and VC financing (-5 to -3 periods) stay relatively constant. Therefore, we
focus our analysis to the period beginning 2 years prior to the financing event. Similar to annual
net sales, the average employment for establishments that receive PE financing is approximately
the same as their control establishments during one and two years prior to receiving financing.

23
However, employment for establishments that received PE financing surpassed their control
establishments during the PE financing inception period. Five years after a PE financing event,
establishments with PE financing have 48 more employees on average as compared to 42 more
employees for their control establishments. This implies that establishments with PE financing
have 14% more jobs growth than their control establishments over the five years after a PE
financing event. At the end of five years following the financing event, establishments with PE
financing employ 6 more employees per establishment than their control establishments.
[Insert Figure 2 here]
The average number of employees for establishments with VC financing during two
years and one year prior to financing is lower than their control establishments. However,
employment for establishments that received VC financing surpassed their control
establishments in three years after the VC financing inception period. Establishments with VC
financing have over 57 more employees per establishment compared to their control
establishments at the end of five years after the financing event. Consistent with the result for
revenues, a financing event accelerates the growth prospects in greater magnitude for VC-backed
firms than for those PE-backed firms. Figure 2 displays the critical role PE and VC financing
plays to provide significantly higher employment opportunities in the economy for small and
medium-sized single entity establishments.
IV. Multivariate regressions

24
There is a potential self-selection bias inherent for establishments with certain business
owners’ characteristics such as non-minority, domestic, and male owners that may affect the
likelihood of receiving funding from PE or VC. There are also some potential unobservable
factors such as the amount of competing business proposals received by PE and VC funds,
owners’ initial capital, owners’ family support, and so forth. In order to examine the impact of
PE and VC financing on establishments growth, first, we examine the impact of business
owners’ demographics on the likelihood of a business establishment to receive PE or VC funding
using the probit regression. Then, in the second stage, we examine the impact of PE and VC
funding on the establishments’ subsequent growth rates, measured by inflation adjusted annual
sales and employment, using the differences-on-differences regression between the pre- and the
post-financing periods. We also correct for a potential self-selection bias using the Heckman
correction technique by including the inverse-Mills ratio obtained from the first stage probit
regression into the second stage differences-on-differences regression (Heckman 1979; Heckman
and Robb, 1985).
4.1. Hypothesis and structural models
Several existing studies have found that owners’ demographics significantly influence the
likelihood of securing external funding successfully. Becker, Blease, and Sohl (2007) find that
women business owners receive significantly smaller funding from angel capital than male
owners. Robb (2012) finds that women business owners face greater credit constraints due to
lower credit scores than men. Fairlie and Robb (2009) show that women business owners are
capital constrained due to less startup capital, less human capital, and less prior work experience.
Carter and Allen (1997) find that women’s efforts to obtain external capital are constrained by

25
their lifestyle intentions. Bates and Bradford (2008) also demonstrate that ethnic minority
business owners are also capital constrained. Robb (2012) reports that minority-owned
businesses encounter higher rejection rates on their loan applications and pay higher interest
rates than non-minority groups. Furthermore, she reports that minority business owners have
lower initial capital that hinders them from raising external capital. Based on these prior studies,
we hypothesize that owner characteristics, namely gender and ethnicity, significantly influence
the likelihood of establishments to secure funding from PE or VC. Additionally, we also believe
that business owners with foreign status face similar funding prospects as women and ethnic
minorities. Therefore, we also include foreign status as one of the factors that influences the
likelihood of securing PE or VC financing. Thus, our first hypothesis is stated as the following:
H1: The likelihood of a business establishment to receive PE or VC funding is dependent on the
owners’ demographics (i.e. minority, women, and foreign owners) of the corresponding
establishment.
We control for gender of establishments’ CEOs (WCEO) because establishments’
leadership gender may also affect the likelihood of PE or VC financing. We control for changes
in the Dun & Bradstreet’s Paydex scores (CHGPAYDEX) and credit rating decreases
(CHGDBR-) and increases (CHGDBR+) as a measure of the ability to pay their short-term
obligations and credit worthiness to obtain bank loans. Previous studies have indicated that PE
and VC are able to select private businesses that exhibit higher growth prior to funding decisions
(Gompers and Lerner, 1999b). Therefore, we control for the change in business establishments’
net sales (CHGSALE) and change in employment (CHGEMP) during one year prior to PE or VC

26
funding. We also control for the establishments’ ages (FIRMAGE), business form (CORP), and
whether the establishments have existing government contracts or not (GCONTRACT). Because
we do not have a measure of business owners’ wealth and local employment from the NETS
database, we use the county level unemployment rate (UNEMP) from the Local Area
Unemployment Statistics published by the Bureau of Labor Statistics as a proxy of business
owners’ wealth and employment in the county at which a business establishment is currently
located. We include indicator variables for state, industry, and year. The structural models for the
first stage regression are described as the following:
Probability (PE financing)it = α0 + α1 MINORITYit + α2 WOWNERit+ α3 FOREIGNit+ α4 WCEOit
+ α5 CHGPAYDEXit + α6 CHGDBR-it+ α7 CHGDBR+it + α8 CHGSALEit-1 + α9 CHGEMPit-1
+ α10 FIRMAGEit + α11 CORPit + α12 GCONTRACTit + α12 UNEMPit + ∑ βk States Dummiesit
+ ∑ γm Industries Dummiesit + ∑ δn Year Dummiesit + it (1)
Probability (VC financing)it = α0 + α1 MINORITYit + α2 WOWNERit+ α3 FOREIGNit+ α4 WCEOit
+ α5 CHGPAYDEXit + α6 CHGDBR-it+ α7 CHGDBR+it + α8 CHGSALEit-1 + α9 CHGEMPit-1
+ α10 FIRMAGEit + α11 CORPit + α12 GCONTRACTit + α12 UNEMPit + ∑ βk States Dummiesit
+ ∑ γm Industries Dummiesit + ∑ δn Year Dummiesit + it (2)
where it is the probability regression error term. We estimate the first stage regression using the
probit regression with heteroskedasticity correction and we estimate the standard errors from the
establishment level clustering.

27
Guo, Hotchkiss, and Song (2011) show that PE buyouts create gains in operating
performance, in terms of profitability and net cash flows, during post buyout periods.
Chemmanur, Krishnan, and Nandy (2011) find that VC-backed firms experience greater
improvement in their total factor productivity during post-VC periods. Similarly, Puri and
Zarutskie (2012) also find that VC-backed firms experience larger increases in their net sales and
employment during post-VC period. Thus, on the second stage, we hypothesize that the
establishment’s subsequent growth rates, measured by annual sales and annual employment
growth rates, are affected by the establishment’s ability to secure funding from PE or VC after
controlling for the endogeneity of the likelihood for PE or VC financing. Thus, our second
hypothesis is stated as the following:
H2: PE or VC funding has positive impacts on business establishment sales and employment
growth during the post financing period.
We measure the impact of PE or VC funding on establishment growth using differences-
in-differences (Card, Katz, and Krueger, 1994; Bertrand, Duflo, and Mullainathan, 2004). We set
up three dummy variables to indicate: (1) the establishments that received PE or VC financing
(PE/VC FUNDED), (2) the establishments after the post-financing period for both those that
received funding and their control group (POST PE/VC), (3) the establishment that received PE
or VC financing during the post-funding period (PE/VC FUNDED x POST PE/VC). Our H2
hypothesis specifically tests whether the establishment that received PE or VC financing during

28
the post funding period (PE/VC FUNDED x POST PE/VC) has significantly higher net sales and
higher employment growth.20
In this second stage regression, we also include the one year lag of sales and employment
growth. We include establishment leadership gender (WCEO) as a proxy for risk taking
behavior. We include the change in Paydex score (CHGPAYDEX) and credit score decrease
(DBR-) and increase (DBR+) as measures of establishments’ ability to secure funding from their
creditors that may affect their growth. We also include firm age (FIRMAGE), business form
(CORP), and whether establishments have existing government contracts or not
(GCONTRACT). Bates and Bradford (2008) find that VCs that focus on minority business
enterprises (MBEs) earn returns that are consistent with mainstream funds. This indicates that
MBEs are not inferior compared to the non-MBEs even though they are capital constrained.
Therefore, we do not include the owners’ demographics on our second stage regression model.
We include indicator variables for state, industry, and year. The structural models for the second
stage regression for establishment annual sales growth (SALEGR) and employment growth
(EMPGR) are described as the following:
SALEGRit or EMPGRWit= β0 + β1 PEFUNDEDit + β2 POSTPEit + β3 PEFUNDEDit x POSTPEit
+ β4 LAGSALEGRWit-1 + β5 WCEOit + β5 CHGPAYDEXit + β5 CHGDBR-it + β5 CHGDBR+it+ β5
FIRMAGEit + β5 CORPit + β5 GCONTRACTit + λ INVERSE-MILLit + ∑γk States Dummiesit + ∑
δm Industries Dummiesit + ∑ θn Year Dummiesit + it (3)
20 We also regress all the control variables on net sales and employment growth, obtain the residuals from 3 years before and 3 years after PE or VC funding, and run the regression of PE/VC FUNDED, POST PE/VC and PE/VC FUNDED x POST PE/VC on these residuals. The results are consistent with reported results.

29
SALEGRit or EMPGRWit= β0 + β1 VCFUNDEDit + β2 POSTVCit + β3 VCFUNDEDit x POSTVCit
+ β4 LAGSALEGRWit-1 + β5 WCEOit + β5 CHGPAYDEXit + β5 CHGDBR-it + β5 CHGDBR+it+ β5
FIRMAGEit + β5 CORPit + β5 GCONTRACTit + λ INVERSE-MILLit + ∑γk States Dummiesit + ∑
δm Industries Dummiesit + ∑ θn Year Dummiesit + it (4)
where, λ is the slope of inverse-Mill’s ratio and it is the regression error term. We estimate the
second stage regression using the ordinary least square (OLS) regression with a
heteroskedasticity correction and we estimate the standard errors from both establishment and
year clustering.
V. Regression results
5.1 First stage probit regression
Table 7 presents the probit regression results for the first stage regression to examine
characteristics that influence business establishments’ likelihood of receiving PE or VC
funding.21 The reported slope coefficients are stated as the marginal impact for each
corresponding independent variable and the robust and establishment clustered z-ratios are
presented in parenthesis under the slope coefficients.
[Insert Table 7 here]
21 The NETS (IEGC) database contains the establishments’ owners’ demographics in the most recent year only. We verified that there is no change in establishment ownership for our sample and control group and also confirmed with the NETS data provider to ensure that there is no change in ownership. Because there is no change in ownership and we choose single establishments that never experience a sale or combination of assets, mergers or acquisitions, then our owners’ demographics from the NETS represent the owners’ demographics for the entire period of our study.

30
The first two columns of Table 7 present the probit regression results for PE funding and
the last 2 columns present the results for VC funding.22 In the first column we include single
entity establishments with multiple rounds of PE financing, and in the second column we only
examine single entity establishments that receive PE financing once (single round). We focus our
discussions on establishments with a single round of PE financing (second column) and find that
owners who are considered as minority, female, and foreign are 21.7%, 2.6%, and 8.8% less
likely to receive PE funding, respectively. These results are statistically and economically
significant. Thus we find evidence to support our first hypothesis H1. This is also consistent with
existing literature that finds ethnic minorities, women, and foreign business owners are facing
capital constraints.
We do not find evidence that woman CEO status has a significant impact on the
likelihood of obtaining PE financing. Additionally, we do not find strong evidence that the
change in Paydex score affects the likelihood of PE financing. Establishments that experience a
decrease in their Dun & Bradstreet credit ratings are 6% more likely to get PE financing while
establishments with increases are 4% less likely to get PE financing. This indicates that PE
financing is acting as a substitute for bank loans when business establishments are experiencing
changes in their credit ratings. We do not find evidence that the change in net sales and the
change in employment during one year prior to financing affect the likelihood of PE financing.
This implies that private equity does not necessarily select their investments based on
establishments’ recent past growth differentials.
We find that older establishments demonstrate less likelihood of receiving PE financing.
We believe that older establishments exhibit better reputations and transparency, and therefore
22 The first stage probit regressions for both PE and VC funded are conducted using the original cross sectional data from NETS (IEGC). We conduct a robustness check by estimating the probit regressions in a panel data procedure (cross sectional and time series) and the results remain robust.

31
have better access to less expensive capital such as bank loans. We find that establishments with
corporation status are also less likely to receive PE financing. We find establishments with
government contracts are 10% more likely to receive PE financing. Government contracts are
likely to produce stable cash flows and provide a certification benefit. We find that
establishments located in higher unemployment counties are 2% less likely to receive PE
financing. We believe that our findings support the existing literature that owners’ wealth,
measured by local unemployment rate, has significant impacts on the likelihood of PE financing.
There is evidence that Florida and New York states are less likely to receive PE financing.
We find similar evidence for the likelihood of VC financing. Again we focus our
discussion on the single round of VC sample (fourth column) since it represents the cleanest
comparison. We find that minority, women, and foreign business owners are 22.2%, 18.7%, and
17.9% less likely to receive VC financing, respectively. This supports our hypothesis H1 and is
also consistent with the literature. We also find that for establishments that experience a decline
in their Dun & Bradstreet credit rating VC financing is 8.6% more likely while establishments
with increases are 14% less likely to get VC financing. Thus VC financing and access to credit
may serve as substitutes. We find that those establishments with government contracts are 15.3%
more likely to receive VC financing. Thus, government contracts provide certification and stable
cash flows that are attractive to VC. We find that establishments located in higher unemployment
counties are 4% less likely to receive VC financing. We believe that owners’ wealth, measured
by local unemployment rates, also has a significant impact on the likelihood of VC financing.
We find that establishments in California and Massachusetts are more likely to get VC financing.
This implies that VC funding tends to agglomerate in certain states where new innovations are
more likely to occur.

32
[Insert Table 8 here]
5.2 Second stage growth rates regression
In the second stage regressions, we examine the impacts of receiving PE or VC financing
on establishments’ annual net sales and employment growth. We examine during three years
prior to and three years after financing using the differences-in-differences method. First, we
examine whether establishments that received PE or VC financing once in any year during 1995
to 2009 have significantly higher growth than their control groups in both prior to and after
financing events. This is represented by the PE/VC FUNDED variable.
Table 8 shows that establishments with PE funding have over 2% (2.63% to 2.9%) higher
sales growth than their control group. Second, we test whether establishments with PE and their
control group are experiencing higher growth during the year PE financing events occurred and
thereafter. This is represented by POSTPE variable.23 We do not find that establishments’ growth
is significantly higher during post-PE periods compared to pre-PE periods. More importantly, we
find that establishments with PE financing are experiencing an additional 2% (2.08% to 2.48%)
higher sales growth than their control group during the post-financing period (PEFUNDED x
POSTPE), thus supports our second hypothesis H2.24
We do not find that the lag of sales growth is significantly related to current period sales
growth. This implies that there is no serial correlation between past growth and current growth
during three years prior to and three years after financing. We find that women CEOs tend to
23 POSTPE is a dummy variable equal to one if an establishment receives PE funding during the year of funding and thereafter or zero otherwise. 24 PEFUNDED x POSTPE is a dummy interaction between PEFUNDED and POSTPE. It captures the structural difference between establishments that received PE funding relative to their control group during the year of PE funding and thereafter.

33
have 2% lower sales growth. This is consistent with existing literature that women executives
tend to be more conservative and less overconfident than male executives (Huang and Kisgen,
2012). We also find that older establishments tend to have lower sales growth rates. This implies
that older firms have less opportunity to grow since they are reaching their mature stage. We do
not find any evidence that government contracts alone contributes to business establishments’
growth.
We find similar results for the impact of VC financing on establishment growth during
three years after relative to three years prior to financing events. However, the magnitude of
slope coefficients of VC funding on establishments’ sales growth is significantly larger than PE
funding. We find VC-funded establishments (VCFUNDED) generally have higher sales growth
than their control group.25 More importantly, we find evidence that these establishments with VC
funding are experiencing over 22% additional sales growth after they received VC financing
(POSTVC).26
[Insert Table 9 here]
Next, we examine the impact of PE and VC financing on establishments’ employment
growth during three years after relative to three years prior to financing. Table 9 presents the
results of this analysis. We find that PE financing has positive and significant impact on
establishment employment growth during the post period relative to pre-financing period. On
average, the establishments with PE financing are experiencing 3% (2.94% to 3.03%) increase in
25 VCFUNDED is a dummy variable equal to one if an establishment receives VC funding once in any year during 1995 to 2009 or zero otherwise. 26 POSTVC is a dummy variable equal to one if an establishment receives VC funding during the year of funding and thereafter or zero otherwise.

34
employment growth during three years after relative to three years prior to financing events.
Again, this evidence supports our hypothesis H2. We find that older establishments have lower
employment growth since older firms have less opportunity to grow as they reach their mature
stage.
We find establishments with VC financing (VC FUNDED) generally have higher
employment growth relative to their control group. Moreover, we still find strong evidence that
establishments with VC financing are still experiencing over 32% further employment growth
during three years after their financing events (VCFUNDED x POSTVC).27 This supports our
hypothesis H2 that VC financing has significant and positive impact on establishments’
employment growth during post-financing periods.
We find evidence that the one-year lag of employment growth significantly affects
current employment growth for VC financing. This implies that the employment growth is
serially correlated from one period to the next. Again, we do not find any evidence that
government contracts alone contributes to business establishments’ growth for the VC sample.
Overall, we find that both PE and VC financing have significant and positive impact on
establishments’ net sales and employment growth relative to their control groups. Furthermore,
the magnitudes of VC financing on establishment growth are larger than the magnitudes of PE
financing.
[Insert Table 10 here]
27 VCFUNDED x POSTVC is a dummy interaction between VCFUNDED and POSTVC. It captures the structural difference between establishments that received VC funding relative to their control group during the year of VC funding and thereafter.

35
Finally, we examine the long-lasting impact of PE or VC financing on establishments net
sales and employment growth during the contemporaneous period until 3 years after the
financing events. We use the growth during two years prior to financing events as a reference
point to examine the impact of PE or VC financing on establishments’ net sales and employment
growth during the contemporaneous period until three years after the financing events. We
include one-year prior to financing event in our sample to represent the pre-financing period.
Panel A of Table 10 shows that the impact of PE financing on both net sales and employment
growth during the contemporaneous period of financing is insignificant.28 This indicates that it
takes some time for PE to execute their strategies to enhance establishments’ growth since PE
financing involves changes in ownership and management. Once changes take place, the impact
on establishment growth is significantly large in the first year after financing and it persists for
three consecutive years.
Panel B of Table 10 presents the impact of VC financing on business establishments’
sales and employment growth during the contemporaneous year and three years after financing.
We find that the impact of VC financing on both net sales and employment growth is immediate.
This implies that venture capital is able to capitalize the business establishments’ growth
immediately after they deploy their capital into the establishments. However, the impact of VC
financing on establishments’ growth only lasts for two consecutive years after the financing
events. Thus, the impact of VC financing is shorter than the impact of PE financing. Overall, we
28 Sales and employment growth rates in year 0 are measured as the percentage change of annual sales and employment from the beginning of the year to the end of the year when an establishment just receives PE or VC financing (year 0). The beginning of the year sales and employment in period 0 are basically the end of year sales and employment in one year prior to receiving PE/VC financing (period -1). We use the same method to calculate sales growth and employment growth rates for years 1, 2, and 3. Then we calculate the difference in sales and employment growth rates in years 1, 2, and 3 relative to sales and employment growth rates two years prior to PE or VC financing year (year -2) as our measures of SALEGR1, EMPGR1, SALEGR2, EMPGR2, SALEGR3, and EMPGR3 on Table 10.

36
find evidence to support our hypothesis H2 that both PE and VC financing significantly increase
the establishment growth during post financing periods.
VI. Additional robustness tests
We conduct additional robustness tests for our results by examining the impact of PE and
VC financing on establishment growth using the propensity matching method (Rosenbaum and
Rubin, 1983). We focus on the single round of PE or VC-financed establishments by deleting the
establishments that received multiple rounds of PE or VC financing to clearly examine the
impact of PC or VC financing on establishments’ organic growth.
The propensity scoring method has been used in finance and accounting literature
(Tucker, 2010; Lennox, Francis, and Wang, 2012) and is appropriate for our analysis since we
only observe establishments that successfully obtained PE or VC financing. Thegoalof
propensityscoringistoconstructprobabilitiesofsuccessfullyobtainingPEorVCfinancing
forestablishmentsthatdidnotreceivePEorVCfinancing.First,weconducttheprobit
regressionfortheentireIEGCsampletoestimatetheprobabilityofeachestablishmentof
receivingPEorVCfinancing.Thisprobitregressionissimilartothefirststageregression
thatisreportedinTable7fortheentireIEGC(NETS).Then,weconstructmatched‐pair
establishmentsthatreceivePEfinancingwithestablishmentsthatneverreceivedPEorVC
financingbasedontheclosestestimatedprobabilities(propensityscores)ofreceivingPE
financingineachyear.Weconstructsimilarmatch‐pairestablishmentsbasedonthe
propensityscoresforreceivingVCfinancingandnameitasthepropensityscoringVC
sample.

37
Ouruntabulatedresultsfromthepropensitymatchingsamplesaresimilartoour
matched‐pairresults.PEfinancingdoesnothaveanimmediateimpactonestablishments’
growthrates.However,itsignificantlyandpositivelyaffectstheirnetsalesand
employmentgrowthratesforthreeconsecutiveyearsafterfinancing.Wealsofindsimilar
resultsthatVCfinancingimmediatelyandpositivelyincreasesestablishments’growth
rates.WefindthattheimpactofVCfinancingonnetsalesandemploymentgrowthrates
remainspositiveandsignificantduringtwoconsecutiveyearsafterfinancing.Overall,our
resultsremainrobustusingthesamplesfromthepropensityscoremethod.
TheNETS(IEGC)databaseispresentedascrosssectionaldata.Wereshapethe
originalNETSdataintoapanel(crosssectionalandtimeseries)dataandconduct
robustnesschecksonourresultspresentedinTables7,8,9,and10.Ourunreported
regressionresultsusingthepaneldataareconsistentwiththeresultspresentedinour
Tables7,8,9,and10.Therefore,webelievethatourresultsarerobust.
VII. Conclusions
Academics, business owners, and policy makers have put a significant amount of
attention on the topic of impact of private equity (PE) and venture capital (VC) financing on
firms’ revenue and employment growth. While most of the existing studies focus on the impact
of leveraged buyouts (LBOs) by private equity firms on job creation and destructions, the
literature on the impacts of PE and VC financing on subsequent growth for small to mid-sized
single entity establishments is still underdeveloped. Furthermore, examining the clean impact of
PE or VC financing on firms’ organic growth is challenging in that data are often aggregated
across business operating units or influenced by corporate combinations. Our study directly

38
compares the impact of PE and VC financing on single entity establishments’ subsequent net
sales and employment growth rates for small and mid-sized establishments that are free from
acquisitions, sale of business divisions, and combinations. Our study also focuses on
establishments that receive a singular round of PE or VC financing. The first contribution of our
study is made by examining the pure impact of a single round of PE or VC financing on single
entity business establishments sales and employment organic growth rates. Our second
contribution is yielded by comparing the impact of PE financing with VC financing during the
post financing periods. Most of the existing studies only examine either PE financing or VC
financing but not both.
Using the Institute for Exceptional Growth Companies (IEGC or NETS) database, this
study is able to cleanly examine the impact of a single round of PE or VC financing on business
establishments’ net sales and employment organic growth rates. Because we focus on single
entity business establishments, the sizes of these establishments are significantly smaller than the
sizes of firms that are examined in the previous studies. Using NETS, D&B, and Pitchbook data
during 1995 to 2009, we construct matched-pair samples for establishments that received
funding from PE or VC with those who never received financing from both PE and VC (control
groups). We also carefully select single entity business establishments for the control group such
that we can precisely compare the establishments with PE or VC financing with their
corresponding control groups.
Our results indicate that minorities, women, and foreign owned establishments are
significantly less likely to receive private equity (PE) funding. These groups are even less likely
to receive funding from venture capital (VC). Policy makers put forth significant efforts to foster
equal opportunity for both minorities and women to have equal access to capital (Hinson, 2010).

39
Our paper provides evidence that the likelihood of successfully obtaining funding from PE and
VC for minorities, women, and foreign owned establishments is still lower than the white-male
group.
After controlling for endogeneity and self-selection biases for probabilities of obtaining
capital from PE or VC, we find that PE or VC financing significantly and positively affect the
establishments’ net sales and employment growth rates. Furthermore, we find that immediate
impact of PE financing on establishments’ growth is insignificant. This is likely the result of a
potentially considerable gap in time between implementing strategic changes and realizing the
results. We find that PE financing increases establishments’ growth rates for three years after
their PE financing event, however. In contrast, we find that the impact of VC financing on
establishments’ growth is immediate and larger than PE financing. However, the impact of VC
financing on establishments growth only lasts for one additional year after the financing year.
Thus it is shorter than the impact of PE financing.
Our findings are relevant for policymakers, capital providers, and business owners. First,
these magnitudes of demographics on the likelihood of receiving PE and VC funding indicate
that minority, women, and foreign-owned establishments are still facing significant challenges to
obtain PE and VC funding to grow their businesses. Second, both PE and VC financing sources
are very important for these establishments to grow their businesses and to create employment
opportunities. These financing events therefore have a positive impact on economic growth.
We also find that there are significant benefits to having government contracts in place
when seeking PE or VC financing. The probabilities of successfully raising capital when
government contracts are in place are sizable and significant. However, these contracts appear to

40
lack any significant influence on sales and employment growth after the financing event occurs.
Further work needs to be done in this area to understand why.
The NETS database has limited information regarding business owners’ wealth,
education, and experience which are important factors that influence the demand for PE and VC
financing. We augment the NETS data with the county level unemployment rate at which these
business establishments reside as a proxy for owners’ wealth and education. We also recognize
that the NETS database may overestimate the employment numbers and underestimate the net
sales receipts. However, because both the establishments with PE and VC funding and their
control establishments are drawn from the same database, we believe that both the funded
establishments and their control groups exhibit the same biases. We conduct robustness checks
using the propensity matching and reshaping the NETS data into a panel data and we find that
our results remain robust.

41
References
Alemany, L., & Marti, J. (2005). Unbiased estimation of economic impact of venture capital backed firms. ESADE Working Paper. Available at http://www.efmaefm.org/efma2005/papers/6-alemany_paper.pdf Amess, K., & Wright, M. (2012). Leveraged buyouts, private equity and jobs. Small Business Economics, 38(4), 419-430. Bates, Timothy and William D. Bradford. 2008. "Venture-Capital Investment in Minority Business," Journal of Money Credit and Banking, March/April: 489-504. Bates, Timothy. 2002. “Restricted Access to Markets Characterizes Women-Owned Businesses,” Journal of Business Venturing, 17: 313-24. Beck, Thorsten, Asli Demirgüç-Kunt, Vojislav Maksimovic. 2008. Financing patterns around the world: Are small firms different. Journal of Financial Economics, Volume 89, Issue 3.467- 487. Becker-Blease, John R., and Jeffrey E. Sohl. 2007. “Do Women-Owned Businesses Have Equal Access to Angel Capital?” Journal of Business Venturing 22(4): 503-21. Bertrand, M., Duflo, E., & Mullainathan, S. (2004, February). How much should we trust differences-in-differences estimates? Journal of Economics, 119(1), 249-275.
Boucly, Q., Sraer, D., & Thesmar, D. (2011). Growth LBOs. Journal of Financial Economics, 102(2), 432-453. Braun, R., Engel, N., Hieber, P., & Zagst, R. (2011). The risk appetite of private equity sponsors. Journal of Empirical Finance, 18(5), 815-832. Card, D., Katz, L. F., & Krueger, A. B. (1994). Comment on David Neumark and William Wascher, "Employment Effects of Minimum and Subminimum Wages: Panel Data on State Minimum Wage Laws". Industrial and Labor Relations Review, 47(3), 487-512.
Carter, N., & Allen, K. (1997). Size determinants of women-owned businesses: choice or barriers to resources? Entrepreneurship & Regional Development, 9, 211-220. Chemmanur, T.J., Krishnan, K, & Nandy, D. K. (2011). How does venture capital financing improve efficiency in private firms? A look beneath the surface. Review of Financial Studies, 24(12), 4037-4090. Cole, R., & Mehran, H. (2011). Gender and the availability of credit to privately held firms: evidence from the surveys of small business finances. FRB of New York Staff Report No. 383. Available at http://www.newyorkfed.org/research/staff_reports/sr383.pdf

42
Davila, A., Foster, G., & Gupta, M. (2003, November). Venture capital financing and the growth of start-up firms. Journal of Business Venturing, 18(6), 689-709.
Davis, S. J., Haltiwanger, J.C., Jarmin, R.S., Lerner, J., & Miranda, J. (2011). Private equity and employment. NBER Working Paper No. 17399. Available at http://www.nber.org/digest/jan12/w17399.html Demiroglu, C., & James, C.M. (2010). The role of private equity group reputation in LBO financing. Journal of Financial Economics, 96(2), 306-330. Engel, D., & Keilbach, M. (2002). Firm level implications of early stage venture capital investment: an empirical investigation. ZEW Discussion Papers No. 02-82. Fairlie, Robert W., and Alicia M. Robb. 2009. “Gender Differences in Business Performance: Evidence from the Characteristics of Business Owners Survey.” Small Business Economics 33: 375–95. Fama, E. F., & French, K. R. (1997). Industry costs of equity. Journal of Financial Economics. 43: 153-197. Gompers, P., & Lerner, J. (1999a). Conflict of interest in the issuance of public securities: Evidence from Venture Capital. Journal of Law and Economics, 42, 1-28. Gompers, P., & Lerner, J. (1999b). The venture capital cycle, Cambridge, MA: The MIT Press. Greene W. (2011). Econometric Analysis, 7th edition. Upper Saddle River, NJ: Prentice-Hall. Guo, S, Hotchkiss, E, & Song, W. (2011). Do buyouts (still) create value? Journal of Finance, 66(2), 479-517. Heckman, J. (1979). Sample selection as a specification error. Econometrica 47, 153-161. Heckman, J., & Robb, Jr., R. (1985). Alternative methods for evaluating the impact of interventions. In J. Heckman & B. Singer (Eds). Longitudinal Analysis of Labor Market Data, (chap. 4). New York: Cambridge University Press. Hedge, D., & Tumlinson, J. (2011). Does Social Proximity Enhance Business Partnerships? Theory and Evidence from Ethnicity’s Role in US Venture (October 5, 2011). Available at SSRN: http://ssrn.com/abstract=1939587 or http://dx.doi.org/10.2139/ssrn.1939587 Hellmann, T. and Puri, M. (2002). Venture capital and the professionalization of start-up firms: empirical evidence, Journal of Finance, 57(1), 169–197. Hinson, D. (2010). Disparities in capital access between minority and non-minority-owned businesses. U.S. Department of Commerce, Minority Development Business Agency. Available at http://www.mbda.gov/sites/default/files/DisparitiesinCapitalAccessReport.pdf

43
Huang, J., & Kisgen, D.J. (2012). Gender and corporate finance: Are male executives overconfident relative to female executives? Journal of Financial Economics 108(3), 822-839. Ivashina, V., & Kovner, A. (2011). The private equity advantage: leveraged buyout firms and relationship banking. Review of Financial Studies, 24(7), 2462-2498. Kaplan, S., & Stromberg, P. (2003). Financial contracting theory meets the real world: an empirical analysis of venture capital contracts, Review of Economic Studies, 70(2), 281–316. Lennox, Clive S., Francis, J. R. & Wang, Z. (2012). Selection models in accounting research. Accounting Review, 87(2), 589-616. Lerner, J. (2011). The Future of Private Equity. European Financial Management, 17(3), 423-435. Lerner, J. (1995, March). Venture Capitalists and the Oversight of Private Firms. Journal of Finance, 50(1), 301-318.
Lerner, J., Sorensen, M., & Stromberg, P. (2011). Private equity and long-run investment: the case of innovation. Journal of Finance, 66(2), 445-477. Lerner, J., & Schoar, A. (2004). The illiquidity puzzle: theory and evidence from private equity. Journal of Financial Economics, 72(1), 3-40. Levine, D.I., & Toffel, M.W. (2010). Quality management and job quality: How the ISO 9001 standard for quality management systems affects employees and employers. Management Science 56(6), 978–996. Marlow, S. and Patton, D. (2005). All credit to men? Entrepreneurship, Finance, and Gender. Entrepreneurship Theory and Practice, 29: 717-735. Martí, J., Menéndez-Requejo, S., & Rottke, O. (2013). The impact of venture capital on family businesses: Evidence from Spain. Journal of World Business 48, 420-430. Metrick, A. (2007). Venture capital and the finance of innovation. Hoboken, NJ: John Willey & Sons Inc. Metrick, A., & Yasuda, A. (2010). The economics of private equity funds. Review of Financial Studies, 23(6), 2303-2341. Neumark, D., Wall, B., & Zhang, J. (2011). Do small businesses create more jobs? New evidence for the United States from the National Establishment Time Series. Review of Economics and Statistics, 93(1), 16–29.

44
Paglia, J. (2012). PCA index survey responses. Pepperdine Private Capital Markets Project, Pepperdine University, First Quarter 2012. Phalippou, L., & Gottschalg, O. (2009). The performance of private equity funds. Review of Financial Studies, 22(4), 1747-1776. Puri, M, & Zarutskie, R. (2012). On the life-cycle dynamics of venture-capital and non-venture-capital-financed firms. Journal of Finance, 68(6), 2247-2293. Robb, A. (2012). Access to Capital Among Young Firms, Minority-owned Firms, Women-owned Firms, and High-tech Firms. SBA Working Paper No. SBAHQ-11-M-0203. Robb, A., & Fairlie, R. (2007). Access to financial capital among U.S. businesses: the case of African American firms. Annals of the American Academy of Political and Social Science 613(47), 47-72. Rosenbaum, P. R., & Rubin, D.B. (1983). The central role of the propensity score in observational studies for casual effects. Biometrika, 70, 41-55. Sorenson, O., & Stuart, T. (2005). The evolution of venture capital investment networks. Federal Reserve Bank of Atlanta.
Tobin, J. (1958). Estimation of relationships for limited dependent variables. Econometrica, 26, 24-36.Toffel, M. W., & Short, J. L. 2011. Coming clean and cleaning up: Does voluntary self-reporting indicate effective self-policing?" Journal of Law and Economics, 54(3), 609-649. Tucker, J. (2010). Selection bias and econometric remedies in accounting and finance research. Journal of Accounting Literature, 29, 31-57. Tykvova, T., & Borell, M. (2012). Do private equity owners increase risk of financial distress and bankruptcy? Journal of Corporate Finance, 18(1), 138-150. Valkama, P., Maula, M., Nikoskelainen, E., & Wright, M. (2013). Drivers of holding period firm-level returns in private equity-backed buyouts. Journal of Banking & Finance, 37, 2378-2391.

45
Appendix A Comparison between NETS database and U.S. Census data Panel A. Aggregate employment from Business Dynamics Statistics and NETS
Business Dynamics Statistics National Establishment Time-Series (NETS) Year # Establishments # Employees # Establishments # Employees 1995 5,839,774 98,519,864 12,179,705 144,895,620 1996 5,933,926 100,380,503 12,385,686 145,260,373 1997 6,043,242 103,203,936 13,090,106 149,713,844 1998 6,108,927 106,268,299 13,573,482 154,267,365 1999 6,174,381 109,060,036 13,699,191 156,118,765 2000 6,219,280 112,624,575 13,658,564 160,220,069 2001 6,348,830 114,349,926 14,267,011 167,211,842 2002 6,399,351 112,123,655 16,071,016 173,173,276 2003 6,460,594 112,720,028 17,192,608 169,037,299 2004 6,542,356 114,002,472 17,365,470 165,715,082 2005 6,679,753 115,520,906 18,054,411 164,486,072 2006 6,781,915 118,921,117 19,710,914 167,984,002 2007 6,888,393 119,913,218 20,550,939 169,757,863 2008 6,862,476 120,083,046 22,325,361 169,478,700 2009 6,678,469 113,900,772 22,617,871 171,922,743 2010 6,619,139 111,175,010 22,015,210 161,957,103
Note: Business Dynamics Statistics is updated every mid-March while NETS is updated every January. The Business Dynamics Statistics is downloaded directly from: http://www2.census.gov/ces/bds/estab/bds_e_all_release.xls. Panel B. Aggregate net sales receipts from Statistics of U.S. Businesses and NETS
Statistics of U.S. Businesses
National Establishment Time-Series (NETS)
Year # Establishments Receipts (in $1000) # Establishments Receipts (in $1000) 1997 6,894,869 18,242,632,687 12,931,953 15,646,277,989 2002 7,200,770 22,062,528,196 15,849,268 19,601,571,421 2007 7,705,018 29,746,741,904 20,311,659 19,433,716,504
Note: Statistics of U.S. Businesses is updated every mid-March while NETS is updated every January. The Statistics of U.S. Businesses is downloaded directly from: http://www2.census.gov/econ/susb/data/1997/us_4digitsic_receipt_1997.xls, http://www2.census.gov/econ/susb/data/2002/us_6digitnaics_receipt_2002.xls, and http://www2.census.gov/econ/susb/data/2007/us_6digitnaics_receipt_2007.xls.

46
Appendix B
Examples of the Pitchbook financing database The Pitchbook financing data indicates whether a particular establishment receives private equity (PE) or venture capital (VC) financing (without dollar amount of PE or VC investments) and its type of ownership. Yeid is the establishment unique identifier from the NETS database. Financing95 implies whether an establishment receives Private Equity (PE) Backed or Venture Capital (VC) Backed financing during year 1995, Financing96 implies whether an establishment receives PE or VC financing during year 1996, etc. Ownership02 implies types of ownership for each establishment during year 2002. Ownership03 implies types of ownership for each establishment during year 2003, etc. The Pitchbook financing and ownership data is available from 1995 to 2009.
Yeid Financing95 Financing96 Financing98 Financing99 1362 Private Equity Backed 2846 Private Equity Backed 3502 Private Equity Backed
15757 Private Equity Backed 68629 VC Backed 75231 Private Equity Backed 80424 VC Backed
Yeid Ownership02 Ownership03 Ownership04 Ownership05 Ownership06 Ownership07
10000332 Privately Held 10001797 Privately Held 10001826 Publicly Held 10002734 Privately Held Privately Held Acquired/Merged 10003352 10012789 Privately Held Publicly Held 10014872 Privately Held

47
Appendix C Variables Definitions
Variables NETS Field Name Definitions PEFUNDED
Financing (Pitchbook)
An indicator variable that takes on a value = 1 if the establishment receives funding from Private Equity during 1995 to 2009
VCFUNDED
Financing (Pitchbook)
An indicator variable that takes on a value = 1 if the establishment receives funding from Venture Capital during 1995 to 2009
EMPGR#
Emp
Percentage change of employment in current year upon receiving funding relative to previous year (in decimal)
SALEGR#
Sales
Percentage change of Sales in current year upon receiving funding relative to previous year (in decimal)
MINORITY
Minority
Minority Owned Indicator-Last (Y = Minority or non-Caucasian Owned, N = Non-Minority or Caucasian Owned)
FOREIGN ForeignOwn Foreign Owned-Last (Y = Yes, Space = No) WCEO
GenderCEO
An indicator variable that takes on a value = 1 if the CEO is a woman or 0 otherwise
WOWNER
WomanOwned
Controlling interest in establishment held by woman-Last (Y = Yes, N = No)
CHGPAYDEX
PayDexMax
Change in D&B Maximum PayDex score. PayDex score 80 indicates that, on average, the business pays its bills in a "Prompt" manner.
CHGDNB-
D&Brating
Change in the first digit of Duns & Bradstreet credit rating toward a worse credit rating (i.e. 3A is worse than 4A rating)
CHGDNB+
D&Brating
Change in first digit of Duns & Bradstreet credit rating toward a better credit rating (i.e. 5A is better than 4A rating)
CHGSALE
Sales
Change in inflation adjusted annual net sales ($). Inflation adjusted annual net sales based on the CPI index (ftp://ftp.bls.gov/pub/special.requests/cpi/cpiai.txt)
CHGEMP Emp Change in number of employees FIRMAGE Age Number of years since the establishment was founded
CORP
LegalStat
Legal Status-Last (G = Proprietorship, H = Partnership, I = Corporation, J = Non-Profit, Blank = NA). CORP is equal to one if an establishment is a Corporation.
GCONTRACT GovtContra Government Contracts/Grants Indicator-Last (Y=Yes, N= No) UNEMP
-
County level unemployment rate (%) from the Bureau of Labor Statistics (source: http://www.bls.gov/lau/).
CA State An indicator variable that takes on a value = 1 if the state is California (CA) or 0 otherwise
FL State An indicator variable that takes on a value = 1 if the state is Florida (FL) or 0 otherwise
MA State An indicator variable that takes on a value = 1 if the state is Massachusetts (MA) or 0 otherwise
NY State An indicator variable that takes on a value = 1 if the state is New York (NY) or 0 otherwise
TX State An indicator variable that takes on a value = 1 if the state is Texas (TX) or 0 otherwise

48
Figure 1 Establishments Inflation Adjusted Sales (Revenue) for PE and VC-Backed and their Matching Groups
0
5
10
15
20
25
30
-5 -4 -3 -2 -1 0 1 2 3 4 5PE NON-PE VC NON-VC
Mil
lion
($)

49
Figure 2 Establishments Employment for PE and VCBacked and their Matching Groups
0
20
40
60
80
100
120
140
160
180
200
-5 -4 -3 -2 -1 0 1 2 3 4 5PE NON-PE VC NON-VC
Num
ber of
Em
ploy
ees

50
Table 1 Data distribution and sample formation This table presents sample selection processes from the original Pitchbook and IEGC (NETS) merged (POF data) to our final samples. A. Financing Observations Percentage Received PE Funding 16,802 62.6% Received VC Funding 7,555 28.2% Others* 2,481 9.2% B. Ownership Observations Percentage Privately Held 15,508 57.8% Acquired/Merged 6,232 23.2% Publicly Held 1,149 4.3% Others** 3,949 14.7% Total observations 26,838 100% Number of establishments 16,482 C. Sample formation PE Sample VC Sample Initial data 16,802 7,555 Match pair results 13,538 6,800 Missing values 5,445 3,666 Sample prior to 1% truncation 8,093 3,134 Final match-pair sample with multiple establishments 4,138 811 Final match-pair sample with single establishment 3,874 2,291 Final match-pair with single round financing 3,074 756 D. Rounds of financing PE Sample VC Sample One round 5,521 979 Two rounds 1,530 971 Three rounds 605 628 Four rounds 214 334 Five rounds 72 134 More than five rounds 71 57 *Others in financing imply acquired by other firms or in the process of going public. ** Others in ownership imply the establishments cease to exist.
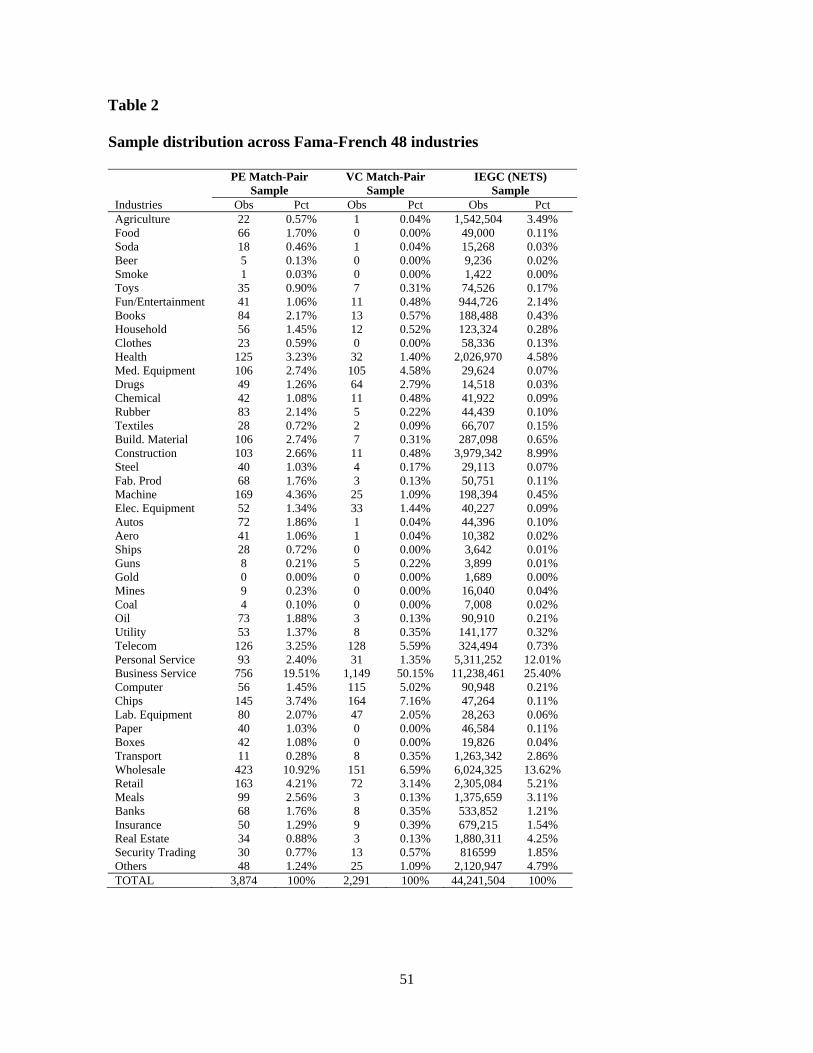
51
Table 2 Sample distribution across Fama-French 48 industries
PE Match-Pair Sample
VC Match-Pair Sample
IEGC (NETS) Sample
Industries Obs Pct Obs Pct Obs Pct Agriculture 22 0.57% 1 0.04% 1,542,504 3.49% Food 66 1.70% 0 0.00% 49,000 0.11% Soda 18 0.46% 1 0.04% 15,268 0.03% Beer 5 0.13% 0 0.00% 9,236 0.02% Smoke 1 0.03% 0 0.00% 1,422 0.00% Toys 35 0.90% 7 0.31% 74,526 0.17% Fun/Entertainment 41 1.06% 11 0.48% 944,726 2.14% Books 84 2.17% 13 0.57% 188,488 0.43% Household 56 1.45% 12 0.52% 123,324 0.28% Clothes 23 0.59% 0 0.00% 58,336 0.13% Health 125 3.23% 32 1.40% 2,026,970 4.58% Med. Equipment 106 2.74% 105 4.58% 29,624 0.07% Drugs 49 1.26% 64 2.79% 14,518 0.03% Chemical 42 1.08% 11 0.48% 41,922 0.09% Rubber 83 2.14% 5 0.22% 44,439 0.10% Textiles 28 0.72% 2 0.09% 66,707 0.15% Build. Material 106 2.74% 7 0.31% 287,098 0.65% Construction 103 2.66% 11 0.48% 3,979,342 8.99% Steel 40 1.03% 4 0.17% 29,113 0.07% Fab. Prod 68 1.76% 3 0.13% 50,751 0.11% Machine 169 4.36% 25 1.09% 198,394 0.45% Elec. Equipment 52 1.34% 33 1.44% 40,227 0.09% Autos 72 1.86% 1 0.04% 44,396 0.10% Aero 41 1.06% 1 0.04% 10,382 0.02% Ships 28 0.72% 0 0.00% 3,642 0.01% Guns 8 0.21% 5 0.22% 3,899 0.01% Gold 0 0.00% 0 0.00% 1,689 0.00% Mines 9 0.23% 0 0.00% 16,040 0.04% Coal 4 0.10% 0 0.00% 7,008 0.02% Oil 73 1.88% 3 0.13% 90,910 0.21% Utility 53 1.37% 8 0.35% 141,177 0.32% Telecom 126 3.25% 128 5.59% 324,494 0.73% Personal Service 93 2.40% 31 1.35% 5,311,252 12.01% Business Service 756 19.51% 1,149 50.15% 11,238,461 25.40% Computer 56 1.45% 115 5.02% 90,948 0.21% Chips 145 3.74% 164 7.16% 47,264 0.11% Lab. Equipment 80 2.07% 47 2.05% 28,263 0.06% Paper 40 1.03% 0 0.00% 46,584 0.11% Boxes 42 1.08% 0 0.00% 19,826 0.04% Transport 11 0.28% 8 0.35% 1,263,342 2.86% Wholesale 423 10.92% 151 6.59% 6,024,325 13.62% Retail 163 4.21% 72 3.14% 2,305,084 5.21% Meals 99 2.56% 3 0.13% 1,375,659 3.11% Banks 68 1.76% 8 0.35% 533,852 1.21% Insurance 50 1.29% 9 0.39% 679,215 1.54% Real Estate 34 0.88% 3 0.13% 1,880,311 4.25% Security Trading 30 0.77% 13 0.57% 816599 1.85% Others 48 1.24% 25 1.09% 2,120,947 4.79% TOTAL 3,874 100% 2,291 100% 44,241,504 100%

52
Table 3 Sample distribution across states
PE Match-Pair Sample
VC Match-Pair Sample
IEGC (NETS) Sample
State Obs Pct Obs Pct Obs Pct AK 6 0.15% 0 0.00% 102,369 0.23% AL 46 1.19% 3 0.13% 586,615 1.33% AR 14 0.36% 1 0.04% 387,834 0.88% AZ 88 2.27% 18 0.79% 797,076 1.80% CA 498 12.85% 988 43.13% 5,446,061 12.31% CO 96 2.48% 69 3.01% 888,817 2.01% CT 67 1.73% 28 1.22% 580,122 1.31% DC 10 0.26% 5 0.22% 122,076 0.28% DE 7 0.18% 1 0.04% 114,652 0.26% FL 218 5.63% 51 2.23% 3,748,447 8.47% GA 121 3.12% 48 2.10% 1,474,127 3.33% HI 6 0.15% 0 0.00% 144,420 0.33% IA 15 0.39% 0 0.00% 514,544 1.16% ID 16 0.41% 8 0.35% 262,907 0.59% IL 185 4.78% 37 1.62% 1,573,483 3.56% IN 73 1.88% 7 0.31% 771,531 1.74% KS 28 0.72% 8 0.35% 428,538 0.97% KY 33 0.85% 3 0.13% 541,637 1.22% LA 28 0.72% 4 0.17% 660,716 1.49% MA 159 4.10% 287 12.53% 919,728 2.08% MD 62 1.60% 34 1.48% 843,879 1.91% ME 17 0.44% 1 0.04% 197,229 0.45% MI 81 2.09% 7 0.31% 1,355,604 3.06% MN 97 2.50% 27 1.18% 850,169 1.92% MO 70 1.81% 7 0.31% 784,270 1.77% MS 23 0.59% 4 0.17% 444,808 1.01% MT 17 0.44% 1 0.04% 171,942 0.39% NC 82 2.12% 57 2.49% 1,184,547 2.68% ND 15 0.39% 0 0.00% 123,605 0.28% NE 25 0.65% 2 0.09% 275,494 0.62% NH 35 0.90% 8 0.35% 225,248 0.51% NJ 139 3.59% 46 2.01% 1,192,497 2.70% NM 12 0.31% 6 0.26% 248,623 0.56% NV 35 0.90% 6 0.26% 346,506 0.78% NY 290 7.49% 116 5.06% 2,747,781 6.21% OH 120 3.10% 31 1.35% 1,392,733 3.15% OK 40 1.03% 0 0.00% 497,207 1.12% OR 53 1.37% 15 0.65% 632,558 1.43% PA 122 3.15% 60 2.62% 1,652,734 3.74% PR 5 0.13% 0 0.00% 78,656 0.18% RI 10 0.26% 2 0.09% 134,535 0.30% SC 47 1.21% 1 0.04% 530,805 1.20% SD 10 0.26% 1 0.04% 135,338 0.31% TN 61 1.57% 13 0.57% 836,547 1.89% TX 356 9.19% 112 4.89% 3,722,027 8.41% UT 64 1.65% 26 1.13% 434,731 0.98% VA 86 2.22% 42 1.83% 1,044,544 2.36% VI 0 0.00% 0 0.00% 4,916 0.01% VT 16 0.41% 3 0.13% 109,283 0.25% WA 69 1.78% 89 3.88% 974,621 2.20% WI 86 2.22% 8 0.35% 714,349 1.61% WV 8 0.21% 0 0.00% 188,281 0.43% WY 7 0.18% 0 0.00% 99,737 0.23% Total 3,874 100% 2,291 100% 44,241,504 100%

53
Table 4 Correlation coefficients Panel A. PE Match-Pair Sample PEFUNDED takes on a value = 1 if the establishment receives funding from Private Equity (PE). SALEGR0 is the annual inflation adjusted sales growth during the period at which the establishment received PE financing. EMPGR0 is annual employment growth during the period at which the establishment received PE financing. MINORITY is equal to 1 if the establishment is owned by an ethnic minority. FOREIGN is equal to 1 if the owner of establishment has foreign status. WOWNER is equal to 1 if the establishment is owned by a woman. WCEO is equal to 1 if the establishment CEO is a woman. CHGPAYDEX indicates the annual change of maximum PayDex score CHGDBR- is the change in Duns & Bradstreet credit rating toward a worse credit rating. CHGDBR+ is the change in Duns & Bradstreet credit rating toward a better credit rating. CHGSALE is the annual change in inflation adjusted sales of an establishment during one year prior to financing. CHGEMP is the annual change in employment of an establishment during one year prior to financing. UNEMP is a county level unemployment rate at which the establishment resides. CORP is equal to 1 if the establishment is a corporation. FIRMAGE is the number of years since the establishment is founded. GCONTRACT is equal to one if the establishment has a government contract. CA, FL, NY, TX are state dummy variables to represent California, Florida, New York and Texas at which represent the top four states with the highest percentage of establishment receiving PE financing. * indicates statistically significant at 1% level.
No Variables 1 2 3 4 5 6 7 8 9 10 11 12 13 1 PEFUNDED 1 2 SALEGR0 0.0178* 1 3 EMPGR0 0.0223* 0.7847* 1 4 MINORITY -0.0786* -0.0067 -0.0082 1 5 FOREIGN -0.0556* 0.0004 0.004 -0.0523* 1 6 WOWNER -0.0644* -0.0039 -0.0063 0.1927* -0.0481* 1 7 WCEO -0.0144 -0.0028 -0.0026 -0.0101 0.0015 0.0833* 1 8 CHGPAYDEX 0.0288* -0.0036 -0.0024 -0.0025 0.0062 -0.0004 -0.0101 1 9 CHGDBR- 0.0203* -0.0004 0.0017 0.0178 0.0072 0.0219* 0.0078 -0.0430* 1
10 CHGDNB+ -0.0319* 0.0034 0.0019 0.0008 -0.0113 -0.0004 0.0054 -0.0580* 0.1594* 1 11 CHGSALE 0.0128 -0.0156 -0.0118 -0.0099 -0.0046 -0.0022 0.0038 -0.0005 0.0129 -0.0013 1 12 CHGEMP 0.0075 -0.0117 -0.0165 -0.0026 0.013 -0.0027 0.011 -0.0074 0.0157 -0.0012 0.6900* 1 13 UNEMP -0.0417* -0.0093 -0.0091 0.0194 -0.0210* 0.008 -0.0251* -0.0203* 0.1351* 0.0841* -0.0055 0.005 1 14 CORP -0.0656* -0.017 -0.0228* 0.0177 0.0555* 0.0211* -0.0057 0.0171 0.0043 -0.0049 -0.0119 -0.0017 -0.0504* 15 FIRMAGE -0.1049* -0.0128 -0.0206* -0.0546* -0.0014 -0.0299* -0.0236* 0.02 0.0148 0.0166 -0.0214* -0.0142 -0.0098 16 GCONTRACT 0.0701* 0.0212* 0.019 0.0315* 0.0313* -0.002 -0.0129 0.0047 0.0177 -0.0352* -0.0032 -0.0052 -0.0744* 17 CA -0.0108 0.0067 -0.0076 0.0321* 0.0086 0.0274* 0.0056 -0.0077 0.0072 -0.0046 0.0006 0.0029 0.1360* 18 FL -0.0042 -0.0045 -0.0038 0.0192 -0.0240* 0.0053 0.0089 0.0039 -0.0019 0.0079 -0.0034 0.0032 0.0326* 19 NY -0.0031 -0.0057 -0.0029 -0.0038 0.0114 -0.0125 0.0099 -0.0152 0.0014 0.0013 -0.0069 -0.0042 -0.015 20 TX 0.0347* 0.0013 0.0006 0.017 -0.0165 -0.0074 0.002 0.0087 0.001 -0.0012 0.0210* 0.0145 -0.0317* No Variables 15 16 17 18 19 14 CORP 1 15 FIRMAGE 0.1260* 1 16 GCONTRACT 0.0671* 0.1137* 1 17 CA 0.0179 -0.0726* 0.0103 1 18 FL -0.0089 -0.0601* -0.0322* -0.0928* 1 19 NY 0.0036 0.0184 -0.0220* -0.1049* -0.0656* 1 20 TX -0.0438* -0.0635* -0.0327* -0.1170* -0.0731* -0.0826*

54
Panel B. VC Match-Pair Sample VCFUNDED takes on a value = 1 if the establishment receives funding from Venture Capital (VC). SALEGR0 is the annual inflation adjusted sales growth during the period at which the establishment received VC financing. EMPGR0 is annual employment growth during the period at which the establishment received VC financing. MINORITY is equal to 1 if the establishment is owned by an ethnic minority. FOREIGN is equal to 1 if the owner of establishment has foreign status. WOWNER is equal to 1 if the establishment is owned by a woman. WCEO is equal to 1 if the establishment CEO is a woman. CHGPAYDEX indicates the annual change of maximum PayDex score. CHGDBR- is the change in Duns & Bradstreet credit rating toward a worse credit rating. CHGDBR+ is the change in Duns & Bradstreet credit rating toward a better credit rating. CHGSALE is the annual change in inflation adjusted sales of an establishment during one year prior to financing. CHGEMP is the annual change in employment of an establishment during one year prior to financing. UNEMP is a county level unemployment rate at which the establishment resides. CORP is equal to 1 if the establishment is a corporation. FIRMAGE is the number of years since the establishment is founded. GCONTRACT is equal to one if the establishment has a government contract. CA, MA, NY, TX are state dummy variables to represent California, Massachusetts, New York and Texas at which represent the top four states with the highest percentage of establishment receiving VC financing. * indicates statistically significant at 1% level. No Variables 1 2 3 4 5 6 7 8 9 10 11 12 13 1 VCFUNDED 1 2 SALEGR0 0.0206* 1 3 EMPGR0 0.0359* 0.0899* 1 4 MINORITY -0.1367* -0.0047 -0.0074 1 5 FOREIGN -0.0808* -0.0017 -0.0028 -0.0443* 1 6 WOWNER -0.1279* -0.0055 -0.007 0.1931* -0.0315 1 7 WCEO -0.0268 -0.0015 -0.0053 0.0038 0.0284 0.0904* 1 8 CHGPAYDEX -0.0132 -0.0163 -0.0053 -0.0195 -0.0013 -0.0274 -0.0062 1 9 CHGDBR- 0.0167 -0.0063 -0.0126 0.018 0.0162 0.0048 0.0025 -0.0268 1 10 CHGDNB+ -0.0975* 0.0026 -0.0321 0.0163 -0.0157 -0.0051 0.0167 -0.0404* 0.1748* 1 11 CHGSALES 0.0368* -0.0027 -0.0065 0.0301 -0.0351* -0.01 -0.0004 0.0085 -0.0078 -0.0033 1 12 CHGEMP 0.0830* -0.0033 -0.0169 -0.001 -0.0199 -0.0155 0.0045 0.0164 0.01 -0.0034 0.3297* 1 13 UNEMP -0.0377* 0.0192 -0.0102 0.0245 -0.0357* 0.0065 -0.0366* -0.019 0.1797* 0.1257* -0.0196 0.0016 1 14 CORP 0.2127* 0.0054 -0.0012 0.008 0.0484* 0.014 -0.0011 0.004 0.0416* -0.0570* 0.0074 0.0348* -0.1021* 15 FIRMAGE -0.4281* -0.0093 -0.0539* 0.0122 0.0102 0.0505* 0.0082 0.0282 0.0255 0.0667* 0.0087 -0.0618* 0.0045 16 GCONTRACT 0.0918* -0.0059 -0.0106 0.0533* 0.0022 0.0068 -0.0224 0.0144 0.0438* -0.0227 0.0115 0.0114 -0.0969* 17 CA 0.2847* 0.0212 0.0119 -0.0369* 0.0201 -0.031 -0.0164 -0.0045 0.0141 -0.0311 -0.0051 0.0105 0.1808* 18 MA 0.1406* -0.0023 -0.0072 -0.0458* 0.0134 -0.0527* 0.0103 -0.0316 -0.0173 -0.0171 -0.0099 0.0124 -0.1120* 19 NY -0.0745* -0.0014 0.0138 -0.0119 0.0115 0.0166 0.0617* -0.0109 -0.0065 0.0175 -0.007 -0.0144 -0.0238 20 TX -0.0589* -0.0027 -0.0087 0.0367* -0.0087 0.0294 0.0017 -0.0128 0.016 -0.0244 -0.0058 -0.0014 -0.0493*
No Variables 14 15 16 17 18 19 14 CORP 1 15 FIRMAGE 0.0274 1 16 GCONTRACT 0.1265* 0.0314 1 17 CA 0.1016* -0.1808* -0.021 1 18 MA 0.0569* -0.0590* 0.0365* -0.1982* 1 19 NY -0.0281 0.0579* -0.0282 -0.1603* -0.0728* 1 20 TX -0.0400* 0.0001 -0.0021 -0.1706* -0.0775* -0.0627*

55
Table 5 Univariate analysis for match-pair sample MINORITY is equal to 1 if the establishment is owned by an ethnic minority. FOREIGN is equal to 1 if the owner of establishment has foreign status. WOWNER is equal to 1 if the establishment is owned by a woman. WCEO is equal to 1 if the establishment CEO is a woman. CHGPAYDEX indicates the annual change of maximum PayDex score. CHGDBR+ is the change in Duns & Bradstreet credit rating toward a better credit rating. CHGDBR- is the change in Duns & Bradstreet credit rating toward a worse credit rating. CHGSALE is the annual change in inflation adjusted sales of an establishment. CHGEMP is the annual change in employment of an establishment. UNEMP is a county level unemployment rate at which the establishment resides. CORP is equal to 1 if the establishment is a corporation. FIRMAGE is the number of years since the establishment is founded. GCONTRACT is equal to one if the establishment has a government contract. * indicates that the means are statistically different from the PE or VC funding sample at 1% level of significance.
Panel A. PE Funding PE funding No funding IEGC (NETS) Variable (Control Sample) Sample MINORITY 0.023 0.054* 0.018 FOREIGN 0.050 0.078* 0.057 WOWNER 0.061 0.096* 0.076 WCEO 0.002 0.003 0.023* CHGPAYDEX -0.474 -0.143 -0.180 CHGDBR- 0.187 0.171 0.282 CHGDNB+ 0.886 0.905 0.718 CHGSALES 0.580 0.123 0.355 CHGEMP 5.721 3.401 2.412 UNEMP 5.845 6.050 7.981 CORP 0.781 0.833* 0.519* FIRMAGE 26.320 31.881* 13.867* GCONTRACT 0.225 0.169* 0.006* Panel B. VC Funding VC funding No funding IEGC (NETS) Variable (Control Sample) Sample MINORITY 0.023 0.084* 0.018 FOREIGN 0.019 0.048* 0.057* WOWNER 0.054 0.127* 0.076 WCEO 0.001 0.003 0.023* CHGPAYDEX -0.477 -0.314 -0.180 CHGDBR- 0.200 0.187 0.282 CHGDNB+ 0.856 0.918* 0.718 CHGSALES 0.552 0.148* 0.355 CHGEMP 7.122 1.678* 2.412* UNEMP 6.349 6.544 7.981 CORP 0.938 0.792* 0.519* FIRMAGE 7.346 21.278* 13.867* GCONTRACT 0.222 0.150* 0.006*
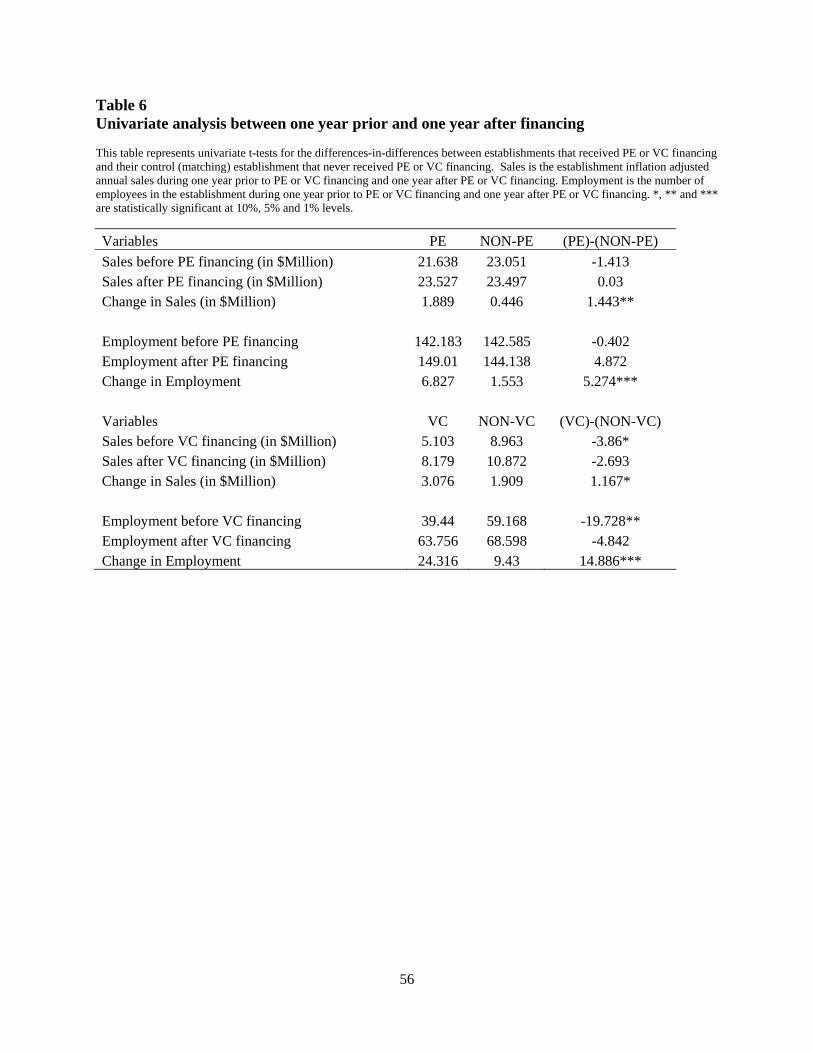
56
Table 6 Univariate analysis between one year prior and one year after financing This table represents univariate t-tests for the differences-in-differences between establishments that received PE or VC financing and their control (matching) establishment that never received PE or VC financing. Sales is the establishment inflation adjusted annual sales during one year prior to PE or VC financing and one year after PE or VC financing. Employment is the number of employees in the establishment during one year prior to PE or VC financing and one year after PE or VC financing. *, ** and *** are statistically significant at 10%, 5% and 1% levels.
Variables PE NON-PE (PE)-(NON-PE)
Sales before PE financing (in $Million) 21.638 23.051 -1.413 Sales after PE financing (in $Million) 23.527 23.497 0.03 Change in Sales (in $Million) 1.889 0.446 1.443**
Employment before PE financing 142.183 142.585 -0.402 Employment after PE financing 149.01 144.138 4.872 Change in Employment 6.827 1.553 5.274***
Variables VC NON-VC (VC)-(NON-VC) Sales before VC financing (in $Million) 5.103 8.963 -3.86* Sales after VC financing (in $Million) 8.179 10.872 -2.693 Change in Sales (in $Million) 3.076 1.909 1.167*
Employment before VC financing 39.44 59.168 -19.728** Employment after VC financing 63.756 68.598 -4.842 Change in Employment 24.316 9.43 14.886***
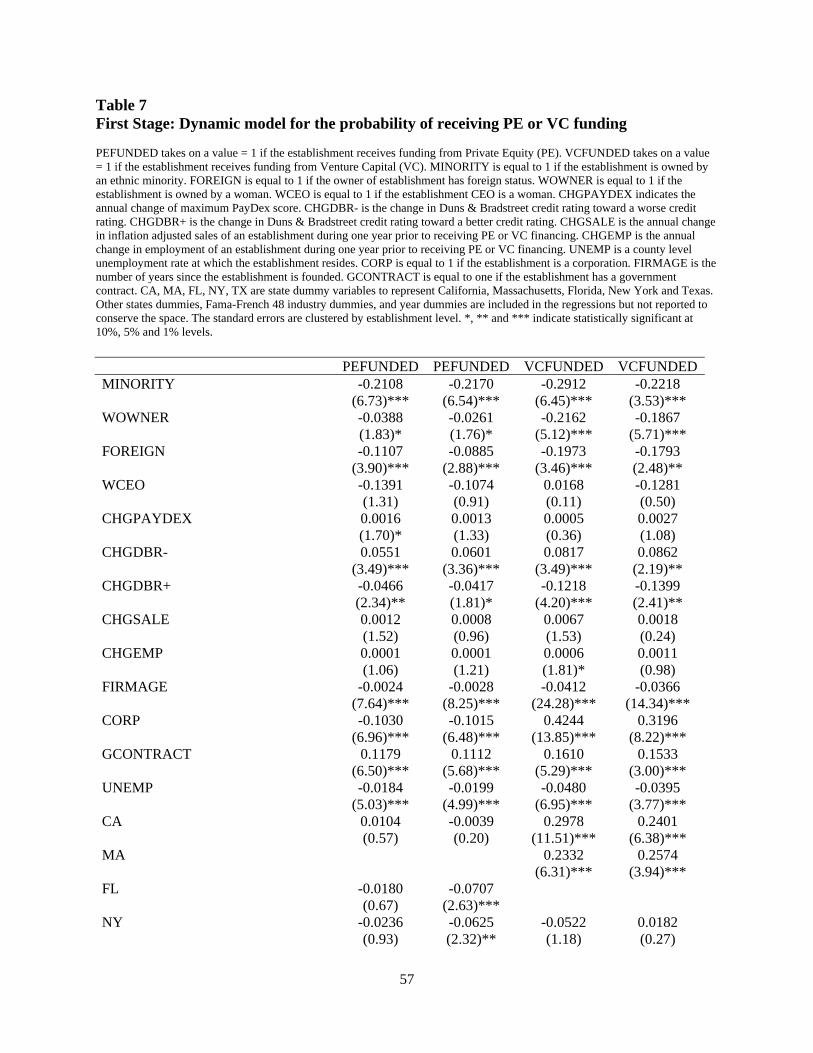
57
Table 7 First Stage: Dynamic model for the probability of receiving PE or VC funding PEFUNDED takes on a value = 1 if the establishment receives funding from Private Equity (PE). VCFUNDED takes on a value = 1 if the establishment receives funding from Venture Capital (VC). MINORITY is equal to 1 if the establishment is owned by an ethnic minority. FOREIGN is equal to 1 if the owner of establishment has foreign status. WOWNER is equal to 1 if the establishment is owned by a woman. WCEO is equal to 1 if the establishment CEO is a woman. CHGPAYDEX indicates the annual change of maximum PayDex score. CHGDBR- is the change in Duns & Bradstreet credit rating toward a worse credit rating. CHGDBR+ is the change in Duns & Bradstreet credit rating toward a better credit rating. CHGSALE is the annual change in inflation adjusted sales of an establishment during one year prior to receiving PE or VC financing. CHGEMP is the annual change in employment of an establishment during one year prior to receiving PE or VC financing. UNEMP is a county level unemployment rate at which the establishment resides. CORP is equal to 1 if the establishment is a corporation. FIRMAGE is the number of years since the establishment is founded. GCONTRACT is equal to one if the establishment has a government contract. CA, MA, FL, NY, TX are state dummy variables to represent California, Massachusetts, Florida, New York and Texas. Other states dummies, Fama-French 48 industry dummies, and year dummies are included in the regressions but not reported to conserve the space. The standard errors are clustered by establishment level. *, ** and *** indicate statistically significant at 10%, 5% and 1% levels.
PEFUNDED PEFUNDED VCFUNDED VCFUNDEDMINORITY -0.2108 -0.2170 -0.2912 -0.2218
(6.73)*** (6.54)*** (6.45)*** (3.53)*** WOWNER -0.0388 -0.0261 -0.2162 -0.1867
(1.83)* (1.76)* (5.12)*** (5.71)*** FOREIGN -0.1107 -0.0885 -0.1973 -0.1793
(3.90)*** (2.88)*** (3.46)*** (2.48)** WCEO -0.1391 -0.1074 0.0168 -0.1281
(1.31) (0.91) (0.11) (0.50) CHGPAYDEX 0.0016 0.0013 0.0005 0.0027
(1.70)* (1.33) (0.36) (1.08) CHGDBR- 0.0551 0.0601 0.0817 0.0862
(3.49)*** (3.36)*** (3.49)*** (2.19)** CHGDBR+ -0.0466 -0.0417 -0.1218 -0.1399
(2.34)** (1.81)* (4.20)*** (2.41)** CHGSALE 0.0012 0.0008 0.0067 0.0018
(1.52) (0.96) (1.53) (0.24) CHGEMP 0.0001 0.0001 0.0006 0.0011
(1.06) (1.21) (1.81)* (0.98) FIRMAGE -0.0024 -0.0028 -0.0412 -0.0366
(7.64)*** (8.25)*** (24.28)*** (14.34)*** CORP -0.1030 -0.1015 0.4244 0.3196
(6.96)*** (6.48)*** (13.85)*** (8.22)*** GCONTRACT 0.1179 0.1112 0.1610 0.1533
(6.50)*** (5.68)*** (5.29)*** (3.00)*** UNEMP -0.0184 -0.0199 -0.0480 -0.0395
(5.03)*** (4.99)*** (6.95)*** (3.77)*** CA 0.0104 -0.0039 0.2978 0.2401
(0.57) (0.20) (11.51)*** (6.38)*** MA 0.2332 0.2574
(6.31)*** (3.94)*** FL -0.0180 -0.0707
(0.67) (2.63)*** NY -0.0236 -0.0625 -0.0522 0.0182
(0.93) (2.32)** (1.18) (0.27)

58
TX 0.0165 0.0100 -0.0524 -0.0279 (0.73) (0.41) (1.19) (0.43)
INTERCEPT 0.0581 0.1989 0.0940 0.1687 (0.89) (2.77)*** (0.46) (0.81)
Observations 7748 6148 4582 1512 EST. with PE or VC 3874 3074 2291 756 Pseudo R-square 0.0638 0.0609 0.4060 0.3607 State dummies Yes Yes Yes Yes Establishment Level Clustering Yes Yes Yes Yes
*, ** and *** are statistically significant at 10%, 5% and 1% levels.

59
Table 8 Second Stage: Differences-in-differences regressions for sales growth during 3 years prior and 3 years after financing This table presents the second stage regression of differences-in-differences (Bertrand et al., 2004; Card, Katz, and Krueger, 1994) during three year prior to PE or VC financing (period -3, -2 and -1) and three years after PE or VC financing (period 1, 2, and 3). SALEGR is the annual inflation adjusted sales growth in the establishments during 3 years prior to PE or VC financing and 3 years after PE or VC financing. PE/VC FUNDED takes on a value = 1 if the establishment receives funding from Private Equity (PE) or Venture Capital (VC). POST PEVCFUNDED takes on a value = 1 during the periods after establishments received PE or VC financing. PE/VC FUNDED*POST PE/VC is the interaction variable that represents the differences-in-differences between establishments that received PE or VC financing and their control (matching) group during periods prior versus after receiving financing. LAGSALEGR is one period lag of sales growth. MINORITY is equal to 1 if the establishment is owned by an ethnic minority. FOREIGN is equal to 1 if the owner of establishment has foreign status. WOWNER is equal to 1 if the establishment is owned by a woman. WCEO is equal to 1 if the establishment CEO is a woman. CHGPAYDEX indicates the annual change of maximum PayDex score. CHGDBR- is the change in Duns & Bradstreet credit rating toward a worse credit rating. CHGDBR+ is the change in Duns & Bradstreet credit rating toward a better credit rating. CHGSALE is the annual change in inflation adjusted sales of an establishment during one year prior to receiving PE or VC financing. CHGEMP is the annual change in employment of an establishment during one year prior to receiving PE or VC financing. UNEMP is a county level unemployment rate at which the establishment resides. CORP is equal to 1 if the establishment is a corporation. FIRMAGE is the number of years since the establishment is founded. GCONTRACT is equal to one if the establishment has a government contract. CA, MA, FL, NY, TX are state dummy variables to represent California, Massachusetts, Florida, New York and Texas. Other states dummies, Fama-French 48 industry dummies, and year dummies are including in the regressions but not reported to conserve the space. The standard errors are clustered by establishment and year. *, ** and *** indicate statistically significant at 10%, 5% and 1% levels.
PE PE VC VC SALESGR SALESGR SALESGR SALESGR
PE/VC FUNDED 0.0290 0.0263 0.2433 0.2720 (2.07)** (2.49)** (2.98)*** (3.01)***
POST PE/VC 0.0041 0.0083 0.1009 0.1034 (0.19) (0.34) (1.41) (1.56)
PE/VC FUNDED x POST PE/VC 0.0248 0.0208 0.2518 0.2285 (2.00)** (2.11)** (1.79)* (1.68)*
LAGSALEGR -0.0001 -0.0002 -0.0002 -0.0002 (0.98) (0.95) (0.30) (0.23)
WCEO -0.2241 -0.2463 -0.7943 -0.6918 (2.12)** (2.26)** (1.85)* (1.60)
CHGPAYDEX 0.0006 0.0011 0.0005 0.0005 (1.40) (1.27) (0.61) (0.52)
CHGDBR- 0.0087 0.0215 0.0514 0.0511 (1.04) (1.42) (1.14) (0.96)
CHGDBR+ -0.0158 -0.0281 -0.1324 -0.1647 (1.23) (1.40) (1.52) (1.64)
FIRMAGE -0.0020 -0.0026 -0.0136 -0.0143 (5.49)*** (5.96)*** (1.53) (1.50)
CORP -0.0487 -0.0627 -0.0007 0.0077 (1.69)* (1.82)* (0.00) (0.05)
GCONTRACT 0.0368 0.0452 0.1880 0.2193 (1.29) (1.39) (1.35) (1.36)
CA -0.0239 -0.0206 -0.1979 -0.2505 (0.70) (0.55) (1.69)* (1.87)*
MA 0.0323 0.0172 (0.12) (0.06)
FL -0.0803 -0.0852 (2.49)** (2.19)**
NY -0.0046 -0.0086 -0.2458 -0.3059 (0.09) (0.16) (1.75)* (1.99)**

60
TX -0.0383 -0.0290 -0.0800 -0.0933 (1.17) (0.67) (0.51) (0.53)
INVERSEMILL 0.1373 0.1601 0.1038 0.0949 (1.68)* (1.99)** (0.79) (0.67)
INTERCEPT 0.1134 0.1686 -0.0487 -0.0201 (1.27) (1.53) (0.21) (0.08)
Observations 46,488 36,888 27,492 9,072 R-squared 0.0128 0.0123 0.0646 0.0643 EST. with PE or VC 3874 3074 2291 756 State dummies Yes Yes Yes Yes Establishment and Year Clustering Yes Yes Yes Yes
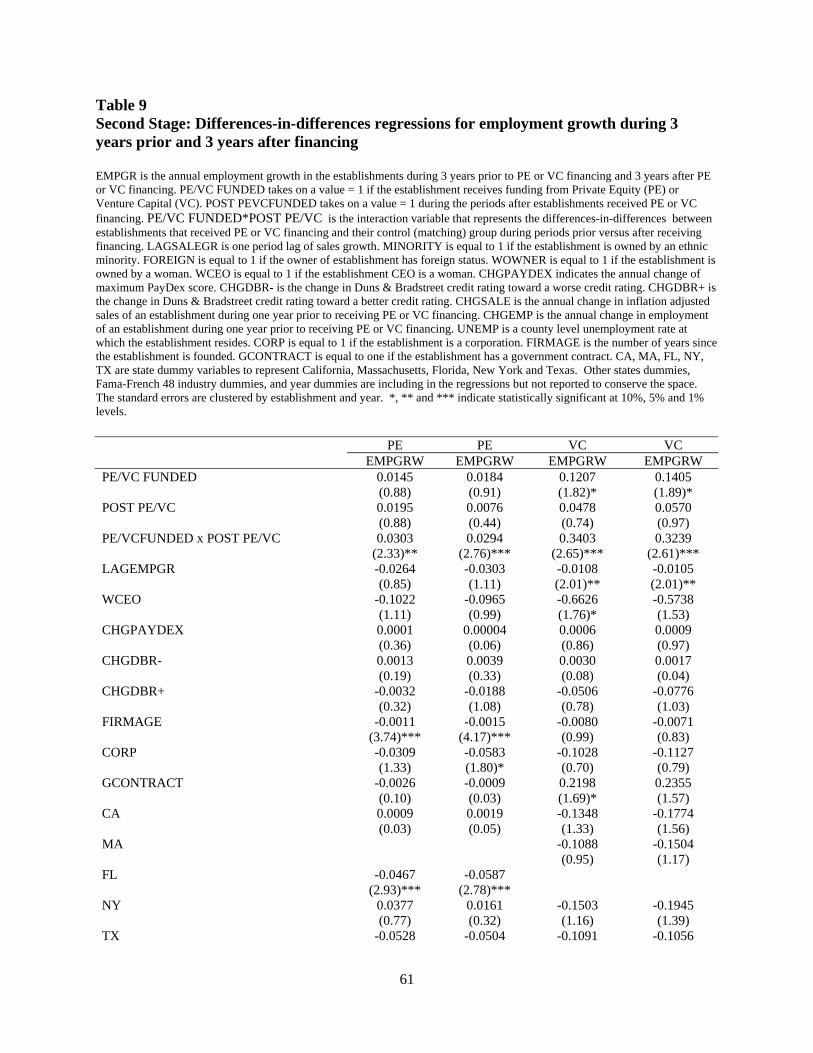
61
Table 9 Second Stage: Differences-in-differences regressions for employment growth during 3 years prior and 3 years after financing EMPGR is the annual employment growth in the establishments during 3 years prior to PE or VC financing and 3 years after PE or VC financing. PE/VC FUNDED takes on a value = 1 if the establishment receives funding from Private Equity (PE) or Venture Capital (VC). POST PEVCFUNDED takes on a value = 1 during the periods after establishments received PE or VC financing. PE/VC FUNDED*POST PE/VC is the interaction variable that represents the differences-in-differences between establishments that received PE or VC financing and their control (matching) group during periods prior versus after receiving financing. LAGSALEGR is one period lag of sales growth. MINORITY is equal to 1 if the establishment is owned by an ethnic minority. FOREIGN is equal to 1 if the owner of establishment has foreign status. WOWNER is equal to 1 if the establishment is owned by a woman. WCEO is equal to 1 if the establishment CEO is a woman. CHGPAYDEX indicates the annual change of maximum PayDex score. CHGDBR- is the change in Duns & Bradstreet credit rating toward a worse credit rating. CHGDBR+ is the change in Duns & Bradstreet credit rating toward a better credit rating. CHGSALE is the annual change in inflation adjusted sales of an establishment during one year prior to receiving PE or VC financing. CHGEMP is the annual change in employment of an establishment during one year prior to receiving PE or VC financing. UNEMP is a county level unemployment rate at which the establishment resides. CORP is equal to 1 if the establishment is a corporation. FIRMAGE is the number of years since the establishment is founded. GCONTRACT is equal to one if the establishment has a government contract. CA, MA, FL, NY, TX are state dummy variables to represent California, Massachusetts, Florida, New York and Texas. Other states dummies, Fama-French 48 industry dummies, and year dummies are including in the regressions but not reported to conserve the space. The standard errors are clustered by establishment and year. *, ** and *** indicate statistically significant at 10%, 5% and 1% levels.
PE PE VC VC EMPGRW EMPGRW EMPGRW EMPGRW
PE/VC FUNDED 0.0145 0.0184 0.1207 0.1405 (0.88) (0.91) (1.82)* (1.89)*
POST PE/VC 0.0195 0.0076 0.0478 0.0570 (0.88) (0.44) (0.74) (0.97)
PE/VCFUNDED x POST PE/VC 0.0303 0.0294 0.3403 0.3239 (2.33)** (2.76)*** (2.65)*** (2.61)***
LAGEMPGR -0.0264 -0.0303 -0.0108 -0.0105 (0.85) (1.11) (2.01)** (2.01)**
WCEO -0.1022 -0.0965 -0.6626 -0.5738 (1.11) (0.99) (1.76)* (1.53)
CHGPAYDEX 0.0001 0.00004 0.0006 0.0009 (0.36) (0.06) (0.86) (0.97)
CHGDBR- 0.0013 0.0039 0.0030 0.0017 (0.19) (0.33) (0.08) (0.04)
CHGDBR+ -0.0032 -0.0188 -0.0506 -0.0776 (0.32) (1.08) (0.78) (1.03)
FIRMAGE -0.0011 -0.0015 -0.0080 -0.0071 (3.74)*** (4.17)*** (0.99) (0.83)
CORP -0.0309 -0.0583 -0.1028 -0.1127 (1.33) (1.80)* (0.70) (0.79)
GCONTRACT -0.0026 -0.0009 0.2198 0.2355 (0.10) (0.03) (1.69)* (1.57)
CA 0.0009 0.0019 -0.1348 -0.1774 (0.03) (0.05) (1.33) (1.56)
MA -0.1088 -0.1504 (0.95) (1.17)
FL -0.0467 -0.0587 (2.93)*** (2.78)***
NY 0.0377 0.0161 -0.1503 -0.1945 (0.77) (0.32) (1.16) (1.39)
TX -0.0528 -0.0504 -0.1091 -0.1056

62
(2.16)** (1.43) (0.78) (0.65) INVERSEMILL -0.0375 -0.0399 0.0349 0.0054
(0.90) (0.83) (0.29) (0.04) INTERCEPT 0.1641 0.2492 0.2428 0.2551
(2.46)** (2.57)** (1.00) (1.07) Observations 46,488 36,888 27,492 9,072 R-squared 0.0134 0.0119 0.0667 0.0650 EST. with PE or VC 3874 3074 2291 756 State dummies Yes Yes Yes Yes Establishment and Year Clustering Yes Yes Yes Yes

63
Table 10 Second Stage: The impact of PE and VC financing on establishment annual growth during three years after financing SALEGR0, SALEGR1, SALEGR2, and SALEGR3 are the annual employment growth in the establishments during period 0, 1, 2, and 3 years after PE or VC financing. EMPGR0, EMPGR1, EMPGR2, and EMPGR3 are the annual employment growth in the establishments during period 0, 1, 2, and 3 years after PE or VC financing. PE/VC FUNDED takes on a value = 1 if the establishment receives funding from Private Equity (PE) or Venture Capital (VC). POST PEVCFUNDED takes on a value = 1 during the periods after establishments received PE or VC financing. PE/VC FUNDED*POST PE/VC is the interaction variable that represents the differences-in-differences between establishments that received PE or VC financing and their control (matching) group during periods prior versus after receiving financing. All control variables from Table 9 including states dummies, Fama-French 48 industry dummies, and year dummies are included in the regressions but not reported to conserve space. The standard errors are clustered by establishment and year. *, ** and *** indicate statistically significant at 10%, 5% and 1% levels.
Panel A. PE Funding SALEGR0 SALEGR1 SALEGR2 SALEGR3 EMPGR0 EMPGR1 EMPGR2 EMPGR3PEFUNDED 0.0047 0.1831 0.0251 -0.0441 0.0149 0.1722 -0.0017 0.0665
(0.18) (1.40) (0.16) (0.41) (0.68) (1.29) (0.01) (1.08) POSTPE 0.0188 0.0864 -0.0111 0.0066 0.0198 0.0816 0.0019 0.0099
(1.07) (1.16) (0.37) (0.38) (1.94)* (1.15) (0.06) (0.70) PEFUNDED x POSTPE 0.0146 0.1972 0.0324 0.0297 0.0058 0.1764 0.0279 0.0165
(0.91) (3.32)*** (2.40)** (2.57)*** (0.37) (3.16)*** (2.21)** (2.56)*** INTERCEPT 0.1929 1.9092 -0.2331 0.1372 0.3040 1.8548 -0.3409 -0.0260
(1.69)* (1.38) (0.49) (0.60) (1.94)* (1.28) (0.76) (0.13) Observations 35091 32982 26106 23746 34753 32982 26106 23746 R-squared 0.0067 0.0123 0.0082 0.0170 0.0064 0.0117 0.0079 0.0104 Control Variables Yes Yes Yes Yes Yes Yes Yes Yes
Panel B. VC Funding SALEGR0 SALEGR1 SALEGR2 SALEGR3 EMPGR0 EMPGR1 EMPGR2 EMPGR3VCFUNDED 0.1949 0.2264 0.2623 0.0107 0.1469 0.1580 0.0371 -0.0910
(1.43) (1.49) (0.76) (0.08) (1.87)* (1.62) (0.86) (0.72) POSTVC 0.1023 0.0344 0.0238 0.0564 0.0687 0.0692 0.0631 0.0303
(1.57) (0.25) (0.46) (0.94) (1.19) (0.53) (1.23) (0.73) VCFUNDED x POSTVC 0.2856 0.3033 0.0642 0.03483 0.2830 0.2778 0.0268 0.0732
(2.98)*** (2.38)** (0.96) (1.09) (2.35)** (2.34)** (0.44) (1.45) INTERCEPT -0.0118 -1.0202 -2.5033 0.8416 0.2544 -1.0829 0.4838 0.7363
(0.05) (1.30) (0.58) (1.15) (1.08) (1.43) (1.80)* (1.03) Observations 9026 7869 6152 4884 9026 7869 6152 4884 R-squared 0.0624 0.1567 0.1078 0.0524 0.0614 0.1638 0.0565 0.0591 Control Variables Yes Yes Yes Yes Yes Yes Yes Yes