The Effects of Offshore Assembly on Industry Location ... · 11 The Effects of Offshore Assembly on...
27
This PDF is a selection from an out-of-print volume from the National Bureau of Economic Research Volume Title: The Effects of U.S. Trade Protection and Promotion Policies Volume Author/Editor: Robert C. Feenstra, editor Volume Publisher: University of Chicago Press Volume ISBN: 0-226-23951-9 Volume URL: http://www.nber.org/books/feen97-1 Conference Date: October 6-7, 1995 Publication Date: January 1997 Chapter Title: The Effects of Offshore Assembly on Industry Location: Evidence from U.S. Border Cities Chapter Author: Gordon H. Hanson Chapter URL: http://www.nber.org/chapters/c6184 Chapter pages in book: (p. 297 - 322)
Transcript of The Effects of Offshore Assembly on Industry Location ... · 11 The Effects of Offshore Assembly on...
This PDF is a selection from an out-of-print volume from the National Bureauof Economic Research
Volume Title: The Effects of U.S. Trade Protection and Promotion Policies
Volume Author/Editor: Robert C. Feenstra, editor
Volume Publisher: University of Chicago Press
Volume ISBN: 0-226-23951-9
Volume URL: http://www.nber.org/books/feen97-1
Conference Date: October 6-7, 1995
Publication Date: January 1997
Chapter Title: The Effects of Offshore Assembly on Industry Location: Evidencefrom U.S. Border Cities
Chapter Author: Gordon H. Hanson
Chapter URL: http://www.nber.org/chapters/c6184
Chapter pages in book: (p. 297 - 322)

11 The Effects of Offshore Assembly on Industry Location: Evidence from U.S. Border Cities Gordon H. Hanson
One of the principal arguments presented against the North American Free Trade Agreement (NAFTA) was that it would encourage domestic manufactur- ers to shut down their operations in the United States and move them to Mex- ico. The NAFTA debate was by no means the first time labor unions and other protectionist interests had appealed to such concerns in an attempt to restrict trade between the United States and low-wage countries. The offshore assem- bly provision (OAP) of the U.S. tariff code has been the focus of repeated debates, with labor consistently arguing for its repeal.'
An OAP permits the duty-free return of domestically manufactured compo- nents that have been processed in another country The importing agent is re- quired to pay import duties only on the value added abroad. OAPs do reduce the cost of moving assembly operations abroad-hence the source of labor opposition-but this is by no means the sole effect of offshore assembly on the domestic economy. The existence of transport costs gives domestic compo- nents manufacturers an incentive to locate near the foreign assembly plants they supply. If a U S . producer supplies assembly plants in a particular foreign region, the firm, all else equal, has an incentive to locate its production opera- tions in the U.S. port city or border area that offers the least-cost access to the foreign market. An OAP, then, potentially affects not only the international location of assembly but also the internal location of complementary manufac- turing activities in the source country.2
Gordon H. Hanson is assistant professor of economics at the University of Texas, Austin, and a faculty research fellow of the National Bureau of Economic Research.
The author thanks James Hanigan and conference participants for helpful comments. Raymond Robertson provided excellent research assistance.
I . For a discussion of labor union opposition to the U.S. OAP, see Grunwald and Flamm (1985). Schoepfle and Perez-Lopez (1988), and Mendez (1993).
2. This possibility may explain labor's coolness toward the argument that an OAP prevents the United States from losing entire industries-components production and assembly-to foreign countries. For a union, there is little difference between a components firm moving to Asia and i t moving to a right-to-work state such as Texas.
297

298 Gordon H. Hanson
In this paper, I study the effect of offshore assembly on the location of man- ufacturing activity in the United States. The locational effects of OAPs have yet to be addressed in the literature. Grossman (1982) develops a theoretical framework that identifies the conditions under which an OAP offers greater protection than a conventional pure-tariff scheme. Finger (1976), Mendez, Murray, and Rousslang (1991), and Mendez (1993) examine the welfare effects of OAPs. All three studies find that, compared to a flat-rate tariff scheme, the US . OAP offers a slight to moderate improvement in welfare and redistributes income from domestic assemblers to components producers and consumers. One shortcoming of these analyses is that they aggregate over regions within a country. To the extent that an OAP causes components production in the source country to relocate internally, it may generate interregional distributional ef- fccts that are missed at the national level.
An additional motivation for studying the U.S. OAP is that it offers a pre- view of the effects that NAFTA is likely to have on industry location in the United state^.^ Mexico is one of the largest suppliers of OAP imports to the U S . economy. Given Mexico’s proximity to the United States and its relatively abundant supply of low-wage labor, the country is a natural site in which to locate offshore assembly for the U.S. market. There is little reason to be- lieve that NAFTA will change the current binational pattern of specialization in manufacturing. In the absence of trade barriers, it is likely that the United States will have a comparative advantage in components production and that Mexico will have a comparative advantage in assembly operations. To the ex- tent that transport costs matter for industry location, the U.S.-Mexico border region is likely to become an important production site for the integrated North American market.
The approach I take is to study how the growth of offshore assembly in Mexico has affected the U.S. border economy. I construct a data set of manu- facturing activities in U S . and Mexican border cities using a combination of U S . and Mexican government sources. The cities on the US.-Mexico border form, in many respects, binational metropolitan areas. City pairs such as San Diego-Tijuana and El Paso-Ciudad Juarez are divided by an international boundary, but they engage in extensive trade in goods and labor services. It is in the larger Mexican border cities that most offshore assembly for the U.S. market occurs. This makes U.S. border cities a natural site in which to locate complementary manufacturing activities. The particular question I ask is whether the growth of export assembly plants in Mexican border cities has contributed to the expansion of specific manufacturing activities in neigh- boring U S . border cities.4
3 . There have been many studies on how NAFTA will affect resource allocation in the United StaLes. Canada, and Mexico (for a survey, see Brown, Deardorff, and Stern 119921). Only Hender- son ( 1993) addresses the intranational locational consequences of economic integration.
3. Hanson (1996) examines the effect of US.-Mexico integration on the overall pattern of eco- nomic activity in the U.S. border region.
299 The Effects of Offshore Assembly on Industry Location
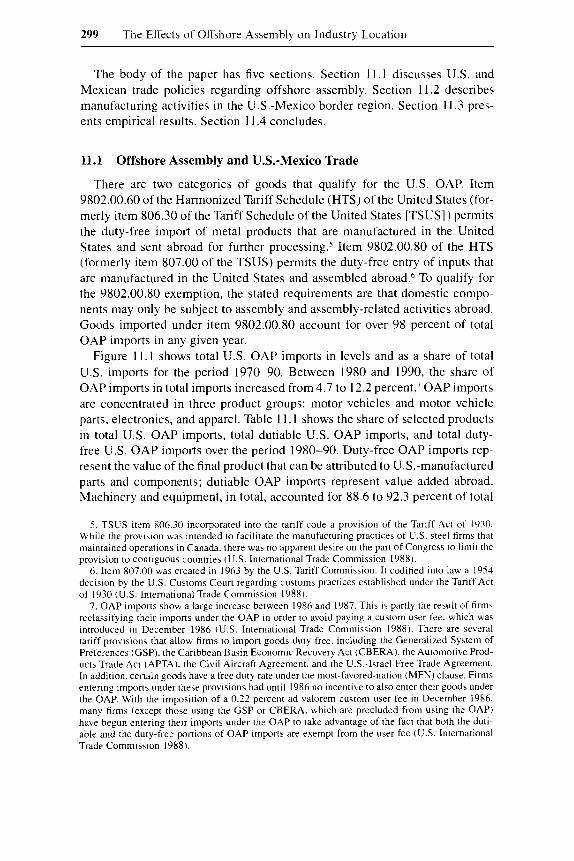
The body of the paper has five sections. Section 11.1 discusses U.S. and Mexican trade policies regarding offshore assembly. Section 11.2 describes manufacturing activities in the US.-Mexico border region. Section 11.3 pres- ents empirical results. Section 11.4 concludes.
11.1 Offshore Assembly and U.S.-Mexico Trade
There are two categories of goods that qualify for the U S . OAP. Item 9802.00.60 of the Harmonized Tariff Schedule (HTS) of the United States (for- merly item 806.30 of the Tariff Schedule of the United States [TSUS]) permits the duty-free import of metal products that are manufactured in the United States and sent abroad for further pro~ess ing .~ Item 9802.00.80 of the HTS (formerly item 807.00 of the TSUS) permits the duty-free entry of inputs that are manufactured in the United States and assembled abroad.6 To qualify for the 9802.00.80 exemption, the stated requirements are that domestic compo- nents may only be subject to assembly and assembly-related activities abroad. Goods imported under item 9802.00.80 account for over 98 percent of total OAP imports in any given year.
Figure 11.1 shows total U.S. OAP imports in levels and as a share of total U.S. imports for the period 1970-90. Between 1980 and 1990, the share of OAP imports in total imports increased from 4.7 to 12.2 percent.' OAP imports are concentrated in three product groups: motor vehicles and motor vehicle parts, electronics, and apparel. Table 11.1 shows the share of selected products in total U.S. OAP imports, total dutiable U.S. OAP imports, and total duty- free U.S. OAP imports over the period 1980-90. Duty-free OAP imports rep- resent the value of the final product that can be attributed to US.-manufactured parts and components; dutiable OAP imports represent value added abroad. Machinery and equipment, in total, accounted for 88.6 to 92.3 percent of total
5 . TSUS item 806.30 incorporated into the tariff code a provision of the Tariff Act of 1930. While the provision was intended to facilitate the manufacturing practices of U S . steel firms that maintained operations in Canada. there was no apparent desire on the part of Congress to limit the provision to contiguous countries (U.S. International Trade Commission 1988).
6. Item 807.00 was created in 1963 by the U.S. Tariff Commission. It codified into law a 1954 decision by the U.S. Customs Court regarding customs practices established under the Tariff Act of 1930 (U.S. International Trade Commission 1988).
7. OAF' imports show a large increase between 1986 and 1987. This is partly the result of firm5 reclassifying their imports under the OAF' in order to avoid paying a custom user fee. whlch was introduced In December 1986 (U.S. International Trade Commission 1988). There are several tariff provisions that allow firms to import goods duty free. including the Generalized System of Preferences (GSP). the Caribbean Basin Economic Recovery Act (CBERA), the Automotive Prod- ucts Trade Act (APTA). the Civil Aircraft Agreement. and the US.-Israel Free Trade Agreement. In addition. certain goods have a free duty rate under the most-favored-nation (MFN) clause. Firms entering imports under there provisions had until 1986 no incentive to also enter their goods under the OAP. With the imposition of a 0.22 percent ad valorem custom user fee in December 1986. many firms (except those using the GSP or CBERA. which are precluded from using the OAP) have begun entering their imports under the OAP to take advantage of the fact that both the duti- able and the duty-free portions of OAP imports are exempt from the user fee (U.S. International Trade Commission 1988).

300 Gordon H. Hanson
0 U.S. OAP Imports A U.S. OAP Imports/Total U.S. I lnpOr tS I 1 I I 1
90
BO
m c 30 - 20 8
0 4
d
10
0
.14
m Y
.12 h
.10 2
.00 g
Y
.-4
c \ m
.06 L
.04 a
:: Y
e 0
.02 2 0
Year
Fig. 11.1 U.S. OAP imports
OAP imports over the period. Motor vehicles are the single largest category of OAP imports, accounting for 59.1 percent of total OAP imports in 1990. The next largest categories are electronic items, including semiconductors and of- fice machines, followed by apparel.
There is considerable variation across products in the U.S. content of OAP imports. Table 1 1.2 shows duty-free OAP imports and dutiable OAP imports as shares of total OAP imports by product over the period 1980-90. In 1990, the duty-free share of OAP imports-the share of the value of the final product attributable to U.S. parts and components-was 50 percent or higher in ap- parel, semiconductors, circuit breakers, and electrical conductors but was less than 25 percent in motor vehicles, internal combustion engines, and televi- sion receivers.
Mexican trade policy allows domestic and foreign firms to take full advan- tage of the U.S. OAP. In 1965, Mexico began to permit the creation of export assembly plants under the Border Industrialization Program.* The program ex- empted the plants, known as maquiladoras, from value-added taxes, duties on imported inputs, and restrictions on foreign ownership, as long as they ex- ported all their output (Hansen 1981). The tariff exemption was of particular importance prior to Mexico’s liberalization of trade in 1985. The combination of the U.S. OAP and Mexico’s maquiladora program implies that a firm that ships U.S.-manufactured components to a plant in Mexico for assembly and
8. One motivation for the Border Industrialization Program was the end of the Bracero Program (1948-64). which had allowed Mexican nationals to work as agricultural laborers in the United States. The Mexican government was concerned about a sudden influx of returning workers and sought to create employment opportunities for them along the border (Hansen 1981).

Table 11.1 US. OAP Imports of Selected Products, 1980-90
OAP Imports of Product as Share of
Product and Year All OAP Imports Dutiable Imports Duty-Free Imports
Apparel, textiles: 1980 1982 1984 1986 1988 1990
1980 1982 1984 I986 1988 1990
1980 1982 I984 1986 I988 I990
1980 1982 1984 1986 1988 1990
1980 1982 1984
1988 1990
1980 1982 1984 1986 1988 1990
I980 I982 1984
Machinery, equipment:
Motor vehicle parts:
Motor vehicles:
Circuit breakers:
1986
Electrical conductors:
Combustion engines:
,043 ,036 ,032 ,039 ,032 ,046
386 ,890 .919 .910 ,923 ,902
.048
.017 ,024 .025 .053 ,038
,375 ,439 ,447 .64 1 ,598 ,591
.0 12
.0 14
.0 13 ,013 ,010 .023
.01 I
.013
.018 ,023 ,016 ,018
,004 ,012 .028
,022 ,019 ,016 ,018 ,019 .032
.927
.926 ,954 ,953 ,950 ,930
.06 I
.0 I8 ,023 ,022 ,053 ,034
SO7 ,584 ,589 ,744 ,672 ,672
,007 .009 .007 .005 .005 ,007
.006
.007 ,009 .0 1 I ,008 ,010
,004 .0 10 ,027
,010 ,085 ,082 ,144 ,078 .08 1
,776 ,792 ,817 ,702 ,832 ,830
,012 ,014 ,026 ,035 ,055 ,048
,016 ,022 ,028 . i 48 ,347 .385
.027
.03 1 ,033 ,046 ,027 ,063
,023 .03 1 ,045 ,080 ,045 ,038
,005 .0 I7 ,029
(continued)

302 Gordon H. Hanson
Table 11.1 (continued)
OAP Imports of Product as Share of:
Product and Year All OAP Imports Dutiable Imports Duty-Free Imports ~
I986 I988 I990
1980 19x2 1984 1986 1988 I990
I980 I982 I984 I986 I988 I990
1980 1982 I984 1986 I988 I990
Ofhce machine5
Semiconductors
Televirion receivers
.029
.035 ,027
,044 ,042 ,064 ,017 ,035 ,028
.I76
.170
.I61
.o I5
.059 ,065
.009 ,007 ,005 .o I2 ,012 .O I9
,027 ,039 ,033
,044 .04 I ,069 ,016 ,036 ,028
,089 .084 .084 .008 ,035 .040
.0 1 1
.008 ,007 .012 ,012 .02 1
,037 ,022 .o 11
,045 ,044 ,052 ,024 ,033 ,025
.4 13
.4 17 ,388 ,047 ,142 ,127
,003 ,003 .002 ,012 .o 1 1 .015
Source: U S . International Trade Commission, Imports underltems 806.30 arid 807.00 of the Tariff Schedule uf rhe United States (various editions). Note: For the period 1980-90, OAP imports are those entered under items 806.30 and 807.00 of TSUSA. The dutiable portion of OAP imports is that equal to the value added by foreign sources; the duty-free portion is that equal to the value of US.-made parts and components. All products that follow machinery and equipment in the table belong to that product category.
then reimports the finished good will, between the two countries, pay import duties in the United States only on the value of Mexican labor and raw materi- als used in the assembly process. Initially, the maquiladora provisions were limited to a free-trade zone that occupied a twenty-kilometer strip on the Mexi- can side of the border with the United States. In 1972, the Mexican government began to allow the creation of maquiladoras in most parts of the country, and, in 1988, the government began to allow the plants to sell up to half their output on the domestic market (Schoepfle and Perez-Lopez 1990).
Figure 11.2 shows U.S. OAP imports from Mexico as a share of total U.S. OAP imports for the period 1980-90. For comparison, figure 11.2 also shows the share of total U S . imports from Mexico. Mexico is the third largest sup- plier of OAP imports, accounting for 16.99 percent of total U.S. OAP imports
303 The Effects of Offshore Assembly on Industry Location
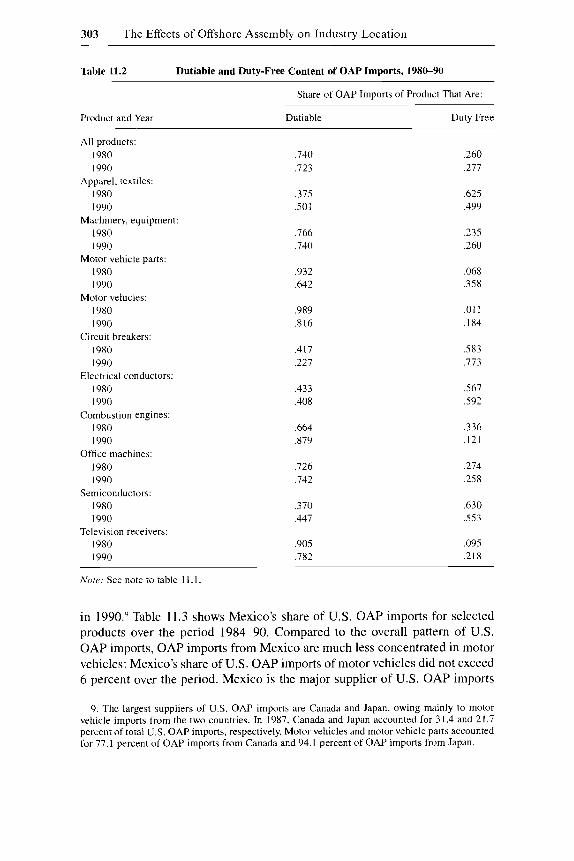
Table 11.2 Dutiable and Duty-Free Content of OAP Imports, 1980-90
Share of OAP Imports of Product That Are:
Product and Year Dutiable Duty Free ~~ ~~ ~ ~
All products: 1980 I990
1980 1990
1980 I990
1980 I990
1980 1990
1980 1990
1980 1990
I980 1990
1980 I990
I980 1990
1980 1990
Apparel, textiles:
Machinery, equipment:
Motor vehicle parts:
Motor vehicles:
Circuit breakers:
Electrical conductors:
Combustion engines:
Office machines:
Semiconductors:
Television receivers:
,740 ,723
,375 ,501
,766 ,740
,932 ,642
,989 .8 16
,417 ,227
,433 ,408
,664 ,879
,726 .742
.370
.447
,905 ,782
,260 ,277
,625 ,499
,235 ,260
,068 ,358
.0 I 1 ,184
,583 ,773
,567 ,592
,336 ,121
,274 ,258
,630 ,553
,095 .2 I8
Note: See note to table 1 I . I
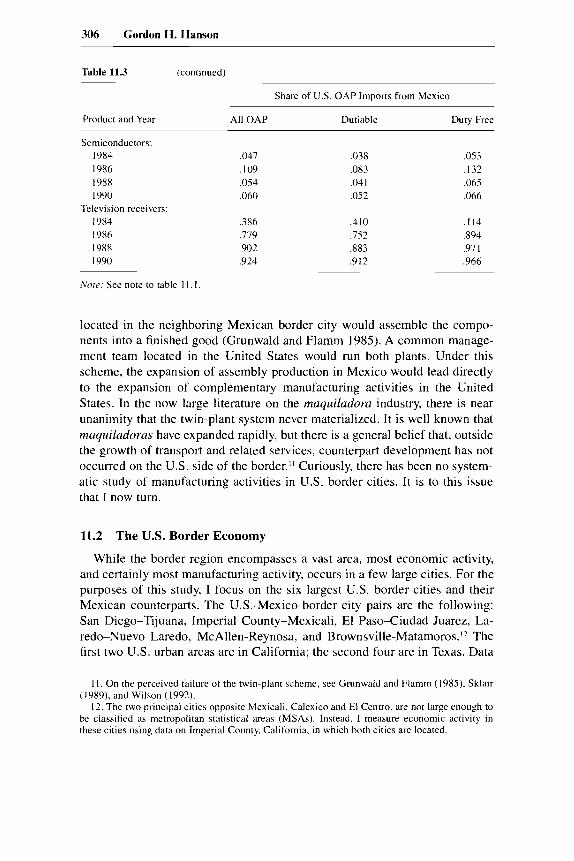
in 1990.’ Table 11.3 shows Mexico’s share of U.S. OAP imports for selected products over the period 1984-90. Compared to the overall pattern of U.S. OAP imports, OAP imports from Mexico are much less concentrated in motor vehicles: Mexico’s share of U.S. OAP imports of motor vehicles did not exceed 6 percent over the period. Mexico is the major supplier of U.S. OAP imports
9. The largest suppliers of U.S. OAP imports are Canada and Japan, owing mainly to motor vehicle imports from the two countries. In 1987, Canada and Japan accounted for 31.4 and 21.7 percent of total U.S. OAP imports, respectively. Motor vehicles and motor vehicle parts accounted for 77. I percent of OAP imports from Canada and 94. I percent of OAP imports from Japan.

304 Gordon H. Hanson
o Share of US. OAP I m orte from Mexico n Share of Total U.S. %ports from Mexico
. I 4
.12
.02 4 I I I
B b 82 ah 86 88 9b Year
Fig. 11.2 U S . imports from Mexico
in a number of electronic and electrical products. In 1990, the country ac- counted for over 80 percent of U.S. OAP imports of electrical conductors, motors and generators, and television receivers and over 30 percent of U S . OAP imports of motor vehicle parts and circuit breakers. During the 1980s, Mexico became a relatively less important source of U.S. OAP apparel im- ports.
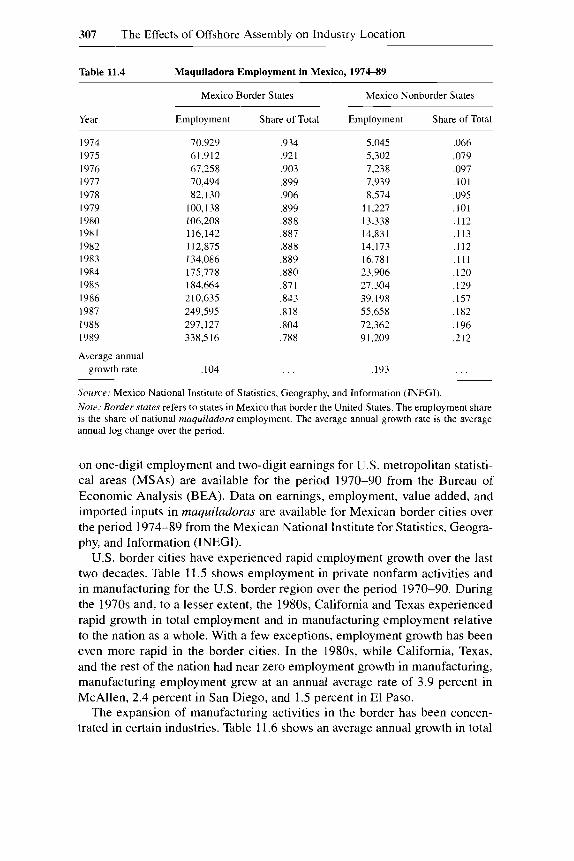
Export assembly plants in Mexico are overwhelmingly concentrated in states on the country’s northern border. Table 11.4 shows employment in ma- quiladoras for border and nonborder states in Mexico over the period 1974-89. There has been a tremendous expansion in offshore assembly over the last two decades. During the sample period, total export assembly employment (in border and nonborder plants combined) in Mexico grew at an average annual rate of 11.3 percent. Within border states, maquiladoras are concentrated in a few border cities. In 1989, maquiladora employment in the six largest border cities accounted for 66.7 percent of national maquiladora employment.’” One factor that may explain the geographic concentration of export assembly plants within the border region is the existence of industrial parks in certain border cities, which provide water and power services and often rent warehouse space and production facilities (Sklair 1989). Such services are scarce or nonexistent in other parts of the border region.
In its original conceptualization, U.S. and Mexican supporters of the maqui- ladora program envisioned a “twin-plant” production arrangement, in which a plant located in a U.S. border city would manufacturer components and a plant
10. These cities are Tijuana, Mexicali, Ciudad Juarez, Nuevo Laredo, Reynosa, and Matarnoros.

Table 11.3 OAP Imports from Mexico as Share of Total U.S. OAP Imports, 1984-90
Share of U S . OAP Imports from Mexico -
Product and Year All OAP Dutiable Duty Free
Apparel, textiles: 1984 1986 1988 1990
1984 1986 198X I990
1984 1986 1988 1990
I984 1986 1988 I990
1984 1986 1988 I990
1984 1986 1988 1990
1984 1986 1988 I990
1984 1986 1988 I990
1984 1986 1988 I990
Machinery, equipment:
Motor vehicle parts:
Motor vehicles:
Circuit breakers:
Electrical conductors:
Combustion engines:
Motors & generators:
Office machines:
,319 ,326 .238 ,236
,154 ,157 ,130 ,153
,407 ,219 ,159 ,359
.008 ,036 ,039 ,058
.725 ,778 ,797 ,429
,855 2 3 2 .902 ,952
.66 I ,590 ,218 ,136
.68 I ,793 ,815 ,889
,131 ,057 ,141 ,161
.I98 ,198 , 151 ,134
-099 ,092 ,085 .I08
,292 ,089 .07 I .I98
,003 .02 1 ,029 ,042
,623 .7 1 I ,725 ,633
.74 I ,715 ,822 ,935
,605 ,536 .I64 ,101
,547 ,682 .692 ,809
,078 ,045 ,112 ,115
,388 ,401 .310 3 3 1
.343
.578 ,300 ,282
.701 ,618 ,447 .647
,286 ,398 . I 0s .128
,786 2 1 6 ,847 ,369
,920 ,907 ,948 ,964
,817 ,776 .s3 1 ,393
,847 ,908 ,943 ,963
,343 ,096 ,246 ,290
306 Gordon H. Hanson
Table 11.3 (continued)
Share of US. OAP Imports from Mexico
Product and Year All OAP Dutiable Duty Free
Semiconductors: 1984 ,047 .038 ,053 1986 . I09 ,083 ,132 1988 ,054 .04 1 ,065 I990 ,060 ,052 ,066
I984 .386 .4 I0 ,114 1986 .I19 ,152 ,894 I988 ,902 ,883 ,971 1990 .924 .9 12 ,966
Television receivers:
Note: See note to table I I . I .
located in the neighboring Mexican border city would assemble the compo- nents into a finished good (Grunwald and Flamm 1985). A common manage- ment team located in the United States would run both plants. Under this scheme, the expansion of assembly production in Mexico would lead directly to the expansion of complementary manufacturing activities in the United States. In the now large literature on the maquiladora industry, there is near unanimity that the twin-plant system never materialized. It is well known that maquiladoras have expanded rapidly, but there is a general belief that, outside the growth of transport and related services, counterpart development has not occurred on the U.S. side of the border.Il Curiously, there has been no system- atic study of manufacturing activities in U.S. border cities. It is to this issue that I now turn.
11.2 The U.S. Border Economy
While the border region encompasses a vast area, most economic activity, and certainly most manufacturing activity, occurs in a few large cities. For the purposes of this study, I focus on the six largest U.S. border cities and their Mexican counterparts. The US.-Mexico border city pairs are the following: San Diego-Tijuana, Imperial County-Mexicali, El Paso-Ciudad Juarez, La- redo-Nuevo Laredo, McAllen-Reynosa, and Brownsville-Matamoros.12 The first two U.S. urban areas are in California; the second four are in Texas. Data
1 I . On the perceived failure of the twin-plant scheme, see Grunwald and Flamm (1985). Sklair (1989), and Wilson (1992).
12. The two principal cities opposite Mexicali, Calexico and El Centro, arc not large enough to be classified as metropolitan statistical areas (MSAs). Instead, 1 measure economic activity in these cities using data on Imperial County, California, in which both cities are located.
307 The Effects of Offshore Assembly on Industry Location
Table 11.4 Maquiladora Employment in Mexico, 1974-89
Mexico Border States Mexico Nonborder States
Year Employment Share of Total Employment Share of Total
1974 I975 I976 1977 1978 1979 1980 1981 1982 1983 1984 19x5 1986 1987 1988 I989
Average annual growth rate
70,929 61,912 67,258 70,494 82,130
1 00.1 38 106.208 116,142 112,875 134,086 175,778 184,664 210,635 249,595 297,127 338,516
,104
,934 ,921 ,903 ,899 ,906 ,899 ,888 ,887 ,888 ,889 ,880 .87 I .843 ,818 304 ,788
5.045 5,302 7,238 7,939 8,574
1 1,227 13,338 14.83 1 14,173 16,781 23,906 27.304 39,198 55,658 72.362 9 1,209
,193
,066 .079 ,097 ,101 ,095 ,101 ,112 .I13 ,112 , 1 1 1 . I20 . I29 .I57 ,182 . I96 ,212
Source: Mexico National Institute of Statistics, Geography, and Information (INEGI). Nore: Border slates refers to states in Mexico that border the United States. The employment share is the share of national maquiladora employment. The average annual growth rate is the average annual log change over the period.
on one-digit employment and two-digit earnings for U S . metropolitan statisti- cal areas (MSAs) are available for the period 1970-90 from the Bureau of Economic Analysis (BEA). Data on earnings, employment, value added, and imported inputs in maquiladoras are available for Mexican border cities over the period 1974-89 from the Mexican National Institute for Statistics, Geogra- phy, and Information (INEGI).
U.S. border cities have experienced rapid employment growth over the last two decades. Table 11.5 shows employment in private nonfarm activities and in manufacturing for the U.S. border region over the period 1970-90. During the 1970s and, to a lesser extent, the 1980s, California and Texas experienced rapid growth in total employment and in manufacturing employment relative to the nation as a whole. With a few exceptions, employment growth has been even more rapid in the border cities. In the 1980s, while California, Texas, and the rest of the nation had near zero employment growth in manufacturing, manufacturing employment grew at an annual average rate of 3.9 percent in McAllen, 2.4 percent in San Diego, and 1.5 percent in El Paso.
The expansion of manufacturing activities in the border has been concen- trated in certain industries. Table 11.6 shows an average annual growth in total

Table 11.5 Employment in U.S. Border Cities and Border States, 1970-90
Private, Nonfarm Employment Manufacturing Employment ('000s of workers) ('000s of workers)
Region and Year Employment Annual Growth Employment Annual Growth
U.S.: 1970 I980 I990
I970 I980 I990
1970 I980 1990
El Paso: 1970 I980 1990
Laredo: 1970 I980 I990
Mc Allen: 1970 1980 1990
California: 1970 1980 1990
Imperial: I970 I980 1990
San Diego: 1970 I980 I990
Texas:
Brownsville:
70,868.2 91,121.8
114,610.3
3,825.2 6,039. I 7,649.8
36.1 63.4 79.1
101.9 156.0 208.4
18.6 30.3 44.3
36.3 70.5
103.9
6,917.9 l0,3 15.8 14,330.9
18.1 27.7 37.8
376.6 680.0
1,106.3
. . . ,025 ,023
. . . ,046 ,024
. . . ,056 ,022
. . . ,043 ,029
. . . ,049 .038
. . . .067 ,037
. . . .040 ,033
. . . .043 .03 1
. . . ,059 ,049
19,684.4 20,776.6 19,755.6
755.8 1,067.8 1,033.7
5.0 11.8 12.1
23.9 36.4 42.4
1.1 2. I 1.9
3.5 9.5
14.0
1,594.5 2,074. I 2.2 2 9.4
I .6 2.0 I .6
67.8 112.2 142.3
. . . ,005
- ,005
. . . ,035
- .003
. . . .086 ,003
. . . .042 ,015
. . . .064
-.013
. . . ,099 ,039
. . . ,026 .007
. . . ,025
-.023
. . . ,050 .024
Source: BEA, Regional Economic Information System Nore: The cities listed are metropolitan statistical areas, as defined by the BEA (except for Impe- rial. which is Imperial County, California). MSAs typically encompass groups of cities that form a contiguous urban area. Annual growth refers to the annual average log change in employment over the previous decade.

Table 11.6 Average Annual Growth in Total Earnings by Manufacturing Industry, 1975-90
Average Annual Growth in Total Earnings (log change in total eamings/U.S. PPI)
Border City Industry City State Nation
Manufacturing: Brownsville ,020 El Paso ,034 Laredo ,027 McAllen ,069 Imperial -.014 San Diego ,060
Brownsvillle ,017 El Paso ,023 Laredo ,024 McAllen ,066 Imperial - ,029 San Diego ,066
Brownsville ,052 El Paso .002 Laredo .lo9 McAllen .08 1 Imperial - ,044
Nondurable goods:
Apparel:
San Diego ,012 Durable goods:
Brownsville ,024 El Pa50 ,058 Laredo .03 1 McAllen ,079
San Diego ,059
Brownsville ,068 El Paso ,198 Laredo ,094 McAllen ,162
San Diego ,075
Brownsville ,182 El Paso .060 San Diego .068
Imperial .0 I 3
Elec. & electronic equip.:
Imperial ,158
Motor vehicles:
Norr: See note to table 11.5.
,034 ,034 ,034 ,034 .038 .038
.03 1
.03 1
.03 I
.03 1
.035 ,035
-.001 -.001 -.001 -.001
,046 .046
,036 .036 ,036 ,036 ,040 ,040
,071 .07 1 .07 1 .07 I ,028 ,028
,030 ,030 ,003
.02 I
.023
,003
.o 19
.0 I8
,018
310 Gordon H. Hanson
earnings, deflated by the U.S. PPI, for selected manufacturing industries in U.S. border cities over the period 1975-90. Relative to the United States as a whole, average annual earnings growth in durable goods was more rapid in five of the border cities, and average annual earnings growth in nondurable goods was more rapid in four of the border cities. The most dramatic differences in earnings growth are for the specific industries that account for most offshore assembly: apparel, electric and electronic equipment, and motor vehicles and motor vehicle parts. While average annual real earnings growth in apparel was nearly flat (0.3 percent) for the nation as a whole, it was 5.2 percent in Brown- sville, 10.9 percent in Laredo, and 8.1 percent in McAllen. And, while average annual real earnings growth in electric and electronic equipment was 1.8 per- cent for the United States as a whole, it was over 6 percent in each of the border cities and over 15 percent in El Paso, McAllen, and Imperial County. Owing to disclosure restrictions, earnings data in motor vehicles are available only for Brownsville, El Paso, and San Diego. In each of these cities, average annual real earnings growth was more than 4 percent higher than for the nation as a whole.
The industries in which offshore assembly is concentrated now account for the majority of border manufacturing activity.I3 Table 11.7 shows the share of two-digit earnings in total manufacturing earnings for border cities and states in 1975 and 1990. In 1990, while apparel accounted for 2.8 percent of national manufacturing earnings, it accounted for over 25 percent of manufacturing earnings in Brownsville, El Paso, and McAllen. Similarly, while electrical and electronic equipment accounted for 9.0 percent of national manufacturing earnings, the industry accounted for over 14 percent of earnings in El Paso, Laredo, and San Diego.
Some questions remain regarding the nature of the manufacturing activities located in U.S. border cities. While I argue that these activities represent com- ponents production and other activities that are complementary to offshore as- sembly, it is entirely possible that part or all of border manufacturing is unre- lated to export manufacturing in Mexico. Unfortunately, the BEA data do not identify whether manufacturing activities take the form of components produc- tion, final goods production, or assembly. Anecdotal evidence, however, sug- gests that much U.S. border manufacturing represents components production for Mexican maquiladoras. Reports in the Twin Plant News, a U S . trade maga- zine for firms that engage in offshore assembly in Mexico, identify two types of manufacturing activities that predominate in US. border cities: plastic injec- tion molding and metal stamping. Both activities are general techniques used to create parts and components for domestic electronic devices and motor ve-
13. Food products has historically been the major manufacturing industry in the U.S. border region. In 1975, it accounted for over 20 percent of manufacturing earnings in Brownsville, La- redo, McAllen, and Imperial County. While the industry is still relatively large in McAllen and Imperial County, over the period 1975-90 the industry's share of manufacturing earnings fell from 23.8 to 14.4 percent in Brownsville and from 29.3 to 13.4 percent in Laredo.

Table 11.7 Regional Industry Shares of Regional Manufacturing Earnings, 1975 and 1990
Industry and Region
~~
1975 1990
Nondurable goods: United States Texas
Brownsville El Paso Laredo McAllen
California Imperial San Diego
Apparel : United States Texas
Brownsville El Paso McAllen
California San Diego
Durable goods: United States Texas
Brownsville El Paso Laredo McAllen
California Imperial San Diego
United States Texas
Elec. & electronic equip.:
Brownsville El Paso Laredo Mc Allen
California San Diego
Motor vehicles: United States Texas
Brownsville El Paso
California San Diego
.37 I
.439
.532 ,692 ,576 ,796 ,304 ,715 . I62
,037 ,044 ,155 ,443 ,250 .03 I ,024
,630 ,561 ,468 308 .424 ,204 ,696 ,285 ,838
.093
.069 ,056 ,016 ,052 .0 I3 . I 5 5 . I27
,059 .o 1 5 ,039 .OOh .02 I ,004
.3X2 ,422 ,506 ,570 ,552 ,762 .290 .574 .178
,028 .026 .25 1 .268 ,302 ,034 ,012
.6 I 8 ,578 ,494 .430 ,448 ,238 .7 I0 ,427 ,822
,090 ,120 .115 . I76 ,142 .05 I .132 ,160
,057 ,014 ,104 .036 .o I2 ,004
~~
Note. See note to table 1 I .5

312 Gordon H. Hanson
hic1es.l‘ Injection-molding and metal-stamping firms appear to be mostly inde- pendent suppliers of major automobile companies or name-brand electronics producers. Some of these firms have relocated to the border at the behest of their major buyers.
The data presented in this section are consistent with the hypothesis that the expansion of export assembly activities in Mexican border cities has contrib- uted to an increase in manufacturing activities in U.S. border cities. The expan- sion of border manufacturing could, however, be due to local labor market conditions, such as low wages arising from an abundant local immigrant labor supply. In the next section, I use more formal techniques to identify the effects of offshore assembly in Mexico on border manufacturing activities in the United States.
11.3 Empirical Results
11.3.1 Model Specification
To study the effects of offshore assembly in Mexico on manufacturing activ- ities in U.S. border cities, I develop a simple model of employment at the city and industry level. As the demand for a city-industry’s output expands, the city-industry will increase the amount of labor it employs. Following Hanson (1996), labor demand at the city-industry level can be modeled as a function of sources of demand for city-industry output.
Consider a competitive labor market in which labor demand in city i by industry j at time t is given by the expression
where Xt,, is a vector of factors that shift labor demand, W?,, is the wage in city- industry ij, and &,,, is an unobserved shock to city-industry labor demand that has mean zero and constant variance uE. Let labor supply in the city-industry be given by
( 2 ) Lt , = g(AWG,,,, W,,, eFiJr,
where AWG,,, is the alternative wage for workers in the city-industry, and IJ.,,, represents an unobserved shock to city-industry labor supply that has mean zero and constant variance u ~ .
From equations (1) and (2). I derive a reduced-form regression equation for equilibrium city-industry employment. I assume that this expression can be written as
14, Rsports in the 7 i t irr Plorit Neii..~ state that employment in the El Paso plastic injection mold- ing industry greu by 700 percent between 1981 and 1988 (Roard 1990) and that in 1993 the industry supplied 5200 million worth of plastic components to Mexico’s offshore assembly indus- try (Goldsberry 1993). El Paso Community College and the University of Texas at El Paso now ofl;tr jpecialized courses in injection-molding techniques (Pannell 1993).
313 The Effects of Offshore Assembly on Industry Location
(3) In L,,t = (Y + y In AGWN, + In X,,,P + u, ,~ ,
where (Y and y are scalars, P is a vector of parameters, and the error term vlJ, is the weighted sum of the labor demand and labor supply shocks. There is also, of course, an analogous reduced-form expression for the equilibrium city- industry wage. Given that there are no data on wages at the two-digit industry level, I restrict my attention to employment.
I identify three variables that shift city-industry labor demand: total personal income in the state in which the MSA is located (SINC,,), total employment in the national industry (USL,), and employment in maquiladoras that are located in the Mexican border city that neighbors the U.S. MSA (MAQJ. The first two variables capture domestic demand for output by the city-industry. The third variable, maquiladora employment, captures foreign demand for city-industry output. To avoid introducing simultaneity bias into the regression, I measure state personal income excluding the MSA on which the observation is taken and measure national industry employment excluding the state in which the MSA is located.
Incorporating the output-demand variables into equation (3), the estimating equation is
(4) In L,,, = a + y In AWG,,, + 0, In SINCr,, + Pz In USL8,, + P, In MAQ,, + u,,,.
Two measures of the alternative wage are available: the average state manufac- turing wage, which I calculate excluding the MSA on which the observation is taken, and the average wage in private nonfarm, nonmanufacturing activities in the MSA.
Unobserved factors may cause employment to vary systematically between border cities or over time. A downturn in the Mexican economy may lead to a sudden influx of Mexican immigrants at all border sites, or the existence of port facilities in one border city may cause it to have higher employment relative to other border cities. To control for idiosyncratic factors that influence city- industry employment, I include dummy variables for the year and city-industry in the regression. Table 11.8 defines the variables and provides summary sta- tistics.
The variable of interest in equation (4) is In MAQ,,. If the expansion of offshore assembly in a Mexican border city increases the demand for manufac- turing goods produced in the neighboring U.S. border city, the estimated coef- ficient on In MAQ,, will be positive. This would indicate that the increase in offshore assembly increases the demand for local cross-border manufacturing goods, which in turn increases the demand for local cross-border manufactur- ing labor. Given the concentration of offshore assembly in certain industries, the effect of maquiladora activities may vary across industries. I allow for this possibility in the estimation.
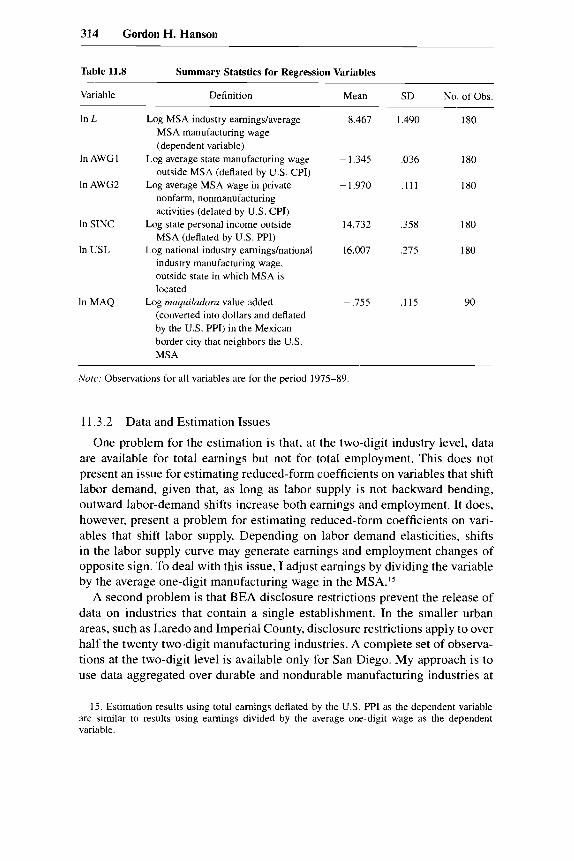
314 Gordon H. Hanson
Table 11.8
Variable Definition Mean SD No.ofObs.
Summary Statstics for Regression Variables
In L Log MSA industry earningdaverage 8.467 1.490 180 MSA manufacturing wage (dependent variable)
outside MSA (deflated by U.S. CPI)
nonfarm, nonmanufacturing activities (delated by U S . CPI)
MSA (deflated by U.S. PPI)
industry manufacturing wage, outside state in which MSA is located
(converted into dollars and deflated by the U.S. PPI) in the Mexican border city that neighbors the U.S. MSA
In AWG 1 Log average state manufacturing wage - 1.345 .036 180
In AWG2 Log average MSA wage in private -1.970 ,111 180
In SINC Log state personal income outside 14.732 ,358 180
In USL Log national industry eamingshational 16.007 ,275 180
In MAQ Log maquiladora value added -.755 ,115 90
Nore: Observations for all variables are for the period 1975-89
1 I .3.2 Data and Estimation Issues
One problem for the estimation is that, at the two-digit industry level, data are available for total earnings but not for total employment. This does not present an issue for estimating reduced-form coefficients on variables that shift labor demand, given that, as long as labor supply is not backward bending, outward labor-demand shifts increase both earnings and employment. It does, however, present a problem for estimating reduced-form coefficients on vari- ables that shift labor supply. Depending on labor demand elasticities, shifts in the labor supply curve may generate earnings and employment changes of opposite sign. To deal with this issue, I adjust earnings by dividing the variable by the average one-digit manufacturing wage in the MSA.I5
A second problem is that BEA disclosure restrictions prevent the release of data on industries that contain a single establishment. In the smaller urban areas, such as Laredo and Imperial County, disclosure restrictions apply to over half the twenty two-digit manufacturing industries. A complete set of observa- tions at the two-digit level is available only for San Diego. My approach is to use data aggregated over durable and nondurable manufacturing industries at
15. Estimation results using total earnings deflated by the U S . PPI as the dependent variable are similar to results using earnings divided by the average one-digit wage as the dependent variable.
315 The EiTects of Olfshore Assembly on Industry Location
the MSA level. The BEA publishes complete earnings data on durable-goods and nondurable-goods industries for all the MSAs in my sample. The durable- nondurable distinction remains useful for my purposes, given that, from table 1 1.6 above, the industries that account for most offshore assembly-electrical and electronic equipment and motor vehicles and motor vehicle parts-also account for most durable-goods manufacturing activity in U.S. border cities. Hence, I expect that the effects of offshore assembly on employment in U.S. border cities will be stronger for durable-goods industries than for nondurable- goods industries.
A final issue for estimation is that the variable In MAQ,, may be correlated with the error term, u,]~. One source of correlation is measurement error. It may be the case that In MAQlt does not capture all activity in the Mexican border area that creates demand for manufacturing goods produced in the neighboring U.S. border city. Measurement error will tend to bias the coefficient estimate on In MAQ,, toward zero (Griliches 1986). A second source of correlation be- tween In MAQ,, and u,], is that the allocation of maquiladora activities across Mexican border cities may itself be a function of the characteristics of U.S. border cities. It may be desirable to locate assembly plants opposite a U.S. border city that has a large local consumer market or good highways and ware- house facilities. In such a case, the unobserved shocks to U.S. city-industry employment will also affect the level of production in maquiladoras located in the neighboring Mexican city. If the level of maquiladora activity in a Mexican border city is correlated with employment shocks in the U.S. border city, the OLS coefficient estimate on maquiladora activities will be biased.
To correct for measurement error and possible endogeneity bias, I use instru- mental variables (IV) estimators. An ideal instrument is one that is correlated with In MAQ,, and uncorrelated with v,],. If there is no serial correlation in the error term, lagged values of the suspect endogenous variable are valid instru- ments. The instruments I use are current values of the other explanatory vari- ables and lagged values of In MAQ,,.
1 1.3.3 Empirical Results
I report OLS and IV estimation results for equation (4). Observations are pooled across MSAs on durable and nondurable manufacturing industries for the period 1974-89. I use two measures of the alternative wage, the state manu- facturing wage (outside the MSA) and the MSA average wage in nonmanufac- turing activities.
In table 11.9, I report OLS and IV regression results for equation (4), in which I constrain the coefficient on maquiladora employment to be equal for durable- and nondurable-goods manufacturing industries. The results are con- sistent with the hypothesis that growth in offshore assembly in Mexico contri- butes to the expansion of manufacturing in U.S. border cities. Coefficient esti- mates on In MAQ are positive and statistically significant in the 1 percent level

316 Gordon H. Hanson
Table 11.9 US. Border-City Manufacturing Employment Estimation Results (standard errors in parentheses)
Estimation Method
OLS IV
In AWGl
In AWG2
- 1.9878 (1.9955)
In SlNC .9544 (3121)
In USL -1.1096 (.9034)
In MAQ .3329** (.0629)
Hausman specification
,3966 (.5391) ,1402
(.7019) -1.0212
(.9103) .3347**
(.0636)
-2.4398 (2.0390)
,8929 (3279)
- 1.2230 (.9213) .4794**
(.0792) -3.324**
,625 1 (.5555)
-.2141 (.7256)
(.93 12)
(.0809)
-1.0971
,495 2* *
-3.546** test statistic
Adjusted R' .984 ,984 ,983 .985 No. of observations 168 168 168 168
Note: Observations are pooled across durable-goods and nondurable-goods manufacturing indus- tries in six U.S. border urban areas (San Diego, Imperial County, El Paso, Laredo, McAllen, and Brownsville) over the period 1974-89. All regressions include dummy variables for the city- industry and the year, which are not shown. Instruments include the (presumed) exogenous inde- pendent variables and the first lag of In MAQ. **Indicates significance at the 1 percent level.
in all regressions. The results do not depend on which measure of the alterna- tive wage I use.'6
The coefficient estimates on In MAQ in the IV regressions are approxi- mately one-third larger than those in the OLS regressions, which is consistent with the presence of measurement error. To determine whether there is mea- surement errodendogeneity bias in the regression, I perform a Hausman speci- fication test. I reject the null hypothesis that In MAQ is uncorrelated with the error term at a 1 percent level of significance. The coefficient estimates from the IV regressions should, then, be viewed as the more reliable.
The data presented in section 11.2 suggest that the growth of offshore as- sembly in Mexico has contributed to the expansion of specific manufactur- ing industries in U.S. border cities. These industries-electrical and elec- tronic equipment and motor vehicles and motor vehicle parts-produce durable goods. To determine whether the expansion of offshore assembly in Mexican border cities has had larger effects for durable-goods manufacturing,
16. The very high R2 statistics in tables I I .9 and in table 11.10 below are due primarily to the city-industry dummy variables. When the city-industry dummies are excluded from the regression, the adjusted R' falls to 0.42.

317 The Elkcts of Offshore Assembly on Industry Location
Table 11.10 Estimation Results with Industry-Varying Coefficients (standard errors in parentheses)
Estimation Method
In AWG 1
In AWG2
In SINC
In USL
In MAQ . DNON
In MAQ DDUR
F-statistic on equality of coefficients for In MAQ
Adjusted R' No. of observations
- 1.9282 ( 1.8930)
I .0406 (.7706) .6233
(.9574) .2200**
i.0658) .4328**
(.0646) 16.47**
,9853 I68
.5 I38 (.51 14) .I652
(.6648) ,7605
(.9648) .2225**
(.0661) .4387**
(.0653) 16.94**
.9853 168
-2.3644 ( I .9438)
.9825 (.7896) S633
(1.0036) .3590**
(.0827) .5782**
(.0823) 13.54**
.9846 168
,7432 ( .5282)
(.6887) ,7583
(1.0121) .3757**
(.0831) .6006*"
(.08 18)
-.I823
13.98**
,9845 168
Note: All regressions include dummy variables for the city-industry and the year. DNON is a dummy variable indicating nondurable-goods industry; DDUR is a dummy variable indicating durable-goods industry. Instruments include the (presumed) exogenous independent variables and the first lag of In MAQ. +*Indicates statistical signifance at the I percent level.
I allow the coefficient on In MAQ to vary across durable- and nondurable- goods industries. Table 11.10 reports OLS and IV regression results. I again find that the coefficient estimates on In MAQ are positive and statistically sig- nificant at the 1 percent level in all regressions. There is a striking difference between the results in tables 11.9 and 11.10. The coefficient estimates on In MAQ for durable-goods industries are nearly twice as large as those for nondurable-goods industries. In the first IV regression (col. 2a), the coefficient estimate on maquiladora value added is 0.578 for the durable-goods industry, compared to 0.359 for the nondurable-goods industry. I reject the null hypothe- sis that the coefficient on In MAQ is equal for durable- and nondurable-goods industries at a 1 percent level of significance in all regressions.
The estimation results are consistent with the hypothesis that the growth of offshore assembly in Mexico has contributed to the growth of complementary manufacturing activities in US. border cities. The quantitative effect of maqui- ladora growth on U S . border employment implied by the coefficient estimates is substantial. IV estimation results (table 11.10, col. 2a) imply that a 10 per- cent increase in offshore assembly activities in Mexico leads to a 5.8 per-
318 Gordon H. Hanson
cent increase in durable-goods manufacturing and a 3.6 percent increase in nondurable-goods manufacturing in U.S. border cities. These effects are large, considering that offshore assembly along the Mexican border has been grow- ing at a rate of more than 10 percent per year for the last two decades.
11.4 Concluding Remarks
The results of this paper have implications for how the U.S. economy will adjust to NAFTA, conditional on the outcome that NAFTA causes export as- sembly in Mexico to expand. U.S. border cities are an obvious site in which to locate production of parts and components consumed by Mexican maquilu- dorus. While manufacturing growth in the U.S. border region has been largely overlooked in the discussion surrounding North American economic integra- tion, the data tell a very clear story. As maquiladoras in Mexico have expanded over the last two decades, so, too, have complementary manufacturing activi- ties in U.S. border cities. The estimation results provide strong support for the hypothesis that the growth of maquiladoras in Mexico increases the demand for manufacturing goods produced in U.S. border cities.
A key question is whether the export assembly industry in Mexico will con- tinue to expand with the implementation of NAFTA. In a purely legalistic sense, NAFTA means the end of the maquiladora regime: it eliminates the “in- bond” arrangement, under which Mexican export assembly plants posted a bond for the value of the duties on the inputs they imported from abroad that was later returned to them once the products containing the imported inputs were exported. This does not mean, however, that NAFTA will alter the current pattern of specialization in which Mexican plants assemble goods from U.S .- made components and export the goods to the U.S. market. Curiously, none of the computable general equilibrium models developed to study NAFTA ad- dress the effects of trade reform on Mexico’s export assembly industry. In an appendix, I use the partial equilibrium framework developed by Grossman (1982) to determine what effect NAFTA will have on the offshore-assembly arrangement-the arrangement in which goods made from U S . components are assembled in Mexico. While such an approach has obvious limitations, the general thrust of the analysis is sensible.
Given Mexico’s low relative wages, it is likely that the country will continue to specialize in the assembly of manufactured goods for the North American market. The more difficult question is which country will produce the compo- nents that maquiladoras assemble. The pre-NAFTA pattern of trade between the United States and Mexico tells us something about each country’s compara- tive advantage. Prior to NAFTA, many goods, including television receivers, motor vehicle parts, and apparel, that were produced from U.S. components and assembled in Mexico were consumed in both the United States and Mex- ico. Even with the pre-NAFTA tariff disadvantage in the Mexican market, U.S.-made components were cheaper than Mexican-made components. The

319 The Effects of Offshore Assembly on Industry Location
abolition of trade barriers should strengthen the comparative advantage of the United States in components production. Of course, such an argument ignores the possibility that NAFTA will change relative prices enough that the United States no longer has a comparative advantage in components production. This is unlikely, however, given that pre-NAFTA tariffs were low for most products. The most likely scenario is that NAFTA will cause Mexican assembly plants and U.S. components producers to expand, in which case one can expect man- ufacturing activities in the United States to continue to relocate to the U.S. border region.
Appendix
I use the framework in Grossman (1982) to assess the effects of NAFTA on industries that engage in offshore assembly. The analysis considers the pattern of production that would emerge if tariffs were eliminated and pre-NAFTA prices remained constant. Such an exercise ignores the general equilibrium effects of trade reform, but it remains useful as a way to identify who benefits from the lowering of trade barriers, holding constant changes in other indus- tries.
Consider a final good j that is produced in two stages. In stage 1, an interme- diate good n is produced, and, in stage 2, the intermediate good is assembled into a final product. One unit of n is required to produce one unit of j . Let P; A
be the price of the final good j , where i is the source country for the intermedi- ate good, and k is the country in which assembly occurs. Let e, be the price of good n produced in country i. There are two countries: the United States, in- dexed by U , and Mexico, indexed by M . Both have tariffs on intermediate and final goods, where t:, is the tariff on good h in country i. There are also costs in shipping goods between countries, where s,, is the unit cost of shipping good h from the United States to Mexico, or vice versa.
I assume that all agents are price takers and that identical goods are con- sumed in the two countries. In practice, there are three possible structures of production: (1) pure U.S. production, (2) intermediate-good production in the United States and assembly in Mexico, and (3) pure Mexican production. The type 2 structure is the offshore assembly arrangement. Arbitrage implies that, in any given market, all types of good j must sell for the same price.
Consider the U S . market for good j . The U.S. price for a type 2 good is
( A l l
The price P,"" is the unit cost of producing the good (which includes the cost .T,, of transporting the intermediate good from the United States to Mexico for assembly). The final good must be transported from Mexico to the United
Py" + t," (PY" - PY - s,,) + s,.

320 Gordon H. Hanson
States, where a tariff is levied on the value added abroad. In the United States, type 2 goods compete with type 1 goods (e.g., television sets, apparel, motor vehicles). While assembly costs are higher for goods wholly produced in the United States, producers of these goods avoid the transport costs and import duties incurred in offshore assembly. Arbitrage requires that the U.S. price for all types of good j be equal:
p l u . u = pu.M + f u (pu.M - pu - + s1, (A21 1 I 1
In few, if any, of these markets are goods wholly produced in Mexico con- sumed in the United States. It must then be true that
(A3) P y M ( l + 5") + s, 2 P y M + r,!-'(PYM + P u ,I - s,,) - 3,.
The price of goods wholly produced in Mexico, inclusive of tariffs and trans- port costs, exceeds the price of offshore assembly goods and goods wholly produced in the United States.
Given (A2) and (A3), the effects of eliminating tariffs are ambiguous. De- pending on the sign of Py" - PYM, NAFTA may or may not cause goods wholly produced in Mexico to be sold in the U.S. market. Pre-NAFTA compe- tition in the Mexican market implies price relations that help resolve this ambi- guity. Suppose that Mexico consumes quantities of good j that are wholly do- mestically produced (e.g., apparel, some motor vehicles). If Mexico also consumes goods wholly produced in the United States, it must be true that
('44) P,"" = PYU (1 + ry) + s,.
If, instead or in addition, Mexico consumes offshore assembly goods, it must be true that
p M . M = p U . M + tM P U . (A51 n ,, I I
Equation (A5) shows that offshore assembly goods sold in Mexico are required to pay duties on the imported inputs used in production. Equations (A4) and (A5) may hold simultaneously.
Consider the effects of eliminating tariffs in both countries. Take first the case in which, prior to NAFTA, Mexico consumes quantities of good j pro- duced under offshore assembly. At pre-NAFTA prices, equations (A2) and (A5) imply that
(A2 ' ) Py" > P?" + s,, P,"" > PY".
Offshore assembly becomes the least-cost strategy of producing good j for both markets. This would cause U.S. components producers and Mexican as- sembly plants to expand and Mexican components producers and U S . assem- bly plants to contract. Now consider the case where, prior to NAFTA, goods wholly produced in the United States are consumed in Mexico. At pre-NAFTA
321 The Effects of Offshore Assembly on Industry Location
prices, it is again true that equation (A2') holds, and, from equation (A4), it is now true that
(A4') P y > Py." + s,. Combining equations (A2') and (A4'), it is clear that, in this case also, offshore assembly is the least-cost production strategy for both markets. Holding con- stant changes in other industries, NAFTA causes offshore assembly to expand.
In addition to ignoring general equilibrium effects, the analysis ignores the existence of countries outside NAFTA and the effects of scale economies. The second omission is likely to be the more serious. If production in manufactur- ing is subject to increasing returns to scale, NAFTA may lead to greater spe- cialization in components production in all three countries. In this event, NAFTA would cause components production to expand in both the United States and Mexico. Even in this case, however, there is still no reason to believe that product assembly in Mexico would contract. As long as Mexico special- izes in assembly, U S . components producers would have an incentive to locate a portion of their activities in the U.S. border region.
References
Brown, D. K., A. V. Deardorff, and R. M. Stem. 1992. North American integration.
Finger, J . M. 1976. Trade and domestic effects of the offshore assembly provision of
Goldsberry, Clare L. 1993. An editorial perspective. Twin Plant News, March, 45. Griliches, Z. 1986. Economic data issues. In Handbook of econometrics, vol. 3 , ed. Z.
Griliches and M. D. Intriligator. Amsterdam: North-Holland. Grossman, G. 1982. Offshore assembly provisions and the structure of protection. Jour-
nal of International Economics 12:301-12. Grunwald, J., and K. Flamm. 1985. The globalfactory; Foreign assembly and interna-
tional trade. Washington, D.C.: Brookings. Hansen. N. 198 1. The border economy: Regional development in the Southwest. Austin:
University of Texas Press. Hanson, G. 1996. US.-Mexico integration and regional economies: Evidence from
border-city pairs. Worlung Paper no. 5425. Cambridge, Mass.: National Bureau of Economic Research.
Henderson, J. V. 1993. Some favorable impacts of a US-Mexico Free Trade Agreement on U.S. urban employment. In The Mexico-U.S. Free Trade Agreement, ed. P. Garber. Cambridge, Mass.: MIT Press.
Mendez, J. A. 1993. The welfare effects of repealing the U.S. offshore assembly provi- sion. Journal of International Economics 34: 1-22.
Mendez, J. A., T. Murray, and D. J. Rousslang. 1991. U.S.-Mexico employment effects of repealing the U.S. offshore assembly provision. Applied Economics 23:553-66.
Pannell, Keith H. 1993. Border education: Responding to the converging needs of the region. Twin Plant News, March, 38-39.
Roard, Mike. 1990. Advanced technology. Twin Plant News, January, 4 1-42.
Economic Journal 102: 1507-19.
the U.S. tariff. American Economic Review 66:598-611.

322 Gordon H. Hanson
SchoepHe, G., and J. Perez-Lopez. 1988. U S . employment impact of TSUS 806.30 and 807.00 provisions and Mexican maquiladoras: A survey of issues and estimates. Economic Discussion Paper no. 29. Washington, D.C.: U.S. Department of Labor.
. 1990. Employment implications of export assembly operations in Mexico and the Caribbean Basin. Working Paper no. 16. Washington, D.C.: Commission for the Study of International Migration and Cooperative Economic Development.
Sklair, L. 1989. Assembling fo r development: The maquila industry in Mexico and the United States. New York: Unwin Hyman.
U.S. International Trade Commission. 1988. Imports under items 806.30 and 807.00 of the tariff schedule of the United States, 1984-87. Publication no. 2 144. Washing- ton, D.C.
Wilson, P. A. 1992. Exports and local development: Mexico’s new maquiladoras. Aus- tin: University of Texas Press.