The effects of method of forage-finishing and cattle breed ...
151
The effects of method of forage-finishing and cattle breed on growth performance, carcass characteristics, meat quality, and fatty acid composition by Lyle M.K. Shepherd A Thesis Presented to The University of Guelph In partial fulfillment of requirements for the degree of Master in Animal and Poultry Science Guelph, Ontario, Canada © Lyle M.K. Shepherd, September 2013
Transcript of The effects of method of forage-finishing and cattle breed ...
The effects of method of forage-finishing and cattle breed on growth
performance, carcass characteristics, meat quality, and fatty acid composition
by
Lyle M.K. Shepherd
A Thesis
Presented to
The University of Guelph
In partial fulfillment of requirements
for the degree of
Master
in
Animal and Poultry Science
Guelph, Ontario, Canada
© Lyle M.K. Shepherd, September 2013

ABSTRACT
THE EFFECTS OF METHOD OF FORAGE-FINISHING AND CATTLE BREED ON
GROWTH PERFORMANCE, CARCASS CHARACTERISTICS, MEAT QUALITY,
AND FATTY ACID COMPOSITION
Lyle M.K. Shepherd Advisor:
University of Guelph, 2013 Dr. Ira B. Mandell
Three methods of forage-finishing (pasture, silage, hay) for beef cattle were used to
evaluate growth performance, carcass traits, meat quality, and fatty acid composition relative to
grain-finished beef. Two hundred steers (100 Angus, 100 Hereford) were equally allocated
(based on size) to 2 locations, evaluating alfalfa or grass forages as alternatives to grain. Growth
performance and carcass traits were greater for grain-finished steers. Forage-finishing increased
(P < 0.02) concentrations of alpha-linolenic acid and total omega-3 fatty acids vs. grain-
finishing. A trained taste panel found no difference (P > 0.05) in tenderness between forage-and
grain-finished beef. Beef flavour intensity was greater (P < 0.05) in grain-finished beef.
Generally, method of forage-finishing did not affect palatability attributes of beef relative to a
grain-finished product but did affect fatty acid composition regardless of whether alfalfa or grass
was used for forage-finishing. Angus and Hereford results were similar.
iii
ACKNOWLEDGEMENTS
The opportunity to undertake and complete this endeavour can be accredited to my
advisor, Dr. Ira Mandell. I would like to thank him for all of his extensive knowledge and input
into this project. Many thanks are also due to my advisory committee; Dr. Robert Berthiaume,
Dr. Niel Karrow, and Dr. Steve Miller. Their guidance and advice were of great value in the face
of such a daunting undertaking.
The help and support of Cheryl Campbell and Lisa Pivotto cannot go unmentioned, their
help and support with the carrying out of this project were of vital importance. I would also like
to thank Dr. Margaret Quinton for her statistical expertise in the analysis of the results that we
obtained.
Many thanks to the staff of the University of Guelph Meat Lab (and especially Brian
McDougall, Judy Kendall, and Sam Leo), who made it possible for this project to become a
reality.
This project was also made possible through the financial support of the Ontario
Cattlemen’s Association (via the Growing Forward program), and the Canadian Cattlemen’s
Association Beef Cattle Research Council. Access to research facilities was provided by
Agriculture and Agri-Foods Canada and the Ontario Ministry of Agriculture and Rural Affairs
(OMAFRA). Many thanks to Cargill Meat Solutions Corp. for allowing us access to their
facilities and service, and their help with obtaining our samples.
I would also like to thank all the friends, family, and loved ones that supported me
throughout this journey. Without them I would not have found the strength achieve all that I
have.
iv
TABLE OF CONTENTS
1. INTRODUCTION ……………………………………………………………………….1
2. LITERATURE REVIEW
2.1. GROWTH PERFORMANCE OF FORAGE-FINISHED STEERS ……….6
2.2. ASSESSMENT OF CARCASS TRAITS IN FORAGE-FINISHED
CATTLE ………………………………………………………………………...10
2.3. ASSESSMENT OF MEAT QUALITY IN FORAGE-FINISHED BEEF ...15
2.4. FATTY ACID COMPOSITION OF FORAGE-FINISHED BEEF ……….20
3. THE EFFECTS OF METHOD OF FORAGE-FINISHING AND CATTLE BREED
ON GROWTH PERFORMANCE, CARCASS CHARACTERISTICS, MEAT
QUALITY, AND FATTY ACID COMPOSITION
3.1. ABSTRACT……………………………………………………..….…....….25
3.2. MATERIALS AND METHODS…………………………………..….......27
3.2.1. ANIMAL MANAGEMENT ………………………………………...27
3.2.2. CATTLE SLAUGHTER AND CARCASS PROCESSING ………28
3.2.3. MEAT QUALITY EVALUATION ………………………………..30
3.2.4. FEED ANALYSIS …………………………………………………...34
3.2.5. DETERMINATION OF INTRAMUSCULAR FAT CONTENT
AND FATTY ACID COMPOSITION ……………………………..34
3.2.6. SENSORY EVALUATION OF LONGISSIMUS MUSCLE ……..36
3.2.7. STATISTICAL ANALYSIS ………………………………………..39

v
3.3. RESULTS AND DISCUSSION – FORAGE-FINISHING USING
ALFALFA…………………………………………………………………….….. 41
3.3.1. ANALYSIS OF DIETS FOR CATTLE MANAGED AT NLARS
(FORAGE-FINISHING USING ALFALFA) …………………………….41
3.3.2. GROWTH PERFORMANCE FOR CATTLE MANAGED AT
NLARS (FORAGE-FINISHING USING ALFALFA) ………………...41
3.3.3. CARCASS TRAITS FOR CATTLE MANAGED AT NLARS
(FORAGE-FINISHING USING ALFALFA)………… ………………….45
3.3.4. COLOUR OF SUBCUTANEOUS FAT OVER LM FOR CATTLE
MANAGED AT NLARS (FORAGE-FINISHING USING ALFALFA) .51
3.3.5. LEAN TISSUE COLOUR AND SHELF-LIFE FOR BEEF FROM
CATTLE MANAGED AT NLARS (FORAGE-FINISHING USING
ALFALFA)…………………………………………………………….……52
3.3.6. FATTY ACID COMPOSITION IN BEEF CUTS FROM CATTLE
MANAGED AT NLARS (FORAGE-FINISHING USING ALFALFA)..54
3.3.7. SENSORY EVALUATION OF LM FROM CATTLE MANAGED AT
NLARS (FORAGE-FINISHING USING ALFALFA) ………………...58
3.4. RESULTS AND DISCUSSION – FORAGE-FINISHING USING
GRASSES …………………………………………………………………………62
3.4.1. ANALYSIS OF DIETS FOR CATTLE MANAGED AT KAP
(FORAGE-FINISHING USING GRASSES) ………………………..63
3.4.2. GROWTH PERFORMANCE FOR CATTLE MANAGED AT KAP
(FORAGE-FINISHING USING GRASSES)...…………………… ...64

vi
3.4.3. CARCASS TRAITS FOR CATTLE MANAGED AT KAP
(FORAGE-FINISHING USING GRASSES) ..………………………67
3.4.4. COLOUR OF SUBCUTANEOUS FAT OVER LM FROM
CATTLE MANAGED AT KAP (FORAGE-FINISHING USING
GRASSES) ……….…………………………………………………..71
3.4.5. LEAN TISSUE COLOUR AND SHELF-LIFE FOR BEEF FROM
CATTLE MANAGED AT KAP (FORAGE-FINISHING USING
GRASSES) …………………………………………………………….72
3.4.6. FATTY ACID COMPOSITION IN BEEF CUTS FROM CATTLE
MANAGED AT KAP (FORAGE-FINISHING USING
GRASSES) …………………………………………………………….74
3.4.7. SENSORY EVALUATION OF LM FROM CATTLE MANAGED
AT KAP (FORAGE-FINISHING USING GRASSES)…………... ...78
3.5. CONCLUSION ……...………………………………………………...……81
4. REFERENCES ……………………………………………………………………….115
vii
LIST OF TABLES
Table 1. Nutritional Composition of Diets (DM basis) ………………………………..85
Table 2. Fatty Acid Legend with Common Names and Chemical Names for
Individual Fatty acids and Classes of Fatty Acids ………………………………….86
Table 3. Fatty Acid Composition of Diets (% of Total Fatty Acids) ……………...........87
Table 4. Management Regimen Effects on Growth Performance Traits When
Cattle are Forage-finished on Alfalfa ………………………………..88
Table 5. Breed Effects for Growth Performance Traits …………………………………89
Table 6. Management Regimen Effects on Carcass Quality Traits When Cattle are
Forage-finished on Alfalfa …………………………………………………………..90
Table 7. Breed Effects on Carcass Characteristics When Cattle are Forage-Finished
on Alfalfa …………………………………………………………………………91
Table 8. Management Regimen Effects on Subcutaneous Fat Colour ………………….92
Table 9. Breed Effects on Subcutaneous Fat Colour ……………………………………93
Table 10. Management Regimen Effects on Longissimus Colour, pH, and Shelf-Life
Attributes When Cattle are Forage-Finished on Alfalfa …………………………….94
Table 11. Management Regimen Effects on Semitendinosus Muscle Colour, pH, and
Shelf-Life Attributes When Cattle are Forage-Finished on Alfalfa ………………….95
Table 12. Breed Effects on Longissimus Colour, pH, and Shelf-Life Attributes ……….96
Table 13. Breed Effects on Semitendinosus Muscle Colour, pH, and Shelf-Life
Attributes …………………………………………………………………………….97
Table 14. Management Regimen Effects on Fatty Acid Composition (% of Total
Fatty Acids) of Longissimus Muscle When Cattle are Forage-Finished on Alfalfa ….98
Table 15. Management Regimen Effects on Fatty Acid Composition (% of Total
Fatty Acids) of the Semitendinosus Muscle When Cattle are Forage-Finished on
Alfalfa ………………………………………………………………………………..99
Table 16. Breed Effects on Fatty Acid Composition (% of Total Fatty Acids) of
Longissimus Muscle When Cattle are Forage-Finished on Alfalfa……………….....100
viii
Table 17. Breed Effects on Fatty Acid Composition (% of Total Fatty Acids) of the
Semitendinosus Muscle of Steers Forage-Finished on Alfalfa ………………………101
Table 18. Management Regimen Effects on Sensory Attributes of LM Steaks and
Shear Force Values of ST and LM steaks When Steers are Forage-Finished with
Alfalfa ………………………………………….……………………………………102
Table 19. Effect of Post-mortem Ageing on Shear Force Values (Longissimus and
Semitendinosus)………………………………………………………………………103
Table 20. Breed Effects on Sensory Attributes for LM Steaks and Shear Force
Values of ST and LM Steaks ……………………………………………………….104
Table 21. Management Regimen Effects on Growth Performance Traits When
Cattle are Forage-Finished on Grass ……………………………………………….105
Table 22. Management Regimen Effects on Carcass Quality Traits When Cattle are
Forage-Finished on Grass …………………………………………………………..106
Table 23. Breed Effects on Carcass Characteristics When Cattle are Forage-Finished
on Grass …………………………………………………………………………….107
Table 24. Management Regimen Effects on Longissimus Colour, pH, and Shelf-Life
Attributes When Cattle are Forage-Finished on Grass …………………………….108
Table 25. Management Regimen Effects on Semitendinosus Muscle Colour, pH, and
Shelf-Life Attributes When Cattle are Forage-Finished on Grass ………………….109
Table 26. Management Regimen Effects on Fatty Acid Composition (% of Total
Fatty Acids) of Longissimus Muscle When Cattle are Forage-Finished on Grass ….110
Table 27. Management Regimen Effects on Fatty Acid Composition (% of Total
Fatty Acids) of the Semitendinosus Muscle of Steers Forage-Finished on Grass …..111
Table 28. Breed Effects on Fatty Acid Composition (% of Total Fatty Acids) of the
Longissimus Muscle When Cattle are Forage-Finished on Grass …………………..112
Table 29. Breed Effects on Fatty Acid Composition of the Semitendinosus Muscle of
Steers Forage-Finished on Grass ……………………………………………………113
Table 30. Management Regimen Effects on Sensory Attributes of LM Steaks and
Shear Force Values of ST and LM steaks When Steers are Forage-Finished with
Grass ……………………………………………………………………………….114
ix
APPENDIX TABLES
Appendix Table 1. Covariates Used in Statistical Analysis of Data ……………………128
Appendix Table 2. Overall Analysis of Variance for Growth Performance Data
When Cattle are Forage-Finished on Alfalfa ……………….......................129
Appendix Table 3. Overall Analysis of Variance of Carcass Characteristics When
Cattle are Forage-Finished on Alfalfa ……………………………………130
Appendix Table 4. Overall Analysis of Variance for Subcutaneous Fat Colour
Data………………………....………………………………………………131
Appendix Table 5. Overall Analysis of Variance for Longissimus Colour Data……….132
Appendix Table 6. Overall Analysis of Variance for Semitendinosus Muscle Colour
Data When Cattle are Forage-Finished on Alfalfa ………………………...133
Appendix Table 7. Overall Analysis of Variance for Fatty Acid Composition Data
of the Longissimus Muscle When Cattle are Forage-Finished on Alfalfa …134
Appendix Table 8. Overall Analysis of Variance for Fatty Acid Composition Data
of the Semitendinosus Muscle of Steers Forage-Finished on Alfalfa ……..135
Appendix Table 9. Overall Analysis of Variance for Sensory Attributes Data of LM
Steaks ……………………………………………………………………..136
Appendix Table 10. Overall Analysis of Variance for Shear Force Data ……………….137
Appendix Table 11. Overall Analysis of Variance of Effects on Carcass
Characteristics When Cattle are Forage-Finished on Grass ……………….138
Appendix Table 12. Overall Analysis of Variance for Fatty Acid Composition Data of the
Longissimus Muscle When Cattle are Forage-Finished on Grass……… …139
Appendix Table 13. Overall Analysis of Variance for Fatty Acid Composition Data of the
Semitendinosus Muscle of Steers Forage-Finished on Grass ……………...140
x
LIST OF ABBREVIATIONS
ADF Acid detergent fibre
ALF Alfalfa
ADG Average daily gain
BW Body weight
CBGA Canadian Beef Grading Agency
CLA Conjugated linoleic acid
CP Crude protein
DM Dry matter
DMI Dry matter intake
FA Fatty acid
IMF Intramuscular fat
KAP Kapuskasing (AAFC) research station
LM Longissimus Dorsi muscle
LMA Longissimus muscle area
MDA Malondialdehyde
MR Management regimen
MUFA Mono-unsaturated fatty acid
NE Net energy
NDF Neutral detergent fibre
NLARS New Liskeard Animal Research Station
PUFA Poly-unsaturated fatty acid
PM Post-mortem
SFA Saturated fatty acid

xi
ST Semitendinosus muscle
SF Shear force
SE Standard error
TBARS Thiobarbituric acid reactive substances assay
TDN Total digestible nutrients
TMR Total mixed ration
TFA Trans-fatty acid
USDA United States Department of Agriculture
WBSF Warner-Bratzler shear force
1
1. INTRODUCTION
Forage-finishing of beef is the primary method for finishing beef cattle around the world.
There is growing interest in North America to examine production systems that use forages as
the primary source of energy input for feeding beef cattle. This is due to perceived benefits for
environmental sustainability and animal welfare, as well as health benefits for consumers due to
qualitative and quantitative differences in nutrient content versus grain-fed beef. The term
forage-finished beef (or “grass-fed beef”) implies that forages are used as the primary source of
energy from weaning until slaughter; thus grains will never be fed to these animals (Producing
Forage-Finished Beef in Manitoba: a Manual, 2007). In order to produce “grass-fed beef” in
Canada, conserved forages (i.e. silage or hay) must also be used, as pastures are not available
year round.
There are numerous species of forage that can be utilized by ruminants which allows for
a production method that can be adopted somewhat universally. The two major families of
plants used as forages for feeding beef cattle are grasses (family of Poaceae) and legumes
(family Fabaceae) (Stevenson, 1982). Grasses are widespread, growing in many locations
whereas legumes are more selective in the areas that they may grow. Legumes are important
because of a symbiotic relationship with rhizobium bacteria, a nitrogen-fixing bacterium, which
can fix atmospheric nitrogen. This reduces the amount of fertilizer a producer would need to
apply for optimal production of forages. The types of carbohydrates also vary amongst the
different species of forages; legumes contain greater amounts of the sugars, galactose and
rhamnose when compared to grasses (Ojima and Isawa, 1968). The nutritive value of forages
can vary widely, with energy content often being the first limiting factor for determining feeding
value (Crampton et al., 1960). Further advancements in the development of high yielding, high
2
quality, and disease/pest resistant grazing crops show promise for forages, such as alfalfa, to
increase the viability of forage-finishing production methods (Smith and Singh, 2000).
Forage-finishing has been consistently shown to alter the fatty acid composition of beef
and increase the concentrations of omega-3 and linolenic fatty acids (Larick et al., 1990;
Dewhurst et al., 2003). Omega-3 fatty acids are essential dietary fatty acids which are often
consumed in inadequate amounts in the diets of many North Americans; food containing omega-
3 fatty acids are now marketed for their benefits to human health. Conjugated linolenic acids
(CLA) increase in ruminant products as a result of forage-finishing and have been associated
with anti-carcinogenic properties (Shultz et al., 1992). Although forages contain greater
concentrations of omega-3 fatty acids when compared to grains, the importance of forage species
on the amounts of linolenic acid in forages and the availability to ruminants has been recognized
by Itoh et al. (1999), Boufaied et al. (2003), Fraser et al. (2004), Dewhurst et al. (2006), and
Lourenco et al. (2008). Boufaied et al. (2003) noted that annual ryegrass, meadow fescue,
orchard grass, white clover, and trefoil had much higher concentrations of linolenic acid than
alfalfa.
Nutritive values of conserved forages are influenced by variables such as the length
between cuttings or the time of year of cutting (Dewhurst et al., 2008). Fatty acid
concentrations of grasses native to the UK were all higher during the vegetative growth stage
(late April) before significantly declining and then recovering in autumn. Fatty acid levels also
declined when the interval between cuttings was extended from 20 days to 38 days. Boufaied et
al. (2003) also reported that the method of conservation of timothy (as hay, haylage, or silage)
did not affect the linolenic acid, or omega 3 fatty acid levels when compared to fresh or wilted
timothy grass. However, when comparing fatty acid content of different methods of feeding
3
forages, conserving the forage as hay or silage altered the linolenic acid content when compared
to fresh pasture of various forage species (French et al., 2000; Shingfield et al., 2005; Dewhurst
et al., 2006).
Claims of forage-finishing methods to be more environmentally friendly (“green”) can be
misleading to consumers. Although high-grain feedlot diets require a considerably larger
amount of time and energy to produce than forages, forage pasture production also requires
external inputs to produce (fertilizers, supplemental feeds) (Galyean et al., 2011). When
comparing the resources required for forage-based finishing (on pasture) to feedlot finishing
(using a high grain diet), the area required to yield the same amount of production is about 12
times greater. Because of this increased area, the actual energy input can be increased by 2.5
times for an equal amount of beef being produced. Evidence suggests that improving
productivity through the use of more efficient high-grain diets actually decreased the carbon
footprint of beef production by up to 16% (Capper, 2011). In a comparison of 1977 and 2007
production methods, modern production techniques required 70% of the animals, 67% of the
land, 81% of the feed, and 88% of the water when compared to the methods used in 1977.
Greenhouse gas emissions are also greater in pasture systems than feedlot systems on a per live-
weight kilogram basis (Pelletier et al., 2010).
Although the environmental impact may be greater, the nutritional composition of forage-
finished beef (most importantly the fatty acid content) may be of interest to consumers. Many
beneficial fatty acids, such as the conjugated linoleic acid and omega-3 fatty acids, have been
shown to be greater in forage-finished beef when compared to its grain-finished counterpart
(French et al., 2000; Engle and Spears, 2004; Leheska et al., 2008). CLA is not naturally found
in monogastric meats (swine or poultry) and is reduced as a result of grain feeding to ruminants.
4
Another consideration when investigating forage-finishing is the effect of breed. Breed
differences may account for differences in growth and meat quality when using alternative
production methods. Baker et al. (2002) found that Angus bulls gained weight at a faster rate
than Hereford bulls when finished on grass pastures for the first 133 days after weaning
(although the ADG for Herefords during the period from 133 days to 16 months was greater than
Angus resulting in similar final body weights). Although, Wagner et al. (1986) found that
performance traits (i.e. dry matter intake) of cows on pasture can be similar between Angus and
Hereford, this can vary from year to year. Itoh et al. (1991) noted that breed may also have an
effect on fatty acid composition when feeding either a pasture or 70% grain diet; linolenic acid
content was greater in Angus steers when compared to Simmentals.
Numerous studies have investigated the use of forage-finishing and its effect on growth
performance, carcass quality, meat quality traits, fatty acid composition, and taste quality (Oltjen
et al., 1981; Bidner et al., 1986; Larick et al., 1990; Mandell et al., 1997). This has been
conducted in studies which examine one or two methods of forage-finishing such as pasture vs.
hay, pasture vs. forage silage, or hay vs. forage silage. To our knowledge, no study has
attempted to examine all of the above traits while examining the 3 methods of forage-finishing
(pasture, hay, and silage). Forage species will also be examined to determine if the difference in
fatty acid content of different forages can alter the fatty acid content and flavour characteristics
of the resulting beef.
The objectives of this study were:

5
To investigate the effects of forage-finishing and breed on growth performance, carcass quality,
meat quality traits, fatty acid composition, and taste quality relative to a high concentrate
finishing method using two different forage species (legume and grass).

6
2.0 LITERATURE REVIEW
2.1. GROWTH PERFORMANCE OF FORAGE-FINISHED CATTLE
The growth performance of beef cattle is one of the largest considerations when
determining the effectiveness of a production system. Measures of growth performance provide
data to quantify and anticipate the growth of animals under different production techniques. The
growth performance traits are measured during the growth of the animal, and include traits such
as the feed intake, weight gain, feed efficiency, and time on feed. From the perspective of the
producer, shortening the time on feed, increasing the market weight, and improving the feed
efficiency of an animal can aid in maximizing gross margins. Feed intake is the amount of feed
(on an as fed or dry matter basis) that an animal consumes, measured as a total amount or
amount given per unit of time (i.e. kilograms/day). Weight gain can be tracked as the total
weight gained, or the average daily gain (ADG) which is the total amount of growth divided by
the number of days on feed. Feed efficiency is a ratio of the amount of food ingested to the
amount of growth within that time period, often presented as either feed: gain or gain: feed.
Forage-finishing is widely accepted to decrease growth performance when compared to a
conventional high grain finishing diet, with many sources reporting effects on performance traits,
such as decreases in average daily gain, feed intake, and final body weight, as well as lengthened
time to slaughter and increased feed: gain (Utley et al., 1975; Bidner et al., 1981; Oltjen et al.,
1971; Forrest, 1982; Mandell et al., 1998; Roberts et al., 2009; Engle and Spears, 2004). In
North America, beef cattle are conventionally-finished on high energy diets composed of grains
such as corn or barley because of the fast growth associated with the high energy feedstuffs (as
well as other carcass trait and meat benefits) (Harrison et al., 1978). Within the past 40 years,
many studies have been conducted investigating the effect of forage-finishing on specific areas
7
of growth performance. Oltjen et al. (1971) described how a pelleted alfalfa diet (98.5% alfalfa
hay) produced lower average daily gains and a greater feed to gain ratio than an all-concentrate
(90.6% cracked corn) diet. Utley et al. (1975) reported an average daily gain of 1.35 kg for
crossbred steers finished on a conventional, high energy diet of 72.8% ground shelled corn, 20%
peanut hulls and 7.2% protein supplement compared to 1.06 kg for steers finished on an all-
forage diet of pellets consisting primarily of bermudagrass. Finishing with high grain diets,
when compared to forage diets, decreases the amount of time it takes for steers to reach market
weight (Bidner et al., 1981; Forrest, 1982).
Breed differences are an important consideration as some breeds are naturally faster
growing and differences in feedstuffs provided have less of an impact on overall performance
(when fed a conventional high grain diet from 1991 through 2000) (Schenkel et al., 2004). For
example, growth rates and mature body size are greater for Charolais and Simmental bulls as
compared to Limousin, Hereford, or Angus bulls (although backfat measurements are greater for
Hereford and Angus). Feed intake measurements for purebred Hereford and Simmental, Angus,
and Hereford beef cow crosses on pasture (measured by fecal output) over a two year period
resulted in similar intakes within these breed crosses (average 2.7 - 2.8 % of body weight/ day)
in the first year, but average daily intake measurements in the second year ranged from 2.2 to
2.8% of body weight (Wagner et al., 1986). Purebred Hereford intake was on the lower end of
this scale (2.3%) but the Angus-Hereford cross achieved a higher intake (2.5%). Performance
measurements for Angus and Hereford beef bulls fed a forage based diet (rye grass fed on
pasture) demonstrated that although Angus were heavier at weaning than the Hereford, by 16
months of age the mean body weight amongst all animals was similar indicating that both
Hereford and Angus will reach similar market weights on this type of diet (Baker et al., 2002).
8
Rates of gains varied between these two breeds though; Angus bulls gained faster post-weaning
and were heavier than Hereford bulls until 133 d post-weaning. ADG of Hereford bulls was
greater than Angus for the period until slaughter resulting in similar final body weights. Bartoň
et al. (2006) compared the growth performance of bulls from 4 breeds including Angus and
Hereford; slaughter weight and average daily gain were similar. This supports similar findings
obtained by Glimp et al. (1971) when comparing slaughter weight and average daily gain of
Angus and Hereford steers. Upon comparing the growth trends of Angus and Hereford steers, it
is therefore expected that they will be similar.
Growth performance can also be affected by different types of forage fed to cattle.
Legumes, such as alfalfa or clover, are commonly employed in forage studies as well as many
different types of grasses that grow natively in different areas. The nutrient content of these
different grasses can vary, for example in a comparison of grasses (Altai wild rye, Brome grass,
Crested wheatgrass, Kentucky bluegrass, oat hay, and reed canary grass fed as hay), traits such
as voluntary dry matter intake and gross energy were similar for the majority of these grass
species (Cymbaluk, 1990). However, reed canarygrass had the lowest gross energy value, and
the lowest digestible energy intake of the test grasses fed to cattle (also the only grass for which
the energy intake failed to surpass the maintenance requirement). In a comparison of grass
forage vs. a legume vs. a high-concentrate diet, there was no significant difference in
performance traits (average daily gain, final body weight) between grass (tall fescue)-fed and
legume (alfalfa)-fed cattle (Scaglia et al., 2012). Angus and Angus crossbred steers were fed on
pasture for the forage treatments whereas the high concentrate fed steers were finished in drylot
(final high concentrate diet consisted of 65% ground corn, 30% corn silage, 4% soybean meal,
and 1% supplement) . Average daily gain was measured and the forages produced daily gains of
9
0.93 kg and 0.98 kg for the alfalfa and tall fescue, respectively, while those in the drylot gained
an average of 1.32 kg/day. Angus steers finished on a grass-only pasture (of tall Fescue)
achieved poorer growth performance when compared to steers finished on a grass pasture with
legumes (either red clover or alfalfa) (Dierking et al., 2010) . Forage-finishing that includes
these two legume species resulted in increased average daily gain over grass only finishing
(ADG of 0.24 kg for cattle fed tall fescue versus ADG of 0.30 kg and 0.40 for alfalfa and red
clover respectively). Increasing the amount of legume species in a forage feeding system can
increase feed intake; beef steers finished on tallgrass-prairie forage produced a linear increase in
total dry matter intake with increases in the amount of alfalfa hay that was included (tallgrass-
prairie hay intake decreased linearly) (Vanzant and Cochran, 1994).
Performance of beef cattle can also be attributed to the method of forage-finishing (as
pasture or conserved as silage or hay). In an experiment with 60 Hereford steers, performance
was evaluated using timothy grass conserved as hay or silage with greater feed efficiency for
cattle fed silage (Petit and Flipot, 1992a). Daily dry matter intake was greater for hay-fed cattle
(2.36% of body weight) vs. silage-fed cattle (1.68% of body weight); however average daily gain
was greater for silage- vs. hay-fed cattle (0.81 kg and 0.73 kg, respectively). This resulted in
feed: gain of 7.1 for silage-fed cattle and 11.0 for hay-fed cattle. This was followed up by an
experiment to measure nutrient utilization in Hereford steers fed timothy grass conserved as
silage or hay with silage feeding improving protein utilization (Petit and Flipot, 1992b).
Digestion and incorporation of an added protein supplement to each forage treatment was
greater when it was added to the silage diet. Charolais steers finished on either a silage only diet
or a restricted silage and ad libitum pasture management system (grass-clover as forage)
achieved significantly different growth rates (Turner et al., 2011). Steers fed only silage had an
10
average daily gain of 0.74 kg whereas silage and pasture-fed steers only grew 0.60 kg/day. Thus,
there exists several factors that impact the performance of beef cattle when finished on forages;
many of these have been examined closely by other researchers in this field. However, few
researchers have examined all of the above mentioned factors within the same study.
2.2. ASSESSMENT OF CARCASS TRAITS IN FORAGE-FINISHED CATTLE
Carcass characteristics are measurements made post-slaughter that determine the value of
the carcass. Some of these measurements directly influence the marketability and consumer
perception of the final product, such as grade score. The carcass traits measured can include the
straightforward measurements of hot carcass weight (weight of carcass with hide, head, internal
fat, and organs removed), backfat depth, and ribeye (or longissimus muscle area). Other carcass
traits can be expressed using several different scoring methods such as marbling score, grade
score, yield grade, and colour (The Canadian Beef Grading Agency, 1998). Marbling score is
the measure of the intramuscular fat content of the carcass and is measured at the ribeye with
grading cameras. Marbling score along with maturity, muscling, ribeye texture and colour, fat
colour and texture, and fat measure are used to determine quality grade for the carcass. Marbling
categories include the following; Prime (highest level of marbling), AAA, AA, and A (for trace
amount of marbling). Yield grade or the % lean yield indicates the amount of lean tissue present
in the carcass. Lean yields can be predicted by the equation, (Lean % = 63.65 + muscle score -
grade fat), where muscle score refers to length and depth of the ribeye (longissimus dorsi) while
grade fat refers to the fat depth. USDA yield grade is used in the United States as a measure of
cutability (percentage of closely trimmed, boneless round, rib, loin, and chuck) and is evaluated
on a scale from 1 to 5 as derived from a regression equation (Crouse et al., 1975). A USDA
yield grade score of 1 is used for carcasses with the greatest amount of saleable lean while a

11
USDA yield grade score of 5 would be the lowest yielding carcass (carcass with the most fat).
Carcass composition can also be estimated by the proportion of lean, fat, and bone tissues as
measured from the rib section (Lunt et al., 1985).
Carcass weights are typically lighter with forage-finishing due to decreased and leaner
growth (Utley et al., 1975; Bidner et al., 1986; McCaughey et al., 1996; Steen et al., 2003; Engle
and Spears, 2004). Crossbred steers fed a pelleted diet consisting of mostly bermudagrass had
hot carcass weights that were 7.5% lower than steers finished on a conventional high energy diet
of mostly ground shelled corn (Utley et al., 1975). Carcasses are leaner when steers are finished
on forage diets as backfat depths are lower as well as having lower marbling scores (Utley et al.,
1975; Bidner et al., 1986; McCaughey et al., 1996; Steen et al., 2003; Engle and Spears, 2004).
Bowling et al. (1977) noted that beef finished on forage had half the amount of subcutaneous fat
as grain-finished beef. Ribeye (longissimus muscle) area is smaller with beef finished on
forages, likely as a result of the lighter carcass weight (Scaglia et al., 2012; McCaughey et al.,
1996; Steen et al., 2003; Dierking et al., 2010). However, when adjusted for the carcass weight,
ribeye area was not significantly different in Continental crossbred steers when finished on
ryegrass pasture when compared to steers-finished on a citrus pulp and ground maize high-
concentrate diet (Steen et al., 2003). Marbling scores are also lower as forage-finishing produces
leaner muscle tissue with less intramuscular fat (Utley et al., 1975; Bidner et al., 1986;
McCaughey et al., 1996). McCaughey et al. (1996) evaluated the effects of management regimen
(pasture- vs. grain-finishing) on marbling score in composite breed steers (1/4 Charolais, 1/4
Simmental, 1/16 Limousin, and 7/ l6 British). Marbling scores were lower in pasture- versus
grain-finished beef with 31.3 % of pasture steers devoid of marbling with no steers attaining
Canada AAA grade; in contrast, all grain-finished steers graded at or above Canada A grade
12
(trace amounts of marbling). Overall grade scores are generally lower for forage-finished beef
likely due to the decreased intramuscular fat content (Bidner et al., 1986; Larick et al., 1987;
MacCaughey et al., 1996; Roberts et al., 2009; Engle and Spears, 2004; Utley et al., 1975).
However, Hereford and Hereford cross steers finished on a primarily orchardgrass silage graded
similarly to steers finished on corn silage (with a small amount of concentrate supplement of
50% barley, 25% beet pulp, 20% oats, and 5% molasses). There was no significant difference in
yield grade between the two treatments with carcasses having grades of mostly A1 or A2
(Forrest et al., 1982). Yield grade is also lower for forage-finished steers (Roberts et al., 2009;
Engle and Spears, 2004; Utley et al., 1975). Crossbred steers finished on ryegrass pasture and
varying levels of whole shelled corn supplementation (0, 0.5 1.0 1.5%, and 2.0% of body weight)
achieved yield grade scores that decreased linearly as the level of corn increased (Roberts et al.,
2009). With beef fed forages, the colour of lean tissue can appear darker while carcass fat can
appear more yellow as a result of increased beta carotene ingestion and deposition in the fat
tissues (Bidner et al., 1981; Bidner et al., 1986; Scaglia et al., 2012; French et al., 2000;
McCaughey et al., 1996).
Carcass characteristics vary by breed because different breeds can have considerably
different body composition (Marshall et al., 1994). The methods for predicting the USDA yield
grade can produce varying degrees of accuracy when applied to different breeds as there are
differences in growth and fattening characteristics (Crouse, 1975). When examining the
existence of breed effects on fat content (both subcutaneous and intramuscular) and marbling
score, breed effects were present amongst a population of crossbred steers with the parental
breeds of Red Poll, Hereford, Angus, Limousin, Braunvieh, Gelbvieh, Simmental, and Charolais
(Gregory, 1994). Based on a marbling score scale in which 4.00 to 4.90 indicates slight and 5.00
13
to 5.90 indicates a small amount of marbling, marbling scores were highest for Angus (5.40) and
lowest for Limousin (4.46) with a mean score of 4.97 for all of the breeds (Hereford score was
5.24). Intramuscular fat (IMF) content for a lean sample from the longissimus ranged from
4.80% for Angus to 2.82% for Limousin with a mean of 3.96% (Hereford IMF% was 4.53%).
Carcass traits including hot carcass weight, fat thickness, longissimus muscle area, marbling
score, quality grade, and yield grade vary amongst different breed types when finished on pasture
(tall fescue overseeded with rye, ryegrass, and red clover during the cooler seasons and tall
fescue and bermudagrass overseeded with sudangrass and some millet during the warmer
seasons) (Camfield, 1999). Large framed- late maturing breed types (LL) (including Chianina or
Charolais, or crosses between the two breeds) had heavier hot carcass weights and larger
longissimus muscle areas when compared to the intermediate framed-intermediate maturing (II)
(Red Poll or Hereford), intermediate framed- early maturing (IE) (Angus), and small framed-
early maturing (SE) (smaller Angus) breeds. The II, IE, and SE breed groups had greater
marbling, quality grades, and yield grades when compared to the LL breed group.
Forage-finishing using a legume (alfalfa) produced a carcass with differing fat colour and
increased backfat and ribeye area when compared to finishing with the grass, tall fescue (Scaglia
et al., 2012). Fat colour was more yellow in Angus and Angus crossbred steers grazing tall
fescue when compared to cattle grazing alfalfa, possibly due to a higher carotenoid content in the
grass pasture. Backfat depth and ribeye area were significantly greater in carcasses from cattle
grazing alfalfa, 7.6 vs. 4.0 mm and 66.7 vs. 57.5 cm2 respectively when compared to carcass
measures from cattle grazing tall fescue. Larick et al (1987) reported that pasture forage species
(tall fescue, smooth bromegrass/red clover, and orchard grass/red clover) affected carcass traits
(hot carcass weight, ribeye area, backfat thickness, and carcass quality grades) for Hereford
14
steers. The tall fescue treatment produced steers with lower hot carcass weights, ribeye areas,
backfat depths, and quality grades when compared to cattle fed the bromegrass/red clover or
orchard grass/red clover diets; the two grass and red clover treatments produced carcasses with
similar carcass traits. However, Angus steers finished on tall fescue pasture produced similar
ribeye areas to steers finished on a grass and legume pasture (either red clover or alfalfa)
(Dierking et al., 2010). When comparing the two legume forages, the red clover pasture
produced significantly greater ribeye areas than the alfalfa pasture (71 cm2 vs. 77cm
2).
Carcass traits were similar when perennial ryegrass was fed as pasture or silage (French
et al., 2000). This included similar hot carcass weights and fat content for continental crossbred
steers fed the 2 forages using management regimens that included supplementary concentrate.
However, finishing Continental x Friesian bulls on forage silage increased lipid content by 39%
when compared to pasture-finished bulls (Steen and Kilpatrick, 1998). Other carcass traits were
similar because animals were slaughtered at a specific weight although growth rates were
similar.

15
2.3. ASSESSMENT OF MEAT QUALITY IN FORAGE-FINISHED BEEF
Meat quality traits that directly influence the consumer include the sensory traits, taste,
texture, and visual appeal. Taste can be an ambiguous term as the Oxford dictionary defines it as
“perceiving the flavour of a thing with the organ of taste” and perception will vary amongst
different individuals (The Oxford English Dictionary, 2012). These traits can all be affected by
several factors but these factors can be separated into two categories; the characteristics of the
individual animal (such as sex, age, breed, etc.) and by external factors (production methods,
diet, weather, slaughter, etc) (Field et al., 1966; Ferguson et al, 2001). Diet plays an important
role in the quality of the final product. Taste is a key component of consumer acceptance and
forage-finishing has been extensively shown to alter the taste of beef, reducing beef flavour and
imparting a flavour that is often described as grassy (Davis et al., 1981; Melton et al., 1982;
Larick et al., 1987). A significant decrease in beef flavour intensity was reported by Mandell et
al. (1998) from Limousin-cross steers fed either a 95% alfalfa silage ration or a 68% high
moisture corn ration. Other terms that have been used to describe off-flavours associated with
grass-fed beef are fishy, milky or dairy, metallic, or gamey (Brown et al., 1979; Davis et al.,
1981; Mandell et al., 1998; Cox et al., 2006).
Different methods exist for measuring these sensory traits, including objective methods
such as shear force tests and subjective methods such as taste panels. Tenderness can be
quantitatively assessed using instrumental measures such as the Warner-Bratzler shear force
(WBSF) test. In the WBSF test, the amount of force required to shear (succumb to the shear
stress which is the force parallel to the cross section) across the muscle fibres of a sample of beef
with an angled blade is measured. Lower shear force values indicate a more tender, easier to
chew steak as more force is required to shear through tough samples of meat. Consumer
16
acceptability of 98% for tenderness can be achieved with a shear force value of 4.1 kg or less
(Huffman et al., 1996); a threshold level of 4.6 kg for retail beef was 88.6% accurate for
predicting whether a consumer would rate beef tenderness as lower than “slightly tender”
(Shackelford et al., 1991). Colour is an important consideration as well as this is most likely the
first qualitative assessment that will be made by consumers when purchasing a cut of beef.
Colour can be measured objectively with the use of a colorimeter which will return measures of
lightness (L* on a scale of 0 [black]-100 [white]), redness [+a*] to greenness [-a*], and
yellowness [+b*] to blueness [-b*] (Barbut, 2002). Redness (a*) is an important colour
parameter to measure as it is an indication as to the oxidation level of the meat; prolonged air
exposure will decrease a* and it will appear less red and more brown which is unappealing to a
consumer (Renerre, 2000).
Subjective measurements are also often used for determining meat quality and these are
determined through the use of taste panels in which the panelists are asked to rank samples on
traits such as tenderness, juiciness, beef flavour, etc... This subjectivity could be reduced with
the use of a trained taste panel, which could be argued to be a more objective assessment.
Destefanis et al., (2008) stated that the tenderness results of a trained taste panel correlated
strongly with shear force measurements that they obtained through a WBSF test
(r = -0.72).
Forage-finishing is often associated with less tender and less flavourful beef when
compared to grain-finished beef (Bowling et al., 1977; Melton et al., 1982; Mitchell et al., 1991).
Melton et al. (1982) described the flavour characteristics of grass (tall fescue) fed beef from
Hereford and Angus steers as dairy-milky or soured dairy flavour. Off flavour incidence is
17
increased when forage diets were fed (Mandell et al., 1998; Sapp et al., 1999). However, other
sources have reported the opposite results with trained taste panels and consumer evaluations
noting no differences in palatability between beef finished on forages and grain-finished beef
(Angus-Hereford on bermudagrass and ryegrass pastures) (Bidner et al., 1981; Bidner et al.,
1986). Sapp et al. (1999) reported an increase in off-flavour in beef from Angus steers when
finished on wheat-rye grass pasture when compared to grain-finished steers, although shear force
values, sensory tenderness, and colour scores were similar between treatments. Shear force and
cook loss values were greater for forage-finished steers when compared to grain-finished steers
(Brown et al., 2007). Steers of different breeds (Chianina, Charolais, Red Poll, Hereford, and
Angus) achieved a mean shear force value of 3.1 kg when finished on tall fescue pasture in
comparison to a mean of 1.4 kg for grain-finished (corn/cotton seed hulls) steers. Shear force
values also vary with the cut of meat but some meat cuts may be more affected by a forage diet
(Kerth et al., 2007). Diet differences in shear force were found in the lumbar section of the
longissimus muscle, although there was little difference in the thoracic section. While WBSF
values for striploin differed for Angus cross steers finished on ryegrass pasture or a high grain
diet (85% corn), shear force, sensory tenderness, and flavor scores were not affected by diet
when evaluating the ribeye. Colour results vary widely within the literature. However a review
of the literature by Priolo et al. (2001) concluded that lightness (L*) decreased by approximately
5% for animals finished for 150 days with forages when compared to animals finished with a
concentrate finishing diet.
Beef flavour can be affected by the species of forage fed to cattle; the flavour of beef
from Hereford-Angus heifers fed sorghum-sudangrass for 84 days was described as sweeter, less
sour, and “gamier” than meat from heifers that grazed fescue-clover pasture (Larick and Turner,

18
1990). Heifers spent 84 days grazing a specific forage species; the heifers were then grouped
together and grazed tall fescue for 8 more days prior to entering a feedlot where a high grain
concentrate diet was fed ad libitum for 0, 54, or 82 days until slaughter. After the feedlot period
the scores associated with the presence of off-flavours were significantly reduced but differences
within the forages for off-flavour scores were still significant.
Palatability and texture characteristics can be affected by other factors as well such as
carcass weight, backfat thickness and pre-slaughter growth rate (May et al., 1992). May et al.
(1992) reported that feeding of a high-concentrate diet to 16 month old steers for up to 84 days
improved tenderness. As carcass fatness increased, the sensory tenderness score tapered and
began to decline after 196 days on feed and a mean fat thickness of 21.08 mm. Carcass traits
that affect tenderness, in order of importance, included carcass weight, marbling, score, and fat
thickness (presumably by increasing the early post-mortem temperature). Post-mortem (PM)
aging is known to increase tenderness and alter flavour (Goll et al., 1964; Koohmaraie et al.,
1988). The effect of PM aging also affects the flavour in conjunction with cooking (Spanier et
al., 1990). A trained taste panel found 2 d aged longissimus muscle steaks from pasture-finished
continental crossbred steers to be less tender with lower overall acceptability than grain-finished
beef but these differences were no longer present after 7 or 14 days of aging (French et al.,
2000).
Method of forage conservation can affect the colour of beef lean as feeding an
extensively fermented ryegrass silage produced beef with a* values (increased redness) greater
than a* values for beef from Friesian cattle grazing ryegrass or fed a restricted fermented
ryegrass silage (O’Sullivan et al., 1994). The forage treatments also produced beef with greater
19
oxidative stability (as determined by a TBARS assay) than beef from cattle fed a high
concentrate diet (either barley based or sugar beet pulp).
Breed differences can contribute to meat quality differences as well. In a comparison of
breeds with different maturities, there were no significant differences in cooking loss or shear
force (Brown et al., 2007). This study included large mature weight, late maturing
(LL)(Chianina, Charolais, or crosses between these breeds), intermediate mature weight, late
maturing (IL)(Red Poll or Hereford), intermediate mature weight, early maturing (IE)(current
pedigree Angus), and small mature weight, early maturing breeds (SE)( Angus cattle similar to
Angus used in the U.S. during the 1950’s). The breeds were finished on pasture (composed of
tall fescue overseeded with rye, ryegrass, and red clover) or in a feedlot (43% cracked corn/33%
cottonseed hulls based diet. Shear force values were significantly greater for longissimus muscle
steaks from all breeds finished on pasture when compared to steaks from feedlot steers, while
cook loss was significantly greater in IL and SE breed groups vs. LL and IE. There were no
significant differences in shear force or cook loss between Angus and Hereford steers. In terms
of flavour preference, similar preference scores were found for Angus and Hereford steaks in a
comparison of breed effects on beef sensory traits (Moore et al., 1978). Wheeler et al. (2010)
examined breed differences in palatability attributes for steaks from Angus, Hereford, Brangus,
Beefmaster, Bonsmara, and Romosinuano cattle. Longissimus steaks from Angus and Hereford
scored higher (and similar) for tenderness, juiciness, flavour, and overall satisfaction when
compared to the other breeds. Therefore, in terms of these breeds, diet is more likely to result in
a difference in flavour characteristics than breed differences (Warren et al., 2008).
20
2.4. FATTY ACID COMPOSITION OF FORAGE-FINISHED BEEF
Fatty acids (FA) are an important component of the nutritional value of any food item as
there are many essential FA required at the cellular level for proper cell function (Connor, 2000;
Simopoulos, 2002). Consumers are being made aware of the health risks regarding the amount
of fat and the fatty acid composition of the foods that they buy and consume every day. Health
professionals recommend that consumers decrease consumption of saturated fatty acids (SFA),
trans-fatty acids (TFA), and cholesterol, and to increase the intake of beneficial polyunsaturated
fatty acids (PUFA) including omega 3 (n-3) fatty acids (Kris-Etherton, 2007). TFA are
unsaturated fatty acids with one (or more) double bonds in the trans-configuration (Mozaffarian
et al., 2006). TFA are produced during the hydrogenation of vegetable oils and can be associated
with negative health effects such as cardiovascular disease. Natural TFA however, like those
produced by ruminants, may have beneficial health effects; these include the conjugated linoleic
acids which have been shown to have anticarcinogenic properties (Shultz et al., 1992). The
omega-3 fatty acids are widely accepted as essential as they are required as structural
components of the phospholipid membranes of body tissues, with higher concentrations in brain
tissue and spermatozoa (Connor, 2000). Omega-3 (n-3) and omega-6 (n-6) fatty acids are
polyunsaturated FA with a double bond at either the n-3 or n-6 position. Some omega-3 FA can
be produced in the body, such as DHA which can be synthesized from alpha- linolenic acid
(18:3n-3).
As consumers become more aware of the properties of specific fatty acids, this could
increase the demand for meats that are lower in the unwanted fatty acids and higher in the
beneficial fatty acids. An extensive amount of research has been done in this field and there is
strong evidence that feeding forages can have a significant effect on the fatty acid composition of
21
lipids in the lean tissue of beef (Larick et al., 1990). Forage plants are able to synthesize unique
fatty acids such as 18:3n-3 (an important building block of higher order omega-3 FA) and
feeding forages can increase the tissue deposition of these FA (Dewhurst et al., 2003). Larick et
al. (1990) found that the fatty acid composition of beef from Angus-Hereford heifers raised on
pasture was altered when heifers were then placed on a high grain diet for varying lengths of
time. The fatty acid composition in LM from Hereford-Angus heifers raised on Tifleaf pearl
millet, sorghum-sudangrass or fescue-clover pastures decreased alpha-linolenic acid (C18:3)
while increasing SFA and PUFA with increased time in the feedlot consuming a high grain diet.
In the past century there has been a significant increase in the consumption of n-6 fatty
acids (due to increased intake of vegetable oils) which have been shown to have negative effects
on human health such as increased blood viscosity and vasoconstriction (Simopoulos, 1999). N-3
fatty acids, however, have anti-inflammatory and vasodilatory effects, decreasing cardiovascular
disease, hypertension, and diabetes in those who regularly consume diets with a lower n-6: n-3
ratios (Simopoulos, 1999). The consumption of both SFA and TFA are known to increase the
risk of cardiovascular disease and medical professionals recommend decreasing the dietary
intake of these fatty acids (Christiansen et al., 1997). Plasma cholesterol levels can also increase
in some individuals when consuming a diet higher in SFA (Grundy an Vega, 1988). Conjugated
linoleic acids (CLA) are another family of fatty acids that have been investigated for health
benefits for humans. CLA are isomers of linoleic acid and have been associated with decreased
risk of some cancers as CLA have cytotoxic effects on human cancer cells in vitro (Shultz et al.,
1992). CLA supplementation decreased LDL cholesterol levels and atherosclerosis in rabbits
(Lee et al., 1994), along with decreasing body fat and increasing lean body mass in mice (Park et
al., 1997). CLA is present in higher amounts in meat from ruminants as opposed to non-

22
ruminants, due to modification of linoleic acid by the ruminal microflora (Chin et al., 1992).
Forage-finishing increased CLA content in several studies (Garcia et al., 2008; Leheska et al.,
2008, Alfaia et al., 2009). Alfaia et al. (2009) reported an almost two-fold increase (5.14 vs.
2.65 mg/g) in CLA content in muscle tissue of bulls finished on pasture (forage unknown) when
compared to muscle samples from bulls finished with a concentrate diet.
Earlier studies involving beef cattle on high-forage diets confirmed that diet can have a
significant impact on fatty acid composition in fat depot tissues (Rumsey et al., 1972). The
feeding of a concentrate diet increased the total unsaturated fatty acid content by 20% when
compared to forage diets of alfalfa and timothy hay. Overall fatty acid composition was
significantly altered in continental crossbred steers finished on pasture (ryegrass) when
compared to finishing with a cereal-based concentrate diet (of mostly citrus pulp and ground
maize) (Steen et al., 2003). The content of n-3 fatty acids was significantly greater for the grass-
fed steers and this (coupled with a decrease in n-6 fatty acids) resulted in a lower overall n-3: n-6
ratio. The level of CLA in grass fed beef can be as much as 3 times higher than levels found in
grain-finished beef (measured in Angus steers finished on tall fescue pasture and compared to a
typical corn-finishing diet) (Engle and Spears, 2009).
There are forage species differences in quantitative and qualitative fatty acid composition
(Dewhurst et al., 2008). For example, orchardgrass is relatively low in C18:1 whereas timothy
grass is relatively high in C18:2. Although levels of FA may differ in forage species, the
resulting fatty acid profile of beef finished with different forage species was not significantly
different (Dierking et al., 2010). In evaluating two species of forage (tall fescue, a grass; alfalfa
and red clover, legumes ), there were forage species differences in fatty acid composition but
this did not affect fatty acid concentrations in meat samples obtained from Angus steers finished
23
on either the grass or a combination of the grass with the two legumes. For example, the diets
with the legume species, alfalfa (ALF) or red clover (RC) contained higher amounts of linolenic
acid than the diet of grass only (4.66 mg/g (ALF), 4.33 mg/g (RC), 3.91 mg/g (tall fescue)) but
the concentration of linoleic acid in the longissimus dorsi of the steers was not significantly
different (6.75 mg/g (ALF), 5.91 mg/g (RC), 6.15 mg/g(tall fescue)).
French et al. (2000) demonstrated the effect of method of feeding grass forages (pasture
or conserved as silage) on fatty acid content of grass-fed beef. Continental crossbred steers were
finished on ryegrass fed as silage or on pasture which was compared to cattle fed a
concentrate/hay (ground barley and beet pulp). Cattle fed the forage treatments were also given a
limited amount of concentrate. Increased grass intake (both silage and pasture) decreased the
concentrations of intramuscular SFA and the n-6: n-3 PUFA ratio while increasing the PUFA:
SFA ratio and CLA. Also CLA content was greater in pasture fed steers than those fed the silage
treatment.
Changes in fatty acid profile due to feeding forages have not only been documented in
research settings but also in grass-fed beef from commercial producers (Leheska et al., 2008).
Meat samples from 13 grass-fed beef producers were tested for fatty acid content. The grass-fed
beef was lower in total fat and MUFA and higher in SFA, n-3 fatty acids, CLA, and trans-
vaccenic acid when compared to beef samples from grain-finished steers (obtained from retail
sources or university meat laboratory). The concentrations of PUFA, TFA, n-6 fatty acids, and
cholesterol in forage-finished beef were not significantly different from the control samples
(grain-finished beef).

24
Breed may also have an effect on fatty acid deposition; although, the extent of this effect
is not always evident (Itoh et al., 1999). In a comparison of Angus and Simmental steers,
deposition of C18:3 and some longer chain fatty acids were significantly altered was along with
a significant interaction between the breed and diet. Another study of Simmental and Red Angus
steers found that the total level of n-3 FA in longissimus muscle was significantly greater in
Simmentals than Red Angus (Laborde et al., 2001). Other fatty acids though, such as the n-6 FA
did not differ between breeds.
The changes in fatty acid composition in beef could also lead to changes in flavour
attributes of meat (Melton et al., 1982; Mandell et al., 1998). Ground beef produced from Angus
and Hereford steers fed a grass diet (pasture containing orchardgrass, Kentucky 31 Fescue, and
Ladino clover) was less desirable in flavour when compared to grain-finishing (corn silage). The
desirable, beefy flavour was associated with lower amounts of C14:1, C18:0 and C18:3 and
higher amounts of C18:1 (Melton et al., 1982). Mandell et al. (1998) also found that Limousin
cross steers fed a 95% alfalfa silage diet or 68% high moisture corn/ 25% alfalfa silage ration
produced differences in aromas (a grassy aroma was increased as a result of forage feeding),
which could be associated with the altered fatty acid composition of the two diet treatments.
The alfalfa silage treatments produced longissimus muscle roasts with greater levels of linolenic
acid (18:3) and lower concentrations of oleic acid (18:1) when compared to the high-moisture
corn treatments.

25
3. THE EFFECTS OF METHOD OF FORAGE-FINISHING AND CATTLE BREED ON
GROWTH PERFORMANCE, CARCASS CHARACTERISTICS, MEAT QUALITY,
AND FATTY ACID COMPOSITION
3.1 ABSTRACT
Three methods of forage-finishing (pasture, silage, hay) for beef cattle were used to
evaluate growth performance, carcass traits, meat quality, and fatty acid (FA) composition
relative to a grain-finished product. The study was conducted at 2 research stations with 50
Angus and 50 Hereford steers used at each location, evaluating alfalfa forages at one station and
grass forages at the other station. Regardless of location, growth performance (total gain, average
daily gain, feed conversion) and carcass traits (hot carcass weight, backfat depth) were greater (P
< 0.05) for grain-finished steers. Pasture-finishing using either forage increased gains (P < 0.10)
vs. feeding conserved forages. Gains and feed intake were lower (P < 0.01) for hay- vs. silage-
finished cattle. Generally, carcass traits were similar across method of forage-finishing
regardless of forage fed. Forage-finishing with grasses increased (P < 0.10) lipid stability, while
forage-finishing with alfalfa increased (P < 0.01) lipid peroxidation vs. grain-finishing. Forage-
finishing increased (P < 0.02) concentrations of alpha-linolenic acid and total omega-3 fatty
acids, resulting in lower (P < 0.01) n6:n3 ratios in longissimus (LM) and semitendinosus (ST)
muscles vs. grain-finishing. Pasture-finishing using alfalfa increased (P < 0.01) alpha-linolenic
concentrations in beef vs. finishing with conserved forages. Cis-9, trans-11 CLA content was
greater in forage- vs. grain-finished beef when cattle were forage-finished using grasses. Total
MUFA concentrations were lower (P < 0.01) for forage-finished beef when compared to grain-
finished beef. Concentrations of PUFA were greater (P < 0.01) in forage- vs. grain-finished beef
but only when alfalfa was used for forage-finishing. A trained taste panel found no differences
(P > 0.05) in tenderness or shear force between forage- and grain-finished beef regardless of
26
which forage was used for forage-finishing. Beef flavour intensity was greater (P < 0.05) with
less off flavours in grain- vs. forage-finished beef. Generally, method of forage-finishing and
breed did not affect tenderness, juiciness, and flavour. The study found that method of forage-
finishing generally did not affect palatability attributes of beef relative to a grain-finished
product but did affect fatty acid composition regardless if alfalfa or grass was used for forage-
finishing.
Key Words: Forage-Finished Beef, Growth Performance, Carcass Traits, Meat Quality, Fatty
Acids, Sensory Evaluation
27
3.2. MATERIALS AND METHODS
3.2.1. ANIMAL MANAGEMENT
Two hundred yearling steers (100 Angus, 100 Hereford) were purchased with 50 head per
breed delivered to both the Agriculture and Agri-Food Canada’s Kapuskasing Experimental
Farm (KAP) in Kapuskasing,Ontario and the University of Guelph’s New Liskeard Agricultural
Research Station (NLARS) in New Liskeard, Ontario in the summer of 2010. Approximately 12
or 13 steers from each breed were allocated to one of 4 management regimens (resulting in
approximately 24 to 25 steers per management regimen subclass). The 4 management regimens
were based on finishing the steers after a constant time on feeds based on forages or grain and
included: 1) pasture, 2) hay, 3) forage silage, and 4) conventional high grain (corn) diet (87%
concentrate). At NLARS, alfalfa forages were produced for the forage-finishing regimens as
well as alfalfa/grass hay used for mixing with the corn ration. Alfalfa was cut in the summer of
2009 for the production of conserved forages (hay, silage). At Kapuskasing, grass forages
composed of reed canary grass at ~ 40%, native grasses (i.e. Canada bluegrass) at ~ 30%, and
weeds (including quackgrass at ~ 30%) were used in the trial with conserved forages (hay,
silage) harvested in the summer of 2009. For both locations, conserved forages were harvested
in the previous year from fields that were similar to the fields used for pasture grazing and all
conserved forages were harvested from first cut forages. The 87% concentrate diet was based on
whole shelled corn, alfalfa hay, and a commercial 32% crude protein supplement. The hay was
sourced at NLARS with bales transported to KAP as needed. Hays at both locations were
produced as round bale hay. With the exception of the pasture-finished cattle, all other cattle
were housed in pens at each location. A subgroup (56 steers at NLARS split into 4 steers/pen,
and 36steers at KAP split into 6 steers/pen) was allocated to pens equipped with Calan gates to
enable determination of feed intake for individual animals, or to pens where cattle were group

28
fed with only pen feed intake data being available. All steers were implanted with Synovex-S
(200 mg Progesterone, 20 mg Estradiol benzoate) (Pfizer Canada Inc.).
The steers all began the finishing diets during the first week of June, 2010 with cattle
weighed on 2 consecutive days. The cattle were weighed every 28 days. Average daily gain
(based on in and out weights) was determined for all cattle in the trial while feed intake and feed
to gain data were determined for all cattle housed in pens equipped with Calan gates.
3.2.2. CATTLE SLAUGHTER AND CARCASS PROCESSING
Cattle were marketed at common times on feed such that approximately equal numbers of
cattle per management regimen/breed subclass were shipped on a given slaughter date for
processing at the Cargill Meats Solution plant in Guelph, ON. There were 3 slaughter dates in
2010 with cattle weighed the day before slaughter on September 15, 22 and 29. Cattle were
shipped on the basis of body weight, first marketing equal numbers of heavier cattle from each
management regimen/breed subclass. Due to light initial weights at start of the trial, death
losses due to bloat at NLARS, and poor performance for forage-finished cattle, some cattle were
not shipped for slaughter on the slaughter dates (September 16, 23, 30). This included 13 steers
at NLARS and 29 steers at KAP including all (24) cattle fed grass hay; low nutrient quality hay
was produced due to poor environmental conditions, resulting in inadequate cattle performance.
Five steers from KAP were not sent to slaughter due to poor performance which resulted in
extremely light bodyweights at the end of the trial; this included 1 from the Corn MR, 2 from the
pasture MR, and 2 from the silage MR. Out of the 13 steers not slaughtered from NLARS, 4
died as a result from bloat (pasture-fed animals), 2 died from other causes (alfalfa silage-fed
cattle), and the rest were not shipped for slaughter due to poor performance which resulted in
extremely light bodyweights at the end of the trial (1 from Corn finishing, 4 from the hay MR,

29
and 2 from the silage MR). Therefore, a total of 156 steers were shipped to the slaughter facility
across the 3 slaughter dates in order to be part of this trial. Cattle were handled and slaughtered
at the Cargill Meats Solution facility in Guelph, ON according to industry procedures, including
stunning with captive bolt prior to exsanguination. The order of kill was recorded at the plant to
enable identification of individual carcasses with the hip and rib on the right side of each carcass
tagged before entering the cooler to facilitate collection of meat cuts during carcass fabrication.
At approximately 84 h postmortem (PM), carcass sides were ribbed between the 12th and
13th ribs, and then graded by Canadian Beef Grading Agency (CBGA) graders according to
Livestock and Poultry Carcass Grading Regulations (Canadian Food Inspection Agency, 1992)
to determine carcass grade and yield characteristics. Hot carcass weight was determined while
camera data were collected on the split interface between the 12th
and 13th
ribs; the camera data
included mm subcutaneous backfat in the last quadrant over the longissimus, longissimus muscle
area, and lean yield. A primal rib section (3 x 4 with chine bone on) consisting of all lean,
muscle, and fat from ribs 6 to 12 from the forequarter and a semitendinosus (ST) muscle from the
hindquarter were removed from the right side of each carcass, packaged and shipped to the
University of Guelph Meat Laboratory for analysis. At five days PM, ST muscles were trimmed
of excess fat and connective tissue, cut into five 2.5 cm-thick steaks, individually labeled, and
vacuum-sealed. ST steaks were allocated as follows for meat quality evaluation:
Steak 1: Colour, pH, and Intramuscular fat determination.
Steak 2: Shear force analysis after 7 days of ageing.
Steak 3: Shear force analysis after 14 days of ageing.
Steak 4: Shear force analysis after 21 days of ageing.
Steak 5: Aged for 14 days as part of a shelf life study.
30
Rib sections were weighed, and cut into eight, 3.175 cm longissimus thoracis (LM) steaks
which were then allocated for analysis of specific meat quality attributes. The first 6 steaks were
dissected into lean, fat and bone components with each component weighed and data recorded
along with partitioning fat into subcutaneous, intermuscular, and body cavity fat depots (Lunt et
al., 1985). All steaks (with the exception of the first) were then tagged and vacuum-sealed. LM
steaks were allocated as follows for meat quality evaluation:
Steak 1: Colour, pH, intramuscular fat determination along with fatty acid analysis.
Steaks 2 and 3: Taste panel evaluation.
Steak 4: Shear force analysis after 7 days of ageing.
Steak 5: Shear force analysis after 14 days of ageing.
Steak 6: Shear force analysis after 21 days of ageing.
Steak 7: Aged for 14 days as part of a shelf life study.
Steaks allocated for five-day colour and pH evaluation were cut and placed on butcher paper,
allowing the fresh-cut surface to bloom with exposure to oxygen in the air for at least 30 minutes
to enhance colour development. With the exception of five-day aged steaks, all other meat
samples were packaged and vacuum sealed, and then aged for 7, 14, or 21 days in a cooler at
4ºC, but above freezing. Post-ageing, the steaks were frozen at -22°C for storage until analysis.
3.2.3. MEAT QUALITY EVALUATION
Temperature and pH measurements were conducted on five-day aged steaks using a
Hanna spear-tipped pH electrode (Hanna Instruments, Mississauga, ON) and thermocouple
connected to an Accumet A71 pH meter (Fisher Scientific, Toronto, ON). The pH meter was
31
allowed to equilibrate to the room temperature of the processing room and then calibrated with
buffer solutions of pH 4 and 7 prior to measurements. The spear-tipped pH electrode was
inserted into the designated muscle at three different locations with pH and temperature
recorded. After colour, temperature and pH measurements were completed, steaks were
vacuum-sealed and frozen for subsequent determination of intramuscular fat content and fatty
acid composition as described later.
An objective determination of lean colour was measured using a handheld Konica
Minolta Chroma Meter (Model CR-400; Konica Minolta Sensing Inc., Ramsey, NJ) with
illuminant D65 and 0° viewing angle. Measurements were obtained from six different locations
on each LM and ST steak designated for colour evaluation. The colorimeter was standardized
using a white ceramic tile with the specifications of Y = 92.7, x = 0.3134, and y = 0.3196.
Colour data were obtained in accordance to the Commission International de l’Eclairage (CIE,
1976) L* a* b* scale with: L*, a measure of luminosity, with a higher value indicating a lighter
colour, a*, a measure of the range from red to green, and b*, a measure of the range from yellow
to blue. For a* and b* measurements, higher positive values indicate increasing red or yellow
colour respectively, while lower values indicate respectively a more green or blue colour. Using
CIE L*a*b* measurements, chroma and hue angle were calculated. Chroma, the intensity or
saturation of the sample colour was calculated by the equation, square root ((a*2) + (b*
2)). Hue
angle, a measure of distance shown in degrees from the true red axis of the CIE colour space was
calculated using the equation, tan-1
(b*/a*); this attribute describes the general type of colour
based on the wavelength of light radiation.
Steaks designated for shear force analysis were removed from the -22°C freezer, and
thawed for 48 hours at 4°C prior to cooking. After thawing, steaks were trimmed of external
32
fat and connective tissue and weighed prior to cooking. Steaks were cooked to an internal
temperature of 70°C using a Garland Grill (ED-30B; Garland Commercial Ranges Ltd.,
Mississauga, ON). Steaks were flipped once internal temperature reached 40°C, and removed
from the grill when internal temperature reached 70°C. Initial temperature measurements and
internal temperature were monitored throughout the cooking process using a Type K flexible
high-temperature thermocouple, inserted into the geometric centre of each steak during cooking.
Endpoint temperature and final weight (in grams) for each sample were recorded immediately
following removal of the steaks from the grill after they had reached the designated temperature
endpoint. In order to immediately stop the cooking process, steaks were placed into individual
polyethylene bags, weighed, sealed, and immersed in an ice-water bath after weighing. Sealed
samples were then transferred and cooled overnight in a 4°C cooler for shear force
measurements the following day. Cooking losses were calculated using the initial raw and final
cooked weights of each sample, using the equation (Percent Cook Loss = [(Raw weight –
Cooked weight)/ Raw weight] *100).
Steaks were removed from the cooler and allowed to equilibrate to room temperature
following overnight storage. Using a drill press mounted corer (Mastercraft 10 inch drill press)
with a core diameter of 1.3 cm, a minimum of six cores was removed, cut parallel to steak
muscle fibres. A TA-XT Plus Texture Analyzer (Texture Technologies Corp., Scarsdale, NY)
with an attached Warner-Bratzler blade was used to shear cores perpendicularly to muscle fibres,
with a blade speed of 3.3 mm s-1
. Using a custom pre-programmed macro in Sun Microsystems
Texture Exponent program software for Windows XP, each core produced a peak shear force
value. Shear force values were determined for all six cores per sample, and then averaged to
determine the individual steak peak shear force value in kg. Using the equation ((Numerically
33
lowest shear force value – Mean Shear force value)/ 2x Standard deviation), outliers were
removed from the data set. The equation was used to remove values that could cause biased
results when shearing through intramuscular fat or connective tissue.
Shelf life was determined on 14 d aged LT and ST steaks, pre-weighed onto 17S
Styrofoam® trays with soaker pads (Shortreed, Guelph, ON), overwrapped with oxygen
permeable commercial polyvinyl chloride (PVC) film and stored for 4 days at 4°C to
determine drip loss. Shelf life steaks were processed for pH, temperature and objective colour (as
previously described), vacuum packaged and frozen at -22°C until further analysis. To determine
the extent of lipid oxidation, a thiobarbituric acid reactive substances (TBARS) assay was
conducted. Steaks were removed from the freezer and placed in the 4°C cooler to thaw.
TBARS (malondialdehyde [MDA] content) analysis on shelf-life steaks was determined
according to Botsoglou et al. (1994). Approximately 8 grams of meat were obtained through the
coring of each steak at random locations throughout the steak. This sample was placed in a 50
mL centrifuge tube to which 10 mL of 5% (wt/vol) trichloroacetic acid were added. Samples
were then homogenized for 30 seconds and placed in a high speed centrifuge to be spun for 15
minutes at 3700 x g. The resultant liquid was filtered through Whatman #1 filter paper and
placed into a cooler overnight. On the following morning, 2 mL of the sample liquid were
pipetted into a screw cap tube and 1.0 mL of 0.2% (wt/vol) thiobarbituric acid (TBA) were added
to the tube before being sealed and vortexed. Sample tubes were then placed in a hot water bath
(at 85°C) for 30 minutes before being cooled in a cold tap water bath. The absorbance of the
resultant liquid was then read at 532 nm using a Shimadzu UV-VIS spectrophotometer
(Shimadzu Corporation, Kyoto Japan). Standard solutions of malondialdehyde (MDA) were
prepared, and its absorbance was also read to produce a standard curve which would be used to

34
determine MDA/g present in the samples obtained from each steak. Absorbance was plotted
against standard concentrations of MDA (ng MDA) with values expressed as ng MDA/g of meat
sample.
3.2.4. FEED ANALYSIS
Feed samples were collected bi-weekly. After dry matter (DM) determination, feed
samples were ground using a Wiley Mill (Wiley Mill, Arthur H. Thomas, Philadelphia, PA),
using a 1 mm screen. Ground samples were then composited by month and submitted to Agri-
Food Laboratories (Unit #1, 503 Imperial Road North, Guelph, ON, Canada) for analysis of total
digestible nutrients (TDN), crude protein (CP), neutral detergent fibre (NDF), acid detergent
fibre (ADF), and major minerals.
3.2.5. DETERMINATION OF INTRAMUSCULAR FAT CONTENT AND FATTY ACID
COMPOSITION
Seven day aged longissimus and semitendinosus steaks were removed from the freezer
and thawed at 4°C for 24 hours. In preparation for freeze-drying, steaks were trimmed of
excess fat, cut into small cubes, and placed in numbered aluminum tins. Freeze-dried samples
were ground to a powder in a small commercial coffee grinder and then mixed; 1.5 to 2 grams
were then weighed into individually marked Ankom Xt4-bags and heat-sealed. Intramuscular fat
content was determined by ether extraction using the Ankom XT20 Fat Analyzer (AOAC, 2004).
The percentage of chemical fat was determined by the following formula: % chemical fat =
((Initial weight - Post extraction weight)/ Initial weight)* 100.
Freeze dried feed and muscle samples were extracted for fatty acid determination using
methods described by O’Fallon et al. (2007) and Nelson et al. (2008). Freeze dried muscle
samples were added to 16 x 125 mm screw cap PYREX culture tubes in which 1 ml internal
35
standard C 13:0, 0.7 ml of 10 N KOH and 5.3 ml of methanol were added. Tubes were capped,
vortexed and incubated at 55oC for 1.5 h. Tubes were cooled below room temperature using
cold tap water. Then 0.58 ml 24 N H2SO4 was added to the tubes before vortexing and
placement into a 55oC water bath for 1.5 h. Tubes were cooled using cold tap water and
afterwards, 3.0 ml of hexane were added prior to hand mixing and vortexing. Tubes were
centrifuged for 5 min with the hexane layer transferred to a gas chromatograph vial that was
stored at -20oC until analysis with a gas chromatograph.
Fatty acid methyl esters were determined using a Shimadzu 2014 gas chromatograph
equipped with a Shimadzu AOC-20 auto sampler and a 120 m x 0.25 mm x 0.25 um BPX-70
capillary column (Mandel Scientific, Guelph, ON.). Helium was used as the carrier gas with a
20:1 split ratio. Injector temperature was 250oC while flame ionization detector (FID)
temperature was 280oC. Initial oven temperature was 150
oC which was held for 1 min, then
increased to 180oC at a rate of 10
oC/min, from 180
oC to 200
oC at 2
oC/min and from 200
oC to
240oC at 1
oC/min and held for 2 min. Fatty acid methyl esters of samples were identified by
comparison of retention times to that of GC reference standards (Nu-Check-Prep, Elysian,MN).
Chromatograms were integrated using Shimadzu GC solutions software.
36
3.2.6. SENSORY EVALUATION OF LONGISSIMUS MUSCLE
A 2-day screening process was conducted to determine suitable candidates for taste panel
training. Suitable individuals required the ability to discern a wide variety of tastes, be regular
beef consumers, and be available for the entire run of the taste panel (4 days a week, for 5
weeks). Several tests were conducted to measure the individual's ability to identify several
common smells (vanilla, mint, lemon, etc.) as well as basic tastes (sweet, sour, bitter, salty).
Twelve individuals were chosen and trained over the course of 2 weeks based on procedures
outlined by AMSA (1995). Eight steaks were randomly chosen for each respective Location by
Management Regimen by Breed combination. Taste panel evaluations were conducted
approximately 4 d per wk over a 5 wk period.
Taste panel procedures followed those described by Streiter et al. (2012). An eight
member trained taste panel was used to evaluate palatability attributes. Sensory attributes were
evaluated using a 10 cm unstructured line scale with verbal intensity descriptors as anchors based
on quantitative descriptive analysis (Stone and Sidel, 2003). Sensory attributes were evaluated
using a scale from 0 to 10 with 0 always representing the left anchor while 10 represented the right
anchor. Sensory attribute definitions and scale values include the following:
1. Softness - the force required to compress the sample between the molar teeth (0 being very
firm and 10 being very soft);
2. Tenderness - the force required to chew measured after three chews excluding the first bite
as a chew (0 being very tough and 10 being very tender);
3. Initial Juiciness - amount of moisture released by the sample after five chews (0 being very
little and 10 being very much);
37
4. Beef Flavour Intensity - the amount of full meaty flavour present after eight chews (0
being very weak and 10 being very intense);
5. Off flavor Intensity - the amount of atypical beef flavour assessed at time of swallowing
(0 being none and 10 being very strong);
6. Chewiness - the energy (force plus time) required to chew the sample as it is prepared for
swallowing (at nine chews) (0 being very chewy and 10 being not chewy);
7. Overall Juiciness - the overall impression of moistness perceived in the mouth after ten
chews (0 being very little and 10 being very much);
8. Flavour desirability (0 being extremely undesirable flavour and 10 being extremely
desirable flavour)
9. Overall acceptability (0 being extremely unacceptable and 10 being extremely acceptable)
The panelists evaluated steaks from the trial, as well as steaks from steers that were-
finished on traditional grain-finishing diets to serve as a control. Two steaks (LM2 and LM3)
from each steer were used in the taste panel. Steaks were removed from the freezer and thawed
for 48 h in a 4°C cooler prior to cooking. Once thawed, steaks were trimmed of external fat
and connective tissue and then weighed. Steaks were cooked on a grooved double sided grill
(Silesia CG2-C Double Grooved High Speed Contact Grill) (Silesia Grill Machines, Oakville,
ON). This non-stick cooking apparatus differed from the Garland grill used for shear force
analysis in order to prevent flavour contamination due to use of cooking oil with the Garland
grill. Steaks were trimmed of excess fat and weighed before being cooking. Initial steak
temperature was recorded by placing a Type K thermocouple into the geometric center of the
38
steak. Internal temperature was monitored throughout the cooking process and steaks were
turned once an internal temperature of 40°C was reached. All steaks were cooked to an internal
end point temperature of approximately 70°C at which time final temperatures of each steak
were recorded. Steaks were removed from the grill, weighed, placed into aluminum pans with a
lid and held in a warming oven (Isotemp Compact Incubator, Fisher Scientific, Toronto, ON) at
30°C prior to coring. Steak samples were partitioned into smaller (1cm x 1 cm x ~2.5cm)
samples and were labeled with three digit random numbers. Each panelist received two cores per
sample, six samples per sitting. Assessment of palatability attributes was conducted within 1 h
post-cooking of steaks in a sensory booth equipped with red lighting to mask differences in
appearance among samples. Water and unsalted crackers were supplied during both the training
and testing sessions to clear the palate between samples. Six samples were prepared each day for
the panelists to evaluate. Panelists were given the following directions:
Please do not eat food or drink or chew gum at least 30 minutes before the taste panel
Please cleanse palette with crackers and water before the start of sampling and between
each individual sample
Please remember to bite down parallel on the cube, not onto the cooked surface
The first cube is to be used to evaluate: softness, tenderness, initial juiciness, beef flavour
intensity, and grassy flavour intensity
The second cube is to be used to evaluate: overall juiciness, flavour desirability, and
overall acceptability

39
Traits were ranked on a 10 cm long line scale where panelists were asked to mark with a
line where that sample would rank.
3.2.7. STATISTICAL ANALYSIS
Data were analyzed as a randomized complete block design using the Mixed procedure of
SAS (SAS Institute, Inc., 2008). Statistical analysis of NLARS and KAP data were conducted
separately. The statistical model for variables relating to growth performance, carcass
characteristics, meat quality traits, fatty acid composition, and taste panel values included
management regimen (pasture, silage, hay and grain), breed (Angus versus Hereford) and the 2
way interaction, as well as the random effect of pen within management regimen and location.
The sensory evaluation model also included animal and panelist as random effects. To include
pasture in the model a pen number was allocated to these management regimens. Weight at the
start of the trial was used as a covariate for growth performance while backfat depth was used as
a covariate for carcass traits; covariates remained in the final model when significant at P < 0.10.
For statistical analysis of carcass grade data, data were first transformed into numerical data for
statistical analysis (Prime = 4, AAA = 3, AA = 2, A = 1, and a 0 was given for any grade below
A). Orthogonal contrasts were used for means separation of management regimen. Differences
among management regimen means were determined by the following contrasts: 1) the
comparison between corn-fed cattle versus cattle-finished on forages (pasture, hay, and silage),
2) the comparison between pasture-finished cattle and cattle finished on conserved forages (hay
and silage) and 3) the comparison of hay-finished cattle versus silage-finished cattle.
40
The effect of postmortem aging (7, 14, 21 days) on shear force was determined by
including management regimen, breed, postmortem ageing day and the 2 and 3 way interactions
in the model. Contrasts were used to examine postmortem ageing effects and included: 1) the
comparison of 7 day aged beef versus the average of 14 and 21 day aged beef and 2) the
comparison of 14 versus 21 day aged beef.

41
3.3. RESULTS AND DISCUSSION – FORAGE-FINISHING USING ALFALFA
3.3.1. ANALYSIS OF DIETS FOR CATTLE MANAGED AT NLARS (FORAGE-
FINISHING USING ALFALFA)
The nutritional composition of the diets (dry matter basis) used for the different MR at
New Liskeard were found to be quite varied (Table 1). The high grain TMR diet (87% corn)
contained much greater amounts of energy than the forage diets that were fed. The alfalfa forage
diets had a higher fibre (both NDF and ADF) content and were also higher in protein and
calcium content than the 87% corn diet. Alfalfa pasture contained greater concentrations of
energy and protein than the two conserved alfalfa diets. The alfalfa hay contained lower
amounts of protein than alfalfa stored as silage or from pasture. Broderick (1985) measured a
lower protein content for alfalfa conserved as hay when compared to alfalfa conserved as silage
and attributed this to a loss of leaves during the baling process. Fibre content, calcium,
phosphorus, and total digestible nutrient values were similar within the forages utilized in the
Broderick study.
The fatty acid (FA) composition of the diets fed in the study are presented in Table 3.
The primary fatty acids for the Corn (TMR) diet were C18:2, C18:1o, and C16:0, whereas the
primary fatty acids for the forages were C18:3a, C16:0, and C18:2. The fatty acid profiles for
each diet indicate that the Corn diet was much higher in oleic acid (C18:1o) and linoleic acid
(C18:2), whereas the forage diets were much higher in the saturated fatty acids (C14:0, C16:0,
C17:0, and C18:0) and the linolenic acids (C18:3a, C18:3g, C20:3). Fatty acid profiles are
relatively similar across the methods of forage-finishing using alfalfa. Harfoot (1978) concluded
that C18:3a is often the primary FA for fresh forages. Alfalfa silage contained a lower C18:3a
content than fresh alfalfa pasture (Whiting et al., 2004); however the forages from NLARS
appear to have similar alpha-linolenic acid contents.

42
3.3.2. GROWTH PERFORMANCE FOR CATTLE MANAGED AT NLARS (FORAGE-
FINISHING USING ALFALFA)
Growth performance data for cattle managed at NLARS are presented in Table 4. There
were no differences (P = 0.842) in initial body weight across management regimens (MR) based
on the procedure used to allocate cattle. Management regimen differences (P < 0.03) existed for
most growth performance traits except for time on feed, which was similar (P > 0.34) across MR
(as expected with a time constant endpoint). Growth performance results were as expected when
comparing the high grain management regimen, based on corn (Corn), with forage-finishing
regimens (Contrast 1) for cattle fed alfalfa pasture, hay, or silage, considering that the Corn diet
contained much higher amounts of energy (net energy [NE], TDN) than the forage diets (Table
1). The steers fed Corn achieved greater (P ≤ 0.0011; Contrast 1) final body weights, total gains,
average daily gains, daily dry matter intakes (DMI) (kg/d and %BW) with lower (more efficient)
(P < 0.0001; Contrast 1) feed:gain than forage-finished cattle. However, there was no difference
(P > 0.11; Contrast 1) in DMI between Corn-fed and forage-finished cattle when intake data
were adjusted as a percentage of BW. Oltjen et al. (1971) reported similar results when feeding
a pelleted alfalfa hay diet that produced a lower average daily gain (1.06 kg vs. 1.2 kg) and a
greater (10.59 kg vs. 7.26 kg) feed to gain ratio than cattle fed a 90.6% cracked corn diet.
Stantan and Schutz (2000) found that DMI was reduced when cattle were switched to an all hay
diet from a high grain diet, so it is expected that Corn-fed cattle in the present study would have
a greater DMI than forage-finished (specifically hay) cattle. Mandell et al. (1998) reported a
decrease in ADG associated with feeding a 95% alfalfa silage ration when compared to finishing
cattle fed a 68% high moisture corn/25% alfalfa silage ration. Slower growth of steers on
pasture was also reported by Purchas and Davies (1974) in Friesian steers as compared to steers

43
fed a high grain diet (composition of either diet was not stated) with steers growing 31% slower
on pasture and taking 69 days longer to reach similar weights as grain-fed steers. Blanco et al.
(2010) reported that bulls finished with lucerne (alfalfa) pasture had lower ADG (1.33 vs. 1.52
kg/d) and required longer time to finish time (350 vs. 335 days of age at slaughter) than bulls
finished on a high concentrate diet.
Pasture-finished cattle tended (P ≤ 0.085; Contrast 2) to be heavier at slaughter and
gained more weight than cattle fed conserved forages. Intake and feed:gain measurements could
not be compared because these data were not collected for pasture cattle due to the nature of the
experimental design. The increased growth of pasture fed steers could be due to the slightly
higher net energy content coupled with higher protein content of alfalfa pasture when compared
to conserved forages (Table 1); this is especially true for alfalfa hay which contained the lowest
amounts of net energy and protein. There is a lack of data in the literature that directly
compares cattle finished on alfalfa pasture vs. cattle finished on conserved alfalfa. However,
Steen and Kilpatrick (2003) evaluated growth parameters for forage-finishing cattle and found
that pasture finishing produced greater gains than feeding conserved forages.
For steers fed conserved forages, alfalfa silage-fed cattle achieved greater (P ≤ 0.02;
Contrast 3) final body weights, total gains, average daily gains, total dry matter intakes (DMI)
and daily DMI with lower (more efficient) (P = 0.0001; Contrast 2) feed:gain than alfalfa hay-fed
cattle. This is most likely a result of MR differences in nutritional composition as alfalfa silage
was greater in net energy and protein than alfalfa hay (Table 1). Dinius (1978) concluded from a
review of the literature that investigated cattle fed hay or silage, that the gains of steers fed hay
is greater than those fed silage due to a much greater intake of hay by cattle when compared to
feeding silage. In a comparison of cattle fed alfalfa silage or alfalfa hay, Helene et al. (1985)

44
found intakes to be greater for steers fed alfalfa silage when compared to cattle fed hay (104.6
g/kg0.75
vs. 99.3 g/kg0.75
). Thomas et al. (1959) compared alfalfa conserved as either hay or
silage when fed to young dairy heifers; hay-fed heifers performed better than heifers fed silage
(faster gains, heavier final body weights).
Hereford steers were lighter (P = 0.008) in BW at the start of the trial than Angus (Table
5). This is most likely a result of sourcing the steers from different producers. Final body
weights, gains (total, ADG), and feed:gain were similar (P > 0.51) across breeds. In a direct
comparison of Angus and Hereford, the two breeds achieved similar body weights with identical
management practices and time on feed (Glimp et al., 1971; Bartoň et al., 2006). Time on feed
differed (P = 0.002) between breeds due to death losses from bloat for Herefords prior to the last
slaughter date in the trial. Angus consumed more (P < 0.01) DM (kg/d or %BW bases) than
Herefords, possibly due to the lighter starting weight of Herefords. However, Chewning et al.
(1990) compared mean feed intake values across breeds and reported the trend for Angus to
consume greater amounts of feed than Herefords (9.82 kg/ day vs. 9.27 kg/ day), suggesting a
possible genetic component for differences in intake and efficiency. Breed differences for DMI
were also reported by Wagner et al. (1986) comparing Angus, Hereford, and Simmental
crossbred steers. Similarly, in that experiment, the purebred Hereford steers consumed less DM
(2.3 % of BW/day) than Angus cross steers (2.5 % of BW/day). There were no MR by breed
interaction (P > 0.12) for any growth performance trait in the present study (Appendix Table 1).
45
3.3.3 CARCASS TRAITS FOR CATTLE MANAGED AT NLARS (FORAGE-
FINISHING USING ALFALFA)
Carcass traits for steers forage-finished on alfalfa at NLARS are presented in Table 6.
Hot carcass weight was affected (P < 0.001) by MR with corn finishing producing heavier (P <
0.0001; Contrast 1) carcasses versus forage-finishing. This is due to the greater gains and
heavier final body weights for steers-finished on Corn, most likely as a result of the greater
dietary energy content of the grain diet when compared to forage-finishing. Similar results were
found when comparing Limousin–cross steers fed a high grain vs. steers fed primarily alfalfa
silage diet with all cattle slaughtered after the same time on feed (Mandell et al., 1998). In that
study, steers-finished on a diet of 68% high moisture corn yielded hot carcass weights averaging
272.9 kg as compared to steers-finished on 95% alfalfa silage where hot carcass weights
averaged 228.3 kg after similar times on feed. Pasture finishing tended (P = 0.085; Contrast 2) to
produce a heavier carcass than cattle fed conserved forages while there were no differences (P >
0.20; Contrast 3) in carcass weight between cattle fed hay or silage. Blanco et al. (2010)-
finished young bulls on either lucerne (alfalfa) pasture or on a concentrate diet. Hot carcass
weight and dressing percentage were similar when slaughtered at similar ages. Alfalfa pasture,
therefore, was an effective method to produce similar carcass weight as grain-finishing.
Backfat measures were greater (P < 0.0001, Contrast 1) for Corn-fed steers when
compared to forage-finished cattle likely as a result of the greater energy content of their diet.
Backfat values were similar (P > 0.40, Contrasts 2 and 3) across method of forage-finishing.
Mandell et al. (1998) also found backfat measurements to be greater in corn-finished steers (5.5
mm backfat) vs. alfalfa silage-finished steers (4.0 mm backfat). Berry et al. (1988) also
measured a decrease in fat thickness when Angus steers were fed alfalfa silage when compared
to steers fed corn concentrate or corn silage.
46
Management regimen did not affect (P > 0.24) longissimus muscle area (LMA)
regardless if examined on an unadjusted basis (cm2) or adjusted per 100 kg hot carcass weight.
There is a trend (P = 0.098, Contrast 1) for LMA (cm2) to be greater in cattle fed Corn vs. LMA
for forage-finished cattle. Mandell et al. (1998) found LMA to be substantially greater for Corn-
finished steers (81.6 cm2) versus steers-finished on alfalfa silage (70.8 cm
2). Blanco et al. (2010)
however, found LMA to be similar between bulls that were-finished on either alfalfa pasture or
concentrates. These results could be due to higher quality alfalfa in the Blanco et al. (2010)
study that yielded growth rates closer to those obtained with finishing on concentrates. The
protein content of the alfalfa pasture was 22.3% in the Blanco et al. (2010) study as compared to
18.6% in the present study (Table 1).
Two measures of lean yield were provided by the packing plant including CBGA Lean
Yield and USDA yield grade values. CBGA Lean Yield is determined by the CBGA grader and
takes into account the muscle score and grade fat while USDA yield grade is determined from
the camera data and is based on the measure of cutability (percentage of closely trimmed,
boneless round, rib, loin, and chuck). CBGA Lean yield % was lower (P = 0.005; Contrast 1) in
Corn-finished versus forage-finished carcasses, indicating a greater fat content with grain-
finished carcasses. There were no differences (P > 0.64; Contrasts 2 and 3) in lean yield across
methods of forage-finishing. USDA yield grade values, however, were similar (P = 0.940)
across MR. Carcass composition was also determined by dissection of ribs 6 through 12 into
lean, fat, and bone components. Lean content was lowest (P < 0.0001; Contrast 1) for Corn-
versus forage-finishing. Method of forage-finishing affected lean content with lower (P< 0.01;
Contrast 2) values for pasture-finished cattle versus cattle fed conserved forages while hay-fed
cattle tended (P < 0.06; Contrast 3) to have greater amounts of lean than silage-fed cattle.
47
Management regimen differences (P < 0.04; Contrasts 1, 2, 3) in fat content were the converse of
MR differences in lean content. Percentage of bone content in the rib was greater (P < 0.0001;
Contrast 1) for Corn vs. forage-finished steers with no differences (P > 0.17; Contrasts 2,3) in
bone content amongst methods of forage-finishing. Mandell et al. (1998) compared the carcass
composition of Limousin-cross steers fed a high moisture corn diet or an alfalfa silage diet. Lean
and bone yields were lower for steers finished with corn vs. alfalfa silage (61.4 vs. 63.5% for
lean yield; 18.7 vs. 21.7% for bone yield), while fat yields were greater for corn vs. alfalfa-
finished cattle (19.4 vs. 14.6%). Bond et al. (1972) also examined hay (mostly alfalfa) vs. grain-
finishing effects on carcass composition and found that hay-fed steers produced carcasses
containing 57.5% lean tissue as compared to 55.1% lean tissue for carcasses from cattle fed the
high corn (60%) finishing diet. Tatum et al. (1988) also found a lower percentage of fat in
carcasses of steers finished with alfalfa hay when compared to steers finished with high grain
corn diets (17.3 vs. 24.6%).
Carcasses were assessed to have trace amounts of marbling (300 to 399), with marbling
scores not affected (P > 0.60) by MR, although numerically greater for Corn-finished steers.
Quality grade was similar across MR (P = 0.19) with Canada “A” grade, although quality grade
was greater (P = 0.044; Contrast 1) in Corn- versus forage-finished carcasses. There were no
differences (P > 0.56; Contrasts 2, 3) in quality grade across methods of forage-finishing.
Mandell et al. (1998) reported higher marbling scores for Corn-fed steers versus steers fed alfalfa
silage (3.27 vs. 2.55 on a 10 point scale with 10 indicating abundant marbling). McCaughey et
al. (1996) indicated that grain-fed steers achieved higher carcass grades versus pasture-finished
steers. All grain-fed steers in the McCaughey et al. (1996) study achieved quality grades of A or
greater versus only 69% of pasture-finished steers achieving an A or higher when slaughtered
48
directly off of a primarily alfalfa pasture. Carcasses from grass-fed steers were assessed to have
lower quality grades than carcasses from corn-finished cattle (Hedrick et al., 1983).
Intramuscular fat (IMF) content was greater (P ≤ 0.009; Contrast 1) in Corn- versus
forage-finished carcasses for both longissimus (LM) and semitendinosus (ST) muscles. There
were no differences (P ≥ 0.29; Contrasts 2, 3) in IMF content for LM across methods of forage-
finishing. There was a trend (P > 0.09; Contrast 2) for IMF content for ST to be greater in
pasture-finished carcasses vs. carcasses from cattle finished on conserved forages. Mandell et al.
(1998) also found IMF content in LM to be greater for Corn-fed cattle vs. cattle finished using
alfalfa silage with respective IMF values of 2.61 and 1.68%. Blanco et al. (2010) also reported
lower IMF content in LM for cattle finished on alfalfa pasture (0.98 % IMF) as compared to
1.84% IMF for LM from cattle fed a concentrate finishing diet.
Although marbling scores were similar across MR (P > 0.60), quality and IMF content
were both greater for Corn-finished carcasses when compared to the forage-finished carcasses.
This could be due to variability with marbling score within MR (large standard error) for camera
grading, thereby causing the small difference (6% difference between the Corn- and forage-
finished carcasses) to be non-significant. The IMF content, on the other hand, had larger
differences (37% difference between Corn and forage-finished carcasses, which were statistically
significant) which may be attributed to the accuracy of chemical fat analysis.
Colour values were similar (P > 0.19) amongst MR although there was a trend (P = 0.06;
Contrast 3) for the colour score to be greater for silage- vs. hay-fed cattle. In viewing the
literature, it is common for forage-finished beef to appear darker (Bidner et al., 1981; Forrest,
49
1982; Crouse et al., 1984; Bidner et al., 1986) than grain-finished beef. Colour differences will
be further discussed in a following section.
Breed differences (P ≤ 0.011) were found with hot carcass weight, LMA, and marbling
with greater values for Angus versus Hereford steers (Table 7). Angus steers produced heavier
carcasses in the past when directly compared to Herefords (Glimp et al., 1971). The only
difference in carcass composition based on rib dissection was a trend (P < 0.06) for greater
percentage of bone in Hereford vs. Angus. In a direct comparison of Angus and Hereford
carcasses, Glimp et al. (1971) concluded that the percentage of carcass bone was greater for
Hereford (14%) than Angus (13.5%). Fat and lean content of the carcasses of these two breeds
has also been shown to be similar when compared (Priyanto et al., 1993). The greater marbling
for Angus steers is supported by the trend (P < 0.09) for greater concentrations of IMF in LM
for Angus versus Herefords and is most likely responsible for the trend (P = 0.09) for higher
quality grade for Angus vs. Hereford cattle. Marshall et al. (1994) similarly found that Angus
achieve higher marbling scores than Hereford, although hot carcass weights and LMA were
similar. Long and Gregory (1975) found that cattle produced from Angus sires produced heavier
carcasses with greater dressing percentage than carcasses from cattle sired by Hereford although
marbling scores and final grade were similar. Gregory (1994) measured differences in marbling
score and IMF content between Angus and Herefords, with Angus achieving a greater marbling
score (5.40 vs. 5.24) and slightly greater IMF content (4.80% vs. 4.53%). Glimp et al. (1971)
also reported greater marbling score for Angus vs. Herefords (5.08 vs. 3.22) as well as a better
USDA carcass grade (9.03 vs. 7.50). These differences in carcass traits could be due to unique
genetic differences of the populations from which the steers were obtained as there is no

50
evidence of management regimen by breed interactions for any of the measured carcass traits
with the exception of a MR by breed interaction (P = 0.092) for colour.

51
3.3.4. COLOUR OF SUBCUTANEOUS FAT OVER LM FOR CATTLE MANAGED AT
NLARS (FORAGE-FINISHING USING ALFALFA)
Subcutaneous fat colour measurements are presented in Table 8 for cattle managed at
NLARS. Lightness (L) and Hue were similar (P > 0.31) across MR. Values for a*, b*, and
chroma were lower (P ≤ 0.04; Contrast 1) for Corn vs. forage-finished beef with forage-finishing
producing subcutaneous fat which is more red and yellow than fat from grain-finished beef. The
b*, and chroma values for fat from pasture-finished beef were greater (P < 0.01; Contrast 2) than
fat colour values from cattle fed conserved forages. The results indicate that alfalfa forage-
finishing does increase the yellow colour of fat while colour saturation is also greater when
compared to grain-finishing. Increased yellow colour has often been associated to the
subcutaneous fat of forage-finished beef and has been shown to decrease with greater lengths of
time spent finishing with high grain diets (Schnell et al., 1997; French et al., 2000). Forages are
greater in beta-carotene content than grains which results in the greater yellow content as it is
deposited into the fat tissues. Alfalfa pasture-finishing produced a greater (P < 0.002; Contrast
2) amount of yellow colour vs. feeding conserved forages with a greater chroma value as well.
This counters the findings of Mandell et al. (1998) that found no increase in yellowness when
comparing alfalfa silage to grain-finished beef. McCaughey and Cliplef (1996) also found no
difference in fat colour when grain-finishing vs. finishing steers on alfalfa/ grass pasture.
Conserved forages produced similar colour values (P > 0.091; Contrast 3). The b*, and chroma
values for fat colour from Angus were greater (P < 0.02, Table 9) than fat colour values for
Hereford although the differences would not be noticeable to the human eye.
52
3.3.5. LEAN TISSUE COLOUR AND SHELF-LIFE FOR BEEF FROM CATTLE
MANAGED AT NLARS (FORAGE-FINISHING USING ALFALFA)
Colour, pH, and shelf-life measurements from longissimus and semitendinosus steaks
obtained from steers-finished at New Liskeard are presented in tables 10 and 11, respectively.
There were no differences (P > 0.27) in pH and L*
across MR for both LM and ST which
indicates no MR differences in the conversion of muscle to meat. Similarly, Blanco et al. (2010)
found no differences in pH (5.5to5.6) for beef from bulls-finished with either a high concentrate
diet or lucerne (alfalfa) pasture. Colour values from Corn-finished beef included greater (P <
0.07; Contrast 1) a*, b*, chroma, and hue values vs. forage-finished beef for both LM and ST.
There were few differences in colour values across methods of forage-finishing.
Priolo et al. (2001) stated that L* is 5% lower for forage-finished vs. concentrate-finished
beef, although the majority of forage species studied in their review were from grasses. Blanco et
al. (2010) conducted a study that investigated the legume, lucerne (alfalfa) as a forage pasture in
bulls; this study, similarly, found no effect of forage type on L* value. Colour values were
similar when comparing alfalfa-finished beef with concentrate-finished beef in several studies
(Dinus and Cross, 1978; Blanco et al., 2010). The latter study also found no differences in
redness (a*) or yellowness (b*) throughout the time period of 4 hours to 14 days after blooming.
The results indicate that forage-finishing with alfalfa can produce beef with similar colour
characteristics to beef produced with traditional high Corn finishing diets, and can minimize or
eliminate the darkening that is often associated with lean colour for forage-finished beef.
Drip losses for both LM and ST steaks were generally similar across MR with only lower
drip loss (P< 0.07; Contrast 2) found when comparing ST from cattle fed conserved forages vs.
ST from cattle finished on pasture. Other studies examining forage-finishing also found no

53
differences in drip loss when comparing forage-finishing using alfalfa to a high concentrate-
finishing regimen (Mandell et al., 1998; Blanco et al., 2011). The assay for thiobarbituric
reactive substances (TBARS) found lower (P < 0.01; Contrast 1) lipid peroxidation for beef from
Corn- vs. forage-finished cattle. While there were no differences in lipid peroxidation across
method of forage-finishing for LM steaks, lipid peroxidation was greater (P < 0.06; Contrast 2)
in ST steaks from cattle fed conserved forages vs. cattle-finished on pasture. It should be
understood that the TBARS assay was conducted on samples that had previously been frozen and
this would cause the values to be higher than those from samples that were analyzed in the fresh
state (Vatansever et al., 2000). The lower TBARS value counters finding of Tansawat et al.
(2013) who found that forage-finishing (that included alfalfa hay during the winter) produced
much lower TBARS values over time when compared to grain-finished LM samples. At 0 days
of aging the mg of malondialdehyde per kg of meat was similar between the two treatments (0.2
mg MDA/kg for forage vs. 0.4 mg MDA/ kg for grain) in the Tansawat et al. (2013) study but
after 12 days the difference was evident; forage-finished samples contained 0.4 mg MDA/kg
whereas the grain samples contained 2.4 mg MDA/kg.
There were no breed differences (P > 0.12, tables 12 and 13) for all colour traits and drip
loss values for both LM and ST. Regardless of muscle cut, lipid peroxidation was greater (P <
0.02) in Hereford vs. Angus beef.
54
3.3.6. FATTY ACID COMPOSITION IN BEEF CUTS FROM CATTLE MANAGED AT
NLARS (FORAGE-FINISHING USING ALFALFA)
Fatty acid profiles of steaks from steers-finished at NLARS are presented in Table 14 for
LM and Table 15 for ST. Palmitic acid (C16:0), palmitoleic acid (C16:1), and oleic acid
(C18:1o) concentrations were greater (P ≤ 0.003; Contrast 1) in Corn-fed vs. forage-finished beef
for LM and ST, while the converse was true for the concentration of stearic acid (C18:0) in beef
cuts. Linoleic acid (C18:2) concentrations in LM tended to be lower (P = 0.070; Contrast 1) in
Corn-fed vs. forage-finished beef. Blanco et al. (2010) reported lower concentrations of C16:0
and C18:1o in LM from bulls finished on alfalfa pasture vs. grain-finished bulls while there was
no difference in C18:2 content for LM. Mandell et al. (1998) found no differences in C16:0,
C16:1, C18:0, and C18:2 contents of ground beef prepared from fat and muscle cuts from steers
finished with alfalfa silage or a high moisture corn ration for similar lengths of time. However,
concentrations of oleic acid (C18:1o) were greater in grain-finished beef for the Mandell et al.
(1998) study. The LM of lambs finished with alfalfa hay contained similar concentrations of
C16:0, C16:1, and C18:2 versus LM samples from lambs finished on a high concentrate diet, but
the C18:0 content was greater in LM from lambs fed the alfalfa hay diet (Bessa et al., 2005). In
general, there were no differences (P > 0.17, Contrast 2) in the concentrations of C16:1, C18:0,
C18:1o, and C18:2 in LM and ST for pasture-finished steers vs. steers finished on conserved
forages except for greater (P < 0.07; Contrast 2) concentrations of C16:0 and C18:0 in pasture-
finished beef. The alfalfa hay-fed beef contained lower (P ≤ 0.020; Contrast 3) concentrations of
C16:0 and greater (P ≤ 0.012; Contrast 3) concentrations of C18:2 than beef from cattle fed
alfalfa silage. Linolenic acid (C18:3) is commonly reported when evaluating fatty acid
composition in meat cuts since the alpha isomer (C18:3a) is an essential omega-3 fatty acid (the
gamma isomer, C18:3g is an omega-6 FA). Concentrations of C18:3a were greater (P < 0.0001;
55
Contrast 1) in alfalfa vs. grain-finished beef for both LM and ST. Concentrations of C18:3a were
expected to be greater in forage-finished beef due to the much higher content of C18:3a in
forages vs. grains in the present study (Table 3) and past studies (Mandell et al., 1998; Blanco et
al., 2010). Both Blanco et al. (2010) and Mandell et al. (1998) found that cattle-finished on
alfalfa forage produced meat with greater amounts of alpha-linolenic acid than grain-finished
beef. Pasture finishing decreased (P < 0.0001; Contrast 2) concentrations of C18:3a in both LM
and ST when compared to beef from cattle fed conserved forages. Blanco et al., (2010)
compared bulls-finished on alfalfa pasture or a high grain diet and found the concentration of
C18:3a to be greater in pasture-finished bulls (4.11%) vs. grain-finished bulls (0.25%). Mandell
et al. (1998)-finished steers with alfalfa silage and reported C18:3a concentrations of 1.0% in
LM vs. 0.4% for LM from grain-finished cattle. The feeding of alfalfa hay increased the C18:3a
content of LM muscle when compared to concentrate feeding in lambs (2.69 vs. 0.36%) (Bessa
et al., 2005).
There were no differences (P > 0.08; Contrast 1) in concentrations of conjugated linoleic
acids (cis-9, trans-11 or trans-10, cis-12) in LM and ST muscles between forage- and grain-
finished beef. Cis-9, trans-11 CLA content was greater (P < 0.0001; Contrast 2) for both
muscles in beef from pasture-finished steers when compared to beef from cattle fed conserved
forages. Alternatively, Blanco et al. (2010) reported greater amounts of cis-9, trans-11 CLA in
muscle from alfalfa pasture vs. concentrate-finished bulls (0.63 vs. 0.32 g/100 g). Bessa et al.,
(2005) also found that alfalfa hay feeding resulted in a greater cis-9, trans-11 concentration in
lamb when compared to concentrate-finished lambs (0.85 vs. 0.55%). CLA production is often
associated with ruminal environment (French et al., 2000) and thus, the differences between
studies could be due to differences in rumen environment. These findings suggest that other
56
mechanisms, other than diet regimen, may have an effect on conjugated linoleic acid content of
beef.
Total saturated fatty acid (SFA) content was similar (P > 0.26; Contrast 1) between
forage- and grain-finished beef for both LM and ST. Pasture finishing decreased (P = 0.005;
Contrast 2) SFA in ST when compared to feeding conserved forages, likely due to greater (P =
0.022; Contrast 3) concentrations of SFA from feeding silage vs. hay. Corn finishing increased
(P ≤ 0.001; Contrast 1) mono-unsaturated fatty acid (MUFA) content while decreasing (P ≤
0.001; Contrast 1) poly-unsaturated fatty acid (PUFA) content for both muscles when compared
to forage-finishing. The only effect on MUFA and PUFA concentrations of muscle cuts was
found with pasture finishing decreasing (P = 0.037; Contrast 2) MUFA content of LM when
compared to feeding conserved forages. PUFA to SFA ratio (PUFA/SFA) was lower (P < 0.001;
Contrast 1) for Corn- vs. forage-finished beef. Blanco et al. (2010) compared concentrate
finishing vs. finishing with alfalfa pasture and found no effects of diet on total SFA content,
while MUFA content was lower and PUFA content was greater when comparing the alfalfa
pasture-finished beef to grain-finished beef.
Both omega 3 (n-3) and omega 6 (n-6) fatty acid concentrations in LM and ST were
greater (P ≤ 0.04; Contrast 1) for forage- vs. grain-finished beef. While n-6 FA content was
greater (P= 0.036; Contrast 3) in LM from hay vs. silage-fed cattle, n-3 FA content in ST was
greater (P = 0.012; Contrast 2) in pasture-fed cattle vs. cattle fed conserved forages. The n-6 to
n-3 ratio (n-6/n-3) in both muscles was greater (P < 0.0001; Contrast 1) for grain- vs. forage-
finished beef, although pasture finishing resulted in a lower (P < 0.001; Contrast 2) n-6 to n-3
ratio when compared to beef from cattle fed conserved forages. Silage feeding decreased (P <
0.0001; Contrast 3) n-6/n-3 ratio vs. feeding hay. When comparing alfalfa pasture to concentrate
57
finishing, Blanco et al. (2010) found no difference in total n-6 FA contents between diets while
n-3 FA content was greater (7.29 vs. 0.82 g/100 g) with a lower n-6/n-3 ratio (2.5 vs.17.78) for
LM for pasture vs. concentrate-fed cattle. Tansawant et al. (2013) found that pasture-finished
Angus steers (supplemented with alfalfa hay during the winter) produced LM samples with
greater total n-3 fatty acids (130 vs. 60 mg for an 85 g sample) and lower n-6/n-3 ratio (2.0 vs.
6.9) when compared to grain-finished Angus steers. Bessa et al. (2005) also found a lower n6/n3
ratio when comparing LM from lambs finished with dried alfalfa vs. a high grain diet (2.0 vs.
7.7). N-3 FA content is greater with forage-finishing when compared to traditional finishing
diets while pasture finishing appears to produce a more desirable omega-6 to omega-3 fatty acid
ratio than finishing with conserved forages.
While there were a few breed differences in FA profile, most would be of questionable
biological significance (Tables 16 and 17). The cis-9, trans-11 CLA content of both muscles and
the N-3 FA content in ST were both greater (P < 0.007) in Angus vs. Herefords.
58
3.3.7. SENSORY EVALUATION OF LM FROM CATTLE MANAGED AT NLARS
(FORAGE-FINISHING USING ALFALFA)
Taste panel results for LM steaks from beef managed at NLARS are presented in Table
18. “Tenderness attributes”, softness and tenderness tended to be greater (P < 0.10; Contrast 1)
for Corn-fed vs. forage-finished beef while chewiness was greater (P < 0.04; Contrast 1) for
Corn-fed beef. There was no effect (P ≥ 0.31; Contrasts 2 and 3) of method of forage-finishing
on any “tenderness attribute”. The difference in tenderness did not translate into a difference in
shear force measurements for the LM steaks though. There were no effects (P > 0.11) of MR on
LM shear force values. However, this was not the case for shear force evaluation of ST, as
shear force values were greater (P = 0.0444; Contrast 2) for steaks prepared from pasture-
finished beef vs. steaks prepared from beef from hay and silage-finished cattle. Ratings for beef
flavour, flavour desirability, and overall acceptability were greater (P ≤ = 0.02; Contrast 1) for
Corn- vs. forage-finished beef. While there was a trend of decreased off-flavours (P = 0.071;
Contrast 1) for Corn-finished beef, grassy flavour was similar (P > 0.28; Contrast 1) between
Corn- vs. forage-finished beef. Juiciness traits (initial and overall juiciness) were similar across
MR (P > 0.64). There were no differences (P > 0.17; Contrasts 2 and 3) in ratings for beef
flavour, grassy flavour, and off flavour amongst methods of forage-finishing with the exception
of grassy flavour which was lower (P = 0.007, Contrast 2) for pasture-finished beef when
compared to beef from cattle fed conserved forages. The results indicate that the different
forage-finishing regimens can produce similar flavour characteristics while pasture finishing may
be an effective method for reducing the grassy flavour often associated with forage-finished beef.
Several studies in the past found limited differences in shear force (SF) when comparing
beef tenderness for cuts produced by finishing cattle with forage or high grain diets. Harrison et
al. (1978) did not find any differences in SF for evaluation of either LM or ST steaks from

59
crossbred steers finished with different nutritional regimes (including grassesand grain).
Mandell et al. (1998) similarly found no difference in SF between steaks from cattle fed a high
moisture corn diet or alfalfa silage. Other studies, however, reported differences in shear force
when comparing tenderness of steaks from cattle fed alfalfa vs. cattle fed high grain diets.
Mandell et al. (1997) found lower shear force values for LM steaks from Charolais steers when
comparing beef produced from feeding a 97% alfalfa silage vs. a high moisture corn diet (3.85
vs. 4.60 kg). In contrast, Berry et al. (1988) reported greater SF values for LM when Angus
steers were finished with alfalfa silage as opposed to cattle fed corn or corn silage diets (7.0, 5.6
5.9 kg respectively).
Other studies that evaluated alfalfa-finishing effects on sensory traits have returned
conflicting results. Mandell et al. (1998) conducted a taste panel to compare LM steaks from
Limousin cross steers when finished with either a high moisture corn ration or a 95% alfalfa
silage ration. In their study, however, the forage diet increased the grassy aroma of beef.
Similar to the present study, beef flavour ratings decreased as a result of feeding the forage diet
but tenderness ratings were similar to ratings for concentrate fed steers. McCaughey and Cliplef
(1996) found no changes in flavour, tenderness, or juiciness ratings when alfalfa pasture-finished
steers were further finished on a high grain diet. Pelleted alfalfa hay was examined by Oltjen et
al. (1971) where juiciness and overall desirability scores were not significantly different from
scores achieved from steaks from cattle finished on concentrates, although the flavour and
tenderness scores were greater for the alfalfa hay fed animals. Conversely, Berry et al. (1988)
concluded that beef produced with alfalfa silage (or orchardgrass silage) had a lower beef flavour
intensity when compared to beef from cattle fed corn or corn silage diets. Alfalfa hay was
ground in a study by Dinius and Cross (1978) and fed to Hereford cattle with steaks from forage-

60
finished animals achieving similar tenderness and juiciness scores to ratings for steaks from
steers finished on the concentrate diet.
The effects of aging on steak tenderness are presented in Table 19. Shear force (SF)
values for both LM and ST steaks decreased considerably with postmortem aging. Steaks aged
for 7 d had greater SF values than 14 and 21 d aged steaks (P < 0.0001, Contrast 1), while 21 d
aged steaks had lower SF values (P < 0.0001, Contrast 2) than steaks aged for 14 d. These
results are not surprising, as it has long been accepted that ageing of beef above freezing
temperatures will increase tenderness. This is a result of enzymatic breakdown of myofibrillar
proteins (via the calpain system), causing an increase in tenderness with postmortem aging
(Koohmaraie, 1996).
There were no breed differences (P > 0.28) for tenderness, juiciness, and beef flavour
attributes, although the taste panel found that beef from Herefords tended to have greater (P =
0.054) off flavours and decreased (P < 0.10) flavour desirability and overall acceptability than
Angus beef (Table 20). This could be due to the trend for greater amounts of IMF in Angus vs.
Hereford LM (Table 7). A very simple study by Moore et al. (1978) found that upon ranking
breeds by preference, a trained taste panel ranked Angus and Hereford samples to be similar in
terms of taste preference (ranked as either positive, negative, or neither). Moore et al. (1978)
also found that shear force values did not differ between Angus and Hereford when evaluating
the effects of beef breed on palatability attributes. Glimp et al. (1971) also compared Angus to
Hereford cattle while investigating sex and age of castration. While the cattle from the 2 breeds
were managed using identical diets and finishing regimens, Warner-Bratzler shear force values
were lower (6.92 vs. 7.67) for Angus than Herefords. The taste panel in the Glimp et al. (1971)

61
study ranked Angus beef with greater tenderness scores and overall acceptability, although
flavour and juiciness scores were similar between the two breeds.
62
3.4. RESULTS AND DISCUSSION – FORAGE-FINISHING USING GRASS
3.4.1. ANALYSIS OF DIETS FOR CATTLE MANAGED AT KAP (FORAGE-
FINISHING USING GRASSES)
Diets fed at Kapuskasing are presented in Table 1. The values for the high grain diet
(which was the exact same feed used in New Liskeard) were higher in net energy and TDN than
the diets used for forage-finishing. The grass diets (which were composed of 40% reed canary
grass, 30% native grasses (such as Canada Bluegrass), and 30% weeds (including quackgrass)
were higher in fibre content (both NDF and ADF) and lower in calcium on a DM basis when
compared to the concentrate diet. Protein levels varied with the method of feeding forage with
grass silage and hay containing the highest and the lowest concentrations, respectively.
Phosphorus content was highest in the pasture grass but the grass hay and silage had lower
percentages that were similar to the high grain diet. Cymbaluk (1990) compared the nutritional
content of different grasses (Altai wildry, Bromegrass, Crested wheatgrass, Kentucky Bluegrass,
oat hay, and reed canarygrass) and found reed canarygrass to have the lowest gross energy value,
lower DMI values, and the lowest digestible energy intake of all grasses tested in beef cattle.
The fatty acid profiles of the diets fed in Kapuskasing are presented in Table 3. Similar
to the fatty acid content of the diets from NLARS, the Corn diet was much higher in oleic acid
(C18:1o) and linoleic acid (C18:2), whereas the forage diets contained more saturated fatty acids
(C14:0, C16:0, C17:0,) and linolenic acid (C18:3a). The primary fatty acids found in the Corn
diet include C18:2, C18:1o, and C16:0 whereas the primary fatty acids in diets used for forage-
finishing were C18:3a, C18:2, and C16:0. C18:3a is often the most prevalent FA in forages
(Harfoot, 1978). Fatty acid profiles of the forages were relatively similar. Dewhurst et al.
(2008) compared the fatty acid profiles of several grass species and concluded there is a
significant genetic component when it comes to variation in lipid quantities, such as linolenic

63
fatty acids. Generally, grasses have high proportions of alpha linolenic acid during the
vegetative growth phase (late April) but this drops significantly in the following season
(recovering in Autumn) (Dewhurst et al., 2008).
64
3.4.2. GROWTH PERFORMANCE FOR CATTLE MANAGED AT KAP (FORAGE-
FINISHING USING GRASSES)
Growth performance data for cattle managed at KAP are presented in Table 21. There
were no differences (P > 0.82) in initial body weight across management regimens (MR) based
on cattle allocation. Management regimen differences (P ≤ 0.001) existed for most growth
performance traits except for time on feed, which was similar (P = 0.98) across MR.
Similar to data from NLARS, Corn-fed steers at KAP achieved greater (P < 0.001,
Contrast 1) final body weights, total gains, average daily gains, total dry matter intakes (DMI)
and daily DMI with lower (more efficient) (P < 0.001, Contrast 1) feed:gain than forage-
finished cattle. These results are likely due to the MR differences in nutritional composition
(Table 1). The Corn diet contained greater amounts of energy (NE, TDN) when compared to the
forage diets. These differences in growth performance were also reported in other studies that
investigated feeding grass forages which resulted in poorer growth when compared to feeding a
high grain concentrate diet (Forrest et al., 1982; Bidner et al., 1986; Engle and Spears, 2004;
Roberts et al., 2009). Forrest et al. (1982) found Hereford steers to achieve a greater ADG when-
finished on corn silage as opposed to grass silage (primarily orchardgrass). Bidner et al. (1986)
reported the same conclusion when Angus-Hereford steers were managed on pasture containing
Bermuda and rye grasses and compared to grain-fed steers. Similarly, Engle and Spears (2004)
reported that Angus steers finished on a high concentrate diet also had a greater ADG than their
pasture-fed (tall-fescue) counterparts. These differences in ADG are most likely due to the
greater energy content of high grain diets versus grass forages, regardless of the grass species.
Roberts et al. (2009) concluded that supplementation of pasture fed steers with whole shelled
corn results in a linear increase in ADG. Williams et al. (1983) reported similar findings as
Brangus x Hereford x Angus steers finished on a 79% corn diet had greater ADG and required

65
51 fewer days on feed to reach the same weight as steers finished on pasture (winter wheat and
sudan/ bermuda grass). Dry matter intake decreased in steers when finished on predominantly
ryegrass silage when compared to steers finished with maize silage (Walsh et al., 2008).
Grass pasture-finished cattle were heavier at slaughter (P = 0.024, Contrast 2) and gained
more weight (total gain and ADG) (P < 0.031, Contrast 2) than cattle fed conserved forages.
This difference was most likely due to the very poor performance of cattle fed grass hay, likely
due to the lower nutritional content of grass hay which contained the lowest protein content on a
DM basis. Similar to the work at NLARS, intake and feed:gain measurements could not be
compared due to the lack of pasture intake data. In young growing bulls, ryegrass pasture was
able to sustain high growth rates (1.20 kg/ day) that were greater than growth rates (0.70 kg/day
ADG) achieved by feeding the same forage conserved as a silage along with feeding 0.8 kg/d of
a supplemental concentrate (Steen and Kilpatrick, 2003). For steers fed conserved forages,
grass silage-fed cattle achieved greater (P ≤ 0.001, Contrast 3) final body weights, total gains,
average daily gains, daily dry matter intakes (DMI) (kg/d) with lower (more efficient) (P <
0.0001, Contrast 3) feed:gain than grass hay-fed cattle. There was very poor growth with hay-
fed cattle as these steers only gained 40.8 kg throughout the entire trial. This resulted in a very
surprisingly poor feed:gain ratio of 27.77. Due to the poor performance of grass hay-fed cattle,
none of these steers were sent to slaughter with the other steers in this trial, and were henceforth
not included in carcass and meat quality measurements. Helene et al. (1985) compared DMI
values for cattle fed timothy hay conserved as silage or hay and found that cattle consumed more
silage than hay on a daily basis (91.0 g/kg0.75
vs. 86.3 g/kg0.75
). Petit and Flipot (1992), though,
found the opposite for intake values in their experiment with Hereford steers finished on timothy
grass hay or silage. Daily DMI was greater for hay-fed cattle (2.36% of body weight) than silage-

66
fed cattle (1.68% of body weight). ADG results were similar, however, as gains were greater for
grass silage- versus hay-fed cattle (0.81 kg/d and 0.73 kg/d respectively). This resulted in feed to
gain ratios of 7.1 for silage-fed cattle and 11.0 for hay-fed cattle.
Reed Canary grass was the predominant grass species used for forage-finishing at KAP
for the present study. Unfortunately there is very limited information in the literature for this
forage species in comparison to evaluation of other grasses for feeding beef cattle. For this
reason, the comparisons with similar forage-finishing studies assume that grass forages will have
similar effects.
Breed differences were similar to findings for steers finished at NLARS. Angus steers
were heavier (P < 0.02) at the start of the trial than Herefords (Table 5), likely due to the breeds
being sourced from different cow-calf operations. No breed differences (P > 0.30) were found
for any of the growth performance traits measured between the two breeds. The similarity in
growth between these two breeds is supported by findings of Glimp et al. (1971) and Bartoň et
al. (2006) that demonstrate similar growth trends between these two breeds (final body weights,
ADG). There were no MR by breed interactions (P > 0.27) for any growth performance trait
measured in the present study (Appendix Table 1)
67
3.4.3. CARCASS TRAITS FOR CATTLE MANAGED AT KAP (FORAGE-FINISHING
USING GRASSES)
Carcass traits for steers managed at Kapuskasing are presented in Table 22. Data from
steers finished on grass hay were not collected due to poor performance and failure to reach
acceptable slaughter weights by the end of the trial. The statistical analysis of the data was
modified to examine 2 contrasts including: Corn- vs. forage-finished (grass pasture and grass
silage) cattle and within forage-finishing (pasture- vs. silage-finished cattle). Hot carcass
weights were heavier (P = 0.002; Contrast 1) for corn- vs. forage-finished carcasses. Carcass
weights were similar (P = 0.608; Contrast 2) between the two methods of forage-finishing. The
heavier hot carcass weights for Corn-fed cattle were expected due to greater final body weights
from the higher energy density of the high grain diets as compared to the forages used in forage-
finishing (Table 1). Forrest (1982) noted a tendency for heavier hot carcass weights from cattle
fed a corn silage diet when compared to carcass weights for Hereford and Hereford cross steers
fed grass silage. Turner et al. (2011) concluded that Charolais steers achieved heavier carcass
weights when concentrates were supplemented in the diet while heavier carcasses were found in
pasture- versus silage-fed steer when pasture vs. silage feeding were compared. Walsh et al.
(2008) compared carcass traits for crossbred steers finished on ryegrass silage or maize silage
and found heavier carcass weights for steers finished with maize silage (335 kg) vs. grass silage
(290 kg). Utley et al. (1975) finished crossbred steers on a pelleted all-forage (Bermuda grass)
diet and reported lighter carcass weights when compared to steers finished on a high-energy
concentrate (mostly corn) diet.
Backfat measurements were greater (P = 0.021; Contrast 1) in Corn vs. forage-finished
carcasses with no differences (P > 0.19; Contrast 2) across method of forage-finishing. The
greater amount of backfat or subcutaneous fat deposition in Corn-finished carcasses is most
68
likely the result of the higher energy density of the Corn diet when compared to forage-finishing.
Finishing Angus-Hereford steers on pasture (rye and Bermuda grasses) produced leaner
carcasses vs. steers finished on a high grain diet when cattle were fed to similar final slaughter
weights (Bidner et al., 1981). These authors achieved the same results in a follow up study
(Bidner et al.,1986) with Angus-Hereford steers on pasture but with feeding greater amounts of
concentrate supplement. Grass silage-finished steers deposited greater amounts of backfat (13.6
vs. 9.3 mm) when Hereford cross steers were supplemented with barley grain (1.35 kg/100 kg of
live weight) as compared to cattle fed only grass silage (Fortin et al., 1985). Backfat decreased
when Angus steers were fed orchardgrass silage when compared to steers fed corn concentrate or
corn silage (Berry et al., 1988). Walsh et al. (2008) indicated that steers finished on grass silage
produced leaner carcasses than steers finished with maize silage. Utley et al. (1975) also
reported leaner carcasses for cattle fed an all-forage diet (pelleted Bermuda grass hay) as
compared to cattle fed 72.8% ground shelled corn diet.
Longissimus muscle area (LMA) tended to be greater (P < 0.09; Contrast 1) for Corn vs.
forage-finished steers with no differences (P = 0.81; Contrast 2) between method of forage-
finishing. In contrast, LMA was smaller (P < 0.001; Contrast 1) for Corn vs. forage-finished
carcasses when LMA was adjusted on a 100 kg hot carcass weight basis. This indicates that
while LMA may be smaller overall, longissimus muscle comprises a larger proportion of the
carcass when steers are finishred-finished with forages. Bidner et al. (1981, 1986) found LMA
tended to be smaller for pasture- versus concentrate-finished steers.
While CBGA lean yield is (P ≤ 0.001; Contrast 1) lower for Corn- versus forage-finished
carcasses, USDA yield grade is greater (P ≤ 0.009; Contrast 1) for Corn-fed carcasses as the
larger numerical value is an indicator of a fatter carcass. There were no differences in CBGA

69
lean yield or USDA yield grade values (P > 0.30); Contrast 2) across method of forage-finishing.
Utley et al. (1975) reported higher USDA yield grades (2.8 vs. 2.1) when comparing corn-fed
versus all forage-fed carcasses. Similar to steers fed at NLARS, lean content from rib dissection
was lowest (P < 0.0001; Contrast 1) for Corn-fed cattle as compared to forage-finished cattle.
Pasture finishing increased (P < 0.0001; Contrast 2) lean content vs. finishing on grass silage.
Fat content was inversely related to lean content with a trend for Corn finishing to increase (P <
0.07; Contrast 1) fat content vs. forage-finishing with no differences (P > 0.34; Contrast 2) in fat
content between pasture- and silage-finished cattle. Bone content tended to be lower (P < 0.07;
Contrast 1) in Corn vs. forage-finished cattle similar to data at NLARS. Priyanto et al. (1993)
found grass-fed Hereford steers to produce carcasses with lower amounts of fat and greater
amounts of lean than grain-fed steers (25.2 vs. 35.6% respectively for fat; 59.7 vs. 52.4% for
lean).
There was a trend for greater (P < 0.09; Contrast 1) marbling for Corn vs. forage-finished
carcasses with no differences (P > 0.33; Contrast 2) across method of forage-finishing. In the
studies by Bidner et al. (1981, 1986), grain-finished beef achieved higher marbling scores than
grass-finished beef. Utley et al. (1975) also reported greater marbling scores for carcasses from
cattle fed concentrates (4.4 marbling score) vs. all forage diets (3.5 marbling score) based on the
following scale (3 = trace, 4= slight, 5= small). Quality grade was greater (P = 0.048; Contrast 1)
for Corn- versus forage-finished carcasses with no differences between the two methods of
forage-finishing (P = 0.233; Contrast 2). Bidner et al. (1981, 1986) also found yield and quality
grades to be greater with concentrate vs. pasture-finished cattle. Intramuscular fat (IMF) content
was similar (P ≥ 0.15; Contrasts 1 and 2) across MR for LM. However, the IMF content for ST
was greater (P = 0.026; Contrast 1) for Corn- versus forage-finished carcasses with no

70
differences (P > 0.24; Contrast 2) across method of forage-finishing. The greater IMF content of
Corn-finished beef supports the trend for a greater marbling score with grain-finished beef.
Decreased marbling and IMF content are often associated with studies comparing forage-
finished to high grain-finished carcasses (Utley et al., 1975; Bidner et al., 1981; Bidner et al.,
1986; Leheska et al., 2008).
Colour values were greater (P < 0.0001; Contrast 1) for Corn- versus forage-finished
carcasses with no differences (P > 0.23; Contrast 2) across method of forage-finishing. Darker
lean tissue has been often attributed to grass forage-finishing when compared to grain-finished
carcasses (Bidner et al., 1981; Forrest, 1982; Crouse et al., 1984; Bidner et al., 1986).
There were few breed differences in carcass traits (Table 23). Hot carcass weights tended
to be heavier (P = 0.060) for Angus vs. Hereford steers. This concurs with the carcass weight
difference obtained at NLARS and findings from past studies (Glimp et al., 1971; Long &
Gregory, 1975; Marshall, 1994). Glimp et al. (1971) compared carcass traits between Angus and
Herefords fed the same finishing diet and found that Angus steers produced carcasses with
heavier greater hot carcass weights than Hereford steers, even though final body weights were
similar between the two breeds. Lean content tended to be greater (P < 0.08) in Angus vs.
Hereford steers. Priyanto et al. (1993) also evaluated breed differences for steers fed the same
diet but there were no differences in carcass fat and lean composition between Angus and
Herefords. There were no management regimen by breed interactions for any carcass trait
(Appendix Table 2).
71
3.4.4. COLOUR OF SUBCUTANEOUS FAT OVER LM FROM CATTLE MANAGED
AT KAP (FORAGE-FINISHING USING GRASSES)
Colour measurements of the subcutaneous fat from steers-finished at KAP are presented
in Table 8. Lightness (L), a*, and hue values were similar (P > 0.22) across MR. The b* value
for fat from corn-finished beef tended to be lower (P < 0.09; Contrast 1) than values for grass-
finished beef which is consistent with previous studies. Although Bidner et al. (1986) found no
differences in fat colour in cattle finished on either a grass pasture forage or high grain diet,
many other studies have indicated that yellow colour is greater with forage-finished beef and will
become less yellow with increased time spent feeding high grain diets (Schnell et al., 1997;
French et al., 2000). The increased yellow colour can be attributed to an increase in beta-
carotene deposition in fat tissue, likely due to greater amounts of beta-carotene in forage diets.
Kerth et al. (2007) reported that ryegrass pasture finishing did not affect L, a*, or hue values but
yellowness (b*) was lowest for steers on an 85% corn finishing diet. Similarly, Moloney et al.
(2013) found the b* value for subcutaneous fat was greater for cattle fed grass silage vs. maize
silage. There were no breed differences (P > 0.13, Table 9) for any of the colour traits.
72
3.4.5. LEAN TISSUE COLOUR AND SHELF-LIFE FOR BEEF FROM CATTLE
MANAGED AT KAP (FORAGE-FINISHING USING GRASSES)
Colour, pH, and shelf-life measurements of steaks produced from steers finished in
Kapuskasing are presented in Table 24 for LM steaks and 25 for ST steaks. There were no
differences (P > 0.14) in pH between Corn- and forage-finished beef while pH for ST was lower
(P < 0.09; Contrast 2) for silage vs. pasture-finished beef. Warren et al., (2008) similarly, found
non-significant differences in pH as a result of feeding grass silage or standard concentrate. For
LM, L* and b* values for Corn-finished beef were greater (P < 0.02; Contrast 1) than values for
forage-finished beef although it is doubtful the human eye will detect those differences. There
were no differences (P > 0.24; Contrast 1) for color values between Corn and forage-finished
beef for ST. L*, b*, and hue values were lower (P < 0.10; Contrast 2) for pasture-finished beef
vs. beef from cattle fed conserved forages. Lower L* values for forage-finished beef agrees with
other studies that attributed darker lean colour with forage-finishing programs (Schroeder et al.,
1980; Bidner et al., 1986; Bennett et al., 1995; Gatellier et al., 2005). Other studies found no
differences in lightness when comparing concentrate to forage-finishing (French et al., 2001;
O’Sullivan et al., 2003). This could indicate that grass forages are able to produce beef with
varying degrees of darkness, which could be dependent on other factors such as growth or
carcass management. Darker lean tissue is a common finding when finishing with forages and
this can be attributed to several factors including the tendency of a higher pH and different
growth rates (Priolo et al., 2001). The a* value is the most important colour value when
evaluating meat oxidation, as a bright red colour is more appealing to consumers than a brown
colour (Gatellier et al.,2005). The effect of forage-finishing on a* value varies from study to
study. Sapp et al. (1998) found that pasture-finished samples were able to stay redder for longer
periods of time than concentrate-finished samples. Lanari et al. (2002), conversely showed that
73
finishing with high grain diets improved a* value after 14 days of storage when compared to
forage-finished beef. French et al. (2001) found no effect of diet on L*, a*, or b*.
Drip loss was similar (P > 0.40) across MR with both LM and ST. While TBARS values
were similar (P > 0.21) across MR for ST, lipid peroxidation in LM was greater (P = 0.06;
Contrast 1) for Corn- vs. forage-finished beef and also greater (P < 0.01; Contrast 2) for silage
vs. pasture-finished beef. The lower TBARS values with forage-finishing is consistent with
several sources that indicated that forage-finishing increases the oxidative stability of lipids,
likely due to increased amounts increased antioxidants, such as vitamin E, found in grasses
(Lanari et al., 2002; O’Sullivan et al., 2003; Gatellier et al., 2005). Gatellier et al. (2005) found
that TBARS values increased faster with post mortem ageing for cuts from concentrate-finished
cattle vs. cuts from pasture-finished cattle. Nuernberg et al. (2005) reported that LM samples
from pasture-based systems were more oxidatively stable than samples from bulls finished on
high grain concentrate diets, especially after 10 days of being shelved.
There were generally no breed differences (tables 12 and 13) for most colour traits. Drip
losses tended to be greater (P < 0.08) in LM from Hereford vs. Angus cattle while lipid
peroxidation was greater (P = 0.02) in LM from Angus cattle. This conflicts with breed
differences in TBARS when forage-finishing with alfalfa and may indicate that something other
than breed could be the cause of the differences in lipid oxidation.

74
3.4.6 FATTY ACID COMPOSITION IN BEEF CUTS FROM CATTLE MANAGED AT
KAP (FORAGE-FINISHING USING GRASSES)
Fatty acid profiles of steaks collected from the steers finished at Kapuskasing are
presented in tables 26 (LM) and 27 (ST). Palmitic acid (C16:0) concentrations were similar (P >
0.17) across MR for both LM and ST. Palmitoleic acid (C16:1), and oleic acid (C18:1o)
concentrations in LM were greater (P < 0.001; Contrast 1) for Corn- vs. forage-finished beef
while there were no differences (P > 0.21) in these fatty acid concentrations across MR for ST.
Forage-finished beef contained greater (P < 0.0001; Contrast 1) amounts of stearic acid (C18:0)
than Corn-finished beef for both LM and ST. Leheska et al. (2008) collected samples of grass
fed beef from several producers across the United States of America and compared the fatty acid
profiles to those produced through traditional high grain-finishing. The researchers concluded
that grass fed beef contained similar proportions of C16:0, C16:1, and C18:2 vs. grain-finished
beef. The C18:0 content was greater in grass-finished beef while C18:1o content was lower in
the Leheska et al. (2008) study. Managing cattle on grass pasture did not affect concentrations of
C16:0 and C16:1 but increased concentrations of C18:0 and C18:2, and decreased concentrations
of C18:1 when compared to grain-finished beef (Williams et al., 1983). Gatellier et al. (2005),
though, found that grass pasture-finished steers produced LM muscle that contained a lower
concentration of C16:0 when compared to cattle fed predominantly maize silage (25.9% vs.
29.1%). In the present study, there was a trend for greater (P < 0.06; Contrast 2) concentrations
of C18:1o content in LM for grass silage- vs. pasture-finished steers, while the converse was true
with C18:0 concentrations being greater (P < 0.04; Contrast 2) in ST from pasture-finished
steers. There were no differences (P > 0.11; Contrast 2) in concentrations of C16:0, C16:1, and
C18:2 between silage- and pasture-finished LM and ST except for greater (P < 0.00; Contrast 2)
75
concentrations of C18:2 in ST from pasture-finished cattle. Conversely, French et al. (2000)
reported greater concentrations of C16:0 in LM from grass pasture- vs. grass silage-finished
cattle with no differences in fatty acid concentrations across method of forage-finishing for
C16:0, C16:1, C18:0, and C18:1.
Alpha-linolenic acid (C18:3a) concentrations were greater (P < 0.02; Contrast 1) in grass
vs. grain-finished beef for both LM and ST. Many studies have consistently reported greater
concentrations of C18:3 when comparing grass pasture-finished beef to concentrate finishing
(Williams et al, 1983; Larick and Turner, 1989; French et al., 2000; Descalzo et al, 2005; Garcia
et al., 2008; Leheska et al., 2008; Alfaia et al., 2009). Although it is common to find that C18:3a
concentrations are greater due to grass finishing, the values vary extensively within the literature.
For example, Alfaia et al. (2009) measured 5.53 vs. 0.48 g/100 g of lipid when comparing grass
pasture-finished steers to grain-finished steers whereas Leheska et al. (2008) reported 0.71 vs.
0.13 g/100g for the same comparison. This is most likely due to differences in C18:3a content of
the grasses used for each study (specific grass species is not specified for either study), but this
demonstrates the variability that is possible when feeding grass forages. There was a greater (P <
0.001; Contrast 2) concentration of C18:3a in pasture- versus silage-fed beef for ST. French et
al. (2000) also reported that C18:3a content was greater when steers were-finished on grass
pasture when compared to feeding grass silage.
Concentrations of CLA varied between the two cuts. LM steaks contained greater (P <
0.0001; Contrast 1) amounts of cis-9, trans-11 CLA when cattle were forage-finished as opposed
to grain-finishing, while silage feeding increased (P = 0.0003; Contrast 2) ) cis-9, trans-11 CLA
deposition vs. pasture finishing. Trans-10, cis-12 CLA was not affected (P = 0.934) by MR for
LM while forage-finishing increased (P < 0.0001; Contrast 1) trans-10,cis-12 CLA deposition in
76
ST vs. grain-finishing although the difference is of questionable biological significance. In the
literature, CLA content increases in beef when comparing grass vs. grain-finishing (Garcia et al.,
2008; Leheska et al., 2008; Alfaia et al., 2009). In a sampling of ground beef from grass fed beef
producers across America, the CLA content of grass fed beef was greater than samples of
conventionally (high grain) finished beef (0.85 vs. 0.43 g/100 g of lipid) (Leheska et al., 2008).
Grass pasture was compared to grass silage finishing by French et al. (2000) with the total CLA
content being greater for grass silage vs. pasture. Differences in CLA content in lean tissue can
be attributed to changes in the ruminal environment as a result of feeding the forage diet (French
et al., 2000). Grasses (and forages in general) are high in concentrations of soluble fiber and
rapidly fermentable sugars which can produce a ruminal environment that decreases CLA
utilization and promotes its production (Kelly et al., 1998). This aids in explaining why it is
possible to see a wide variation in CLA deposition in lean tissues, although it will be consistently
greater when finishing with forages as opposed to grain.
SFA content was not affected (P > 0.25) by MR for LM while grain-finishing decreased
((P < 0.04; Contrast 1) SFA deposition in ST vs. forage-finishing. Several studies in the literature
also reported greater concentrations of SFA when comparing grass vs. grain-finishing (Leheska
et al., 2008; Garcia et al., 2008). Corn finishing increased (P < 0.0001; Contrast 1) MUFA
content in both LM and ST but decreased (P < 0.0001; Contrast 1) PUFA content in ST when
compared to forage-finishing. Silage feeding increased MUFA content (P = 0.011; Contrast 2) in
ST vs. pasture finishing. The literature has found MUFA content to be consistently greater in
grass vs. grain-finished cattle (Descalzo et al, 2005; Garcia et al., 2008; Leheska et al., 2008;
Alfaia et al., 2009). PUFA/SFA ratio in ST was greater (P < 0.0001) for forage vs. grain-
finished beef (Contrast 1) and for pasture vs. silage-finished beef (Contrast 2). Gatellier et al.
77
(2005) similarly found that grass pasture finishing resulted in no difference in SFA content but
greater PUFA content in Charolais steers when compared to steers finished on a high grain-
finishing diet. When comparing pasture to silage finishing, French et al. (2000) also concluded
that feeding grass pasture results in a greater PUFA: SFA ratio (0.13 vs. 0.09).
N-6 fatty acid content differences existed (P < 0.0001) in ST but not LM. Forage-
finishing increased (P = 0.01; Contrast 1) n-6 fatty acids vs. Corn-finishing, with greater (P<
0.0001; Contrast 2) concentrations of n-6 fatty acids in pasture- vs. silage fed beef. In the
literature, n-6 content varies from study to study with forage-finishing increasing (Descalzo et
al., 2005, Alfaia et al., 2009), decreasing (Garcia et al., 2008), or not affecting (Leheska et al.,
2008) n-6 FA concentrations vs. grain-finished beef. However, French et al. (2000) though
found no difference in n-6 FA content when comparing grass pasture vs. finishing cattle on grass
silage. N-3 fatty acid content was greater (P ≤ 0.014; Contrast 1) in both cuts from steers
finished on grass when compared to Corn finishing. Findings of greater concentrations of n-3
fatty acids in forage- vs. grain-finished beef are commonly reported in the literature (Nuernberg
et al., 2005; Ponnampalam et al., 2006; Garcia et al., 2008; Leheska et al., 2008; Alfaia et al.,
2009). For ST, pasture-finished beef contained greater (P < 0.0001; Contrast 2) amounts of n-3
FA vs. silage-finished beef. French et al. (2000) similarly concluded that pasture finishing
resulted in greater n-3 FA content than grass silage finishing (1.36 vs. 0.91 g / 100 g of lipid).
There were few breed differences in fatty acid concentrations of LM (Table 28) and ST
(Table 29). The alpha-linolenic acid and cis-9, trans-11 CLA concentrations for Angus were
greater (P ≤ 0.03) than Herefords for both cuts. The fatty acid profiles of these two breeds are not
often compared, although other studies have found fatty acids, such as the omega-3 FAs, can
vary between beef breeds (Itoh et al., 1999). The concentration of trans-10, cis-12 in ST was

78
greater (P < 0.03) in Herefords vs. Angus but the difference is of questionable biological
significance.
3.4.7. SENSORY EVALUATION OF LM FROM CATTLE MANAGED AT KAP
(FORAGE-FINISHING USING GRASSES)
Taste panel results from LM steaks from steers finished in Kapuskasing are presented in
Table 30. There were no management regimen effects (P ≥ 0.27) for any “tenderness” attribute
or off flavour. The effects of MR on shear force values were similar to those reported for
NLARS (NLARS), with similar (P > 0.11; Contrast 1) shear force values for Corn- vs. forage-
finished LM or ST. This suggests that grass forage-finishing is able to produce beef that is
similar in tenderness to conventional grain-finished beef. The trained taste panel assessed Corn-
finished beef to have greater (P < 0.04; Contrast 1) ratings for beef flavour, flavour desirability,
and overall acceptability vs. forage-finished beef with less (P < 0.07; Contrast 1) grassy flavour.
While beef flavour ratings for grass silage-finished beef were greater (P < 0.04; Contrast 2) than
pasture-finished beef, method of forage-finishing did not affect (P > 0.56; Contrast 2) ratings for
flavour desirability and overall acceptability. Juiciness attributes were not affected (P > 0.34;
Contrast 1) by Corn vs. forage-finishing. The trained taste panel assessed grass silage-finished
beef to have greater (P < 0.03; Contrast 2) ratings for initial and overall juiciness than pasture-
finished beef. It would appear that feeding grass silage is able to produce a higher juiciness
attribute that is similar to Corn finishing when compared to pasture finishing.
Past studies examining the effects of forage-finishing using grasses on shear force values
achieved similar results as the present study. SF values measured by Bidner et al. (1986) were
similar for LM steaks from grain- and grass-finished Angus-Hereford steers (4.2 vs. 4.0 kg). Sitz
et al. (2005) compared grass-fed beef imported from Australia to beef produced domestically in

79
the United States and reported similar Warner Bratzler shear force values (3.61 kg to 3.64 kg).
French et al. (2001) also found no significant differences in SF when comparing grass-fed vs.
concentrate-fed beef. Other studies found forage-finishing with grasses increased SF values vs.
high grain feeding. Schroeder et al. (1980) attributed greater SF values with forage-finished beef
with more extensive cold shortening of muscles from steers finished with forage when compared
to grain-fed cattle. Berry et al. (1988) reported greater SF values for LM when Angus steers
were finished with orchardgrass silage vs. finishing cattle using corn or corn silage diets (7.3,
5.6, 5.9 kg respectively).
Lower ratings for beef flavour are often found with trained taste panel assessments of
beef when cattle are fed grass silage and hay diets when compared to beef from cattle fed high
corn diets (Melton, 1983). Berry et al. (1988) concluded that beef produced from feeding
orchardgrass silage (or alfalfa silage) had the lowest beef flavour intensity when compared to
beef from cattle fed corn or corn silage diets. Melton (1983) associated the off- or non-beef
flavours to increased levels of long-chain PUFAs in the intramuscular fat of forage-finished beef.
The findings of Bidner et al. (1985) concur; a taste panel found grass pasture-finished beef to
have less intense beef flavour than grain-finished beef. Crouse et al. (1984), however, reported
that when finishing heifers on grass pasture, beef flavour intensity was similar to the flavour
intensity for beef from cattle finished on a corn silage diet. More recently, Kerth et al. (2007)
also reported decreases in flavour intensity and beef flavour (as well as tenderness values) when
comparing grass pasture finishing to beef from cattle fed a high concentrate diet (85% corn).
Grass finishing, in this study, agrees with the majority of the literature that corn finishing
increases beef flavour when compared to finishing cattle on grass forages. The differences
80
between methods of forage-finishing in the present study though, suggest that grass silage
finishing could be a method of invoking a stronger beef flavour.
The effects of postmortem ageing on shear force values for steaks cut from steers raised
in KAP are presented in Table 19. Similar to data from NLARS, shear force values for both LM
and ST steaks decreased considerably with postmortem aging. Steaks aged for 7 d had greater
SF values than 14 and 21 d aged steaks (P < 0.0001, Contrast 1); while 21 d aged steaks had
lower SF (P < 0.0001, Contrast 2) than steaks aged for 14 d.
There were no breed (P ≥ 0.12) differences for tenderness attributes (including shear
force of LM and ST), initial juiciness, beef and grassy flavours, flavour desirability, and overall
acceptability (Table 20). Off flavour tended to be greater (P < 0.10) in Hereford beef while the
taste panel found Hereford beef to be more juicy (P < 0.03) than Angus beef. The similar results
for taste were not surprising, as it has been shown that these two breeds score similarly in terms
of taste preference and shear force when compared (Moore et al., 1978). However, Glimp et al.
(1971) found Angus LM steaks to be more tender (as measured by Warner-Bratzler shear force
and a trained taste panel).
81
3.5 CONCLUSION
The objective of this study was to investigate the effects of forage-finishing (method and
forage species) and breed on growth performance, carcass quality, meat quality, and fatty acid
composition relative to grain-finished beef. Extensive work has been conducted in the past
investigating forage-finishing but no study, to the best of our knowledge, has concurrently
compared all three methods of forage-finishing (pasture, silage, and hay) vs. grain-finishing
while also examining cattle breed differences. Two different forages were examined in the study
but since they were evaluated at different locations, the forages cannot be directly compared.
Therefore, this study may provide the North American beef industry with a more complete
understanding of the many factors affecting the viability of a forage-finishing system for beef
cattle.
As was expected, growth performance traits were negatively affected by forage-finishing
when compared to grain-finishing. With both forages investigated, grain-finishing resulted in
superior growth (final body weight, total gain, ADG, DMI) and increased efficiency (lower feed:
gain) vs. forage-finishing. When evaluating forage-finishing with grasses, pasture finishing
increased gains vs. feeding conserved forages. This is most likely due to the poor quality of the
grass hay used in the study which produced lower feed intake and corresponding gains, and poor
feed efficiency versus finishing cattle with grass silage. When evaluating forage-finishing, alfalfa
pasture finishing tended to increase gains vs. feeding conserved forages similar to the findings
feeding grasses. Growth performance decreased for cattle-finished on alfalfa hay vs. cattle
finished with alfalfa silage.
Forage-finishing (using alfalfa or grasses) produced carcasses of lighter weight and less
backfat than grain-finishing. Lean yield was greater for forage-finished carcasses while

82
intramuscular fat content was greater for grain-finished carcasses. However, this did not
translate into a difference in marbling scores between grain-finished cattle and cattle forage
finished on alfalfa.
A commonly reported problem with forage-finishing is the presence of yellow
subcutaneous fat which can result in potential downgrading of carcasses. The yellow fat color is
due to greater amounts of beta carotene in forages vs. grains. Alfalfa-finishing resulted in
subcutaneous fat that was more yellow when compared to grain-finished beef. Grass finishing
regimens, similarly, trended to yellower fat colour than grain-finishing. Method of forage-
finishing using alfalfa affected the presence of yellow fat color with greater values for
yellowness for pasture-finished carcasses vs. carcasses from beef fed conserved alfalfa. Forage-
finishing can also affect the colour of lean tissue with darker coloured lean a common effect of
forage-finishing. Meat colour was darker for steers forage-finished with grasses compared to
grain-finished beef. Lean colour was not affected by forage-finishing with alfalfa. Lipid
oxidation was evaluated in a shelf life study. While forage-finishing with grasses increased lipid
stability when compared to grain-finishing; forage-finishing with alfalfa increased lipid
peroxidation.
Fatty acid content of the intramuscular lipid fraction was significantly impacted by the
MR evaluated in this project. Forage-finishing with alfalfa decreased concentrations of palmitic
acid, palmitoleic acid, and oleic acid while increasing stearic acid vs. grain-finished beef.
Forage-finishing with grasses also decreased concentrations of palmitoleic acid, and oleic acid
while increasing stearic acid vs. grain-finished beef. While forage-finishing with alfalfa
increased linoleic acid content vs. grain-finishing, this was not the case when cattle were forage-
finished with grasses.. Alpha-linolenic acid, an important omega 3 fatty acid, was deposited at
83
higher concentrations in forage-finished beef regardless if alfalfa or grasses were fed. Forage-
finishing with alfalfa did not affect the conjugated linoleic acid content of beef while forage-
finishing with grasses increased concentration of cis-9, trans-11 CLA when compared to grain-
finishing. Grain-finishing increased concentrations of total monounsaturated fatty acid and
decreased concentrations of polyunsaturated fatty acid and omega-3 fatty acids vs. forage-
finishing. While the PUFA/SFA ratio of forage-finished beef was greater than grain-finished
beef, the converse was true for the omega 6/ omega 3 fatty acid ratio.
Forage-finishing with alfalfa tended to decrease “tenderness” ratings vs. grain-finished
beef as measured by a trained taste panel. This contrasts similar tenderness ratings when grain-
finished beef is compared to beef forage-finished with grasses. Taste panel ratings for beef
flavour, flavour desirability, and overall acceptability were greater for grain vs. forage-finished
beef. Despite the greater IMF content in grain-finished beef, juiciness ratings were not affected
when compared to forage-finishing.
There were generally no breed differences for most growth performance, carcass, and
meat quality traits apart from TBARS values which varied in differences between the two
locations. Fatty acid composition and palatability attributes were also similar between breeds.
Ultimately, the results of this study provide a more comprehensive understanding of the
effects of forage-finishing beef cattle on performance and meat quality in North America.
Growth performance and carcass traits were generally diminished as a result of forages (either
alfalfa or grass). Forage-finishing did produce a more yellow subcutaneous fat, as well as a
darker lean tissue although this was only the case for grass forage-finishing. Both grass and
alfalfa-finishing produced beneficial effects on the fatty acid composition of beef with increased
84
conjugated linoleic acids and omega 3 fatty acids such as alpha linolenic acid. A trained taste
panel rated grain-finished beef as having a more desirable and beefy flavour when compared to
forage finishing. Generally, method of forage-finishing had few effects besides the poorer
growth associated with conserved forages (and specifically, the hay MR). Angus and Hereford
steers both produce similar results for growth, carcass, sensory, and fatty acid traits when forage-
finished.

85
Table 1: Nutritional Composition of Diets (DM basis)
Diet Composition Data for Cattle Managed at NLARS with Forage Finishing Using
Alfalfa
Management Regimen
z
Component
TMRy
(Grain)
Alfalfa
Pasture Alfalfa Hay
Alfalfa
Silage
Dry Matter (%) 89.5 30.1 92.6 52.0
Net Energy (Mcal/ kg) 1.63 0.94 0.81 0.88
TDNx (%) 86.1 64.6 65.3 62.8
Crude Protein (%) 12.4 18.6 13.4 17.5
NDFw (%) 21.6 37.8 46.5 39.1
ADFv (%) 10.7 28.3 26.8 32.1
Cau (%) 0.58 1.68 1.52 1.87
Pt (%) 0.33 0.25 0.21 0.28
Composition Data for Cattle Managed at KAP with Forage Finishing Using Grasses
Management Regimen
s
Component
TMRy
(Grain)
Grass
Pasture Grass Hay Grass Silage
Dry Matter (%) 89.6 28.0 89.5 23.5
Net Energy (Mcal/ kg) 1.66 0.92 0.95 0.86
TDNx (%) 87.0 63.9 64.9 62.3
Crude Protein (%) 13.1 11.9 9.7 16.1
NDFw (%) 18.1 54.1 53.9 53.0
ADFv (%) 9.8 31.3 32.1 34.7
Cau (%) 0.61 0.45 0.44 0.43
Pt (%) 0.33 0.28 0.24 0.32
zManagement Regimen includes cattle finished on a high grain diet (Corn) or forage-
finished on Alfalfa Pasture, Alfalfa Hay, or Alfalfa Silage.
yTotal mixed ration (High grain diet).
xTotal digestible.
wNeutral detergent fibre.
vAcid detergent fibre.
uCalcium.
tPhosphorus.
sManagement Regimen includes cattle finished on a high grain diet (Corn) or forage-
finished on Grass Pasture, Grass Hay, or Grass Silage.

86
Table 2: Fatty Acid Legend with Common Names and Chemical Names for Individual Fatty acids and Classes
of Fatty Acids
Short-Hand Common Name Chemical Name
C14:0 Myristic Acid Tetradecanoic Acid
C16:0 Palmitic Acid Hexadecanoic Acid
C16:1 Palmitoleic acid (Z)-9-hexadecenoic Acid
C17:0 Margaric Acid Heptadecanoic Acid
C18:0 Stearic Acid Octadecanoic acid
C18:1tv Trans-vaccenic acid (E)-11-octadecenoic acid
C18:1o Oleic acid 9-octadecenoic acid
C18:1v Vaccenic acid (Z)-11-octadecenoic acid
C18:2 linoleic acid all-cis-9,12-octadecadienoic acid
C18:3g Gamma-Linolenic acid all-cis-6,9,12-octadecatrienoic acid
C18:3a Alpha-Linolenic Acid all-cis-9,12,15-octadecatrienoic acid
C20:0 Arachidic Acid Eicosanoic acid
CLA 9 11 Cis-9, trans-11 Conjugate Linoleic Acid
CLA 10 12 Trans-10, cis-12 Conjugated Linoleic Acid
C20:1 Eicosenoic Acid 11-eicosenoic acid
C20:2 Eicosodienoic Acid all-cis-11,14-eicosadienoic acid
C20:3 Dihomo-gamma-linolenic acid all-cis-8,11,14-eicosatrienoic acid
C20:4 Eicosatetraenoic acid all-cis-8,11,14,17-eicosatetraenoic acid
C20:3b Eicosatrienoic acid all-cis-11,14,17-eicosatrienoic acid
C22:0 Behenic Acid Docosanoic acid
C20:5 Eicosopentaenoic acid all-cis-5,8,11,14,17-eicosapentaenoic acid
C22:4 Adrenic acid all-cis-7,10,13,16-docosatetraenoic acid
C22:5 Docosopentaenoic acid all-cis-4,7,10,13,16-docosapentaenoic acid
C22:6 Docosohexaenoic acid all-cis-4,7,10,13,16,19-docosahexaenoic acid
SFA Saturated Fatty acids (total)
MUFA Mono-unsaturated Fatty Acids (total)
PUFA Poly-unsaturated Fatty Acids (total)
n-6 fatty acids Omega 6 Fatty acids
n-3 fatty acids Omega 3 Fatty acids
n-6:n-3 ratio Ratio of Omega 6 to Omega 3 Fatty acids
PUFA:SFA
ratio
Ratio of Poly-unsaturated Fatty acids to
saturated fatty acids
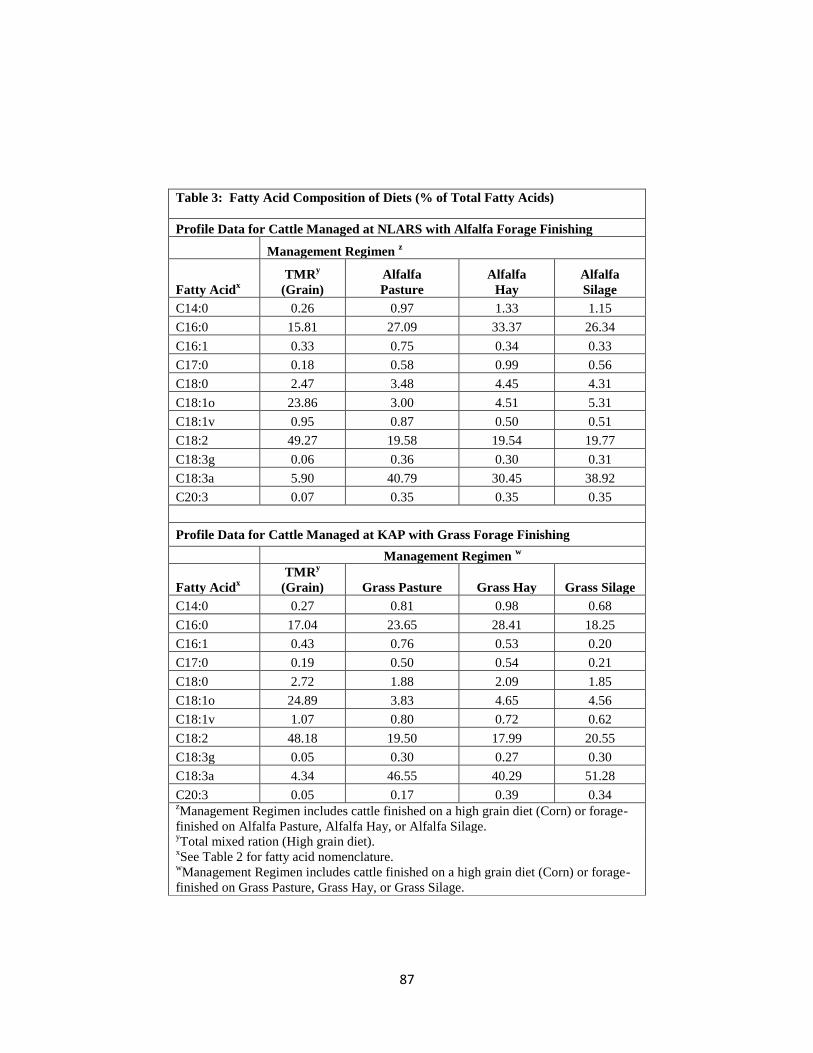
87
Table 3: Fatty Acid Composition of Diets (% of Total Fatty Acids)
Profile Data for Cattle Managed at NLARS with Alfalfa Forage Finishing
Management Regimen z
Fatty Acidx
TMRy
(Grain)
Alfalfa
Pasture
Alfalfa
Hay
Alfalfa
Silage
C14:0 0.26 0.97 1.33 1.15
C16:0 15.81 27.09 33.37 26.34
C16:1 0.33 0.75 0.34 0.33
C17:0 0.18 0.58 0.99 0.56
C18:0 2.47 3.48 4.45 4.31
C18:1o 23.86 3.00 4.51 5.31
C18:1v 0.95 0.87 0.50 0.51
C18:2 49.27 19.58 19.54 19.77
C18:3g 0.06 0.36 0.30 0.31
C18:3a 5.90 40.79 30.45 38.92
C20:3 0.07 0.35 0.35 0.35
Profile Data for Cattle Managed at KAP with Grass Forage Finishing
Management Regimen w
Fatty Acidx
TMRy
(Grain) Grass Pasture Grass Hay Grass Silage
C14:0 0.27 0.81 0.98 0.68
C16:0 17.04 23.65 28.41 18.25
C16:1 0.43 0.76 0.53 0.20
C17:0 0.19 0.50 0.54 0.21
C18:0 2.72 1.88 2.09 1.85
C18:1o 24.89 3.83 4.65 4.56
C18:1v 1.07 0.80 0.72 0.62
C18:2 48.18 19.50 17.99 20.55
C18:3g 0.05 0.30 0.27 0.30
C18:3a 4.34 46.55 40.29 51.28
C20:3 0.05 0.17 0.39 0.34 zManagement Regimen includes cattle finished on a high grain diet (Corn) or forage-
finished on Alfalfa Pasture, Alfalfa Hay, or Alfalfa Silage.
yTotal mixed ration (High grain diet).
xSee Table 2 for fatty acid nomenclature.
wManagement Regimen includes cattle finished on a high grain diet (Corn) or forage-
finished on Grass Pasture, Grass Hay, or Grass Silage.

88
Table 4. Management Regimen Effects on Growth Performance Traits When Cattle are Forage-Finished on Alfalfa
Management Regimen
z
Contrastsy
Trait Covariatex Corn
Alfalfa
Pasture
Alfalfa
Hay
Alfalfa
Silage SE P-value
Contrast 1:
Corn vs.
Forages
Contrast 2:
Pasture vs.
Conserved
Contrast 3:
Hay vs. Silage
Initial Body
Weight (kg) None
411.2 407.7 422.5 413.0 12.99 0.842 0.811 0.668 0.532
Final body
weight (kg) WtSOT 602.0 539.0 499.2 528.4 7.40 <0.0001 <0.0001 0.085 0.007
Total Gain (kg) None 188.2 125.2 85.3 114.6 7.23 <0.0001 <0.0001 0.075 0.005
Time on Feed
(days) WtSOT 112.6 111.1 115.0 112.9 1.35 0.349 0.805 0.239 0.229
Average Daily
Gain (kg/d) WtSOT 1.83 1.14 0.74 1.02 0.072 <0.0001 <0.0001 0.078 0.008
DMIw(kg/d) None 11.2 N/A
u 9.1 10.5 0.27 0.001 0.0011
t N/A
s 0.007
DMIw, % BW
v WtSOT 2.21 N/A
u 1.99 2.16 0.053 0.028 0.1175
t N/A
s 0.02
Feed to gain WtSOT 6.18 N/Au 13.00 9.67 0.457 <0.0001 <0.0001
t N/A
s 0.001
zManagement Regimen includes cattle finished on a high grain diet (Corn) or forage-finished on Alfalfa Pasture, Alfalfa Hay, or Alfalfa Silage.
yContrasts include Contrast 1: cattle fed the high grain diet vs. forage-finishing; Contrast 2: Comparison of pasture-finished cattle vs. cattle forage-
finished on conserved forages (silage, hay); Contrast 3: Comparison of cattle forage-finished on hay vs. cattle forage-finished on silage. x Covariate: Body weight at start of test (WtSOT) was tested in the model for growth performance traits and was included in the final model when
significant at P < 0.10. Traits without a covariate remaining in the final model are labeled None. wDMI = Dry matter intake.
v % BW = percentage of body weight.
uNo intake data was collected for pasture fed steers.
t Contrast was performed comparing the high grain diet (Corn) versus cattle forage-finished on Alfalfa Hay and Alfalfa Silage as Alfalfa Pasture data
was not available. sNot applicable as data not available for pasture-fed steers.
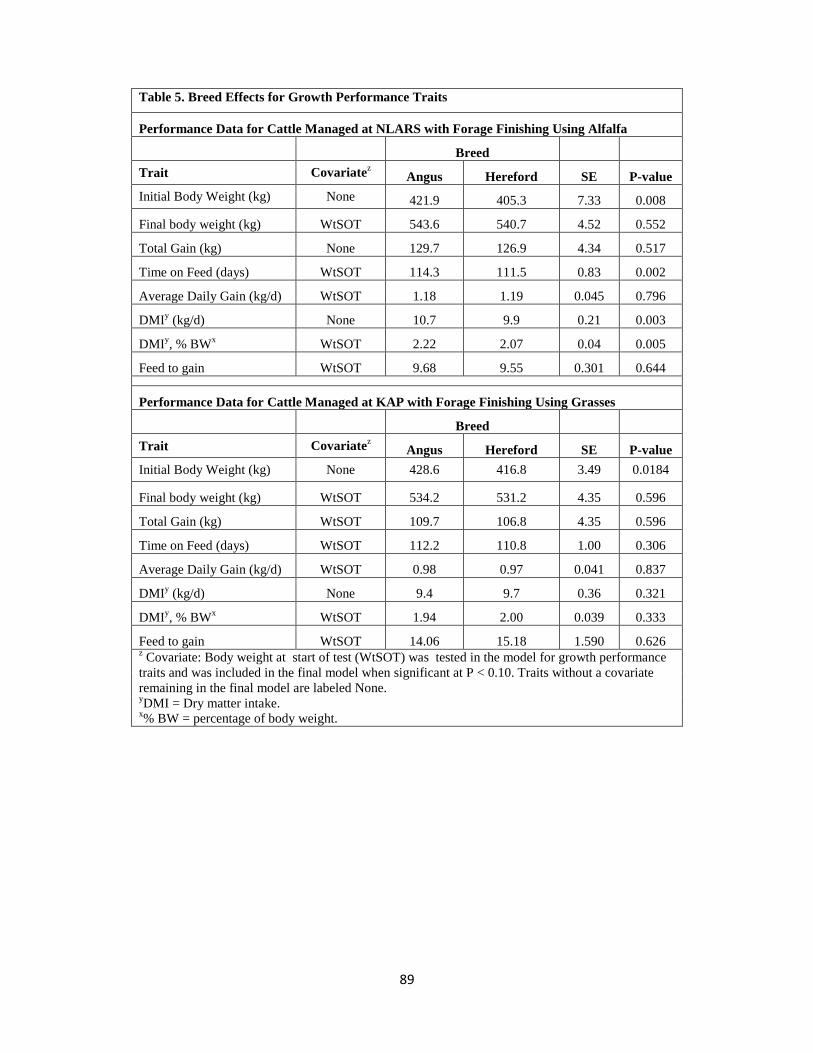
89
Table 5. Breed Effects for Growth Performance Traits
Performance Data for Cattle Managed at NLARS with Forage Finishing Using Alfalfa
Breed
Trait Covariatez Angus Hereford SE P-value
Initial Body Weight (kg) None 421.9 405.3 7.33 0.008
Final body weight (kg) WtSOT 543.6 540.7 4.52 0.552
Total Gain (kg) None 129.7 126.9 4.34 0.517
Time on Feed (days) WtSOT 114.3 111.5 0.83 0.002
Average Daily Gain (kg/d) WtSOT 1.18 1.19 0.045 0.796
DMIy (kg/d) None 10.7 9.9 0.21 0.003
DMIy, % BW
x WtSOT 2.22 2.07 0.04 0.005
Feed to gain WtSOT 9.68 9.55 0.301 0.644
Performance Data for Cattle Managed at KAP with Forage Finishing Using Grasses
Breed
Trait Covariatez Angus Hereford SE P-value
Initial Body Weight (kg) None 428.6 416.8 3.49 0.0184
Final body weight (kg) WtSOT 534.2 531.2 4.35 0.596
Total Gain (kg) WtSOT 109.7 106.8 4.35 0.596
Time on Feed (days) WtSOT 112.2 110.8 1.00 0.306
Average Daily Gain (kg/d) WtSOT 0.98 0.97 0.041 0.837
DMIy (kg/d) None 9.4 9.7 0.36 0.321
DMIy, % BW
x WtSOT 1.94 2.00 0.039 0.333
Feed to gain WtSOT 14.06 15.18 1.590 0.626 z Covariate: Body weight at start of test (WtSOT) was tested in the model for growth performance
traits and was included in the final model when significant at P < 0.10. Traits without a covariate
remaining in the final model are labeled None. yDMI = Dry matter intake.
x% BW = percentage of body weight.
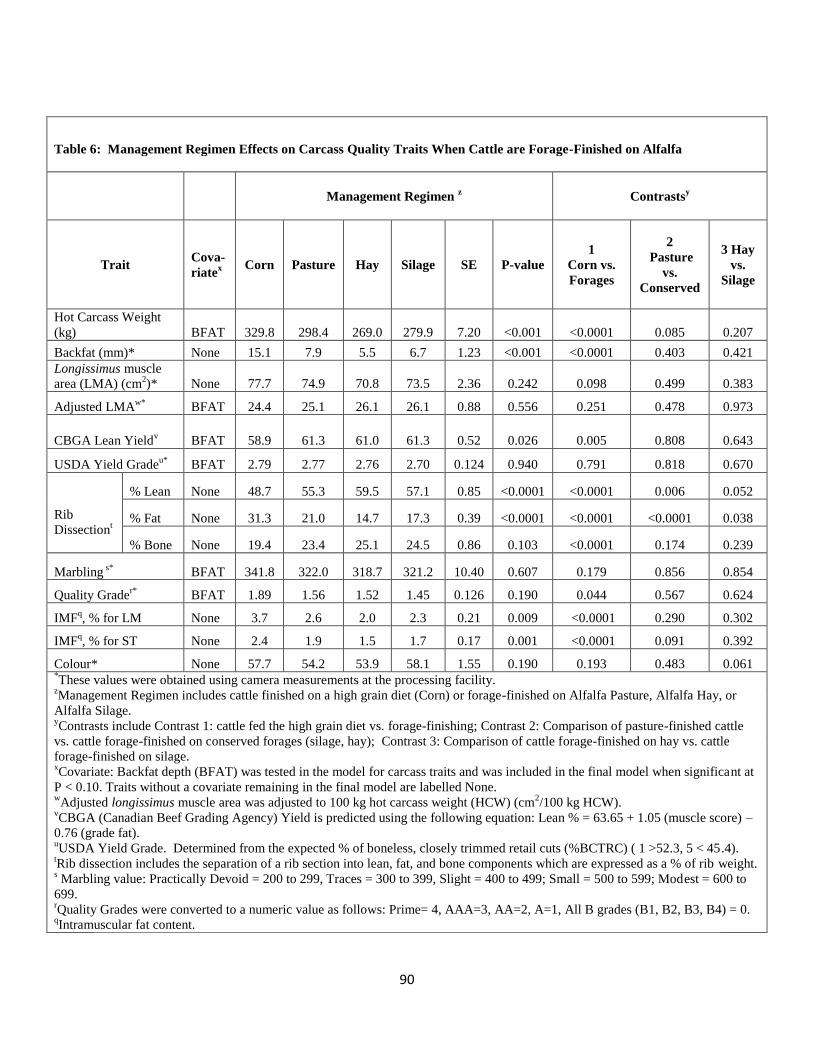
90
Table 6: Management Regimen Effects on Carcass Quality Traits When Cattle are Forage-Finished on Alfalfa
Management Regimen z Contrasts
y
Trait Cova-
riatex
Corn Pasture Hay Silage SE P-value
1
Corn vs.
Forages
2
Pasture
vs.
Conserved
3 Hay
vs.
Silage
Hot Carcass Weight
(kg) BFAT 329.8 298.4 269.0 279.9 7.20 <0.001 <0.0001 0.085 0.207
Backfat (mm)* None 15.1 7.9 5.5 6.7 1.23 <0.001 <0.0001 0.403 0.421
Longissimus muscle
area (LMA) (cm2)* None 77.7 74.9 70.8 73.5 2.36 0.242 0.098 0.499 0.383
Adjusted LMAw*
BFAT 24.4 25.1 26.1 26.1 0.88 0.556 0.251 0.478 0.973
CBGA Lean Yieldv BFAT 58.9 61.3 61.0 61.3 0.52 0.026 0.005 0.808 0.643
USDA Yield Gradeu*
BFAT 2.79 2.77 2.76 2.70 0.124 0.940 0.791 0.818 0.670
Rib
Dissectiont
% Lean None 48.7 55.3 59.5 57.1 0.85 <0.0001 <0.0001 0.006 0.052
% Fat None 31.3 21.0 14.7 17.3 0.39 <0.0001 <0.0001 <0.0001 0.038
% Bone None 19.4 23.4 25.1 24.5 0.86 0.103 <0.0001 0.174 0.239
Marbling s*
BFAT 341.8 322.0 318.7 321.2 10.40 0.607 0.179 0.856 0.854
Quality Grader*
BFAT 1.89 1.56 1.52 1.45 0.126 0.190 0.044 0.567 0.624
IMFq, % for LM None 3.7 2.6 2.0 2.3 0.21 0.009 <0.0001 0.290 0.302
IMFq, % for ST None 2.4 1.9 1.5 1.7 0.17 0.001 <0.0001 0.091 0.392
Colour* None 57.7 54.2 53.9 58.1 1.55 0.190 0.193 0.483 0.061 *These values were obtained using camera measurements at the processing facility.
zManagement Regimen includes cattle finished on a high grain diet (Corn) or forage-finished on Alfalfa Pasture, Alfalfa Hay, or
Alfalfa Silage. yContrasts include Contrast 1: cattle fed the high grain diet vs. forage-finishing; Contrast 2: Comparison of pasture-finished cattle
vs. cattle forage-finished on conserved forages (silage, hay); Contrast 3: Comparison of cattle forage-finished on hay vs. cattle
forage-finished on silage. xCovariate: Backfat depth (BFAT) was tested in the model for carcass traits and was included in the final model when significant at
P < 0.10. Traits without a covariate remaining in the final model are labelled None. wAdjusted longissimus muscle area was adjusted to 100 kg hot carcass weight (HCW) (cm
2/100 kg HCW).
vCBGA (Canadian Beef Grading Agency) Yield is predicted using the following equation: Lean % = 63.65 + 1.05 (muscle score) –
0.76 (grade fat). uUSDA Yield Grade. Determined from the expected % of boneless, closely trimmed retail cuts (%BCTRC) ( 1 >52.3, 5 < 45.4).
tRib dissection includes the separation of a rib section into lean, fat, and bone components which are expressed as a % of rib weight.
s Marbling value: Practically Devoid = 200 to 299, Traces = 300 to 399, Slight = 400 to 499; Small = 500 to 599; Modest = 600 to
699. rQuality Grades were converted to a numeric value as follows: Prime= 4, AAA=3, AA=2, A=1, All B grades (B1, B2, B3, B4) = 0.
qIntramuscular fat content.

91
Table 7: Breed Effects on Carcass Characteristics When Cattle are Forage-Finished
on Alfalfa
Breed
Trait Covariatez Angus Hereford SE P-value
Hot Carcass Weight
(kg) BFAT 301.7 286.9 3.95 <0.0001
Backfat (mm)* None 8.6 9.0 0.73 0.613
Longissimus muscle
area (LMA) (cm2)* None 76.5 71.9 1.47 0.008
Adjusted LMAy*
BFAT 25.44 25.37 0.504 0.899
CBGA Lean Yieldx BFAT 60.4 60.9 0.32 0.300
USDA Yield Gradew*
BFAT 2.71 2.79 0.071 0.327
Rib
Dissectionv
% Lean None 55.7 54.6 0.60 0.184
% Fat None 20.7 21.4 0.26 0.379
% Bone None 22.7 23.4 0.61 0.056
Marbling u*
BFAT 337.6 314.2 6.37 0.011
Quality Gradet*
BFAT 1.70 1.51 0.077 0.091
IMFs, % for LM None 2.8 2.5 0.13 0.083
IMFs, % for ST None 1.8 1.9 0.12 0.511
Colour* None 56.8 55.2 0.97 0.171 *These values were obtained using camera measurements at the processing facility.
zCovariate: Backfat depth (BFAT) was tested in the model for carcass traits and was
included in the final model when significant at P < 0.10. Traits without a covariate
remaining in the final model are labeled None. yAdjusted longissimus muscle area was adjusted to 100 kg hot carcass weight (HCW)
(cm2/100 kg HCW).
xCBGA (Canadian Beef Grading Agency) Yield is predicted using the following equation:
Lean % = 63.65 + 1.05 (muscle score) – 0.76 (grade fat). wUSDA Yield Grade. Determined from the expected % of boneless, closely trimmed retail
cuts (%BCTRC) ( 1 >52.3, 5 < 45.4). vRib dissection includes the separation of a rib section into lean, fat, and bone components
which are expressed as a % of rib weight.
uMarbling value: Practically Devoid = 200 to 299, Traces = 300 to 399, Slight = 400 to 499;
Small = 500 to 599; Modest = 600 to 699. tQuality Grades were converted to a numeric value as follows: Prime= 4, AAA=3, AA=2,
A=1, All B grades (B1, B2, B3, B4) = 0. sIntramuscular fat content.
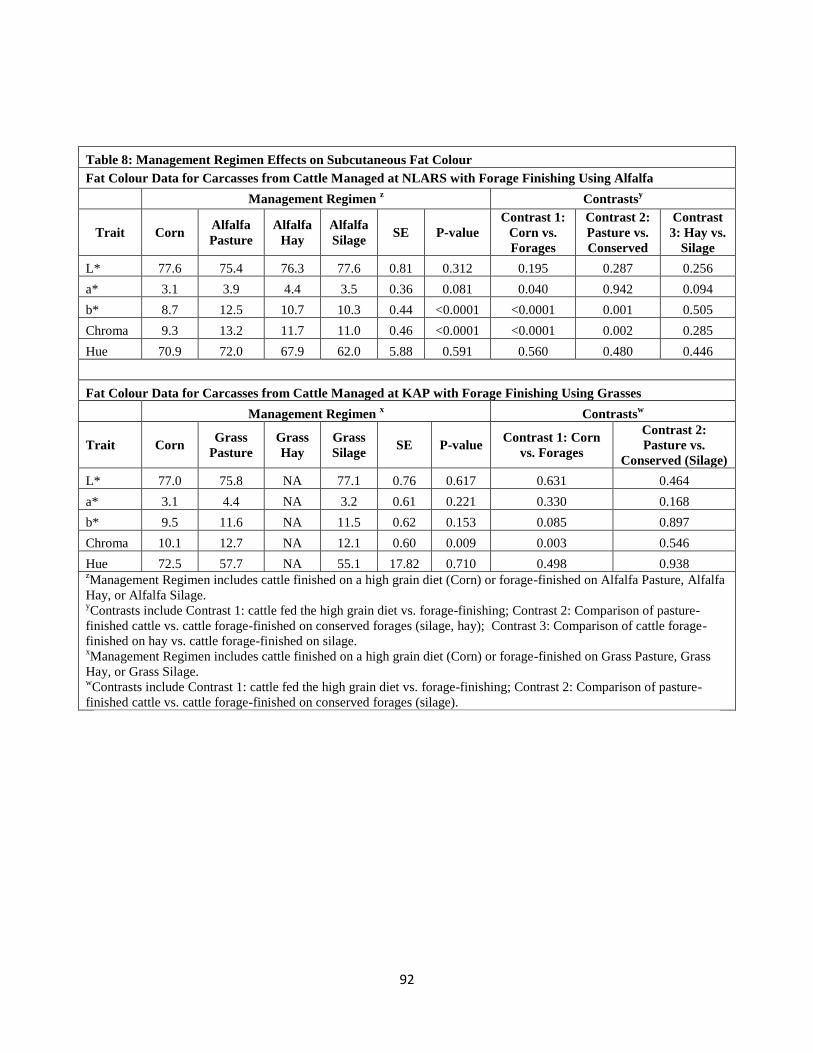
92
Table 8: Management Regimen Effects on Subcutaneous Fat Colour
Fat Colour Data for Carcasses from Cattle Managed at NLARS with Forage Finishing Using Alfalfa
Management Regimen z Contrasts
y
Trait Corn Alfalfa
Pasture
Alfalfa
Hay
Alfalfa
Silage SE P-value
Contrast 1:
Corn vs.
Forages
Contrast 2:
Pasture vs.
Conserved
Contrast
3: Hay vs.
Silage
L*
77.6 75.4 76.3 77.6 0.81 0.312 0.195 0.287 0.256
a* 3.1 3.9 4.4 3.5 0.36 0.081 0.040 0.942 0.094
b* 8.7 12.5 10.7 10.3 0.44 <0.0001 <0.0001 0.001 0.505
Chroma 9.3 13.2 11.7 11.0 0.46 <0.0001 <0.0001 0.002 0.285
Hue 70.9 72.0 67.9 62.0 5.88 0.591 0.560 0.480 0.446
Fat Colour Data for Carcasses from Cattle Managed at KAP with Forage Finishing Using Grasses
Management Regimen x Contrasts
w
Trait Corn Grass
Pasture
Grass
Hay
Grass
Silage SE P-value
Contrast 1: Corn
vs. Forages
Contrast 2:
Pasture vs.
Conserved (Silage)
L* 77.0 75.8 NA 77.1 0.76 0.617 0.631 0.464
a* 3.1 4.4 NA 3.2 0.61 0.221 0.330 0.168
b* 9.5 11.6 NA 11.5 0.62 0.153 0.085 0.897
Chroma 10.1 12.7 NA 12.1 0.60 0.009 0.003 0.546
Hue 72.5 57.7 NA 55.1 17.82 0.710 0.498 0.938 zManagement Regimen includes cattle finished on a high grain diet (Corn) or forage-finished on Alfalfa Pasture, Alfalfa
Hay, or Alfalfa Silage. yContrasts include Contrast 1: cattle fed the high grain diet vs. forage-finishing; Contrast 2: Comparison of pasture-
finished cattle vs. cattle forage-finished on conserved forages (silage, hay); Contrast 3: Comparison of cattle forage-
finished on hay vs. cattle forage-finished on silage.
xManagement Regimen includes cattle finished on a high grain diet (Corn) or forage-finished on Grass Pasture, Grass
Hay, or Grass Silage. wContrasts include Contrast 1: cattle fed the high grain diet vs. forage-finishing; Contrast 2: Comparison of pasture-
finished cattle vs. cattle forage-finished on conserved forages (silage).
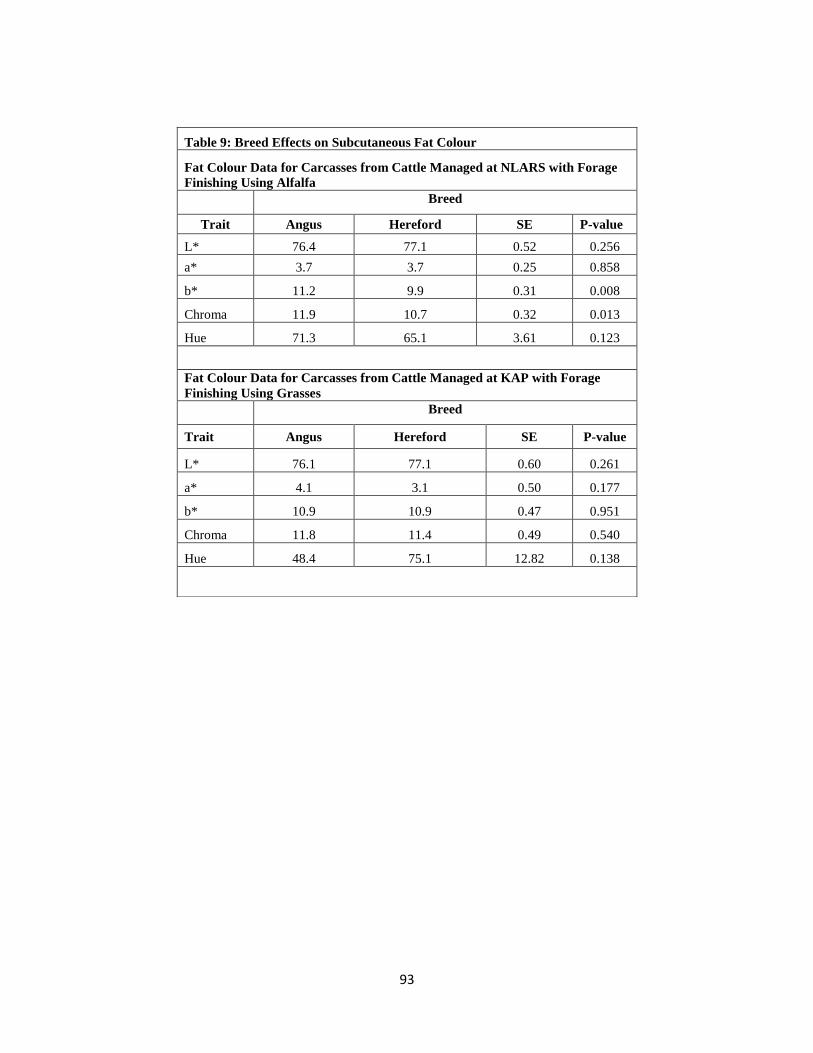
93
Table 9: Breed Effects on Subcutaneous Fat Colour
Fat Colour Data for Carcasses from Cattle Managed at NLARS with Forage
Finishing Using Alfalfa
Breed
Trait Angus Hereford SE P-value
L* 76.4 77.1 0.52 0.256
a* 3.7 3.7 0.25 0.858
b* 11.2 9.9 0.31 0.008
Chroma 11.9 10.7 0.32 0.013
Hue 71.3 65.1 3.61 0.123
Fat Colour Data for Carcasses from Cattle Managed at KAP with Forage
Finishing Using Grasses
Breed
Trait Angus Hereford SE P-value
L* 76.1 77.1 0.60 0.261
a* 4.1 3.1 0.50 0.177
b* 10.9 10.9 0.47 0.951
Chroma 11.8 11.4 0.49 0.540
Hue 48.4 75.1 12.82 0.138
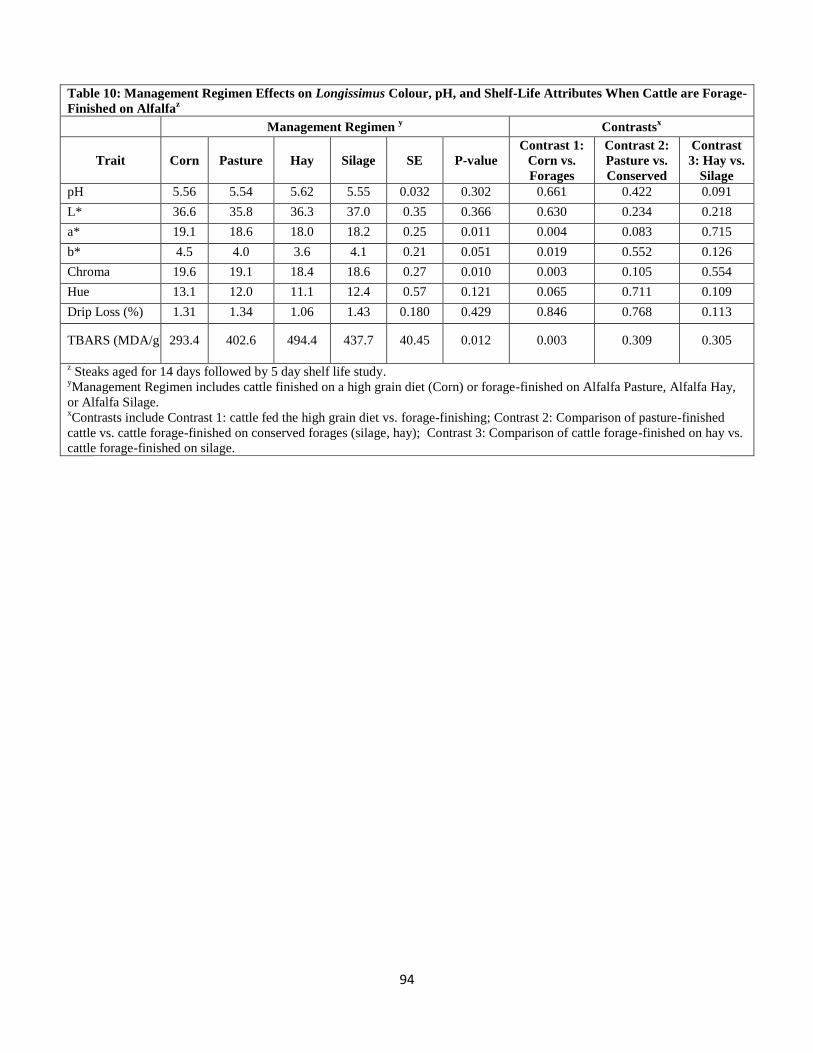
94
Table 10: Management Regimen Effects on Longissimus Colour, pH, and Shelf-Life Attributes When Cattle are Forage-
Finished on Alfalfaz
Management Regimen y Contrasts
x
Trait Corn Pasture Hay Silage SE P-value
Contrast 1:
Corn vs.
Forages
Contrast 2:
Pasture vs.
Conserved
Contrast
3: Hay vs.
Silage
pH 5.56 5.54 5.62 5.55 0.032 0.302 0.661 0.422 0.091
L* 36.6 35.8 36.3 37.0 0.35 0.366 0.630 0.234 0.218
a* 19.1 18.6 18.0 18.2 0.25 0.011 0.004 0.083 0.715
b* 4.5 4.0 3.6 4.1 0.21 0.051 0.019 0.552 0.126
Chroma 19.6 19.1 18.4 18.6 0.27 0.010 0.003 0.105 0.554
Hue 13.1 12.0 11.1 12.4 0.57 0.121 0.065 0.711 0.109
Drip Loss (%)
1.31 1.34 1.06 1.43 0.180 0.429 0.846 0.768 0.113
TBARS (MDA/g) 293.4 402.6 494.4 437.7 40.45 0.012 0.003 0.309 0.305
z Steaks aged for 14 days followed by 5 day shelf life study.
yManagement Regimen includes cattle finished on a high grain diet (Corn) or forage-finished on Alfalfa Pasture, Alfalfa Hay,
or Alfalfa Silage. xContrasts include Contrast 1: cattle fed the high grain diet vs. forage-finishing; Contrast 2: Comparison of pasture-finished
cattle vs. cattle forage-finished on conserved forages (silage, hay); Contrast 3: Comparison of cattle forage-finished on hay vs.
cattle forage-finished on silage.

95
Table 11: Management Regimen Effects on Semitendinosus Muscle Colour, pH, and Shelf-Life Attributes When Cattle
are Forage-Finished on Alfalfaz
Management Regimen y Contrasts
x
Trait Corn Pasture Hay Silage SE P-
value
Contrast 1:
Corn vs.
Forages
Contrast 2:
Pasture vs.
Conserved
Contrast
3: Hay vs.
Silage
pH 5.50 5.49 5.51 5.51 0.044 0.988 0.962 0.762 0.992
L* 39.3 38.1 39.0 38.7 0.46 0.279 0.158 0.192 0.711
a* 21.1 20.7 19.8 19.6 0.41 0.069 0.031 0.179 0.734
b* 7.0 6.5 5.7 5.8 0.28 0.004 0.002 0.037 0.979
Chroma 22.2 21.7 20.7 20.5 0.42 0.051 0.018 0.164 0.814
Hue 18.3 17.4 15.8 16.1 0.71 0.052 0.022 0.112 0.781
Drip Loss (%)
0.94 1.20 0.90 1.04 0.096 0.151 0.342 0.061 0.314
TBARS (ng
MDA/g)
409.9 497.8 637.6 527.6 34.85 0.003 0.004 0.053 0.031
z Steaks aged for 14 days followed by 5 day shelf life study.
yManagement Regimen includes cattle finished on a high grain diet (Corn) or forage-finished on Alfalfa Pasture, Alfalfa Hay, or
Alfalfa Silage. xContrasts include Contrast 1: cattle fed the high grain diet vs. forage-finishing; Contrast 2: Comparison of pasture-finished
cattle vs. cattle forage-finished on conserved forages (silage, hay); Contrast 3: Comparison of cattle forage-finished on hay vs.
cattle forage-finished on silage.
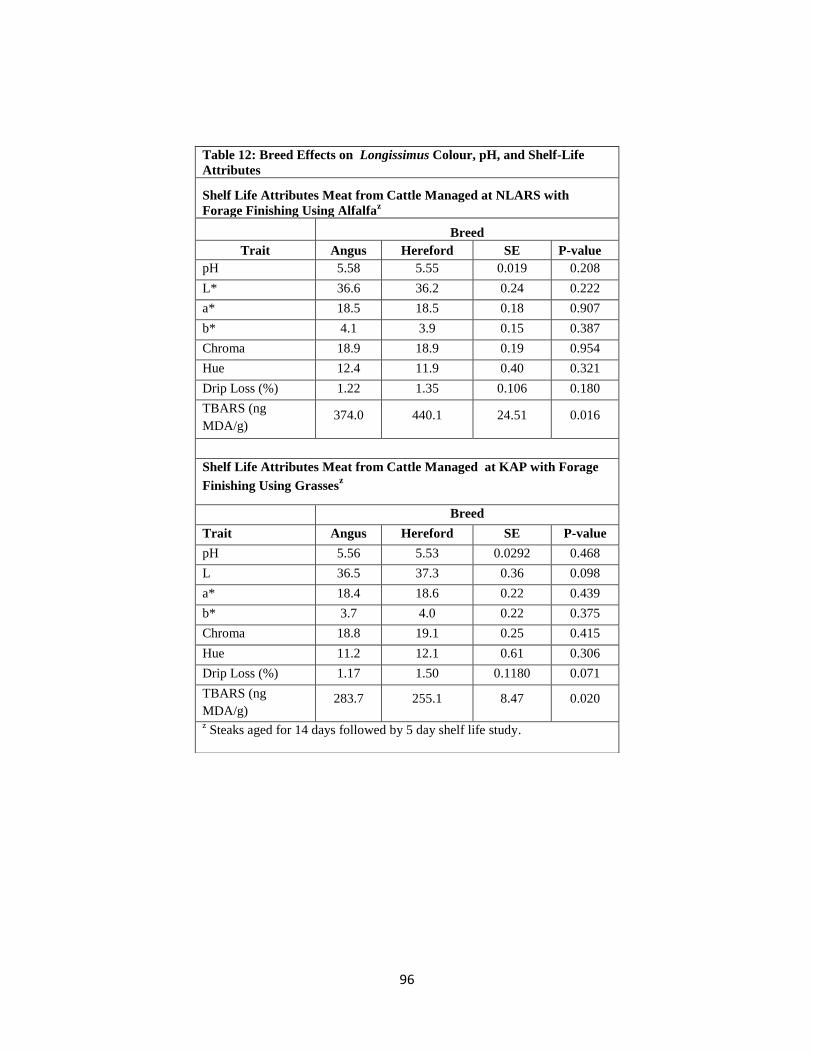
96
Table 12: Breed Effects on Longissimus Colour, pH, and Shelf-Life
Attributes
Shelf Life Attributes Meat from Cattle Managed at NLARS with
Forage Finishing Using Alfalfaz
Breed
Trait Angus Hereford SE P-value
pH 5.58 5.55 0.019 0.208
L* 36.6 36.2 0.24 0.222
a* 18.5 18.5 0.18 0.907
b* 4.1 3.9 0.15 0.387
Chroma 18.9 18.9 0.19 0.954
Hue 12.4 11.9 0.40 0.321
Drip Loss (%)
1.22 1.35 0.106 0.180
TBARS (ng
MDA/g)
374.0 440.1 24.51 0.016
Shelf Life Attributes Meat from Cattle Managed at KAP with Forage
Finishing Using Grassesz
Breed
Trait Angus Hereford SE P-value
pH 5.56 5.53 0.0292 0.468
L 36.5 37.3 0.36 0.098
a* 18.4 18.6 0.22 0.439
b* 3.7 4.0 0.22 0.375
Chroma 18.8 19.1 0.25 0.415
Hue 11.2 12.1 0.61 0.306
Drip Loss (%) 1.17 1.50 0.1180 0.071
TBARS (ng
MDA/g) 283.7 255.1 8.47 0.020
z Steaks aged for 14 days followed by 5 day shelf life study.
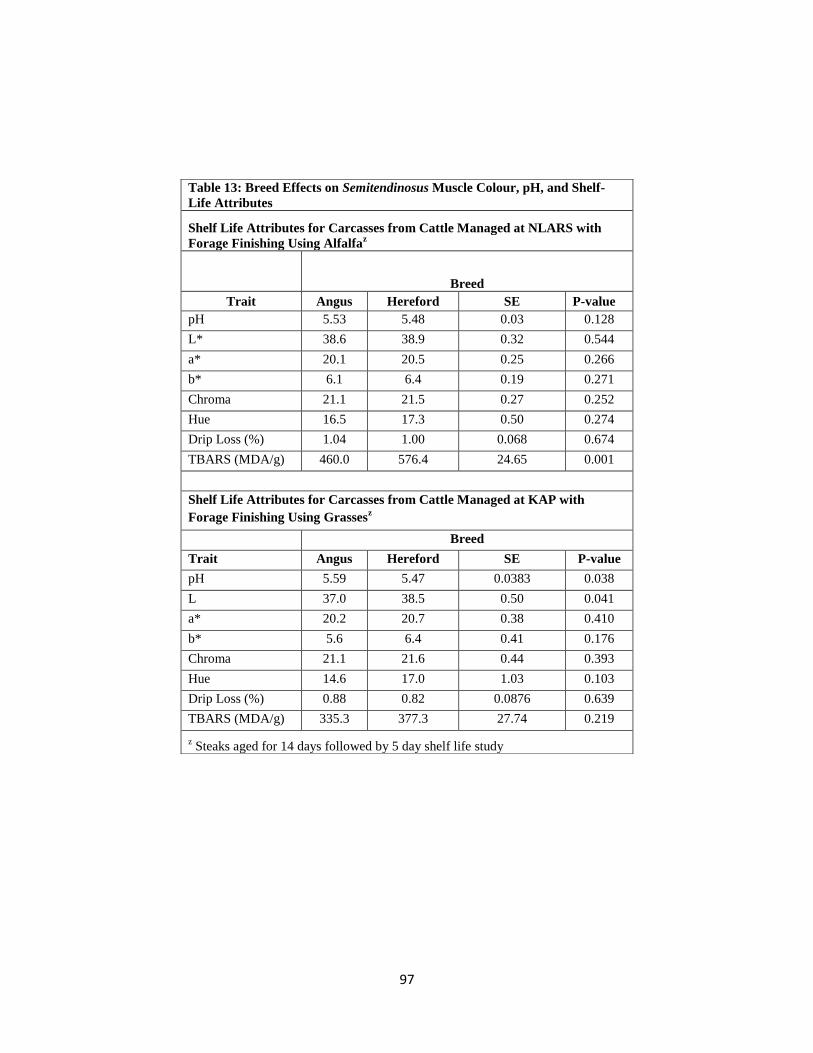
97
Table 13: Breed Effects on Semitendinosus Muscle Colour, pH, and Shelf-
Life Attributes
Shelf Life Attributes for Carcasses from Cattle Managed at NLARS with
Forage Finishing Using Alfalfaz
Breed
Trait Angus Hereford SE P-value
pH 5.53 5.48 0.03 0.128
L* 38.6 38.9 0.32 0.544
a* 20.1 20.5 0.25 0.266
b* 6.1 6.4 0.19 0.271
Chroma 21.1 21.5 0.27 0.252
Hue 16.5 17.3 0.50 0.274
Drip Loss (%)
1.04 1.00 0.068 0.674
TBARS (MDA/g)
460.0 576.4 24.65 0.001
Shelf Life Attributes for Carcasses from Cattle Managed at KAP with
Forage Finishing Using Grassesz
Breed
Trait Angus Hereford SE P-value
pH 5.59 5.47 0.0383 0.038
L 37.0 38.5 0.50 0.041
a* 20.2 20.7 0.38 0.410
b* 5.6 6.4 0.41 0.176
Chroma 21.1 21.6 0.44 0.393
Hue 14.6 17.0 1.03 0.103
Drip Loss (%) 0.88 0.82 0.0876 0.639
TBARS (MDA/g) 335.3 377.3 27.74 0.219
z Steaks aged for 14 days followed by 5 day shelf life study
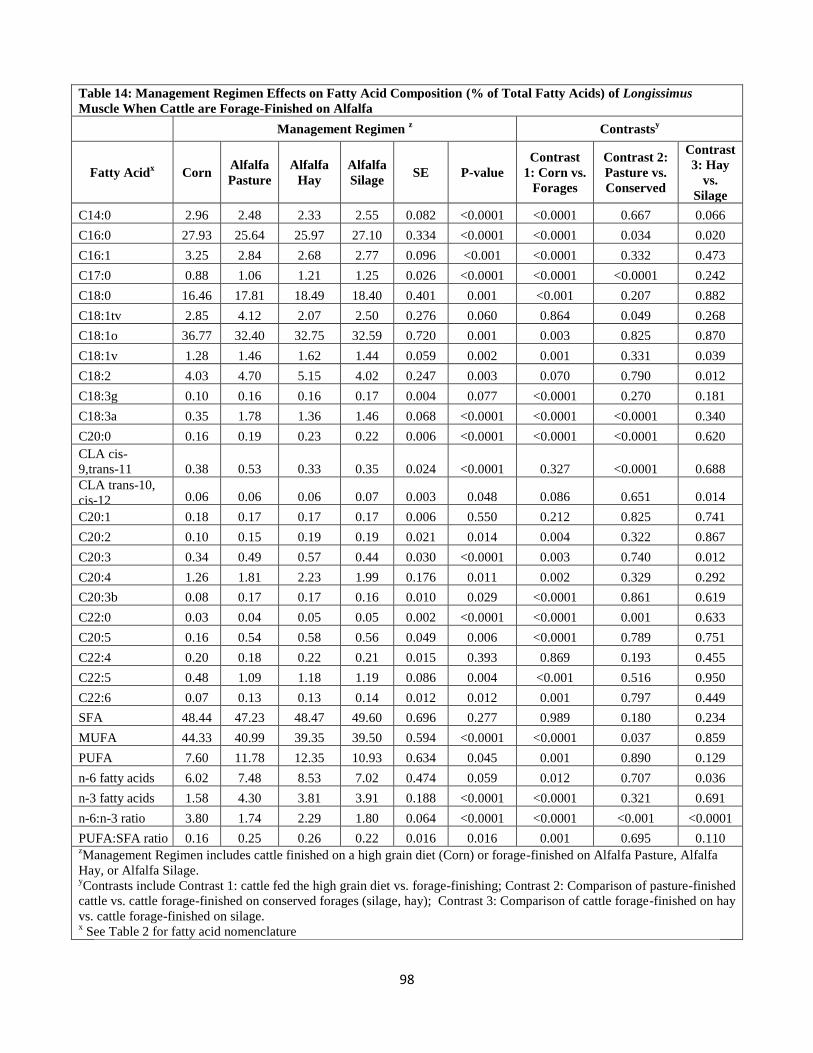
98
Table 14: Management Regimen Effects on Fatty Acid Composition (% of Total Fatty Acids) of Longissimus
Muscle When Cattle are Forage-Finished on Alfalfa
Management Regimen z Contrasts
y
Fatty Acidx Corn
Alfalfa
Pasture
Alfalfa
Hay
Alfalfa
Silage SE P-value
Contrast
1: Corn vs.
Forages
Contrast 2:
Pasture vs.
Conserved
Contrast
3: Hay
vs.
Silage
C14:0 2.96 2.48 2.33 2.55 0.082 <0.0001 <0.0001 0.667 0.066
C16:0 27.93 25.64 25.97 27.10 0.334 <0.0001 <0.0001 0.034 0.020
C16:1 3.25 2.84 2.68 2.77 0.096 <0.001 <0.0001 0.332 0.473
C17:0 0.88 1.06 1.21 1.25 0.026 <0.0001 <0.0001 <0.0001 0.242
C18:0 16.46 17.81 18.49 18.40 0.401 0.001 <0.001 0.207 0.882
C18:1tv 2.85 4.12 2.07 2.50 0.276 0.060 0.864 0.049 0.268
C18:1o 36.77 32.40 32.75 32.59 0.720 0.001 0.003 0.825 0.870
C18:1v 1.28 1.46 1.62 1.44 0.059 0.002 0.001 0.331 0.039
C18:2 4.03 4.70 5.15 4.02 0.247 0.003 0.070 0.790 0.012
C18:3g 0.10 0.16 0.16 0.17 0.004 0.077 <0.0001 0.270 0.181
C18:3a 0.35 1.78 1.36 1.46 0.068 <0.0001 <0.0001 <0.0001 0.340
C20:0 0.16 0.19 0.23 0.22 0.006 <0.0001 <0.0001 <0.0001 0.620
CLA cis-
9,trans-11 0.38 0.53 0.33 0.35 0.024 <0.0001 0.327 <0.0001 0.688
CLA trans-10,
cis-12 0.06 0.06 0.06 0.07 0.003 0.048 0.086 0.651 0.014
C20:1 0.18 0.17 0.17 0.17 0.006 0.550 0.212 0.825 0.741
C20:2 0.10 0.15 0.19 0.19 0.021 0.014 0.004 0.322 0.867
C20:3 0.34 0.49 0.57 0.44 0.030 <0.0001 0.003 0.740 0.012
C20:4 1.26 1.81 2.23 1.99 0.176 0.011 0.002 0.329 0.292
C20:3b 0.08 0.17 0.17 0.16 0.010 0.029 <0.0001 0.861 0.619
C22:0 0.03 0.04 0.05 0.05 0.002 <0.0001 <0.0001 0.001 0.633
C20:5 0.16 0.54 0.58 0.56 0.049 0.006 <0.0001 0.789 0.751
C22:4 0.20 0.18 0.22 0.21 0.015 0.393 0.869 0.193 0.455
C22:5 0.48 1.09 1.18 1.19 0.086 0.004 <0.001 0.516 0.950
C22:6 0.07 0.13 0.13 0.14 0.012 0.012 0.001 0.797 0.449
SFA 48.44 47.23 48.47 49.60 0.696 0.277 0.989 0.180 0.234
MUFA 44.33 40.99 39.35 39.50 0.594 <0.0001 <0.0001 0.037 0.859
PUFA 7.60 11.78 12.35 10.93 0.634 0.045 0.001 0.890 0.129
n-6 fatty acids 6.02 7.48 8.53 7.02 0.474 0.059 0.012 0.707 0.036
n-3 fatty acids 1.58 4.30 3.81 3.91 0.188 <0.0001 <0.0001 0.321 0.691
n-6:n-3 ratio 3.80 1.74 2.29 1.80 0.064 <0.0001 <0.0001 <0.001 <0.0001
PUFA:SFA ratio 0.16 0.25 0.26 0.22 0.016 0.016 0.001 0.695 0.110 zManagement Regimen includes cattle finished on a high grain diet (Corn) or forage-finished on Alfalfa Pasture, Alfalfa
Hay, or Alfalfa Silage. yContrasts include Contrast 1: cattle fed the high grain diet vs. forage-finishing; Contrast 2: Comparison of pasture-finished
cattle vs. cattle forage-finished on conserved forages (silage, hay); Contrast 3: Comparison of cattle forage-finished on hay
vs. cattle forage-finished on silage.
x See Table 2 for fatty acid nomenclature
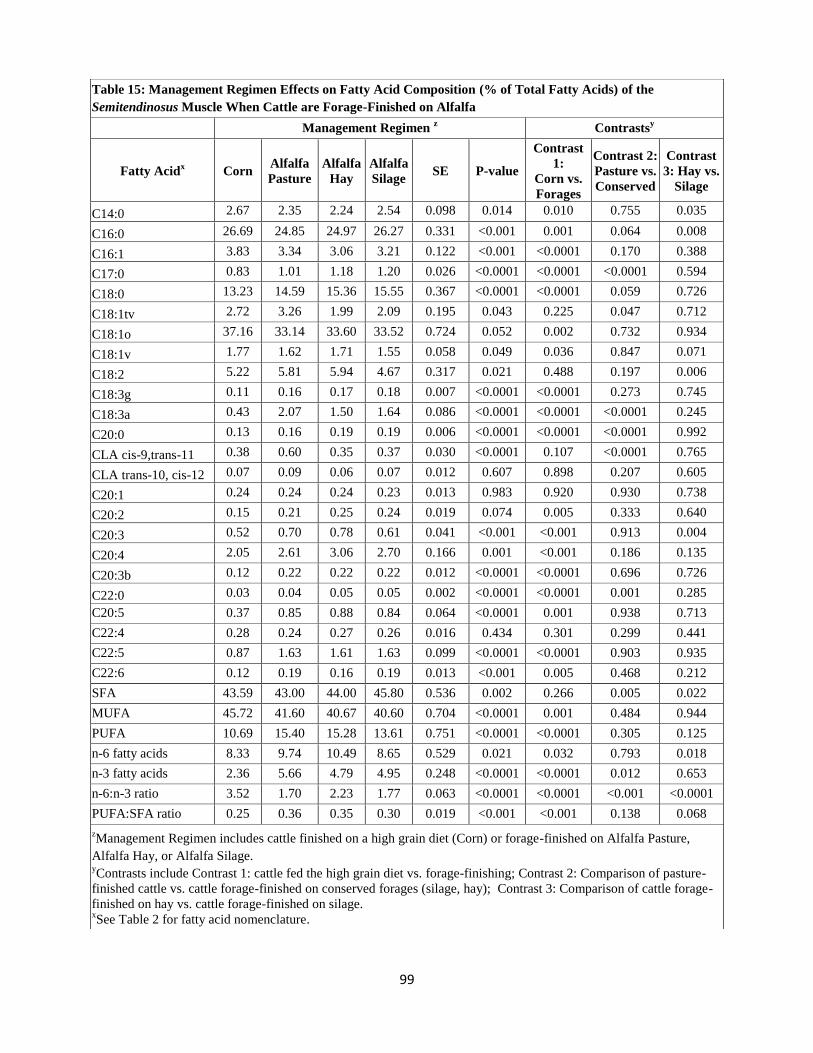
99
Table 15: Management Regimen Effects on Fatty Acid Composition (% of Total Fatty Acids) of the
Semitendinosus Muscle When Cattle are Forage-Finished on Alfalfa
Management Regimen z Contrasts
y
Fatty Acidx Corn
Alfalfa
Pasture
Alfalfa
Hay
Alfalfa
Silage SE P-value
Contrast
1:
Corn vs.
Forages
Contrast 2:
Pasture vs.
Conserved
Contrast
3: Hay vs.
Silage
C14:0 2.67 2.35 2.24 2.54 0.098 0.014 0.010 0.755 0.035
C16:0 26.69 24.85 24.97 26.27 0.331 <0.001 0.001 0.064 0.008
C16:1 3.83 3.34 3.06 3.21 0.122 <0.001 <0.0001 0.170 0.388
C17:0 0.83 1.01 1.18 1.20 0.026 <0.0001 <0.0001 <0.0001 0.594
C18:0 13.23 14.59 15.36 15.55 0.367 <0.0001 <0.0001 0.059 0.726
C18:1tv 2.72 3.26 1.99 2.09 0.195 0.043 0.225 0.047 0.712
C18:1o 37.16 33.14 33.60 33.52 0.724 0.052 0.002 0.732 0.934
C18:1v 1.77 1.62 1.71 1.55 0.058 0.049 0.036 0.847 0.071
C18:2 5.22 5.81 5.94 4.67 0.317 0.021 0.488 0.197 0.006
C18:3g 0.11 0.16 0.17 0.18 0.007 <0.0001 <0.0001 0.273 0.745
C18:3a 0.43 2.07 1.50 1.64 0.086 <0.0001 <0.0001 <0.0001 0.245
C20:0 0.13 0.16 0.19 0.19 0.006 <0.0001 <0.0001 <0.0001 0.992
CLA cis-9,trans-11 0.38 0.60 0.35 0.37 0.030 <0.0001 0.107 <0.0001 0.765
CLA trans-10, cis-12 0.07 0.09 0.06 0.07 0.012 0.607 0.898 0.207 0.605
C20:1 0.24 0.24 0.24 0.23 0.013 0.983 0.920 0.930 0.738
C20:2 0.15 0.21 0.25 0.24 0.019 0.074 0.005 0.333 0.640
C20:3 0.52 0.70 0.78 0.61 0.041 <0.001 <0.001 0.913 0.004
C20:4 2.05 2.61 3.06 2.70 0.166 0.001 <0.001 0.186 0.135
C20:3b 0.12 0.22 0.22 0.22 0.012 <0.0001 <0.0001 0.696 0.726
C22:0 0.03 0.04 0.05 0.05 0.002 <0.0001 <0.0001 0.001 0.285
C20:5 0.37 0.85 0.88 0.84 0.064 <0.0001 0.001 0.938 0.713
C22:4 0.28 0.24 0.27 0.26 0.016 0.434 0.301 0.299 0.441
C22:5 0.87 1.63 1.61 1.63 0.099 <0.0001 <0.0001 0.903 0.935
C22:6 0.12 0.19 0.16 0.19 0.013 <0.001 0.005 0.468 0.212
SFA 43.59 43.00 44.00 45.80 0.536 0.002 0.266 0.005 0.022
MUFA 45.72 41.60 40.67 40.60 0.704 <0.0001 0.001 0.484 0.944
PUFA 10.69 15.40 15.28 13.61 0.751 <0.0001 <0.0001 0.305 0.125
n-6 fatty acids 8.33 9.74 10.49 8.65 0.529 0.021 0.032 0.793 0.018
n-3 fatty acids 2.36 5.66 4.79 4.95 0.248 <0.0001 <0.0001 0.012 0.653
n-6:n-3 ratio 3.52 1.70 2.23 1.77 0.063 <0.0001 <0.0001 <0.001 <0.0001
PUFA:SFA ratio 0.25 0.36 0.35 0.30 0.019 <0.001 <0.001 0.138 0.068
zManagement Regimen includes cattle finished on a high grain diet (Corn) or forage-finished on Alfalfa Pasture,
Alfalfa Hay, or Alfalfa Silage. yContrasts include Contrast 1: cattle fed the high grain diet vs. forage-finishing; Contrast 2: Comparison of pasture-
finished cattle vs. cattle forage-finished on conserved forages (silage, hay); Contrast 3: Comparison of cattle forage-
finished on hay vs. cattle forage-finished on silage.
xSee Table 2 for fatty acid nomenclature.

100
Table 16: Breed Effects on Fatty Acid Composition (% of Total Fatty Acids) of Longissimus
Muscle When Cattle are Forage-Finished on Alfalfa
Breed
Fatty Acidz Angus Hereford SE P-value
C14:0 2.52 2.64 0.058 0.144
C16:0 26.39 26.94 0.236 0.105
C16:1 2.84 2.93 0.068 0.383
C17:0 1.11 1.09 0.018 0.642
C18:0 18.12 17.46 0.284 0.100
C18:1tv 2.99 2.79 0.177 0.359
C18:1o 33.90 33.35 0.472 0.364
C18:1v 1.40 1.50 0.042 0.092
C18:2 4.46 4.49 0.167 0.870
C18:3g 0.15 0.15 0.003 0.681
C18:3a 1.28 1.19 0.048 0.198
C20:0 0.20 0.20 0.004 0.655
CLA cis-9,trans-11 0.43 0.36 0.017 0.007
CLA trans-10, cis-12 0.06 0.07 0.002 0.023
C20:1 0.17 0.17 0.003 0.200
C20:2 0.12 0.19 0.012 <0.0001
C20:3 0.44 0.48 0.020 0.131
C20:4 1.65 1.99 0.107 0.004
C20:3b 0.14 0.15 0.006 0.488
C22:0 0.04 0.04 0.001 0.998
C20:5 0.46 0.46 0.031 0.951
C22:4 0.18 0.22 0.009 0.001
C22:5 0.95 1.02 0.054 0.272
C22:6 0.10 0.13 0.007 0.001
SFA 48.47 48.39 0.436 0.870
MUFA 41.35 40.74 0.420 0.313
PUFA 10.44 10.89 0.414 0.387
n-6 fatty acids 7.01 7.52 0.303 0.167
n-3 fatty acids 3.43 3.37 0.129 0.761
n-6:n-3 ratio 2.31 2.50 0.045 0.005
PUFA:SFA ratio 0.22 0.23 0.010 0.335 zSee Table 2 for fatty acid nomenclature
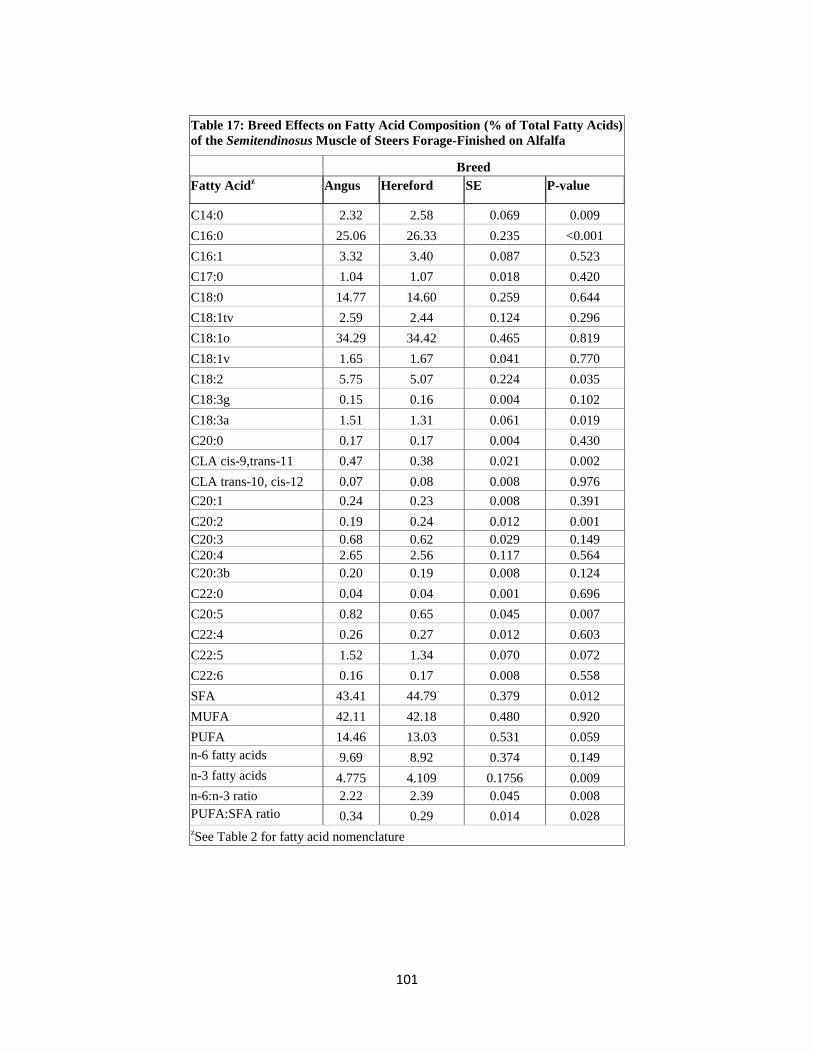
101
Table 17: Breed Effects on Fatty Acid Composition (% of Total Fatty Acids)
of the Semitendinosus Muscle of Steers Forage-Finished on Alfalfa
Breed
Fatty Acidz Angus Hereford SE P-value
C14:0 2.32 2.58 0.069 0.009
C16:0 25.06 26.33 0.235 <0.001
C16:1 3.32 3.40 0.087 0.523
C17:0 1.04 1.07 0.018 0.420
C18:0 14.77 14.60 0.259 0.644
C18:1tv 2.59 2.44 0.124 0.296
C18:1o 34.29 34.42 0.465 0.819
C18:1v 1.65 1.67 0.041 0.770
C18:2 5.75 5.07 0.224 0.035
C18:3g 0.15 0.16 0.004 0.102
C18:3a 1.51 1.31 0.061 0.019
C20:0 0.17 0.17 0.004 0.430
CLA cis-9,trans-11 0.47 0.38 0.021 0.002
CLA trans-10, cis-12 0.07 0.08 0.008 0.976
C20:1 0.24 0.23 0.008 0.391
C20:2 0.19 0.24 0.012 0.001
C20:3 0.68 0.62 0.029 0.149
C20:4 2.65 2.56 0.117 0.564
C20:3b 0.20 0.19 0.008 0.124
C22:0 0.04 0.04 0.001 0.696
C20:5 0.82 0.65 0.045 0.007
C22:4 0.26 0.27 0.012 0.603
C22:5 1.52 1.34 0.070 0.072
C22:6 0.16 0.17 0.008 0.558
SFA 43.41 44.79 0.379 0.012
MUFA 42.11 42.18 0.480 0.920
PUFA 14.46 13.03 0.531 0.059
n-6 fatty acids 9.69 8.92 0.374 0.149
n-3 fatty acids 4.775 4.109 0.1756 0.009
n-6:n-3 ratio 2.22 2.39 0.045 0.008
PUFA:SFA ratio 0.34 0.29 0.014 0.028 zSee Table 2 for fatty acid nomenclature

102
Table 18: Management Regimen Effects on Sensory Attributes of LM Steaks and Shear Forcex Values of ST
and LM steaks When Steers are Forage-Finished with Alfalfa
Management Regimen z Contrasts
y
Trait Corn Alfalfa
Pasture
Alfalfa
Hay
Alfalfa
Silage SE
P-
value
Contrast
1: Corn
vs.
Forages
Contrast
2: Pasture
vs.
Conserved
Contrast
3: Hay
vs.
Silage
Softness 6.8 6.4 6.1 6.1 0.36 0.307 0.098 0.709 0.425
Tenderness 6.8 6.4 6.1 6.0 0.36 0.283 0.085 0.868 0.399
Initial Juiciness 6.2 5.9 5.8 5.9 0.37 0.831 0.374 0.849 0.927
Beef Flavour 6.6 6.1 6.3 6.0 0.39 0.063 0.020 0.171 0.713
Off Flavour 1.1 1.5 1.5 1.4 0.21 0.311 0.071 0.864 0.675
Grassy Flavour 1.4 1.3 2.0 1.5 0.25 0.031 0.287 0.007 0.354
Chewiness 6.1 5.6 5.3 5.2 0.34 0.133 0.036 0.820 0.310
Overall
Juiciness 5.8 5.8 5.5 5.5 0.35 0.645 0.433 0.582 0.381
Flavour
Desirability 7.0 6.4 6.1 6.4 0.30 0.042 0.010 0.253 0.893
Overall
Acceptability 6.8 6.1 5.9 6.0 0.33 0.016 0.002 0.491 0.749
Shear
forcex
LM 3.82 4.21 4.22 4.29 0.173 0.3775 0.1102 0.8328 0.7620
ST 5.82 6.25 5.98 5.82 0.131 0.0589 0.1594 0.0444 0.5178 zManagement Regimen includes cattle finished on a high grain diet (Corn) or forage-finished on Alfalfa Pasture,
Alfalfa Hay, or Alfalfa Silage. yContrasts include Contrast 1: cattle fed the high grain diet vs. forage-finishing; Contrast 2: Comparison of pasture-
finished cattle vs. cattle forage-finished on conserved forages (silage, hay); Contrast 3: Comparison of cattle forage-
finished on hay vs. cattle forage-finished on silage. xMeasured in kg using Warner-Bratzler shear force test.

103
Table 19: Effect of Postmortem Ageing on Shear Force Valuesz (Longissimus and Semitendinosus)
Shear Force Data for Carcasses from Cattle Managed at NLARS with Forage Finishing Using Alfalfa
Ageing Contrastsy
Trait Muscle 7 Days 14 Days 21 Days SE P-value 1 2
Shear
Forcex
LM 5.14 3.93 3.34 0.126 <0.0001 <0.0001 <0.0001
ST 6.72 6.06 5.12 0.101 <0.0001 <0.0001 <0.0001
Shear Force Data for Carcasses from Cattle Managed at KAP with Forage Finishing Using Grasses
Ageing Contrasts
y
Trait
Muscle
7 Days
14 Days
21 Days
SE
P-value
1
2
Shear
Forcex
LM 5.56 4.17 3.56 0.178 <0.0001 <0.0001 <0.0001
ST 6.81 5.99 5.12 0.116 <0.0001 <0.0001 <0.0001 zMeasured by Warner-Bratzler shear force test.
yContrasts: Contrast 1 - Comparison of steaks aged for 7 days vs. the average of steaks aged for 14 and 21 days;
Contrast 2 – Comparison of steaks aged for 14 days versus 21 days. xMeasured in kg using Warner-Bratzler shear force test.
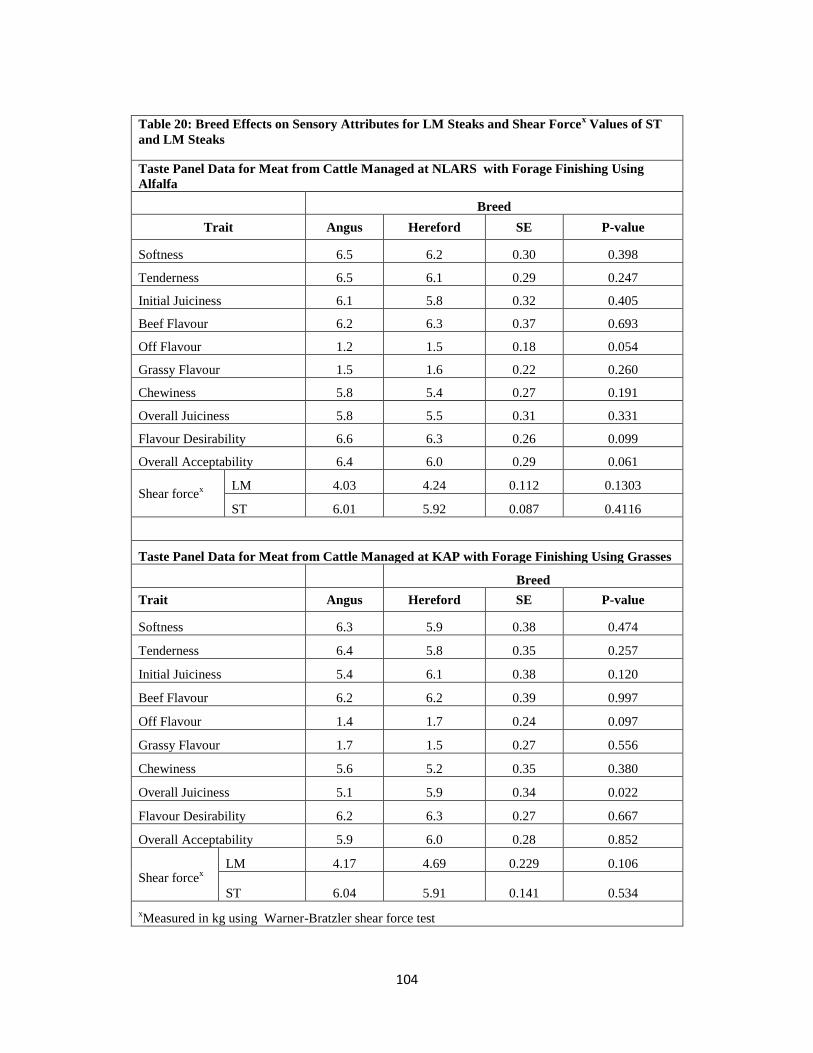
104
Table 20: Breed Effects on Sensory Attributes for LM Steaks and Shear Forcex Values of ST
and LM Steaks
Taste Panel Data for Meat from Cattle Managed at NLARS with Forage Finishing Using
Alfalfa
Breed
Trait Angus Hereford SE P-value
Softness 6.5 6.2 0.30 0.398
Tenderness 6.5 6.1 0.29 0.247
Initial Juiciness 6.1 5.8 0.32 0.405
Beef Flavour 6.2 6.3 0.37 0.693
Off Flavour 1.2 1.5 0.18 0.054
Grassy Flavour 1.5 1.6 0.22 0.260
Chewiness 5.8 5.4 0.27 0.191
Overall Juiciness 5.8 5.5 0.31 0.331
Flavour Desirability 6.6 6.3 0.26 0.099
Overall Acceptability 6.4 6.0 0.29 0.061
Shear forcex
LM 4.03 4.24 0.112 0.1303
ST 6.01 5.92 0.087 0.4116
Taste Panel Data for Meat from Cattle Managed at KAP with Forage Finishing Using Grasses
Breed
Trait Angus Hereford SE P-value
Softness 6.3 5.9 0.38 0.474
Tenderness 6.4 5.8 0.35 0.257
Initial Juiciness 5.4 6.1 0.38 0.120
Beef Flavour 6.2 6.2 0.39 0.997
Off Flavour 1.4 1.7 0.24 0.097
Grassy Flavour 1.7 1.5 0.27 0.556
Chewiness 5.6 5.2 0.35 0.380
Overall Juiciness 5.1 5.9 0.34 0.022
Flavour Desirability 6.2 6.3 0.27 0.667
Overall Acceptability 5.9 6.0 0.28 0.852
Shear forcex
LM 4.17 4.69 0.229 0.106
ST 6.04 5.91 0.141 0.534
xMeasured in kg using Warner-Bratzler shear force test
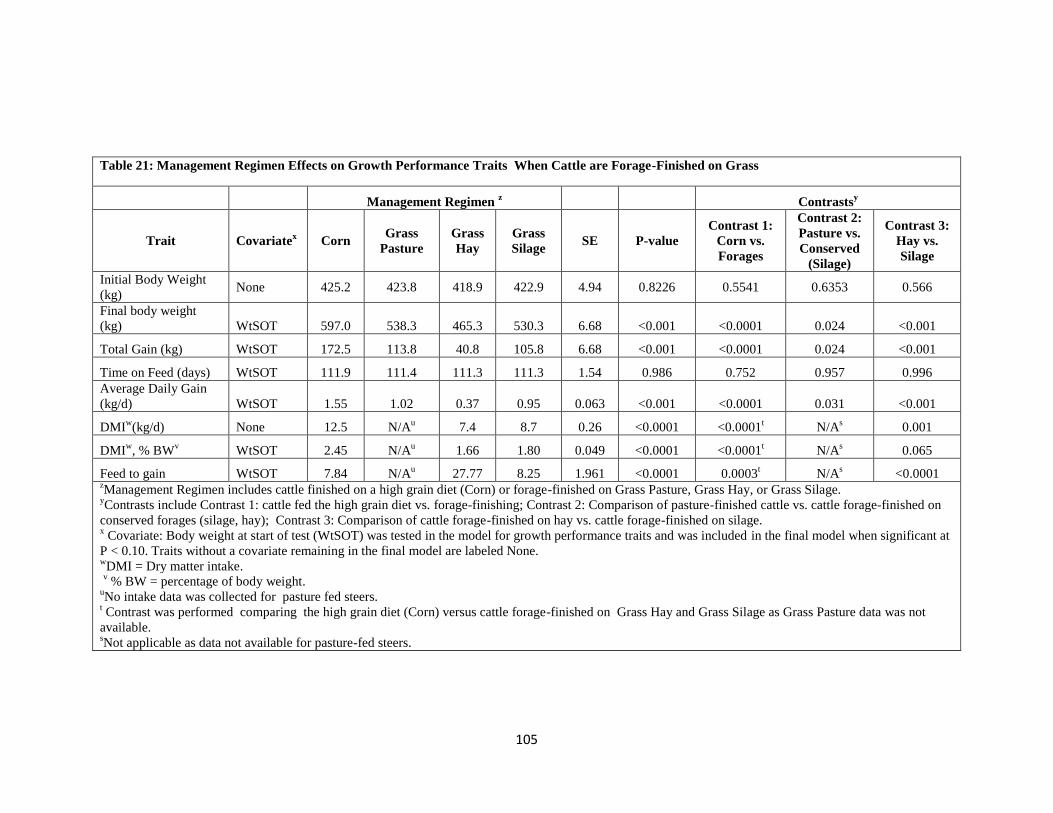
105
Table 21: Management Regimen Effects on Growth Performance Traits When Cattle are Forage-Finished on Grass
Management Regimen z Contrasts
y
Trait Covariatex Corn
Grass
Pasture
Grass
Hay
Grass
Silage SE P-value
Contrast 1:
Corn vs.
Forages
Contrast 2:
Pasture vs.
Conserved
(Silage)
Contrast 3:
Hay vs.
Silage
Initial Body Weight
(kg) None 425.2 423.8 418.9 422.9 4.94 0.8226 0.5541 0.6353 0.566
Final body weight
(kg) WtSOT 597.0 538.3 465.3 530.3 6.68 <0.001 <0.0001 0.024 <0.001
Total Gain (kg) WtSOT 172.5 113.8 40.8 105.8 6.68 <0.001 <0.0001 0.024 <0.001
Time on Feed (days) WtSOT 111.9 111.4 111.3 111.3 1.54 0.986 0.752 0.957 0.996
Average Daily Gain
(kg/d) WtSOT 1.55 1.02 0.37 0.95 0.063 <0.001 <0.0001 0.031 <0.001
DMIw(kg/d) None 12.5 N/A
u 7.4 8.7 0.26 <0.0001 <0.0001
t N/A
s 0.001
DMIw, % BW
v WtSOT 2.45 N/A
u 1.66 1.80 0.049 <0.0001 <0.0001
t N/A
s 0.065
Feed to gain WtSOT 7.84 N/Au 27.77 8.25 1.961 <0.0001 0.0003
t N/A
s <0.0001
zManagement Regimen includes cattle finished on a high grain diet (Corn) or forage-finished on Grass Pasture, Grass Hay, or Grass Silage.
yContrasts include Contrast 1: cattle fed the high grain diet vs. forage-finishing; Contrast 2: Comparison of pasture-finished cattle vs. cattle forage-finished on
conserved forages (silage, hay); Contrast 3: Comparison of cattle forage-finished on hay vs. cattle forage-finished on silage. x Covariate: Body weight at start of test (WtSOT) was tested in the model for growth performance traits and was included in the final model when significant at
P < 0.10. Traits without a covariate remaining in the final model are labeled None. wDMI = Dry matter intake.
v % BW = percentage of body weight.
uNo intake data was collected for pasture fed steers.
t Contrast was performed comparing the high grain diet (Corn) versus cattle forage-finished on Grass Hay and Grass Silage as Grass Pasture data was not
available. sNot applicable as data not available for pasture-fed steers.
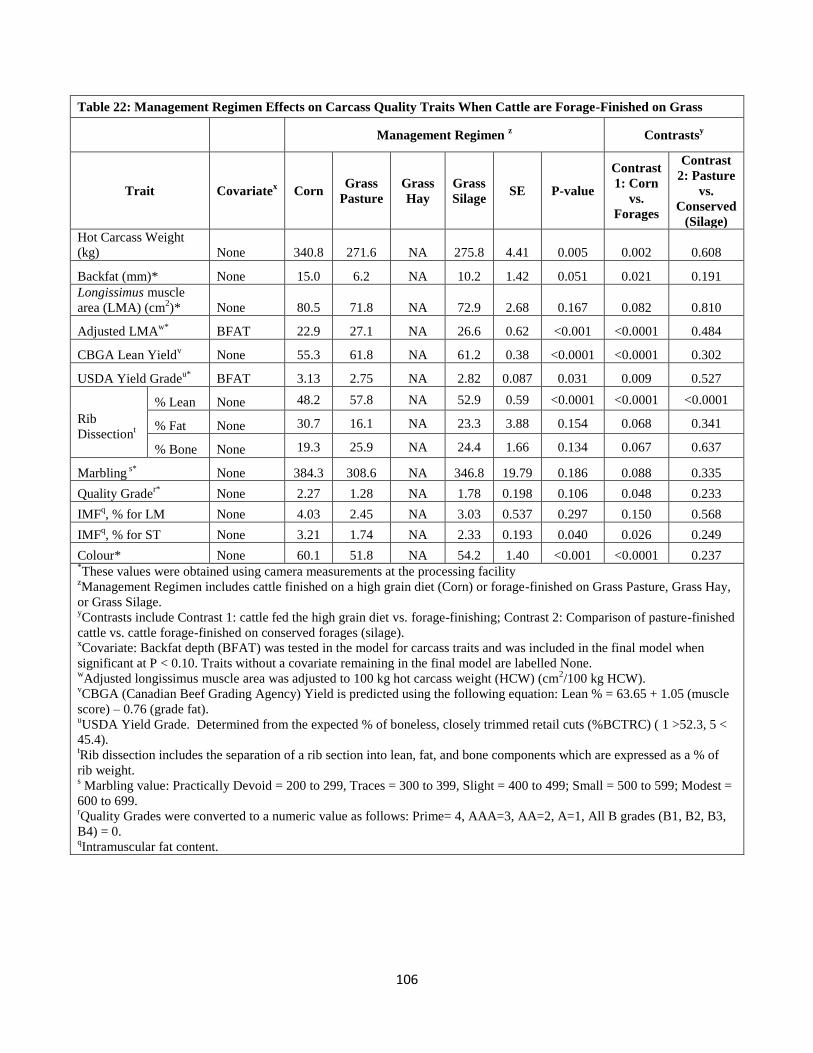
106
Table 22: Management Regimen Effects on Carcass Quality Traits When Cattle are Forage-Finished on Grass
Management Regimen
z Contrasts
y
Trait Covariatex Corn
Grass
Pasture
Grass
Hay
Grass
Silage SE P-value
Contrast
1: Corn
vs.
Forages
Contrast
2: Pasture
vs.
Conserved
(Silage)
Hot Carcass Weight
(kg) None 340.8 271.6 NA 275.8 4.41 0.005 0.002 0.608
Backfat (mm)* None 15.0 6.2 NA 10.2 1.42 0.051 0.021 0.191
Longissimus muscle
area (LMA) (cm2)* None 80.5 71.8 NA 72.9 2.68 0.167 0.082 0.810
Adjusted LMAw*
BFAT 22.9 27.1 NA 26.6 0.62 <0.001 <0.0001 0.484
CBGA Lean Yieldv None 55.3 61.8 NA 61.2 0.38 <0.0001 <0.0001 0.302
USDA Yield Gradeu*
BFAT 3.13 2.75 NA 2.82 0.087 0.031 0.009 0.527
Rib
Dissectiont
% Lean None 48.2 57.8 NA 52.9 0.59 <0.0001 <0.0001 <0.0001
% Fat None 30.7 16.1 NA 23.3 3.88 0.154 0.068 0.341
% Bone None 19.3 25.9 NA 24.4 1.66 0.134 0.067 0.637
Marbling s*
None 384.3 308.6 NA 346.8 19.79 0.186 0.088 0.335
Quality Grader*
None 2.27 1.28 NA 1.78 0.198 0.106 0.048 0.233
IMFq, % for LM None 4.03 2.45 NA 3.03 0.537 0.297 0.150 0.568
IMFq, % for ST None 3.21 1.74 NA 2.33 0.193 0.040 0.026 0.249
Colour* None 60.1 51.8 NA 54.2 1.40 <0.001 <0.0001 0.237 *These values were obtained using camera measurements at the processing facility
zManagement Regimen includes cattle finished on a high grain diet (Corn) or forage-finished on Grass Pasture, Grass Hay,
or Grass Silage. yContrasts include Contrast 1: cattle fed the high grain diet vs. forage-finishing; Contrast 2: Comparison of pasture-finished
cattle vs. cattle forage-finished on conserved forages (silage).
xCovariate: Backfat depth (BFAT) was tested in the model for carcass traits and was included in the final model when
significant at P < 0.10. Traits without a covariate remaining in the final model are labelled None. wAdjusted longissimus muscle area was adjusted to 100 kg hot carcass weight (HCW) (cm
2/100 kg HCW).
vCBGA (Canadian Beef Grading Agency) Yield is predicted using the following equation: Lean % = 63.65 + 1.05 (muscle
score) – 0.76 (grade fat). uUSDA Yield Grade. Determined from the expected % of boneless, closely trimmed retail cuts (%BCTRC) ( 1 >52.3, 5 <
45.4). tRib dissection includes the separation of a rib section into lean, fat, and bone components which are expressed as a % of
rib weight. s Marbling value: Practically Devoid = 200 to 299, Traces = 300 to 399, Slight = 400 to 499; Small = 500 to 599; Modest =
600 to 699. rQuality Grades were converted to a numeric value as follows: Prime= 4, AAA=3, AA=2, A=1, All B grades (B1, B2, B3,
B4) = 0. qIntramuscular fat content.

107
Table 23: Breed Effects on Carcass Characteristics When Cattle are Forage-Finished
on Grass
Breed
Trait Covariatez Angus Hereford SE P-value
Hot Carcass Weight (kg) None 300.5 291.6 3.26 0.060
Backfat (mm)* None 10.4 10.6 1.03 0.867
Longissimus muscle area
(LMA) (cm2)* None 76.6 73.6 1.97 0.241
Adjusted LMAy*
BFAT 25.6 25.4 0.42 0.723
CBGA Lean Yieldx None 59.3 59.6 0.31 0.562
USDA Yield Gradew*
BFAT 2.86 2.94 0.059 0.378
Rib
Dissectionv
% Lean None 53.6 52.4 0.48 0.073
% Fat None 22.2 24.6 2.75 0.431
% Bone None 23.0 23.4 1.19 0.724
Marbling u*
None 360.7 332.5 14.46 0.145
Quality Gradet*
None 1.89 1.66 0.146 0.228
IMFs, % for LM None 3.71 3.35 0.431 0.594
IMFs, % for ST None 2.74 2.80 0.180 0.839
Colour* None 54.9 55.8 1.14 0.561 *These values were obtained using camera measurements at the processing facility.
zCovariate: Backfat depth (BFAT) was tested in the model for carcass traits and was
included in the final model when significant at P < 0.10. Traits without a covariate
remaining in the final model are labeled None. yAdjusted longissimus muscle area was adjusted to 100 kg hot carcass weight (HCW)
(cm2/100 kg HCW).
xCBGA (Canadian Beef Grading Agency) Yield is predicted using the following equation:
Lean % = 63.65 + 1.05 (muscle score) – 0.76 (grade fat). wUSDA Yield Grade. Determined from the expected % of boneless, closely trimmed retail
cuts (%BCTRC) ( 1 >52.3, 5 < 45.4). vRib dissection includes the separation of a rib section into lean, fat, and bone components
which are expressed as a % of rib weight.
uMarbling value: Practically Devoid = 200 to 299, Traces = 300 to 399, Slight = 400 to 499;
Small = 500 to 599; Modest = 600 to 699. tQuality Grades were converted to a numeric value as follows: Prime= 4, AAA=3, AA=2,
A=1, All B grades (B1, B2, B3, B4) = 0. sIntramuscular fat content.

108
Table 24: Management Regimen Effects on Longissimus Colour, pH, and Shelf-Life Attributes When
Cattle are Forage-Finished on Grassz
Management Regimen y Contrasts
x
Trait Corn Grass
Pasture
Grass
Hay
Grass
Silage SE
P-
value
Contrast
1: Corn
vs.
Forages
Contrast
2: Pasture
vs.
Conserved
(Silage)
pH 5.5 5.6 NA 5.5 0.0360 0.173 0.148 0.267
L* 37.8 35.9 NA 37.0 0.45 0.009 0.015 0.068
a* 18.7 18.3 NA 18.5 0.28 0.496 0.381 0.461
b* 4.5 3.2 NA 3.9 0.27 0.008 0.012 0.073
Chroma 19.2 18.6 NA 19.0 0.30 0.258 0.207 0.327
Hue 13.3 9.8 NA 11.9 0.76 0.006 0.011 0.055
Drip Loss (%)
1.47 1.16 NA 1.38 0.1504 0.406 0.348 0.470
TBARS (ng
MDA/g) 285.2 238.7 NA 284.3 10.37 0.003 0.060 0.004
z Steaks aged for 14 days followed by 5 day shelf life study.
yManagement Regimen includes cattle finished on a high grain diet (Corn) or forage-finished on Grass Pasture,
Grass Hay, or Grass Silage. xContrasts include Contrast 1: cattle fed the high grain diet vs. forage-finishing; Contrast 2: Comparison of
pasture-finished cattle vs. cattle forage-finished on conserved forages (silage).
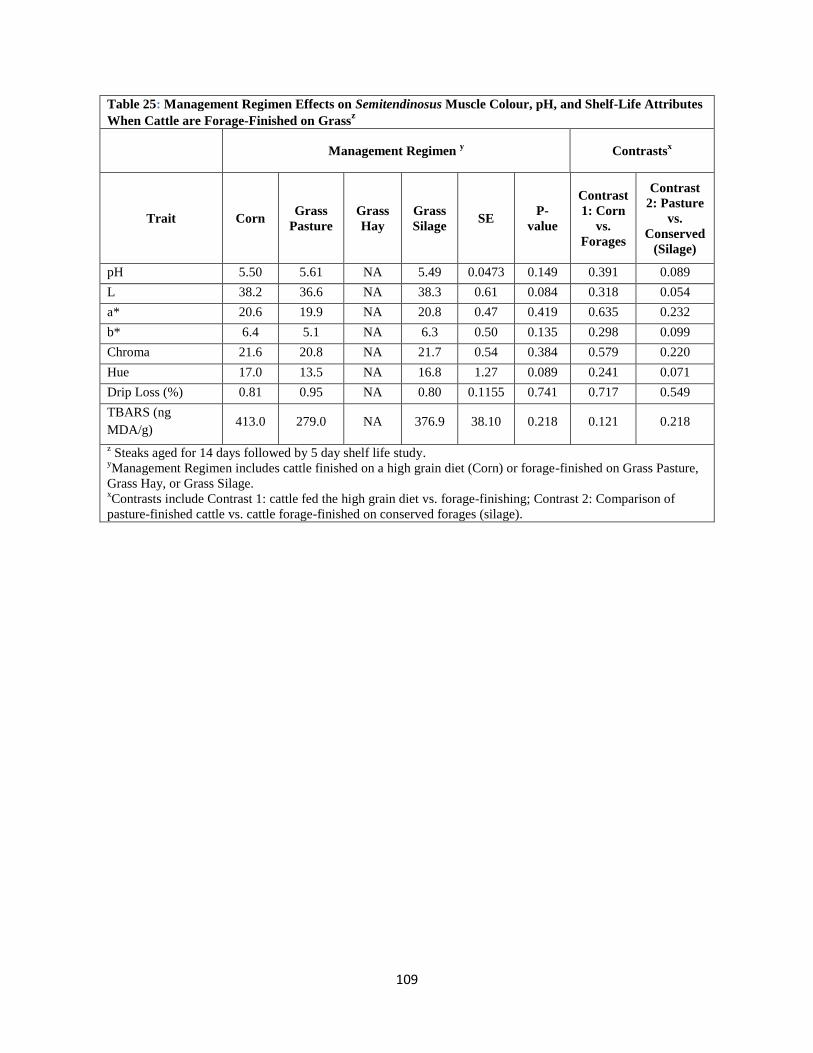
109
Table 25: Management Regimen Effects on Semitendinosus Muscle Colour, pH, and Shelf-Life Attributes
When Cattle are Forage-Finished on Grassz
Management Regimen y Contrasts
x
Trait Corn Grass
Pasture
Grass
Hay
Grass
Silage SE
P-
value
Contrast
1: Corn
vs.
Forages
Contrast
2: Pasture
vs.
Conserved
(Silage)
pH 5.50 5.61 NA 5.49 0.0473 0.149 0.391 0.089
L 38.2 36.6 NA 38.3 0.61 0.084 0.318 0.054
a* 20.6 19.9 NA 20.8 0.47 0.419 0.635 0.232
b* 6.4 5.1 NA 6.3 0.50 0.135 0.298 0.099
Chroma 21.6 20.8 NA 21.7 0.54 0.384 0.579 0.220
Hue 17.0 13.5 NA 16.8 1.27 0.089 0.241 0.071
Drip Loss (%)
0.81 0.95 NA 0.80 0.1155 0.741 0.717 0.549
TBARS (ng
MDA/g) 413.0 279.0 NA 376.9 38.10 0.218 0.121 0.218
z Steaks aged for 14 days followed by 5 day shelf life study.
yManagement Regimen includes cattle finished on a high grain diet (Corn) or forage-finished on Grass Pasture,
Grass Hay, or Grass Silage. xContrasts include Contrast 1: cattle fed the high grain diet vs. forage-finishing; Contrast 2: Comparison of
pasture-finished cattle vs. cattle forage-finished on conserved forages (silage).
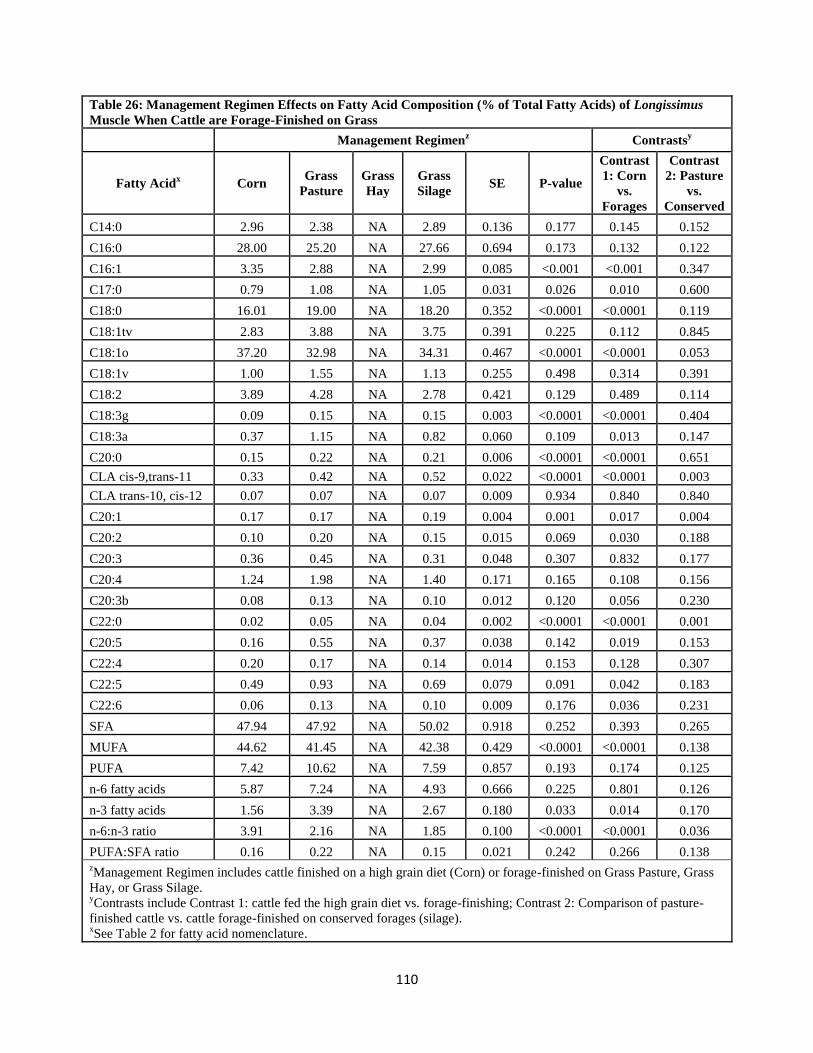
110
Table 26: Management Regimen Effects on Fatty Acid Composition (% of Total Fatty Acids) of Longissimus
Muscle When Cattle are Forage-Finished on Grass
Management Regimenz Contrasts
y
Fatty Acidx Corn
Grass
Pasture
Grass
Hay
Grass
Silage SE P-value
Contrast
1: Corn
vs.
Forages
Contrast
2: Pasture
vs.
Conserved
C14:0 2.96 2.38 NA 2.89 0.136 0.177 0.145 0.152
C16:0 28.00 25.20 NA 27.66 0.694 0.173 0.132 0.122
C16:1 3.35 2.88 NA 2.99 0.085 <0.001 <0.001 0.347
C17:0 0.79 1.08 NA 1.05 0.031 0.026 0.010 0.600
C18:0 16.01 19.00 NA 18.20 0.352 <0.0001 <0.0001 0.119
C18:1tv 2.83 3.88 NA 3.75 0.391 0.225 0.112 0.845
C18:1o 37.20 32.98 NA 34.31 0.467 <0.0001 <0.0001 0.053
C18:1v 1.00 1.55 NA 1.13 0.255 0.498 0.314 0.391
C18:2 3.89 4.28 NA 2.78 0.421 0.129 0.489 0.114
C18:3g 0.09 0.15 NA 0.15 0.003 <0.0001 <0.0001 0.404
C18:3a 0.37 1.15 NA 0.82 0.060 0.109 0.013 0.147
C20:0 0.15 0.22 NA 0.21 0.006 <0.0001 <0.0001 0.651
CLA cis-9,trans-11 0.33 0.42 NA 0.52 0.022 <0.0001 <0.0001 0.003
CLA trans-10, cis-12 0.07 0.07 NA 0.07 0.009 0.934 0.840 0.840
C20:1 0.17 0.17 NA 0.19 0.004 0.001 0.017 0.004
C20:2 0.10 0.20 NA 0.15 0.015 0.069 0.030 0.188
C20:3 0.36 0.45 NA 0.31 0.048 0.307 0.832 0.177
C20:4 1.24 1.98 NA 1.40 0.171 0.165 0.108 0.156
C20:3b 0.08 0.13 NA 0.10 0.012 0.120 0.056 0.230
C22:0 0.02 0.05 NA 0.04 0.002 <0.0001 <0.0001 0.001
C20:5 0.16 0.55 NA 0.37 0.038 0.142 0.019 0.153
C22:4 0.20 0.17 NA 0.14 0.014 0.153 0.128 0.307
C22:5 0.49 0.93 NA 0.69 0.079 0.091 0.042 0.183
C22:6 0.06 0.13 NA 0.10 0.009 0.176 0.036 0.231
SFA 47.94 47.92 NA 50.02 0.918 0.252 0.393 0.265
MUFA 44.62 41.45 NA 42.38 0.429 <0.0001 <0.0001 0.138
PUFA 7.42 10.62 NA 7.59 0.857 0.193 0.174 0.125
n-6 fatty acids 5.87 7.24 NA 4.93 0.666 0.225 0.801 0.126
n-3 fatty acids 1.56 3.39 NA 2.67 0.180 0.033 0.014 0.170
n-6:n-3 ratio 3.91 2.16 NA 1.85 0.100 <0.0001 <0.0001 0.036
PUFA:SFA ratio 0.16 0.22 NA 0.15 0.021 0.242 0.266 0.138 zManagement Regimen includes cattle finished on a high grain diet (Corn) or forage-finished on Grass Pasture, Grass
Hay, or Grass Silage. yContrasts include Contrast 1: cattle fed the high grain diet vs. forage-finishing; Contrast 2: Comparison of pasture-
finished cattle vs. cattle forage-finished on conserved forages (silage). xSee Table 2 for fatty acid nomenclature.

111
Table 27: Management Regimen Effects on Fatty Acid Composition (% of Total Fatty Acids) of the
Semitendinosus Muscle of Steers Forage-Finished on Grass
Management Regimenz Contrasts
y
Fatty Acidx Corn Pasture Hay Silage SE P-value
Contrast
1: Corn
vs.
Forages
Contrast
2: Pasture
vs.
Conserved
C14:0 2.67 2.25 NA 2.69 0.073 <0.0001 0.022 <0.0001
C16:0 26.78 24.25 NA 26.51 0.422 0.219 0.123 0.171
C16:1 3.95 3.30 NA 3.64 0.225 0.312 0.160 0.435
C17:0 0.75 1.05 NA 1.03 0.030 0.016 0.006 0.693
C18:0 12.61 15.90 NA 14.88 0.333 <0.0001 <0.0001 0.038
C18:1tv 4.21 3.11 NA 3.15 1.227 0.761 0.509 0.985
C18:1o 37.10 33.76 NA 36.23 1.812 0.574 0.386 0.473
C18:1v 2.83 1.71 NA 1.55 0.945 0.592 0.371 0.926
C18:2 4.33 5.27 NA 3.34 0.216 <0.0001 0.913 <0.0001
C18:3g 0.10 0.18 NA 0.16 0.005 0.075 0.008 0.267
C18:3a 0.37 1.43 NA 0.95 0.059 <0.0001 <0.0001 <0.0001
C20:0 0.12 0.18 NA 0.18 0.005 <0.0001 <0.0001 0.451
CLA cis-9,trans-11 0.42 0.48 NA 0.57 0.033 0.089 0.075 0.235
CLA trans-10,cis-12 0.06 0.07 NA 0.07 0.002 <0.001 <0.0001 0.166
C20:1 0.25 0.23 NA 0.27 0.008 0.005 0.788 0.001
C20:2 0.12 0.28 NA 0.22 0.014 0.123 0.024 0.201
C20:3 0.44 0.65 NA 0.45 0.031 <0.0001 0.004 <0.0001
C20:4 1.54 2.83 NA 2.06 0.117 <0.0001 <0.0001 <0.0001
C20:3b 0.10 0.19 NA 0.14 0.008 <0.0001 <0.0001 <0.0001
C22:0 0.02 0.05 NA 0.04 0.001 <0.0001 <0.0001 <0.0001
C20:5 0.24 0.88 NA 0.61 0.050 <0.0001 <0.0001 <0.001
C22:4 0.24 0.24 NA 0.20 0.013 0.030 0.250 0.016
C22:5 0.66 1.49 NA 1.08 0.072 <0.0001 <0.0001 <0.001
C22:6 0.09 0.20 NA 0.16 0.010 <0.0001 <0.0001 0.002
SFA 42.96 43.68 NA 45.32 0.587 0.018 0.032 0.058
MUFA 48.34 42.12 NA 44.83 0.715 <0.0001 <0.0001 0.011
PUFA 8.70 14.20 NA 10.01 0.532 <0.0001 <0.0001 <0.0001
n-6 fatty acids 6.77 9.45 NA 6.43 0.365 <0.0001 0.010 <0.0001
n-3 fatty acids 1.93 4.74 NA 3.58 0.193 <0.0001 <0.0001 <0.0001
n-6:n-3 ratio 3.53 2.03 NA 1.81 0.085 <0.0001 <0.0001 0.077
PUFA:SFA ratio 0.20 0.33 NA 0.22 0.013 <0.0001 <0.0001 <0.0001 zManagement Regimen includes cattle finished on a high grain diet (Corn) or forage-finished on Grass Pasture,
Grass Hay, or Grass Silage. yContrasts include Contrast 1: cattle fed the high grain diet vs. forage-finishing; Contrast 2: Comparison of pasture-
finished cattle vs. cattle forage-finished on conserved forages (silage). xSee Table 2 for fatty acid nomenclature.
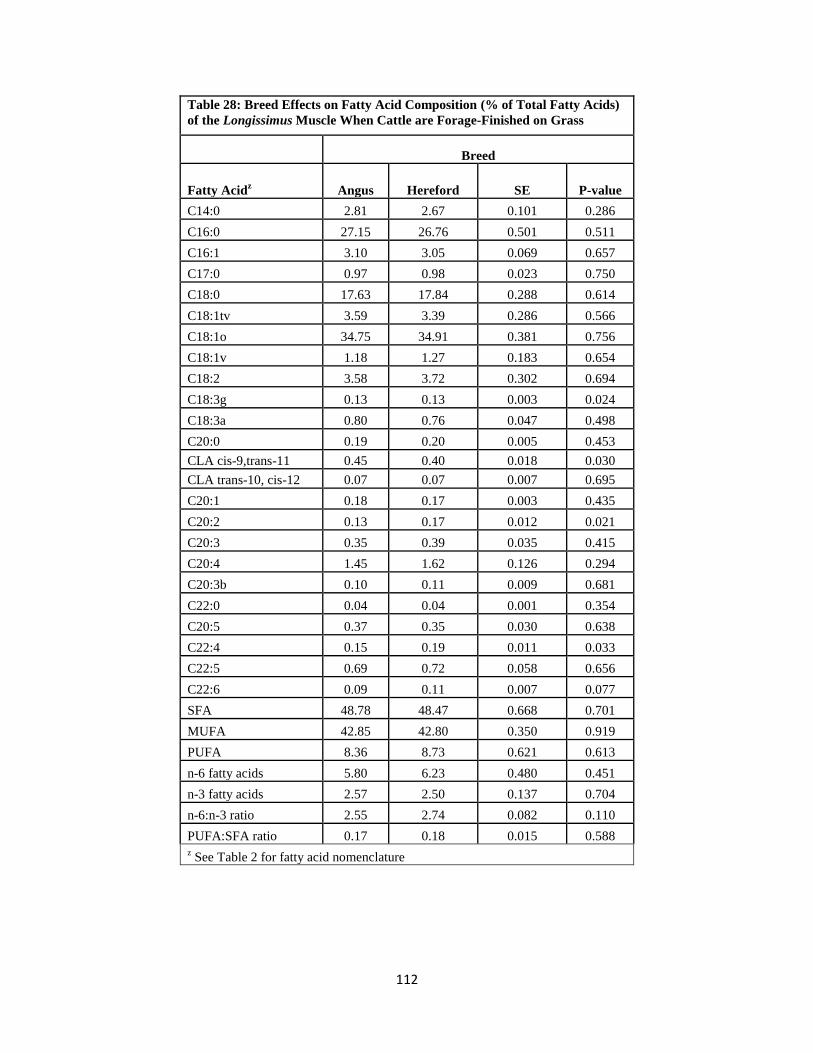
112
Table 28: Breed Effects on Fatty Acid Composition (% of Total Fatty Acids)
of the Longissimus Muscle When Cattle are Forage-Finished on Grass
Breed
Fatty Acidz Angus Hereford SE P-value
C14:0 2.81 2.67 0.101 0.286
C16:0 27.15 26.76 0.501 0.511
C16:1 3.10 3.05 0.069 0.657
C17:0 0.97 0.98 0.023 0.750
C18:0 17.63 17.84 0.288 0.614
C18:1tv 3.59 3.39 0.286 0.566
C18:1o 34.75 34.91 0.381 0.756
C18:1v 1.18 1.27 0.183 0.654
C18:2 3.58 3.72 0.302 0.694
C18:3g 0.13 0.13 0.003 0.024
C18:3a 0.80 0.76 0.047 0.498
C20:0 0.19 0.20 0.005 0.453
CLA cis-9,trans-11 0.45 0.40 0.018 0.030
CLA trans-10, cis-12 0.07 0.07 0.007 0.695
C20:1 0.18 0.17 0.003 0.435
C20:2 0.13 0.17 0.012 0.021
C20:3 0.35 0.39 0.035 0.415
C20:4 1.45 1.62 0.126 0.294
C20:3b 0.10 0.11 0.009 0.681
C22:0 0.04 0.04 0.001 0.354
C20:5 0.37 0.35 0.030 0.638
C22:4 0.15 0.19 0.011 0.033
C22:5 0.69 0.72 0.058 0.656
C22:6 0.09 0.11 0.007 0.077
SFA 48.78 48.47 0.668 0.701
MUFA 42.85 42.80 0.350 0.919
PUFA 8.36 8.73 0.621 0.613
n-6 fatty acids 5.80 6.23 0.480 0.451
n-3 fatty acids 2.57 2.50 0.137 0.704
n-6:n-3 ratio 2.55 2.74 0.082 0.110
PUFA:SFA ratio 0.17 0.18 0.015 0.588 z See Table 2 for fatty acid nomenclature
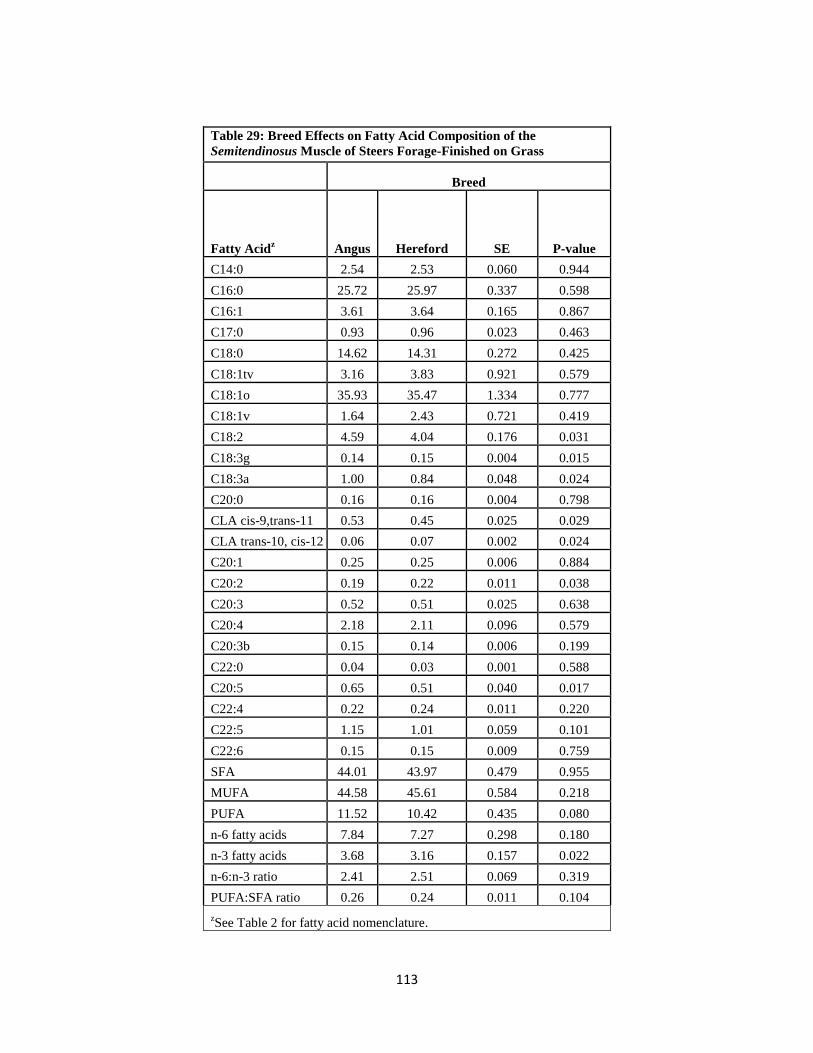
113
Table 29: Breed Effects on Fatty Acid Composition of the
Semitendinosus Muscle of Steers Forage-Finished on Grass
Breed
Fatty Acidz Angus Hereford SE P-value
C14:0 2.54 2.53 0.060 0.944
C16:0 25.72 25.97 0.337 0.598
C16:1 3.61 3.64 0.165 0.867
C17:0 0.93 0.96 0.023 0.463
C18:0 14.62 14.31 0.272 0.425
C18:1tv 3.16 3.83 0.921 0.579
C18:1o 35.93 35.47 1.334 0.777
C18:1v 1.64 2.43 0.721 0.419
C18:2 4.59 4.04 0.176 0.031
C18:3g 0.14 0.15 0.004 0.015
C18:3a 1.00 0.84 0.048 0.024
C20:0 0.16 0.16 0.004 0.798
CLA cis-9,trans-11 0.53 0.45 0.025 0.029
CLA trans-10, cis-12 0.06 0.07 0.002 0.024
C20:1 0.25 0.25 0.006 0.884
C20:2 0.19 0.22 0.011 0.038
C20:3 0.52 0.51 0.025 0.638
C20:4 2.18 2.11 0.096 0.579
C20:3b 0.15 0.14 0.006 0.199
C22:0 0.04 0.03 0.001 0.588
C20:5 0.65 0.51 0.040 0.017
C22:4 0.22 0.24 0.011 0.220
C22:5 1.15 1.01 0.059 0.101
C22:6 0.15 0.15 0.009 0.759
SFA 44.01 43.97 0.479 0.955
MUFA 44.58 45.61 0.584 0.218
PUFA 11.52 10.42 0.435 0.080
n-6 fatty acids 7.84 7.27 0.298 0.180
n-3 fatty acids 3.68 3.16 0.157 0.022
n-6:n-3 ratio 2.41 2.51 0.069 0.319
PUFA:SFA ratio 0.26 0.24 0.011 0.104
zSee Table 2 for fatty acid nomenclature.

114
Table 30: Management Regimen Effects on Sensory Attributes of LM Steaks and Shear Forcex Values of ST and
LM steaks When Steers are Forage-Finished with Grass
Management Regimen z Contrasts
y
Trait Corn Grass
Pasture
Grass
Hay
Grass
Silage SE P-value
Contrast
1: Corn
vs.
Forages
Contrast
2: Pasture
vs.
Conserved
(Silage)
Softness 5.7 6.3 NA 6.4 0.40 0.356 0.158 0.841
Tenderness 5.7 6.2 NA 6.4 0.37 0.289 0.124 0.757
Initial Juiciness 5.8 5.2 NA 6.2 0.39 0.066 0.749 0.023
Beef Flavour 6.4 5.8 NA 6.3 0.39 0.014 0.037 0.034
Off Flavour 1.6 1.4 NA 1.7 0.24 0.270 0.880 0.110
Grassy Flavour 1.3 1.6 NA 2.0 0.28 0.103 0.067 0.242
Chewiness 5.1 5.5 NA 5.7 0.36 0.483 0.259 0.668
Overall Juiciness 5.6 5.0 NA 5.7 0.34 0.055 0.341 0.028
Flavour Desirability 6.8 5.9 NA 6.0 0.29 0.009 0.003 0.745
Overall
Acceptability 6.4 5.7 NA 5.9 0.19 0.062 0.024 0.564
Shear
forcex
LM 4.71 3.96 NA 4.61 0.286 0.180 0.204 0.147
ST 6.07 5.89 NA 5.96 0.174 0.764 0.522 0.797 zManagement Regimen includes cattle finished on a high grain diet (Corn) or forage-finished on Grass Pasture or Grass
Silage. yContrasts include Contrast 1: cattle fed the high grain diet vs. forage-finishing; Contrast 2: Comparison of pasture-
finished cattle vs. cattle forage-finished on conserved forages (silage, hay). xMeasured by Warner-Bratzler shear force test.
115
4. REFERENCES
Alfaia, C. P., S. P. Alves, S. Martins IV, A. S. Costa, C. M. Fontes, J. P. Lemos et al. 2009.
Effect of the feeding system on intramuscular fatty acids and conjugated linoleic acid
isomers of beef cattle, with emphasis on their nutritional value and discriminatory ability.
Food Chem. 114(3): 939-946.
Allen, V., J. Fontenot, R. Kelly, and D. Notter. 1996. Forage systems for beef production from
conception to slaughter: III. Finishing systems. J. Anim. Sci. 74(3): 625-638.
Allen, V., J. Fontenot, and D. Notter. 1992. Forage systems for beef production from conception
to slaughter: II. Stocker systems. J. Anim. Sci. 70(2): 588-596.
AMSA. 1995. Research guidelines for cookery, sensory evaluation and instrumental tenderness
measurements of fresh meat. American Meat Science Association. Savoy, IL.
Anders, S., and A. Moeser. 2008. Assessing the demand for value‐based organic meats in
Canada: A combined retail and household scanner‐data approach. International Journal of
Consumer Studies. 32(5): 457-469.
Archile-Contreras, A., I. Mandell, and P. Purslow. 2010. Disparity of dietary effects on collagen
characteristics and toughness between two beef muscles. Meat Sci. 86(2): 491-497.
Baker, J. F., R. C. Vann, and W. E. Neville. 2002. Evaluations of genotype x environment
interactions of beef bulls performance-tested in feedlot or pasture. J. Anim. Sci. 80(7):
1716.
Barbut, S. 2002. Poultry products processing: An industry guide. . United States of America,
CRC Press.
Bartoň, L., D. Řehák, V. Teslík, D. Bureš, and R. Zahrádková. 2006. Effect of breed on growth
performance and carcass composition of Aberdeen Angus, Charolais, Hereford and
Simmental bulls. Czech Journal of Animal Science. 51: 47-53.
Bennett, L., A. Hammond, M. Williams, W. Kunkle, D. Johnson, R. Preston et al. 1995.
Performance, carcass yield, and carcass quality characteristics of steers finished on
rhizoma peanut (Arachis glabrata)-tropical grass pasture or concentrate. J. Anim. Sci.
73(7): 1881-1887.
Berry, B., K. Leddy, J. Bond, T. Rumsey, and A. Hammond. 1988. Effects of silage diets and
electrical stimulation on the palatability, cooking and pH characteristics of beef loin steaks.
J. Anim. Sci. 66(4): 892-900.
Bessa, R. J. B., P. Portugal, I. Mendes, and J. Santos-Silva. 2005. Effect of lipid supplementation
on growth performance, carcass and meat quality and fatty acid composition of
intramuscular lipids of lambs fed dehydrated lucerne or concentrate. Livest. Prod. Sci.
96(2): 185-194.
116
Bidner, T., A. Schupp, A. Mohamad, N. Rumore, R. Montgomery, C. Bagley et al. 1986.
Acceptability of beef from Angus-Hereford or Angus-Hereford-Brahman steers finished on
all-forage or a high-energy diet. J. Anim. Sci. 62(2): 381-387.
Bidner, T. D., A. R. Schupp, R. E. Montgomery, and J. Carpenter Jr. 1981. Acceptability of beef
finished on all-forage, forage-plus-grain or high energy diets. J. Anim. Sci. 53(5): 1181-
1187.
Blanco, M., I. Casasús, G. Ripoll, B. Panea, P. Albertí, and M. Joy. 2010. Lucerne grazing
compared with concentrate-feeding slightly modifies carcase and meat quality of young
bulls. Meat Sci. 84(3): 545-552.
Botsoglou, N. A., D. J. Fletouris, G. E. Papageorgiou, V. N. Vassilopoulos, A. J. Mantis, and A.
G. Trakatellis. 1994. Rapid, sensitive, and specific thiobarbituric acid method for
measuring lipid peroxidation in animal tissue, food, and feedstuff samples. J. Agric. Food
Chem. 42(9): 1931-1937.
Boufaïed, H., P. Chouinard, G. Tremblay, H. Petit, R. Michaud, and G. Bélanger. 2003. Fatty
acids in forages. I. Factors affecting concentrations. Canadian Journal of Animal Science.
83(3): 501-511.
Bowling, R. A., G. C. Smith, Z. L. Carpenter, T. R. Dutson, and W. M. Oliver. 1977.
Comparison of forage-finished and grain-finished beef carcasses. J. Anim. Sci. 45(2): 209-
215.
Broderick, G. A. 1985. Alfalfa silage or hay versus corn silage as the sole forage for lactating
dairy cows. J. Dairy Sci. 68(12): 3262-3271.
Broderick, G. A., and D. R. Buxton. 1991. Genetic variation in alfalfa for ruminal protein
degradability. Canadian Journal of Plant Science. 71(3): 755-760.
Brown, A. H., P. K. Camfield, C. W. Rowe, L. Y. Rakes, F. W. Pohlman, Z. B. Johnson et al.
2007. Effect of beef growth type on cooking loss, tenderness, and chemical composition of
pasture-or feedlot-developed steers. Asian Australasian Journal of Animal Sciences.
20(11): 1746.
Brown, H. G., S. L. Melton, M. J. Riemann, and W. R. Backus. 1979. Effects of energy intake
and feed source on chemical changes and flavor of ground beef during frozen storage. J.
Anim. Sci. 48(2): 338-347.
Bull, S., H. P. Rusk, and R. R. Snapp. 1941. Effect of pasture on grade of beef.
Butler, T. J., J. T. Biermacher, S. M. Interrante, M. K. Sledge, A. A. Hopkins, and J. H. Bouton.
2012. Production and economics of grazing alfalfa in the southern great plains. Crop Sci.
52(3): 1424-1429.
117
Camfield, P. K., A. Brown Jr, Z. B. Johnson, C. J. Brown, P. K. Lewis, and L. Y. Rakes. 1999.
Effects of growth type on carcass traits of pasture-or feedlot-developed steers. J. Anim.
Sci. 77(9): 2437-2443.
Capitan, B., C. Krehbiel, R. Kirskey, L. Lauriault, G. Duff, and G. Donart. 2004. Effects of
winter and summer forage type on pasture and feedlot performance and carcass
characteristics by beef steers. The Professional Animal Scientist. 20(3): 225-236.
Capper, J. L. 2011. Replacing rose-tinted spectacles with a high-powered microscope: The
historical versus modern carbon footprint of animal agriculture. Anim. Front. 1(1): 26-32.
Chewning, J., A. Brown, Z. Johnson, and C. Brown. 1990. Breed means for average daily gain,
feed conversion and intake of beef bulls during postweaning feedlot performance tests. J.
Anim. Sci. 68(6): 1500-1504.
Chin, S. F., W. Liu, J. M. Storkson, Y. L. Ha, and M. W. Pariza. 1992. Dietary sources of
conjugated dienoic isomers of linoleic acid, a newly recognized class of anticarcinogens.
Journal of Food Composition and Analysis. 5(3): 185-197.
Christiansen, E., S. Schnider, B. Palmvig, E. Tauber-Lassen, and O. Pedersen. 1997. Intake of a
diet high in trans monounsaturated fatty acids or saturated fatty acids: Effects on
postprandial insulinemia and glycemia in obese patients with NIDDM. Diabetes Care.
20(5): 881-887.
Comerford, J., H. Harpster, E. Cash, V. Baumer, R. Stout, and R. Swope. 2005. Animal and
forage production and economics of three grazing systems for beef cattle. The Professional
Animal Scientist. 21(6): 455-464.
Connor, W. E. 2000. Importance of n-3 fatty acids in health and disease. Am. J. Clin. Nutr.
71(1): 171S.
Cox, R. B., C. R. Kerth, J. G. Gentry, J. W. Prevatt, K. W. Braden, and W. R. Jones. 2006.
Determining acceptance of domestic forage-or grain-Finished beef by consumers from
three southeastern US states. J. Food Sci. 71(7): S542-S546.
Crampton, E. W., E. Donefer, and L. E. Lloyd. 1960. A nutritive value index for forages. J.
Anim. Sci. 19(2): 538-544.
Crouse, J., H. Cross, and S. Seideman. 1984. Effects of a grass or grain diet on the quality of
three beef muscles. J. Anim. Sci. 58(3): 619-625.
Crouse, J. D., M. E. Dikeman, R. M. Koch, and C. E. Murphey. 1975. Evaluation of traits in the
USDA yield grade equation for predicting beef carcass cutability in breed groups differing
in growth and fattening characteristics. J. Anim. Sci. 41(2): 548-553.
Cymbaluk, N. F. 1990. Comparison of forage digestion by cattle and horses. Canadian Journal of
Animal Science. 70(2): 601-610.
118
Davis, G. W., A. Cole Jr., W. R. Backus, and S. L. Melton. 1981. Effect of electrical stimulation
on carcass quality and meat palatability of beef from forage-and grain-finished steers. J.
Anim. Sci. 53(3): 651-657.
Descalzo, A., E. Insani, A. Biolatto, A. Sancho, P. Garcia, N. Pensel et al. 2005. Influence of
pasture or grain-based diets supplemented with vitamin E on antioxidant/oxidative balance
of argentine beef. Meat Sci. 70(1): 35-44.
Destefanis, G., A. Brugiapaglia, M. T. Barge, and E. Dal Molin. 2008. Relationship between
beef consumer tenderness perception and Warner-Bratzler shear force. Meat Sci. 78(3):
153-156.
Dewhurst, R. J., N. D. Scollan, S. J. Youell, J. K. S. Tweed, and M. O. Humphreys. 2001.
Influence of species, cutting date and cutting interval on the fatty acid composition of
grasses. Grass Forage Sci. 56(1): 68-74.
Dierking, R. M., R. L. Kallenbach, and I. Grün. 2010. Effect of forage species on fatty acid
content and performance of pasture-finished steers. Meat Sci. 85(4): 597-605.
Dinius, D., and H. Cross. 1978. Feedlot performance, carcass characteristics and meat. J. Anim.
Sci. 47(5): 1109-1113.
Dinius, D., H. Goering, R. Oltjen, and H. Cross. 1978. Finishing beef steers on forage diets with
additives and supplemental lipid. J. Anim. Sci. 46(3): 761-768.
Dinius, D., R. Oltjen, and T. Rumsey. 1975. Pelleted forage diets plus supplemental energy and
feed additives for finishing beef cattle. J. Anim. Sci. 41(3): 868-875.
Dinius, D. A. 1978. Conserved pasture crops for finishing beef cattle. J. Anim. Sci. 47(3): 736-
746.
Drennan, M., and M. Lawlor. 1976. Evaluation of pelleted dried grass as a supplement to grass
silage for fattening steers. Anim. Prod. 22(01): 97-103.
Engle, T. E., and J. W. Spears. 2004. Effect of finishing system (feedlot or pasture), high-oil
maize, and copper on conjugated linoleic acid and other fatty acids in muscle of finishing
steers. Animal Science. 78(2): 261-270.
Ferguson, D. M., H. L. Bruce, J. M. Thompson, A. F. Egan, D. Perry, and W. R. Shorthose.
2001. Factors affecting beef palatability: Farmgate to chilled carcass. Aust. J. Exp. Agric.
41(7): 879-891.
Field, R. A., G. E. Nelms, and C. O. Schoonover. 1966. Effects of age, marbling and sex on
palatability of beef. J. Anim. Sci. 25(2): 360-366.

119
Fincham, J., J. Fontenot, W. Swecker, J. Herbein, J. Neel, G. Scaglia et al. 2009. Fatty acid
metabolism and deposition in subcutaneous adipose tissue of pasture- and feedlot-finished
cattle. J. Anim. Sci. 87(10): 3259-3277.
FitzGerald, R., E. Wolfe, R. Laby, and D. Hall. 1980. Beef production from lucerne and
subterranean clover pastures. 2. bloat occurrence and effect of anti-bloat capsules. Animal
Production Science. 20(107): 688-694.
Forrest, R. J. 1982. A comparison of the growth and carcass characteristics of steers reared on
pasture and finished for varying periods on corn or grass silage. Canadian Journal of
Animal Science. 62(4): 1079-1088.
Fortin, A., D. M. Veira, D. A. Froehlich, G. Butler, and J. G. Proulx. 1985. Carcass
characteristics and sensory properties of Hereford — Shorthorn bulls and steers fed
different levels of grass silage and high moisture barley. J. Anim. Sci. 60(6): 1403-1411.
French, P., E. O'Riordan, F. J. Monahan, P. J. Caffrey, M. Vidal, M. T. Mooney et al. 2000. Meat
quality of steers finished on autumn grass, grass silage or concentrate-based diets. Meat
Sci. 56(2): 173-180.
French, P., C. Stanton, F. Lawless, E. O'riordan, F. J. Monahan, P. J. Caffrey et al. 2000. Fatty
acid composition, including conjugated linoleic acid, of intramuscular fat from steers
offered grazed grass, grass silage, or concentrate-based diets. J. Anim. Sci. 78(11): 2849-
2855.
Fraser, M. D., M. H. Speijers, V. J. Theobald, R. Fychan, and R. Jones. 2004. Production
performance and meat quality of grazing lambs finished on red clover, lucerne or perennial
ryegrass swards. Grass Forage Sci. 59(4): 345-356.
Galyean, M. L., C. Ponce, and J. Schutz. 2011. The future of beef production in North America.
Animal Frontiers. 1(2): 29-36.
Garcia, P., N. Pensel, A. Sancho, N. Latimori, A. Kloster, M. Amigone et al. 2008. Beef lipids in
relation to animal breed and nutrition in Argentina. Meat Sci. 79(3): 500-508.
Garmyn, A., G. Hilton, R. Mateescu, and D. VanOverbeke. 2010. Effects of concentrate-versus
forage-based finishing diet on carcass traits, beef palatability, and color stability in
longissimus muscle from Angus heifers. The Professional Animal Scientist. 26(6): 579-
586.
Gatellier, P., Y. Mercier, H. Juin, and M. Renerre. 2005. Effect of finishing mode (pasture-or
mixed-diet) on lipid composition, colour stability and lipid oxidation in meat from
Charolais cattle. Meat Sci. 69(1): 175-186.
Glimp, H., M. Dikeman, H. Tuma, K. Gregory, and L. Cundiff. 1971. Effect of sex condition on
growth and carcass traits of male Hereford and Angus cattle. J. Anim. Sci. 33(6): 1242-
1247.

120
Goll, D. E., D. W. Henderson, and E. A. Kline. 1964. Post-�Mortem changes in physical and
chemical properties of bovine muscle. J. Food Sci. 29(5): 590-596.
Gregory, K. E., L. V. Cundiff, R. M. Koch, M. E. Dikeman, and M. Koohmaraie. 1994. Breed
effects, retained heterosis, and estimates of genetic and phenotypic parameters for carcass
and meat traits of beef cattle. J. Anim. Sci. 72(5): 1174-1183.
Grundy, S. M., and G. L. Vega. 1988. Plasma cholesterol responsiveness to saturated fatty acids.
Am. J. Clin. Nutr. 47(5): 822-824.
Hall, D., R. FitzGerald, E. Wolfe, and B. Cullis. 1980. Beef production from lucerne and
subterranean clover pastures. 3. Composition and quality of the diet selected. Animal
Production Science. 20(107): 695-702.
Harfoot, C., and G. Hazlewood. 1997. Lipid Metabolism in the Rumen. Pages 382-426 in The
Rumen Microbial Ecosystem. Springer.
Harrison, A., M. Smith, D. Allen, M. Hunt, C. Klastner, and D. Kroft. 1978. Nutritional regime
effects on quality and yield characteristics of beef. J. Anim. Sci. 47(2): 383.
Helene, V. P., J. Seoane, and P. M. Flipot. 1985. Digestibility and voluntary intake of forages fed
as hay or wilted silage to beef steers. Canadian Journal of Animal Science. 65(4): 879-889.
Huffman, K. L., M. F. Miller, L. C. Hoover, C. K. Wu, H. C. Brittin, and C. B. Ramsey. 1996.
Effect of beef tenderness on consumer satisfaction with steaks consumed in the home and
restaurant. J. Anim. Sci. 74(1): 91-97.
Itoh, M., C. B. Johnson, G. P. Cosgrove, P. D. Muir, and R. W. Purchas. 1999. Intramuscular
fatty acid composition of neutral and polar lipids for heavy-weight Angus and Simmental
steers finished on pasture or grain. J. Sci. Food Agric. 79(6): 821-827.
Kelly, M., E. Kolver, D. Bauman, M. Van Amburgh, and L. Muller. 1998. Effect of intake of
pasture on concentrations of conjugated linoleic acid in milk of lactating cows. J. Dairy
Sci. 81(6): 1630-1636.
Kerth, C. R., K. W. Braden, R. Cox, L. K. Kerth, and D. L. Rankins. 2007. Carcass, sensory, fat
color, and consumer acceptance characteristics of Angus-cross steers finished on ryegrass
(lolium multiflorum) forage or on a high-concentrate diet. Meat Sci. 75(2): 324-331.
Kilcher, M. 1982. Beef production from grass-alfalfa pastures grown in different stand patterns
in a semiarid region of the Canadian prairies. Canadian Journal of Plant Science. 62(1):
117-124.
Koohmaraie, M. 1996. Biochemical factors regulating the toughening and tenderization
processes of meat. Meat Sci. 43: 193-201.

121
Koohmaraie, M., A. S. Babiker, R. A. Merkel, and T. R. Dutson. 1988. Role of Ca++
-�Dependent
proteases and lysosomal enyzmes in postmortem changes in bovine skeletal muscle. J.
Food Sci. 53(5): 1253-1257.
Kris-Etherton, P., S. Innis, and D. A. Ammerican. 2007. Position of the American dietetic
association and dietitians of Canada: Dietary fatty acids. J. Am. Diet. Assoc. 107(9): 1599.
Laborde, F. L., I. B. Mandell, J. J. Tosh, J. W. Wilton, and J. Buchanan-Smith. 2001. Breed
effects on growth performance, carcass characteristics, fatty acid composition, and
palatability attributes in finishing steers. J. Anim. Sci. 79(2): 355-365.
Lanari, M. C., M. Brewster, A. Yang, and R. K. Tume. 2002. Pasture and grain finishing affect
the color stability of beef. J. Food Sci. 67(7): 2467-2473.
Larick, D., H. Hedrick, M. Bailey, J. Williams, D. Hancock, G. Garner et al. 1987. Flavor
constituents of beef as influenced by Forage‐ and Grain‐Feeding. J. Food Sci. 52(2): 245-
251.
Larick, D., and B. Turner. 1990. Flavor characteristics of Forage‐and Grain‐Fed beef as
influenced by phospholipid and fatty acid compositional differences. J. Food Sci. 55(2):
312-317.
Lee, K. N., D. Kritchevsky, and M. W. Pariza. 1994. Conjugated linoleic acid and atherosclerosis
in rabbits. Atherosclerosis. 108(1): 19.
Leheska, J. M., L. D. Thompson, J. C. Howe, E. Hentges, J. Boyce, J. C. Brooks et al. 2008.
Effects of conventional and grass-feeding systems on the nutrient composition of beef. J.
Anim. Sci. 86(12): 3575-3585.
Long, C. R., and K. E. Gregory. 1975. Heterosis and management effects in carcass characters of
Angus, Hereford and reciprocal cross cattle. J. Anim. Sci. 41(6): 1572-1580.
Lourenco, M., G. Van Ranst, B. Vlaeminck, S. De Smet, and V. Fievez. 2008. Influence of
different dietary forages on the fatty acid composition of rumen digesta as well as ruminant
meat and milk. Anim. Feed Sci. Technol. 145(1): 418-437.
Lozier, J., E. Rayburn, and J. Shaw. 2006. The decision to finish cattle on pasture: An
ethnographic approach. J. Sustainable Agric. 28(3): 5-23.
Lunt, D., G. Smith, F. McKeith, J. Savell, M. Riewe, F. Horn et al. 1985. Techniques for
predicting beef carcass composition. J. Anim. Sci. 60(5): 1201-1207.
Mandell, I., J. Buchanan-Smith, and C. Campbell. 1998. Effects of forage vs grain feeding on
carcass characteristics, fatty acid composition, and beef quality in Limousin-cross steers
when time on feed is controlled. J. Anim. Sci. 76(10): 2619.

122
Mandell, I., E. Gullett, J. Buchanan-Smith, and C. Campbell. 1997. Effects of diet and slaughter
endpoint on carcass composition and beef quality in charolais cross steers. Canadian
Journal of Animal Science. 77(3): 403-414.
May, S. G., H. G. Dolezal, D. R. Gill, F. K. Ray, and D. S. Buchanan. 1992. Effect of days fed,
carcass grade traits, and subcutaneous fat removal on postmortem muscle characteristics
and beef palatability. J. Anim. Sci. 70(2): 444-453.
McCaughey, W. P., and R. L. Cliplef. 1996. Carcass and organoleptic characteristics of meat
from steers grazed on alfalfa/grass pastures and finished on grain. Canadian Journal of
Animal Science. 76(1): 149-152.
McCluskey, J. J., T. I. Wahl, Q. Li, and P. R. Wandschneider. 2005. US grass-fed beef:
Marketing health benefits. Journal of Food Distribution Research. 36(3): 1.
Melton, S. 1983. Effect of forage feeding on beef flavor. Food Technol. 37(5): 239-248.
Melton, S., M. Amiri, G. Davis, and W. Backus. 1982. Flavor and chemical characteristics of
ground beef from grass-, forage-grain-and grain-finished steers. J. Anim. Sci. 55(1): 77.
Mitchell, G. E., A. W. Reed, and S. A. Rogers. 1991. Influence of feeding regimen on the
sensory qualities and fatty acid contents of beef steaks. J. Food Sci. 56(4): 1102-1103.
Moloney, A., M. Mooney, J. Kerry, C. Stanton, and P. O’Kiely. 2013. Colour of fat, and colour,
fatty acid composition and sensory characteristics of muscle from heifers offered
alternative forages to grass silage in a finishing ration. Meat Sci. 95(3): 608-615.
Moore, V., K. Jury, and J. Bass. 1978. Organoleptic assessment of meat: A comparison of beef
breeds. Int. J. Food Sci. Tech. 13(3): 211-215.
Mozaffarian, D., M. B. Katan, A. Ascherio, M. J. Stampfer, and W. C. Willett. 2006. Trans fatty
acids and cardiovascular disease. N. Engl. J. Med. 354(15): 1601-1613.
Muchenje, V., M. Chimonyo, K. Dzama, P. E. Strydom, T. Ndlovu, and J. G. Raats. 2010.
Relationship between off-flavor descriptors and flavor scores in beef from cattle raised on
natural pasture. Journal of Muscle Foods. 21(3): 424-432.
Muir, P., N. Smith, G. Wallace, G. Cruickshank, and D. Smith. 1998. The effect of short‐term
grain feeding on liveweight gain and beef quality. N. Z. J. Agric. Res. 41(4): 517-526.
Nelson, M., J. Busboom, C. Ross, and J. O’Fallon. 2008. Effects of supplemental fat on growth
performance and quality of beef from steers fed corn finishing diets. J. Anim. Sci. 86(4):
936-948.
Nuernberg, K., D. Dannenberger, G. Nuernberg, K. Ender, J. Voigt, N. D. Scollan et al. 2005.
Effect of a grass-based and a concentrate feeding system on meat quality characteristics
123
and fatty acid composition of longissimus muscle in different cattle breeds. Livest. Prod.
Sci. 94(1): 137-147.
O’Fallon, J., J. Busboom, M. Nelson, and C. Gaskins. 2007. A direct method for fatty acid
methyl ester synthesis: Application to wet meat tissues, oils, and feedstuffs. J. Anim. Sci.
85(6): 1511-1521.
Ojima, K., and T. Isawa. 1968. The variation of carbohydrates in various species of grasses and
legumes. Canadian Journal of Botany. 46(12): 1507-1511.
Oltjen, R. R., T. S. Rumsey, and P. A. Putnam. 1971. All-forage diets for finishing beef cattle. J.
Anim. Sci. 32(2): 327-333.
O'Sullivan, A., K. O'Sullivan, K. Galvin, A. P. Moloney, D. J. Troy, and J. P. Kerry. 2004.
Influence of concentrate composition and forage type on retail packaged beef quality. J.
Anim. Sci. 82(8): 2384-2391.
Papadopoulos, Y. A., H. T. Kunelius, and A. H. Fredeen. 1993. Factors influencing pasture
productivity in atlantic Canada. Canadian Journal of Animal Science. 73(4): 699-713.
Park, Y., K. J. Albright, W. Liu, J. M. Storkson, M. E. Cook, and M. W. Pariza. 1997. Effect of
conjugated linoleic acid on body composition in mice. Lipids. 32(8): 853-858.
Pelletier, N., R. Pirog, and R. Rasmussen. 2010. Comparative life cycle environmental impacts
of three beef production strategies in the upper midwestern United States. Agricultural
Systems. 103(6): 380-389.
Perry, D., J. Thompson, I. Hwang, A. Butchers, and A. Egan. 2001. Relationship between
objective measurements and taste panel assessment of beef quality. Aust. J. Exp. Agric.
41(7): 981-1012.
Petit, H. V., and P. M. Flipot. 1992a. Feed utilization of beef steers fed grass as hay or silage
with or without nitrogen supplementation. J. Anim. Sci. 70(3): 876-883.
Petit, H. V., and P. M. Flipot. 1992b. Source and feeding level of nitrogen on growth and carcass
characteristics of beef steers fed grass as hay or silage. J. Anim. Sci. 70(3): 867-875.
Pordomingo, A., G. Grigioni, F. Carduza, and G. V. Lagreca. 2011. Effect of feeding treatment
during the backgrounding phase of beef production from pasture on: I. animal
performance, carcass and meat quality. Meat Sci.
Poulson, C., T. Dhiman, A. Ure, D. Cornforth, and K. Olson. 2004. Conjugated linoleic acid
content of beef from cattle fed diets containing high grain, CLA, or raised on forages.
Livest. Prod. Sci. 91(1): 117-128.
Priolo, A., D. Micol, and J. Agabriel. 2001. Effects of grass feeding systems on ruminant meat
colour and flavour. A review. Animal Research. 50(3): 185-200.

124
Priyanto, R., E. Johnson, and D. Taylor. 1993. Prediction of carcass composition in heavy-
weight grass-fed and grain-fed beef cattle. Animal Production-Glasgow-. 57: 65-65.
Purchas, R., and H. L. Davies. 1974. Carcass and meat quality of Friesian steers fed on either
pasture or barley. Crop and Pasture Science. 25(1): 183-192.
Raes, K., S. De Smet, and D. Demeyer. 2004. Effect of dietary fatty acids on incorporation of
long chain polyunsaturated fatty acids and conjugated linoleic acid in lamb, beef and pork
meat: A review. Anim. Feed Sci. Technol. 113(1): 199-221.
Renerre, M. 2000. Oxidative processes and myoglobin. Antioxidants in Muscle Foods.OCED,
New York, NY, USA. : 113-135.
Reverte, D., Y. Xiong, and W. Moody. 2003. Properties of restructured beef steaks from forage-
and grain-fed cattle as affected by antioxidant and flavoring agents. Meat Sci. 65(1): 539-
546.
Roberts, S. D., C. R. Kerth, K. W. Braden, D. Rankins Jr, L. Kriese-Anderson, and J. W. Prevatt.
2009. Finishing steers on winter annual ryegrass (lolium multiflorum lam.) with varied
levels of corn supplementation I: Effects on animal performance, carcass traits, and forage
quality. J. Anim. Sci. 87(8): 2690-2699.
Rumsey, T. S., R. R. Oltjen, K. P. Bovard, and B. M. Priode. 1972. Influence of widely diverse
finishing regimens and breeding on depot fat composition in beef cattle. J. Anim. Sci.
35(5): 1069-1075.
Sapp, P. H., S. E. Williams, and M. A. McCann. 1999. Sensory attributes and retail display
characteristics of pasture- and/or grain-fed beef aged 7, 14 or 21 days. J. Food Qual. 22(3):
257-274.
Scaglia, G., J. P. Fontenot, W. Swecker Jr, B. A. Corl, S. K. Duckett, H. T. Boland et al. 2012.
Performance, carcass, and meat characteristics of beef steers finished on 2 different forages
or on a high-concentrate diet. The Professional Animal Scientist. 28(2): 194-203.
Schaake, S., G. Skelley, E. Halpin, L. Grimes, R. Brown, D. Cross et al. 1993. Carcass and meat
sensory traits of steers finished on fescue and clover, summer forage, or for different
periods in drylot. J. Anim. Sci. 71(12): 3199-3205.
Schenkel, F. S., S. P. Miller, and J. W. Wilton. 2004. Genetic parameters and breed differences
for feed efficiency, growth, and body composition traits of young beef bulls. Canadian
Journal of Animal Science. 84(2): 177-185.
Schroeder, J., D. Cramer, R. Bowling, and C. Cook. 1980. Palatability, shelflife and chemical
differences between forage-and grain-finished beef. J. Anim. Sci. 50(5): 852.

125
Shackelford, S. D., J. B. Morgan, H. R. Cross, and J. W. Savell. 1991. Identification of threshold
levels for Warner-Bratzler shear force in beef top loin steaks. Journal of Muscle Foods.
2(4): 289-296.
Shain, D., T. Klopfenstein, R. Stock, B. Vieselmeyer, and G. Erickson. 2005. Evaluation of
grazing alternate summer and fall forages in extensive beef cattle production systems. The
Professional Animal Scientist. 21(5): 390-402.
Shingfield, K. J., C. K. Reynolds, B. Lupoli, V. Toivonen, M. Yurawecz, P. Delmonte et al.
2005. Effect of forage type and proportion of concentrate in the diet on milk fatty acid
composition in cows given sunflower oil and fish oil. Anim.Sci. 80: 225-238.
Shultz, T. D., B. P. Chew, W. R. Seaman, and L. O. Luedecke. 1992. Inhibitory effect of
conjugated dienoic derivatives of linoleic acid and [beta]-carotene on the in vitro growth of
human cancer cells. Cancer Lett. 63(2): 125-133.
Simopoulos, A. P. 1999. Essential fatty acids in health and chronic disease. Am. J. Clin. Nutr.
70(3): 560S-569S.
Sitz, B., C. R. Calkins, D. M. Feuz, W. J. Umberger, and K. M. Eskridge. 2005. Consumer
sensory acceptance and value of domestic, Canadian, and Australian grass-fed beef steaks.
J. Anim. Sci. 83(12): 2863.
Smith Jr, S., A. Singh, M. Phillips, T. Terrill, D. Belesky, and J. Berdahl. 2000. Future of alfalfa
as a grazing crop in North America. Proceedings/Reports of the American forage and
grassland council, 37th North American alfalfa improvement conference, Madison,
Wisconsin, July 16-19, 2000.
Spanier, A. M., K. W. McMillin, and J. A. Miller. 1990. Enzyme activity levels in beef: Effect of
postmortem aging and End-point cooking temperature. J. Food Sci. 55(2): 318-322.
Stanton, T., and D. Schutz. 2000. Effect of switching from high grain to hay five days prior to
slaughter on finishing cattle performance. Colorado State University Research
Report.Colorado State University, Fort Collins, CO.
Steen, R. W. J., and D. J. Kilpatrick. 1998. Effects of pasture grazing or storage feeding and
concentrate input between 5.5 and 11 months of age on the performance and carcass
composition of bulls and on subsequent growth and carcass composition at 620 kg live
weight. J. Anim. Sci. 66(1): 129–141.
Steen, R., N. Lavery, D. Kilpatrick, and M. Porter. 2003. Effects of pasture and high-concentrate
diets on the performance of beef cattle, carcass composition at equal growth rates, and the
fatty acid composition of beef. N. Z. J. Agric. Res. 46(2): 69-81.
Stelzleni, A. M., and D. D. Johnson. 2008. Effect of days on concentrate feed on sensory off-
flavor score, off-flavor descriptor and fatty acid profiles for selected muscles from cull beef
cows. Meat Sci. 79(2): 382-393.
126
Stevenson, F. J. 1982. Nitrogen in agricultural soils. American Society of Agronomy.
Stone, H., and J. Sidel. 2003. Descriptive analysis in “Encyclopedia of food science”.
Streiter, P. J., C. Campbell, and I. Mandell. 2012. The effects of skeletal separation and moisture
enhancement for improving the eating quality of cull cow beef. Meat Sci. 92(4): 400-408.
Tansawat, R., C. A. Maughan, R. E. Ward, S. Martini, and D. P. Cornforth. 2013. Chemical
characterisation of pasture‐and grain‐fed beef related to meat quality and flavour
attributes. Int. J. Food Sci. Tech. 48(3): 484-495.
Thomas, J., J. Sykes, and L. Moore. 1959. Comparison of alfalfa hay and alfalfa silage alone and
with supplements of grain, hay, or corn silage for growing dairy calves. J. Dairy Sci. 42(4):
651-657.
Turner, T., A. Hessle, K. Lundström, and J. Pickova. 2011. Silage-concentrate finishing of bulls
versus silage or fresh forage finishing of steers: Effects on fatty acids and meat tenderness.
Acta Agriculturae Scandinavica, Section A-Animal Science. 61(2): 103-113.
Uhart, B. A., and F. D. Carroll. 1967. Acidosis in beef steers. J. Anim. Sci. 26(5): 1195-1198.
Umberger, W. J., D. M. Feuz, C. R. Calkins, and K. Killinger‐Mann. 2002. US consumer
preference and willingness‐to‐pay for domestic corn‐fed beef versus international
grass‐fed beef measured through an experimental auction. Agribusiness. 18(4): 491-504.
Utley, P. R., R. E. Hellwig, and W. C. McCormick. 1975. Finishing beef cattle for slaughter on
all-forage diets. J. Anim. Sci. 40(6): 1034-1038.
Vanzant, E., R. Cochran, E. Titgemeyer, S. Stafford, K. Olson, D. Johnson et al. 1996. In vivo
and in situ measurements of forage protein degradation in beef cattle. J. Anim. Sci. 74(11):
2773-2784.
Vanzant, E. S., and R. C. Cochran. 1994. Performance and forage utilization by beef cattle
receiving increasing amounts of alfalfa hay as a supplement to low-quality, tallgrass-prairie
forage. J. Anim. Sci. 72(4): 1059-1067.
Varela, A., B. Oliete, T. Moreno, C. Portela, L. Monserrrat, J. Carballo et al. 2004. Effect of
pasture finishing on the meat characteristics and intramuscular fatty acid profile of steers of
the Rubia Gallega breed. Meat Sci. 67(3): 515-522.
Vatansever, L., E. Kurt, M. Enser, G. Nute, N. Scollan, J. Wood et al. 2000. Shelf life and eating
quality of beef from cattle of different breeds given diets differing in n-3 polyunsaturated
fatty acid composition. Animal Science. 71(3): 471-482.
Wagner, M. W., K. M. Havstad, D. E. Doornbos, and E. L. Ayers. 1986. Forage intake of
rangeland beef cows with varying degrees of crossbred influence. J. Anim. Sci. 63(5):
1484-1490.
127
Walsh, K., P. O'Kiely, A. P. Moloney, and T. M. Boland. 2008. Intake, performance and carcass
characteristics of beef cattle offered diets based on whole-crop wheat or forage maize
relative to grass silage or ad libitum concentrates. Livestock Science. 116(1): 223-236.
Warren, H. E., N. D. Scollan, M. Enser, S. I. Hughes, R. I. Richardson, and J. D. Wood. 2008.
Effects of breed and a concentrate or grass silage diet on beef quality in cattle of 3 ages. I:
Animal performance, carcass quality and muscle fatty acid composition. Meat Sci. 78(3):
256-269.
Wheeler, T., L. Cundiff, S. Shackelford, and M. Koohmaraie. 2010. Characterization of
biological types of cattle (cycle VIII): Carcass, yield, and longissimus palatability traits. J.
Anim. Sci. 88(9): 3070.
Whiting, C., T. Mutsvangwa, J. Walton, J. Cant, and B. McBride. 2004. Effects of feeding either
fresh alfalfa or alfalfa silage on milk fatty acid content in Holstein dairy cows. Anim. Feed
Sci. Technol. 113(1): 27-37.
Williams, J., D. Wagner, L. Walters, G. Horn, G. Waller, P. Sims et al. 1983. Effect of
production systems on performance, body composition and lipid and mineral profiles of
soft tissue in cattle. J. Anim. Sci. 57(4): 1020-1028.
Wolfe, E., R. FitzGerald, D. Hall, and O. Southwood. 1980. Beef production from lucerne and
subterranean clover pastures. 1. The effects of pasture, stocking rate and supplementary
feeding. Animal Production Science. 20(107): 678-687.
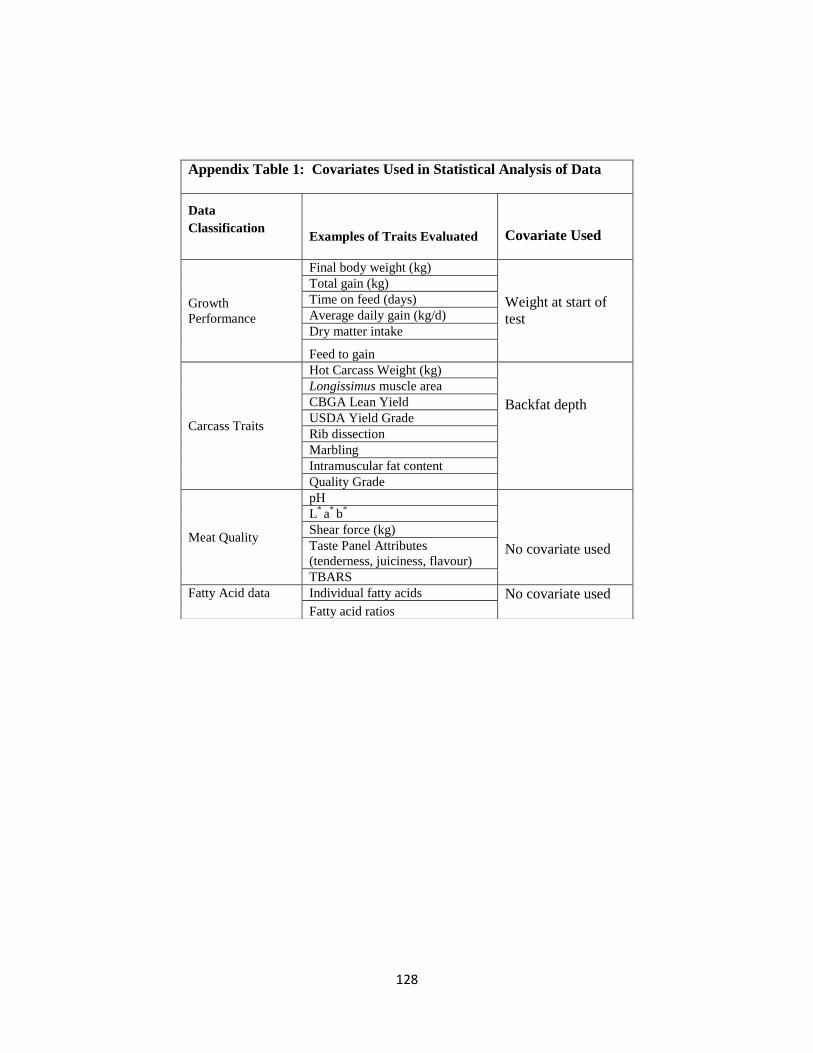
128
Appendix Table 1: Covariates Used in Statistical Analysis of Data
Data
Classification Examples of Traits Evaluated
Covariate Used
Growth
Performance
Final body weight (kg)
Weight at start of
test
Total gain (kg)
Time on feed (days)
Average daily gain (kg/d)
Dry matter intake
Feed to gain
Carcass Traits
Hot Carcass Weight (kg)
Backfat depth
Longissimus muscle area
CBGA Lean Yield
USDA Yield Grade
Rib dissection
Marbling
Intramuscular fat content
Quality Grade
Meat Quality
pH
No covariate used
L* a
* b
*
Shear force (kg)
Taste Panel Attributes
(tenderness, juiciness, flavour)
TBARS
Fatty Acid data Individual fatty acids No covariate used
Fatty acid ratios
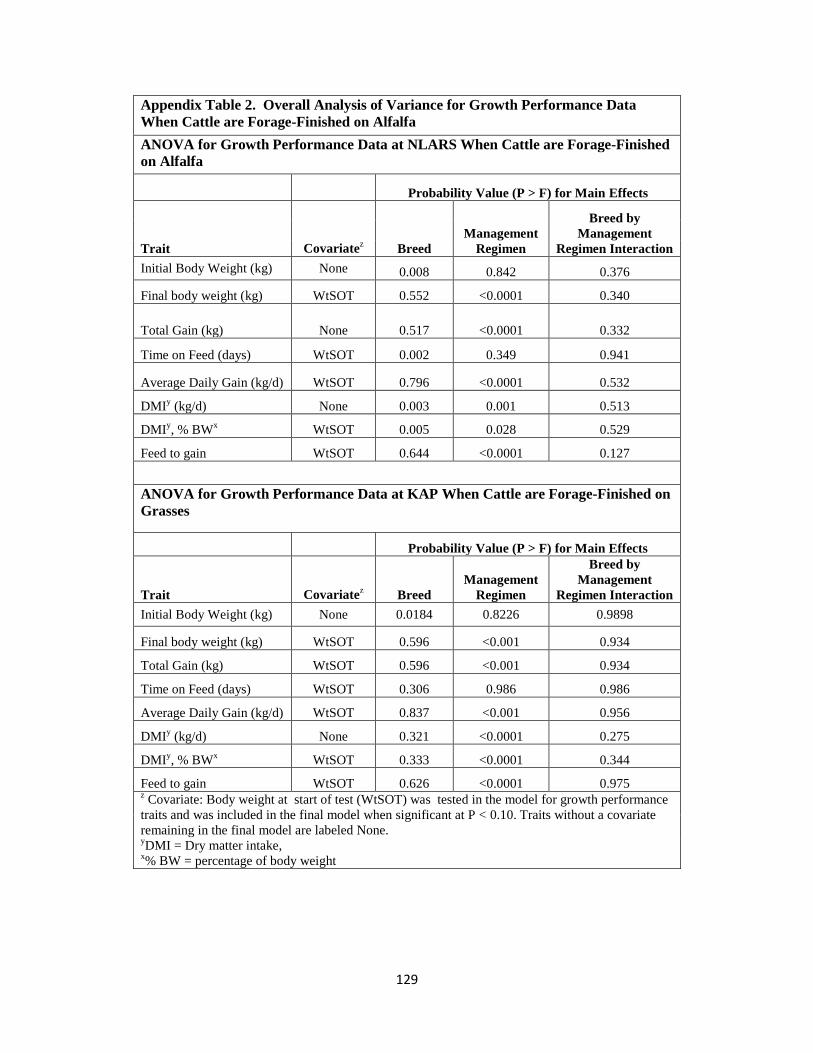
129
Appendix Table 2. Overall Analysis of Variance for Growth Performance Data
When Cattle are Forage-Finished on Alfalfa
ANOVA for Growth Performance Data at NLARS When Cattle are Forage-Finished
on Alfalfa
Probability Value (P > F) for Main Effects
Trait Covariatez Breed
Management
Regimen
Breed by
Management
Regimen Interaction
Initial Body Weight (kg) None 0.008 0.842 0.376
Final body weight (kg) WtSOT 0.552 <0.0001 0.340
Total Gain (kg) None 0.517 <0.0001 0.332
Time on Feed (days) WtSOT 0.002 0.349 0.941
Average Daily Gain (kg/d) WtSOT 0.796 <0.0001 0.532
DMIy (kg/d) None 0.003 0.001 0.513
DMIy, % BW
x WtSOT 0.005 0.028 0.529
Feed to gain WtSOT 0.644 <0.0001 0.127
ANOVA for Growth Performance Data at KAP When Cattle are Forage-Finished on
Grasses
Probability Value (P > F) for Main Effects
Trait Covariatez
Breed
Management
Regimen
Breed by
Management
Regimen Interaction
Initial Body Weight (kg) None 0.0184 0.8226 0.9898
Final body weight (kg) WtSOT 0.596 <0.001 0.934
Total Gain (kg) WtSOT 0.596 <0.001 0.934
Time on Feed (days) WtSOT 0.306 0.986 0.986
Average Daily Gain (kg/d) WtSOT 0.837 <0.001 0.956
DMIy (kg/d) None 0.321 <0.0001 0.275
DMIy, % BW
x WtSOT 0.333 <0.0001 0.344
Feed to gain WtSOT 0.626 <0.0001 0.975 z Covariate: Body weight at start of test (WtSOT) was tested in the model for growth performance
traits and was included in the final model when significant at P < 0.10. Traits without a covariate
remaining in the final model are labeled None. yDMI = Dry matter intake,
x% BW = percentage of body weight

130
Appendix Table 3: Overall Analysis of Variance of Carcass Characteristics When Cattle are Forage-
Finished on Alfalfa
Probability Value (P > F) for Main Effects
Trait Covariatez Breed
Management
Regimen
Breed by
Management
Regimen
Interaction
Hot Carcass Weight (kg) BFAT <0.0001 <0.001 0.186
Backfat (mm)* None 0.613 <0.001 0.590
Longissimus muscle area (LMA)
(cm2)* None 0.008 0.242 0.345
Adj LMAy*
BFAT 0.899 0.556 0.5151
CBGA Lean Yieldx BFAT 0.300 0.009 0.396
USDA Yield Gradew*
BFAT 0.327 0.001 0.4233
Rib Dissectionv
% Lean None 0.184 <0.0001 0.719
% Fat None 0.379 <0.0001 0.283
% Bone None 0.056 0.103 0.999
Marbling u*
BFAT 0.011 0.114 0.166
Quality Gradet*
BFAT 0.091 0.607 0.714
IMFs, % for LM None 0.083 0.940 0.368
IMFs, % for ST None 0.511 0.026 0.472
Colour* None 0.171 0.190 0.092 *These values were obtained using camera measurements at the processing facility
zCovariate: Backfat depth (BFAT) was tested in the model for carcass traits and was included in the final
model when significant at P < 0.10. Traits without a covariate remaining in the final model are labelled
None. yAdjusted longissimus muscle area is was adjusted to 100 kg hot carcass weight (HCW) (cm
2/100 kg
HCW) xCBGA (Canadian Beef Grading Agency) Yield is predicted using the following equation: Lean % = 63.65
+ 1.05 (muscle score) – 0.76 (grade fat) wUSDA Yield Grade. Determined from the expected % of boneless, closely trimmed retail cuts
(%BCTRC) ( 1 >52.3, 5 < 45.4) vRib dissection includes the separation of a rib section into lean, fat, and bone components which are
expressed as a % of rib weight
u Marbling value: Practically Devoid = 200 to 299, Traces = 300 to 399, Slight = 400 to 499; Small = 500
to 599; Modest = 600 to 699. tQuality Grades were converted to a numeric value as follows: Prime= 4, AAA=3, AA=2, A=1, <AB1, B2,
B3, B4 =0 sIntramuscular fat content
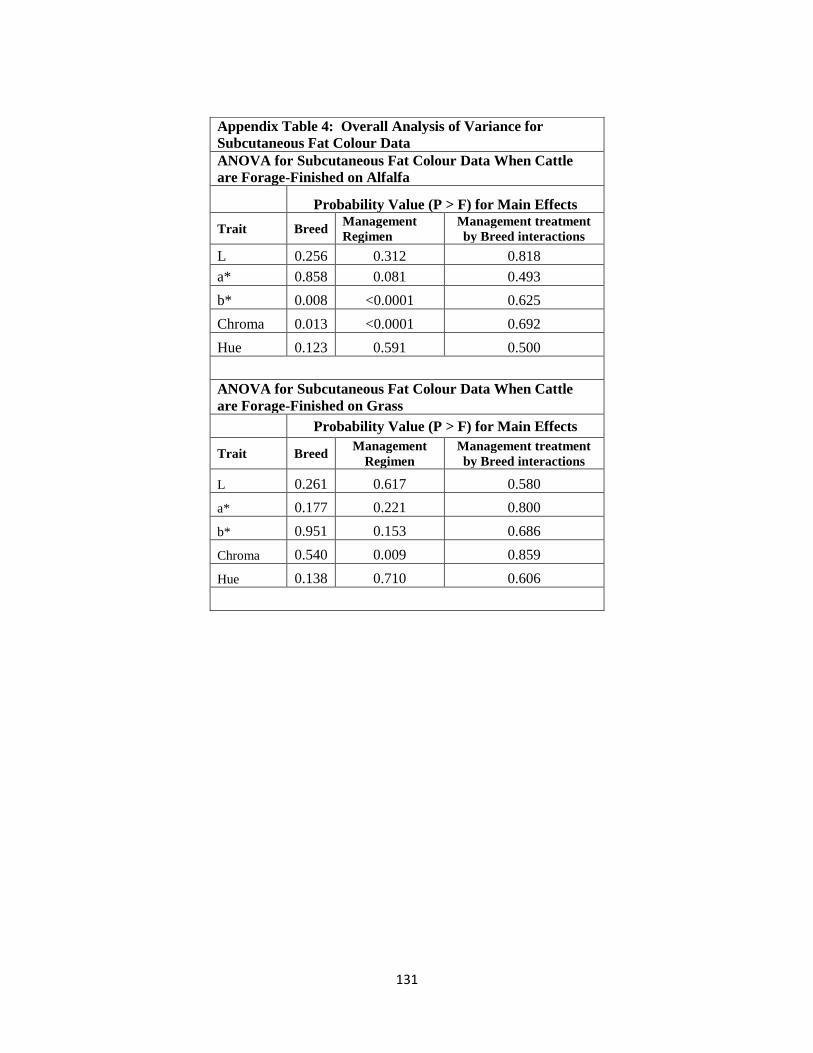
131
Appendix Table 4: Overall Analysis of Variance for
Subcutaneous Fat Colour Data
ANOVA for Subcutaneous Fat Colour Data When Cattle
are Forage-Finished on Alfalfa
Probability Value (P > F) for Main Effects
Trait Breed Management
Regimen
Management treatment
by Breed interactions
L 0.256 0.312 0.818
a* 0.858 0.081 0.493
b* 0.008 <0.0001 0.625
Chroma 0.013 <0.0001 0.692
Hue 0.123 0.591 0.500
ANOVA for Subcutaneous Fat Colour Data When Cattle
are Forage-Finished on Grass
Probability Value (P > F) for Main Effects
Trait Breed Management
Regimen Management treatment
by Breed interactions
L 0.261 0.617 0.580
a* 0.177 0.221 0.800
b* 0.951 0.153 0.686
Chroma 0.540 0.009 0.859
Hue 0.138 0.710 0.606

132
Appendix Table 5: Overall Analysis of Variance for Longissimus Colour
Data
ANOVA for Longissimus Colour Data When Cattle are Forage-Finished on
Alfalfa z
Probability Value (P > F) for Main Effects
Trait Breed Management
Regimen
Management treatment
by Breed interactions
pH 0.208 0.302 0.523
L 0.222 0.366 0.119
a* 0.907 0.011 0.050
b* 0.387 0.051 0.987
Chroma 0.954 0.010 0.084
Hue 0.321 0.121 0.874
Drip Loss (%) 0.180 0.429 0.010
TBARS ( ng
MDA/g)z 0.016 0.012 0.286
ANOVA for Longissimus Colour Data When Cattle are Forage-Finished on
Grass z
Probability Value (P > F) for Main Effects
Trait Breed Management
Regimen
Management treatment
by Breed interactions
pH 0.468 0.173 0.153
L 0.098 0.009 0.895
a* 0.439 0.496 0.008
b* 0.375 0.008 0.112
Chroma 0.415 0.258 0.008
Hue 0.306 0.006 0.289
Drip Loss (%)z
0.071 0.406 0.787
TBARS z (ng
MDA/g)w
0.020 0.003 0.226
zSteaks aged for 14 days + 5 days on shelf
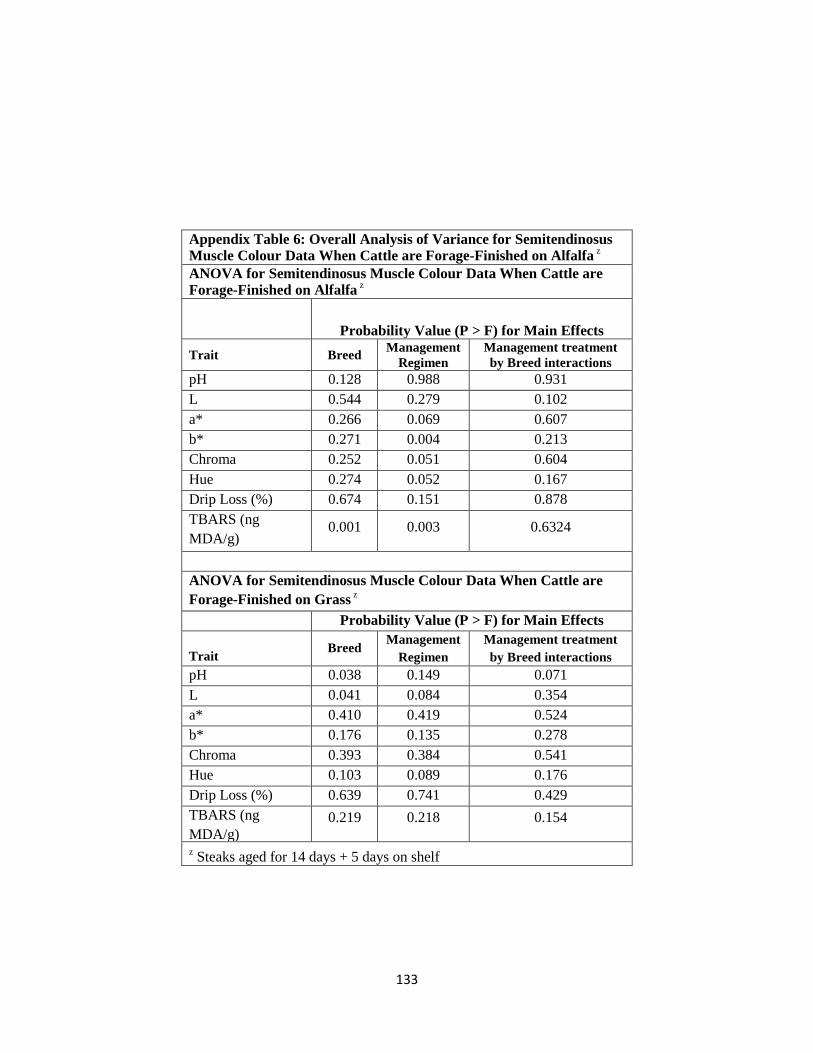
133
Appendix Table 6: Overall Analysis of Variance for Semitendinosus
Muscle Colour Data When Cattle are Forage-Finished on Alfalfa z
ANOVA for Semitendinosus Muscle Colour Data When Cattle are
Forage-Finished on Alfalfa z
Probability Value (P > F) for Main Effects
Trait Breed Management
Regimen
Management treatment
by Breed interactions
pH 0.128 0.988 0.931
L 0.544 0.279 0.102
a* 0.266 0.069 0.607
b* 0.271 0.004 0.213
Chroma 0.252 0.051 0.604
Hue 0.274 0.052 0.167
Drip Loss (%)
0.674 0.151 0.878
TBARS (ng
MDA/g)
0.001 0.003 0.6324
ANOVA for Semitendinosus Muscle Colour Data When Cattle are
Forage-Finished on Grass z
Probability Value (P > F) for Main Effects
Trait Breed
Management
Regimen
Management treatment
by Breed interactions
pH 0.038 0.149 0.071
L 0.041 0.084 0.354
a* 0.410 0.419 0.524
b* 0.176 0.135 0.278
Chroma 0.393 0.384 0.541
Hue 0.103 0.089 0.176
Drip Loss (%) 0.639 0.741 0.429
TBARS (ng
MDA/g)
0.219 0.218 0.154
z Steaks aged for 14 days + 5 days on shelf

134
Appendix Table 7: Overall Analysis of Variance for Fatty Acid
Composition Data of the Longissimus Muscle When Cattle are Forage-
Finished on Alfalfa
Probability Value (P > F) for Main Effects
Fatty Acids Breed
Management
Regimen
Breed by Management
Regimen Interaction
C14:0 0.144 <0.0001 0.780
C16:0 0.105 <0.0001 0.266
C16:1 0.383 <0.001 0.883
C17:0 0.642 <0.0001 0.675
C18:0 0.100 0.001 0.540
C18:1tv 0.359 0.060 0.900
C18:1o 0.364 0.001 0.686
C18:1v 0.092 0.002 0.582
C18:2 0.870 0.003 0.223
C18:3g 0.681 0.077 0.910
C18:3a 0.198 <0.0001 0.271
C20:0 0.655 <0.0001 0.801
CLA cis-9,trans-11 0.007 <0.0001 0.930
CLA trans-10, cis-12 0.023 0.048 0.231
C20:1 0.200 0.550 0.290
C20:2 <0.0001 0.014 0.181
C20:3 0.131 <0.0001 0.177
C20:4 0.004 0.011 0.296
C20:3b 0.488 0.029 0.470
C22:0 0.998 <0.0001 0.592
C20:5 0.951 0.006 0.342
C22:4 0.001 0.393 0.276
C22:5 0.272 0.004 0.268
C22:6 0.001 0.012 0.497
SFA 0.870 0.277 0.918
MUFA 0.313 <0.0001 0.459
PUFA 0.387 0.045 0.236
n-6 fatty acids 0.167 0.059 0.260
n-3 fatty acids 0.761 <0.0001 0.263
n-6:n-3 ratio 0.005 <0.0001 0.903
PUFA:SFA ratio 0.335 0.016 0.331 s See Table 2 for fatty acid nomenclature
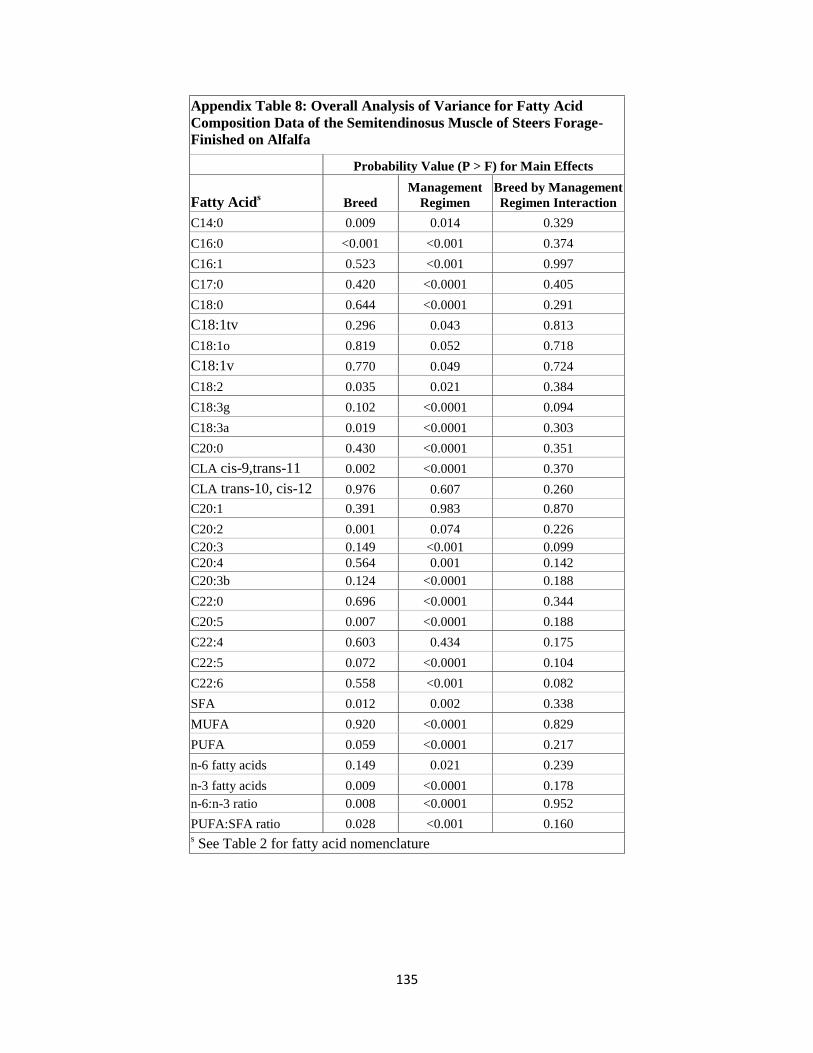
135
Appendix Table 8: Overall Analysis of Variance for Fatty Acid
Composition Data of the Semitendinosus Muscle of Steers Forage-
Finished on Alfalfa
Probability Value (P > F) for Main Effects
Fatty Acids Breed
Management
Regimen
Breed by Management
Regimen Interaction
C14:0 0.009 0.014 0.329
C16:0 <0.001 <0.001 0.374
C16:1 0.523 <0.001 0.997
C17:0 0.420 <0.0001 0.405
C18:0 0.644 <0.0001 0.291
C18:1tv 0.296 0.043 0.813
C18:1o 0.819 0.052 0.718
C18:1v 0.770 0.049 0.724
C18:2 0.035 0.021 0.384
C18:3g 0.102 <0.0001 0.094
C18:3a 0.019 <0.0001 0.303
C20:0 0.430 <0.0001 0.351
CLA cis-9,trans-11 0.002 <0.0001 0.370
CLA trans-10, cis-12 0.976 0.607 0.260
C20:1 0.391 0.983 0.870
C20:2 0.001 0.074 0.226
C20:3 0.149 <0.001 0.099
C20:4 0.564 0.001 0.142
C20:3b 0.124 <0.0001 0.188
C22:0 0.696 <0.0001 0.344
C20:5 0.007 <0.0001 0.188
C22:4 0.603 0.434 0.175
C22:5 0.072 <0.0001 0.104
C22:6 0.558 <0.001 0.082
SFA 0.012 0.002 0.338
MUFA 0.920 <0.0001 0.829
PUFA 0.059 <0.0001 0.217
n-6 fatty acids 0.149 0.021 0.239
n-3 fatty acids 0.009 <0.0001 0.178
n-6:n-3 ratio 0.008 <0.0001 0.952
PUFA:SFA ratio 0.028 <0.001 0.160 s See Table 2 for fatty acid nomenclature
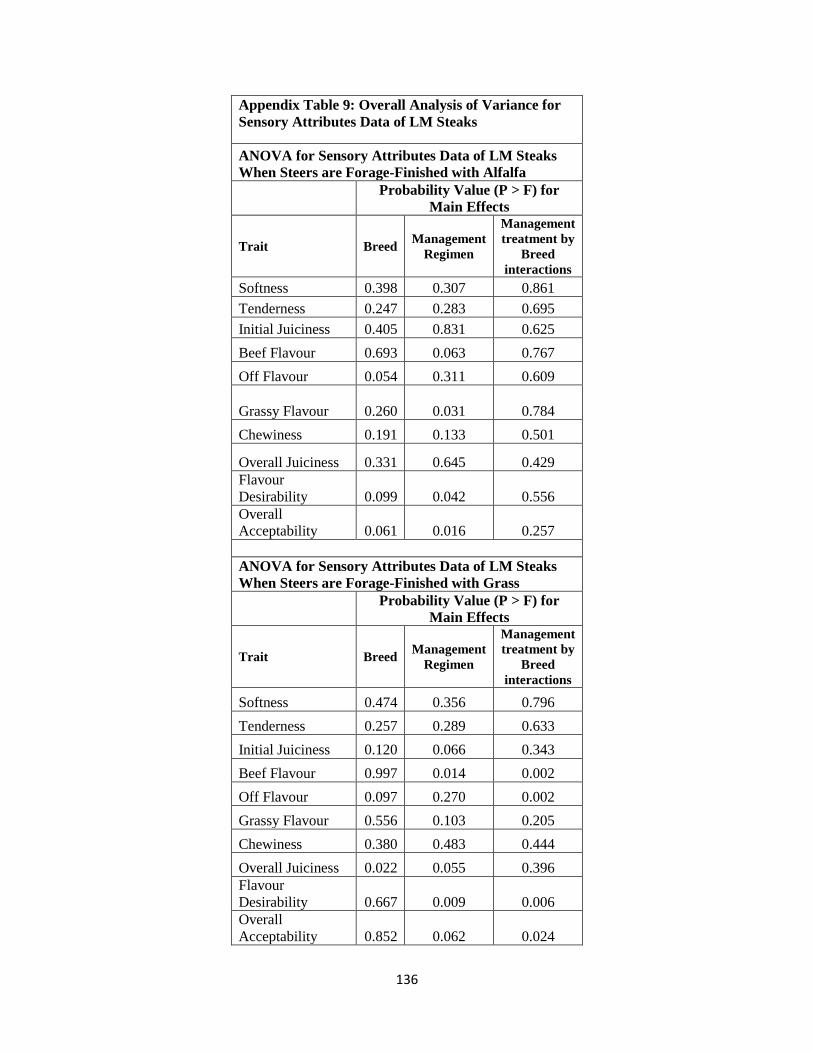
136
Appendix Table 9: Overall Analysis of Variance for
Sensory Attributes Data of LM Steaks
ANOVA for Sensory Attributes Data of LM Steaks
When Steers are Forage-Finished with Alfalfa
Probability Value (P > F) for
Main Effects
Trait Breed Management
Regimen
Management
treatment by
Breed
interactions
Softness 0.398 0.307 0.861
Tenderness 0.247 0.283 0.695
Initial Juiciness 0.405 0.831 0.625
Beef Flavour 0.693 0.063 0.767
Off Flavour 0.054 0.311 0.609
Grassy Flavour 0.260 0.031 0.784
Chewiness 0.191 0.133 0.501
Overall Juiciness 0.331 0.645 0.429
Flavour
Desirability 0.099 0.042 0.556
Overall
Acceptability 0.061 0.016 0.257
ANOVA for Sensory Attributes Data of LM Steaks
When Steers are Forage-Finished with Grass
Probability Value (P > F) for
Main Effects
Trait Breed Management
Regimen
Management
treatment by
Breed
interactions
Softness 0.474 0.356 0.796
Tenderness 0.257 0.289 0.633
Initial Juiciness 0.120 0.066 0.343
Beef Flavour 0.997 0.014 0.002
Off Flavour 0.097 0.270 0.002
Grassy Flavour 0.556 0.103 0.205
Chewiness 0.380 0.483 0.444
Overall Juiciness 0.022 0.055 0.396
Flavour
Desirability 0.667 0.009 0.006
Overall
Acceptability 0.852 0.062 0.024
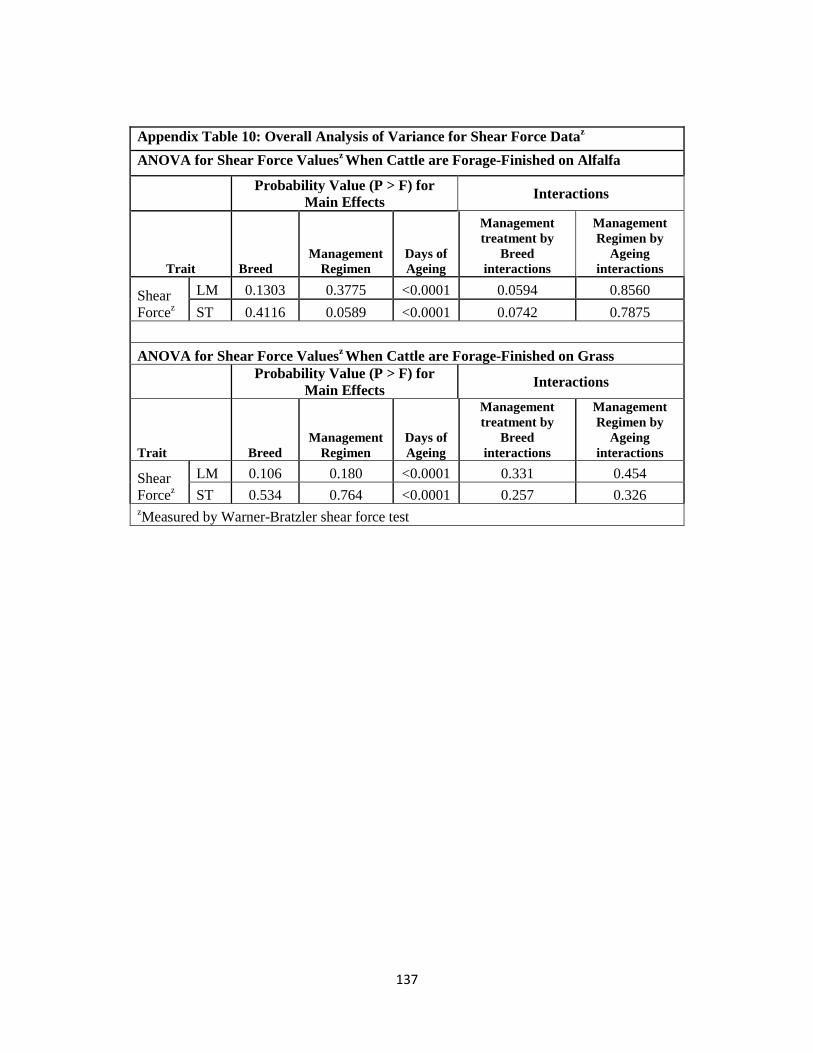
137
Appendix Table 10: Overall Analysis of Variance for Shear Force Dataz
ANOVA for Shear Force Valuesz When Cattle are Forage-Finished on Alfalfa
Probability Value (P > F) for
Main Effects Interactions
Trait Breed
Management
Regimen
Days of
Ageing
Management
treatment by
Breed
interactions
Management
Regimen by
Ageing
interactions
Shear
Forcez
LM 0.1303 0.3775 <0.0001 0.0594 0.8560
ST 0.4116 0.0589 <0.0001 0.0742 0.7875
ANOVA for Shear Force Valuesz When Cattle are Forage-Finished on Grass
Probability Value (P > F) for
Main Effects Interactions
Trait Breed Management
Regimen Days of
Ageing
Management
treatment by
Breed
interactions
Management
Regimen by
Ageing
interactions
Shear
Forcez
LM 0.106 0.180 <0.0001 0.331 0.454
ST 0.534 0.764 <0.0001 0.257 0.326 zMeasured by Warner-Bratzler shear force test

138
Appendix Table 11: Overall Analysis of Variance of Effects on
Carcass Characteristics When Cattle are Forage-Finished on Grass
Probability Value (P > F) for
Main Effects
Trait Covariate1 Breed
Management
Regimen
Breed by
Management
Regimen
Interaction
Hot Carcass Weight
(kg) None 0.060 0.005 0.768
Backfat (mm)* None 0.867 0.051 0.329 Longissimus muscle
area (LMA) (cm2)* None 0.241 0.167 0.619
Adj LMA2*
BFAT 0.723 <0.001 0.158
CBGA Lean Yield3 None 0.562 <0.0001 0.754
USDA Yield Grade4*
BFAT 0.378 0.031 0.1836
Rib
Dissection5
% Lean None 0.073 <0.0001 0.130
% Fat None 0.431 0.154 0.549
% Bone None 0.724 0.134 0.421
Marbling 6*
None 0.145 0.186 0.746
Quality Grade7*
None 0.228 0.106 0.627
IMF8, % for LM None 0.594 0.195 0.949
IMF8, % for ST None 0.839 0.019 0.949
Colour* None 0.561 <0.001 0.890 *These values were obtained using camera measurements at the processing
facility 1Covariate: Backfat depth (BFAT) was tested in the model for carcass traits
and was included in the final model when significant at P < 0.10. Traits
without a covariate remaining in the final model are labelled None. 2Adjusted longissimus muscle area is was adjusted to 100 kg hot carcass
weight (HCW) (cm2/100 kg HCW)
3CBGA (Canadian Beef Grading Agency) Yield is predicted using the
following equation: Lean % = 63.65 + 1.05 (muscle score) – 0.76 (grade fat) 4USDA Yield Grade. Determined from the expected % of boneless, closely
trimmed retail cuts (%BCTRC) ( 1 >52.3, 5 < 45.4) 5Rib dissection includes the separation of a rib section into lean, fat, and bone
components which are expressed as a % of rib weight
6 Marbling value: Practically Devoid = 200 to 299, Traces = 300 to 399, Slight
= 400 to 499; Small = 500 to 599; Modest = 600 to 699. 7Quality Grades were converted to a numeric value as follows: Prime= 4,
AAA=3, AA=2, A=1, <AB1, B2, B3, B4 =0 8Intramuscular fat content
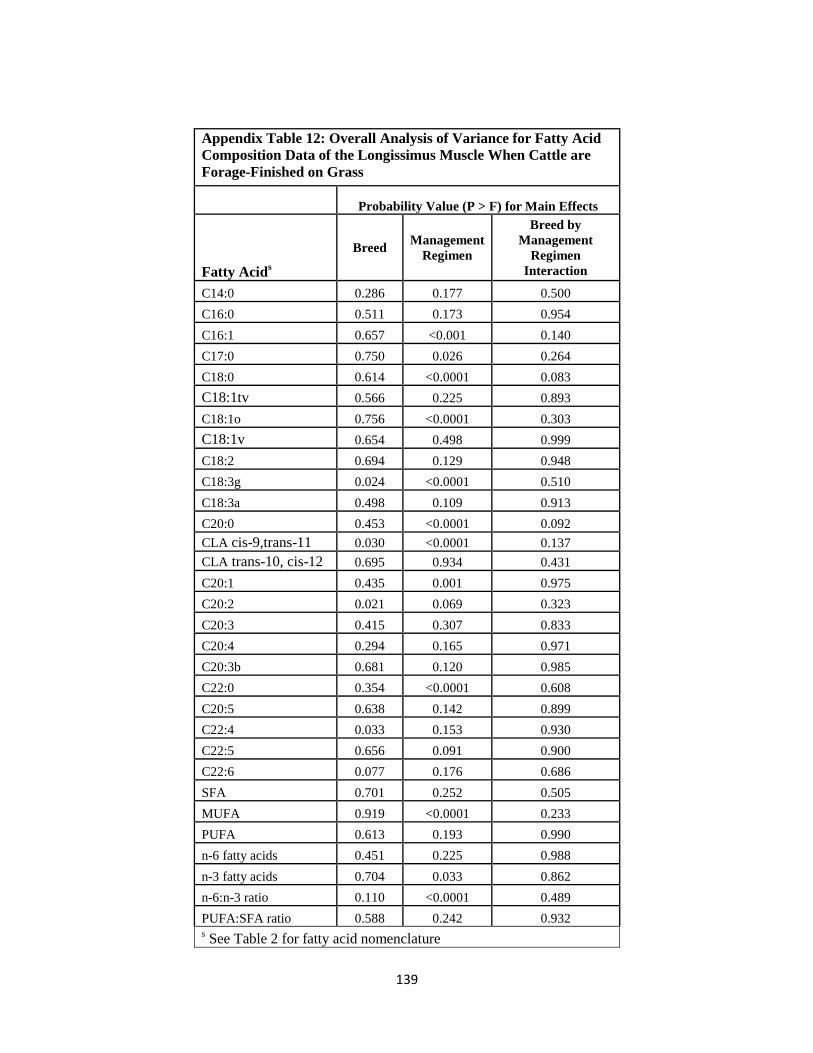
139
Appendix Table 12: Overall Analysis of Variance for Fatty Acid
Composition Data of the Longissimus Muscle When Cattle are
Forage-Finished on Grass
Probability Value (P > F) for Main Effects
Fatty Acids
Breed Management
Regimen
Breed by
Management
Regimen
Interaction
C14:0 0.286 0.177 0.500
C16:0 0.511 0.173 0.954
C16:1 0.657 <0.001 0.140
C17:0 0.750 0.026 0.264
C18:0 0.614 <0.0001 0.083
C18:1tv 0.566 0.225 0.893
C18:1o 0.756 <0.0001 0.303
C18:1v 0.654 0.498 0.999
C18:2 0.694 0.129 0.948
C18:3g 0.024 <0.0001 0.510
C18:3a 0.498 0.109 0.913
C20:0 0.453 <0.0001 0.092
CLA cis-9,trans-11 0.030 <0.0001 0.137
CLA trans-10, cis-12 0.695 0.934 0.431
C20:1 0.435 0.001 0.975
C20:2 0.021 0.069 0.323
C20:3 0.415 0.307 0.833
C20:4 0.294 0.165 0.971
C20:3b 0.681 0.120 0.985
C22:0 0.354 <0.0001 0.608
C20:5 0.638 0.142 0.899
C22:4 0.033 0.153 0.930
C22:5 0.656 0.091 0.900
C22:6 0.077 0.176 0.686
SFA 0.701 0.252 0.505
MUFA 0.919 <0.0001 0.233
PUFA 0.613 0.193 0.990
n-6 fatty acids 0.451 0.225 0.988
n-3 fatty acids 0.704 0.033 0.862
n-6:n-3 ratio 0.110 <0.0001 0.489
PUFA:SFA ratio 0.588 0.242 0.932 s See Table 2 for fatty acid nomenclature
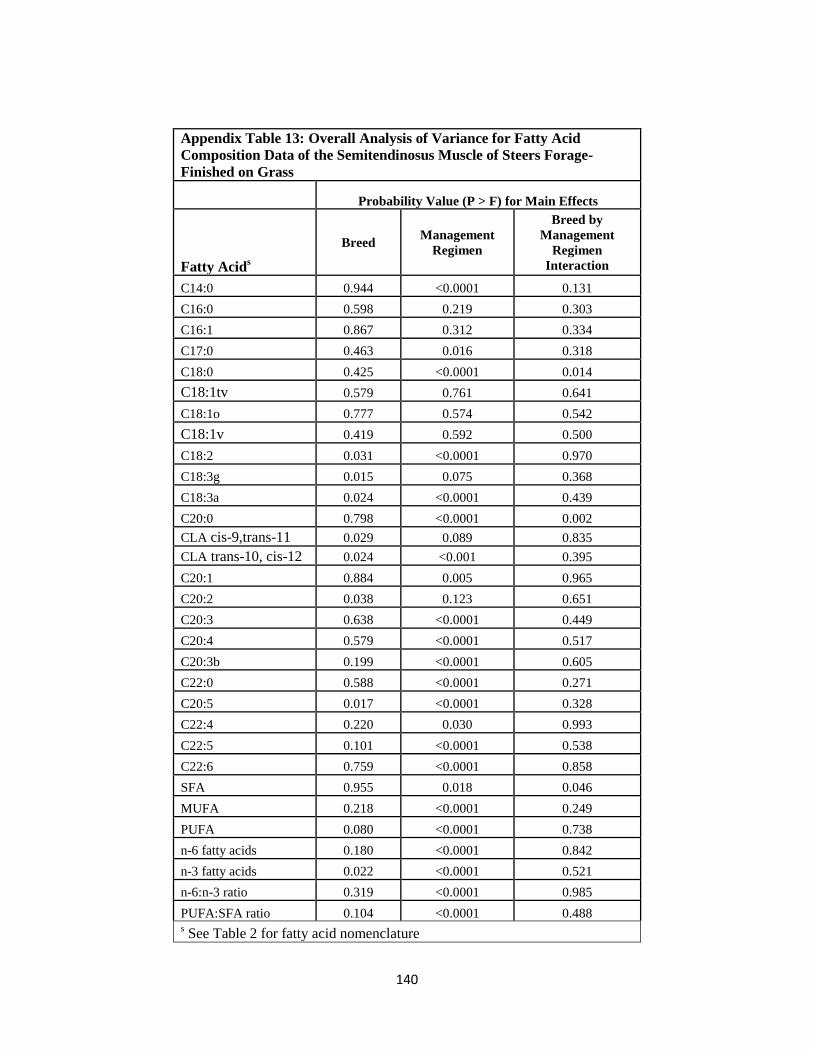
140
Appendix Table 13: Overall Analysis of Variance for Fatty Acid
Composition Data of the Semitendinosus Muscle of Steers Forage-
Finished on Grass
Probability Value (P > F) for Main Effects
Fatty Acids
Breed Management
Regimen
Breed by
Management
Regimen
Interaction
C14:0 0.944 <0.0001 0.131
C16:0 0.598 0.219 0.303
C16:1 0.867 0.312 0.334
C17:0 0.463 0.016 0.318
C18:0 0.425 <0.0001 0.014
C18:1tv 0.579 0.761 0.641
C18:1o 0.777 0.574 0.542
C18:1v 0.419 0.592 0.500
C18:2 0.031 <0.0001 0.970
C18:3g 0.015 0.075 0.368
C18:3a 0.024 <0.0001 0.439
C20:0 0.798 <0.0001 0.002
CLA cis-9,trans-11 0.029 0.089 0.835
CLA trans-10, cis-12 0.024 <0.001 0.395
C20:1 0.884 0.005 0.965
C20:2 0.038 0.123 0.651
C20:3 0.638 <0.0001 0.449
C20:4 0.579 <0.0001 0.517
C20:3b 0.199 <0.0001 0.605
C22:0 0.588 <0.0001 0.271
C20:5 0.017 <0.0001 0.328
C22:4 0.220 0.030 0.993
C22:5 0.101 <0.0001 0.538
C22:6 0.759 <0.0001 0.858
SFA 0.955 0.018 0.046
MUFA 0.218 <0.0001 0.249
PUFA 0.080 <0.0001 0.738
n-6 fatty acids 0.180 <0.0001 0.842
n-3 fatty acids 0.022 <0.0001 0.521
n-6:n-3 ratio 0.319 <0.0001 0.985
PUFA:SFA ratio 0.104 <0.0001 0.488 s See Table 2 for fatty acid nomenclature