Consumer Acceptability Advice and Health Effects Analysis on ...

Louisiana State UniversityLSU Digital Commons
LSU Historical Dissertations and Theses Graduate School
1995
The Effects of Metacognitive Advice and Control ofSequence on Student Achievement and AttitudeToward Computer-Assisted Instruction andContent.Andrew Mark HoldenLouisiana State University and Agricultural & Mechanical College
Follow this and additional works at: https://digitalcommons.lsu.edu/gradschool_disstheses
This Dissertation is brought to you for free and open access by the Graduate School at LSU Digital Commons. It has been accepted for inclusion inLSU Historical Dissertations and Theses by an authorized administrator of LSU Digital Commons. For more information, please [email protected].
Recommended CitationHolden, Andrew Mark, "The Effects of Metacognitive Advice and Control of Sequence on Student Achievement and Attitude TowardComputer-Assisted Instruction and Content." (1995). LSU Historical Dissertations and Theses. 5956.https://digitalcommons.lsu.edu/gradschool_disstheses/5956

INFORMATION TO USERS
This manuscript has been reproduced from the microfilm master. UMI films the text directly from the original or copy submitted. Thus, some thesis and dissertation copies are in typewriter face, while others may be from any type of computer printer.
Hie quality of this reproduction is dependent upon the quality of the copy submitted. Broken or indistinct print, colored or poor quality illustrations and photographs, print bleedthrough, substandard margins, and improper alignment can adversely afreet reproduction.
In the unlikely event that the author did not send UMI a complete manuscript and there are missing pages, these will be noted. Also, if unauthorized copyright material had to be removed, a note will indicate the deletion.
Oversize materials (e.g., maps, drawings, charts) are reproduced by sectioning the original, beginning at the upper left-hand comer and continuing from left to right in equal sections with small overlaps. Each original is also photographed in one exposure and is included in reduced form at the back of the book.
Photographs included in the original manuscript have been reproduced xerographically in this copy. Higher quality 6" x 9" black and white photographic prints are available for any photographs or illustrations appearing in this copy for an additional charge. Contact UMI directly to order.
A Bell & Howell Information Company 300 North Zeeb Road. Ann Arbor. Ml 48106-1346 USA
313/761-4700 800/521-0600

THE EFFECTS OF METACOGNIUVE ADVICE AND CONTROL OF SEQUENCE ON STUDENT ACHIEVEMENT AND ATTITUDE TOWARD
COMPUTER-ASSISTED INSTRUCTION AND CONTENT
A Dissertation
Submitted to the Graduate Faculty of the Louisiana State University and
Agricultural and Mechanical College in partial fulfillment of the requirements for degree of
Doctor of Philosophy
in
The School of Vocational Education
byAndrew M ark Holden
B.Sc., University of Waterloo, 1990 May 1995

UMI Number: 9538736
UMI Microform 9538736 Copyright 1995, by UMI Company. All rights reserved.
This microform edition is protected against unauthorized copying under Title 17, United States Code.
UMI300 North Zeeb Road Ann Arbor, MI 48103
ACKNOWLEDGMENTS
I would like to thank Dr. J. W. Trott and Dr. M. F. Burnett for guiding me
with my research project. Special thanks goes to Dr. S. K. MacGregor for help
with the design of the instructional program. I would also like to thank the other
members of my committee, Dr. J. G. McMurry, Dr. J. K. Kotrlik, and Dr. K.
Koonce, for their assistance.
In the School o f Vocational Education, I would like to thank Sandra Cash
and Sharon Hutchison for helping with registration and other administrative
necessities to graduate from LSU. In the Department o f Administration and
Foundational Services, I would like to thank Sundar Vedantham and Deborah
Humbles for their outstanding assistance in helping me overcome administrative
obstacles. Special thanks goes to Aravind Somanchi for help with the file transfers
while I completed my dissertation from Montreal.
I would like to thank my colleagues Skip Twitchell, Geetanjali Soni, and
Cathy Hamilton for their suggestions with my study, for our discussions, and for
our comradeship during my studies at LSU.
Finally, I would like to thank my family for their support, especially my
father who, during the last week of his life, told me he was proud o f me. I would
not have been able to complete this process without the love, help, and support
from my wife Dr. Mamta Rawat. She was there for me when I needed
encouragement to continue and she never stopped believing in my ability to finish
the degree.

TABLE OF CONTENTS
ACKNOWLEDGMENTS ................................................................................................... ii
LIST OF TABLES ..............................................................................................................vi
ABSTRACT ....................................................................................................................... viii
C H A P T E R .......................................................................................................................... 11 IN T R O D U C T IO N ............................................................................................... 1
Statement o f the p ro b lem ........................................................................ 2Purpose ..................................................................................................... 3O bjectives.................................................................................................. 5H y p o th ese s ................................................................................................ 6Significance of the s tu d y ........................................................................ 7Limitations ............................................................................................... 7
2 REVIEW OF LITERATURE ........................................................................... 9Introduction................................................................................................ 9Computer-assisted instruction history ................................................ 9Statistics and research methodology computer-assisted
in s tru c tio n ................................................................................. 12Metacognition ....................................................................................... 14Self-directed le a rn in g ........................................................................... 15Learner control o f in struction ............................................................ 17Variables o f investigation .................................................................. 20Variables in this study ........................................................................ 21
S e q u e n ce .................................................................................... 22Advisement .............................................................................. 23M etacognition........................................................................... 25Self-directed learning ............................................................ 28Ability . . .............................................................................. 28Prior knowledge of c o n te n t................................................... 29A ttitu d e ....................................................................................... 30
Summary ....................................................................................... 31
3 M ETH O D O LO G Y ............................................................................................ 33Population and su b jec ts ........................................................................ 33Instrum entation...................................................................................... 38
Descriptive in fo rm atio n ......................................................... 38Independent variables ............................................................ 40Dependent variables ............................................................... 45Extraneous v a ria b le s ............................................................... 47

Data c o lle c tio n ...................................................................................... 48Data a n a ly s is ......................................................................................... 48
Objective 1 ................................................................................ 48Objective 2 ................................................................................ 49Objective 3 ................................................................................ 49Objective 4 ................................................................................ 50Hypothesis 1 ............................................................................. 50Hypothesis 2 ............................................................................. 51Hypothesis 3 ............................................................................. 51Hypothesis 4 ............................................................................. 51Hypothesis 5 ............................................................................. 52
4 R E S U L T S ........................................................................................................... 53Objective 1 ............................................................................................ 53Objective 2 ............................................................................................ 78Objective 3 ............................................................................................ 80Objective 4 ............................................................................................ 80Hypothesis 1 ......................................................................................... 81Hypothesis 2 ......................................................................................... 82Hypothesis 3 ......................................................................................... 82Hypothesis 4 ......................................................................................... 85Hypothesis 5 ......................................................................................... 88Supplementary re su lts .......................................................................... 88
5 CONCLUSIONS AND RECOMMENDATIONS .................................... 93C onclusions............................................................................................ 98
Objectives 2 and 3 ................................................................. 98Objective 4 ................................................................ 100Hypotheses 1 and 2 ................................................................. 101Hypothesis 3 ................................................................................ 103Hypothesis 4 ............................. 103Hypothesis 5 ................................................................................ 104Supplementary r e s u l t s ...............................................................105C o v a r ia te s ...................................................................................105
Recommendations for future re s e a rc h ................................................ 106Recommendations for practice ............................................................107
REFERENCES ................................................................................................................ 109
A PPEN D IX ......................................................................................................................... 119A DESIGN OF IN S T R U C T IO N .......................................................................... 119
T o p ic .......................................................................................................... 119Audience ..................................................................................................119
iv

Problem and rationale for so ftw are ...................................................... 120Instruction.................................................................................................. 120F lo w c h a rt.................................................................................................. 121Formative evaluation o f instructional p ro g ra m ..................................122
B F L O W C H A R T .......................................................................................................123
C SELF-DIRECTED LEARNING READINESS S C A L E ................................127
D PRETEST AND PO ST T E ST ............................................................................... 132
E ROBUSTNESS SEMANTIC DIFFERENTIAL FOR ATTITUDETOWARD THE INSTRUCTIONAL PR O G R A M ........................ 138
F ROBUSTNESS SEMANTIC DIFFERENTIAL FOR ATTITUDETOWARD THE INSTRUCTIONAL C O N T E N T ........................ 139
VITA ...................................................................................................................................140
v

LIST OF TABLES
3.1 Number o f Participants Assigned to Treatment G ro u p s ................................. 37
3.2 Number o f Useable Responses by Treatment G ro u p ....................................... 39
4.1 Number and Percent of Participants by Department/School byTreatment G r o u p ............................................................................................... 54
4.2 Number and Percent o f Participants by Department/School byTreatment Level ............................................ 55
4.3 Number and Percent of Participants by Gender by Treatment Group . . . . 57
4.4 Number and Percent o f Participants by Gender by Treatment Level . . . . 58
4.5 Mean Age o f Participants by Treatment G ro u p ................................................ 59
4.6 Mean Age o f Participants by Treatment Level ................................................ 60
4.7 Number and Percent o f Participants by Education Level by TreatmentG ro u p .................................................................................................................... 61
4.8 Number and Percent of Participants by Education Level by TreatmentLevel .................................................................................................................... 63
4.9 Number and Percent o f Participants by Education Status by TreatmentG ro u p .................................................................................................................... 64
4.10 Number and Percent of Participants by Education Status by TreatmentLevel .................................................................................................................... 65
4.11 Mean GRE Quantitative and GRE Verbal Scores of Participants byTreatment G r o u p ............................................................................................... 66
4.12 Mean GRE Quantitative and GRE Verbal Scores o f Participants byTreatment Level ............................................................................................... 67
4.13 Mean GRE Analytical Score of Participants by Treatment G r o u p 69
4.14 Mean GRE Analytical Score by Participants by Treatment L e v e l 70
vi
4.15 Mean Self-Directed Learning Readiness Score o f Participants byTreatment G r o u p .................... 72
4.16 Mean Self-Directed Learning Readiness Score o f Participants byTreatment Level ................................................................................................ 73
4.17 Mean Pretest and Posttest Scores of Participants by Treatment Group . . 74
4.18 Mean Pretest and Posttest Scores of Participants by Treatment Level . . . 76
4.19 Mean Attitude toward Instructional Program and Instructional Contentof Participants by Treatment G ro u p ......................................................... 77
4.20 Mean Attitude toward Instructional Program and Instructional Contentof Participants by Treatment L e v e l ......................................................... 79
4.21 Ancova o f Posttest Score by Metacognitive Advice with Pretest andGRE Analytical S c o r e ................................................................................. 83
4.22 Ancova of Posttest Score by Metacognitive Advice with Pretest andGRE Analytical Score for Participants with Learner Control of S eq u en ce ........................................................................................................ 84
4.23 Ancova o f Posttest Score by Control of Sequence with Pretest andGRE Analytical Score for Participants without Metacognitive Advice . 86
4.24 Ancova of Posttest Score by Self-Directed Learning Readiness withPretest and GRE Analytical Score for Participants with LearnerControl of S e q u e n c e .................................................................................... 87
4.25 Ancova of Posttest Score by Control of Sequence with Pretest andGRE Analytical Score for Lower Self-Directed Learning Readiness Level Participants.......................................................................................... 89
4.26 Relationship between Attitude toward Instructional Program andAttitude toward Instructional Content by Treatment G ro u p ................ 91
4.27 Ancova of Posttest Score by Control of Sequence and MetacognitiveAdvice with Pretest and GRE Analytical Score for Lower Self- Directed Learning R ead in ess ..................................................................... 92
vii

ABSTRACT
The purpose o f the study was to investigate the effects of the CAI design
features - metacognitive advice and control o f instructional sequence upon student
achievement and attitude toward the instructional program and content. The topic
of the CAI was designing comparative research to control threats to internal
validity. Four versions o f the CAI were created based upon the combinations of
the bi-level independent variables - metacognitive advice and control of
instructional sequence.
The participants o f the study were graduate students from four departments
at Louisiana State University. The independent variables were metacognitive
advice, control o f instructional sequence, and the participant’s self-directed
learning readiness level. The dependent variables were posttest achievement and
attitude toward the instructional program and content.
The study had four objectives and five hypotheses. The treatment variables
metacognitive advice and control o f instructional sequence had no effect upon
posttest achievement. However, the researcher found that the participants’ self
directed learning readiness was important. First, when the participants had control
of the instructional sequence, the higher self-directed learning readiness participants
had higher achievement than the lower level participants. Second, for the lower
level self-directed learning readiness participants, the participants with program
control o f instructional sequence had higher achievement than the participants with
learner control o f instructional sequence. Regarding the attitude toward the

instructional program and content, there were no differences in attitude among the
participants who used the four different version o f the CAI.
The participant’s problem solving ability and prior knowledge o f content
were used as covariates and were significant in the analyses. This, along with the
finding that self-directed learning readiness is important with achievement in
learner control o f instruction, indicates that personal characteristics are important
factor in having control o f CAI.

CHAPTER 1
INTRODUCTION
Computers have been used as instructional delivery methods since 1959 and
has come to be known as computer-assisted instruction (CAI). There are two
different philosophies regarding how the computer should deliver instruction.
Advocates o f the first philosophical position, program control o f instruction,
believe that the computer should present the necessary instruction and the learner
should have no control over his or her learning. In contrast with this philosophy is
the idea that the learner should be allowed to have control o f his or her learning,
called learner control o f instruction. Supporters of this philosophical position feel
that program control o f instruction is not beneficial to the learner since real world
learning is not always adaptive to individual learner needs. The supporters of
learner control of instruction presumed that students would be more motivated,
have higher achievement, lower frustration and anxiety because they would be able
to choose the information they needed (Steinberg, 1989). However those that
support program control of instruction feel that the student cannot make effective
decisions regarding his or her learning. The computer could assess student’s
performance and, based upon the student’s performance, could provide more
practice, review examples, or move the student to more advanced material as
needed.
1

2
Statement of the problem
Researchers have studied giving students control of sequence, review items,
practice items, pace, text density, and feedback. The results have not been
conclusive as to which dimensions the learner can effectively control (Tennyson &
Buttrey, 1980; Higginbotham-Wheat, 1990; Tennyson, 1980). Some studies have
included advice to help the students make effective choices regarding instruction.
Advice is information given to the student from the CAI. This advice can include
information regarding sequence of instruction, problem solving modelling, or
learning needs regarding mastery level.
Metacognitive skills are very important for the success o f students working
independently on CAI (Haynes & Malouf, 1986). Metacognition is what learners
know of their own cognition and their ability to control those cognitions
(Meichenbaum, 1980). Gagne (1985) described metacognition as having four
steps: awareness of task goals, knowledge of applicable learning strategies,
selection o f appropriate learning strategy, and self-monitoring. While some studies
have given students advice regarding parts o f the metacognitive process, no studies
have given advice regarding all four steps in the metacognitive process.
Learner control o f instruction allows for more individualized instruction on
a given topic. Allowing learners to choose the sequence for their instruction would
allow them to learn in ways more meaningful for themselves. However, not all
students have the metacognitive ability to learn efficiently. Thus, a metacognitive
advisement strategy may be helpful to those learners who are lacking in such skills.

3Most studies regarding learner control o f instruction have included college
age students or younger as subjects in the study. However, this study included
older adults as subjects. One important issue with independent learning with adults
is their self-directed learning ability. Adults are competent when they engage in
self-directed learning activities in day to day life (Tough, 1979 in Knowles, 1990)
but may not be in a formal learning situation (Knowles & Associates, 1984 in
Knowles, 1990). Therefore, if an adult is allowed more control o f their learning in
a CAI format, his or her level o f self-directedness may impact their achievement.
No previous research has examined the relationship between a student’s self
directed learning readiness and their achievement with learner controlled CAI.
One possible reason is self-directed learning readiness is less o f an issue for the
younger subjects in previous learner control research since they are less likely to
be self-directed (Knowles, 1980).
Purpose
The purpose o f this study was to examine the effect of metacognitive
advisement and control o f sequence upon achievement in an educational research
design CAI program for two levels o f student self-directed learning readiness.
There have been numerous advances in computer technology to improve the
delivery of instruction using microcomputers. The capability o f microcomputers to
utilize sound, graphics, still photographs, and video has lead to an increased
availability of software for educational purposes. Some o f these CAI programs
will provide opportunities for autonomous learning. This study provided some

4
additional information to key areas of learner control regarding what should be
controlled and by whom. The metacognitive advice feature and the self-directed
learning readiness characteristic of the participants provided this information.
In this study, there were three independent variables, each with two levels.
The first, metacognitve advisement had the levels o f students receiving
metacognitive advice and students receiving no advice. Second, learner control of
instructional sequence, had levels o f learner control o f instructional sequence and
program control o f instructional sequence. Finally, the self-directed learning
readiness o f the participants was classified as higher or lower based upon the
median of the participant’s scores on the Self-Directed Learning Readiness Scale
(SDLRS).
Four versions o f the CAI program were created to place the subjects into
groups having program control o f sequence with and without metacognitive
advisement and learner control of sequence with and without metacognitive
advisement. The advisement strategies were metacognitive in nature to assist
learners in successful completion of the learning objectives. The students were
blocked on their self-directed learning readiness level before being assigned to the
four treatment levels.
The dependent variables used were the participant’s posttest achievement,
attitude toward CAI, and attitude toward the CAI content. Also, there were two
extraneous variables. First, the participant’s prior knowledge o f content was

measured by the pretest. Second, the participant’s problem solving ability was
measured by the student’s GRE analytical score.
Objectives
Four objectives and five hypotheses were formulated to guide the researcher
in this study. The four objectives were:
1. To describe the sample o f graduate students on the following characteristics:
college department, gender, age, level of study, education status, SDLRS
score, GRE quantitative, verbal, and analytical scores, pretest and posttest
achievement scores, and the participants’ attitudes toward the instructional
program and the instructional content;
2. To compare the attitude toward the instructional program by categories of
each of the three treatment variables: Self-directed learning readiness,
metacognitive advice, and control o f instructional sequence;
3. To compare the attitude toward instructional content by categories o f each
of the three treatment effects: Self-directed learning readiness,
metacognitive advice, and control o f instructional sequence; and
4. To determine if a significant relationship exists between the subject’s
SDLRS score and their attitude toward the instructional program by each of
the four treatment groups; learner control with metacognitive advice,
learner control without metacognitive advice, program control with
metacognitive advice, and program control without metacognitive advice.

6
Hypotheses
The five hypotheses were:
1. The posttest scores o f those who received metacognitive advice were higher
than those who had not received the metacognitive advice controlling for the
participant’s prior knowledge o f content and problem solving ability;
2. For those with learner control of sequence, the posttest scores of those who
received metacognitive advice would have higher scores than who had not
received the metacognitive advice controlling for the participant’s prior
knowledge o f content and problem solving ability;
3. For those without metacognitive advice, the posttest scores of those with
program control o f instructional sequence were higher than those with
learner control of instructional sequence controlling for the participant’s
prior knowledge o f content and problem solving ability;
4. For those with learner control o f instructional sequence, the posttest scores
of those with higher self-directed learning readiness would be higher than
those with lower self-directed learning readiness controlling for the
participant’s prior knowledge of content and problem solving ability; and
5. For those with lower self-directed learning readiness, the posttest scores of
those with program control of sequence were higher than those with learner
control o f sequence controlling for the participant’s prior knowledge of
content and problem solving ability.
Significance of the study
CAI researchers have found that students are not always able to make
effective learning choices when using learner control CAI. Some researchers have
given students ongoing advice (Lee 1990, 1991) modelling suggestions (Armstrong,
1989) and advice regarding learning needs compared to a specific mastery level
(Johansen & Tennyson, 1983). However, no research has determined the
effectiveness o f giving students metacognitive advice for all components that
comprise metacognition. In addition, while CAI has been suggested as a method to
develop self-directed learning skills, no research has examined the relationship
between subject self-directed learning ability and achievement using CAI when the
subject has the opportunity for self-directed study through the control of
instruction.
Limitations
The research was conducted on a purposive sample o f education graduate
students at Louisiana State University, Baton Rouge campus. The participants
were volunteers from the School of Vocational Education, the School of Human
Ecology, Administrative and Foundational Services, and Curriculum and
Instruction departments. Thus, the reader should be cautioned when generalizing
these findings to the general population of education graduate students, since
volunteers for the study may not have been representative o f the accessible
population o f education graduate students. However, the graduate students were

8
described based upon certain descriptive characteristics to enable readers to obtain
an idea o f the characteristics o f the sample studied.
CHAPTER 2
REVIEW OF LITERATURE
Introduction
This chapter provides an overview of research literature related to learner
control o f CAI. The first section discusses the history o f CAI and some o f the
factors that have lead to the widespread use of CAI. The second section describes
existing CAI for the subject matter of statistics and research methodology.
Metacognition and its components were described in the third section. Finally, the
last section describes past research on learner control of instruction, in general,
and the characteristics o f learners and previous variables of investigation in more
detail.
Computer-assisted instruction history
Instructional designers have developed automated systems of instruction
since 1959 (Merrill, et al., 1992). The first project of significance was PLATO.
This system was initially funded by the University of Illinois and the Department
o f Defense. Features included in the system were an authoring system language
called TUTOR and specially designed computer terminals connected to
minicomputers. TUTOR has greatly facilitated the development o f CAI programs.
PLATO guided the user through the instruction and the student had no control over
the sequence, speed, and content. Basically, the program made the decisions about
review and sequence depending on the needs of the student.
9

10
The basic premise o f instruction developed on systems such as PLATO was
that the CAI should adapt to the learning style and characteristics o f each student.
The CAI could then present information in the most appropriate manner for each
student. However, others felt that this would make the student dependent upon the
computer and subsequent learning would be difficult since most learning is not
adaptive to the learner’s needs (Milheim, et al. 1992). Subsequently, the combined
efforts o f engineers from MITRE Corporation, in McLean, Virginia, educators at
the CAI laboratory, at the University o f Texas, and the Institute for Computer
Uses in Education at Bringham Young University developed a CAI system
(TICC1T) that would allow students to become more independent. TICCIT was
also developed for minicomputers.
TICCIT, developed in 1971, differed from other CAI in its instructional
strategies since it was the first program to allow learners to control their own
instruction. Basically, the TICCIT system differed from previous CAI by having
instructional methods built into the system, not the software, and instruction that
taught concept classification instead o f drill and practice. Furthermore, the CAI
allowed learners this control by indicating their choices for sequence and type of
display, and whether it was the rule, example, or practice for a concept (Merrill, et
al., 1992).
The cost of these minicomputers and CAI systems was high compared to
the microcomputers that were available in the 1970’s, and most public schools
could only afford to obtain the less powerful microcomputers. The earliest CAI

11
programs developed for these microcomputers mimicked printed programmed
instruction by presenting information in a linear fashion with learners
understanding one concept before moving on to the next (Nix, 1990). These
programs were typically drill and practice or tutorial CAI. However, all
information does not have a unidirection, linear relationship among concepts. Any
one piece of knowledge is usually connected to many different ideas and this
knowledge can be represented by different cognitive psychology memory models
(Solso, 1991). One reason for the unavailability o f nonlinear CAI was the lack of
computing power available at the time.
In the 1980’s, microcomputers became more powerful and could be used
for more creative CAI. The availability of more powerful computers lead to the
development o f programs that can access information in a nonlinear fashion.
These programs use a concept called hypermedia. Hypermedia allows for
intelligent non-linear connections of information. It allows a user to branch from
one information section to the next using a navigational system. Furthermore,
these logical links can show how one piece of information relates to others in a
similar subject area to allow understanding o f the knowledge structure for that
subject content.
The widespread use o f computers in the education system has the potential
to provide more personalized instruction. Computers can provide individualized
instruction to students with different learning styles and cognitive processes
(Wesley, Krockover, & Hicks, 1985). Allowing the learner to control aspects of -

12
the instructional program allows for a more personalized educational setting.
Learner control o f instruction provides the opportunity for the student to make
choices regarding his or her learning situation. These learner control strategies are
based upon the premise that the independent learner will make intelligent choices
regarding his or her learning and thus will be able to increase achievement.
Statistics and research methodology computer-assisted instruction
In a literature review of existing Statistics and Research methodology CAI,
nine instructional programs were mentioned. Almost all the CAI is concerning
statistical instruction. In addition, the CAI was used on Macintosh, IBM, and
minicomputer platforms and targeted for college-level courses. The length of the
instruction varied from a few hours for the CAI used in experiments to a one
semester CAI course.
The statistics and research CAI can be classified in two ways: development
o f software or topic and instructional format. First, the classification system
includes whether the author discussed previously developed software or the CAI
was developed by the author. For the second classification method, the topics of
instruction consisted o f a general introduction to statistics, which is similar to an
introductory college level course on statistics that includes descriptive and
inferential statistics, or only a few statistics topics. The instructional format is the
type of CAI which could be tutorial, drill and practice or a combination o f the
different content delivery methods.

13First, concerning the CAI that the author did not develop, two programs,
Statmaster (Davis & Knaupp, 1984) and Bootstrap Statistics (Simon, 1988) were
reviewed for their instructional value. Also, Reynolds and Dansereau (1990)
discuss how Macstat was used as the CAI for their experiment regarding the
effectiveness o f using hypertext versus hypermaps on college students’ learning.
The other development classification for statistics and research CAI is the
CAI was developed by the researcher. The first use was for instruction of
statistical concept (Layne & Wells, 1990; Hunka, 1991; Barnes, Swehosky, &
Laguna-Castillo, 1988). The other use for the statistics CAI was in an experiment
using statistics as a content area for the subjects to study (Ross, Morrison, &
O ’Dell, 1989; Evans, 1982).
The second method of classifying the statistics and research CAI is by topic
and instructional format. Most o f the CAI described included content to cover the
basic descriptive and inferential concepts included in a typical college level
introductory statistics course. In this group of CAI, two programs consisted of
tutorial format (Ross, Morrison, & O ’Dell, 1989; Barnes, Swehosky, & Laguna-
castillo, 1988; Evans, 1982). The others consisted of tutorial and at least one
other CAI type of instruction, such as drill and practice or problem solving.
Shelley and Knaupp (1984) described CAI that allows the user to enter data for
examples o f statistical concepts, while Layne and Wells (1990) use drill and
practice along with tutorial instruction. The final CAI described in this section
utilizes diagnosis and remediation, drill, review, problem solving, simulation, and

testing (Hunka, 1991). The CAI described by Hunka was the only system that
replaced the traditional method o f classroom instruction instead o f supplementing
it.
The instruction for one CAI system contained only the t-test and z-test for
content in a tutorial delivery method (Reynolds & Dansereau, 1990). Finally, one
CAI program described did not indicate the extent o f the content for the drill and
practice and tutorial (Simon, 1988).
Metacognition
Metacognition is what learners know of their own cognition and their ability
to control those cognitions (Meichenbaum, 1980). This process is made up of
several components. Gagne (1985) defined four metacognitive strategies that are
important for success in any learning task. These are: awareness o f task goals,
knowledge o f applicable learning strategies, selection of appropriate learning
strategies, and self-monitoring. Regarding learning strategies, Milkulecky and
Adams (1986) reviewed the literature to find writing notes, focus, questioning, use
o f prior experience, mental imagery, reaction and arousal to be the characteristics
o f metacognitive behavior for learning strategy.
Learners who have developed metacognitive skills can be more efficient in
their learning. People with good metacognitive skills predicted their performance
better (Flavell, Freidrick, & Hoyt, 1970), differentiated between relevant and
irrelevant information (Markham, 1977), and identified tasks that required specific
types o f strategies (Kreutzer, 1975). In addition, less skilled learners and those

15
who encounter new subject matter tend not to detect their failure to understand new
material (August, Flavell, & Clift, 1984; Baker, 1979; Flavell, 1979; Garner,
1981; Garner & Anderson, 1982; Grabe & Mann, 1984; Markham, 1977;
Robinson & Robinson, 1984; Whimbey, 1976).
Self-directed learning
One of the main tenets o f andragogy is that the natural maturation process
of people is to move from dependency to increasing levels o f self-directedness
(Knowles, 1980). Knowles (1990) describes the self-directed learner as having
several competencies relating to:
o understanding of instructor directed and self-directed and when each
is appropriate;
o desire and ability to maintain curiosity toward learning;
o objective self perception and acceptance of feedback nondefensively;
o self diagnosis o f realistic learning needs and seeking help when
needed;
o ability to translate learning needs into measurable objectives;
o resource identification for learning objective;
o strategy planning for effective use o f resources;
o ability to carry out plan for learning;
o self assessment ability when objectives are met;
o collaboration with peers for sharing learning resources; and

16
o ability to take initiative in using instructors and other experts for
resource needs.
Liberman and Linn (1991) indicate that students who are learning to be self
directed can learn from external instruction, but they must eventually practice their
self-directed skills independently. CAI can be a tool for students to practice their
self-directed learning skills. In addition, Tennyson and Rasch (1988) suggest that
computer software programs that are domain-specific and provide for self-directed
learning offer beneficial opportunities for developing higher level thinking
strategies.
The University of Georgia is using CAI for such a purpose. Mills and
DeJoy (1988) observed self-directed adult learning and adult use of technology for
learning at the University o f Georgia Learning Lab. From their observations, they
identified 12 design elements that are important to self-directed adult learners.
These are:
o clear behavioral objectives;
o opportunities for practice;
o appropriate feedback;
o adjustable levels o f difficulty;
o adjustable speed o f presentation;
o opportunities for backup and review;
o adjustable sequencing o f information;
o opportunities to correct entries;

o exiting at any time;
o exiting and reentering program at same place;
o opportunities to move around program without repetition;
o confidential storage o f entries; and
o cross referencing of CAI and support materials.
Liberman and Linn (1991) describe the self-directed learning process to
include metacognition. While there has been research conducted on the
relationship o f the student’s metacognition and learner control, there has not been
any research to examine the student’s self-directed learning ability related to
learner control of CAI.
Learner control of instruction
This section describes previous research on learner control of instruction.
First, the reasoning behind learner control of instruction is given. Then, the
variables examined in previous research were described. Finally, the variables
relevant to this study were discussed in greater detail.
The debate between whether or not learners should be given control of their
learning has two basic arguments. The basis for the first argument is that
instructional designers know what is best for students and can design CAI to ensure
that the student would proceed through the required material and that this would
allow the student to achieve the objective. The opposing viewpoint of the debate
concerns giving the learner control o f their learning. One premise in this argument
is that the learners know what they need to achieve the given objective, and thus

18
should be given control of their own learning. Students should control their own
learning and not be dependent upon the computer to succeed.
Learner control in computer aided instruction is not one construct but a
collection o f strategies that function in different ways depending on what is being
controlled and by whom (Ross & Morrison, 1989). The learner may have control
over lesson pace, sequence, content, feedback, number of practice items,
advisement, or a combination of these CAI features. Intuitively, learners should be
given control o f their learning.
Providing opportunities for control is based upon the argument that students
would have higher motivation if allowed to control their own learning (Steinberg,
1989). Steinberg also believed that this control would reduce boredom, frustration,
and anxiety from working with CAI since students would be able to choose
selectively the information. This also allows the student to avoid materials he or
she is not prepared to study or to exclude sections he or she had previously
learned. In addition, Steinberg indicated that learner control o f instruction "will
maintain attention longer, involve students more deeply, and perhaps give students
greater insights" (1989, p. 117).
While giving the learner more control of his or her learning is a noble goal,
doing so can present some problems for the learner. A student who does not know
how to make intelligent decisions for learning may not use learner control of
instruction effectively. This is the "too-much-rope" syndrome (Borsook, 1991)

19
characterized by the students having freedom to make decisions and thus have
enough rope to hang themselves.
There has been much research on various aspects of learner control, but the
studies have not confirmed the anticipated benefits o f greater individual
achievement and motivation. One possible reason for the lack o f advantage in
using learner control o f instruction is that research studies did not examine the
psychological processes and individual differences in learning skills and strategies
(Steinberg, 1989). Examples o f these are: lack of clearly defined objectives
(Romiszowski, 1981), naive or erroneous learning strategies (Steinberg, 1977),
lack o f metacognitive skills (Rigney, 1978; Allen & Merrill, 1985), or lack of
feedback information for the learner to make meaningful decisions (Tennyson &
Rotlien, 1979). The metacognitive skills are the control process of thinking which
relates new knowledge to existing knowledge, selecting thinking strategies, and
planning, monitoring, and evaluating the thinking process (Dirkes, 1985).
Learner control researchers have given students control o f various aspects
of the instructional system in an attempt to determine the instructional conditions in
which students would learn more efficiently. Unfortunately, the results have not
been consistent enough to give a clear indication of what aspects o f the instruction
the learner should be allowed to control. This does not mean however, that the
student should not have control o f his or her learning. The learner control
research has shown that learner control of instruction can be more efficient than
program control. Therefore, the mission for researchers is to determine when the

20
student should have control o f his or her learning. This includes the aspects of the
CAI that the student might be able to control as well as which students should be
able to control their instruction.
Variables of investigation
This section describes previous learner control o f instruction research
regarding the variables that the researchers have examined. Several variables of
investigation have been researched with learner control. They can be broken down
into three categories o f variables: characteristics of the learner, components of
computer assisted instruction, and learning.
First, the variables associated with the characteristics o f the learner include
locus of control orientation, personality styles, and cognitive ability. Second,
variables investigated with components of the CAI program include control of
content path, pace (Hannafin, 1984), level of difficulty, amount of practice,
completion time, (Steinberg, 1977) and text density (Morrison, Ross, & O’Dell,
1988; Ross & Morrison, 1989; Ross & Rakow, 1982; Tennyson, 1980; Tullis,
1981, 1983). The research variables typically included control of content,
sequence, and pacing. Finally, regarding the instructional features of the CAI
Hannafin (1984) examined contingencies of instruction, and Steinberg (1977)
described instructional strategies that were studied. In addition, Lee (1990, 1991)
investigated giving students advice for effective learning.

21
Variables in this study
The variables o f metacognitive advice and learner control o f sequence were
selected for this study based upon the need for further research into CAI design
features that may compensate for a student’s inability to make effective decisions
during learner control o f instruction. One guidance method is that of giving advice
to the learner regarding where to proceed in the instruction. Advice has been
shown to be beneficial for learners who do not have sufficient capabilities for
independent learning (Tennyson, 1980; Johansen & Tennyson, 1983). Regarding
the CAI feature for student control, learner control of sequence o f instruction is
one o f the primary ways that learners can have more active learning.
Learners should be able to control the sequence of the instruction to relate
the information in a personal manner to assist in their understanding of the
material. This sequence o f instruction can occur at two levels. The macro control
allows students to select "chapters" while the micro control would allow students to
sequence certain "pages" within the chapters.
In this section a more detailed literature review provides information
regarding the variables considered in this research. This study looked at the
effects o f metacognitive advisement, with learner control o f sequence instruction,
with students grouped by self-directed learning readiness levels. Also,
metacognitive advice is one type of advice that students could receive during
learner control o f instruction. Thus, the literature reviewed includes the
importance o f advice in general and metacognitive advice in particular. In

22
addition, the prior knowledge of content is examined because of its influence upon
student achievement in learner-control CAI. Finally, the attitude of students is
measured because of its importance for learning.
Sequence
The learner control o f sequence is a common method for students to have
more active participation in their learning. Some learner control studies have used
learner control of sequence as a feature o f the CAI in examining other variables of
interest. For example, Johansen and Tennyson (1983) found that learner control of
sequence is a useful strategy if advice is given to the student regarding where to
proceed. Also, Milheim (1989) found that student’s attitude toward learning was
greater when the students had control of sequence.
There have been studies to examine the effectiveness of giving students
control of the sequence of instruction. Gray (1988) showed that allowing for this
control has a positive effect on comprehension, but no effect upon retention. Also,
sequence control o f instruction is more effective when provided at different points
in the lesson (Gray, 1987).
However, other studies have found no posttest achievement differences
between learner control o f sequence and program control o f sequence (Strickland &
Wilcox, 1978; Arnone & Grabowski, 1991). In addition, Strickland and Wilcox
found no differences between treatment groups for time on rule, time on example,
time of practice, or the numbers o f rules, examples or practice items.

23
Milheim and Martin (1991) describe situations based upon motivation,
attribution, or information processing theory bases where giving the student control
of learning would be appropriate. They recommend learner control of sequence
when students are familiar with a topic and are able to make appropriate relevant
choices, and when lengthy programs have content with no prerequisite order.
Also, learners should have control when there is a high probability o f success
regardless of the chosen sequence, and when students perceive through feedback
that success is under their personal control. Furthermore, they recommended that
when students have previous knowledge of content, or are of higher ability, or
when the type of learning includes cognitive strategies or higher-order problem
solving, the learner should have control. Finally, they recommend that learner
control of sequencing should not be allowed when the material needs to be in a
certain order.
Advisement
One of the problems in relinquishing control of instruction is that the
learner may not make appropriate decisions for their instruction. Bunderson
(1976) found that students make poor choices when left with no instruction for the
next decision. Students must make two complex decisions during learner control-
how to answer a question, and where to proceed after answering the question
(Gray, 1987). Gray also reported that giving the students too much control may
distract the students.

24
Where instructional decisions need to be made, better learning is likely to
occur with the provision o f external coaching or advisement regarding what
resources to select (Tennyson, 1980). Because it is not easily practical to develop
adaptive systems, an alternative is to assist the learner by advising as to which
decisions should be made next. Hannafin (1984) indicates that learner control
would work well when coaching or when advisement is provided to assist learners
in making decisions and in using strategies known to be effective. Furthermore,
students make use of instructional suggestions and like being given advice on what
to do next for sequence and strategy (Laurillard, 1984).
Additional research has shown that learner control with advisement is
beneficial, since those students demonstrate greater achievement following
instruction than the non-advisement groups (Arnone & Grabowski, 1991; Hannafin,
Garhart, Reiber, & Phillips, 1985; Johansen & Tennyson, 1983; Tennyson, 1981;
Lee, 1991). Furthermore, Johansen and Tennyson (1983) showed that learner
control can be a powerful management strategy for learning when the learner has
sufficient advisement o f specific learning needs compared to a definite mastery
level. Arnone and Grabowski (1992) found that advisement concerning what to
study next and curiosity advice resulted in greater achievement and more curiosity
for content exploration than did learner control without advice. In a literature
review regarding learner control, with advice, Milheim and Azbell (1988) reported
that groups with advisement had higher posttest means, had more students reach

25
mastery, had longer time on task, needed less instructional time, and needed fewer
instructional instances.
When comparing levels o f advisement and locus of control orientation of
the learner, those with adaptive advisement had higher achievement, more
advisement was being followed and a greater amount of practice was performed as
compared with those who had evaluative feedback, or a combination of the two
(Santiago & Okey, 1990).
While most o f the research, concerning advisement with learner control of
instruction, found advice to be helpful, some studies showed no additional increase
in achievement from advice during instruction. Goetzfried and Hannafin (1985)
did not find advice to be helpful during learner control for low achieving students
in their accuracy o f math rule and application learning. For both groups their
achievement was poor. Thus, the effectiveness o f advice during learner control of
instruction may only occur when learners have a minimum level of cognitive
ability. In another study, Coorough (1991) also found no difference in posttest
achievement or reduction in anxiety between advisement and non-advisement
groups.
Metacognition
Metacognitive skills are very important for the success o f students working
independently on CAI (Haynes & Malouf, 1986). Learner control researchers
know that good metacognitive skills are a critical component when giving a learner
control of his or her learning (Garhart & Hannafin, 1986).

26
Self monitoring is one critical step in metacognition, and providing such
metacognitive assistance for the student’s learning with CAI may allow the student
to use his or her control more efficiently. One problem that a student may have
from controlling the instruction is that he or she may not accurately assess their
understanding o f lesson information. Garhart and Hannafin (1986) found that there
was a low correlation between student’s self reported understanding and their
achievement.
Another factor related to metacognition is perception o f learning needs.
Perception is a cognitive function that includes references to previously coded
information and comprehension of present and future learning needs (Johansen &
Tennyson, 1983). Using learner control in CAI requires higher level complex
learning tasks, and learners, without information on learning performance and
need, cannot make use o f perception (Johansen & Tennyson, 1983). Informing a
learner o f their initial assessment compared to a mastery criterion and subsequently
updating the assessment can give the learner an improved perception o f what is
required for learning (Johansen & Tennyson, 1983). Furthermore, advisement
helps learners in the perception of learning needs, need intensity, and effort
required to learn (Johansen & Tennyson, 1983).
Some research has shown a link between achievement and learner control of
instruction. Lee (1991) found students had more utilization and correctness of
metacognitive monitoring and knowledge acquisition and application for the learner
control group compared to a program control group. Also, where the program

27
control groups emphasized the product o f learning, the learner control groups
emphasized the process as well as the product of learning. In addition, Quinto and
Weener (1983) found a significant correlation between the student’s metacognitive
ability and achievement on CAI. Furthermore, Quinto and Weener found that
college students’ self assessment of their own general ability on problem solving
was a good indication of their ability to accurately predict their performance on
specific problem solving tasks.
If the student is weak in his or her metacognitive ability, the CAI can
include features to assist the learner. For example, Armstrong (1989) found that
presenting a model o f how to solve problems helped student’s self-monitoring
skills. In addition, when supportive factors such as provision o f clearly labeled
options, basic requirements, and presentation of feedback and advice concerning
on-going progress were integrated into the design of the learner control study, it
seemed to foster student’s metacognition as well as cognitive knowledge and skills
in a more effective way than program control (Lee, 1990, 1991).
There is some indication in the literature that the lack o f student
achievement with learner control in a CAI environment may not be from the lack
of control in the environment, but from the lack of the student’s metacognitive
ability to assess his or her own learning needs. Furthermore, since some studies
have shown that higher ability students achieve more with learner control, this
might be an indication that those students have the metacognition necessary to

28
succeed and that success is related to these skills and not the learner control of the
program (Higginbotham-Wheat, 1990).
Self-directed learning
Liberman and Linn (1991) describe the self-directed learning process to
include metacognition. While there has been research conducted on the
relationship of the student’s metacognition and learner control, there has not been
any research to examine the student’s self-directed learning ability related to
learner control o f CAI.
Ability
Previous research on learner control has determined two factors that
influence achievement on learner control CAI. The first is prior knowledge of
content and the second is the ability of student. Student’s with high ability can use
learner control o f instruction effectively (Santiago & Okey, 1990b).
One learner characteristic investigated is the ability or aptitude of the
students. Most research has shown that those with higher ability have more
success when given control of instructional decisions. Many students, especially
low achievers, lack the knowledge and motivation to make appropriate decisions
regarding such conditions as pacing (Gay, 1986; Reiser, 1984) sequencing of
content (Judd, Bunderson, & Bessent, 1970; Seidel, 1975; Seidel & Wagner, 1978)
and amount of practice (Ross, Rakow, & Bush, 1980; Ross & Rakow, 1981;
Tennyson, 1980). Also, studies have shown that learner control can be effective

29
when used by high aptitude students (Fry, 1972; Ross & Rakow, 1981; Hannafin,
1984).
The performance o f the learner on CAI is affected by the ability of the
learner. Researchers have shown that high achieving learners can benefit from a
high degree o f learner control (Borsook, 1991b; Gay 1986; Santiago & Okey,
1990b) In addition, Carrier, Davidson, and Williamson (1985) found that higher
ability students selected more options during CAI and had higher achievement.
However, Milheim (1988) found high and low ability students had no difference in
achievement with learner control o f instruction. Regarding lower ability students,
Goetzfried and Hannafin (1985) found no achievement difference for learners, with
control of instruction, who were of below average or low ability. Since higher
ability learners may benefit from learner control and lower ability students do not,
this suggests that learners may need a minimum level of learning competence
before being able to benefit from learner control o f instruction.
Prior knowledge of content
Another factor affecting achievement in learner control CAI is the learner’s
prior knowledge of the subject area. Researchers reported that prior knowledge in
content area improves achievement with learner control of instruction (Borsook,
1991b; Lee & Lee, 1991; Lee, 1990; Santiago & Okey, 1990b; Gay 1986;
Hannafin and Colamaio, 1987). Also, Santiago and Okey (1990a) found that
students with prior knowledge of content area can use learner control of instruction

30
effectively. However, there is also some evidence to suggest that amount of prior
knowledge does not make a difference (Lee, 1991).
Attitude
Another important aspect o f learning is the attitude of the learner
concerning the delivery o f instruction and the content of instruction. Bloom (1976)
indicates that the student’s affective level is a factor that accounts for variation in
student’s learning.
The early research on student’s attitude toward student control o f learning
has produced mixed results regarding the expected outcome o f students having a
more positive attitude with more control of their own learning. Regarding the
research showing more favorable attitudes toward learner control, Lahey, Hurlock,
and McCann (1973) found 80% of the students preferred learner control in a naval
base electronics course. In addition, other researchers (Fernald, Chiasori, &
Lawson 1975; Fry, 1972; Newkirk, 1973) found more favorable attitudes toward
learner control of instruction.
Not all research has shown learner control o f instruction to improve the
attitude of students. Judd, Bunderson, and Bessent (1970) found a lack of
improvement of attitude with student control o f learning. In addition, Reiser and
Sullivan (1977) found student attitudes, regarding taking quizzes at their own pace,
to be equal to those with no control o f quiz pace. In a review of the learner
control literature, Judd (1972) found few studies supporting learner control of
instruction to improve attitudes toward learning. A subsequent review of the

31
literature (Merrill, 1979) also found no consistent increase in attitude toward
learning for groups with learner control.
In recent learner controlled instruction CAI research, there has been little
work done on attitude toward learning using CAI. However, the recent research
still does not give a clear indication that attitude toward learning using CAI would
improve if learners have more control o f their instruction. Researchers have found
learner attitudes more favorable in CAI for learner control of context (Ross,
Morrison, & O ’Dell, 1990), for higher text density (Ross, Morrison, & O ’Dell,
1988), and levels o f feedback (Pridemore & Klein, 1992). In addition, Milheim
(1989) examined the attitudinal effects of learner control pacing and sequence, but
found no differences between attitudes. However, attitudes for all the groups were
high for using CAI with an interactive video system.
However, all research on the learner’s attitude has not been supportive of
learner control. Ross and Morrison (1989) found no difference in attitude when
learners had control o f text density. Also, Anastasio and Wilder (1984) found less
favorable attitudes with learner control in mathematics instruction. In addition,
they found that the attitude o f learners with learner control o f instruction in english
was more favorable when the CAI was combined with considerable amount of
instructor support.
Summary
This chapter provided an overview of research about the history of CAI,
statistics and research methods CAI, characteristics of the learner, and CAI and

32
learner variables that were in this study. CAI has existed since the late 1950’s and
the categories o f program and learner control o f instruction provide a major
distinction between CAI types. Furthermore, computer technological
developments, such as multimedia software programs, have allowed developers to
design more sophisticated instruction in a manner more meaningful to learners.
Thus, more sophisticated learner control CAI can be designed.
Two factors that might affect how well a learner might use the control of
instruction are metacognition and self-directed learning. Also, the research
described indicated that allowing the learner to control may not result in improved
achievement, however, increased achievement can result from external advice.
Another factor related to achievement with control o f instruction is characteristics
of the learner. Prior content knowledge and ability of the learner having control of
CAI was described as being important. Finally, the researched described did not
indicate a consistent improvement in attitude with learners having control o f their
instruction.

CHAPTER 3
METHODOLOGY
The purpose o f this study was to examine the effect o f metacognitive
advisement and control o f sequence upon achievement in an educational research
design CAI program for two levels o f student self-directed learning readiness.
Since the subject’s prior knowledge o f content and cognitive ability can affect
achievement in CAI (Lee & Lee, 1991; Santiago & Okey, 1990b), these variables
were controlled as covariates in the analysis.
Population and subjects
The target population o f this study was education graduate students. The
accessible population for this study were the graduate students in the School of
Vocational Education, School o f Human Ecology, Department of Administrative
and Foundational Services, and the Department o f Curriculum and Instruction at
Louisiana State University, Baton Rouge. The students in the School of Human
Ecology were included in the study to obtain the required number o f participants.
While these students are not classified as education students, there were only nine
from this department, thus most of the sample was comprised o f education
graduate students.
Hinkle, Wiersma and Jurs describe four factors that affect sample size: the
effect size, the population variance and the alpha and beta levels for type I and
type II errors. The effect size is the size o f the difference to be detected. In this
study, the effect was the difference in posttest scores between treatment groups of
33

34
subjects. The posttest measurement was a 20 item multiple choice test, with each
item having a value o f one point. For purposes o f the study a true difference was
considered to exist between posttest means when there was a difference of more
than one point between any two groups in the study. The population variance
estimate was taken from the final exam scores o f two recent VED 7905 Advanced
Research Design classes. The content of this course included instruction on the
threats to internal and external validity. Since some of the subjects in the study
were from the School of Vocational Education, the final exam grades o f previous
students represented a reasonable estimate of the population variance in this study.
The scores from the final exam were converted to a 20 point scale. The variance
of the final exam scores was 3. The alpha level for type one errors was set at
0.05. The final component was the power of the test. McNemar (1960) in
Hinkle, Wiersma, and Jurs (1988) recommend an alpha to beta ratio o f one to four
for behavioral science studies. Thus, the established alpha of .05 would yield a
beta o f 0.20, which would give a power of 0.80 for the statistical test. The sample
size for each treatment group depends upon the objective that divides the entire
sample into the greatest number of groups. Four o f the hypotheses required four
groups, from the eight possible treatment groups. Thus, the number o f subjects
needed, as determined from the sample size formula, was divided in half. The
sample size formula for the number o f subjects in each treatment group is n = 2a
(z„ + Zg)2 / ES2. The z„ for an a value of 0.05 is 1.65 while the zp for a /3 value

35
of 0.20 is 0.84. These values and the population variance (cr2) and effect size (ES)
were put into the formula n = 2 * 3 (1.65 4- 0.84)2 / l 2 = 37.
Since the 37 subjects were split into two groups, another subject was added
to make the number o f subjects evenly divisible by two. Thus, 19 people were
needed for each treatment group, with a total of 152 subjects for the entire study.
Regarding participation in this study, the subjects who agreed to participate
signed a participant agreement form to allow the researcher to obtain the GRE
analytical score and other demographic information. The researcher had an
accessible population o f 491 students in the four departments/schools at Louisiana
State University. This list was provided by the Records and Registration
department at the university. Subsequently, the students on the list were randomly
ordered for the researcher to contact. Then, the researcher attempted to contact
each student to see if he or she would agree to participate in the study. The
researcher attempted to call each person three times over one week at different
times during the day. If there was no response from the student after the third
phone call, the researcher considered him or her to be unavailable and selected the
next person on the list. The researcher could not contact some students because of
inaccuracies in the list provided by the Records and Registration department. Once
the phone calls were completed, the researcher had obtained 153 people who
agreed to participate in the study, Once an individual agreed to participate, the
researcher sent the participation agreement form. The participation agreement
form briefly described the requirements of participation in the study, collected the

36
demographic information, the self-directed learning readiness score, and the
participant’s approval to release his or her GRE scores. All of this was collected
under the provision o f confidentiality o f the information by the researcher.
If the researcher had not received the participation agreement form after
one week, a phone call was made to the participant to request that the form be
returned. Some of the participants then sent in the forms, while others withdrew
from the study. A final total o f 126 participation agreement forms were returned.
The students who agreed to participate in the study were divided into two
groups: higher and lower self-directed learning readiness based upon the median of
the SDLRS score for all participants. The median SDLRS score for the
participants was 240.5. Those with scores above 240.5 were classified as higher
self-directed learning readiness participants, and those with scores below 240.5
were classified as lower self-directed learning readiness participants. Thus, each
level o f the self-directed learning readiness variable contained 63 participants.
These people were then randomly assigned to four treatment groups of program
control of instructional sequence with and without metacognitive advice and learner
control of instructional sequence with and without metacognitive advice. The
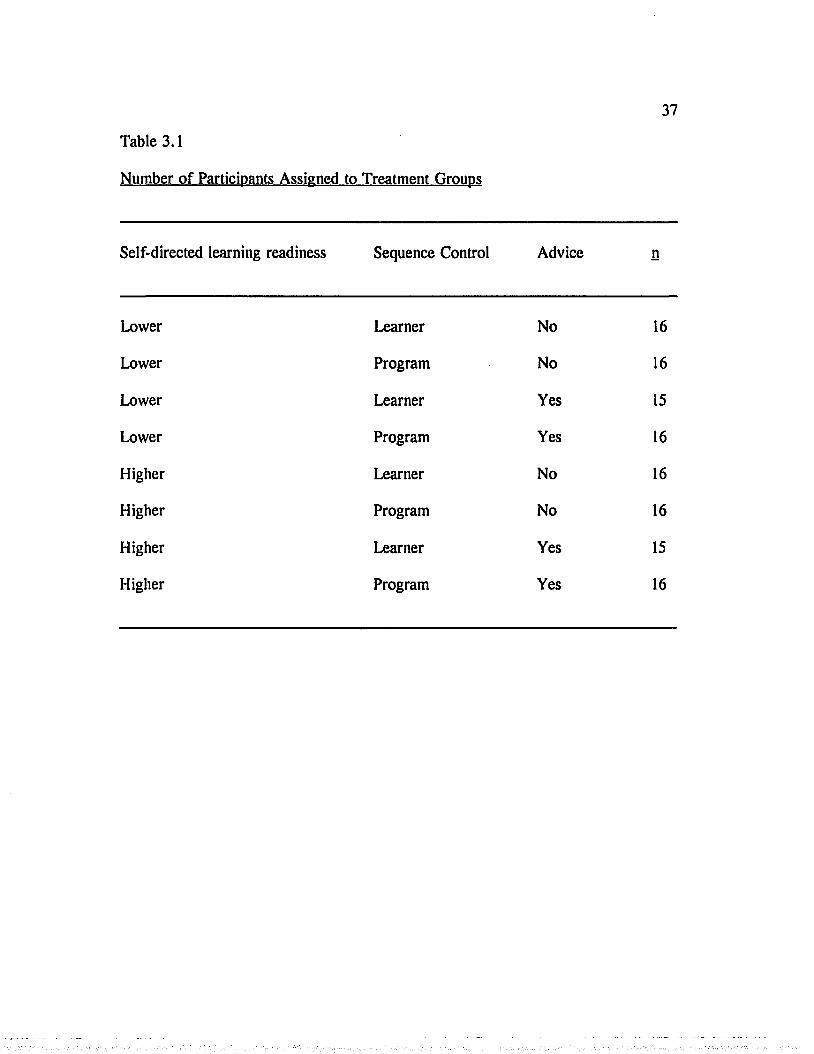
number o f participants assigned to each group is presented in Table 3.1.
After the participants were assigned to their treatment group, the researcher
called each participant to schedule time to use the instructional program. Of the
126 people who returned the participation agreement form, nine withdrew from the
study, one person’s data was thrown out after the researcher determined the
37
Table 3.1
Number o f Participants Assigned to Treatment Groups
Self-directed learning readiness Sequence Control Advice n
Lower Learner No 16
Lower Program No 16
Lower Learner Yes 15
Lower Program Yes 16
Higher Learner No 16
Higher Program No 16
Higher Learner Yes 15
Higher Program Yes 16

38
participant used the instructional program in an unintended manner, and one person
could not complete the study because of a visual impairment. This left the
researcher with 115 useable responses. The number of useable responses by
treatment group is presented in Table 3.2.
The final 115 data points were less than the number required from the
sample formula to achieve the desired beta level. However, the researcher had
exhausted the accessible population, thus no other participants were available to
replace those who withdrew from the study.
Instrumentation
In this study, six instruments were used. These instruments were used to
collect information regarding demographic information, dependent, independent,
and extraneous variables.
Descriptive information
Selected demographic characteristics of the students were collected, using
the participation agreement form except for each participant’s GRE scores, which
were collected, from the participant’s student file, using a recording form. The
characteristics selected to describe this population were department/school in which
enrolled, gender, age, level o f study, education status, self-directed learning
readiness, and GRE quantitative, verbal, and analytical scores. Also, the
participants were described by their pretest and posttest achievement scores as well
as their attitudes toward the instructional program and instructional content.

39
Table 3.2
Number o f Useable Responses by Treatment Group
Self-directed learning readiness Sequence Control Advice n
Lower Learner No 14
Lower Program No 15
Lower Learner Yes 15
Lower Program Yes 13
Higher Learner No 14
Higher Program No 15
Higher Learner Yes 14
Higher Program Yes 15

40
Independent variables
The three independent variables in the study were control o f instructional
sequence, metacognitive advice and the self-directed learning readiness level o f the
student. The first two variables were design features of the instructional program.
The control o f sequence had the levels of program and learner control. The
program control of sequence feature determined how the participant moved through
the information. The participant examined the introduction, the six individual
threats, and the case studies. The individual threat sections included information
regarding each threat. This included definition, contributing factors and controls,
examples, identify threat practice and control threat practice. The participants with
program control of sequence saw the information in the order listed above. For
the learner control of sequence, each participant had the ability to examine the
introduction, individual threats, and cases studies sections as well as the individual
threat subsections in the order he or she wanted. A participant had the ability to
look at as much or as little information as needed. Also, the participant made
decisions about how much to practice.
The metacognitive advice treatment variable had the levels o f with and
without advice. The advice was designed to assist the participant by getting him or
her to think more of their metacognition, and, thus, help his or her achievement.
The metacognitive advice given depended upon which screen the learner was
viewing at any given moment. Based upon the Gagne (1985) model for
metacognition, there are four strategies and each of these strategies had a

41
corresponding type o f advice during the instruction. First, the awareness of task
goals advice asked the student if he or she needed to take notes regarding the
objective for the section before continuing with the instruction. Next is the
knowledge of applicable learning strategies and selection of learning strategies.
The learning strategies selected were taking notes and making drawings to help the
student understand concepts. The student could have taken notes about any
information, or drawn images to create a mental map to help with understanding
the material. Regarding the advice, the instructional program monitored student
use of note taking and image representation. If the student used the note taking
and drawing features o f the instructional program, no advice was given. However,
if the student did not use those features, the instructional program asked if he or
she needed to use the features to help with their understanding and learning of the
information. The instruction for each threat included definition, contributing
factors and controls, examples, and practice identifying and controlling the threat.
Therefore, to help with participant’s understanding, he or she was asked if he or
she needed to review a particular section before completing the practice. The final
step in metacognitive process is self-monitoring. The self-monitoring advice was
given after each practice, where the participant received information regarding the
number of practice attempts, the number answered correctly on the first and second
try, and the number answered incorrectly. A point system was devised to give the
students a score along with the number answered correctly. An answer was worth
5 points for a correct response on the first try, 3 points for a correct response on

42
the second try, and 0 points for an incorrect response. After the participant saw
this information, he or she was asked how well he or she was learning the
information. In addition, when the participant had a practice rate less than the
mastery level of 85%, the instructional program asked if the participant thought he
or she needed to review the instruction for that section before continuing with
further practice.
The combination of the control o f instructional sequence and metacognitive
advice variables resulted in four treatments: Learner control o f instructional
sequence with and without metacognitive advice and program control of
instructional sequence with and without metacognitive advice. Each of the four
versions o f the instructional programs consisted of about three hours of instruction
about the topic (Designing Comparative Research to Control for Threats to Internal
Validity). The design o f the instruction is described in Appendix A.
The content of the instruction was based upon the work of Cook and
Campbell (1979). Cook and Campbell describe thirteen threats to internal validity.
Since the participants were expected to use the instructional program for about
three hours, the researcher selected six o f the thirteen threats for the instruction.
The six threats chosen were history, testing, instrumentation, mortality, differential
selection, and maturation.
The instructional program was developed using HyperCard and Hypergasp.
HyperCard is an authoring system that runs on the Macintosh computers. It is a
hypermedia program, which allows one to develop intelligent links between

43
information that the user can access in a non-linear way. The instructional content
was divided into three main sections: introduction, individual threats, and case
studies.
The introduction section described threats to internal validity in general and
explained common research design symbols. The individual threats section was
comprised o f the six threats chosen for the instruction. Each individual threat had
the following sections: definition, contributing factors and controls, examples,
identify threats practice, and control threats practice. The definition information
described the threat. For the contributing factors and controls, information was
presented when the threat would exist and methods to control the threat. The
examples section provided three examples for each threat. These included
situations when the threat existed and when it did not exist. For the practice, the
participant had a choice of identifying or controlling each threat. He or she read a
case study and then identified whether the threat existed or chose how to control
the threat. Finally, for the case study information, the participant examined brief
research reports for the example, identify, and control cases. The example case
presented whether or not all o f the threats existed and the identify case allowed the
participant to identify whether or not all o f the threats existed. The control case
allowed the participant to design part of a research study to control as many threats
as possible.
The third independent variable was the participant’s self-directed learning
readiness level. The participant’s student self-directed learning readiness was

44
measured by the SDLRS (Appendix C). Guglielmino (1977 in Guglielmino, Long,
& McCune, 1989) developed the SDLRS from a delphi study regarding "the
characteristics o f the self-directed learner which appear to be most closely related
to his self-directed learning" (p. 92). The SDLRS instrument contains 58 items
that reflect the desirable characteristics for self-directed learning. The instrument
requires people to respond to statements that describe their learning. The 5-point
Likert-type items have responses of "Almost always true, "Usually true,"
"Sometimes true," Usually not true," and "Almost never true."
The SDLRS is a valid and reliable instrument. Guglielmino et al. (1989)
indicated the instrument is reliable as determined from the 17 studies conducted to
examine the reliability of the instrument. In a recent study, Guglielmino (1988 in
Guglielmino, et al., 1989) found the SDLRS had a Pearson split-half reliability
estimate o f 0.94. In support o f the construct validity, Firestone (1984, in
Guglielmino, et al., 1989) found instructor and observer ratings o f student’s self-
directedness and the student’s SDLRS score were significantly correlated. In
addition, Brockett (1985) found the SDLRS to have a Cronbach’s alpha reliability
o f 0.87 for older adults in a study of self-directed learning and life satisfaction.
The students were blocked into two groups, higher and lower self-directed
learning readiness groups, based upon the median student SDLRS score (240.5).
Therefore, the students who scored above the SDLRS median were classified as
having higher self-directed learning readiness and the students who scored below
the median were classified as having lower self-directed learning readiness.

45
The researcher examined the reliability of the SDLRS in this study. The
SDLRS had a Cronbach’s alpha of a = .92.
Dependent variables
There were three dependent variables o f interest in this study. These were
(1) student achievement of the content; (2) student attitude toward the method of
delivery o f the instruction; and (3) the content o f the instruction. Student
achievement was determined from the posttest (Appendix D), a 20-item multiple-
choice instrument, with each item having four choices. The instrument was
designed by the researcher to measure the level of student learning of the content
regarding designing comparative research to control for threats to internal validity.
The researcher selected a range of questions regarding the definitions, contributing
factors, methods to control the threats to internal validity. The researcher used
Bloom’s (1956) taxonomy of educational objectives for the cognitive domain as a
guide to provide different levels o f difficulty for the test. There were nine
questions that were designed to test knowledge (2, 3, 4, 5, 8, 12, 13, 14, and 15).
There were two questions designed to test comprehension (1 and 7). Also, four
questions were designed to test application (6, 18, 19, and 20). One question was
designed to test analysis (9). Finally, four questions were designed to test
evaluation (10, 11, 16, and 17).
The posttest was validated by a research methods expert. The instrument
was revised based upon the advice o f the expert. After approximately one-quarter
of the students had completed the instructional program, the researcher was told by

46
a participant that one of the questions had two correct possibilities. The researcher
reviewed the posttest instrument and found that two o f the questions had errors.
These were corrected for subsequent participants. The researcher used only the 18
correct items in the data analysis. Regarding the reliability o f the posttest, the
researcher found a Spearman-Brown split-half reliability of .52.
The Robustness Semantic Differential (RSD) was used to measure the
student attitudes. Licata and Willower (1978) developed the construct of
environmental robustness as a school climate variable based upon the work of
Goffman (1967). Environmental robustness is based upon social situations being
understood using theatrical analogies which identify actors, plot, setting, and
audience (Licata & Wildes, 1980). The instrument was designed to obtain the
student’s feeling on ten bipolar adjectives regarding a statement. The two
statements in this study, which were used with the RSD, were "The instructional
program is" (Appendix E) and "The internal validity threats’ content is" (Appendix
F). Licata and Willower scored the instrument from 1 to 7 for each bipolar pair of
objectives with the more positive adjective receiving the high score. Thus, for the
10 items, the range o f possible scores was from 10 to 70, with 70 being the most
favorable attitude.
Several researchers have found the RSD to be a reliable measure of
attitudes. Licata and Willower found a test-retest reliability o f 0.77 (Pearson) for
the total instrument. In addition, Ortiz and MacGregor (1991) reported a
Cronbach’s alpha reliability ranging from 0.83 to 0.92 for six RSD scales relating
47
to mathematics instruction. Finally, Morris (1986) had six RSD scales concerning
middle-school teacher’s perceptions of student robustness and student achievement
with Cronbach’s alpha reliability ranging from 0.84 to 0.92.
The researcher measured the reliability of the RSD for both attitude
measures. The RSD for the attitude toward the instructional program had a
Cronbach’s alpha reliability o f a = .86, while the RSD for the attitude toward the
instructional content had a Cronbach’s alpha reliability o f & = .87.
Extraneous variables
The extraneous variables, prior knowledge of content and student problem
solving ability, were measured by the pretest (Appendix D) and the student’s GRE
analytical ability score, respectively. The pretest was the same as the posttest.
The researcher found the pretest to have a Spearman-Brown split-half reliability of
.08.
The other extraneous variable was student problem solving ability. A
measure o f this was obtained from the student’s GRE analytical score. The GRE
analytical score is made up of two analytical abilities: analytic reasoning and
logical reasoning. The analytic reasoning is a measure o f general analytic
reasoning for the "student ability to understand a given structure of arbitrary
relationship among fictitious persons, plans, things, or events and to deduce new
information from the relationships" (ETS p. 9, 1989 in Ratcliff, et al., 1991). The
logical reasoning is a measure of "student ability to understand, analyze, and
evaluate positions and contentions" (ETS p. 9, 1989 in Ratcliff, et al., 1991).

48
Data collection
The demographic information was gathered on a recording form for each
student from his or her student file. The other variables were collected during the
treatment period in the computer room in the College o f Education computer
laboratories. Before using the instructional program, each participant was
instructed that he or she was testing the computer instructional unit and to behave
as if it were a research methods lesson. The variables of investigation for the
study were not mentioned to the student. The first measurement made was
regarding prior knowledge of content. Each student completed the pretest, which
was administered by the computer. Next, the student proceeded through the
instruction. Once the student had completed the instruction, the posttest, student
attitude toward the instructional program and student attitude toward instructional
content instruments were administered by the computer program.
Data analysis
The alpha level of 0.05 was selected as the criteria for statistical
significance in all statistical tests performed in this study.
Objective 1
The demographic information was collected from the participation
agreement form, the recording form, and the instructional program. The
appropriate statistical description for the college department, gender, education
level, and education status is the frequency and percentage of group by each
treatment group for each variable and level o f treatment variables. For the age,

49
GRE quantitative, verbal, and analytical scores, SDLRS score, pretest and posttest
achievement scores, and the attitudes toward the instructional program and
instructional content, the appropriate statistical description is the mean, standard
deviation, and number for each treatment group and level o f treatment variables.
To interpret the SDLRS score, the researcher used Guglielmino and
Guglielmino’s (1991) interpretation scale for the instrument. The scale has five
levels: high (252-290), above average (227-251), average (202-226), below average
(155-201), and low (58-176).
Objective 2
The instructional program measured the attitude toward CAI for each
subject. Next, the scores of all subjects were sorted by the level of the treatment
variables. Three attitude comparisons were made between: program control of
sequence and learner control o f sequence; presence of metacognitive advice and
absence o f metacognitive advice; and higher and lower self-directed learning
readiness. The appropriate statistical test for this objective was a t-test o f attitude
toward the instructional program by each treatment effect.
Objective 3
The instructional program measured the attitude toward the instructional
content for each subject. Next, the scores of all subjects were sorted by the level
of the treatment variables. Three attitude comparisons were made between:
program control o f sequence and learner control o f sequence; presence of
metacognitive advice and absence o f metacognitive advice; and higher and lower

50
self-directed learning readiness. The appropriate statistical test for this objective is
a t-test of attitude toward the instructional content by each treatment effect.
Objective 4
The subjects were divided into four groups: learner control with
metacognitive advice, learner control without metacognitive advice, program
control with metacognitive advice, and program control without metacognitive
advice. For each group, a Pearson product moment correlation was calculated to
determine if a relationship existed between the student SDLRS scores and their
attitude toward the instructional program.
Hypothesis 1
The posttest scores of the subjects were sorted into two groups: those who
had metacognitive advice and those who did not. The appropriate statistical
analysis for this hypothesis was an ancova of posttest scores by metacognitive
advice or not treatment with pretest and GRE analytical scores used as covariates.
The researcher adjusted the alpha level for all ANCOVA analyses to . 10 from .05
and the direction o f the difference was examined. This was done since the F-test
from the ANCOVA is two tailed and the hypotheses are all directional, which
requires a one-tail test. Adjusting the alpha value and examining the direction of
the difference is an appropriate method to obtain a one-tail F-test (J. Geaghan,
personal communication, March 15, 1995). Thus, the desired tail of the test will
have the required .05 probability for rejecting the null hypothesis.

51
Hypothesis 2
The scores o f the subjects with learner control o f sequence were sorted into
two groups: with and without metacogntive advice. The appropriate statistical
analysis was an ancova of posttest scores by metacognitive advice or not with
pretest and GRE analytical scores used as covariates. The alpha level for this test
was set to .10 and the direction o f the difference was examined.
Hypothesis 3
The scores o f the subjects without metacognitive advice were sorted into
two groups: program control o f sequence and learner control o f sequence. The
appropriate statistical analysis was an ancova of posttest scores by metacognitive
advice or not with pretest and GRE analytical scores used as covariates. The alpha
level was set to . 10 and the direction o f the difference was examined.
Hypothesis 4
The scores of the subjects with learner control o f sequence were sorted into
two groups: higher and lower self-directed learning readiness. The appropriate
statistical analysis was an ancova o f posttest scores by metacognitive advice or not
with pretest and GRE analytical scores used as covariates. The alpha level was set
to .10 and the direction o f the difference was examined.
Hypothesis 5
The scores of the subjects with lower self-directed learning readiness were
sorted into two groups: program and learner control of sequence. The appropriate
statistical analysis was an ancova of posttest achievement by metacognitive advice

or not with pretest and GRE analytical scores used as covariates. The alpha level
was set to .10 and the direction of the difference was examined.

CHAPTER 4
RESULTS
Objective 1
The first objective was to describe the sample o f graduate students on the
following characteristics: college department, gender, age, level o f study,
education status, SDLRS score, GRE quantitative, verbal, and analytical scores,
pretest and posttest achievement scores, and the participant’s attitudes toward the
instructional program and instructional content.
The participants in each of the Administration and Foundational Services
and Vocational Education departments represented about one third of the sample.
About one quarter of the sample was from the Curriculum and Instruction
department. The number o f participants from each treatment group by department/
school are presented in Table 4.1. Regarding the self-directed learning readiness
treatment levels, the higher level had 28.6% of the participants from the
Administration and Foundational Services department and 30.2% of the participants
from the Curriculum and Instruction department. The lower level self-directed
learning readiness participants had 36.5 % of the participants from the
Administration and Foundational Services department and 22.2% from the
Curriculum and Instruction department. The number of participants by
department/school and treatment variable level are presented in Table 4.2.
Regarding the gender o f the participants, approximately 70% of the sample
was female. The lowest proportion o f female participants was 62.5 % for two
53
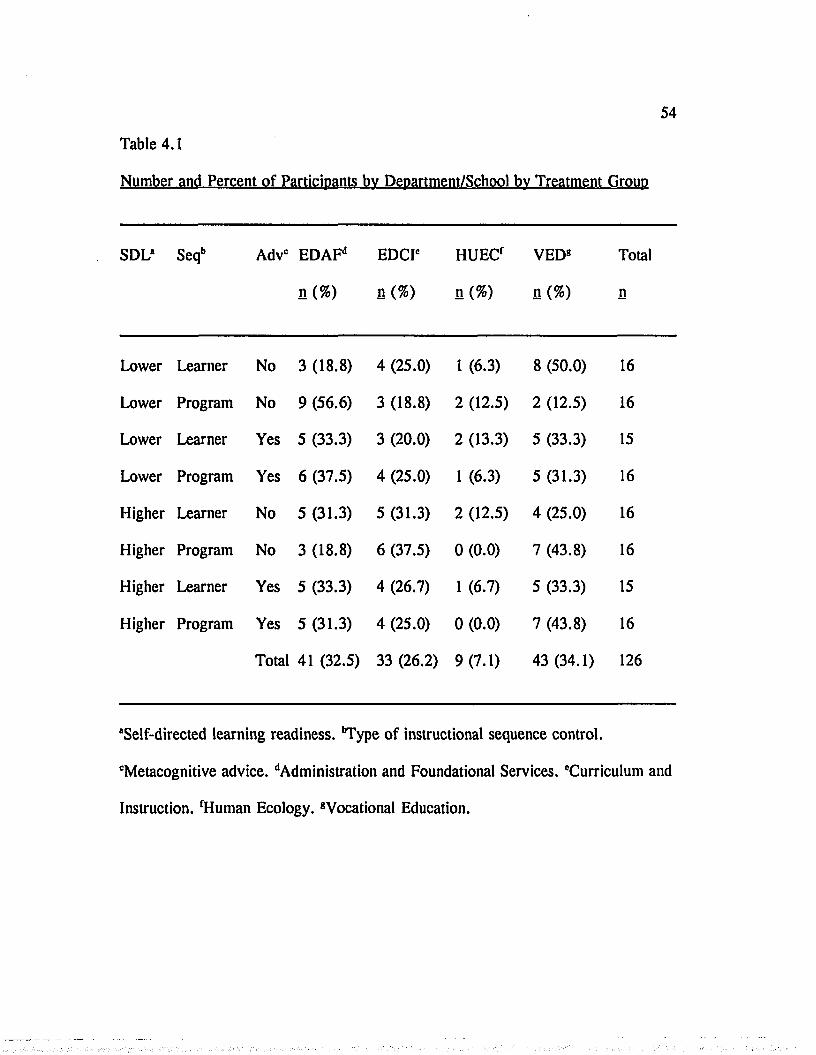
54
Table 4.1
Number and Percent of Participants bv Department/School bv Treatment Group
SDL" Seqb Adv' EDAFd
n ( * )
EDCI'
fl(% )
HUECf
n (%)
VED8
n(%)
Total
n
Lower Learner No 3 (18.8) 4 (25.0) 1 (6.3) 8 (50.0) 16
Lower Program No 9 (56.6) 3 (18.8) 2 (12.5) 2 (12.5) 16
Lower Learner Yes 5 (33.3) 3 (20.0) 2 (13.3) 5 (33.3) 15
Lower Program Yes 6 (37.5) 4 (25.0) 1 (6.3) 5 (31.3) 16
Higher Learner No 5 (31.3) 5 (31.3) 2 (12.5) 4 (25.0) 16
Higher Program No 3 (18.8) 6 (37.5) 0 (0.0) 7 (43.8) 16
Higher Learner Yes 5 (33.3) 4 (26.7) 1 (6.7) 5 (33.3) 15
Higher Program Yes 5 (31.3) 4 (25.0) 0 (0.0) 7 (43.8) 16
Total 41 (32.5) 33 (26.2) 9(7.1) 43 (34.1) 126
"Self-directed learning readiness. bType o f instructional sequence control.
'Metacognitive advice. dAdministration and Foundational Services. 'Curriculum and
Instruction. fHuman Ecology. 8Vocational Education.
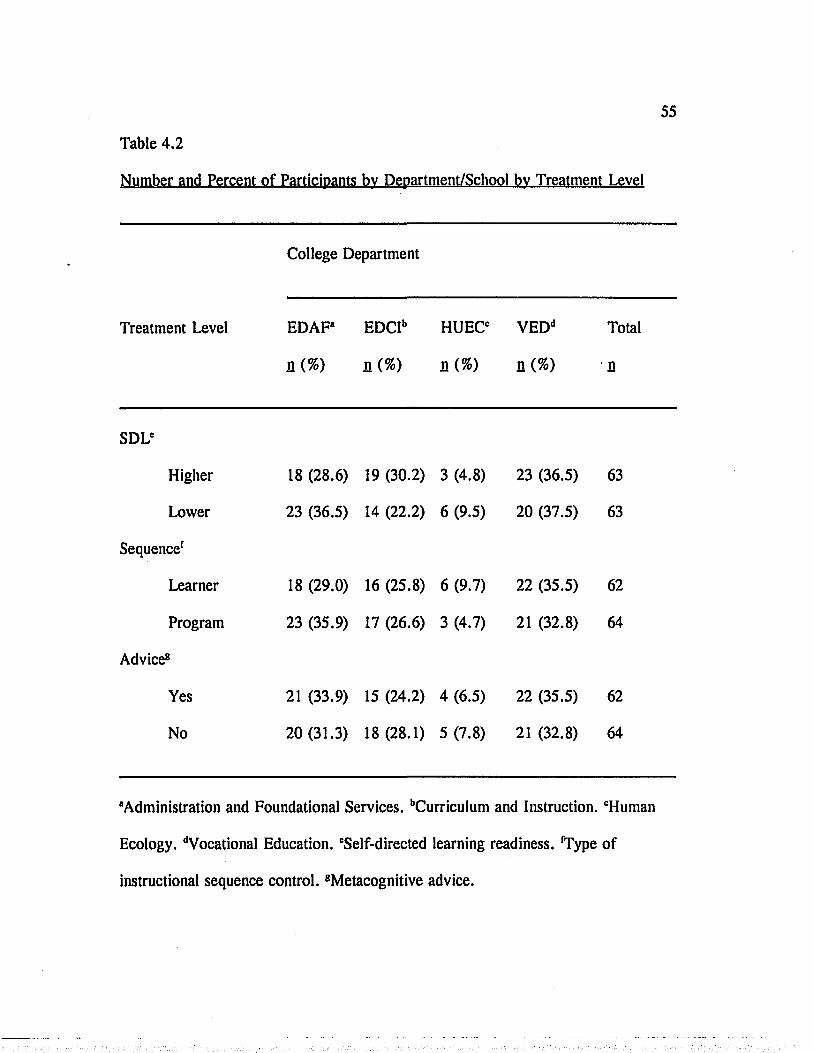
55
Table 4.2
Number and Percent of Participants bv Department/School bv Treatment Level
Treatment Level
College Department
EDAF*
n ( %)
EDClb
n ( %)
HUEC"
n ( %)
VEDd
fl(% )
Total
■ n
SDL"
Higher 18 (28.6) 19 (30.2) 3 (4.8) 23 (36.5) 63
Lower 23 (36.5) 14 (22.2) 6 (9.5) 20 (37.5) 63
Sequencef
Learner 18 (29.0) 16 (25.8) 6 (9.7) 22 (35.5) 62
Program 23 (35.9) 17 (26.6) 3 (4.7) 21 (32.8) 64
Advice8
Yes 21 (33.9) 15 (24.2) 4 (6.5) 22 (35.5) 62
No 20 (31.3) 18 (28.1) 5 (7.8) 21 (32.8) 64
"Administration and Foundational Services. bCurriculum and Instruction. "Human
Ecology. dVocational Education. "Self-directed learning readiness. Type of
instructional sequence control. 8Metacognitive advice.
56
groups: the lower self-directed learning readiness learners who had program
control o f sequence with metacognitive advice and the higher self-directed learning
readiness learners who had learner control o f sequence without metacognitive
advice. The highest proportion of female participants was 81.3% for the higher
self-directed learning readiness learners who had program control o f sequence with
metacognitive advice. The number o f participants from each treatment group by
gender are presented in Table 4.3. Also, the number o f participants by gender and
treatment variable level are presented in Table 4.4.
The mean age of all participants was 36.5 (§D = 9.4). The mean ages of
participants from each treatment group are presented in Table 4.5. Regarding the
self-directed learning readiness treatment levels, the higher self-directed learning
readiness participants had a mean age o f 39.3 (SD = 9.7, n = 62) and the lower
self-directed learning readiness participants had a mean age of 33.6 (SD = 8.6, n
= 63). The mean ages of participants by treatment variable level are presented in
Table 4.6.
Participants were described on the variable education level as either
master’s or doctoral students. A little less than one half were doctoral students.
The number o f participants from each treatment group by education level are
presented in Table 4.7. Concerning the metacognitive advice treatment variable,
nearly two-thirds of those without metacognitive advice were in the master’s
program and for those with metacognitive advice, less than half were in the

57
Table 4.3
Number and Percent of Participants bv Gender bv Treatment Group
SDL* Seqb Adv' Female
n(%)
Male
n(%)
Total
n
Lower Learner No 11 (68.8) 5 (31.3) 16
Lower Program No 12 (75.0) 4 (25.0) 16
Lower Learner Yes 10 (66.7) 5 (33.3) 15
Lower Program Yes 10 (62.5) 6 (37.5) 16
Higher Learner No 10 (62.5) 6 (37.5) 16
Higher Program No 12 (75.0) 4 (25.0) 16
Higher Learner Yes 10 (66.7) 5 (33.3) 15
Higher Program Yes 13 (81.3) 3 (18.8) 16
Total 88 (69.8) 38 (30.2) 126
“Self-directed learning readiness. T ype of instructional sequence control.
'Metacognitive advice.

Table 4.4
Number and Percent of Participants bv Gender bv Treatment Level
58
Treatment Level
Gender
Female
n ( %)
Male
n( %)
Total
n
SDL"
Higher 45 (71.4) 18 (28.6) 63
Lower 43 (68.3) 20 (31.7) 63
Sequenceb
Learner 41 (66.1) 21 (33.9) 62
Program 47 (73.4) 17 (26.6) 64
Advice' .
Yes 43 (69.4) 19 (30.6) 62
No 45 (70.3) 19 (27.9) 64
"Self-directed learning readiness. ’Type of instructional sequence control.
'Metacognitive advice.

59
Table 4.5
Mean Age of Participants bv Treatment Group
SDL* Seqb Adv° Mean SD n
Lower Learner No 36.0 9.4 16
Lower Program No 32.3 7.9 16
Lower Learner Yes 32.5 7.9 15
Lower Program Yes 33.7 7.8 16
Higher Learner No 35.9 8.7 16
Higher Program No 39.3 7.8 16
Higher Learner Yes 40.3 10.4 15
Higher Program Yes 42.8 10.6 16
Total 36.5 9.4 125d
“Self-directed learning readiness. ‘Type of instructional sequence control.
'Metacognitive advice. dl (0.8%) Missing [No score]
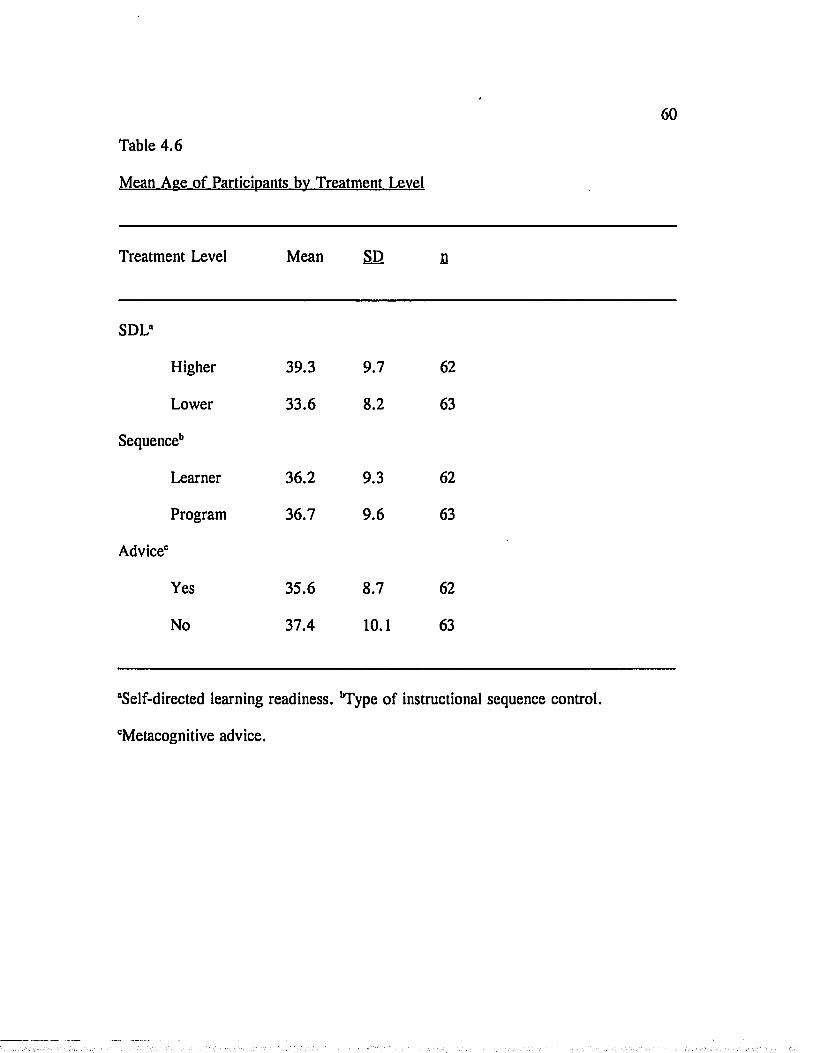
60
Table 4.6
Mean Age of Participants bv Treatment Level
Treatment Level Mean SD n
SDL"
Higher 39.3 9.7 62
Lower 33.6 8.2 63
Sequenceb
Learner 36.2 9.3 62
Program 36.7 9.6 63
Advice®
Yes 35.6 8.7 62
No 37.4 10.1 63
"Self-directed learning readiness. ‘’Type of instructional sequence control.
'Metacognitive advice.

61
Table 4.7
Number and Percent of Participants bv Education Level bv Treatment Group
SDL* Seqb Adv® Doctoral
n(%)
Masters
n(%)
Total
n
Lower •Learner No 7 (43.8) 9 (56.3) 16
Lower Program No 3 (18.8) 13 (81.3) 16
Lower Learner Yes 8 (53.3) 7 (46.7) 15
Lower Program Yes 10(62.5) 6 (37.5) 16
Higher Learner No 6 (37.5) 10 (62.5) 16
Higher Program No 6 (37.5) 10 (62.5) 16
Higher Learner Yes 8 (53.3) 7 (46.7) 15
Higher Program Yes 9 (56.3) 7 (43.8) 16
Total 57 (45.2) 69 (54.8) 126
"Self-directed learning readiness. ‘Type of instructional sequence control.
'Metacognitive advice.

62
master’s program. The number o f participants by education level and treatment
variable level are presented in Table 4.8.
Participants were described on their education status in the program as
either full-time or part-time. Full-time students were considered to be enrolled in
nine semester hours o f graduate coursework. Any student enrolled in less than
nine hours was considered to be part-time. The number o f full-time students in the
sample was a little more than 40%. The number o f participants from each
treatment group by education status is presented in Table 4.9. Also, about 37% of
the sample were full-time students for the metacognitive advice treatment level and
about 47% of the sample were full-time students for the no advice treatment level.
The number of participants by education status and treatment variable level are
presented in Table 4.10.
The mean GRE quantitative score for the sample was 511 (SD = 103).
The means for the treatment groups ranged from 486 (SD = 87) for the lower self
directed learning readiness level participants with program control o f instructional
sequence without metacognitive advice to 549 (SD = 94) for the higher self
directed learning readiness level participants with learner control of instructional
sequence without metacognitive advice. The mean GRE quantitative scores of
participants from each treatment group are presented in Table 4.11. Also, the
mean GRE quantitative scores by treatment variable level are presented in Table
4.12.

Table 4.8
Number and Percent of Participants by Education Level by Treatment Level
Treatment Level
Education Level-
Doctoral
n ( % )
Master’s
n ( %)
Total
n
SDL*
Higher 29 (46.0) 34 (54.0) 63
Lower 28 (44.4) 35 (55.6) 63
Sequence11
Learner 29 (46.8) 33 (53.2) 62
Program 28 (43.8) 36 (56.3) 64
Advice0
Yes 35 (56.5) 27 (43.5) 62
No 22 (34.4) 42 (65.6) 64
“Self-directed learning readiness. 'Type of instructional sequence control.
“Metacognitive advice.

64
Table 4.9
Number and Percent of Participants by Education Status bv Treatment Group
SDL“ Seqb Advc Full-time Part-time Total
fl(% ) n ( %) n
Lower Learner No 9 (56.3) 7 (46.8) 16
Lower Program No 6 (37.5) 10 (62.5) 16
Lower Learner Yes 5 (33.3) 10 (66.7) 15
Lower Program Ves 8 (50.0) 8 (50.0) 16
Higher Learner No 7 (43.8) 9 (56.3) 16
Higher Program No 8 (50.0) 8 (50.0) 16
Higher Learner Yes 4 (26.7) 11 (73.3) 15
Higher .Program Yes 6 (37.5) 10 (62.5) 16
Total 53 (42.1) 73 (57.9) 126
“Self-directed learning readiness. ‘Type o f instructional sequence control.
°Metacognitive advice.

Table 4.10
Number and Percent of Participants by Education Status bv Treatment Level
Treatment Level
Education Status
Full-time
n (%)
Part-time
n(%)
Total
n
SDL"
Higher 35 (39.7) 38 (60.3) 63
Lower 28 (44.4) 35 (55.6) 63
Sequenceb
Learner 25 (40.3) 37 (59.7) 62
Program 28 (43.8) 36 (56.3) 64
Advice'
Yes 23 (37.1) 39 (62.9) 62
No 30 (46.9) 34 (53.1) 64
"Self-directed learning readiness. 'Type of instructional sequence control.
'Metacognitive advice.

66
Table 4.11
Mean GRE Quantitative and GRE Verbal Scores o f Participants bv Treatment Group
SDL* Seqb Adv" Mean Qd SD Mean V" SD n
Lower Learner No 504 117 510 89 15
Lower Program No 486 87 502 85 16
Lower Learner Yes 513 126 458 122 15
Lower Program Yes 511 88 479 127 14
Higher Learner No 549 94 516 114 16
Higher Program No 514 122 529 94 14
Higher Learner Yes 487 85 511 106 15
Higher Program Yes 526 109 529 153 14
Total 511 103 504 112 119f
Note. Minimum score = 200 and maximum score = 800.
"Self-directed learning readiness. ‘Type of instructional sequence control.
'Metacognitive advice. dMean GRE quantitative score. "Mean GRE verbal score. f7
(5.5%) missing [7 (5.5%) no score].
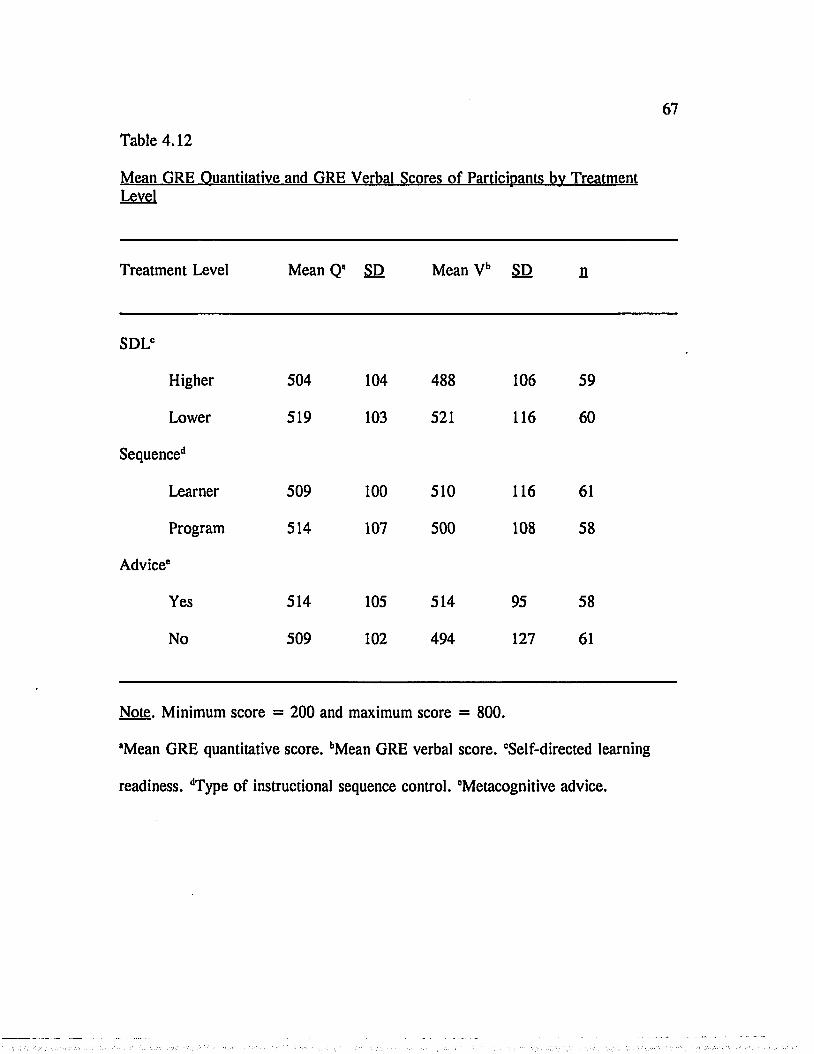
67
Table 4.12
Mean GRE Quantitative and GRE Verbal Scores of Participants bv TreatmentLevel
Treatment Level Mean Q’ SD Mean Vb SD n
SDLC
Higher 504 104 488 106 59
Lower 519 103 521 116 60
Sequenced
Learner 509 100 510 116 61
Program 514 107 500 108 58
Advice'
Yes 514 105 514 95 58
No 509 102 494 127 61
Note. Minimum score = 200 and maximum score = 800.
"Mean GRE quantitative score. bMean GRE verbal score. cSelf-directed learning
readiness. dType of instructional sequence control. 'Metacognitive advice.

68
The mean GRE verbal score for the sample was 504 (SD = 112). The
means had a range from 458 (SD = 122) for the lower self-directed learning
readiness level participants with program control of instructional sequence without
metacognitive advice to 529 for the higher self-directed learning readiness level
participants with program control of instructional sequence with metacognitive
advice (§D = 153) and the higher self-directed learning readiness level participants
with program control of instructional sequence without metacognitive advice (§D
= 94). The mean GRE verbal scores of participants from each treatment group
are presented in Table 4.11. Also, the mean GRE verbal scores by treatment
variable level are presented in Table 4.12.
The mean GRE analytical score for the sample was 514 (£D = 117). The
mean scores ranged from 489 (SD = 104) for the higher self-directed learning
readiness participants with program control of instructional sequence with
metacognitive advice to 578 (SD = 120) for the higher self-directed learning
readiness participants with learner control of sequence without metacognitive
advice. The mean GRE analytical scores of participants from each treatment group
are presented in Table 4.13. Those with metacognitive advice had a mean score of
492 (SD = 108), while those without metacognitive advice had a mean score of
533 (SD = 123). The mean GRE analytical score by treatment variable level is
presented in Table 4.14.
Concerning the participant’s SDLRS score, the entire sample had a mean of
239 (SD = 19.6). According to the interpretation chart for the self-directed

69
Table 4.13
Mean GRE Analytical Score of Participants bv Treatment Group
SDL* Seqb Advc Mean SD n
Lower Learner No 510 108 15
Lower Program No 512 122 16
Lower Learner Yes 490 107 15
Lower Program Yes 492 118 12
Higher Learner No 578 120 14
Higher Program No 539 145 12
Higher Learner Yes 500 115 11
Higher Program Yes 489 104 12
Total 514 117 107d
Note. Minimum score = 200 and maximum score = 800.
“Self-directed learning readiness. 'Type o f instructional sequence control.
'Metacognitive advice. d19 (15.1%) missing [19 (15.1%) no score].

70
Table 4.14
Mean GRE Analytical Score bv Participants bv Treatment Level
Treatment Level Mean SD n
SDL*
Higher 502 111. 49
Lower 529 123 58
Sequence11
Learner 508 121 52
Program 520 115 55
Advice'
Yes 533 123 57
No 492 107 50
Note. Minimum score = 200 and maximum score = 800.
"Self-directed learning readiness. 'Type o f instructional sequence control.
'Metacognitive advice.

learning readiness scale (Guglielmino & Guglielmino, 1991), the sample had an
above average level of self-directed learning readiness. The mean self-directed
learning readiness scores o f participants from each treatment group are presented in
Table 4.15. The median SDLRS score o f 240.5 was used to divide the sample into
higher and lower self-directed learning readiness groups. The higher self-directed
learning readiness participants had a mean score of 255 (£D = 8.9, n = 63),
while the lower self-directed learning readiness participants had a mean score of
222 (SD = 12.3, n = 63). According to the interpretation chart for the self
directed learning readiness scale (Guglielmino & Guglielmino, 1991) the higher
level participants had a high level of self directed learning readiness, while the
lower level participants had an average level of self-directed learning readiness.
The mean SDLRS score for each treatment variable level is presented in Table
4.16.
The mean pretest score for the sample was 6.3 (SD = 1.9). The lowest
pretest mean score was 5.9 and was shared by two groups, the lower self-directed
learning readiness level participants (SD = 2.0) and the higher self-directed
learning readiness participants who had program control o f instructional sequence
without metacognitive advice (SD = 1.5). The highest was 6.9 (SD = 1.6) for
the lower self-directed learning readiness participants who had learner control of
instructional sequence without metacognitive advice. The mean pretest score for
each o f the treatment groups is presented in Table 4.17. Concerning the control of
sequence treatment variable, the learner control level participants had a mean of

72
Table 4.15
Mean Self-Directed Learning Readiness Score of Participants bv Treatment Group
SDL* Seqb Adv® Mean SD n
Lower Learner No 227 12.8 16
Lower Program No 222 11.9 16
Lower Learner Yes 221 12.9 15
Lower Program Yes 219 11.1 16
Higher Learner No 257 8.8 16
Higher Program No 253 8.0 16
Higher Learner Yes 255 9.2 15
Higher Program Yes 256 10.0 16
Total 239 19.6 126
Note. Minimum score = 58 and maximum score = 290.
‘Self-directed learning readiness. 'Type of instructional sequence control.
'Metacognitive advice.

73
Table 4.16
Mean Self-Directed Learning Readiness Score of Participants by Treatment Level
Treatment Level Mean SD n
SDL"
Higher 255 8.9 63
Lower 222 12.3 63
Sequence**
Learner 240 19.3 62
Program 237 20.0 64
Advice'
Yes 237 20.7 62
No 240 18.5 64
Note. Minimum score = 58 and maximum score = 290.
"Self-directed learning readiness. 'Type o f instructional sequence control.
'Metacognitive advice.

74
Table 4.17
Mean Pretest and Posttest Scores of Participants bv Treatment Group
SDL* Seqb Adv° Mean Prd SD Mean Poe SD n
Lower Learner No 6.9 1.6 9.1 2.3 14
Lower Program No 5.9 2.0 10.0 2.2 15
Lower Learner Yes 6.3 2.2 8.7 2.7 15
Lower Program Yes 6.3 1.8 9.8 2.7 13
Higher Learner No 6.6 2.0 11.0 2.1 14
Higher Program No 5.9 1.5 10.5 2.3 15
Higher Learner Yes 6.6 2.4 10.4 2.3 14
Higher Program Yes 6.3 1.6 10.1 2.4 15
Total 6.3 1.9 9.9 2.4 115
Note. Maximum score = 18
"Self-directed learning readiness. T y p e o f instructional sequence control.
'Metacognitive advice. dMean pretest score. "Mean posttest score.

75
6.6 (SD — 2.0) while the program control level participants had a mean of 6.1
(SD = 1.7). The pretest means by treatment variable level are presented in Table
4.18.
Presented in Table 4.18 are the posttest means for the treatment groups.
Regarding the participants’ posttest scores, the mean for the sample was 9.9 (SD
= 2.4). The posttest means ranged from 9.1 (SD = 2.3) for the lower self
directed learning readiness level participants who had learner control of
instructional sequence without metacognitive advice to 11.0 (SD = 2.1) for the
higher self-directed learning readiness level participants who had learner control of
instructional sequence without metacognitive advice. The posttest means for each
level of the treatment variables are presented in Table 4.18. Concerning the self
directed learning readiness treatment variable, the higher level participants had a
mean posttest score of 10.5 (SD = 2.3) while the lower level participants had a
mean posttest score of 9.4 (SD = 2.5).
The participants’ attitudes toward the instructional program for the sample
was 52.0 (SD = 9.0). The attitude scores ranged from 49.8 (SD = 9.0) for the
lower self-directed learning readiness level participants who had learner control of
instructional sequence without metacognitive advice to 54.3 (SD = 8.2) for the
higher self-directed learning readiness participants who had learner control of
instructional sequence with metacognitive advice. The mean attitude toward the
instructional program for each treatment group is presented in Table 4.19. Also,

Table 4.18
Mean Pretest and Posttest Scores of Participants bv Treatment Level
Treatment Level Mean Pr* SD Mean Pob SD n
SDLC
Higher 6.3 1.9 10.5 2.3 58
Lower 6.3 1.9 9.4 2.5 57
Sequence11
Learner 6.6 2.0 9.8 2.5 57
Program 6.1 1.7 10.1 2.3 58
Advice'
Yes 6.4 2.0 9.8 2.5 57
No 6.3 1.8 10.1 2.3 58
Note. Maximum score = 18
•Mean pretest score. bMean posttest score. cSelf-directed learning readiness. dType
of instructional sequence control. 'Metacognitive advice.

Table 4.19
Mean Attitude toward Instructional Program and Instructional Content ofParticipants bv Treatment Group
SDL* Seqb Adv° Mean Pd SD Mean Cc SD ‘ n
Lower Learner No 49.8 9.0 47.4 7.5 14
Lower Program No 53.8 8.5 51.5 8.1 15
Lower Learner Yes 50.5 8.5 48.7 9.5 15
Lower Program Yes 50.9 8.5 47.9 8.6 13
Higher Learner No 50.1 7.4 49.4 8.4 14
Higher Program No 53.9 8.0 51.8 10.4 15
Higher Learner Yes 54.3 8.2 53.9 8.2 14
Higher Program Yes 52.8 13.1 51.9 13.8 15
Total 52.0 9.0 50.3 9.5 115f
Note. Minimum score = 10 and maximum score = 70.
“Self-directed learning readiness. ‘Type of instructional sequence control.
“Metacognitive advice. dMean attitude toward instructional program. “Mean attitude
toward instructional content. fl l (8.7%) missing [11 (8.7%) mortality].

78
the mean attitude toward the instructional program for each treatment variable level
is presented in Table 4.20.
Regarding the participants’ attitudes toward the instructional content, the
sample mean was 50.3 (§D = 9.5). The lowest attitude score was 47.4 (§D =
7.5) for the lower self-directed learning readiness level participants who had
learner control o f instructional sequence without metacognitive advice. The higher
self-directed learning readiness level participants who had learner control of
instructional sequence with metacognitive advice had the highest mean attitude
score (M = 53.9, SD = 8.2). The mean attitude scores for each treatment group
are presented in Table 4.19. In addition, the mean attitude toward the instructional
content by treatment variables level is presented in Table 4.20.
Objective 2
The second objective was to compare the attitude toward the instructional
program by categories o f each o f the three treatment variables: Self-directed
learning readiness, presence or absence o f metacognitive advice, and control of
instruction.
There was no difference in attitude toward the instructional program (1(113)
= 0.90, g = .37) between the higher (M = 52.8) and lower (M. = 51.3) self
directed learning readiness participants. Furthermore, there was no significant
difference (1(113) = 0.09, g = .93) between those who received metacognitive
advice (M = 52.1) and those who did not receive the metacognitive advice (M =
51.9). Finally, the participants who had control of instructional sequence (M =

Table 4.20
Mean Attitude toward Instructional Propram and Instructional Content ofParticipants bv Treatment Level
Treatment Level Mean P* SD Mean Cb SD n
SDL'
Higher 52.8 9.4 51.7 10.4 58
Lower 51.3 8.5 48.9 8.4 57
Sequenced
Learner 51.1 8.3 49.8 8.6 57
Program 53.0 9.6 50.9 10.4 58
Advice'
Yes 52.1 9.7 50.6 8.7 57
No 51.9 8.3 50.1 8.7 58
Note. Minimum score = 10 and maximum score = 70.
"Mean attitude toward instructional program. bMean attitude toward instructional
content. 'Self-directed learning readiness. dType of instructional sequence control.
'Metacognitive advice.

80
51.1) did not have a significantly different attitude toward the instructional
program than did those with program control of instructional sequence (M 52.9),
C(113) = -1.05, p < = .30).
Objective 3
The third objective was to compare the attitude toward instructional content
by categories of each of the three treatment effects: Self-directed learning
readiness, metacognitive advice, and control o f instructional sequence.
There was no difference in attitude toward the instructional content CO 13)
= 1.59, g < .11) between the higher (M = 51.7) and lower (M = 48.9) self
directed learning readiness participants. Also, those who received metacognitive
advice (M = 50.6) did not have a significantly different attitude than those who
did not receive the metacognitive advice (M 50.0), 0(113) = 0.33, g < .74).
Finally, the participants who had control of instructional sequence (M = 49.8) did
not have a significantly different attitude toward the instructional program than did
those with program control o f instructional sequence (M 50.9), 0(113) = 0.58, g
< .56).
Objective 4
The fourth objective was to determine if a significant relationship existed
between the participant’s SDLRS score and his or her attitude toward the
instructional program by each of the four treatment groups; learner control of
instructional sequence with metacognitive advice, learner control o f instructional
sequence without metacognitive advice, program control of instructional sequence

81
with metacognitive advice, and program control o f instructional sequence without
metacognitive advice.
To assist the researcher interpret the Pearson product moment correlation,
the researcher used the interpretation of Hinkle, Wiersma, and Jurs (1988). Using
the magnitude o f the correlation, Hinkle, Wiersma, and Jurs (1988) describe the
correlation coefficient from .00 to .30 as having little if any correlation, from .30
to .50 as having low correlation, from .50 to .70 as having moderate correlation,
from .70 to .90 as having high correlation, and from .90 to 1.00 as having very
high correlation.
The Pearson product moment correlations for the treatment groups were
learner control o f instructional sequence with metacognitive advice (.23), learner
control of instructional sequence without metacognitive advice (. 13), program
control o f instructional sequence with metacognitive advice (-.09), and program
control o f instructional sequence without metacognitive advice (.02). None of the
correlations were significant at the .05 alpha level. Since the correlations ranged
from -.09 and .23, there was little correlation (Hinkle, Wiersma, & Jurs, 1988)
between the participants SDLRS score and his or her attitude toward the
instructional program.
Hypothesis 1
The first hypothesis was that the posttest scores of those who received
metacognitive advice were higher than those who did not receive the metacognitive

82
advice controlling for the participant’s prior knowledge of content and problem
solving ability.
Contrary to the predicted result, those who received metacognitive advice
(M = 9.54) did not perform significantly better than those who did not (M =
10.21), controlling for the participant’s prior knowledge o f the content and their
problem solving ability (F (l,94) = 0.41, p = .53). The GRE analytical score was
a significant covariate, while the pretest score was not. The results o f the ancova
are presented in Table 4.21.
Hypothesis 2
The second hypothesis was that for those with learner control of sequence,
the posttest scores of those who received metacognitive advice were higher than for
those who had not received the metacognitive advice, controlling for the
participant’s prior knowledge of content and problem solving ability.
Contrary to the predicted result for the participants with learner control of
sequence, those who received metacognitive advice (M = 9.16) did not perform
significantly better than those who did not (M = 10.28) controlling for the
participants prior knowledge o f the content and their problem solving ability
(F (l,49) = 0.84, g = .36). Neither the GRE analytical score nor the pretest score
were significant covariates. The results of the ancova are presented in Table 4.22.
Hypothesis 3
The third hypothesis was that for those without metacognitive advice, the
posttest scores o f those with program control o f instructional sequence were higher

Table 4.21
Ancova of Posttest Score bv Metacognitive Advice with Pretest and GREAnalytical Score
Source 3S df MS E a
Covariates 111.28 2 55.64 11.38 < .01
Pretest 11.09 1 11.09 2.27 .14
GRE analytical 96.00 1 96.00 19.63 < .01
Treatment
Metacognitive advice 1.99 1 1.99 0.41 .53
Residual 459.71 94 4.89
Total 572.98 97 5.91
Note. n=98, 28 (22.2%) missing [17 (13.5%) no GRE analytical score, 11 (8.7%)
mortality].

84
Table 4.22
Ancova of Posttest Score bv Metacognitive Advice with Pretest and GREAnalytical Score for Participants with Learner Control of Sequence
Source SS df MS F a
Covariates 35.87 . 2 17.94 3.18 .05
Pretest 13.55 1 13.55 2.40 .13
GRE analytical 19.14 1 19.14 3.39 .07
Treatment
Metacognitive advice 4.75 1 4.75 0.84 .36
Residual 259.45 46 5.64
Total 300.07 49 6.12
Note. n=50, 12 (19.4%) missing [7 (11.3%) no GRE analytical score, 5 (8.1%)
mortality].

85
than those with learner control o f instructional sequence, controlling for the
participant’s prior knowledge o f content and problem solving ability.
Contrary to the predicted result for the participants who received
metacognitive advice, those with learner control o f sequence (M — 10.28) did not
perform significantly better than those with program control o f sequence (M =
10.15), controlling for the participants prior knowledge of the content and their
problem solving ability (F (l ,48) = 0.20, p = .59). The GRE analytical score was
a significant covariate, while the pretest score was not. The results of the ancova
are presented in Table 4.23.
Hypothesis 4
The fourth hypothesis was that for those with learner control of
instructional sequence, the posttest scores of those with higher self-directed
learning readiness were higher than those with lower self-directed learning
readiness, controlling for the participant’s prior knowledge o f content and problem
solving ability.
As predicted for the participants with learner control of sequence, the
posttest score for the higher self-directed learning readiness participants
(M = 10.64) was significantly higher than the posttest score for the lower self
directed learning readiness participants (M = 10.15), controlling for the
participant’s prior knowledge of the content and their problem solving ability
(F(l,46) = 9.35, p = .02). Neither the GRE analytical score nor the pretest score
were significant covariates. The results o f the ancova are presented in Table 4.24.

86
Table 4.23
Ancova o f Posttest Score by Control o f Sequence with Pretest and GRE Analytical Score for Participants without Metacognitive Advice
Source s s df MS F e
Covariates 103.10 2 51.55 10.54 < .01
Pretest 3.75 1 3.75 0.77 .29
GRE analytical 91.30 1 91.30 18.67 .00
Treatment
Control of instructional sequence 0.98 1 0.98 0.20 .59
Residual 158.60 48 3.30
Total 262.68 51 5.15
Note. n=52, 12 (18.8%) missing [6 (9.4%) no GRE analytical score, 6 (9.4%)
mortality].

87
Table 4.24
Ancova of Posttest Score bv Self-Directed Learning Readiness with Pretest andGRE Analytical Score for Participants with Learner Control of Sequence
Source df MS E R
Covariates 35.87 2 17.94 5.44 .04
Pretest 13.55 1 13.55 4.11 .11
GRE analytical 19.14 1 19.14 5.80 .06
Treatment
Self-directed learning readiness 30.86 1 30.86 9.35 .02
Residual 233.35 46 5.07
Total 300.08 49 6.12
Note. n=50, 12 (19.4%) missing [6 (9.7%) no GRE analytical score, 6 (9.7%)
mortality].
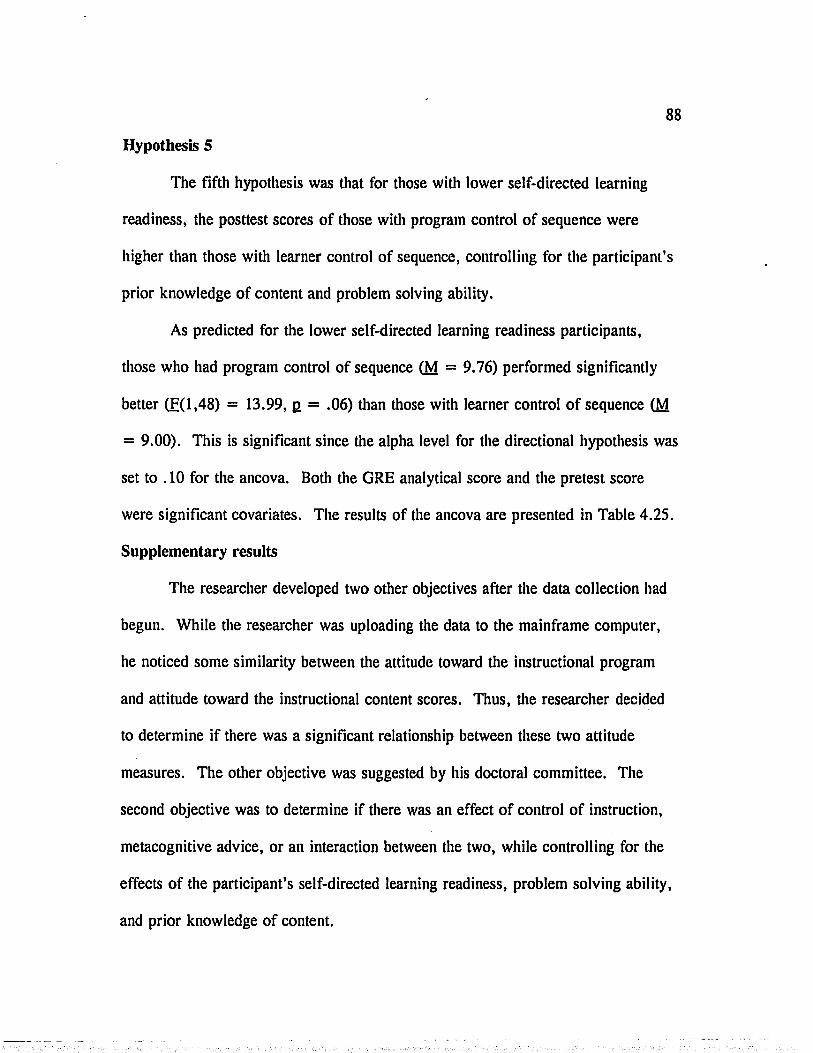
88
Hypothesis 5
The fifth hypothesis was that for those with lower self-directed learning
readiness, the posttest scores o f those with program control o f sequence were
higher than those with learner control o f sequence, controlling for the participant’s
prior knowledge of content and problem solving ability.
As predicted for the lower self-directed learning readiness participants,
those who had program control o f sequence (M = 9.76) performed significantly
better (F (l ,48) = 13.99, g = .06) than those with learner control o f sequence (M
= 9.00). This is significant since the alpha level for the directional hypothesis was
set to . 10 for the ancova. Both the GRE analytical score and the pretest score
were significant covariates. The results of the ancova are presented in Table 4.25.
Supplem entary results
The researcher developed two other objectives after the data collection had
begun. While the researcher was uploading the data to the mainframe computer,
he noticed some similarity between the attitude toward the instructional program
and attitude toward the instructional content scores. Thus, the researcher decided
to determine if there was a significant relationship between these two attitude
measures. The other objective was suggested by his doctoral committee. The
second objective was to determine if there was an effect o f control o f instruction,
metacognitive advice, or an interaction between the two, while controlling for the
effects o f the participant’s self-directed learning readiness, problem solving ability,
and prior knowledge of content.

89
Table 4.25
Ancova o f Posttest Score bv Control o f Sequence with Pretest and GRE Analytical Score for Lower Self-Directed Learning Readiness Level Participants
Source £ § df M S F g
Covariates 92.96 2 46.48 14.08 .00
Pretest 31.05 1 31.05 9.41 .01
GRE analytical 61.64 1 61.64 18.68 .00
Treatment
Control o f instructional sequence 13.99 1 13.99 4.24 .06
Residual 185.24 48 3.86
Total 292.19 51 5.73
Note. n=53, 10 (15.9%) missing [4 (6.3%) no GRE analytical score, 6 (9.5%)
mortality].

90
For the first objective, the Pearson product moment correlations for seven
o f the treatment groups were between .76 and .88. This means that there was a
high correlation (Hinkle, Wiersma, & Jurs, 1988) between the two attitude scores.
One treatment group, higher self-directed learning readiness participants with
learner control o f instructional sequence with metacognitive advice, had a Pearson
product moment correlation o f .93, which is a very high correlation (Hinkle,
Wiersma, & Jurs, 1’988). Presented in Table 4.26 are the correlations between the
attitude toward instructional content and attitude toward the instructional program
for each group and the correlation for the entire sample.
For the second supplementary objective, there was no posttest difference for
either the control of sequence or metacognitive advice treatments, nor was there an
interaction effect between the two. However, the three covariates in the analysis,
self-directed learning readiness and problem solving ability were significant. The
prior knowledge o f content covariate was not significant. The results o f the ancova
table are presented in Table 4.27.

91
Table 4.26
Relationship between Attitude toward Instructional Program and Attitude towardInstructional Content bv Treatment Group
SDL" Seqb Adv“ r p
Lower Learner No .84 < .01
Lower Program No .81 < .01
Lower Learner Yes .78 < .01
Lower Program Yes .87 < .01
Higher Learner No .77 < .01
Higher Program No .76 < .01
Higher Learner Yes .93 < .01
Higher Program Yes .88 < .01
“Self-directed learning readiness. T ype of instructional sequence control.
“Metacognitive advice.
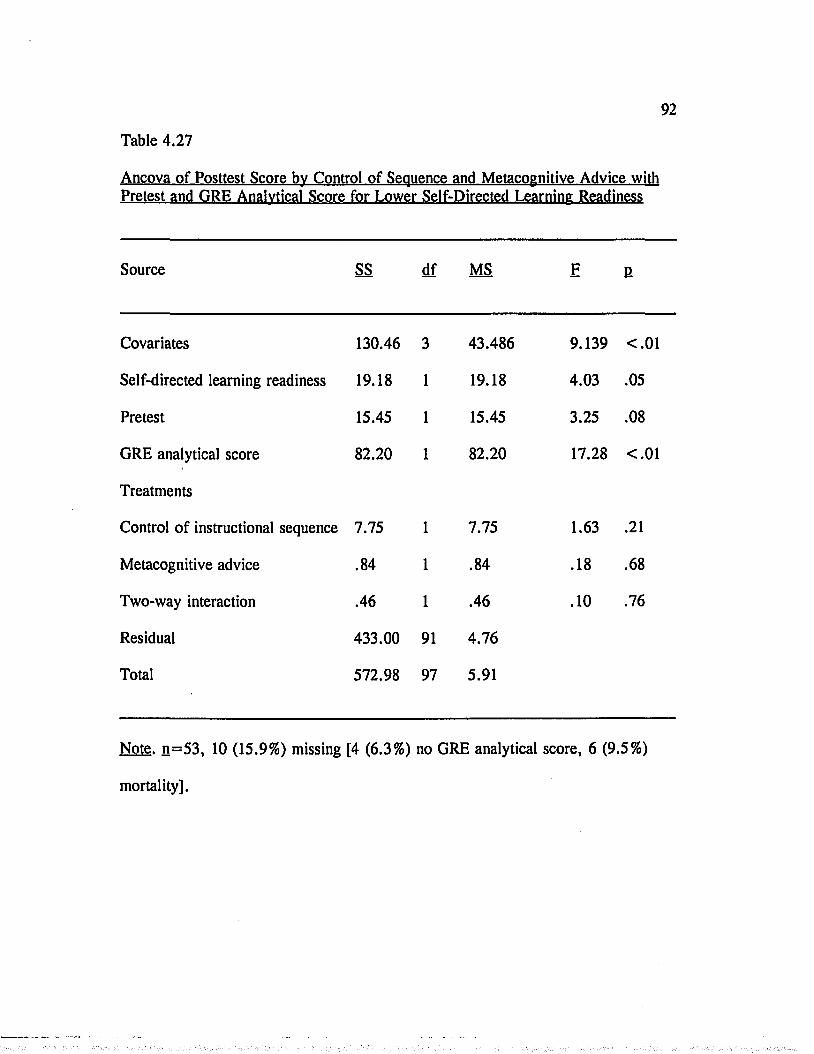
92
Table 4.27
Ancova of Posttest Score by Control of Sequence and Metacognitive Advice withPretest and GRE Analytical Score for Lower Self-Directed Learning Readiness
Source ££ df MS F R
Covariates 130.46 3 43.486 9.139 < .01
Self-directed learning readiness 19.18 1 19.18 4.03 .05
Pretest 15.45 1 15.45 3.25 .08
GRE analytical score 82.20 1 82.20 17.28 < .01
Treatments
Control of instructional sequence 7.75 1 7.75 1.63 .21
Metacognitive advice .84 1 .84 .18 .68
Two-way interaction .46 1 .46 .10 .76
Residual 433.00 91 4.76
Total 572.98 97 5.91
Note. n= 53 , 10 (15.9%) missing [4 (6.3%) no GRE analytical score, 6 (9.5%)
mortality].
CHAPTER 5
CONCLUSIONS AND RECOMMENDATIONS
There were four objectives and five hypotheses to guide the researcher.
The first objective was to describe the participants based upon selected descriptive
characteristics, which included college department, gender, age, level of study,
education status, SDLRS score, GRE quantitative, verbal, and analytical scores,
pretest and posttest achievement scores, and the participant’s attitudes toward the
instructional program and the instructional content. The second objective examined
whether or not there were differences in the participants’ attitude toward the
instructional program by levels o f each o f the three treatment variables. The third
objective examined if there were differences in the participants’ attitude toward the
instructional content by levels of each of the three treatment variables. The fourth
objective was to determine if there was a significant relationship between the
participant’s SDLRS score and his or her attitude toward the instructional program.
The target population o f the study consisted o f graduate students in selected
departments. The accessible population for the researcher were the graduate
students in the School of Vocational Education, School o f Human Ecology,
Administrative and Foundational Services, and Curriculum and Instruction
departments at the Louisiana State University, Baton Rouge.
The researcher determined that the required number o f participants for the
study was 152, based upon calculations from the sample size formula described by
Hinkle, Wiersma, and Jurs (1988). The accessible population o f the four
93

94
departments was 491 graduate students. A list o f graduate students was obtained
and all graduate students were randomly ordered within each department. The
researcher contacted these students to determine who would be willing to
participate in the study. Anyone who agreed to participate was sent a participation
agreement form to complete and return to the researcher. If a person could not be
contacted by the third attempt in a week, the researcher considered that student to
be unavailable, and selected the next potential participant from the list o f students.
A list of 153 participants was obtained by the researcher.
Each person who agreed to participate in the study was requested to
complete a participation agreement form and return it to the researcher. The
participation agreement form provided a brief description of what was expected
from each participant, collected demographic information, and included the
SDLRS. The researcher contacted the people who agreed to participate if they had
not returned the participation agreement form within one week. From the sample
of 153, 126 participation agreement forms were returned to the researcher, leaving
the researcher with a mortality rate o f 27 at this stage in the study. Unfortunately,
the researcher had exhausted the accessible population and no replacements were
available.
The SDLRS scores were calculated for all participants and they were
divided into two groups based upon the median score. The participants were
defined as having higher and lower self-directed learning readiness levels. These
two groups were then assigned to four treatment groups based upon the two other

95
treatment variables, control o f instructional sequence and metacognitive advice.
The four program versions were learner control o f instructional sequence with and
without metacogntive advice and program control of instructional sequence with
and without metacognitive advice.
The researcher then proceeded to schedule the participants to complete the
instructional program. O f the 126 people, nine withdrew from the study, one data
point was eliminated because the individual used the program in an unintended
manner, and one person could not complete the study because he had visual
disability. Thus, there were 115 useable responses.
The demographic information was collected using the participation
agreement form, a recording form, and the instructional program. Concerning the
treatment variables, the SDLRS was included with the participation agreement
form and the participants were assigned to levels of metacognitive advice and
control o f instructional sequence. The pretest achievement, posttest achievement,
attitude toward the instructional program, and attitude toward the instructional
content were measured using the instructional program.
The first objective was to describe the sample based upon the demographic
information collected. Regarding the college department, about one third of the
participants were from the Curriculum and Instruction Department. The School of
Vocational Education and the Administration and Foundation Service department
each comprised approximately one-third o f the sample. Concerning the gender of

96
participants, approximately 70% were female. The mean age o f the participants
was about 37 years.
A little less than one-half o f the sample was enrolled at the doctoral level,
while the others were enrolled at the master’s level. Pertaining to the participants
education status, a little less than 60% were enrolled part-time and the others were
enrolled full-time at the university.
The participants were also described by their GRE scores. The mean GRE
quantitative score for the treatment groups ranged from 486 to 549. the range of
mean GRE verbal scores was from 458 to 529. Finally, for the GRE analytical
score, the treatment groups means ranged from 489 to 578.
Regarding the SDLRS scores of the participants, the mean self-directed
learning readiness level was 239. The median score of 240.5 was used to divide
the sample into higher and lower self-directed learning readiness levels. The
higher level had a mean SDLRS score of 255, while the lower level had a mean
SDLRS score o f 222.
The pretest scores of the treatment groups ranged from 5.9 to 6.9 with a
mean of 6.3 for the entire sample. For the posttest, the mean scores ranged from
8.7 to 11.0 with a mean of 9.9 for the entire sample. Also, the participants were
described as to their attitude toward the instructional program and the instructional
content. For the entire sample, the mean attitude toward the instructional content
was 52, while the mean attitude toward the instructional content was approximately
50.
97
The second objective was to compare the attitude toward the instructional
content by both levels o f the three treatment variables self-directed learning
readiness, control of instructional sequence, and metacognitive advice. The third
objective was to compare the attitude toward the instructional content by both
levels o f the three treatment variables. For both objectives, there were no
differences between levels of the three treatment variables.
The final objective was to determine, for the four treatment groups, if there
was a relationship between the participant’s SDLRS score and his or her attitude
toward the instructional program. The four treatment groups were obtained from
the combination of the control of instructional sequence and metacognitive advice
treatment variables. The researcher found that there was little correlation between
the participant’s SDLRS score and their attitude toward the instructional program
for all four groups.
The researcher also had five hypotheses in the study. For the first
hypothesis, contrary to the predicted results, those who received metacognitive
advice did not have a higher posttest score than those who did not receive
metacognitive advice, controlling for the participants’ prior knowledge of the
subject and their problem solving ability. Related to the first hypothesis, the
second hypothesis predicted that for the learners with control o f instructional
sequence, those receiving metacognitive advice would have higher posttest score
than those who did not receive metacognitive advice. Contrary to the predicted

98
results, those receiving metacognitive advice did not have higher posttest score
than those who did not receive the advice.
The third hypothesis examined the posttest score between the learner and
program control of instructional sequence for those participants who did not
receive metacognitive advice. Contrary to the predicted result, those with program
control o f instructional sequence did not have higher posttest scores than those
participants with learner control o f instructional sequence.
As predicted in the fourth hypothesis, for the participants with learner
control of instructional sequence, those with a higher level o f self-directed learning
readiness had higher posttest scores than those who had a lower level of self
directed learning readiness.
Finally, as predicted in hypothesis five, the lower self-directed learning
readiness participants who had program control o f instructional sequence had
higher posttest scores than those participants with lower level o f self-directed
learning readiness who had learner control o f instructional sequence.
Conclusions
Objectives 2 and 3
The participants, by all treatment effects, did not have different attitudes
toward the instructional program or the instructional content. For this sample, the
treatments did not have an effect on the participant’s attitude toward the program
or content. Previous research has included studies with more positive attitudes
from participants having control o f instruction (Lahey, Hurlock, & McCann, 1973;

99
Fry, 1972; Newkirk, 1973). However, there have also been studies where there
has been no improvement in attitude from having control o f instruction (Judd,
Bunderson, & Bessent, 1970; Milheim, 1989). This study adds to the lack of
improvement side o f the research on improvement in attitude.
The attitude scores had a possible range o f 10 to 70, with 70 being the most
positive attitude and 10 being the most negative. The mean attitudes toward the
instructional program and instructional content with all the treatment variables was
about 50. This means the attitude toward the instructional program and content
was slightly favorable, but not much above the neutral score o f 40.
There are probably three potential factors that could have affected the
attitude outcome. First, all o f the participants were volunteers. Since they had
agreed to participate in a study during which they would learn by using a
computer, they may have had a similar disposition toward learning with computers.
Thus, a difference in attitude toward learning with computers may appear during a
classroom setting and not an experimental setting. Second, the features o f the
instruction, metacognitive advice and control o f instructional sequence, may not
have been dramatically different to cause an improvement in attitude. For
example, the students who had control of sequence may have taken the same path
as those who did not have control o f sequence. Therefore, the researcher would
not expect to find a difference in attitude between the variable control of
instructional sequence. The last potential factor is the participants’ experience with
instructional programs. Many of the students probably have not had experience

100
with any other instructional program and subsequently they would have no basis of
comparison for their attitude toward the instructional features.
Concerning the reliability o f the attitude measures, the instruments had
Cronbach alpha reliability o f .86 and .87 for the attitude toward instructional
program and the attitude toward the instructional content, respectively. Ary,
Jacobs, and Razavieh (1990) indicate that for research purposes that reliability in
the range of .30 to .50 might' be acceptable for research purposes. Therefore, in
this study, the attitude instruments were reliable.
Objective 4
There was no relationship between the participant’s SDLRS score and their
attitude toward the instructional program. The researcher wanted to determine
whether those who had control o f sequence would have a relationship between their
self-directed learning readiness and their attitude toward the instructional program.
This was based upon the premise that those people who were higher self-directed
learners would have a more positive attitude toward the instructional program when
they had control of the program. While the learner control participants had a
higher correlation than the program control participants, all correlations were
negligible since r was less than .30 for all treatment combinations. A potential
explanation for a low correlation is that the higher self-directed learning readiness
participants, with program control o f sequence, may have been satisfied with the
sequence o f the instruction and having control would not change their attitude
toward the program that much.

101
The Cronbach’s alpha reliability for the SDLRS instrument was .92. This
is an acceptable level o f reliability for the instrument (Ary, Jacobs, & Razavieh,
1990).
Hypotheses 1 and 2
There was no posttest difference between those who received metacognitive
advice and those who did not. Similarly, for only those participants with learner
control o f sequence, those with metacognitive advice did not have higher posttest
scores than those with metacognitive advice.
Most o f the research with advice and learner control o f instruction has
shown that advice is helpful (Tennyson, 1980; Hannafin, 1984; Johansen &
Tennyson, 1983; Milheim & Azbell, 1988). However, some studies found that
advice with learner control o f instruction did not help posttest achievement
(Goetzfried & Hannafin, 1985; Coorough, 1991). In this study the researcher
found that metacognitive advice was not helpful in increasing posttest achievement.
There are two possible explanations for this. First, the type o f advice may not
have been very helpful. The metacognitive advice was constructed to assist the
student to think about their learning to make better choices with the instruction.
Other research on advice has included advice on what the participant should do
next not to get him or her to think about what they should do next. The
participant may have thought about the metacognitive advice to help them make a
better decision.

102
Another potential explanation for why the metacognitive advice did not help
was because o f the nature o f the learning environment. The students participated
voluntarily for about two to three hours in a study where they would have no
academic credit for success. Since the students were using the instruction for such
a short period o f time, they may not have approached the lesson in the same
manner as they would a college course. The metacognitive advice may not have
been useful in this setting.
The researcher found that the pretest had a split-half reliability of .08 and
the posttest had a split-half reliability o f .52. The pretest reliability would not be
acceptable according to Ary, Jacobs, and Razavieh (1990). However, they
describe the reliability measure as being a function of the heterogeneity o f the
group. Since the standard deviation for the pretest instrument (SD = 1.9) was
smaller than the standard deviation for the posttest (SD = 2.4) instrument, the
research should expect the reliability for the pretest instrument to be lower.
Another factor that might have affected the reliability was the amount o f guessing
by the participants. The mean pretest score for the group was 6.3, which would
be close to the mean score o f 4.5, if a group of people had guessed all answers on
the 18 item test. Since the pretest and the posttest are the same instrument, the
reliability coefficients should not be drastically different. The researcher believes
the dramatically lower reliability level for the pretest may be from the low
variation in the pretest scores and from the guessing of the participants.

103
Hypothesis 3
The participants with program control o f instructional sequence without
metacognitive advice did not have higher achievement than those with learner
control o f instructional sequence without metacognitive advice. The researcher
expected the program control o f sequence participants to have higher achievement
than the learner control o f sequence without metacognitive advice. This would be
consistent with some research that learner control o f sequence without advice does
not lead to higher posttest achievement than program control of sequence
(Bunderson, 1976; Strickland & Wilcox, 1978; Arnone & Grabowski, 1991). In
this study there was no difference in the posttest scores of those with learner or
program control o f sequence without advice. These results might have been
expected since the participants in the study were graduate students and would be
expected to make appropriate decisions regarding their learning given control of
instruction.
Hypothesis 4
For the participants with learner control o f instructional sequence, the
higher self-directed learning readiness participants had a higher posttest
achievement than the lower self-directed learning readiness participants. Self
directed learning readiness participants have the ability to identify resources for
learning objectives, carry out plans for learning, and assess one’s ability when
objectives were met. These results break new ground in the area o f computer
assisted instruction. The researcher could not find any previous research that

investigated the participants self-directed learning ability as a variable of
investigation. This is possible since most of the research with computer-assisted
instruction has been with college age students and younger. Since self-directed
learning ability is an aspect typically found in literature concerning adult learners,
the researchers using children and youths as subjects may not have had a reason to
investigate this characteristic. This result in the study is consistent with the theory
that those with more self-directed learning ability performed better given control of
their learning. Furthermore, an individual’s self-directed learning ability may be a
key characteristic when considering whether he or she should have control of their
instruction.
Hypothesis 5
In this study the lower self-directed learning readiness participants with
program control o f sequence had higher achievement than the lower self-directed
learning readiness participants with learner control o f instruction. This was the
expected result since the lower self-directed learning readiness participants should
do better in a more instructor controlled environment. This is consistent with the
results in hypothesis 4, which gives further credibility to the importance o f the
individual’s self-directed learning readiness. The results indicate that even at an
average level o f self-directed learning readiness, adults should not have control of
the sequence o f their instruction in a computer environment.

105
Supplementary results
There was a relationship between the participant’s attitude toward the
instructional program and his or her attitude toward the instructional content. For
the eight treatment groups, there was a high or very high correlation between the
two attitude scores. From this result, the researcher believes the participants did
not separate the content from the program when they indicated their attitudes
toward the program and content.
Regarding the second supplementary result, there was no posttest difference
between levels of the control o f instructional sequence or metacognitive advice, or
an interaction between the two. Therefore, metacognitive advice was not helpful
to the participants to increase their achievement with the CAI when they had
control of instructional sequence.
Covariates
In general, the participant prior knowledge o f instruction was not a
significant covariate concerning posttest achievement. This covariate was
significant with one of the five hypotheses in this study. In this study, the
student’s prior knowledge did not significantly contribute to participant
achievement. However, since the duration of the experiment was short, the prior
knowledge may not have been an important factor. The other covariate, the
participants problem solving ability, as measured by their GRE analytical score,
was a highly significant covariate with three o f the five hypotheses and the other

106
two were less than . 10. Therefore, the participant's problem solving ability is an
important indicator of success with this type of instruction.
In addition, the participant’s problem solving ability and self-directed
learning readiness were significant covariates with the supplementary two-way
ancova analysis. This is similar to the results o f the other hypotheses and, thus,
indicates that problem solving ability and self-directed learning readiness are more
important than prior knowledge o f content with CHANGE WITH success with
learner control of instructional sequence.
Recommendations for future research
Based upon the results o f this study, the researcher believes that further
research should be conducted in several areas. First, the self-directed learning
characteristic of individuals who use CAI with control o f instruction should be
investigated to determine if this characteristic is an important criteria for
determining who should have control o f their instruction. Since this was the first
study examining this characteristic, the results need to be confirmed. In addition,
this characteristic should be examined regardless o f the age o f the participants in
the study. Younger participant’s self-directed learning ability should be examined
to determine if it contributes to achievement success with CAI.
The second area of research to be investigated involves the advice given to
participants. Studies should be done to investigate the types o f advice that improve
achievement with control o f instruction. Researchers should determine if
participants should be given advice regarding where to go next in the sequence or

107
whether they should be given advice to help them make more effective decisions
themselves.
Another study that should be done is to replicate the treatment in a research
methodology course. This study was done on a voluntary basis during a short
treatment time. The results may be different if the students are in a research
methods class and the study is longer in duration. During an entire course, the
metacognitive advice may have a different effect than during the short experiment.
Finally, the researcher has two recommendations for studying the attitude
toward CAI. First, if a researcher is going to examine the participant’s attitude
toward the CAI, he or she should examine the participant’s attitude toward specific
features and not the program in general. The researcher should do this to find out
the features that are related to improved attitudes with using CAI. The last
recommendation for research is regarding a qualitative study o f attitude toward
CAI. The researcher believes that a qualitative investigation is required to
determine if there is a difference in attitude toward the CAI when participants have
control of instruction.
Recommendations for practice
The researcher has two recommendations for practice in the development of
CAI. First, the characteristics o f the user need to be considered when deciding
whether to give control o f instruction to the user. If the users will have high
problems solving ability, high self-directed learning readiness, or prior knowledge

of the content, the researcher would recommend the user be given control o f the
instructional sequence.
Second, metacognitive advice may not be helpful in increasing achievement
with control o f instructional sequence. The advice did not have an effect in
increasing the achievement in this study. The researcher does not know if the
metacognitive advice increased the student’s metacognition, but only that it did not
help in increasing the student’s achievement in this study.
REFERENCES
Allen, B. S ., & Merrill, M. D. (1985). System-assigned strategies and CBI.Journal o f Educational Computing Research. 1(1), 3-21.
Anastasio, E. J ., & Wilder, H. Z. (1984). Is computer-based instruction ready to move into the home? (ERIC Document Reproduction Service No. ED 268 950)
Armstrong, A. M. (1989). The development o f self-regulation skills through the modeling and structuring of computer programming. Educational Technology Research and Development. 22(2), 69-76
Arnone, M. P ., & Grabowski, B. L. (1991). The effects of program control, learner control, and learner control with advisement lesson control strategies on anxiety and learning from computer-assisted instruction. (ERIC Document Reproduction Service No. ED 334 979)
Arnone, M. P ., & Grabowski, B. L. (1992). The effects o f children’s achievement and curiosity o f variations in learner control over an interactive video lesson. Educational Technology Research and Development. 40(1), 15-27.
Ary, D ., Jacobs, L. C ., & Razavieh, A. (1990). Introduction to research in education. Fort Worth: Holt, Rinehart, and Winston.
August, D. L ., Flavell, J. H ., & Clift, R. (1984). Comparison of comprehension monitoring o f skilled and less skilled readers. Reading Research Quarterly. 20, 39-53.
Barnes, J. W ., Swehosky, F. S., & Laguna-castillo, M. (1988). Using an instructional LAN to teach statistics course. Technological Horizons in Education. 16(2), 80-84.
Bloom, B. S. (1956). Taxonomy of educational objectives, the classification of educational goals, bv a committee o f college and university examiners. (Vol.1). New York: David McKay.
Bloom, S. B. (1976). Human characteristics and school learning. New York: McGraw-Hill.
Borsook, T. (1991b). Harnessing the power o f interactivity for instruction. In M.R. Simonson and C. Hargrave (Eds.), Proceedings o f the 1991 Convention of the Association for Educational Communications and Technology (pp. 103-
109
110
117). Orlando Florida: Association for educational communications and technology.
Bransford, J. D ., & Nitsch, K. E. (1978). Coming to understand things we could not previously understand. In J. F. Kavargh & W. Strange (Eds.), Speech and language in the laboratory, school, and clinic. Cambridge, MA: MIT Press
Brockett, R. G. (1985). The relationship between self-directed learning readiness and life satisfaction among older adults. Adult Education Quarterly. 35(4), 210-219.
Brown, A. L ., Campione, J. C ., & Barclay, C. R. (1979). Training self-checking routines for estimating test readiness: Generalization from list learning to prose recall. Child Development. 50. 501-512.
Brown, B. R. (1966). An instrument for the measurement of expressed attitude toward computer-assisted instruction. In H. E. Mitzel & G. L. Brandon (Eds.), Experimentation with Computer-Assisted Instruction in Technical Education. (Semi-annual progress report, project no. OEC-5-85-074). University Park, PA: The Pennsylvania State University. (ERIC Document Reproduction Service No. ED 010 498)
Carrier, G. A ., & Sales, G. C. (1987). Pair vs individual work on the acquisition of concepts in a computer-based instructional lesson. Journal o f Computer- Based Instruction. 14, 11-17
Cook, T. D ., & Campbell, D. T. (1979). Quasi-experimentation: Design and analysis issues for field settings. Chicago: Rand McNally College.
Coorough, R. P. (1991). The effects of program control, learner control, and learner control with advisement lesson control strategies on anxiety and learning from computer-assisted instruction. (ERIC Document Reproduction Service No. ED 334 979)
Davis, S. J ., & Knaupp, J. (1984). Software review. School Science and Mathematics. 84(61. 522-528.
Dick, W ., & Carey, L. (1992). The systematic design of instruction (3rd ed.). Glenview, IL: Scott, Foresman.
Dirkes, M. A. (1988). Self-directed thinking in the curriculum. Roeper Review. JJL(2), 92-94.

IllEvans, R. W. (1982). Designing computer-based education for effective
information retrieval: A cognitive science approach. (ERIC Document Reproduction Service No. ED 222 173)
Fernald, P. S ., Chiasori, M. J ., & Lawson, D. W. (1975). Systematicmanipulation o f student pacing, the perfection requirement, and contact with a teaching assistant in an introductory psychology course. Teaching of Psychology. 2(4), 147-151.
Firestone, P. (1984). A construct validation of the self-directed learning readiness scale with labor education participants. (Doctoral dissertation, University of Toronto). Dissertation Abstracts International. 46, 1160A.
Flavell, J. H. (1979). Metacognition and cognitive monitoring: A new era of cognitive-developmental inquiry. American Psychologist. 34, 906-911.
Friend, C. L ., & Cole, C. L. (1990). Learner control in computer-basedinstruction: A current literature review. Educational Technology. 30(11), 47-49.
Fry, J. P. (1972). Interactive relationship between inquisitiveness and student control o f instruction. Journal of Educational Psychology. 63(5), 459-465.
Gagne, E. D. (1984). The cognitive psychology of school learning. Boston: Little, Brown.
Garhart, C ., & Hannafin, M. (1986). The accuracy of cognitive monitoring during computer-based instruction. Journal of Computer-Based Instruction. J3(3), 88- 93.
Garner, R. (1981). Monitoring of passage inconsistency among poorcomprehenders: A preliminary test of the “ piecemeal processing” explanation. Journal o f Educational Research. 74, 159-162.
Garner, R ., & Anderson, J. (1982). Monitoring o f understanding research:Inquiry, direction, and methodological dilemmas. Journal o f Experimental Education. 50, 70-76.
Gay, G. (1986). Interaction o f learner control and prior understanding in computer- assisted video instruction. Journal of Educational Psychology. 78, 225-227.
German, K. E. (1987). Attitudes toward computer instruction. Journal of Computers in Mathematics and Science Teaching. 7(1-2), 22-28.

112
Goetzfried, L ., & Hannafin, M. J. (1985). The effect o f locus o f CAI control strategies on the learning o f mathematics rules. American Educational Research Journal. 22, 273-278.
Goffman, E. (1967). Interaction ritual. New York: Doubleday.
Gray, S. H. (1987). The effect of sequence control on computer assisted learning. Journal o f Computer-Based Instruction. 14(2), 54-56.
Gray, S. H. (1988). Sequence control menus and CAI: A follow-up study. Journal o f Computer-Based Instruction. 15(2), 57-60.
Guglielmino, L. M. (1977). Development o f the self-directed learning readiness scale. (Doctoral dissertation, University of Georgia). Dissertation Abstracts International. 2£, 6467A.
Guglielmino, L. M. (1988). [Item-test correlations and reliability estimate for 3151 respondents to the SDLRS]. Unpublished raw data.
Guglielmino, L. M ., & Guglielmino, P. J. (1991). The Learning Preference Assessment. King o f Prussia, PA: Organizational Design and Development.
Guglielmino, L. M ., Long, & McCune (1989). Reactions to Field’s investigation into the SDLRS. Adult Education Quarterly. 32(4), 235-245.
Hannafin, M. J. (1984). Guidelines for using locus of instructional control in the design o f computer-assisted instruction. Journal o f Instructional Development. 7(3), 6-10.
Hannafin, M. J ., & Colamaio, M. E. (1987). The effects o f variations in lesson control and practice on learning from interactive video. Educational Communications and Technology Journal. 21(4), 203-212.
Hannafin, M. J ., Garhart, C ., Reiber, L. P., & Phillips, T. L. (1985). Keeping interactive video in perspective: Tentative guidelines and cautions in the design o f interactive video. In E. E. Miller & M. L. Mosley (Eds.). Educational media and technology yearbook. Littleton, CO: Libraries Unlimited, Inc.
Haynes, J. A ., & Malouf, D. B. (1986). Computer assisted instruction needs help. Academic Therapy. 22(2), 157-164.
Higginbotham-Wheat, N. (1990). Learner control: When does it work? (ERIC Document Reproduction Service ED 323 930)

113
Hinkle, D ., Wiersma, W ., & Jurs, S. G. (1988). Applied statistics for the behavioral sciences (2nd ed.). Boston: Houghton Mifflin.
Hunka, S. (1991). Sixteen years o f teaching elementary applied statistics using CAI: A case study. Journal of Educational Technology Systems. i2 (2 ), 139- 150.
Johansen, K. J ., & Tennyson, R. D. (1983). Effect o f adaptive advisement on perception in learner-controlled, computer-based instruction using a rule- learning task. Educational Communication and Technology: A Journal of Theory. Research, and Development. 21(4), 226-36.
Judd, W. A. (1972, July). Learner controlled computer assisted instruction. Paper presented at the meeting o f the international school on computers in education, Pugnochiuso, Italy. (ERIC Document Reproduction Service No. ED 072 635)
Judd, W. A ., Bunderson, C. V ., & Bessent, E. W. (1970). An investigation of the effect o f learner control in computer-assisted instruction prerequisite mathematics (MATHS). (Technical report No. 5) Austin, TX: Computer- assisted instruction laboratory, The University of Texas at Austin. (ERIC Document Reproduction Service No. ED 053 532)
Knowles, M. S. (1980). The modern practice o f adult education. Englewood Cliffs, N. J.: Cambridge
Knowles, M. S. (1981). The adult learner: A neglected species (2nd ed.). Houston: Gulf.
Knowles, M. S. (1990). Fostering competence in self-directed learning. In R. M. Smith & Associates, Learning to learn across the lifespan (pp. 123-136). San Francisco: Jossey-Bass.
Lahey, G. F ., Hurlock, R. E ., & McCann, P. H. (1973). Post lesson remediation and student control of branching in computer-based training. (Research report No. SRR 73-19) Navy Training Research Laboratory, Naval Personnel and Training research course laboratory. (ERIC Document Reproduction Service No. ED 083 797)
Laurillard, D. H. (1984). Interactive video and the control of learning. Educational Technology. 24(6), 7-15.

114
Layne, B. H ., & Wells, J. B. (1990). Development and application o f CAI modules for use in Statistics and research methods courses. Journal of Computers in Mathematics and Science Teaching. 1Q(1), 35-38.
Lee, M. J. (1991). Metacognition and cognitive effects o f different loci ofinstructional control. (ERIC Document Reproduction Service No. ED 334 993)
Lee, M. J. (1990). Effects o f different loci o f instructional control on students metacognition and cognition; Learner vs. program control. (ERIC Document Reproduction Service No. ED 323 938)
Lee, S. S ., & Lee, Y. H. K. (1991). Effects o f learner control versus program control strategies on computer-assisted learning o f chemistry: For acquisition or review? Journal of Educational Psychology. 33(4), 491-498.
Licata, J. W ., & Wildes, J. R. (1980, January). Environmental robustness and classroom structure: Some field observations. The High School Journal, p 146- 154.
Licata, J. W ., & Willower, D. J. (1978). Towards an operational definition of environmental robustness. Journal of Educational Research. 21, 218-222.
Markman, E. M. (1977). Realizing that you don’t understand: A preliminary investigation. Child Development. 48, 986-992.
Mathis, A, Smith, T. & Hansen, D. (1970). College student’s attitudes toward computer-assisted instruction. Journal of Educational Psychology. 31, 46-51.
McNemar, Q. (1960). Psychological statistics (4th ed.). New York: John Wiley & Sons.
Merrill, M. D. (1979). Final report - learner controlled instructional strategies: An empirical investigation. (Working paper No. 107)
Merrill, P. F ., Hammons, K ., Tolman, M. N ., Christensen, L ., Vincent, B. R., & Reynolds, P. L. (1992). Computers in education (2nd ed.). Needham Heights, MA: Allyn and Bacon.
Milkulecky, L ., & Adams, S. M. (1986). The relationship o f extreme attributional styles (learned helplessness’) to metacognitive reading behaviors o f college students on academic probation. (ERIC Document Reproduction Service No. ED 280 014)

115
Milheim, W. D. (1988). The effects o f two learner control variables - pacing and sequence - on learning from an interactive video lesson. Unpublished doctoral dissertation, Kent State University, Kent, OH.
Milheim, W. D. (1989). Perceived attitudinal effects o f various types o f learner control in an interactive video lesson. (ERIC Document Reproduction Service No. ED 308 828)
Milheim, W. D., & Azbell, J. W. (1988). How past research on learner control can aid in the design o f interactive video materials. (ERIC Document Reproduction Service No. ED 295 652)
Milheim, W. D ., & Martin, B. L. (1991). Theoretical bases for the use of learner control: Three different perspectives. Journal of Computer-Based Instruction. 18(3), 99-105.
Mills, H ., & DeJoy, J. K. (1988). Applications o f educational technology in a selfdirected learning program for adults. Lifelong Learning. 12(3), 22-24.
Morris, B. (1986). Teacher perception o f multiple dimensions o f the work environment, environmental robustness, and school holding power.Unpublished doctoral dissertation, Louisiana State University, Baton Rouge, LA.
Morrison, G. R., Ross, S. M ., & O ’Dell, J. K. (1988). Text density level as a design variable in instructional displays. Educational Communication and Technology Journal. 36, 103-115.
Newkirk, R. L. (1973). A comparison o f learner control and machine control strategies for computer-assisted instruction. Programmed Learning and Educational Technology. 10(2), 82-91.
Nix, D. (1990). Should computers know what you can do with them? In D. Nix & R. Spiro (Eds.), Cognition. Education. Multimedia: Exploring ideas in high technology (pp. 143-162). Hillsdale, NJ: Lawrence Erlbaum Associates.
Ortiz, E ., & MacGregor, S. K. (1991). Effects o f logo programming onunderstanding variables. Journal o f Educational Computing Research. 7(1), 37-50.
Pridemore, D. R., & Klein, J. D. (1992). Effects of learner control over feedback in computer-based instruction. (ERIC Document Reproduction Service No. ED 348 016)

116
Quinto, A. L ., & Weener, P. D. (1983). Assessing metacognitive skills in problem solving. (ERIC Document Reproduction Service No. ED 229 403)
Ratcliff, J. L ., & The effect o f coursework patterns and course selection on the development o f general learned abilities among college graduates. (ERIC Document Reproduction Service No. ED 334 927)
Reiser, R. A. (1984). Reducing student procrastination in a personalized system of instruction course. Educational Communication and Technology Journal. 22, 41-49.
Reiser, R. A. (1977). Effects o f self-pacing and instructors pacing in a PSI course. Journal of Educational Research. 21(1). 8-12
Reynolds, S. B., & Dansereau, D. F. (1990). The knowledge hypermap: An alternative to hypertext. Computers and Education. 14(5), 409-416.
Rigney, J. W. (1978). Learning strategies: A theoretical perspective. In H. F. O’Neill, Jr. (Ed.). Learning strategies, (pp 165-205).
Romiszowski, A. (1981). Troubleshooting in educational technology or, Why projects fail. Programmed Learning and Educational Technology. 18(3). 168- 189.
Robinson, E. J ., & Robinson, W. P. (1984). Realizing you don’t understand: A further study. Journal o f Child Psychology and Psychiatry and Allied Disciplines. 25, 621-627.
Ross, S. M ., & Morrison, G. R. (1989). Reducing the density o f text presentations using alternative control strategies and media. (ERIC Document Reproduction Service No. ED 308 836)
Ross, S. M ., Morrison, G. R ., & O’Dell, J. K. (1988). Text density and learner control as design variables with CBI and print media. (ERIC Document Reproduction Service No. ED 395 661)
Ross, S. M ., Morrison, G. R ., & O’Dell, J. K. (1989). Uses and effects o f learner control o f context and instructional support in computer-based instruction. Educational Technology Research and Development. 37(4), 29-39.
Ross, S. M ., Morrison, G. R ., & O’Dell, J. K. (1990). Uses and effect of learner control of context and instructional support in computer-based instruction. (ERIC Document Reproduction Service No. ED 323 945)

117
Ross, S. M ., & Rakow, E. A. (1981). Learner control versus program control as adaptive strategies for selection o f instructional support on math rules. Journal of Educational Psychology. 23, 745-753.
Ross, S. M ., & Rakow, E. A. (1982). Adaptive instructional strategies for teaching rules in mathematics. Educational Communication and Technology Journal. 30, 67-74.
Ross, S. M ., Rakow, E. A ., & Bush, A. J. (1980). Instructional adaptation for self-managed learning systems. Journal o f Educational Psychology. 72, 312- 320.
Romiszowski, A. J. (1981). Designing instructional systems. London: Kogan Page.
Santiago, R. S., & Okey, J. R. (1990a) The effects o f advisement and locus of control on achievement in learner-controlled instruction. (ERIC Document Reproduction Service No. ED 330 332)
Santiago, R. S., & Okey, J. R. (1990b, February). Sorting out learner control research: Implications for instructional design and development. Paper presented at the annual conference o f the Association for Education Communications and Technology, Anaheim, CA.
Schwier, R., & Misanchuk, E. R. (1993). Interactive multimedia instruction. Englewood Cliffs, NJ: Educational Technology
Seidel, R. J. (1975). Learner control o f instructional sequencing within an adaptive tutorial CAI environment. Alexandria, VA: Human Resources Research Organization Technical Report, 75-77.
Seidel, R., & Wagner, T. (1978). Learner control of instructional sequencing within an adaptive tutorial CAI environment. Instructional Science. 7, 37-80.
Simon, J. L. (1988). Courseware reviews. Mathematics teacher. 81(6), 492-494.
Solso, R. L. (1991). Cognitive psychology (3rd ed.). Needham Heights, MA:Allyn and Bacon.
Steinberg, E. R. (1989). Cognition and learner control: A literature review, 1977- 1988. Journal o f Computer-Based Instruction. 16(4), 117-121.
Steinberg, E. R. (1977). Review of student control o f learning in computer-assisted instruction. Journal o f Computer-Based Instruction. 3(3), 84-90.

118
Street, S ., & Licata, J. W. (1988). Supervisor expertise, teacher autonomy, and environmental robustness. (ERIC Document Reproduction Service No. ED 299 697)
Strickland, S ., & Wilcox, W. C. (1978). Repression study of learner control data. (ERIC Document Reproduction Service No. ED 208 012)
Tennyson, R. D. (1980). Instructional control strategies and content structure as design variables in concept acquisition using computer-based instruction.Journal o f Educational Psvcholopv. ]2, 525-532.
Tennyson, R. D ., & Buttrey, T. (1980). Advisement and management strategies as design variables in computer-assisted instruction. Educational Communication and Technolopv Journal. 28, 169-176.
Tennyson, R. D ., Christensen, D. L., & Park, S. I. (1984). The Minnesotaadaptive instructional system: An intelligent CBI system. Journal o f Computer- Based Instruction. 11(1), 2-13.
Tennyson, R. D ., & Rasch, M. (1988). Instructional design for the improvement of learning and cognition. (ERIC Document Reproduction Service No. ED 295 667)
Tennyson, R. D ., & Rothen, W. (1979). Management of computer basedinstruction: Design o f an adaptive control strategy. Journal o f Computer-Based Instruction. 5(3), 61-74.
Tennyson, C. L ., Tennyson, R. D ., & Rothen, W. (1980). Content structure and instructional control strategies as design variables in concept acquisition.Journal o f Educational Psychology. 72(4), 499-505.
Tullis, M. (1981). An evaluation of alphanumeric, graphic, and color information displays. Human Factors. 23(5), 541-550.
Tullis, T. S. (1983). The formatting of alphanumeric displays: A review and analysis. Human Factors. 25(6), 657-682.
Wesley, B. E ., Krockover, G. H ., & Hicks, C. R. (1985). Locus o f control and acquisition o f computer literacy. Journal of Computer-Based Instruction. 12(1), 12-16
Whimbey, T. (1976). Intelligence can be taught. New York: Bantam.

APPENDIX A
DESIGN OF INSTRUCTION
The model for the design of the instruction was the systematic design of
instruction (Dick and Carey, 1990). This model has eleven steps. These are:
Identifying an instructional goal, conducting a goal analysis, conducting a
subordinate skills analysis, identifying entry behaviors and characteristics, writing
performance objectives, developing criterion-referenced test items, developing and
instructional strategy, developing instructional materials, designing and conducting
formative evaluations, revising instructional materials, and summative evaluation.
In addition, the instructional activities contained design elements that are specific to
CAI. The design guidelines described by Schwier and Misanchuk (1993) assisted
the researcher in designing effective instructional materials.
Topic
The topic for the CAI was "Designing comparative research to control for
threats to internal validity."
Audience
The target audience of this instruction was education graduate students.
The researcher included examples, practice, and testing cases from many different
aspects o f education at different educational levels. This variety was included to
provide examples that different students might find interesting or have knowledge
about the content areas.
119

120
Problem and rationale for software
Controlling for threats to internal validity is an important concern when
designing comparative research. Frequently, social science graduate students do
not have much experience in designing research and will end up in a career
conducting research or at least reading research reports. Therefore, these graduate
students should be able to effectively design and evaluate research design for
threats to internal validity.
Typically, the concept of internal validity is covered in an introductory
research methods course. However, many other topics are also discussed and thus
graduate students may not receive sufficient practice in designing experiments to
control for the threat to internal validity.
Instruction
The instruction consisted of a three hour unit using a HyperCard program.
The students read instructional material, practiced designing research, and were
evaluated on their progress. Once the instruction was completed, the students
should have understood, comprehended and had the ability to apply the knowledge
to design research to control for threats to internal validity.
The students were required to control for the six o f the thirteen threats to
internal validity identified by Cook and Campbell (1979). Six threats were chosen
because o f the time constraints of designing instruction the student could complete
in three hours. The six threats chosen were: History, Testing, Instrumentation,
Mortality, Differential Selection, and Maturation. These were chosen of the

121
thirteen because they are the most common threats to internal validity. The student
received instruction regarding the following:
• definitions o f the threats to internal validity
• contributing factors and controls for the threat
• examples o f the threats
• identification o f the threats in an example
• identification of all validity threats in a case
• control measures o f individual validity threats in an example
• control measures o f all validity threats in a case
• designs o f comparative research to control for threats to internal and
external validity
Flowchart
The flowchart for the learner control of sequence without metacognitive
advice is presented in Appendix B. Some parts of the flowchart were ommitted
since the sections are duplications and the framework can be seen in the flowchart
for the similar sections. Each individual threat had the same structure as the
shown in section A. There were three cases studies which examined all six threat
at the same time, as opposed to one individual threat. The example case allowed a
user to view whether the six threats existed. The identify case allowed the
participant to identify whether the six threats existed. Finally, the control case
allowed the participant to select design aspects to control the six threats. An

122
assessment o f student understanding was made at the score stage during sections F,
G, H, and I, as well as during the identify and control threat case studies.
Form ative evaluation o f instructional program
The instructional program was evaluated by a panel of content experts.
This panel included an instructional design expert, a content expert, and two
graduate students who were familiar with the research content and instructional
design. Revisions to the programs were made based upon the recommendations of
the panel. The instruction was evaluated for content accuracy, clarity, and
operation. In addition, the researcher asked the first five participants for each of
the four versions o f the instructional program to provide comments about the
program. Minor revisions were made after these comments were gathered.
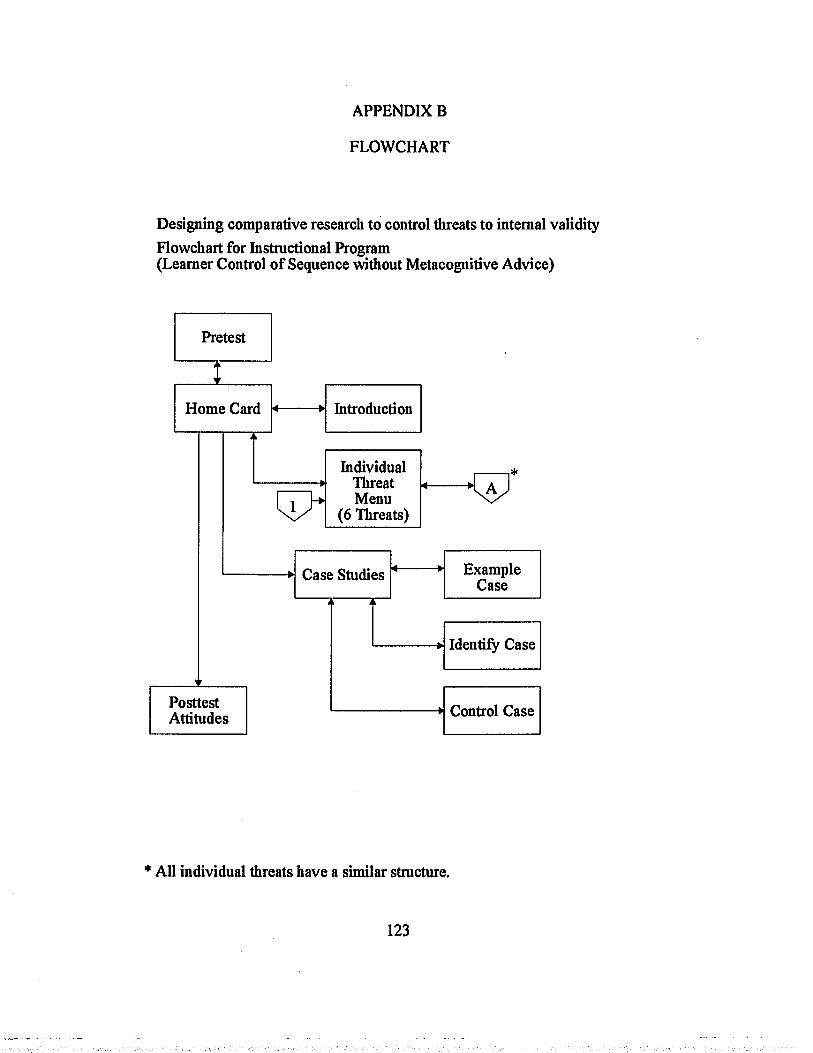
APPENDIX B
FLOWCHART
Designing comparative research to control threats to internal validityFlowchart for Instructional Program(Learner Control o f Sequence without Metacognitive Advice)
Introduction
ExampleCase
Identify Case
Control Case
Case Studies
Pretest
Home Card
PosttestAttitudes
Individual Threat Menu
(6 TTireats)
* All individual threats have a similar structure.
123

*— <2)
—>
Example 2
Example 1
Example 3
Definition
ExampleMenu
PracticeMenu
Contributing Factors
and Controls
Definition Contributing Factors
Examples Practice
Threat Menu
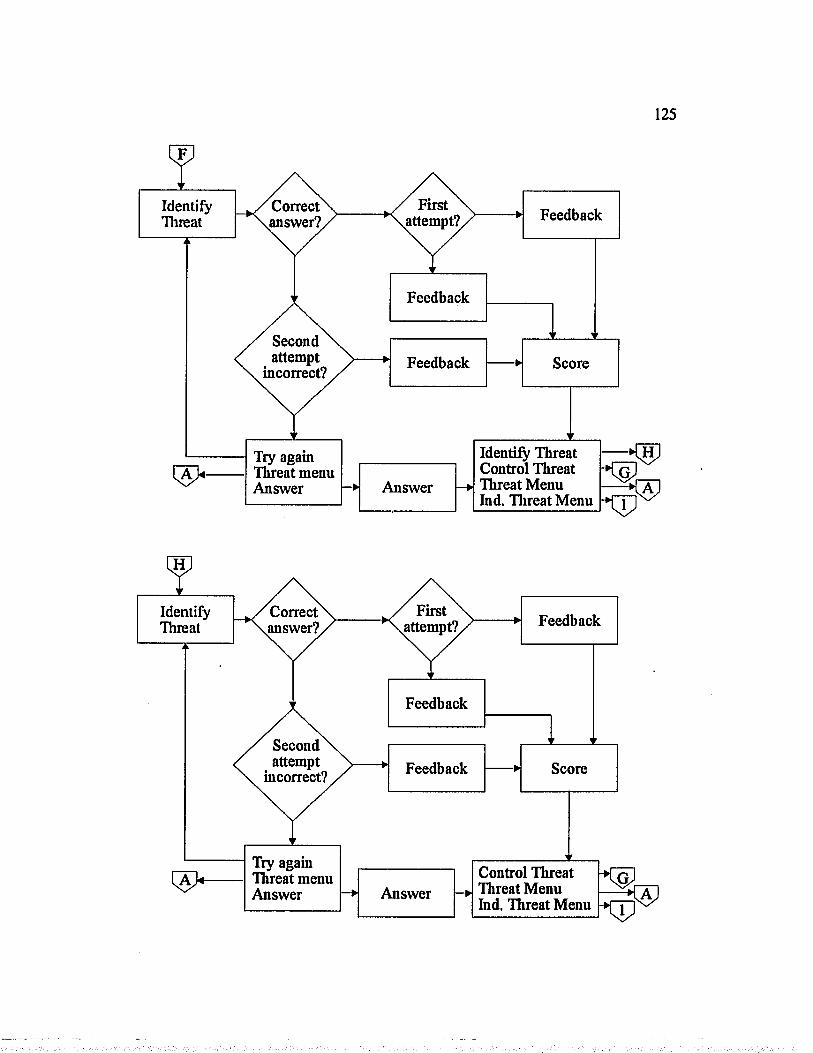
125
Identify C o rre c t\ FirstFeedbackThreat \a n s w e r ? / X attem pt? /
[ A > -
Secondattempt
incorrect?
Feedback
Feedback Score
Try again Identify ThreatThreat menu Control ThreatAnswer — ► Answer — ►Threat Menu
Ind. Threat Menu
Identify , / c FeedbackThreat \ a n ty
Feedback
Secondattempt
incorrect? Feedback Score
Try agam Threat menu Answer
Control Threat Threat Menu Ind, Threat Menu
Answer

126
Control , / C 7irst / .FeedbackThreat / a 2m p t? /~
Feedback
Secondattempt
incorrect?Feedback Score
Control Threat Identify Threat Threat Menu Ind. Threat Menu
Try agam Threat menu Answer Answer
Control , / C o rre c t\ / F i r s t / .FeedbackThreat / a n s w e r ? / / a t t e m p t? /
Secondattempt
incorrect?
Try again Threat menu Answer
Feedback
Feedback Score
-► AnswerIdentify Threat Tlireat Menu Ind. Threat Menu

APPENDIX C
SELF-DIRECTED LEARNING READINESS SCALE
AAT - Almost Always TrueUT - Usually true (more than half the time)ST - Sometimes True (about half the time)UNT - Usually Not True (less than half the time)ANT - Almost Never True
1. I’m looking forward to learning as long AAT UT ST UNT ANTas I’m living.
2. I know what I want to learn. AAT UT ST UNT ANT
3. When I see something that I don’t AAT UT ST UNT ANTunderstand, I stay away from it.
4. If there is something I want to learn, I AAT UT ST UNT ANTcan figure out a way to learn it.
5. I love to learn. AAT UT ST UNT ANT
6. It takes me a while to get started on new AAT UT ST UNT ANTprojects
7. In a classroom situation, I expect the AAT UT ST UNT ANTinstructor to tell all class membersexactly what to do at all times.
8. I believe that thinking about who you AAT UT ST UNT ANTare, where you are, and where youshould be going should be a major part of every person’s education
9. I don’t work very well on my own AAT UT ST UNT ANT
10. If I discover a need for information that I AAT UT ST UNT ANTdon’t have, I know where to go to get it.
11. I can learn things on my own better than AAT UT ST UNT ANTmost people
127

128
12. Even if I had a great idea, 1 can’t seem AAT UT ST UNT ANTto develop a plan for making it work.
13. In a learning experience, I prefer to take AAT UT ST UNT ANTpart in deciding what will be learned andhow.
14. Difficult study doesn’t bother me if I’m AAT UT ST UNT ANTinterested in something.
15. No one but me is truly responsible for AAT UT ST UNT ANTwhat I learn.
16. I can tell whether I’m learning something AAT UT ST UNT ANTwell or not.
17. There are so many things I want to learn AAT UT ST UNT ANTthat I wish that there were more hours ina day.
18. If there is something I have decided to AAT UT ST UNT ANTlearn, I can find time for it, no matterhow busy I am.
19. Understanding what I read is a problem AAT UT ST UNT ANTfor me.
20. If I don’t learn, it’s not my fault. AAT UT ST UNT ANT
21. I know when I need to learn more about AAT UT ST UNT ANTsomething.
22. If I can understand something well AAT UT ST UNT ANTenough to get by, it doesn’t bother me ifI still have questions about it.
23. I think libraries are boring places. AAT UT ST UNT ANT
24. The people I admire most are always AAT UT ST UNT ANTlearning new things.
25. I can think o f many different ways to AAT UT ST UNT ANTlearn about a new topic.

129
26. I try to relate what I am learning to my long-term goals.
AAT UT ST UNT ANT
27. I am capable of learning for myself almost anything I need to know.
AAT UT ST UNT ANT
28. I really enjoy tracking down the answer to a question.
AAT UT ST UNT ANT
29. I don’t like dealing with questions where there is not one right answer.
AAT UT ST UNT ANT
30. I have a lot o f curiosity about things. AAT UT ST UNT ANT
31. I’ll be glad when I’m finished learning. AAT UT ST UNT ANT
32. I’m not as interested in learning as other people seem to be.
AAT UT ST UNT ANT
33. I don’t have any problem with basic study skills.
AAT UT ST UNT ANT
34. I like to try new things even if I’m not sure how they will turn out.
AAT UT ST UNT ANT
35. I don’t like it when people who really know what they’re doing point out mistakes that I am making.
AAT UT ST UNT ANT
36. I’m good at thinking o f unusual ways to do things.
AAT UT ST UNT ANT
37. I like to think about the future. AAT UT ST UNT ANT
38. I’m better than most people are at trying to find out the things I need to know.
AAT UT ST UNT ANT
39. I think o f problems as challenges, not stop signs.
AAT UT ST UNT ANT
40. I can make myself do what I think I AAT UT ST UNT ANTshould.

1JU
41. I’m happy with the way I investigate problems.
AAT UT ST UNT ANT
42. I become a leader in group learning situations.
AAT UT ST UNT ANT
43. I enjoy discussing ideas. AAT UT ST UNT ANT
44. I don’t like challenging learning situations.
AAT UT ST UNT ANT
45. I have a strong desire to learn new things.
AAT UT ST UNT ANT
46. The more I learn, the more exciting the world becomes.
AAT UT ST UNT ANT
47. Learning is fun. AAT UT ST UNT ANT
48. It’s better to stick with the learning methods that we know will work instead of always trying new ones.
AAT UT ST UNT ANT
49. I want to learn more so that I can keep growing as a person.
AAT UT ST UNT ANT
50. I am responsible for my learning - no one else is.
AAT UT ST UNT ANT
51. Learning how to learn is important to me.
AAT UT ST UNT ANT
52. I will never be too old to learn new things.
AAT UT ST UNT ANT
53. Constant learning is a bore. AAT UT ST UNT ANT
54. Learning is a tool for life. AAT UT ST UNT ANT
55. I learn several new things on my own each year.
AAT UT ST UNT ANT

131
56. Learning doesn’t make any difference in AAT UT ST UNT ANTmy real life.
57. I am an effective learner in a classroom AAT UT ST UNT ANTsituation and on my own.
58. Learners are leaders. AAT UT ST UNT ANT

APPENDIX D
PRETEST AND POSTTEST
1. Which of the following statements provides an accurate description ofinternal validity.a. The instruments used in the study can reliably measure the
dependent variables.b. The results from the study are from the treatment and not from
another influence.c. The results o f the study can be from the treatment or from another
source.d. The instruments in the study can accurately measure the dependent
variables.
2. Which of the following is not a contributing factor for the testing threat tointernal validity.a. The time between the pretest and the posttest.b. The reactivity o f the pretest.c. The novelty or motivating effects of the pretest.d. The subjectivity of the pretest.
3. Which design accurately represents a pretest-posttest study with two groups?a. X O O
X O Ob. O X O
0 X 0c. x o x
x o xd. o x x
o x x
4. Random assignment does not control which of the following threats to internal validity: (Choose one)a. Historyb. Mortalityc. Testingd. Selection
132

1335. Which of the following is a contributing factor for the instrumentation
threat to internal validity.a. The reactivity o f the pretest.b. The time between the pretest and the posttest.c. The subjectivity of the pretest.d. The number o f items in the instrument.
6. A history teacher wants to find the impact o f a film developed to improve the attitudes toward World War II Holocaust survivors. One group of students will see the film, while the other group o f students will see a film about the history o f food production in the United States. The teacher has randomly selected sixty tenth grade students to participate in the study. If a pretest will be used to measure the initial students’ attitude, it will be a similar, but not the same instrument. Choose the design of the study that controls the most threats to internal validity.a. R X I 0
R X 2 0b. R O X I 0
R 0 X 2 0c. 0 X 1 0
0 X 2 0d. XI 0
X2 0
7. Which of the following statements best describes the mortality threat tointernal validity.a. The results of the study are confounded because o f the death of the
researcher conducting the study.b. The study results are confounded by the loss o f similar subjects from
both treatment groups.c. The study results are confounded because the researcher removed
subject scores from both groups because the answers were ineligible.d. The results if the study are confounded because of the loss of more
subjects from one treatment group than the other group.
8. Which of the following is not a factor that may contribute to the maturationthreat to internal validity.a. Duration of the experiment.b. Characteristics of the subjects.c. Whether the subjects were randomly selected for the experiment.d. Whether the subjects were randomly assigned to treatment groups.

134
9. A home economics teacher wishes to determine the effects of providing video information regarding safe food handling procedures to seventh grade students. The teacher randomly assigned the group of sixty students to two treatment groups. Both groups are pretested to determine their existing knowledge of safe food handling procedures. One group receives print and verbal instruction on safe food handling procedures and the other group received video instruction in addition to the print and verbal instruction.The home economist teacher knows that randomly assigning the students tothe two treatment groups controls for th e _____________ threat to internalvalidity.a. Testingb. Instrumentationc. Intrasession Historyd. Maturation
10. A researcher was interested in determining which two sets of curriculum materials is more effective for teaching safety procedures in a welding shop. The participants are sixty ninth grade welding students randomly selected from the school district to participate in the three hour instructional session. The students were assigned to groups based upon the order in which they arrived to the research classroom. The students received a safety awareness pretest, completed the instruction, and then took the posttest. In this study, the least important threat to internal validity is:a. Testingb. Selectionc. Mortalityd. Maturation
11. A researcher was interested in determining which two sets of curriculum materials is more effective for teaching safety procedures in a welding shop. The participants are sixty ninth grade welding students randomly selected from the school district to participate in the three hour instructional session. The students were assigned to groups based upon the order in which they arrived to the research classroom. The students received a safety awareness pretest, completed the instruction, and then took the posttest. In this study, the most important threat to internal validity is:a. Testingb. Selectionc. Mortalityd. Maturation

Selection is a threat to internal validity. Choose the control method that will control this threat.a. Random assignment of subjects to treatments.b. Choosing the duration o f the experiment.c. Experimental isolation of participants.d. Control for changes in the instrument.
Random assignment controls which of the following threats to internal validity: (Choose one)a. Mortalityb. Instrumentationc. Intrasession Historyd. Maturation
A researcher is interested in choosing between two sets of geography curriculum materials. The participants will be sixty eleventh grade students from the same high school. Choose a method that will control for the selection threat to internal validity.a. Allow the students to choose their group membership.b. Allow the researcher to determine group membership.c. Randomly select the students from the eleventh grade classes.d. Random assignment of students to treatment groups.
Which o f the following will control a potential mortality threat to internal validity.a. Using randomly assigned matched pairs of participants.b. Randomly assigning participants to treatment groups.c. Randomly selecting participants for the study.d. Using healthy participants.
A researcher was interested in determining which of two sets of mathematics curriculum materials was better. The participants in the study were two first grade classes in the same school. The researcher measured the students’ initial mathematics knowledge, using an objective instrument, at the beginning of the study. The students participated in the study for
"four months. At the end o f the year, the researcher measured the students’ mathematics achievement, using the same pretest instrument, to determine which curriculum materials should be used in the future. Which o f the following is the least important threat to internal validity for the study:a. Historyb. Testingc. Maturationd. Mortality

136
17. A researcher was interested in determining which of two sets of mathematics curriculum materials was better. The participants in the study were two first grade classes in the same school. The researcher measured the students’ initial mathematics knowledge, using an objective instrument, at the beginning o f the study. The students participated in the study for four months. At the end o f the year, the researcher measured the students’ mathematics achievement, using the same pretest instrument, to determine which curriculum materials should be used in the future. Which of the following is the most important threat to internal validity for the study:a. Historyb. Testingc. Maturationd. Mortality
18. A researcher is interested if students’ attitude toward science is affected by their participation in experiments during class time. The researcher thinks that if students are allowed to get ’hands on’ experience in the classroom, they will have a better attitude toward science. The principal of the school has agreed to allow the researcher to experiment on one or two ninth grade agricultural science classes, providing the experiment takes place with the existing classes and during regular class time. The experiment is one week long. The next three questions relate to this study.This choice is regarding the measurement of the dependent variable (student attitude toward science). Choose one of the following, remembering your goal is to minimize threats to internal validity.a. A twenty item, five point, Lykert-type scale instrument.b. A five question short answer instrument.c. An outside observer to ask specific questions regarding student
attitude toward science.d. Two outside observers to ask specific questions regarding student
attitude toward science.

137
19. A researcher is interested if students’ attitude toward science is affected by their participation in experiments during class time. The researcher thinks that if students are allowed to get ’hands on’ experience in the classroom, they will have a better attitude toward science. The principal o f the school has agreed to allow the researcher to experiment on one or two ninth grade agricultural science classes, providing the experiment takes place with the existing classes and during regular class time. The experiment is one week long. The next three questions relate to this study.Choose a design to control the most threats to internal validity.a. XI 0b. O XI 0c. 0 XI 0
0 X2 Od. XI 0
X2 0
20. A researcher is interested if students’ attitude toward science is affected by their participation in experiments during class time. The researcher thinks that if students are allowed to get ’hands on’ experience in the classroom, they will have a better attitude toward science. The principal o f the school has agreed to allow the researcher to experiment on one or two ninth grade agricultural science classes, providing the experiment takes place with the existing classes and during regular class time. The experiment is one week long. The next three questions relate to this study.Which factor does not affect the history threat to internal validity.a. The duration of the study.b. Whether the subjects are randomly assigned to treatment groups.c. Whether the subjects are isolated from external influences.d. Whether the subjects are randomly selected from the target
population.

APPENDIX EROBUSTNESS SEMANTIC DIFFERENTIAL FOR ATTITUDE TOWARD THE
INSTRUCTIONAL PROGRAM
The instructional program is:boring : __ :fresh : __ :meaningless ___ : ____ :important ___ : ____ :usual : __ :powerful : __ :passive : __ :thrilling : __ :uneventful ___ : ____ :challenging ___ : ____ :
interestingstalemeaningfulunimportantunusualweakactivequietingaction-packeddull

APPENDIX FROBUSTNESS SEMANTIC DIFFERENTIAL FOR ATTITUDE TOWARD THE
INSTRUCTIONAL CONTENT
The "Internal validity threats’ content" is:boring : ____: ____ : ____ :fresh : ____: ____ : ____ :meaningless ___ : ____: ____ : ____ :important ___ : ____: ____ : ____ :usual : ____: ____ : ____ :powerful : ____: ____ : ____ :passive : ____: ____ : ____ :thrilling : ____: ____ : ____ :uneventful ___ : ____: ____ : ____ :challenging ___: ____: ____ : ____ :
interestingstalemeaningfulunimportantunusualweakactivequietingaction-packeddull
139

VITA
Andrew Holden was born in St. Catharines, Ontario on June 1, 1964. He
pursued undergraduate studies at the University of Waterloo in Waterloo, Ontario.
While finishing his studies at Waterloo, by correspondence, he worked for the
Government of Ontario as a receptionist, payroll clerk, and computer technician.
He graduated with a Bachelor o f Science degree in the spring of 1990.
Andrew then attended graduate school at Louisiana State University. His
dissertation research dealt with the effect o f metacognitive advice and control of
sequence on student achievement and attitude toward computer assisted instruction
and content. He received his doctor o f philosophy in Vocational Education with a
minor in Educational Technology in May, 1995.
140

DOCTORAL EXAMINATION AND DISSERTATION REPORT
Candidate:
Major Field:
Title of Dissertation:
Date of Bxamination:
Andrew Mark Holden
Vocational Education
The Effects of Metacognitive Advice and Control of Sequence on Student Achievement and Attitude toward Computer-Assisted Instruction and Content
Approved:
Major ProfeAsoi/ and Chairman
Graduate SchoolDean of
EXAMINING COMMITTEE:
OM fcxM
UC-̂ >
March 14, 1995