THE EFFECTS OF DATA-DRIVEN INSTRUCTIONAL LEADERSHIP …
124
THE EFFECTS OF DATA-DRIVEN INSTRUCTIONAL LEADERSHIP ON STUDENT ACHIEVEMENT by Hayward Mark Chandler Liberty University A Dissertation Presented in Partial Fulfillment Of the Requirements for the Degree Doctor of Education Liberty University 2020
Transcript of THE EFFECTS OF DATA-DRIVEN INSTRUCTIONAL LEADERSHIP …

THE EFFECTS OF DATA-DRIVEN INSTRUCTIONAL LEADERSHIP ON STUDENT
ACHIEVEMENT
by
Hayward Mark Chandler
Liberty University
A Dissertation Presented in Partial Fulfillment
Of the Requirements for the Degree
Doctor of Education
Liberty University
2020

2
THE EFFECTS OF DATA-DRIVEN INSTRUCTIONAL LEADERSHIP ON STUDENT
ACHIEVEMENT
by Hayward Mark Chandler
A Dissertation Presented in Partial Fulfillment
Of the Requirements for the Degree
Doctor of Education
Liberty University, Lynchburg, VA
2020
APPROVED BY:
Carolyn McCreight Ed. D., Committee Chair
Rebecca Lunde Ed. D., Committee Member

3
ABSTRACT
Instructional leadership is key in reaching educational goals for students. Data-driven
instructional leadership leveraged to improve teachers’ instructional practices provides
opportunities for teachers to reflect, collaborate, and improve instructional practice. Data-driven
leadership has been studied, but achievement results have not been a common topic. It is of
value to understand the aspects of school leadership with causal nexus to student outcomes and
what actions by leaders are associated with positive student outcomes. This study examined the
achievement scores of four groups of schools (N= 81) in the state of New Mexico. The treatment
groups leveraged data-driven practices, while the control groups did not use formalized data-
driven practices. A causal-comparative design with a t-test analysis was conducted on the
differences of achievement scores based on the Partnership for Assessment of Readiness for
College and Career assessment. Results of independent samples t-tests did not reveal a
statistically significant difference between data-driven groups and nondata-driven groups on
neither reading nor math achievement outcomes. However, the mean averages of data-driven
groups were higher than the nondata-driven groups on both academic measures.
Keywords: instructional leadership, data, achievement, collaboration, leadership,
instructional practices

4
Dedication
This manuscript is dedicated to my Lord and Savior, Jesus Christ. His love, calling on
my life, and constant presence have both provided the foundation for this work and paved the
path to the completion of it. To my parents (Boyce and Sue) who provided me with a childhood
experience which taught me spiritual, moral, and work ethic lessons that have stood the test of
time. To my brother, Sanford - without his support, encouragement, example, influence, and
love I might never had sought to pursue any higher educational goals. To my children, Kelsi,
Elijah, and Lucas who have endured lost time from their dad as he got another degree, who
constantly provided me with laughter, inspiration, reflection, and joy. Their incredible strength,
intelligence, and love never ceased to amaze me. Bethany, Jacob, and Karissia have provided
ongoing positive encouragement to and interest in my progress and success. George Bickert, my
friend, my brother, my heart is full, and you understand. To my beautiful (Nizhoni) wife, Char,
this would not be possible without her. The long hours of reading, sorting data, editing, giving
feedback, discussing, and listening are only the tip of the iceberg in describing her demonstrated
sacrifice. Her patience, understanding, encouragement, support, and love made this dream a
reality. I can never repay her. I love you Babe!

5
Acknowledgments
I would like to acknowledge the tireless efforts of my Chair, Dr. McCreight and
Methodologist, Dr. Lunde for guiding me through the process of completing this work.
Their efforts to lead me on this journey are greatly appreciated. Their prayers, feedback,
wisdom, and support were challenging and corrective. I am grateful to the long line of
friends, family, colleagues, students, and teachers that have influenced and inspired me over
the years. Truly, I have stood upon, the shoulders of those giants who have, not only gone
before me, but those also that I have served or served with in my journey. I will not name
any names as there are too many and I would be amiss to exclude anyone that has
influenced my journey. Thank you all!

6
Table of Contents
ABSTRACT .................................................................................................................................... 3
Dedication ....................................................................................................................................... 4
Acknowledgments ........................................................................................................................... 5
List of Tables .................................................................................................................................. 8
List of Figures ................................................................................................................................. 9
List of Abbreviations .................................................................................................................... 10
CHAPTER ONE: INTRODUCTION ........................................................................................... 11
Overview ........................................................................................................................... 11
Background ....................................................................................................................... 11
Problem Statement ............................................................................................................ 18
Purpose Statement ............................................................................................................. 19
Significance of the Study .................................................................................................. 21
Research Questions ........................................................................................................... 23
Definitions ......................................................................................................................... 24
CHAPTER TWO: LITERATURE REVIEW ............................................................................... 26
Overview ........................................................................................................................... 26
Theoretical Framework ..................................................................................................... 26
Related Literature .............................................................................................................. 36
Summary ........................................................................................................................... 66
CHAPTER THREE: METHODS ................................................................................................. 71
Overview ........................................................................................................................... 71
Design ............................................................................................................................... 71

7
Research Questions ........................................................................................................... 73
Hypotheses ........................................................................................................................ 73
Participants and Setting ..................................................................................................... 73
Instrumentation ................................................................................................................. 76
Procedures ......................................................................................................................... 80
Data Analysis .................................................................................................................... 82
CHAPTER FOUR: FINDINGS .................................................................................................... 84
Overview ........................................................................................................................... 84
Research Questions ........................................................................................................... 84
Null Hypotheses ................................................................................................................ 84
Descriptive Statistics ......................................................................................................... 85
Results ............................................................................................................................... 86
CHAPTER FIVE: CONCLUSIONS ............................................................................................ 93
Overview ........................................................................................................................... 93
Discussion ......................................................................................................................... 93
Implications ....................................................................................................................... 97
Limitations ........................................................................................................................ 98
Recommendations for Future Research ............................................................................ 98
REFERENCES ........................................................................................................................... 100
APPENDIX ................................................................................................................................. 124

8
List of Tables
Table 1. Descriptive Statistics for PARCC Reading Scores (Research Question One)
………………………………………………………………….………….….…85
Table 2. Descriptive Statistics for PARCC Math Scores (Research Question Two)
…………………………………..………………….……………………………..…85
Table 3. Kolmogorov-Smirnova Test of Normality……………….………………….…...89
Table 4. Levene’s Test for Equality of Variances …………………………….…….……89
Table 5. t-test for Equality of Means…………………………………………………..….90
Table 6. Kolmogorov-Smirnova Test of Normality…………………………………….…90
Table 7. Levene’s Test for Equality of Variances ………………………………………. 91
Table 8. t-test for Equality of Means…………………………………………………...…92

9
List of Figures
Figure 1. Boxplot for Leader Practices and Percent Proficient on Reading PARCC...……….…86
Figure 2. Boxplot for Leader Practice and Percent Proficient on Math PARCC……....….….…87
10
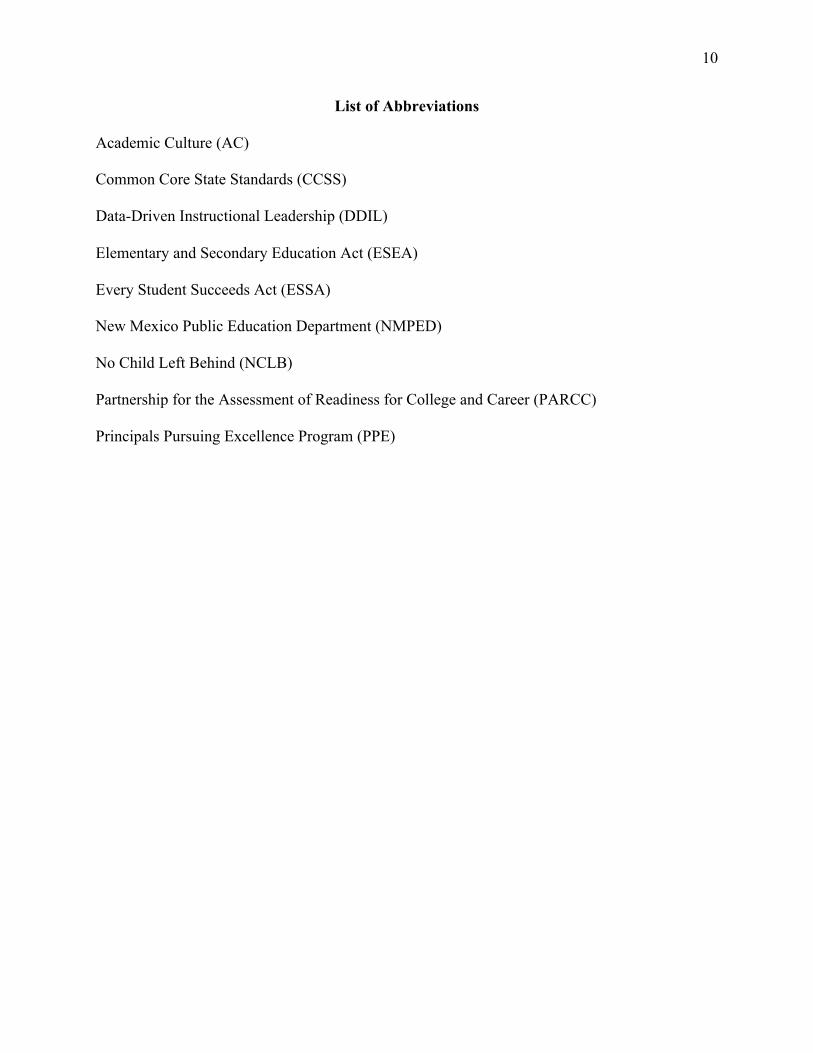
List of Abbreviations
Academic Culture (AC)
Common Core State Standards (CCSS) Data-Driven Instructional Leadership (DDIL) Elementary and Secondary Education Act (ESEA)
Every Student Succeeds Act (ESSA)
New Mexico Public Education Department (NMPED) No Child Left Behind (NCLB) Partnership for the Assessment of Readiness for College and Career (PARCC) Principals Pursuing Excellence Program (PPE)

11
CHAPTER ONE: INTRODUCTION
Overview
Educational leaders have for decades needed a better understanding of the “paths” (Heck,
2014, p. 653) through which leadership has an established indirect role on student outcomes. This has made the interactions and frameworks of leadership become more important to the field of education (Hattie, 2009). Chapter One provides a background of instructional leadership and the role of using data-driven approaches in educational leadership and instruction. These constructs were examined from a social learning framework of leadership and instructional change. This is followed by a problem statement, a purpose statement, the significance of the study, the research questions, and relevant definitions.
Background
The American educational system struggles with the task of providing students a quality
education. Schools are expected to prepare students by passing on the values of democracy and
providing each student with an appropriate and equitable education, which in turn will help to
protect the competitive edge of America and work to eliminate poverty (Christensen, Horn, &
Johnson, 2011). How to accomplish these goals has been the point of much study and debate
both within the field of education itself and within the arena of American culture and politics. In
1983 the National Commission on Education released A Nation at Risk (Ravitch, 2016).
According to Ravitch this report suggested that if American schools strengthened the curriculum,
raised graduation requirements, and increased the amount of time in school, they could raise both
student achievement and the national economy. Ravitch argued that this did not hold true then
nor does it today. Ravitch suggested that the greater threat to American society is inattention to
economic, social, and racial inequality. Hacker and Pierson (2017) hold similar views,

12
purporting that the decline of federal support for education is a major concern. Education is
different than other sectors of government or business. Education possesses the unique
aspiration to produce not a specific predictable product, but rather seeks to develop individuals
“to be thoughtful citizens, competent parents, faithful friends, capable workers, generous
neighbors and lifelong learners” (Munro, 2014, p. 115). Within the context of this responsibility,
educational leaders have a call to foster the best possible outcomes for students and develop the
quality of teachers’ instructional practices in the process of school improvement.
Historical Context
Under the Johnson Administration, Congress passed the Elementary and Secondary
Education Act (ESEA) in 1965 (Gamson, McDermott, & Reed, 2015). This legislation
effectively elevated the federal government’s role in educational matters to a new level. Though
the states maintained the function of educational administration, the federal government
established a vested interest in and financial commitment to the educational institution. The aim
was to provide educational access to those who needed it most and hopefully address the issue of
poverty through better educational access for students (Gamson, McDermott, & Reed, 2015).
Compliance with the Civil Rights Act resulted in the release of the1966 Coleman Report
(Dickinson, 2016). This report suggested that factors beyond the jurisdiction of the educational
system such as family composition, economic status, and race were more responsible for the
academic success of a student than any other single factor (Hanushek, 2016). This report
bolstered the use of research in education as well as the use of data in the evaluation of
educational outcomes and policy concerns. This construct has persisted since that time and is
responsible for linking data to educational policy even today (Hanushek, 2016).

13
Over time, changes in society, culture, and global economic matters have resulted in the
reauthorization of this federal mandate a few times from 1965-2015. However, no significant
changes in educational policy or practice were readily observable in federal policy until the G.
W. Bush administration introduced the No Child Left Behind (NCLB) Legislation, which
Congress passed in 2001. This brought about a new era of accountability to school districts
(Saultz, White, Mceachin, Fusarelli, & Fusarelli, 2017) and has heightened focus on what
happens in schools and classrooms across the nation (Young, Winn, & Reedy, 2017). Public
reporting of standardized high-stakes testing, as well as teacher evaluations based on those test
results were mandated by NCLB and have become the norm for the educational landscape during
most of the last two decades (Steinberg & Donaldson, 2016).
Even so, little attention was given to educational leadership under federal policies, while
public reporting, teacher accountability and evaluations, school progress, and other factors were
scrutinized. However, in 2015 under the Obama administration, the most recent reauthorization
of the Elementary and Secondary Education Act (ESSA) was signed into law. This version of
the law places a greater emphasis on the role of building-level educational leaders and the
influence they have on teacher quality and student outcomes (Young et al., 2017).
Through the years, federal policies have had various political and social goals, but
improved student achievement has been a common thread. Since 2001 the focus on student
achievement has become the priority of these policies (Militello, Jackson, & Wang, 2013).
Beyond the influences outside the control of the school, such as socioeconomic status and
family conditions, the teacher has been widely accepted as the single-most important factor
associated with student achievement (Hitt & Tucker, 2016). A meta-analysis conducted by
Hattie (2009) provided evidence that the most significant influences on student academic

14
outcomes were the actions and behaviors of the teacher. A body of evidence supports the idea
that regarding the improvement of student achievement, one cannot ignore the role of the teacher
and the quality of instruction s/he delivers (Goddard, Goddard, Kim, & Miller, 2015; Goddard,
Hoy, & Hoy, 2000; Hattie, 2009; Santoyo, Peiser, & Lemove, 2012).
Second only to the impact teachers have on student outcomes is the influence of
principals on student learning (Louis, Leithwood, Wahlstrom, Anderson, Michlin, & Mascall,
2010). While these effects have been called indirect by Dumay, Booen, and Van Damme (2013),
they are important to student achievement and teacher effectiveness. By promoting efficacy
(both individual and collective), placing focus on instructional practices, and collaboration,
leaders are able to influence teachers’ improved instructional practices resulting in positive
student outcomes (Goddard et al., 2015).
In order to transform the interactions between teachers and students into positive and
productive educational outcomes, leaders must find ways to leverage data to influence the key
aspects associated with the teaching and learning process (Datnow & Hubbard, 2016). In fact,
the use of data is now an expectation and a practice that is utilized in both reform and
accountability efforts (Levin & Datnow, 2012). As a result of the heightened accountability
efforts from the federal government under No Child Left Behind (NCLB) and the Race to the
Top Program, the use of data for reporting, teacher evaluations, and accountability has grown
exponentially. Ravitch (2016) suggested that the American school system has more data than
any other system in the world, and perhaps more confusion about how to best educate students.
Given these changes in politics, policy, and social expectations, the role of leadership
exists in a fluid and complex domain. This has shifted the focus and work of the educational
leader, as well as the research. Leaders have moved from primarily management tasks to the role

15
of leading for instruction and achievement (Gordon, Taylor-Backor, & Croteau, 2017; Sheng,
Wolff, Kilmer, & Yager, 2017).
Social Context
It is valuable to recognize the social context in which the educational system operates.
This social context is the fabric of American life, which has been influenced by a diverse
compilation of cultures, languages, traditions, and beliefs. Yet, schools are largely designed for middle class students and inequitable for the unique needs of students from families of lower socioeconomic status (Koppelman, 2017). In fact, since the release of the Coleman Report over 50 years ago, the achievement gap between ethnic subgroups has been closed only slightly, while the gap between socioeconomic groups has widened (Hacker & Pierson, 2017).
Holding that “Public education is a foundation stone to democracy,” Ravitch (2016, p.
XLIII) argued that the citizens of our society are responsible for making sure that all children
receive a good education that includes both equity and excellence. Providing a democratic and
common educational experience were ideals arising from former leaders such as Mann and
Dewey. These goals still influence today’s educational system (Gutek, 2011) and are important
for educators to embrace and embody.
Educational professionals are given the task by federal mandates and social contracts to
deliver an equitable education to a mosaic of students under the current pressures of societal
conditions. They are expected to do this through the use of data to demonstrate improvements in
student outcomes. Much of the data that educators utilize are used only for accountability and
evaluation purposes and are not intentionally used as a driver to improve instruction (Shen et al.,
2010). Educators desiring to make improvement in student outcomes need to leverage the use of

16
data along with daily effective practices in order to improve the quality of their instruction
(Slavin, Cheung, Holmes, Madden, & Chamberlain, 2013).
Principals play a key role in facilitating data use among teachers (Datnow & Hubbard,
2016). Principals leveraging the use of data as a leadership approach for improving school
performance has been identified by some researchers as the most promising way to help move
schools forward on a large scale (Sun, Johnson, & Przybylski, 2016). One use of data by
principals is observation and feedback. According to Ing (2013), the intentional use of
observation and feedback with a focus on instructional improvement showed a positive
significant relationship to the instructional climate of a school and assisted in generating positive
student outcomes. Marsh and Farrell (2015) provided support for the idea that while
administrators have observational data, more often than not they lack the acumen to use or
leverage these data to make substantive changes to instructional practices of teachers.
Other studies provided support for the positive outcomes of using data to drive
instructional decisions, which resulted in increased gains in achievement by up to an extra month
on standardized assessments (van Geel et al., 2016). Yet Park and Datnow (2016) claimed that
still little is known from the literature about how educators specifically use data for instructional
decisions.
In relation to instructional leadership, Wang, Bowers, and Fikis (2017) found that over
the past 50 years research on educational leadership seems to have been influenced by shifts in
politics and societal values. This has resulted in a diversity of topics in educational research yet
concerns about teaching and instructional leadership remained in the top five categorical issues
that have been studied. Amid these changes in the social context many support the shift in the
role of leadership to a position that can be leveraged to develop teachers through feedback,

17
reflection, and mentoring (Kraft, Gilmour, & Society for Research on Educational Effectiveness,
2016).
Theoretical Context
Using the theoretical framework based on Bandura’s social cognitive theory (Goddard et
al., 2015), and aspects of Vygotsky’s sociocultural theory (Marsh & Farrell, 2015), this study
examined the influence that data-driven practices of leadership have on teacher performance as
evidenced in school outcomes. The social constructs of how adults learn from interaction, social
environment, and modeling to build and redefine behaviors associated with learning are key
aspects of the framework. These constructs can be seen in efforts by Santoyo, Peiser, and
Lemove (2012) and Glover (2017) and deserve a purposeful examination of their effectiveness in
other contexts. An important construct in this study is the relationship between principals and
teachers. This type of learning in a collaborative environment within the context of the natural
and social world and based on human relationships (Gutek, 201, p. 359) illustrates what Dewey
advocated for and envisioned.
Likewise, the theoretical context of this study assumes that human behavior does not
occur in a vacuum and relational interactions provide individuals or groups to solve problems
collaboratively. Bambrick-Santoyo (2018) summed up the core idea for this construct by stating,
“What really makes education effective is well-leveraged leadership that ensures great teaching
to guarantee great learning” (p. 6). The outcome of this study should be viewed through the lens
of the aforementioned theoretical framework and how interactions and relationships of leaders
and teachers demonstrating data-driven instructional practices in a collaborative manner might
affect improvements in instructional practices leading to positive student outcomes.

18
Problem Statement
Given that principals’ roles in student educational outcomes are second only to the
influence of teachers’ actions and attitudes for student achievement (Louis et al., 2010; Brown,
2015) studying the influence of leaders’ behaviors upon student achievement is important. The
idea that principals’ use of data in leading schools is the most prominent way to help move
schools forward creates the need to understand how these data are used and how it might be
better utilized by leaders (Sun et al., 2016). Exactly what data are used and how the data are
used remains a challenge to educators. An aphorism about this idea is that schools are data rich
and information poor. Administrators face the challenge of leveraging data to improve
instruction and educational outcomes for students. This approach stands in stark contrast to the
construct of using data to evaluate teachers and categorizing students and schools by their
standings on accountability reports.
In a policy report, Gill, Borden, and Hallgren (2014) presented a conceptual framework
for data-driven practices. As one of the three constructs, these authors included the use of data to
inform instructional decisions. Like other findings in the literature, this stops well short of
measuring the effects of a specific model of leadership using data-driven principles that improve
the quality of instruction and instructional outcomes.
Evidence suggests that feedback conversations provide opportunities to utilize
observational data to improve teacher instruction (Mihaly et al., 2018). However, there is little
research that leaders can reference to develop skills that would enhance the ability to provide
teachers with feedback that improves either quality of teacher instruction or student outcomes.
While the literature provides support for the use of data and strong leadership, it falls
short of providing strong empirical evidence to a nexus of these factors with student or school

19
outcomes. It is of value to provide leaders with evidence of leadership practices that use data to
foster positive student or overall school outcomes. The problem is that there is a need to identify
an effective way in which principals can leverage data from observational and assessment
sources to improve teachers’ instructional practices and consequently student educational
outcomes.
Purpose Statement
The purpose of this quantitative, causal-comparative study was to compare the reading
and math achievement scores from the Partnership Assessment for College and Career
Readiness (PARCC) between schools utilizing data-driven practices and schools not using such
practices in the state of New Mexico. The independent variable is instructional leadership
practices utilized by the various schools (data-driven instructional leadership and non-data-
driven leadership). Instructional leadership practices are defined as the “active collaboration of
principal and teacher on curriculum, instruction, and assessment” (Marks & Printy, 2003, p. 371)
wherein “the principal seeks out the ideas, insights, and expertise of teachers… and works with
teachers for school improvement” (Marks & Printy, 2003 p. 371). These practices effectively
link summative and formative assessment results to inform instructional decisions and assist in
the improvement of instruction and student achievement (Halverson et al., 2007). The dependent
variable is the reading and math achievement scores from the Partnership for Assessment of
Readiness for College and Careers Readiness (PARCC). The reading and math achievement
scores, measured by the Partnership for Assessment of Readiness for College and Careers
(PARCC) (reported as a percentage on a continuous scale from 0-100; Green & Salkind, 2017)
and are maintained on the New Mexico Public Education Department’s Accountability page.
Reading and math achievement scores on the PARCC assessment are defined as the school
average proficiency scores for reading and math reported as a percentage of 100. These scores

20
are a standardized measure of students’ reading vocabulary, general ability to read, ability to read
and draw meaning from both informational text and literature, mathematical reasoning ability,
mathematical conceptualization, modeling practice, and general content knowledge of math. In
this study these scores are reported as the average school level percentage proficient for grades
three through eight.
The independent variable of leadership practices consisted of two groups: one group of
39 schools that participated in the New Mexico Public Education Department’s Principals
Pursuing Excellence Program (PPE) and the second group of 42 that did not. The PPE schools
implemented leadership principles and practices focused on data-driven instructional leadership.
The Partnership for Assessment of Readiness for College and Careers (PARCC) is
designed with the intention of determining whether or not students are ready for college and have
the likelihood of earning at least a C on college work. PARCC has five levels of proficiency.
Student scores in the top two levels (proficient and advanced) have been shown to have an 89%
chance of earning a C in college level work (Nichols-Barrer, Place, Dillon, & Gill, 2016). The
PARCC exam is designed to measure the Common Core State Standards with complex reading,
writing, and math tasks (Gewertz, 2015). PARCC is a type of standardized assessment that
yields proficiency scores defined as the level of performance needed to meet or exceed standards
of a given grade level (Doorey & Polikoff, 2016).
According to Martinez (2017), New Mexico schools have a population that includes 48%
of students of Hispanic ethnicity and 10.5% of students of Native American ethnicity.
Additionally, Martinez (2017) stated that for 20 years New Mexico has not met the national
average on standardized measures of basic academic domains. The state serves some 340,000
students in almost 900 schools, spending an average of $9,734 per child. The percentage of

21
students receiving free and reduced lunch is 62.5%, with an English Language Learner rate of
14.4% (Education Week, 2019).
The population of this study encompassed 336 elementary and middle schools in New
Mexico that received a score on their state report card in the range from 0 to 49.9 and assigned a
D or an F for the 2014 and or the 2015 school year(s). The sample for the study consisted of 81
schools drawn from the 336 (50) elementary and (31) middle schools that earned a D or F on
their state report cards in the 2014 or 2015 school years. From this sample, schools that were
participants of the Principals Pursuing Excellence Program formed the treatment groups as a
convivence sample. The control groups were randomly selected from the remaining 297 D and F
schools that did not participate in the program using simple random sampling. Demographic
composition of the schools in the sample consisted of total population of 30,970 including
15,784 male students, 15,107 female students, 5,072 students of Anglo ethnicity, 343 students of
African American ethnicity, 18,929 students of Hispanic ethnicity, 56 students of Asian
ethnicity, and 6,094 students of Native American ethnicity. The sample represents 27,474
students belonging to economically disadvantaged families, 6,167 students identified as English
Language Learners, and 4,521 students with disabilities.
While a body of research exists on data-driven leadership, few studies have examined the
model of data-driven instructional leadership’s effect on standardized scores or school outcomes
(Datnow & Hubbard, 2016; Yoon, 2016). Research has suggested that more research needs to be
completed that provides evidence of success in regard to the relationship that exists between
data-driven instructional leadership practices and student outcomes (Datnow & Hubbard, 2016;
Yoon, 2016).
Significance of the Study
The significance of this study to the field of education was to provide educational

22
leaders with evidence in relation to the approach taken to improve quality instruction and
positive student outcomes. In a related study, Sun et al. (2016) stated that fostering collaborative
data-based practices contributed to positive student outcomes, but the results were largely
descriptive and inconsistent. The researcher examined the effects of leadership behaviors
regarding data-driven practices including observation, coaching, and feedback on school
achievement outcomes. This evidence will help guide educational leaders’ practice, and support
the importance of instructional leadership as it pertains to the quality and improvement of
instruction. Slavin et al. (2013) found that the simple use of data was not enough if leaders failed
to bring about effective change in teacher practices. While instructional change has been shown
to happen (Sleegers, Thoonen, Oort, & Peetsma, 2014), more insight is needed as to the
leadership activities that help to build school capacity for instructional change. Leaders applying
this model can more efficiently and effectively leverage their time and skills to the important
aspects of the teaching and learning process. Ultimately this process, as implemented by leaders,
should improve student achievement and school performance.
This study sought to provide evidence of how leadership can influence student
standardized achievement outcomes and the improvement of instructional practices of teachers.
The aspect of improved quality of instruction is key to all aspects of the educational field
(Bambrick-Santoyo et al., 2012; Hattie 2009). If leaders leverage observational data, feedback,
and student data to focus on teachers’ instructional practices, the teaching and learning
community can reap the benefits through positive changes in instruction, which leads to
improved student achievement (Foster, 2018). In alignment with the Center for Educational
Research’s stated theory of action, this study is intended to support the idea that the quality of
instruction is the most critical aspect of the teaching and learning process. Therefore,

23
empowering leaders to support the development of high-quality instruction adds value to the
field of educational leadership by providing leaders with a direction of focus and a given
leadership framework from which to implement such an approach.
Many educators assume they are providing instruction that best meets students’ needs but
according to Goodwin and Webb (2014), teachers could not effectively identify research-based
educational strategies. Educational research is underutilized (Hattie, 2009) and does little good
for students when it is not leveraged for their good. The relationship between teachers and
students is the critical point of the teaching and learning process (Hattie, 2009). Leaders must
assume the role of being the teacher of teachers if the outcomes for students are truly the end
goal. Otherwise, a principal becomes merely a manager and not an instructional leader (Sheng et
al., 2017).
The goal of this study was to provide supporting evidence as to whether or not engaged
instructional leadership based on data, research-based best practices, and relationships make any
difference in teaching and learning (Marsh, Bertrand, & Huguet, 2015). Such evidence will
provide opportunities for researchers to consider the more specific actions of leaders in this
capacity and how they influence student outcomes.
Research Questions
The research questions for this study are:
RQ1: Is there a difference in the reading scores on the Partnership for College
and Career Readiness Assessment between schools that used data-driven
instructional leadership practices and those schools that did not use data-driven instructional
leadership practices?
RQ2: Is there a difference in the math scores on the Partnership for College
24
and Career Readiness Assessment between schools that used data-driven
instructional leadership practices and those schools that did not use data-driven instructional
leadership practices?
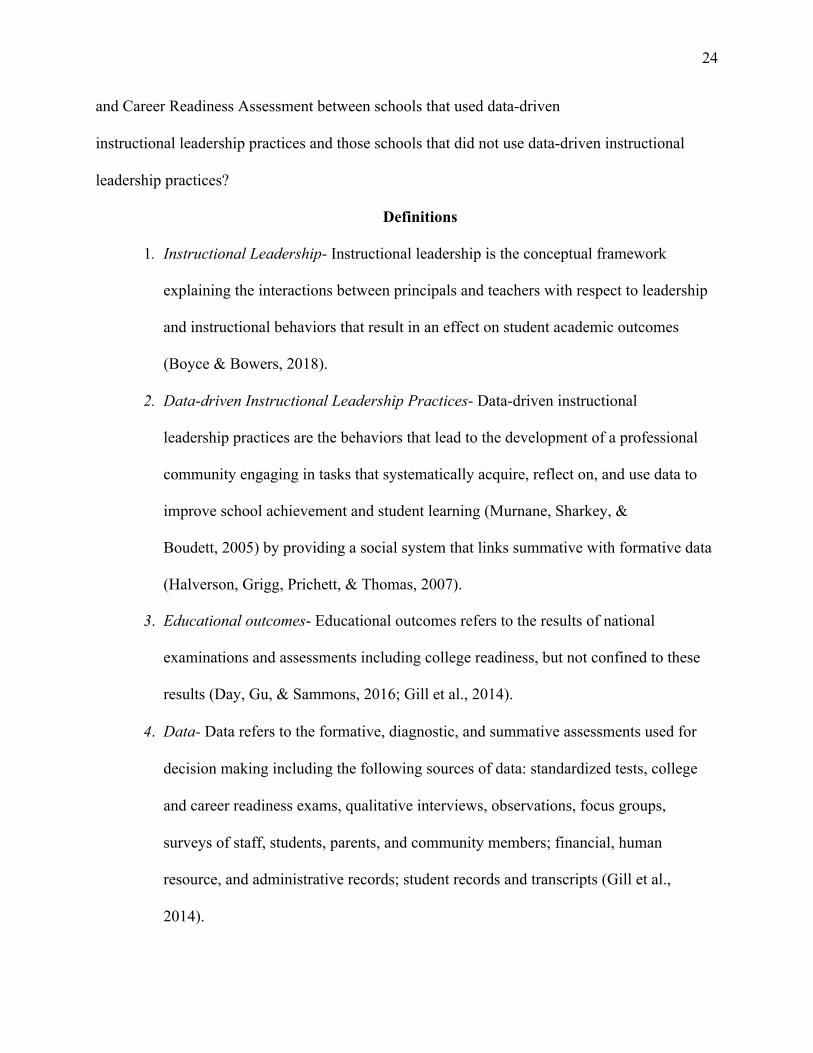
Definitions
1. Instructional Leadership- Instructional leadership is the conceptual framework
explaining the interactions between principals and teachers with respect to leadership and instructional behaviors that result in an effect on student academic outcomes (Boyce & Bowers, 2018).
2. Data-driven Instructional Leadership Practices- Data-driven instructional
leadership practices are the behaviors that lead to the development of a professional
community engaging in tasks that systematically acquire, reflect on, and use data to
improve school achievement and student learning (Murnane, Sharkey, &
Boudett, 2005) by providing a social system that links summative with formative data
(Halverson, Grigg, Prichett, & Thomas, 2007).
3. Educational outcomes- Educational outcomes refers to the results of national examinations and assessments including college readiness, but not confined to these results (Day, Gu, & Sammons, 2016; Gill et al., 2014).
4. Data- Data refers to the formative, diagnostic, and summative assessments used for
decision making including the following sources of data: standardized tests, college
and career readiness exams, qualitative interviews, observations, focus groups,
surveys of staff, students, parents, and community members; financial, human
resource, and administrative records; student records and transcripts (Gill et al.,
2014).
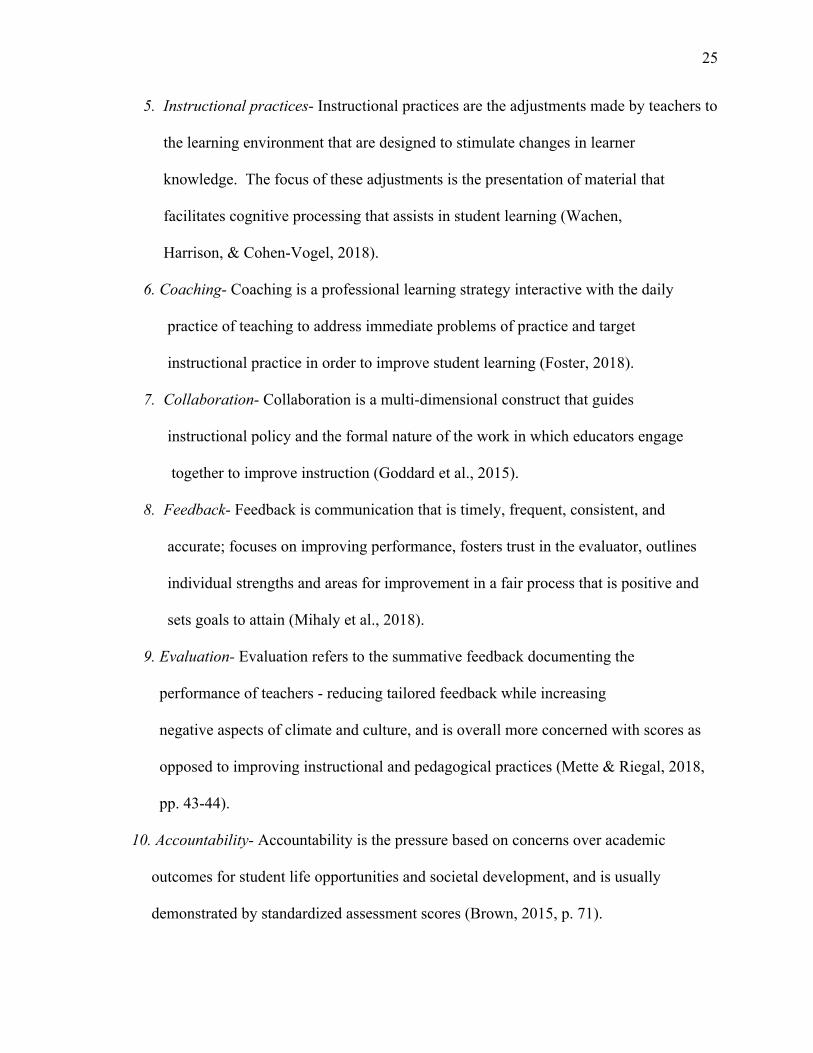
25
5. Instructional practices- Instructional practices are the adjustments made by teachers to the learning environment that are designed to stimulate changes in learner
knowledge. The focus of these adjustments is the presentation of material that facilitates cognitive processing that assists in student learning (Wachen, Harrison, & Cohen-Vogel, 2018).
6. Coaching- Coaching is a professional learning strategy interactive with the daily practice of teaching to address immediate problems of practice and target instructional practice in order to improve student learning (Foster, 2018). 7. Collaboration- Collaboration is a multi-dimensional construct that guides
instructional policy and the formal nature of the work in which educators engage
together to improve instruction (Goddard et al., 2015). 8. Feedback- Feedback is communication that is timely, frequent, consistent, and accurate; focuses on improving performance, fosters trust in the evaluator, outlines individual strengths and areas for improvement in a fair process that is positive and
sets goals to attain (Mihaly et al., 2018). 9. Evaluation- Evaluation refers to the summative feedback documenting the performance of teachers - reducing tailored feedback while increasing negative aspects of climate and culture, and is overall more concerned with scores as opposed to improving instructional and pedagogical practices (Mette & Riegal, 2018, pp. 43-44).
10. Accountability- Accountability is the pressure based on concerns over academic
outcomes for student life opportunities and societal development, and is usually demonstrated by standardized assessment scores (Brown, 2015, p. 71).

26
CHAPTER TWO: LITERATURE REVIEW
Overview
This study examined data-driven leadership practices in the context of social cognitive
theory by comparing achievement results between schools. Chapter Two provides the theoretical
framework in which the study is framed and guided, reviews related literature of leadership,
instruction, data use, professional development, coaching, capacity building, observation and
feedback, and academic improvement.
Theoretical Framework
This causal-comparative study draws from two social theories to form the theoretical
framework from which to view the research question. Bandura’s (1986) social cognitive theory,
also known in the 1960s as social learning theory, was identified by Bandura, a well-known
theorist of social behavior (Nelson, 2016). Vygotsky’s (1978) sociocultural learning theory can
be loosely connected to Bandura’s work but places more focus on human social interactions and
how they influence learning (Schunk, 2016). Together these theories provide a lens to explain
how school culture fostered by principal leadership is likely to be responsible for any differences
found in student achievement results (Leithwood & Sun, 2018). This indirect effect is vital as it
centers on the interactions, influences, and relationships that an educational leader develops and
maintains with teachers and instructional staff. Specific behaviors of leaders that have been
linked to some of the strongest influences on student learning are participation in teacher
learning, planning, and evaluating instruction (Brown, 2015). The actions taken by leaders that
influence these outcomes are those actions that provide opportunities for teachers to reflect,
collaborate, and improve on instructional practice. These human activities take place in a social

27
context. Thus, the aforementioned social theories provide the framework to better understand
these functions.
Social Cognitive Theory
Bandura’s (1986) social cognitive theory has been used in various studies contributing to
the understanding of how people process and learn and as Nelson (2016) reported Bandura is
renowned for “identification learning, human motivation, thought, and action” (p. 9). Bandura’s
ideas include the thought that humans are flexible and adaptable, learn from interactions with
their environment, and have the capacity to change their behavior (Schunk, 2016). Specific to
the current study social cognitive theory supports the idea that leaders not only have the ability to
influence others by social modeling and mentoring but are also able to “self-reflect” (p. 9)
resulting in improved performance actions experienced both in their own leadership efforts as
well as the instructional practice of the teachers they serve. It is important to note that situational
environmental factors can also influence growth and development of individuals, but Bandura
believed most human behavior was a result of “observation and modeling” (Nelson, 2016, p. 10).
The practice of observation, feedback, and skill practice (modeling with role play) is key in the
data-driven instructional leadership practices to be examined by this study.
Bandura’s (1986) social cognitive theory has elements of both enactive and vicarious
cognitive learning, which are described in this section (Schunk, 2016). Social cognitive theory
holds that an individual has interactions with the environment, with various behaviors, and with
personal factors such as efficacy. These interactions help to form the cognitive growth and
learning within individuals (Nelson, 2016; Schunk, 2016). Enactive cognition arises from the
actual experiences in which an individual engages. Vicarious learning results from the
observation of others or the models of behavior that others provide. Vicarious cognitive growth

28
is derived from the observed consequences (and the emotional stimulation they elicit) of the
observed model or behavior. Bandura purported that both enactive and vicarious cognition
interacts with an individual’s environment and have a reciprocal effect on the individual and the
environment (Schunk, 2016).
The psychological framework explaining learning in Bandura’s work can be described as
the bridge between behaviorism and the cognitive model of learning (Connolly, 2017). The
processes associated with the theory are attention, the construction of symbols or representations
of what is observed, the ability to recall and use (referred to by Bandura, [1977] as motor
responses), those representations, and the application of these to guide behaviors or actions.
Critical in this process is motivation or the will to do the things observed (Connolly, 2017). In
his own work Bandura (1977) defined these aspects and suggested that an individual’s level of
response in the imitation of a specific behavior was directly related to the influence which the
observed model (or exemplar) held with the individual. Applied to the current study teachers are
more apt to improve or change instructional practices when they observe their leader taking an
active role in observing instruction, providing feedback, participating in collaborative planning
efforts focused on instructional improvement, and actually modeling the expected instructional
practices during the coaching and collaborative process. This process is both a relational and
social action.
Extending the nexus between social cognitive theory and the current study Wood and
Bandura (1989) purported that “Mastery modeling has been widely used with good results to
develop intellectual, social, and behavioral competencies” (p. 363). Wood and Bandura outlined
the aspects of this construct, which are instrumental to contemporary classroom instruction.
These include an effective modeling of the desired skill(s), opportunities to practice these skills

29
with guidance and feedback of an expert or mentor (role playing, which is a part of the data-
driven model of this study), and independent exercise of the skill by the individual for a mastery
experience (the individual needs to experience success with the new skill for purposes of
efficacy). According to Wood and Bandura the individual developing a new skill will be more
likely to leverage the new skill if the specific modeled behavior(s) align with outcomes the
individual considered as preferred and positive in nature. With this idea in mind the importance
of a given leader’s behavior in carrying out the practices of data-driven instructional leadership is
highlighted. A leader that functions as a supportive coach rather than a compliance officer can
be viewed as both a necessary and productive shift in the implementation of data-driven
instructional leadership. This shift in roles by the leader from that of evaluator to mentor or
coach serves to foster positive changes and improvement in instructional practices (Glickman,
2002).
Mccormick and Martinko (2004) provided support for the relationship social cognitive
theory has with data-driven instructional leadership. Mccormick and Martinko described social
cognitive theory as a “dynamic process…of reciprocal relationships” (p. 2), which has been used
widely to define a number of “human phenomenon” (p. 2) including decision making and job
performance. These aspects are at the heart of changes influenced by data-driven instructional
leadership. Mccormick and Martinko also indicated that social cognitive theory provides
opportunities for self-regulation, motivation, action, and other critical traits which are necessary
for leading changes within the framework of data-driven instructional leadership practices.
Efficacy
Self-efficacy is an important aspect of social cognitive theory. According to Schunk
(2016), self-efficacy was defined by Bandura as “personal beliefs about one’s capabilities to

30
learn or perform actions at designated levels” (p. 142). Bandura’s theory addresses teacher self-
efficacy as well as student self-efficacy, which can be an important link in the learning process
(Schunk). Teacher self-efficacy has been the subject of a broad body of literature and research in
the past, and more recently Goddard et al. (2015) studied the influence “collective efficacy” (p.
510) as reported by teachers had on student achievement. Other fields of study have also shown
that efficacy is important to overall organizational success (Cai, Li & Guan, 2016). Cai, Li, and
Guan found that information sharing by managers improved team efficacy and cooperation.
Further, they stated that “Mutual investment in relationship fosters the highest level of
knowledge sharing” (p. 675). The construct of efficacy as well as the more socially based
concept of collective efficacy forms underlying assumptions of this study.
The assumption is that efficacy, and specifically collective efficacy, is dependent on
professional collaboration, social interactions, and enactive and vicarious learning. Specifically,
how these constructs interact with the instructional leadership of the principal is important to this
proposed study. Principals who foster learning environments that promote collaboration, teacher
buy-in, efficacious ideas, and positive changes in instructional practices among staff members
have established environments conducive for the use of data-driven practices (Leithwood & Sun,
2018). Consequently, when this type of environment has been fostered, improvement in student
outcomes have occurred (Leithwood & Sun, 2018). Glover (2017) relied on social learning
theory to help explain the influences that coaching, modeling, providing practice, and feedback
have on changes in classroom practices that lead to improved student performance (p. 14). In a
study on a related topic Dunn, Airola, Lo, and Garrison (2013) cited teacher efficacy as viewed
through social cognitive theory as critical to teacher growth in both data use and collaboration
for improved practices.

31
An important concept of social cognitive theory is that of human agency (Kim and
Baylor, 2006). Within the understanding of agency, individuals leverage behaviors or actions to
bring about desired outcomes (p. 578). Three aspects of this idea provide a framework for
growth and development especially as it relates to the proposed study. Kim and Baylor
suggested that personal agency (what is controlled by the individual learner), proxy agency
(social modeling), and collective agency (collaboration; pp. 579-581) work together as social
cognitive theory to facilitate growth and development of individuals and groups. Th
Underlying assumptions of the proposed study also include ideas from the social
cognitive theory that self-efficacy is able to mediate fears of failure while supporting one’s
ability to strive to reach goals established from set challenges (Sleegers et al., 2014). Of more
significance to the current study, these authors supported the idea that social cognitive theory
provided for the development of individual learners as they responded to a life experienced
collectively (pointing to collective efficacy).
Sociocultural Learning Theory
Considered by some as one of the oldest and most powerful social theories (Gillani,
2000) Vygotsky’s socially based learning and development ideas help to shape the current study.
These ideals provide a framework for the principles of data-driven leadership practices to take
root by fostering cultures of “communication styles, personalities, cognitive abilities… out of
cultural interactions” (p. 186). Additionally, Lantolf, Thorne, and Poehner (2015) paraphrased
Vygotsky, stating that individuals are not separated from the social world but are rather social
beings that leverage social relationships as basis for the qualities responsible for higher order
cognitive activity.

32
Vygotsky (1978) is credited with the idea of sociocultural learning theory (Marsh &
Farrell, 2015). This theory assumes that learning is a social event and happens in a social
context. Individuals build learning capacity through communities of learning where they
establish collaborative relationships with others and can become part of a culture of learning over
time (Marsh & Farrell, 2015, p. 274).
Marsh and Farrell (2015) utilized this theory to study the mutually beneficial relationship
this idea of social culture supports. The development of teachers’ ability to use data is an aspect
of this construct. This idea has also been studied at the university level, demonstrating that
change in the course of professional practice involved aspects that were based in social contexts
(Dancy, Henderson, & Turpen, (2016). The interaction with data as part of “the inter-active web
of actors, artifacts, and the situation is the appropriate unit of analysis for studying practice”
(Spillane, Halverson, & Diamond, 2001, p. 23). Spillane et al. (2001) provided examples of this
kind of interaction comparing it to a pilot landing a plane and to students using a calculator for
computation. The “complex multifaceted” (Spillane et al., 2015, p. 150) interactions and
composition of instruction is important for educational leaders to keep in mind as they provide
guidance and mentorship in the daily work of leading instruction in the relational context of the
profession (Spillane, 2015, p. 26).
Other research supports the idea that teachers as learners within an interactive
environment have an influence on instructional practices (Sleegers et al. 2014). Specifically,
Sleegers et al. (2014) suggested that efficacy influenced teachers to become interested and
participate in learning, which increased their willingness to pursue organizational or school
goals. These goals included namely, professional development activities, which in turn
influenced the quality of their instruction. This willingness to adjust behaviors has a relationship

33
to data-driven instructional leadership based in sociocultural learning. The influences on teacher
efficacy, quality, and positive instructional changes resulting in improved student outcomes are
seen as a result of the sociocultural learning lens that guides this study.
Sociocultural theory’s application to this study was supported by Shabani (2016).
Shabani discussed four aspects of Vygotsky’s work that are suggested to be relevant to the
professional development and growth of teachers. Sociocultural theory parallels Bandura’s
social cognitive theory in the stated four aspects of human development: (a) mediation and tools
adopted by society (sociocultural), (b) the integration of mediational tools into an individual’s
development (ontogenetic), (c) the evolutional development of human’s mental capacity across
time (phylogenetic), and (d) The moment-to-moment development of language and associated
learning during activity (microgenetic). These four aspects of human development were linked
to types of professional development. Some of these directly relate to the current study. For
example, mentoring, observation and feedback, and actionable research (i.e., data-driven
decision making). Vygotsky’s ideas provide useful insight in questions of “educational
development and transformation” (Marginson & Dang, 2017, p. 127) based in social context.
Zone of Proximal Development
A central concept in Vygotsky’s theory is the zone of proximal development (ZPD),
which is defined as the “difference between a learner’s actual development and his or her
potential development assisted by others” (Kim & Baylor 2006, p. 577). The ZPD is the area
where individuals can grow past their present level of learning. Nelson (2016) suggested that an
individual can advance step-by-step to higher skill levels when working with a mentor under
Vygotsky’s theory. According to Nelson this can be accomplished through “observation,
modeling, training, and mentoring (p. 11). Furthermore, Nelson suggested that the mentoring

34
relationship has mutual benefits for both the mentor and the mentee. This mentoring relationship
is reflective of a data-driven leader providing guidance to instructional staff. Another nexus to
data-driven instructional leadership can be seen in how Gillani (2000) demonstrated the social
learning theory. Gillani described the progression of the learner from actual level of
development to potential levels as fostered by the zone of proximal development. Learners in
the ZPD progress from a reliance on others to being able to contribute to collaborative efforts.
This results in self-reliance and finally moves to internalization of the new information or skill
by the individual. This describes the process a data-driven leader would use within a mentoring
relationship with a teacher in order to foster growth and development in that teacher’s
instructional skills. The methods outlined by Bambrick-Santoyo (2016) provide a foundation for
this type of data-driven coaching and mentorship model. In Leverage Leadership Bambrick-
Santoyo (2018) summed up the core idea for the concept of data-driven practices. He stated,
“What really makes education effective is well-leveraged leadership that ensures great teaching
to guarantee great learning” (p. 6). By combining the idea of the ZPD with data-driven practices,
leaders can foster growth and development among teachers to improve instructional quality. In
turn, better quality instruction can provide the desired results of improved student outcomes.
Theory Applied to Practice
Social cognitive theory and sociocultural theory provide the framework of the current
study by demonstrating how humans interact, learn, and change based on motivation gained from
the social environment and relational context in which they exist. The social interactions
between principals and teachers, which lead to changes in both teacher instruction and improved
student outcomes (as evidenced through the influence of data-driven instructional leadership

35
practices) will be viewed through the lens of social cognitive theory and sociocultural learning
theory in this study.
Providing further theoretical applications for this study, Mireles-Rios and Becchio (2018)
provided an examination of Bandura’s theory as it relates to the proposed study. Mireles-Rios
and Becchio claimed that four sources help to shape teacher performance through enhanced
efficacy: (a) mastery experiences (actual experiences of success by an individual or group), (b)
verbal persuasion (encouragement from supervisors and others), (c) emotional arousal
(physiological responses to behaviors and or their consequences), and (d) vicarious experiences
(modeling observed from others). Taken together, these sources help frame the idea of the social
interactions (including feedback) that teachers and principals experience in the framework of the
data-driven instructional leadership practices. The experience with coaching, role playing,
planning, and collaborative discourse are especially applicable when this model is focused on
teacher growth and development.
According to Kim and Baylor (2009) the process of teaching and learning is a “highly
social activity” (p. 576). Social interactions are critical in the process of growth and
development (Kim & Baylor). Borrowing from the ideas of Kim and Baylor, the melded
theoretical framework of social cognitive theory and social cultural learning views the processes
of data-driven instructional leadership practices as having three prongs. The first is to “provoke
cognitive conflict” (p. 578) in order to challenge the status quo and stimulate changes for
instructional outcomes. Secondly, leadership should “provide information to advance a learner’s
knowledge” (p. 578) and “scaffolding to extend a learner’s cognitive range” (p. 578). These
aspects should ideally be focused on the teacher’s zone of proximal development. Lastly, the
leader should demonstrate empathy-based relationships with those being mentored.

36
Theory Advancement
This study advances the constructs of social cognitive theory and sociocultural learning
theory by providing evidence that data-driven instructional leadership is influenced by the
theories when applied to leadership practice. The interactions between leaders and teachers that
foster human growth and development through enactive cognitive challenge, collaborative work
including observation, modeling, and other vicarious experiences, and empathetic relationships
of a social nature extend the application of these well-established social theories. The data-
driven practices of observation, feedback, modeling, coaching, and the resulting changes in
instructional practices influencing student learning are examples of changes in human behavior
supported by these theories. Mastery experiences, self-efficacy, and collective efficacy work to
support teacher confidence, which in turn has an influence on instructional quality and ultimately
student achievement. Further, these theories gain evidence supporting how they help explain the
complex multidimensional nature of educational leadership, collaboration, and practice as a
human phenomenon. This could effectively extend the theory’s influence and reciprocal nature
in view of educational leaders’ ability to act as socially based change agents leveraging teachers’
ZPD to attain new levels of quality instructional practices and use of instructional strategies that
are proven to yield the greatest return on instructional investment. These factors are set in the
highly social context of community, institutional, and societal cultures (Hallinger, 2010).
Related Literature
The focus on educational improvement and leadership has been debated thoughtfully for
some time, especially since the adoption of the No Child Left Behind (NCLB) legislation in
2001. More recently the push toward Common Core State Standards (CCSS) has fueled political
discussions, debate, and divisions over issues of increased levels of accountability (Ravitch,

37
2016; Young et al., 2016). More recently, as one of the last actions of the Obama administration,
the authorization of Every Student Succeeds Act (ESSA) was signed into law in December of
2015. This newest edition of educational reform legislation created an “ideological shift”
(Horsford et al., 2017, p. 618). in the role of governmental participation in public education at
the national level
This policy action returned the weight of authority in educational matters to the states,
producing challenges for educators who are seeking what is best for students. This leads
professionals to ask, along with Horsford et al. (2017) “what ESSA might mean for educational
leaders at the local school and district levels, be they teacher-leaders, principals, superintendents,
school board members, or…” (p. 618). Some (Saultz et al., 2017) have suggested that the
flexibility under the Every Student Succeeds Act (ESSA) could be problematic in relation to how
leaders develop and distribute quality teachers, especially in underserved populations.
Noticeable in the Every Student Succeeds Act (ESSA) is the emphasis on leadership and
leadership development (Young et al., 2017). This federal policy action comes after 35 years of
research on educational leadership and suggests a shift in understanding the importance that
leadership holds (Young et al., 2017).
The improvement of instruction through practices of data-driven instruction and
leadership is of special interest under the current high stakes testing model of assessment and
accountability (Brown, 2015). How teachers use data is an important factor for attaining desired
results on standardized achievement measures (Militello et al. 2013; van Geel, Keuning,
Visscher, & Fox 2016; Schifter, Natarajan, Ketehut, & Kirchgessner, 2014). Leaders need to be
prepared to guide teachers to improve instruction and address both individual and collective
academic needs through the effective use of data (Sun et al., 2016; Yoon; Sun, 2016). A narrow

38
definition of data use has emerged through the political debates over accountability and
evaluation versus improvement and growth models associated with school change (Faria et al.
2014). A model of data-driven instructional leadership that is comprehensive in nature and can
serve as an effective model that is worthy of replication is needed to adequately address this
narrow understanding. One such model is the focus of this proposed study. Within the model a
shift is suggested regarding the focus of data use from that of evaluation and accountability
purposes to that of improvement in the quality of instruction and teacher growth leading to
improved school outcomes (Kraft & Gilmour, 2016).
This study sought to fill a gap in the literature by measuring the outcomes of such a
model against others not utilizing the model. The literature speaks with a certain volume about
educational leadership in various forms such as instructional leadership, transformational
leadership, and other less mentioned leadership practices, as well as leadership’s relationship to
student achievement. However, few studies emerged in the literature specifically examining the
nexus of data-driven instructional leadership and improved student achievement (Sun et al.,
2016).
While there has been a great deal of research and policy change dealing with data-driven
practices in education, little progress has been made at the classroom level (Dunn, Airola, Lo, &
Garrison, 2013). Levin and Datnow (2012) pointed out that many previous studies have not fully
examined exactly how the actions taken by principals demonstrate the role educational leaders
assume when working to influence other important factors pertaining to the use of data. Slavin
et al. (2013) stated, “While data-driven practices are known to have an influence on achievement
little has been done to move this concept forward at the school level in a way that impacts

39
achievement” (p. 374). The evidence to support the effectiveness of using models that leverage
the use of data-driven efforts is minimal.
Instructional leaders’ role as agents to improve instruction requires that improvements be
made in the quality of press provided by principals and other leaders that are assigned the
responsibility to carry out this difficult task (Rigby et al., 2017). Rigby et al. pointed out that a
possible problem with this routine was the lack of professional development provided to leaders
by school districts, and that perhaps this is only viewed by districts as a means of compliance
checking rather than as a pathway to improvement.
As a field of professional practice, education has a great deal of data with which to work. However, it is evident that much of these student data “are used more for accountability
purposes—for assessing of rather than for the learning” (Shen et al., 2010, p. 450). The growing
volume of data coupled with the intense focus on evaluation rather than on improving instruction
and student outcomes reveal the concerning issues educational leaders and the field itself face
with this (Shen et al., 2010, p. 450).
Considering the importance of data-driven instructional practices, leaders cannot ignore
the construct of coaching. While Glover (2017) seems to have approached data-driven
instructional coaching as not specifically originating from the principal, what the author said
could have merit as a tool for principals. Analyzing a coaching model through the lens of
reading interventions, Glover stated, “The data-driven instructional coaching model
focuses… on the quality of instructional delivery and the application of a toolkit of research-
based practices with student groups” (p. 15). From a change theory approach this researcher
found the use of data-driven instructional coaching to be a positive method to improve both
teacher practice and student results. Unfortunately, the role assumed by principal as the

40
instructional coach and within the construct of data-driven instructional coaching has not been
well addressed.
Data Use by Educators
Hacker and Pierson (2017) highlighted both the importance and abundance of data in
today’s world. These authors pointed out that American and global economies demand the
collection of volumes of data. The importance of education to the American economy is a
social investment from which the government desires to reap both economic and civic rewards
(pp. 64-65). The surplus of data is evident in schools as well. This brings educators to question
which data are most important. Due to the time constraints educators face, data mining can be
seen as a consuming activity; therefore, educational leaders and teachers must focus on the
specific and correct data to leverage for student outcomes and instructional improvement.
Hoover and Abrams (2013) spoke to this dilemma by suggesting that teachers view district and
state assessments as aspects of instruction rather than separate from the instructional structure of
their classrooms (p. 230).
Teachers tend to view data from central tendencies rather than by disaggregating by
subgroups or content, which denies them the full benefit of item analysis to understand students’
levels of conceptual understanding (Hoover & Abrams, 2013, p. 229). To overwhelm teachers
with too much data could result in the right data being overlooked within the scope of teachers’
practice. This is a threat to the improvement of quality instruction and positive student
outcomes. In light of all the data educators must sift through, it is important that leaders focus
on supporting “teachers being more savvy consumers of assessment data” (Hoover & Abrams,
2013, p. 229).
Leaders must develop these skills and their application to everyday practice in order to

41
best support teachers. Marsh and Farrell (2015) indicated that although much data is available to
teachers and administrators, these professionals often fail to “know how to use data in a way that
leads to deep changes in instruction and improved student outcomes” (p. 270). Additionally,
educators possibly “lack adequate skills and knowledge to formulate questions, select indicators,
and identify solutions” (p. 270).
Yoon (2016) found that the use of data-driven practices by principals did not significantly
change over three years; however, significant variations were found among schools’ usage of
data. Yoon stated that more experienced principals were less likely to apply data-driven
practices, while instructionally focused principals and principals with less experience were more
likely to use data-driven practices. This idea is supported by Hvidston, Range, McKim, and
Mette (2015). Yoon (2016) also noted that teacher buy-in increased over the three years of the
study, especially if the principal used data-driven practices, further stating that there was a
need to understand which specific aspects of both teachers’ and principals’ practices led to
positive student outcomes based on data or educational reform practices.
Complicating this great need is teachers’ understanding of research-based instructional
strategies. Goodwin and Webb (2014) found that only 16% of teachers could actually name a
research-based instructional strategy. Inclusive in a principal’s leadership role is the provision of
a bridge to connect teachers to data, both in a formative informational fashion to enable teachers
the ability to adjust instruction, and to provide a researched-based framework for the delivery of
instruction through research-based instructional strategies (Marsh & Farrell, 2014).
Unfortunately, as Yoon (2016) pointed out, even when principals had adequate knowledge of
data to support teachers, they did not always share what they knew. Perhaps this was a result of
poor efficacy of the leader’s skill set around data-driven leadership practices.

42
Providing formative assessment has shown to be linked to the use of data to drive
instruction with an effect size of 0.90 (Hattie, 2009). The use of data was also found to have an
effect size of 0.67 in relation to the effects of leadership on student achievement (Leithwood &
Azah, 2017).
Leaders must recognize the importance of leading teachers in the use of data to improve
practice. Some research has supported the idea that how teachers frame data and the use thereof
was important to the effect the data had on student learning, and teachers’ competency in using
data is becoming an essential skill to effectual instructional practice (Wardrip & Herman, 2018).
The concept of building trust between a principal and the teacher surfaces in the literature
as an essential prerequisite factor for teacher buy-in with new instructional practices including
data-driven components (Allen, Grigsby & Peters, 2015; Yoon, 2016). Allen, Grigsby, and
Peters (2015) pointed out the critical influence leaders have had when providing feedback with
the goal of improvement and overall success of the school community. More specifically,
Datnow and Hubbard (2016) indicated that in addition to actions taken by principals their
“espoused beliefs about data use are critical as well” (p. 123). Datnow and Hubbard also
discussed the significance of the collaborative context in which teachers’ data capacity was
normally developed. A large body of research points to the lack of adequate teacher preparation
to use data effectively. Specifically, teachers’ capacity is lacking in reference to adjusting
instruction to meet the needs of a variety of students (Datnow & Hubbard, 2016, p. 123).
Multiple issues emerge when considering teachers’ use of data. Some of these issues
include: (a) barriers, both organizational and personal, (b) political usage of data, (c) trust of
administration, (c) professional development, (d) mentoring, and (e) system design (Datnow &
Hubbard, 2016; Ingram, Louis, Seashore & Schroeder, 2004; Marsh &

43
Farrell, 2014;). A study by Faria, Greenberg, Meakin, Bichay, Heppen, and Society for Research
on Educational Effectiveness (2014) found that barriers such as those aforementioned were
associated with lower test scores, while teacher data use was associated with higher achievement
results.
Principals have the opportunity to provide teachers with the tools necessary to overcome
some of these barriers. An example of this was explored by Jimerson, Choate, and Dietz (2015)
in a study that promoted the use of mentors to build capacity. The mentor role was filled either
by the principal or some other member of the administrative team including teacher leaders.
Leaders’ influences are connected to their ability to build trust among teachers and
students. One specific way this has manifested itself is through what Leithwood and Sun (2018)
called academic culture (AC). This culture is fostered through instructional time use, rigor and
expectations (in academic domains), and relationships with students (specifically how the culture
of discipline is managed). Fostering this environment is a complex task with multiple variables.
The development of this type of environment is important for leaders to consider as they work to
improve schools. Trust among and between staff and leadership, a strong focus on instruction,
and the provision of a safe environment have shown to improve efficacy and commitment to the
organization (Leithwood & Sun, 2018 p. 359).
The function of capacity building is a critical element in the successful implementation of
a data-driven approach to instructional improvement (Datnow & Hubbard, 2016). Datnow and
Hubbard suggested that future research should focus on programs that have been successful in
implementing a capacity building approach. They encouraged this type of study, suggesting that
the results could provide instructive information for the impact of such a program on both
practice and policy reform related to the domain of data-driven leadership.

44
A central function of leadership is to enable others to act. This is accomplished through
building trust, fostering collaboration, and developing competence in others (Kouzes & Posner,
2012, p. 29). In order to accomplish this task of developing competence, educational leaders
must determine how to best engage teachers to foster the type of environment that will support
professional growth and changed practices.
Furthermore, how teachers view an administrator’s ability to facilitate conversations around capacity (fostering self-reflection) in regard to their instructional practices is an aspect considered to be key to their perceptions about leadership effectiveness (Mette, Range, Anderson, Hvidston, & Nieuwenhuizen, 2015). Whether school leaders should use data to evaluate teachers or to develop teachers can be
a troublesome issue that causes some disagreement. Pham and Heinemann (2014) raised
concerns over what the purpose of teacher evaluations should be. Possible considerations were
(a) Is the primary purpose of observation and data collection to make judgmental comparisons of
teachers? (b) Is data collection mainly to inform the public about school and student measured
progress? and, (c) Are data to be used to measure individual teacher growth and improve
practice? The authors noted that systems that leverage data for the purposes of evaluating
teachers for competence and systems that are designed to foster growth in teachers are simply
not the same (p. 41).
While the debate over whether to use observational data to evaluate teachers or to
develop teachers continues, it is important that educational leaders leverage the device of
observation to glean the best outcome for students. Kraft et al. (2016) described this debate as
support and grow or the “observe and write” (p. A-3) system for teacher evaluation. Further,
their research indicated that 75% of principal participants favored the “support and grow”

45
method. Nonetheless, administrators must comply with state and district mandates during the
process.
Academic Improvement
A body of research exists examining data-driven instructional leadership for using data in
compliance, accountability, and evaluation practices (Marsh & Farrell, 2015; Marsh, Bertrand, &
Huguet 2015; Gill, Borden, & Hallgren, 2014, Sun et al., 2016). However, the development of
quality instruction that fosters school improvement requires administrators to move beyond these
aspects (Brown, 2015). Dunn et al. (2013) stated that since data-driven practices have a strong
influence for student outcomes, it is important that teachers get help in using data-driven
practices. Leaders desiring to influence teaching and learning will need to provide avenues of
data use that is directly related to instructional focus and improvement at the classroom level.
Sun et al. (2016) have tested a framework of data-driven practices for leaders that can be
applied at all levels of k-12 educational settings. These authors leave to question which of the
factors associated with the framework will be effective in specific environments. Sun et al. also
implied that principals’ use of data to directly inform instructional practices was still in the
infancy stage, and that research is still needed to determine which aspects are more effective in
various geographical areas. Factors Sun et al. have outlined within this framework are factors
identified elsewhere in the literature, including (a) collaborative culture, (b) collective teacher
efficacy and teacher trust, and (c) data-informed teaching.
Bambrick-Santoyo (2018) revisited and reintroduced the seven super-levers from his
work in 2012. The first and perhaps most important of these levers is data-driven instruction.
Bambrick-Santoyo holds that the principal is key to the success of school improvement. He
stated that a growing body of evidence around effective schools debunked two myths about

46
effective leadership (p. 6). The first one is that principals are administrators and managers (like
firefighters). Conversely, Bambrick-Sanyoto purported that successful effective leaders consider
themselves instructional leaders and focus their attention on the teaching and learning process.
Secondly, principals approach the evaluation process with teachers as sufficient, when in reality
effective leaders know that “Every minute spent completing a teacher evaluation rubric is a
moment not used working with a teacher to improve” (p. 6).
Granted, the evaluation process can be an important tool for the improvement of teacher
quality; however, there is some a level of disagreement on this topic. According to a study
conducted by Mihaly et al. (2018), feedback assisted teachers in improving instructional
practices for improved student outcomes. Mihaly et al. held that a “critical stage in the
evaluation cycle is the feedback conversation…after each of two or three annual formal
classroom observations” (p. 1). These “feedback conversations have the potential to influence
teaching practice by evaluating a teacher’s instructional practices at multiple points each year, in
place of the once-a-year” (p. 1) style of evaluation. No doubt this model is superior to a once-a-
year model as the authors indicated; however, more time is needed working with teachers from a
coaching stance if true improvement is to be made in teacher quality. It should be noted that
little evidence is available to guide school level leaders in the process of providing feedback to
instructional staff in a way that leads to positive student outcomes (Mihaly et al., 2018). Shen et
al. (2010) supported the identified need for principals to have support in leading with data,
stating that principals are on the “front line” (p. 450) to bring about change and influence
improved learning.

47
Garet et al. (2017) reported findings that supported the idea that feedback improves
instructional practices and is related to improved student achievement; however, the link
between instructional leadership and improved student achievement could not be supported.
Conversely, Mitchell, Kenseler, and Tschannen (2015) suggested that a direct
relationship exists between instructional leadership and student outcomes. While others have
supported indirect but strong influences of instructional leadership on school outcomes, placing
the construct at the forefront of attention for various stakeholders (Mitchell et al., 2015).
Salisbury, Goff, and Blitz (2019) claimed that strong relationships were found between student
outcomes and instructional leadership. These findings are not appropriate to be generalized and
the researcher calls for extending this line of empirical research into other contexts of the
domain. This finding is contrary to other findings of only indirect effects of principals on
student achievement (Brown, 2016).
This study sought to add to this body of work, making connections to leadership,
specifically, data-driven instructional leadership and achievement results. Like Mitchell (2015),
the current study examined school level results between schools rather than individual student
results. However, this study expanded into a very different context than the Mitchell (2015)
study by analyzing scores from a larger sample and cross section of a state using rural, urban,
and suburban school settings with a diverse demographic composition.
The decision of an educational leader about where and when to spend their time has
significant implications on the level of instructional improvement they want to see among
teachers (May & Supovitz, 2011, p. 350). These researchers also suggested that targeted efforts
by principals can bring about significant improvements or changes in some teachers’
instructional quality. Three levels of principal and teacher interactions were found: (a) 10% of

48
the participants had no interactions or contact with principals, (b) 68% reported some contact,
and (c) 22% had reports of high amounts of contact.
The Role of Leadership Educational leadership practices have evolved within the context of the dominant
political culture and demands of each era in which the development emerged. In the 1960s and
1970s educational leadership practices were focused on the management and execution of
governmental dictates. In essence, leadership practices served as compliance controls to ensure
policies were followed. The progression of leadership practices into the 1980s fostered the
emergence of instructional leadership (Bush & Glover, 2014), which grew out of the out the
effective schools research (Kovacevic & Hallinger, 2019) developing an idea that viewed the
principal as the sole source of expertise and knowledge on instruction. In the 1990s educational
leadership practices centered on transformational leadership. This required the principal to foster
ownership of the implementation of both external and internal initiatives through collaborative
work between school stakeholders (Bush & Glover, 2014). This collaborative work has opened
the door to the model of distributive leadership, which draws on “expertise” (Marks & Printy,
200, p. 371) where it is found (among teachers) and not solely in the principal’s knowledge base.
In the last three decades world-wide attention from governments has placed an emphasis
on the professional development of school leaders with special attention toward instruction,
which had the goal of raising levels of increased achievement and instruction (Hallinger, 2003).
Since 2000, leadership practices examined in the literature have emerged from concepts that
draw from critical aspects of instructional leadership and transformational leadership in order to
facilitate school improvement (Kovacevic & Hallinger, 2019).
49
Whether leaders gather observational data for evaluation purposes or for coaching
teachers to improve, time constraints arise as an overarching issue for leaders to manage (Mihaly
et al., 2018). According to Munro (2014), principals seem to be able to generally identify
excellent teaching as well as poor teaching practices in their observations of teachers; however,
the large number of teachers in the middle are more difficult to appropriately critique. This
suggested inability of educational leaders to pinpoint the quality instruction of the average
teacher is a concern that can be addressed through a coaching and mentoring model of support.
When using a coaching and mentoring model, teachers get the opportunity to develop their
professional practice around research-based practices and data-driven decisions (Foster, 2018;
Johnson, 2016; Sharplin, Stahl, & Kehrwald, 2016). This approach is in contrast to the single-
time evaluation process that is focused on accountability (Kraft & Gilmour, 2016).
These issues present the need for making sure principals are prepared to provide adequate
guidance to teachers in regard to data-driven practices. In a related study, Miller et al. (2016)
stated that leadership programs might be inadequate in preparing educational leaders for
instructional leadership. Miller et al. suggested that other external programs that provide
professional development might be helpful in equipping leaders with appropriate skills in
instructional leadership. Miller et al. found that principals who participated in a long-term
professional development program for instructional leadership demonstrated growth in their
knowledge and beliefs about abilities in instructional leadership; however, they did not
experience growth in actually working with teachers to improve instruction. While the
professional development of educational leaders is critical, it is important that this professional
development result in “substantively significant growth in the practices that” involve “them

50
directly in teachers’ work around curriculum, instruction, and assessment” (Miller et al., 2016, p.
559).
An important factor for district and school leaders to consider is the influence of
instructional coaches and professional learning communities (Marsh et al., 2015). A principal’s
role and interactions within these constructs can be vital to the success of a data-driven initiative;
however, the principal’s interaction with and involvement in the development of teachers must
remain the focal point. Within that context Marsh et al. found that the relationships, dialogue,
and interactions across instructional contexts may have been responsible for “deeper level
changes in pedagogy” (p. 30) as they related to the use and understanding of data.
The overall value of a model that fosters school improvement through developing the
quality of teacher instruction can be supported by how teachers perceive the outcome of principal
feedback and whether or not it has merit, is actionable, and worthy of teacher attention. To this
end, Range, Young, and Hvidston (2013) found that both new and tenured teachers considered
constructive feedback from principals to be important. The researchers also found that critical
aspects of what teachers valued and utilized as points of reflection on their practice included (a)
trusting relationships, (b) constructive feedback, (c) reflection, and (d) areas of improvement.
Range et al. (2013) suggested these findings supported the need for further research on formative
supervision.
The critical aspects teachers felt were important as identified by Range et al. (2013)
support the idea that instructional leaders hold influence over instruction. The task of
instructional leaders is how to best implement leadership practices in order to have the best
influence on student outcomes. Since many researchers agree that this influence is more indirect
as opposed to direct (Dutta & Sahney, 2016; Heck & Hallenger, 2014), the interactions and

51
frameworks of leadership have become more important. Promoting the school culture has been
identified as one such construct. Specifically, the focus on academic achievement within a
positive school climate fostered by the principal is likely to be responsible for differences found
in student achievement results (Leithwood & Sun, 2018). This indirect effect is vital, as it
centers on the interactions, influences, and relationships that an educational leader develops and
maintains with teachers and instructional staff. Together, these aspects supported effective
teaching when the instructional leader had the capacity to enhance both teacher quality of
effectiveness and consistency across teachers and grades (Heck & Hallenger, 2014). The quality
of instruction cannot be overstated as a critical factor in student outcomes. A series of
ineffective teachers can magnify negative outcomes for student learning, thus helps to drive
leadership efforts to improve instructional quality (Heck & Hallinger, 2014). This strengthens
the argument that consistent quality in teacher instruction is a factor of importance and can be
fostered by strong leadership. The central efforts associated with teaching and learning have
been suggested by Bush and Glover (2014) as the places where educational leaders can make a
real difference in student outcomes. Likewise, behaviors associated with instructional leadership
models have been shown to demonstrate greater effects than other theoretical approaches to
educational leadership (Bush & Glover, 2014).
Heck and Hallinger (2014) examined the idea of leading for learning as conceptual for
this kind of instructional leadership. In reviewing 109 studies through meta-analysis, Boyce and
Bowers (2018) support the idea of leadership for learning and pointed out the themes that
emerged from 25 years of quantitative research on instructional leadership. These themes in the
research have focused mostly on principal leadership and influence. They have also included
studies dealing with school climate. The review by Boyce and Bowers provided support that

52
principals’ influences on school climate and other aspects of general academic culture are
important. It is worth noting that in this meta-analysis the issue of linking student achievement
to instructional leadership was not addressed, thus demonstrating a gap in the literature in
explaining the relationship between instructional leadership and student achievement. While this
does strengthen the nexus between the relationship or influence of the instructional leader and
the teacher, more evidence is needed to understand what degree of effect instructional leadership
has on student outcomes. Whether the influence instructional leadership has on student
achievement is indirect as some have suggested or has a more direct relationship on student
achievement, the evidence supporting this construct is important to the educational field.
Principals and teachers working together using data-driven practices to improve
instruction is an important element of leadership. Observation and feedback are among the data-
driven practices supported in the literature. The results of a study by Moore, Kuofie, Hakim, and
Branch, (2016) suggested that leader observation and specific feedback were “not determining
factors in achieving high levels of student academic achievement” (p. 13). This is a striking
difference in information when compared to the majority of literature in the review. The main
limitation to this conclusion by Moore et al. is that the findings were based on one study only,
and Moore et al. noted that the findings were in contrast to most of the current research. Moore
et al.’s findings do point to the need for more evidence in order to provide clarification on this
topic. When one considers the behaviors and actions principals exhibit with teachers around
instruction and data, one is led to consider two important questions: Do these actions make any
difference? If not, would principals’ actions and behaviors be better spent on managerial tasks?
Moore et al.’s (2016) findings are specifically in opposition to Hattie’s (2009) meta-
analysis findings. Hattie’s research showed that principal factors have only a medium effect size

53
on achievement (0.36). The sub dimension of instructional leadership attained a much better
effect size (0.66) and in regard to elementary level contexts instructional leadership effect sizes
were even larger (0.76). These effect sizes are in comparison to transformational practices of
leadership (0.36). This suggests that in general, leadership practices have a medium effect on
achievement; however, when instructional leadership is leveraged a greater result is possible.
Further, when instructional leaders promoted and participated in teacher development and
learning, their impact seemed to be even greater (0.91). Similar effects are noted for planning
and evaluating curriculum (0.91), and direct involvement in evaluating teaching and providing
feedback (0.74; Hattie, 2009, pp. 84-85).
Another issue arising in this domain is the differences between instructional and
transformational leadership practices. Transformational leadership and instructional leadership
have been shown to have an interconnectedness (Dutta & Sahney, 2016). Evidence from this
study suggested a high degree of correlation between the instructional and transformational
dimensions, and that principals exhibited both behaviors to some degree (p. 953). In order to
outline an understanding of instructional leadership and transformational leadership, a definition
of each is appropriate. According to the Center of Educational Leadership at the University of
Washington’s College of Education (2018), four dimensions of instructional leadership are
responsible for a framework to define this concept. First, an instructional leader must provide
vision, mission, and a learning focused culture. Second, the leader must focus on the
improvement of instructional practices. Third, an instructional leader must be careful with the
allocation of resources. Finally, the instructional leader needs to effectively maintain systems
and processes. The focal point of the current study dealt mainly with the second domain of

54
improving instructional practice. Under this domain two sub-domains emerge: observation and
analysis, and support for teacher growth.
The integration of transformational and shared instructional leadership models facilitates
the principal’s role as an agent for fostering teacher growth (Marks & Printy, 2003). This focus
on teachers’ professional growth provides for the foundation of leadership’s authority. This
authority is based on moral authority involving the synergetic engagement of emotional,
intellectual, and social aspects of leadership. This is important in light of the unique professional
nature of the professionals in education. This is evidenced in that educators have not tended to
respond well to standard or traditional forms of leadership structures (Sergiovanni, 2007).
Educational leadership in general, and specifically instructional leadership, is a complex,
vital, and important aspect of the educational process. This phenomenon is so complex that
Marzano, Waters, and McNulty (2005) identified 21 leadership aspects that showed a correlation
with student achievement. While all the factors explored by Marzano et al. are important, four
are of special concern and importance in relation to the current study’s research topic. These
four principal behaviors include (a) the provision of intellectual stimulation, defined as not only
keeping informed about current research, but fostering discussions with teachers on research,
theory, and effective practices (p. 53); (b) direct participation in supporting teachers with
curriculum, assessment, and instruction (p. 54); (c) advanced acumen for coaching in curriculum,
assessment, and instruction (p. 55); and (d) constant monitoring and evaluation of these factors
as well as the impact of other factors on student achievement (p. 56).
Transformational and instructional leadership have some overlapping traits.
Riggio (2014) identified four elements of leadership practice juxtaposed within these two styles
including (a) positive role modeling, (b) inspirational motivation, (c)

55
individualized consideration, and (d) intellectual stimulation. These practices place an enormous
investment on relationships and modeling while encouraging creativity.
Educational leaders that blended these two leadership practices as they worked in
tandem had more influence in developing teacher instructional quality, resulting in
improved student outcomes (Dutta & Sahney, 2016). Supportive of this idea is a concept that
Hitt and Tucker (2016) called shared instructional leadership, and stated that it is desirable
for positive educational outcomes (pp. 534-535). These leadership practices consist of less
directive approaches as well as a collaborative approach between principal and teacher to foster
growth, research, and improved practices. This shared instructional leadership has been viewed
in two domains; one for learning and another for teaching (Glickman, 2002). The literature
supports that leadership for teaching has been the focus of educational leadership practices and
research. Little has been considered about the learning domain when compared to the teaching
aspects of this construct.
Leadership for learning (which is at the core understood as instructional leadership)
viewed by Glickman’s (2002) work has recognized the professional status of educators and
places an emphasis on collaborative approaches to educational practices as a shared endeavor
between teachers and principals. This is perhaps the most productive place for the growth of
professional practice and provides for a high level of principal and teacher interaction and
relationship. If principals desire to influence teaching these interactions and their relational
nature need appropriate attention. Payne (2005) pointed out that within the teaching learning
context desired learning outcomes did not take place absent of relationship. Jensen (2009)
extended this idea to relationships between members of a school staff. While relationships are
central to learning, relationships alone are inadequate to meet the learning needs of all students.

56
Intentional efforts must be focused on specific practices with the teacher-student relationship, or
in this case leader-teacher.
Bambrick-Sanyto (2016) outlined a framework to support teachers at various stages of
development with professional development that address the specific needs of teachers based on
their level of instructional expertise. The approach advocated in Bambrick-Sanyto’s Get Better
Faster recognized the fluid nature of instructional prowess among teachers with some needing
greater levels of support while others are independently effective.
Efforts to provide professional development to meet individual needs in the context of
relationships provide a framework to help to conceptualize leadership. In an effort to define
modern educational leadership, three characteristics have been used (Bush & Glover, 2014).
Influence, which can involve social influence, by one or multiple individuals within a school is
one characteristic that shapes leadership. This influence exists regardless of a person’s or
group’s formal authority. The values manifested by recognized leadership figures are another
characteristic of this understanding of leadership. The final characteristic identified was the
facilitation of a clear vision, which is considered by some as a central aspect of successful
leadership (Bush &Glover, 2014).
Beyond the framework of leadership are the actual practices in which leaders engage in
routinely with teachers. Observation and feedback are such practices. When quality feedback
has been provided on a regular basis, research has shown it enhanced and improved student
outcomes (Van Geel et al., 2016). The quantity of the feedback is a critical aspect in supporting
positive instructional changes or improvements. Even when quality feedback was given by an
administrator, it took from seven to 10 visits before the follow-up feedback was effective in
achieving the desired results of improvement (Teemant, Leland & Berghosf, 2014; van L, van

57
Grift, van Veen, & Fokkens-Bruinsma, 2016). This could help explain why it is difficult for
principals to influence positive development of a teacher’s practice with the two to three formal
visits they typically make in a year. Far too often the feedback that is given by administrators to
teachers is not what is desirable to support changes in the quality of instruction. Due to the many
time constraints faced by educational leaders, feedback is often the task that is both provided not
often enough and may be too brief to affect any changes that matter when it is given (Kraft et al.
2016). On the other hand, when quality feedback is provided on a regular basis research has
shown it enhances and improves student outcomes (van Geel et al., 2016). The quantity of the
feedback is a critical aspect in supporting positive instructional changes or improvements.
The requirements and pressures under which educational leaders must operate must be
considered (Grissom, Loeb, & Master, 2013). A principal is compelled to accomplish as much
as possible to get the work completed. The principal’s goal must be to enhance, improve, and
generally influence positive student changes in learning and achievement. Reaching the goal of
school success is bound up in individual student success. This is most impacted by the
classroom teacher, as established in the literature. While coaching teachers has been “positively
associated with achievement gains,” it is a “rare practice among observed principals” (Grissom et
al., 2013, p. 440).
Grissom et al. (2013) further suggested that the context of coaching is influenced by how
it is both viewed and received by teachers. A related study by Mette et al. (2015) found that
teachers identified a principal’s effectiveness with his/her ability to build capacity that caused
teachers to self-reflect on instructional improvement.
Teachers’ Role

58
Even though ample data exist (Marsh & Ferrell, 2015), it seems that educators continue
to operate as they always have for over a hundred years (Hattie, 2009, p. 5). Hattie conducted a
meta-analysis and synthesized findings from over 800 studies yielding the effect sizes of
multiple factors in relationship to student achievement. The data from Hattie’s study supported
the idea that many things are of value within the practices of education but pointed out that while
something might work or actually, does work, it may not provide the most gain for the most
effort or investment. These findings suggested that domains with an effect size of 0.40 or greater
hold the ability to move students more than one year of achievement growth (pp. 249-250).
Hattie outlined that teacher-student relationships had one of the largest effect sizes (0.72) on
student achievement. Out of 138 various factors examined in a large- scale meta-analysis,
teacher-student relationships ranked number 11.
Greer (2013) linked the use of data-driven instruction to predicting student achievement
through multiple factors. Four key factors were identified: (a) the understanding and use of data-
driven instruction as a tool for closing the achievement gap, (b) a clear vision for data use, (c)
changes to instruction after analyzing data, and (d) view of data-driven instruction as a natural
and necessary aspect of the teaching and learning process and not just extra work ( p. 122).
Schmonker (2019) suggested that the wide-spread use of poor instructional practices has resulted
in “hundreds of hours of wasted class time” (p. 31). Schmonker pointed to the need for the use
of “evidence-based” (p. 30) instructional practices. This necessitates a greater need for teacher
development and learning.
Professional Development
Foundational understanding to move educators forward through improved leadership
that leads to improved student achievement came from the work of Leithwood, Louis,

59
Anderson, and Wahlstrom (2004). Specifically, these researchers analyzed the literature and
challenged districts, schools, and classroom leaders with the following conclusion: “[The] direct and indirect effects of school leadership account for about a quarter of total school
effects” (p. 3). If one quarter of what a school does to impact student outcomes is directly
related to the principal, then it is critical to understand, focus, and improve upon the interactions
and behaviors of these leaders.
Based on this knowledge, it follows that the ability to deliver quality professional
development is valuable in equipping educational leaders with the necessary tools to lead schools
effectively; however, research suggests that more standard methods of professional development
are less productive and therefore their effectiveness is questioned (Gumus & Bellibas, 2016). In
contrast, methods of professional development for educational leaders that include strategies of
mentoring, networking, and researching might be more likely to improve instructional leadership
and specifically influence the amount of time leaders spend on the aspects of teaching and
learning in schools (Gumus & Bellibas, 2016).
Providing administrators with adequate training and professional development is critical
in developing data-driven instructional leadership (Miller et al., 2016; Young, 2016). Champion
(2017) suggested leadership training may be viewed as two-fold. First, according to Champion,
educational leaders must be able to identify and analyze data in such a way that the collective
organization works collaboratively to identify gaps in achievement, develop action plans and
goals to address these gaps, and be able to monitor progress toward these goals. This practice
must be developed in educational leaders as a natural or embedded aspect of day-to-day work
and become common place in the routine discussions of educators. For this to happen, feedback
alone may not be enough to improve the quality of leadership practices to enhance learning.

60
Adding the component of coaching with feedback to an administrator’s professional
development experience may multiply the impact the leader has when working to improve
instruction (Bickman, Goldring, De Andrade, Breda, & Goff, 2012).
Secondly, leaders need the skills to collect observational data and provide feedback that
can be leveraged for coaching moments, which ultimately can become a driver for teacher
development and the improvement in quality of instruction (Rigby et al, 2017). According to
Rigby et al. this data collection can be used to drive collaborative learning. These authors also
suggested that the literature on this matter points to the benefit of principals learning from an
expert. The learning of better ways to support teachers is underpinned by teachers’ propensity to
develop “ambitious practice” (p. 505) by focusing on a small number of levers that have the
potential for the most significant impact on student learning
Questions were raised by Rigby et al. (2017) as to the quality of leader feedback and
coaching suggestions. Further, without value added training and support for principals and other
instructional leaders who provide observation and feedback to teachers, significant
improvements in instructional practices are less likely to occur (p. 476). Compounding this issue
is the idea that educational leaders also need support in the acumen for more effective
interpersonal abilities, which target fostering conservations around the quality of teaching and
learning (Le Fevve & Robinson, 2015).
Efforts to improve teaching practice through instructional coaching was found to be
consistent with research-based effective professional development (Desimone & Pak, 2017).
School districts that need to provide support for school improvement efforts should ensure
school leaders are able to provide professional development that best addresses teacher learning.
Desimone and Pak suggested this can be accomplished through instructional coaching.

61
Principals therefore must have the skills and training to deliver and monitor this construct.
Johnson (2016) questioned whether or not school leaders have the experience to deliver
professional development effectively with this type of model and therefore called for the need of
further support.
Delivering embedded quality professional development is critical. In addition to the
necessary training to carry out general improvement efforts, leaders also need to be able to
provide professional development to meet teachers’ needs. Brown and Green (2014) identified
professional development as a leadership strategy used in successful school transformations.
When coaching was viewed as the method for delivering professional development, it was
viewed quite positively by teachers (Grissom et al., 2013). Coaching as a method to implement
the use of research-based instructional skills to a broader base of teachers has been implemented
with positive results in teacher practices (McCollum, Hemmeter, & Hsieh, 2013), and has
provided further evidence for the benefits of this type of professional development approach.
Teachers seem to have a basic distrust for professional development that is provided by
school districts, and thus tend to maintain control over their own professional development and
growth (Makkonen, Tejwani, Venkateswaran, Regional Educational, National Center for
Education Evaluation and, Regional Assistance, & WestEd. 2016). Research has shown that
teachers do not always see a clear relationship between their evaluation and professional
development and their instructional practices (Makkonen, 2016). As a result, districts and school
leaders are well advised to consider professional development activities at the school level that
align with individual teachers’ or groups of teachers’ needs. This could help encourage teachers
in seeing the value of the professional development activities, as well as in being actively

62
engaged with the leader providing the learning. The goal would then be a greater buy-in and
application of the learning to practice by the teachers (Makkonen, 2016).
The provision of coaching as embedded professional development is an integral part of a
data-driven approach to educational leadership. One can identify a disconnect between the
behaviors and activities of leaders and the expectations held for improved student outcomes
when considering the findings of Leithwood et al. (2004), who noted that 25% of school
outcome effects were attributed to leadership, yet participants spent only three to five hours per
week (8% of a principal’s time on average) on instructional leadership activities (May &
Supovitz, 2011).
Instructional coaching has been shown to be an effective professional development
approach (Teemant, 2014). Through the operational definition of instructional leadership, the
focus is clearly to improve instruction. Teemant stated, “Instructional coaching… provides
teachers with ongoing, longitudinal, collaborative, and job-embedded professional development
focused on their individual needs and student learning” (p. 143).
Instructional coaching was clearly defined by Teemant (2014) as a process that is
collaborative, reflective, and results in new practices that improve classroom instruction.
Furthermore, the relationship component described is one of respect, reciprocity, and genuine
dialogue. This is the type of culture that educational leaders should seek to build in the process
of developing teachers both personally and professionally.
The amount of time that principals commit to coaching and providing feedback to
teachers is an important consideration for educational leaders desiring to improve instructional
practices and student outcomes. The amount of time spent on these activities may not be as
critical as the “quality and focus” (Foster, 2018, p. 19) of the coaching itself. The review of

63
literature has shown that the complex set of competencies and or activities in which an
educational leader influences teachers’ practices or general school improvements was linked to
developing trust, relationships, and shared leadership practices. These should all have the focus
of improving student achievement through improved quality of teaching (Foster, 2018). This
was supported by Huff, Preston, Goldring, and Guthrie (2018), who sought to understand what
role principals played in providing support that brought improvement through changes in teacher
practices.
Leaders must attend to important aspects and implementation of support that lead to
actual changes in educator practices (Huff et al., 2018, p. 30). Monitoring and feedback are the
focal points regarding how this can bring about better quality of instruction. Exactly which
leadership practices foster these changes remains in need of development and understanding
(Huff et al., 2018, p. 30). Critical knowledge of teachers’ skills factors into this cycle of
observation, coaching, and feedback. Research supports the idea that quality feedback occurs
once the observer has made three visits to a teacher’s classroom, and at least 10 visits are needed
to provide any quality summative evaluation (van L et al., 2016).
Extending the idea of the value and quality of coaching, Militello et al. (2013) suggested
that use of data by teachers should be primarily used to make classroom decisions. Leaders need
to support teachers in tailoring their instruction to increase student learning with the right data
(Militello et al., 2013). Critical to this is assisting teachers with defining the data, providing time
for teachers to collectively interpret the data and subsequent actions to take, and training in the
data literacy necessary to use the data appropriately (Militello et al., 2013). This training,
coupled with the use of high yield instructional strategies using data to improve instructional
practice and student learning, stands as the desired outcome of the educational process.

64
In the literature, dimensions of an educational leader are suggested as having the power
to identify leaders for specific schools or contexts. Hitt, Woodruff, Myers, and Zhu (2018)
claimed these competencies were high leverage, underlying, enduring, and related to effective
performance. In total, these researchers indicated seven competency categories with sub
domains for each. A full examination of the competencies and domains manifests the
complexity of leadership behaviors necessary for leading today’s schools and attaining the
academic improvement demanded by stakeholders.
A number of characteristics were explored by Hitt et al. (2018), and several of these
competencies specifically related to the topic of the proposed study. Competencies Hitt et al.
outlined include (a) builds capacity with support and accountability by creating a culture of high
performance by matching individual growth and goals to the school’s vision, and developing
school leadership with coaching and mentoring in order to gain skills for reaching school goals,
(b) elicits intended responses by acting to influence thinking and mindsets of others and
influencing others’ perceptions with data, (c) fosters group interactions that demonstrate the
importance of collaborative effort and intentional work, fostering information sharing and
relationship building, (d) demonstrates a commitment to student learning through policy
leverage, decision-making, and instructional improvement; (e) prioritizes, especially with
complex data, to identify related concepts or what is most important, (f) provides clarity by
narrowing the meaning and value of complex data into prioritized focus that others can
understand and act upon, (g) develops others, (h) fosters growth through professional
development, (i) works to resolve performance that is lacking, and (j) communicates progress
toward and work that remains in order to meet goals.

65
The difficult task of defining a quality teacher is outlined by Saultz et al. (2017), as well
as with the federal policy review on the Every Student Succeeds Act (ESSA). Saultz et al. stated
that teacher quality has previously been determined or commonly associated with student
outcomes. Prior to the current so-called accountability era, educational attainment and licensure
were frequently used to define a quality teacher. Saultz et al. described how the role of the
federal government has decreased in regard to defining a quality teacher under ESSA. Outcome-
based observational systems that tried to define a good teacher have been criticized (Good &
Lavigne, 2015). The aspects of these systems under critical analysis include the concepts that
teacher performance was not consistently stable over time and that these systems to evaluate
teachers tended to dismiss good teachers and reward poor teachers.
There is a concern over teaching to the test or providing instruction that might be
considered cookie cutter in nature. Liou, Grigg, and Halverson (2014) explained the need for
professional development and a quality system design for data use. A primary function of these
systems is an approach that places emphasis on improving the test scores of the school. The
overemphasis on scores stands in oppositional contrast with the autonomy teachers have
traditionally enjoyed. Such a narrow focus of instructional purposes on one set of central
outcomes such as standardized tests scores could produce negative consequences. It has been
argued that “Good teaching involves much more than increasing students’ scores on standardized
achievement tests. Good teaching includes helping students to become better problem finders
and problem solvers, as well as encouraging student civility, social responsibility, and much
more” (Good & Lavigne, 2015, p. 10). However, current politics, policy, and opinions support
these kinds of systems as methods to maintain systems of accountability. Under these

66
circumstances, professional development activities should align with meeting the aforementioned
expectations.
Summary
Educators, parents, and other stakeholders desiring the best possible educational
outcomes for students seek answers to questions about how to improve the quality of instruction
that inevitably leads to desired student outcomes. Hanushek (2016) stated that the 1965
Coleman Report suggested that forces outside of the school such as a student’s home
environment, economic status, and race were largely responsible for student achievement. This
provided schools with the excuse of having little to no control over these issues and thus schools
operated largely in a fashion that enabled the status quo for years. The Coleman Report shifted
focus to student outcomes and the use of extensive data in education, which effectively linked
data to policy thereafter (Hanushek, 2016).
In time, changes in society, culture, and global economic matters resulted in federal
mandates of the No Child Left Behind (NCLB) legislation in 2001. This marked the start of a
new era of accountability and brought laser focus onto what happens in schools and classrooms.
Public reporting of standardized high stakes testing, and teacher evaluations based on those test
results are now the norm. Schifter et al. (2014) stated that while data have always been used by
educators, the use of data is now expected according to these federal guidelines. According to
Levin and Datnow (2012) national and local educational reform maintains the expectancy for
schools to use data-driven decision-making principles. Subsequently, data use to date has largely
had a focus on evaluation or accountability purposes (Shen et al., 2010). Bambrick-Sanyoto
(2018) suggested that a different approach is more important; that is, improvement of teacher
instructional quality, especially as it leads to improved achievement.

67
In December 2015 the reauthorization of federal policy in education was passed as the
Every Student Succeeds Act (ESSA) under Obama’s tenure. ESSA is commended for
recognizing the importance of school leadership – both in leadership development and practice
(Young et al., 2017). Young et al. reported that 40 years of educational leadership research has
led to the realization, especially in the last 15 years, that educational leaders impact every aspect
of schooling, including teacher practice. A search using Liberty University Library’s search
tools for educational leadership produced 114,265 hits with a date range from 1898 to 2019.
Peer reviewed articles reduced this number to 45,268. When filtered by years, more than half of
these articles, some 24,006, originated from the last decade (2009 to 2019). Furthermore, almost
half of the research articles in the last decade (10,517) appear since 2015. This supports the idea
that actually studying educational leadership is a relatively new field. Educational change is a
slow process and 10 years has not provided the adequate attention and improvements to
educational leadership that students deserve.
Much work remains to be done in this domain. Approaching this work from a research
standpoint is an important factor for leaders. Young et al. (2017) continue to provide positive
statements as to the allowances of Every Student Succeeds Act (ESSA) for states to be able to
make a “3% set-aside” (p. 717) of Title II funds under Part B to dedicate to leadership
development. Strong support for leadership outlines leadership responsibilities that encompass
“providing guidance and advice about instructional practices and crafting targeted and
individualized feedback, support, and opportunities for teachers in this endeavor (May &
Supovitz, 2011)” (Young et al., 2017, p. 714). A leader’s “personal involvement in planning,
coordinating, and evaluating teaching and teachers” (Young et al., 2017, p. 714) has enduring
aspects of impacting student achievement. The difference in leadership practices was noted as

68
the difference between high and low performing schools (Young et al., 2017, pp. 714-715), and
places the value of “active engagement” (Young et al.,2017, p. 715) as a factor in positive
influences on student outcomes.
Three states have elected to invest in leadership by leveraging the three percent of Title II
funding. New Mexico is one of these states and is the setting for the current study, which
examined the effects of data-driven leadership practices as implemented by participants of the
New Mexico Principal’s Pursuing Excellence (PPE) program on school achievement scores. The
Every Student Succeeds Act (ESSA) supports evidence-based practices such as the model that
was considered. Young et al. (2017) stated, “Specifically, the reauthorization of the ESSA,
emphasizes evidence-base initiatives while providing new flexibilities to states and districts with
regard to the use of federal funds, including funds to promote effective school leadership” (p.
716).
In a meta-analysis, Hattie (2009) provided evidence that among the factors educators can
control, the most significant influences on student academic outcomes are teacher actions and
behaviors. Other research indicated that second only to teacher effects is that of principal effects
on student learning outcomes (Brown’ 2015). While these effects have been called indirect by
Allen et al. (2015), they are important to student achievement and teacher effectiveness.
According to Datnow and Hubbard (2016), principals are an essential catalyst in assisting
teachers with data use. Sun et al. (2016) stated, “Principals’ use of data to lead schools has been
identified by some researchers as the most prominent way to help move schools forward on a
large scale” (p. 93).
According to Brown (2015), the interactive participation between school leaders and
teachers is critical. In reviewing schools where high gains in achievement were made, Brown

69
found that teachers considered the principal as an effective instructional leader. Further, Brown
indicated that leaders who are unable to foster change around student assessment and data use
are likely to be inadequate in accomplishing organizational or academic goals.
Clearly, what happens in the classroom and the relationship between students and their
teacher are important to the achievement experienced by students (Hattie, 2009). Knowing that
principals have an important positive relationship with student outcomes, the question arises,
what can teachers and principals do to significantly influence student outcomes?
Schifter et al. (2014) stated that while data have always been used by educators, the use
of data is now expected according to federal guidelines. According to Levin and Datnow (2012),
national and local educational reform maintains the expectancy of using data-driven decision-
making principles. In spite of this knowledge, data-driven practices are not always utilized and
when they are it is most often for accountability and evaluation purposes as opposed to
improvement reasons. What options remain for educational leaders and teachers? Providing
more evidence for the support of data-driven practices with a focus on improvement is needed.
While the evidence connecting leadership behaviors and student outcomes has provided
an opportunity for improvement, principals’ skills and acumen in determining how to identify
and support teachers in the average category are lacking. Research suggests principals can
identify the teachers who are demonstrating the greatest need as well as those whose
performance is exemplary rather effectively (Munro, 2017, p. 147); however, Munro revealed
that teachers performing in the average range of effectiveness on measured performance scales
presented principals with a more difficult task in identifying ways to improve the quality of
instruction. This implies training is needed in educational leaders’ practices, which could
improve their ability to identify specific teacher behaviors that fall within the median range of

70
effectiveness ratings. Additionally, what strategies to employ in improving instruction for the
average teacher’s practice remains an elusive concept for leaders.
Improving a school’s performance is critical and the literature suggests this can
effectively be accomplished through assisting individual teachers to improve the quality of their
instruction. Bickert (2011) found that in reference to student achievement, the quality of a
student’s teacher was more important than the quality of the school a child attended. This
conclusion is congruent with Hattie’s (2009) findings that teacher effects are the most significant
factor for student achievement.

71
CHAPTER THREE: METHODS
Overview
The purpose of this causal-comparative study was to examine the outcomes of data-
driven instructional leadership practices on student reading and math achievement within the
context of social cognitive theory. The researcher analyzed the differences in proficiency scores
of reading and math between schools that used data-driven instructional practices and those that
did not. The specific behaviors of leaders that have been linked to some of the strongest
influences on student learning are participation in teacher learning, planning, and evaluating
instruction (Brown, 2015). This study examined the actions taken by leaders that provide
opportunities for teachers to reflect, collaborate, and improve on instructional practice through
the secondary results these practices have on student achievement. Chapter Three describes the
research design, questions, null hypotheses, and the participants and setting. The chapter also
provides the instrumentation, procedures, and the data analysis for the study.
Design
The researcher used a causal-comparative design for this quantitative study. This design
is the most appropriate one because the researcher wanted to compare the differences of the
outcomes of the dependent variable (reading and math achievement scores) between the groups
of the independent variable of leadership practices. This design was also appropriate for the
study because the researcher could not manipulate the independent variable (Gall, Gall, & Borg,
2007). According to Gall et al., a causal-comparative design aligns with how educators and
educational stakeholders view the world (p. 307).
The researcher examined the independent variable of instructional leadership practices
used by principals. Instructional leadership practices are defined as the “active collaboration of

72
principal and teacher on curriculum, instruction, and assessment” (Marks & Printy, 2003, p. 371)
wherein “The principal seeks out the ideas, insights, and expertise of teachers… and works with
teachers for school improvement” (Marks & Printy, 2003 p.371). The independent variable
consisted of two groups. One group included schools whose principal practiced data-driven
instructional leadership as demonstrated through participation in the Principals Pursuing
Excellence Program (PPE) sponsored by the New Mexico Public Education Department
(NMPED). The second group was comprised of schools whose principals did not participate in
the PPE program.
The dependent variable was the reading and math achievement scores, measured by the
Partnership for Assessment of Readiness for College and Careers (PARCC), reported as a
percentage on a continuous scale from 0-100 (Green & Salkind, 2017), and maintained on the
New Mexico Public Education Department’s Accountability page. Reading and math
achievement scores on the PARCC assessment are defined as the school average proficiency
scores for reading and math reported as a percentage of 100. These scores are a standardized
measure of students’ reading vocabulary, general ability to read, ability to read and draw
meaning from both informational text and literature, mathematical reasoning ability,
mathematical conceptualization, modeling practice, and general content knowledge of math. In
this study these scores are reported as the average school level percentage proficient for grades
three through eight.
Gall, et al. (2007) stated that this type of design allows the researcher to identify
cause-and-effect relationships between the identified variables. Since the data analyzed
was derived from previously obtained assessment scores, the analysis is a type of ex post
facto research that examined differences between groups on given variables (Gall et al., 2007, p.
306).

73
Research Questions
The research questions for this study are:
RQ1: Is there a difference in the reading achievement scores on the Partnership
for Assessment of Readiness for College and Careers between schools that used data-driven
instructional leadership practices and those schools that did not use data-driven instructional
leadership practices?
RQ2: Is there a difference in the math achievement scores on the Partnership
for Assessment of Readiness for College and Careers between schools that used data-driven
instructional leadership practices and those schools that did not use data-driven instructional
leadership practices?
Hypotheses
The null hypotheses for this study are:
H01: There is no statistically significant difference in the reading achievement scores on
the Partnership for Assessment of Readiness for College and Careers between schools whose
leaders practiced data-driven instructional leadership and schools whose leaders did not practice
data-driven instructional leadership.
H02: There is no statistically significant difference in the math achievement scores on the
Partnership for Assessment of Readiness for College and Careers between schools whose leaders
practiced data-driven instructional leadership and schools whose leaders did not practice data-
driven instructional leadership.
Participants and Setting
The participants for this study were from schools with a D or F rating on their state report
card in the state of New Mexico. Participants were selected from the New Mexico Public
Education Department’s (NMPED; n.d.) Accountability Office records for school grading and

74
based on the school’s reported scores falling between 0 and 49.9 during the 2014 or 2015 school
year(s). These data are public archived information and maintained by the NMPED and thus
required no special permissions to access. The NMPED maintains the report cards for each
school, which contains demographic information, stakeholder survey results, and scores from the
Partnership for Assessment of Readiness for College and Careers, along with other data. Since
these are publicly available data; the researcher was able to access without any special
permission. Schools using data-driven instructional leadership practices are defined as
participants in the Principals Pursuing Excellence Program (PPE). Schools that practiced data-
driven instructional leadership have been identified by the New Mexico Public Education
Department’s (NMPED) Priority Schools Bureau. These schools were identified, invited to
apply, and selected (as well as monitored) during the implementation of data-driven practices by
the NMPED through the state PPE program.
A sample was taken from the schools with a D or F on their state report cards by simple
random sampling. From that sample the researcher established a control groups of schools that
did not participate in the Principal’s Pursuing Excellence Program (PPE). A convenience sample
of schools identified as having participated in the PPE program was used to establish the
treatment groups. This type of sampling was used because the treatment of data-driven
instructional leadership practices had already been applied with the PPE schools; these schools
were limited in number, and it was impossible for the researcher to randomly select a treatment
group.
New Mexico is a sparsely populated state in the southwestern United States. New
Mexico’s southern border is with Mexico, and Arizona, Colorado, Texas, and Oklahoma are
neighboring states (DataUSA22, 2019). New Mexico is considered an economically challenged

75
state (Mitchell & Esquivel, 2017). Educationally, New Mexico ranks near the bottom of U.S.
states and has a high population of English Language Learners (Ballotpedia, 2019). Even though
the feel of New Mexico is rural, two-fifths of the population lives in urban areas (Regan, Bureau
of Business and Economic Research, 2016). According to the U.S. Census Bureau QuickFacts:
United States (2019), New Mexico has a population comprised of individuals that are 49.1% of
Hispanic ethnicity, 37.1% of White ethnicity, 10.9% of Native American ethnicity, and less than
2% of all other ethnicities.
According to Education Week (2019), New Mexico serves 340,365 students. Of these,
62% are considered eligible for free and or reduced lunch and 14% are considered English
Language Learners. Education Week also reported that the 2015 National Assessment of
Educational Performance proficiency rates for fourth graders in New Mexico in math were 27.2
%, and for reading 24.8%.
The sample for the study was comprised of 81 schools that earned the status of D or F by
scoring from 0 to 49.9 on the New Mexico Public Education Department’s (NMPED) School
Report Card. The treatment groups consisted of 39 schools that participated in the Principals
Pursuing Excellence Program (PPE) sponsored by the NMPED. The control groups drew from
42 schools selected from the remaining 296 schools in the state that did not participate in the
PPE Program. These schools were entered into an Excel spreadsheet and a simple random
sample was generated for 35 for reading and 32 for math. The treatment group for reading had
35 and for math 32. The reading n = 70 and the math n = 64 satisfied the minimum number of 64
participants for a causal-comparative design that is needed to obtain a medium effect size with an
alpha level of 0.05 and a statistical power of 0.7, which assists in avoiding a Type II error (Gall
et al. ,2007).

76
The sample for the study consisted of 81 schools drawn from the 336 (50) elementary and
(31) middle schools that earned a D or F on their state report cards in the 2014 or 2015 school
years. From this sample, schools that were participants of the Principals Pursuing Excellence
Program formed the treatment groups as a convivence sample. The control groups were
randomly selected from the remaining 297 D and F schools that did not participate in the
program using simple random sampling. Demographic composition of the schools in the sample
consisted of total population of 30,970 including 15,784 male students, 15,107 female students,
5,072 students of Anglo ethnicity, 343 students of African American ethnicity, 18,929 students
of Hispanic ethnicity, 56 students of Asian ethnicity, and 6,094 students of Native American
ethnicity. The sample represents 27,474 students belonging to economically disadvantaged
families, 6,167 students identified as English Language Learners, and 4,521 students with
disabilities.
These participants represent a cross section of the state, including those living in both
urban and rural areas.
Instrumentation
The instrument for this study was the Partnership for Assessment of Readiness for
College and Careers (PARCC). This was the state mandated standardized assessment for K-12
public schools in New Mexico until 2019 (Gewertz, 2019). The results of this assessment are
maintained on the NMPED website under the Accountability Office tab.
The purpose of PARCC was to measure student learning as it relates to the Common
Core State Standards (CCSS; Meyer & Paxson, 2019). This assessment is referred to as a “new-
era assessment that measures students’ readiness for college and career” through demonstrating
“mastery of rigorous” content, thinking critically and solving problems (PARCC, n.d.). The

77
collaborative partnership of states adopting the Common Core State Standards in 2010 joined to
develop this instrument to reflect the high expectations based on competencies that students will
need for future success. This instrument has been used in studies by Kozleski and Choi (2018),
Backes and Cowan (2019), Arellano et al. (2018), and Mihaly et al. (2018).
According to the Partnership for Assessment of Readiness for College and Careers
(PARCC; n.d.) “PARCC states have carried out research to establish the validity of the
assessments.” PARCC also provides feasibility study information and a list of independent
studies supporting the idea that it is an effective test. This instrument has been administered in
over 24 states as the state level standardized measure since 2014. In 2018 PARCC was the state
adopted standardized assessment for six states, the District of Columbia, the Bureau of Indian
Education, and the Department of Defense Education Activity.
The Partnership for Assessment of Readiness for College and Careers (PARCC) utilizes
internal validity methods to establish and maintain construct validity. Reported validity scores
for 2017 by subclaim (subscale) and grade for grades three to five yield an average
intercorrelation for validity of 0.75 in reading and 0.72 in math.
The Partnership for Assessment of Readiness for College and Careers’ (PARCC, n.d)
Technical Report for 2017 reported reliabilities for the Reading Complex Text for grades three
through 11 from 0.87 to 0.91 for Computer Based Test (CBT), and from 0.80 to 0.93 for Paper
Based Test (PBT). The median reliability across all grades and modes is 0.90. The reliability for
grades three through five ranges from 0.85 to 0.89, and for all grades and modes the median of
the average reliabilities for the sub claim is 0.83. Reading Information is 0.79 overall. The
Reading Vocabulary sub claim is based on points from 12 to 24. The subclaims’ average

78
reliabilities are 0.67. The Partnership for Assessment of Readiness for College and Careers.
(n.d.) provides evidence of Cronbach’s alpha for math at 0.93 and reading at 0.83.
The number of items and their point values for each subclaim are listed as follows: Third
grade English Language Arts; Reading Literature (RL) and Reading for Information (RI) each
have nine to 12 items worth 19-20 points. Reading Vocabulary (RV) four to seven items worth
eight to14 points. The Reading section has a total of 22 items worth 46 points. Grade four
varies slightly from grade three with RL seven to 19 items worth 16-40 points, RI six to17 items
worth 14-36 points, and RV four to eight items worth eight to 16 points. The total for fourth-
grade Reading is 30 items worth 64 points. For fifth grade RL has 10-16 items worth 24-34
points, RI nine to 13 items worth 22-28 points, and RV four to eight items worth eight to 16
points. The total for fifth grade is 30 items worth 64 points. For math in third grade Math
Calculation (MC) has 26 items worth 30 points, Additional and Supporting Content (ASC) 10
items worth 10 points, Math Reasoning (MR) four items worth 14 points, and Modeling Practice
(MP) three items worth 12 points. There is a total for math of 43 items worth 66 points. The
fourth-grade MC has 25 items worth 31 points, ASC has eight items for nine points, MR four
items for 14 points, and MP three items for 12 points. A total of 43 items worth 66 points make
up this part of the assessment. Fifth-grade MC has 25 items worth 31 points, ASC eight items
worth nine points, MR items worth 14 points and MP three items worth 12 points. A total of 40
items worth 66 points is the structure of the subclaim.
Scores for the Partnership for Assessment of Readiness for College and Careers
(PARCC; n.d.) are reported as Scaled Scores. These scores range from 650-850. Five levels are
assigned to the scores as follows. Level 1 Does Not Meet Expectations is defined as a score of
650-699 for any grade level; Level 2 Partially Met Expectations is defined with a score of 700-

79
725 or 726 depending on the grade level and subject; Level 3 Approaches Expectations is
defined by a score of 726 or 727; Level 4 Met Expectations has a score of 750-789; and Level 5
Exceeds Expectations with scores of 790 and above.
The Partnership for Assessment of Readiness for College and Careers (PARCC)
assessment is conducted as a secure testing event requiring state adoption and adherence to
testing windows and other standardization protocols. The test is intended for students in grades
three through 11. The PARCC test has two forms, paper-based (PBT) and computer–based
(CBT). It should be noted that validity, reliability, and number of test items vary based on the
format in which it is delivered. Only scores for the CBT are reported in this paper for validity
and reliability purposes.
In regard to math, the Partnership for Assessment of Readiness for College and Careers
(PARCC;2018) subclaims have greater numbers of points, thus are thought to have greater
reliability estimates. The average reliability for the subclaim is 0.83. PARCC reports validity
results between 0.83 and 0.91 on scaled subclaims of the assessment. Doorey, Polikoff, and
Fordham (2016) found PARCC to be an excellent match for measuring criteria in both content
and depth in English language arts and a good match in mathematics.
Finally, Nichols-Barrer, Place, Dillon, and Gill (2016) found that the Partnership for
Assessment of Readiness for College and Careers (PARCC) is adequate to predict college
success among students and has a higher standard for performance when compared to the
Massachusetts Comprehensive Assessment System. The researchers found a 0.23 coefficient in
English language arts and a 0.43 in math when compared to college grade point averages.
The Partnership for Assessment of Readiness for College and Careers (PARCC) is a
nationally known standardized test (Stotsky, 2015). Public entities have used the instrument and
published the results in the public domain, thus no special permission was needed to utilize the

80
data.
Procedures
After Institutional Review Board (IRB) approval, school level proficiency scores for
reading and math on the Partnership for Assessment of Readiness for College and Careers were collected from the New Mexico Public Education Department (NMPED) archival records found on the Accountability Department website. These data included the percentage of students scoring proficient and advanced on the Partnership for Assessment of Readiness for College and Careers (PARCC). No permissions were required by the NMPED to access the
data, as the information is public domain. The researcher inquired about any permissions the
New Mexico Public Education Department might have required. A representative from the
NMPED affirmed that the information is public domain and no permission was required. The
researcher contacted the Priority Schools Bureau of the New Mexico Public Education
Department by phone. The Director stated that information about the Principals Pursuing
Excellence (PPE) was public information. The Director then asked that the researcher send his
email contact. After the researcher sent this information, the Priority Schools Bureau sent by
email the Principals Pursuing Excellence Program’s participating cohort schools to the
researcher on a spreadsheet. These data indicated the schools that participated in PPE and in
which school years they were participants of the program.
The data to be obtained from these records are comprised of scores obtained from the
Partnership for Assessment of Readiness for College and Careers (PARCC) scores. PARCC
results are maintained under the achievement results section of the New Mexico Public
Education Department’s Accountability page.
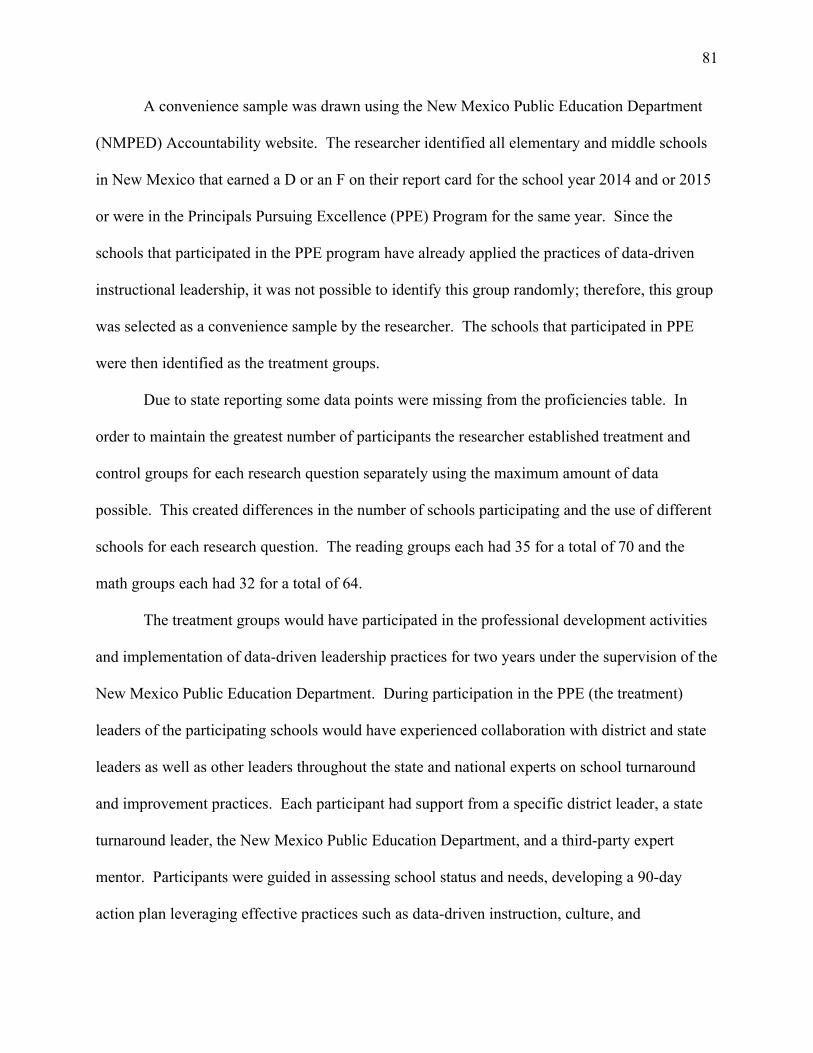
81
A convenience sample was drawn using the New Mexico Public Education Department
(NMPED) Accountability website. The researcher identified all elementary and middle schools
in New Mexico that earned a D or an F on their report card for the school year 2014 and or 2015
or were in the Principals Pursuing Excellence (PPE) Program for the same year. Since the
schools that participated in the PPE program have already applied the practices of data-driven
instructional leadership, it was not possible to identify this group randomly; therefore, this group
was selected as a convenience sample by the researcher. The schools that participated in PPE
were then identified as the treatment groups.
Due to state reporting some data points were missing from the proficiencies table. In
order to maintain the greatest number of participants the researcher established treatment and
control groups for each research question separately using the maximum amount of data
possible. This created differences in the number of schools participating and the use of different
schools for each research question. The reading groups each had 35 for a total of 70 and the
math groups each had 32 for a total of 64.
The treatment groups would have participated in the professional development activities
and implementation of data-driven leadership practices for two years under the supervision of the
New Mexico Public Education Department. During participation in the PPE (the treatment)
leaders of the participating schools would have experienced collaboration with district and state
leaders as well as other leaders throughout the state and national experts on school turnaround
and improvement practices. Each participant had support from a specific district leader, a state
turnaround leader, the New Mexico Public Education Department, and a third-party expert
mentor. Participants were guided in assessing school status and needs, developing a 90-day
action plan leveraging effective practices such as data-driven instruction, culture, and
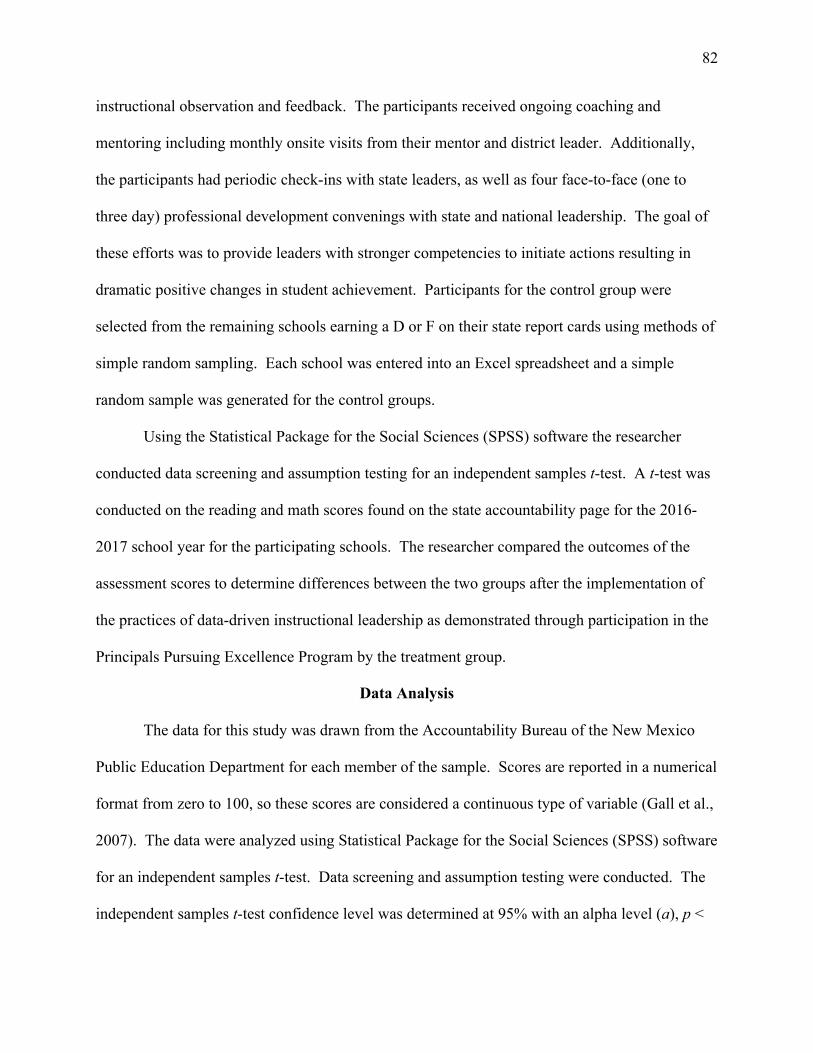
82
instructional observation and feedback. The participants received ongoing coaching and
mentoring including monthly onsite visits from their mentor and district leader. Additionally,
the participants had periodic check-ins with state leaders, as well as four face-to-face (one to
three day) professional development convenings with state and national leadership. The goal of
these efforts was to provide leaders with stronger competencies to initiate actions resulting in
dramatic positive changes in student achievement. Participants for the control group were
selected from the remaining schools earning a D or F on their state report cards using methods of
simple random sampling. Each school was entered into an Excel spreadsheet and a simple
random sample was generated for the control groups.
Using the Statistical Package for the Social Sciences (SPSS) software the researcher
conducted data screening and assumption testing for an independent samples t-test. A t-test was
conducted on the reading and math scores found on the state accountability page for the 2016-
2017 school year for the participating schools. The researcher compared the outcomes of the
assessment scores to determine differences between the two groups after the implementation of
the practices of data-driven instructional leadership as demonstrated through participation in the
Principals Pursuing Excellence Program by the treatment group.
Data Analysis
The data for this study was drawn from the Accountability Bureau of the New Mexico
Public Education Department for each member of the sample. Scores are reported in a numerical
format from zero to 100, so these scores are considered a continuous type of variable (Gall et al.,
2007). The data were analyzed using Statistical Package for the Social Sciences (SPSS) software
for an independent samples t-test. Data screening and assumption testing were conducted. The
independent samples t-test confidence level was determined at 95% with an alpha level (a), p <

83
0.05. This alpha level of significance allows for a statistical power of 0.7. All assumptions were
met at an a=.05.
In order to determine if a difference existed between the means of the two groups of the
independent variable the researcher used a t-test to analyze the PPE groups compared to the non-
PPE groups. A two-tailed test was used to test the null hypotheses. According to Gall et al.
(2007), some researchers see this model as a “more compatible… view of social science” (p.
143). The independent samples t-test provides for a medium effect size with a statistical power
of 0.7 at the alpha level a=.05 with N=64 (Gall et al., 2007, p. 145).
With an independent samples t-test, data need to satisfy six assumptions. The dependent
variable must be continuous, the independent variable should be categorical, and there must be
independence of observations. According to Gall et al. (2007) continuous scores such as
educational tests and measures are considered as an interval scale for the reasons of analysis (p.
130). The data for this study were reported on a continuous scale from zero to 100; the
independent variable consist of two categorical groups (data-driven and non-data-driven); and no
relationship existed between groups. The researcher screened the data for outliers using a
boxplot. The researcher tested for normality of distribution using the Kolmogorov-Smirnova test
of normality since the sample size was greater than 50. Finally, the homogeneity of variances
was tested with Levene’s test of equality of variances. The data analysis design determined if
there was a difference between the means of the two groups of the independent variable on the
one continuous dependent variable. According to Warner (2013), a commonly accepted alpha
level of .05 can be used to analyze the data. According to Green and Salkind (2017), this alpha
level will assist in avoiding a Type I error. Based on this information the researcher used an
alpha level of .05 for this study.
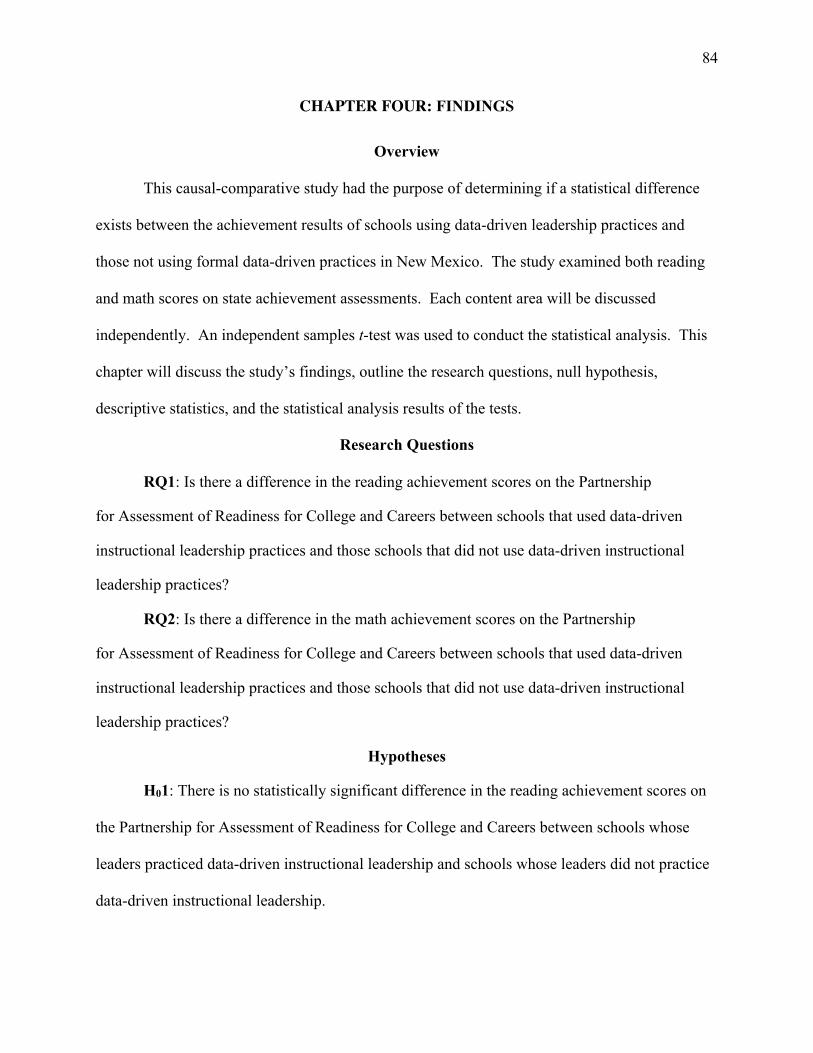
84
CHAPTER FOUR: FINDINGS
Overview
This causal-comparative study had the purpose of determining if a statistical difference
exists between the achievement results of schools using data-driven leadership practices and
those not using formal data-driven practices in New Mexico. The study examined both reading
and math scores on state achievement assessments. Each content area will be discussed
independently. An independent samples t-test was used to conduct the statistical analysis. This
chapter will discuss the study’s findings, outline the research questions, null hypothesis,
descriptive statistics, and the statistical analysis results of the tests.
Research Questions
RQ1: Is there a difference in the reading achievement scores on the Partnership
for Assessment of Readiness for College and Careers between schools that used data-driven
instructional leadership practices and those schools that did not use data-driven instructional
leadership practices?
RQ2: Is there a difference in the math achievement scores on the Partnership
for Assessment of Readiness for College and Careers between schools that used data-driven
instructional leadership practices and those schools that did not use data-driven instructional
leadership practices?
Hypotheses
H01: There is no statistically significant difference in the reading achievement scores on
the Partnership for Assessment of Readiness for College and Careers between schools whose
leaders practiced data-driven instructional leadership and schools whose leaders did not practice
data-driven instructional leadership.

85
H02: There is no statistically significant difference in the math achievement scores on the
Partnership for Assessment of Readiness for College and Careers between schools whose leaders
practiced data-driven instructional leadership and schools whose leaders did not practice data-
driven instructional leadership.
Descriptive Statistics
Descriptive statistics were generated for each research question. For Research Question
One, 70 schools were compared on reading achievement proficiencies of the 2016 Partnership
for the Assessment for Readiness for College and Careers (PARCC). The sample included 35
schools with leadership practices identified as data-driven (17 middle and 18 elementary) and 35
schools not participating in formal data-driven practices (14 middle and 21 elementary). The
schools with data-driven leadership attained a higher percent proficiency rate (M = 17.71, SD
=7.95) than did schools that used non-data-driven practices (M =15.31, SD =5.89). For Research
Question Two, 64 schools were compared on math achievement outcomes for PARCC including
23 middle schools and 41 elementary schools. This sample included 32 schools using data-
driven leadership practices and 32 schools in the non-data-driven instructional practices group.
The math scores for the data-driven group were higher (M =16.81, SD =8.08), than the group of
schools that used non-data-driven practices (M =15.06, SD =7.15; see Table 5).
Table 1 Descriptive Statistics for PARCC Reading Scores (Research Question One) Leadership Practice Mean Std. Deviation N Data-Driven 17.71 Non-Data-Driven 15.31
7.954 35 5.890 35
Table 2

86
Descriptive Statistics for PARCC Math (Research Question Two) Leadership Practice Mean Std. Deviation N Data-Driven 16.81 Non-Data-Driven 15.06
8.08 32 7.15 32
Results The following section presents the results of the data screening for the research questions.
This section includes data screening using boxplots to determine whether any outliers existed in
the data.
Data Screening The data sets for reading and math achievement scores were screened independently for
outliers. In the analysis of data for reading, no outliers were identified through a review of a
boxplot output. The results of this screening can be seen in Figure 1.
Figure 1. Boxplot for Leader Practices and Percent Proficient on Reading PARCC.

87
In the analysis of data for math, one outlier was identified through a review of a boxplot
output. The results of this screening can be seen in Figure 4. In order to determine whether to
keep the outlier or remove it from the data set the researcher ran the analysis with the outlier and
again without the outlier. Results of the analysis did not cause a change in the significance levels
(difference of 0.75 on the Means Difference and 0.206 on the p) of the results. Therefore, the
outlier was considered a genuinely unusual data point and was included for the final analysis.
Figure 2.
Boxplot for Leader Practice and Percent Proficient on Math PARCC.

88
Results for Null Hypothesis One In this section, the results of assumption testing and results of the independent samples t-
test for Research Question One are discussed. Data from these analyses are given in the tables
found within the section.
Assumptions. The statistical analysis for an independent samples t-test requires testing
for the normality of the data. The data sample consisted of 70, so the researcher used the
Kolmogorov-Smirnov to satisfy this assumption. PARCC achievement scores for both data-
driven leadership practices and non-data-driven leadership practices were determined to be

89
normally distributed, as assessed by the Kolmogorov-Smirnova test of normality with a p > .05
(see Table 3).
Table 3
Kolmogorov-Smirnova Test of Normality for PARCC Reading Scores
Leader Practice Statistic df Sig. DDL .086 35 .200* NonDDL .142 35 .073
Note. This is a lower bound of the true significance. a. Lilliefors Significance Correction. The researcher tested the homogeneity of variances using Levene’s test for equality of
variances. There was homogeneity of variances for achievement scores for schools with data-
driven leadership practices and those with non-data-driven practices as assessed by Levene’s test
of equality of variances (p = .094; see Table 4). Since the p-value for these data were greater
than .05, this assumption was satisfied.
Table 4
Levene’s Test for Equality of Variances
F Sig. Percent Proficient 2.887 .094 Equal Variances Assumed
Results. Since the assumptions were met, the researcher used the standard t-test to
determine any differences between the two groups of the study. The mean achievement scores of
the data-driven group was 2.40, 95%CI [-.938 to 5.738] higher than that of the non-data-driven
group (see Table 5). There was not a statistically significant difference in achievement scores
between schools using data-driven and non-data-driven leadership practices, M=2.40, 95% CI [-
.938 to 5.738] t (68) = (1.44), p = .156. Since there was not a statistically significant difference

90
between the means of schools using data-driven and non-data-driven leadership practices (p >
.05), the null hypothesis for Research Question One was retained. Since no statistically
significant difference was found in the data, the researcher did not explore effect sizes with
Cohen’s d.
Table 5 t-test for Equality of Means
95% Confidence Sig. Mean Std. Error Level of the t df (2-tailed) Difference Difference Difference lower upper Percent Proficient 1.435 68 .156 2.40 1.673. -.938 5.738 Equal Variances Assumed
Results for Hypothesis Two In this section, the results of assumption testing and results of the independent samples t-
test for Research Question Two are discussed. Data from these analyses are given in the tables
found within the section.
Assumptions. The statistical analysis for an independent samples t-test requires testing
for the normality of the data. The data sample consisted of 64, so the researcher used the
Kolmogorov-Smirnov to satisfy this assumption. PARCC achievement scores for data-driven
leadership practices met the assumption of normal distribution (p > .05; see Table 6). The non-
data-driven leadership practices group data were determined to violate the assumption of normal
distribution, as assessed by the Kolmogorov-Smirnova test of normality with a p < .05 (see Table
6). Since the independent samples t-test is considered robust to normality deviations (Laerd
Statistics, n.d.) especially if the numbers of the comparison groups are equal, the researcher
determined to proceed with the analysis.
Table 6

91
Kolmogorov-Smirnova Test of Normality
Leader Practice Statistic df Sig. DDL .103 32 .200* NonDDL .166 32 .025
Note. This is a lower bound of the true significance. a. Lilliefors Significance Correction.
The researcher tested the homogeneity of variances using Levene’s test for equality of
variances. There was homogeneity of variances for achievement scores for schools with data-
driven leadership practices and those with non-data-driven practices as assessed by Levene’s test
of equality of variances (p = .256; see Table 7). Since the p-value for these data were greater
than .05, this assumption was satisfied.
Table 7
Levene’s Test for Equality of Variances
F Sig. Percent Proficient 1.317 .256 Equal Variances assumed
Results. Since the assumptions were met, the researcher used the standard t-test to
determine any differences between the two groups of the study. The mean achievement scores of
the data-driven group was 1.75, 95% CI [-2.063 to 5.563] higher than that of the non-data-driven
group (see Table 8). There was not a statistically significant difference in achievement scores
between schools using data-driven and non-data-driven leadership practices, M=1.75, 95% CI [-
]2.063 to 5.563 t (62) = (.918), p = .362. Since there was not a statistically significant difference
between the means of schools using data-driven and non-data-driven leadership practices (p >
.05), the null hypothesis for Research Question Two was retained. Since no statistically

92
significant difference was found in the data, the researcher did not explore effect sizes with
Cohen’s d.
Table 8 t-test for Equality of Means
95% Confidence Sig. Mean Std. Error Level of the t df (2-tailed) Difference Difference Difference lower upper Percent Proficient .918 62 .362 1.75 1.907 -2.063 5.563 Equal Variances Assumed

93
CHAPTER FIVE: CONCLUSION
Overview
The purpose of this study was to determine if there was a difference between the
achievement scores of schools using data-driven instructional leadership practices and schools
not using data-driven practices. The contents of this chapter will discuss the results of the
statistical analysis for each research question, implications of the study, and provide
recommendations for further research.
Discussion
The goal of this study was to identify any differences between the reading and math
achievement scores on the Partnership for Assessment of Readiness for College and Careers of
schools with leadership practices that are data-driven and schools not practicing data-driven
leadership. The study was guided by the following research questions.
RQ1: Is there a difference in the reading achievement scores on the Partnership
for Assessment of Readiness for College and Careers between schools that used data-driven
instructional leadership practices and those schools that did not use data-driven instructional
leadership practices?
RQ2: Is there a difference in the math achievement scores on the Partnership
for Assessment of Readiness for College and Careers between schools that used data-driven
instructional leadership practices and those schools that did not use data-driven instructional
leadership practices?
The first research question sought to determine differences between schools using data-
driven and non-data-driven leadership practices on reading achievement scores. There were 35
data-driven and 35 non-data-driven schools examined. An independent samples t-test was run to
determine if there were differences in percent proficient scores of reading between data-driven

94
and non-data-driven groups. While the reading scores for the data-driven group were higher than
the group of schools that used non-data-driven practices, there was not a statistically significant
difference on the reading scores (p = .156). Therefore, the null is retained.
The second research question sought to determine differences between schools using
data-driven and non-data-driven leadership practices on math achievement scores. There were
32 data-driven and 32 non-data-driven schools examined. An independent samples t-test was run
to determine if there were differences in the percent proficient achievement scores on math
between data-driven and non-data-driven groups. While the math scores for the data-driven
group were higher than the group of schools that used non-data-driven practices, there was not a
statistically significant difference on the math scores (p = .362). Therefore, the null is retained.
The difference between schools using data-driven and non-data-driven practices was not
found to be statistically significant. However, the data-driven groups in this study did score
higher than the non-data-driven groups on both measures of achievement. This aligns with other
research found in the literature that provides evidence that leadership has an important positive
effect over many educational factors including achievement, even though the effect on
achievement has been found to be indirect in nature rather than having a direct effect on student
achievement outcomes (Allen et. al, 2016; Brown, 2016; Dutta & Sahney, 2016; Hitt et. al, 2018;
Yoon, 2016). One might conclude that the practices of data-driven leaders in this study
contributed to the higher mean averages of achievement scores in both reading and math among
groups of the independent variable. Considering that the well-supported construct (as outlined
by the literature review of this study) that leadership is second only to teacher effects among
school factors makes the behaviors of educational leaders of importance to the field.
Consequently, the function of data-driven instructional leadership is important to the field of
95
education despite the findings of this specific study. Slavin et. al (2013) found no direct
significant differences in achievement scores as a direct, immediate effect of data-driven
leadership practices; however long-term differences were noted.
In conflict with the findings of the current study, Shatzer, Caldavella, Hallam, and Brown
(2014) stated that a principal can have a positive impact on student achievement outcomes.
Other studies (Glover, 2017; Lynch, Smith, Provost, & Madden, 2016) have also purported that
leadership practices have shown a positive effect or relationship to student achievement. In
addition to these studies, Moore et. al (2016) found mixed results related to data-driven
professional development activities and positive student outcomes on achievement measures.
The most striking contrast to this study is the report and current claims touted by
Uncommon Schools. In a report, Teh, McCullough, and Gill, (2010) provided evidence that the
efforts of Uncommon Schools in New York had “achievement impacts [that] are positive,
significant, and substantial” (p. 10). These schools claim to leverage data-driven practices
aligned with the treatment group of this study. Further claims found on the Uncommon Schools
(n.d.) website state that they are closing the achievement gap with demographic challenges such
as 82% of students living in low income homes. These schools claim they outperformed the
other New York City schools on average by 20% in math and 7% in English Language Arts in
2019 state testing.
Social cognitive theory provides support in viewing these results. Social cognitive theory
identifies the behaviors of leaders in the context of interactions between individuals that provide
opportunities for learning, change, and growth. Leithwood and Sun (2018) pointed out this idea,
as well as the influence leaders had on school culture and attributed it to changes in student
achievement. Bandura (1977) suggested that within social cognitive theory an individual was

96
more likely to change a given behavior based on the relationship the individual had with the
model or mentor providing the stimulus for change. In this case, that model is the educational
leader as they interact with teachers. Directly related to this study, social cognitive theory
explains how the interactions, based on relationships between leaders and teachers and intended
to bring positive change, can help explain identified differences.
Vygotsky’s (1978) sociocultural learning theory helps explain this phenomenon further.
Sociocultural learning theory states that learning does not take place in a social vacuum, but
rather in the culture and community of social interactions. Marsh and Farrell (2015) used this
idea to study communities of social learning and culture and provided further support for this
theoretical basis. The collaborative approach in data-driven leadership draws directly from this
construct.
These theories provide a basis for understanding that the relationships formed in a social
setting and leadership provided within that context can be seen to have an influence on the
indirect effects that leadership has on student achievement. This explains the differences found
on mean averages for both reading and math scores in this study, even though they were not
found to be statistically significant.
The impact of leadership behavior remains an important aspect of educational concern.
Louis et. al (2010) have shown that a key aspect of connecting student learning and school
leadership is the role leaders play in developing people. As demonstrated in the literature, the
complexities of educational leadership and how leadership affects people through aspects of
school culture, teacher quality, and student achievement outcomes continue to evade a full
understanding by professionals in the field. Thus, they deserve further examination and
attention. This study did not find statistically significant differences; however, given the

97
limitations of the study and the small sample size the researcher believes that it is important to
note that both reading and math means were higher for the schools using data-driven practices.
Those practices remain a potential explanation of the differences and a source worthy of further
study.
Implications
Regardless of the findings of this study being not statistically significant, the findings do
support the body of research on the important, albeit indirect, role that leadership has on student
achievement. Hattie (2009) pointed out the primary importance of the teacher in relation to
student achievement. A body of literature supports the idea that the role leadership has in
creating collaborative, positive cultures that develop individuals and improve teacher quality is
vital. Slavin et. al (2013) stated, “What the findings imply is that helping school leaders
understand student data is helpful but in itself does not produce educationally important gains in
achievement. Schools must actually take action to change teaching and learning” (p. 390).
Leaders providing positive school cultures and changes in instructional quality leading to
improved achievement are critical to the educational landscape. Solid evidence by Leithwood et.
al (2004) promoted by The Wallace Foundation (n. d.) clearly support that second only to the
role of teachers is the role that leaders play in student achievement results.
Therefore, the findings of this study can be used to support the constructs of developing
the skills of leaders to enable them to create communities of collaborative culture that focus on
data-driven practices that improve the quality of instruction. It can be concluded that what
leaders do, does matter. Knowing that their behaviors are second only to teacher effects, leaders
should work to provide the best possible culture in which teachers can collaborate around data
focused on improved instruction in order to improve student achievement. This concept aligns

98
with the idea Bambrick-Santoyo (2018), suggested that quality teaching to ensure student
achievement should be the goal of educational leadership.
Limitations
This study was limited in a number of ways. The data for the study were archival and
accessed from the New Mexico Department of Public Education’s website. Due to reporting
factors controlled by the NMPED, some data were not included on the PARCC data file resulting
in some potential participants of the study to be eliminated from the sample. These data could
have had an effect on the overall analysis and results. This could also explain and or have
caused the violation of normal distribution for the math data set, as well as the outlier identified.
The design and implementation of the Principal’s Pursuing Excellence Program (PPE)
was changed by the NMPED between year two and three of the program. This allowed more
schools with a report card grade higher than an F or a D to be in the program and forced the
researcher to eliminate those schools from the study due to factors that could not be controlled
otherwise.
The study also consisted of a small sample size due to a convenience sampling that was
available to the researcher for the treatment group. This study was conducted using data from
schools with grades three to eight in the state of New Mexico. Due to the limited population for
this study it is not possible to generalize any findings to any other groups or areas within the
country. The size of the sample met requirements of Gall et. al (2007), but a larger size would
have provided a better basis for the study.
Finally, the research design might have contributed to the limitations of the results by comparing only one data point between the two groups.
Recommendations for Future Research

99
After a review of the results from this study, the following recommendations are made
for any future research. First, a larger sample size should be considered. The sample size for
this study was a main limitation for obtaining results with a greater added value.
A second recommendation would be to include a more representative sample of
participants from across a region or the country. This would allow for the results to be more
generalizable to a larger population.
Any future research should also include the consideration of a correlational design. Since
the literature supports leadership’s indirect effect on achievement, a causal-comparative design
might not have been the best fit. Rather, future researchers should consider what the relationship
between the variables might be through a bivariate correlational design, allowing the researcher
to have some reasonable evidence that the association of scores has any causation (Warner,
2013).
Finally, future researchers should consider examining differences in the achievement
gains made by the groups rather than using only one data point. This should also include
differences on the factors of gender, grade level, socioeconomic status, and ethnicity.

100
REFERENCES
Allen, N., Grigsby, B., & Peters, M. L. (2015). Does leadership matter? Examining the
relationship among transformational leadership, school climate, and student
achievement. International Journal of Educational Leadership Preparation, 10(2), 1-22.
Retrieved from
http://ezproxy.liberty.edu/login?url=http://search.ebscohost.com/login.aspx?direct=t
rue&db=eric&AN=EJ1083099&site=ehost-live&scope=site
Arellano, B., Liu, F., Stoker, G., Slama, R., Regional Educational, L. S., National Center for
Education Evaluation and, Regional Assistance, & SEDL. (2018). Initial Spanish
proficiency and English language development among Spanish-speaking English learner
students in New Mexico. REL 2018-286. Washington, DC: Regional Educational
Laboratory Southwest. Retrieved from
http://ezproxy.liberty.edu/login?url=http://search.ebscohost.com/login.aspx?direct=true&
db=eric&AN=ED580202&site=ehost-live&scope=site
Backes, B., & Cowan, J. (2019). Is the pen mightier than the keyboard? The effect of online
testing on measured student achievement. Economics of Education Review, 68, 89-103.
doi: 10.1016/j.econedurev.2018.12.007
Ballotepedia. (2019). Retrieved from https://ballotpedia.org/Main_Page
Bambrick-Santoyo, P. (2016). Get better faster: A 90-day plan for coaching new teachers. San
Francisco, CA: Jossey-Bass.
Bambrick-Santoyo, P. (2018). Leverage leadership 2.0: A practical guide to building exceptional
schools. San Francisco, CA: Jossey-Bass.
Bambrick-Santoyo, P., Peiser, B., & Lemove, D. (2012). Leverage leadership: A practical guide

101
to building exceptional schools. San Francisco, CA: Jossey-Bass.
Bandura, A., & Walters, R. H. (1977). Social learning theory. Englewood Cliffs, NJ: Prentice-
Hall.
Bandura, A. (1986). Social foundations of thought and action. Englewood Cliffs, NJ: Prentice-
Hall.
Bickert, G. (2011). The effects of curriculum-based measures on elementary math
achievement (Unpublished doctoral dissertation). Arizona State University, Phoenix, AZ.
Bickman, L., Goldring, E., De Andrade, A. R., Breda, C., & Goff, P. (2012). Improving principal leadership through feedback and coaching. Society for Research on Educational
Effectiveness. Society for Research on Educational Effectiveness. Retrieved from Google Scholar. https://files.eric.ed.gov/fulltext/ED530123.pdf
Boyce, J., & Bowers, A. J. (2018). Toward an evolving conceptualization of instructional
leadership as leadership for learning: Meta-narrative review of 109 quantitative studies
across 25 years. Journal of Educational Administration, 56(2), 161-182. Retrieved
from http://ezproxy.liberty.edu/login?url=http://search.ebscohost.com/login.aspx?direct=t
rue&db=eric&AN=EJ1174334&site=ehost-
live&scope=site; http://dx.doi.org/10.1108/JEA-06-2016-0064
Brown, A. A., & Green, R. L. (2014). Practices used by nationally blue-ribbon award winning
principals to improve student achievement in high-poverty schools. National Forum of
Applied Educational Research Journal, 27(1), 2-18. Retrieved from
http://ezproxy.liberty.edu/login?url=http://search.ebscohost.com/login.aspx?direct=t
rue&db=ehh&AN=92976092&site=ehost-live&scope=site
Brown, G. (2015). Leading school-based assessment for educational improvement: Rethinking

102
accountability. Rassegna Italiana Di Valutazione, 19(61), 70-81. Retrieved from
http://ezproxy.liberty.edu/login?url=http://search.ebscohost.com/login.aspx?direct=t
rue&db=a9h&AN=114725200&site=ehost-live&scope=site
Brown, G. (2016). Leadership's influence: A case study of an elementary principal's
"indirect" impact on student achievement. Education, 137(1), 101-115. Retrieved
from http://ezproxy.liberty.edu/login?url=http://search.ebscohost.com/login.aspx?direct=t
rue&db=eric&AN=EJ1112173&site=ehost-
live&scope=site; http://www.projectinnovation.com/education.html
Cai, H. R., Li, M., & Guan, P. P., (2016). Fostering managers' knowledge-
sharing behavior: The impact of the employee- organization relationship. Social Behavior
& Personality: an international journal. 44 (4), 669-678. doi:10.2224/sbp.2016.44.4.669
Champion, R. (2017). Let's really talk about data. Learning Professional, 38(3), 56-58. Retrieved
from http://ezproxy.liberty.edu/login?url=http://search.ebscohost.com/login.aspx?direct=t
rue&db=eric&AN=EJ1147575&site=ehost-
live&scope=site; https://learningforward.org/publications/jsd/jsd-
blog/jsd/2017/06/15/the-learning-professional-june-2017
Christensen, C. M., Horn, M. B., & Johnson, C. W. (2011). Disrupting class: How
disruptive innovation will change the way the world learns (2nd ed.). New York,
NY: McGraw Hill.
Connolly, G. J. (2017). Applying social cognitive theory in coaching athletes: The power of
positive role models. Strategies, 30(3), 23-29. doi:10.1080/08924562.2017.1297750
Corbett, J. (2014). New Mexico state policy brief: January 2015. San Francisco, CA: WestEd.
Dancy, M., Henderson, C., & Turpen, C. (2016). How faculty learn about and implement

103
research-based instructional strategies: The case of peer instruction. Physical Review
Physics Education Research, 12(1), 010110-1. Retrieved from
http://ezproxy.liberty.edu/login?url=http://search.ebscohost.com/login.aspx?direct=t
rue&db=eric&AN=EJ1092550&site=ehostlive&scope=site; http://dx.doi.org/10.1103/Ph
ysRevPhysEducRes.12.010110
Data USA. (2019). Retrieved from https://datausa.io/profile/geo/new-mexico#education
Datnow, A., & Hubbard, L. (2016). Teacher capacity for and beliefs about data-driven decision
making: A literature review of international research. Journal of Educational Change, 17(1), 7-28. doi:10.1007/s10833-015-9264-2
Day, C., Gu, Q., & Sammons, P. (2016). The impact of leadership on student
outcomes. Educational Administration Quarterly, 52(2), 221-258. doi:10.1177/0013161X15616863
Dickinson, E. E. (2016). Coleman report set the standard for the study of public education. Johns
Hopkins Magazine, 68, 38. Desimone, L. M., & Pak, K. (2017). Instructional coaching as high-quality professional
development. Theory into Practice, 56(1), 3-12. Doorey, N., Polikoff, M., & Fordham, T. B. (2016). Evaluating the content and quality of next generation assessments. Washington, DC: Thomas B. Fordham Institute. Retrieved from http://ezproxy.liberty.edu/login?url=http://search.ebscohost.com/login.aspx?direct=t rue&db=eric&AN=ED565742&site=ehost-live&scope=site Dumay, X., Boonen, T., & Van Damme, J. (2013). Principal leadership long-term indirect effects
on learning growth in mathematics. Elementary School Journal, 114(2), 225-251.
Retrieved from

104
http://ezproxy.liberty.edu/login?url=http://search.ebscohost.com/login.aspx?direct=true&
db=eric&AN=EJ1015538&site=ehost-live&scope=site; http://dx.doi.org/10.1086/673198
Dunn, K. E., Airola, D. T., Lo, W., & Garrison, M. (2013). Becoming data driven: The influence
of teachers’ sense of efficacy on concerns related to data-driven decision
making. Journal of Experimental Education, 81(2), 222.
doi:10.1080/00220973.2012.699899
Dutta, V., & Sahney, S. (2016). School leadership and its impact on student achievement: The
mediating role of school climate and teacher job satisfaction. International Journal of
Educational Management, 30(6), 941-958. Retrieved from
http://ezproxy.liberty.edu/login?url=http://search.ebscohost.com/login.aspx?direct=true&
db=eric&AN=EJ1109267&site=ehost-live&scope=site; http://dx.doi.org/10.1108/IJEM-
12-2014-0170
Education Week. (2019). New Mexico State Report. Retrieved from
https://www.edweek.org/topics/states/new_mexico/index.html
Faria, A., Greenberg, A., Meakin, J., Bichay, K., Heppen, J., & Society for Research
on Educational Effectiveness. (2014). Replicating the relationship between teachers'
data use and student achievement: The urban data study and the data dashboard usage
study. Evanston, IL: Society for Research on Educational Effectiveness. Retrieved
from http://ezproxy.liberty.edu/login?url=http://search.ebscohost.com/login.aspx?direct=t
rue&db=eric&AN=ED562866&site=ehost-live&scope=site
4 Dimensions of Instructional LeadershipTM . (n.d.). Center of Educational Leadership at the
University of Washington’s College of Education. Retrieved from https://www.k-
12leadership.org

105
Foster, E. (2018). The impact of coaching on teacher practice and student achievement. Learning
Professional, 39(4), 16-19. Retrieved from
http://ezproxy.liberty.edu/login?url=http://search.ebscohost.com/login.aspx?direct=true&
db=eric&AN=EJ1190332&site=ehost-
live&scope=site; https://learningforward.org/journal/august-2018-vol-39-no-4/the-
impact-of-coaching-on-teacher-practice-and-student-achievement/
Gall, M. P., Gall, J. D., & Borg, W. R. (2007). Educational research: An
introduction (8th ed.). Boston, MA: Pearson.
Gamson, D. A., McDermott, K. A., & Reed, D. S. (2015). The Elementary and Secondary
Education Act at fifty: Aspirations, effects, and limitations. RSF: The Russell Sage Foundation Journal of the Social Sciences, 1(3), 1-29. doi:10.7758/rsf.2015.1.3.01
Garet, M. S., Wayne, A. J., Brown, S., Rickles, J., Song, M., Manzeske, D., & National Center
for Education Evaluation and, Regional Assistance. (2017). The impact of providing
performance feedback to teachers and principals. executive summary. NCEE 2018-
4000. Washington, DC: National Center for Education Evaluation and Regional
Assistance, Institute of Education Sciences, U.S. Department of Education. Retrieved
from http://ezproxy.liberty.edu/login?url=http://search.ebscohost.com/login.aspx?direct=t
rue&db=eric&AN=ED578874&site=ehost-live&scope=site
Gewertz, C. (2015). Online testing drives 'tech prep' priorities. Education Week, 34(30), 1-12.
Retrieved from
http://ezproxy.liberty.edu/login?url=http://search.ebscohost.com/login.aspx?direct=true&
db=ofm&AN=102706951&site=ehost-live&scope=site
Gill, B., Borden, B. C., & Hallgren, K. (2014). A conceptual framework for data-driven decision

106
making. Seattle, WA: Final Report of Research Conducted by Mathematica Policy
Research.
Gillani, B. B. (2000). Culturally responsive educational web sites. Educational Media
International, 37 (3), 185-195. doi:10.1080/09523980050184754
Glover, T. A. 1. (2017). A data-driven coaching model used to promote students’ response to
early reading intervention. Theory into Practice, 56(1), 13-20.
doi:10.1080/00405841.2016.1260401
Goddard, R., Goddard, Y., Kim, E. S., & Miller, R. (2015). A theoretical and empirical analysis
of the roles of instructional leadership, teacher collaboration, and collective efficacy
beliefs in support of student learning. American Journal of Education, 121(4), 501-530.
Goddard, R. D., Hoy, W. K., & Hoy, A. W. (2000). Collective teacher efficacy: Its meaning,
measure, and impact on student achievement. American Educational Research
Journal, 37(2), 479-507. Retrieved from
http://ezproxy.liberty.edu/login?url=http://search.ebscohost.com/login.aspx?direct=true&
db=ehh&AN=18701924&site=ehost-live&scope=site
Good, T. L., & Lavigne, A. L. (2015). Issues of teacher performance stability are not new:
Limitations and possibilities. Education Policy Analysis Archives, 23, 2. Retrieved
from http://ezproxy.liberty.edu/login?url=http://search.ebscohost.com/login.aspx?direct=t
rue&db=eric&AN=EJ1049881&site=ehost-live&scope=site
Goodwin, D., & Webb, M. A. (2014). Toward a common understanding of research-based
instructional strategies. Research in Higher Education Journal, 26, 1-7. Retrieved
from http://ezproxy.liberty.edu/login?url=http://search.ebscohost.com/login.aspx?direct=t
rue&db=eric&AN=EJ1055304&site=ehost-live&scope=site

107
Gordon, S. P., Taylor-Backor, K., & Croteau, S. (2017). Recommended capacities for educational
leadership: Pre-reform era scholars versus reform-era scholars versus national
standards. NASSP Bulletin, 101(3), 188-214. doi:10.1177/0192636517726856
Green, S. B., & Salkind, N. J. (2017). Using SPSS for Windows and Macintosh. Upper
Saddle River, NJ: Pearson Education. Kindle Edition.
Greer, W. (2013). Which variables associated with data-driven instruction are believed to best
predict urban student achievement? Retrieved from
http://ezproxy.liberty.edu/login?url=https://search-proquest-
com.ezproxy.liberty.edu/docview/1440453271?accountid=12085
Grissom, J. A., Loeb, S., & Master, B. (2013). Effective instructional time use for school leaders:
Longitudinal evidence from observations of principals. Educational Researcher, 42(8),
433-444. Retrieved from
http://ezproxy.liberty.edu/login?url=http://search.ebscohost.com/login.aspx?direct=t
rue&db=eric&AN=EJ1019297&site=ehost-
live&scope=site; http://dx.doi.org/10.3102/0013189X13510020
Gumus, E., & Bellibas, M. S. (2016). The effects of professional development activities on
principals' perceived instructional leadership practices: Multi-country data analysis using
TALIS 2013. Educational Studies, 42(3), 287-301. Retrieved from
http://ezproxy.liberty.edu/login?url=http://search.ebscohost.com/login.aspx?direct=true&
db=eric&AN=EJ1103634&site=ehost-
live&scope=site; http://dx.doi.org/10.1080/03055698.2016.1172958
Gutek, G. L. (2011). Historical and philosophical foundations of education: A biographical
introduction (5th ed.). Saddle River, NJ: Pearson.

108
Hacker, J. S., & Pierson, P. (2017). American amnesia: How the war on government led us to
forget what made America prosper, New York, NY: Simon and Schuster.
Hallinger, P. (2011), Leadership for learning: Lessons from 40 years of empirical
research, Journal of Educational Administration, 49 (2), 125-
142. https://doi.org/10.1108/09578231111116699
Hallinger, P., & Kovačević, J. (2019). A bibliometric review of research on educational
administration: Science mapping the literature, 1960 to 2018. Review of Educational
Research, 89(3), 335-369.
Halverson, R., Grigg, J., Prichett, R., & Thomas, C. (2007). The new instructional leadership:
Creating data-driven instructional systems in school. Journal of School
Leadership, 17(2), 159-194. Retrieved from
http://ezproxy.liberty.edu/login?url=http://search.ebscohost.com/login.aspx?direct=true&
db=eric&AN=EJ807376&site=ehostlive&scope=site; http://www.rowman.com/Page/JSL
Hanushek, E. A. (2016). What matters for student achievement: Updating Coleman on the
influence of families and schools. Education Next, 16(2), 18-26. Retrieved from
http://ezproxy.liberty.edu/login?url=http://search.ebscohost.com/login.aspx?direct=true&
db=eric&AN=EJ1092964&site=ehostlive&scope=site; http://educationnext.org/wht-
matters-for-student-achievement/
Hattie, J. (2009). Visible learning. London, UK: Routledge. Heck, R., H., & Hallinger, P. (2014). Modeling the longitudinal effects of school leadership on teaching and learning. Journal of Educational Administration, 52(5), 653-681.
doi:10.1108/JEA-08-2013-0097 Hitt, D. H., & Tucker, P. D. (2016). Systematic review of key leader practices found to influence

109
student achievement: A unified framework. Review of Educational Research, 86(2), 531-
569. Retrieved from
http://ezproxy.liberty.edu/login?url=http://search.ebscohost.com/login.aspx?direct=true&
db=eric&AN=EJ1100248&site=ehost-
live&scope=site; http://dx.doi.org/10.3102/0034654315614911
Hitt, D. H., Woodruff, D., Meyers, C. V. 1., & Zhu3, G. (2018). Principal
competencies that make a difference: Identifying a model for leaders of school
turnaround. Journal of School Leadership, 28(2), 56-81. doi:10.1177/105268461802800103
Hoover, N. R., & Abrams, L. M. (2013). Teachers' instructional use of summative student
assessment data. Applied Measurement in Education, 26(3), 219-231.
doi:10.1080/08957347.2013.793187
Horsford, S. D., Jean-Marie, G., Tran, N., Carpenter, B., Adams, C., Schares, D., & Sanders, K. N. (2017). Special issue introduction school leadership and the Every Student Succeeds
Act: Dilemmas and possibilities in an era of inequality. Journal of School Leadership, 27(5), 618-621. doi:10.1177/105268461702700501
Huff, J., Preston, C., Goldring, E., & Guthire, J. E. (2018). Learning-centered leadership
practices for effective high schools serving at-risk students. Teachers College
Record, 120(9), 1-38. Retrieved from
http://ezproxy.liberty.edu/login?url=http://search.ebscohost.com/login.aspx?direct=true&
db=asn&AN=131723260&site=ehost-live&scope=site
Hvidston, D. J., Range, B. G., McKim, C. A., & Mette, I. M. (2015). The views of novice and
late career principals concerning instructional and organizational leadership within their

110
evaluation. Planning & Changing, 46(1), 109-126. Retrieved from
http://ezproxy.liberty.edu/login?url=http://search.ebscohost.com/login.aspx?direct=true&
db=ehh&AN=110937915&site=ehost-live&scope=site
Ing, M. (2013). What principals do to improve teaching and learning: Comparing the use of
informal classroom observations in two school districts. Journal of School
Leadership, 23(5), 846-864. Retrieved from
http://ezproxy.liberty.edu/login?url=http://search.ebscohost.com/login.aspx?direct=true&
db=eric&AN=EJ1045370&site=ehost-live&scope=site;https://rowman.com/page/JSL
Jimerson, J. B., Choate, M. R., & Dietz, L. K. (2015). Supporting data-informed practice among
early career teachers: The role of mentors. Leadership & Policy in Schools, 14(2), 204-
232. doi:10.1080/15700763.2014.997937
Johnson, K. G. (2016). Instructional coaching implementation: Considerations for K-12
administrators. Journal of School Administration Research and Development, 1(2), 37-
40. Retrieved from
http://ezproxy.liberty.edu/login?url=http://search.ebscohost.com/login.aspx?direct=t
rue&db=eric&AN=EJ1158169&site=ehost-live&scope=site
Kim, Y., & Baylor, A. (2006). A social-cognitive framework for pedagogical agents as learning
companions. Education Tech Research Development, 54, 569-596 doi:10.1007/s11423- 006-0637-3
Koppelman, K., L. (2017) Understanding human differences: Multicultural education for a diverse America (5th ed.). Hoboken, NJ: Pearson. Kouzes, J. M., & Posner, B. Z. (2012). The leadership challenge: How to make extraordinary
things happen in organizations. San Francisco, CA: The Leadership Challenge.

111
Kozleski, E. B., & Choi, J. H. (2018). Leadership for equity and inclusivity in schools: The
cultural work of inclusive schools. Inclusion, 6(1), 33-34. doi:10.1352/2326-6988-6.1.33
Kraft, M. A., Gilmour, A., & Society for Research on Educational Effectiveness. (2016). Can
principals promote teacher development as evaluators? Evanston, IL: Society for
Research on Educational Effectiveness. Retrieved from
http://ezproxy.liberty.edu/login?url=http://search.ebscohost.com/login.aspx?direct=true&
db=eric&AN=ED567597&site=ehost-live&scope=site
Lantolf, J. P., Thorne, S. L., & Poehner, M. E. (2015). Sociocultural theory and second language
development. Theories in Second Language Acquisition: An Introduction. New York,
NY: Routledge, pp. 207-226.
Laerd Statistics (n.d.). Statistical tutorials and software guides. Retrieved from
https://statistics.laerd.com/premium/index.php
Le Fevre, D. M., & Robinson, V. M. J. (2015). The interpersonal challenges of instructional
leadership: Principals’ effectiveness in conversations about performance issues. Educational Administration Quarterly, 51(1), 58-95. doi:10.1177/0013161X13518218
Leithwood, K., & Azah, V. N. (2017). Characteristics of high-performing school
districts. Leadership & Policy in Schools, 16(1), 27-53.
doi:10.1080/15700763.2016.1197282
Leithwood, K., Louis, K. S., Anderson, S., & Wahlstrom, K. (2004). How leadership influences student learning. review of research. Administration Quarterly, 51(1), 58-95. doi:10.1177/0013161X13518218
Leithwood, K., & Sun, J. (2018). Academic culture: A promising mediator of school leaders’

112
influence on student learning. Journal of Educational Administration, 56(3), 350-363. doi:10.1108/JEA-01-2017-0009 Levin, J. A., & Datnow, A. (2012). The principal role in data-driven decision making: Using
case-study data to develop multi-mediator models of educational reform. School
Effectiveness and School Improvement, 23(2), 179-201.
doi:10.1080/09243453.2011.599394
Liou, Y., Grigg, J., & Halverson, R. (2014). Leadership and the design of data-driven
professional networks in schools. International Journal of Educational Leadership and
Management, 2(1), 29-73. Retrieved from
http://ezproxy.liberty.edu/login?url=http://search.ebscohost.com/login.aspx?direct=true&
db=eric&AN=EJ1111672&site=ehost-live&scope=site
Louis, K. S., Leithwood, K., Wahlstrom, K. L., Anderson, S. E., Michlin, M., & Mascall, B.
(2010). Learning from leadership: Investigating the links to improved student
learning. Center for Applied Research and Educational Improvement/University of
Minnesota and Ontario Institute for Studies in Education/University of Toronto, 42, 50.
Lynch, D., Smith, R., Provost, S., & Madden, J. (2016). Improving teaching capacity to increase
student achievement: The key role of data interpretation by school leaders. Journal of
Educational Administration, 54(5), 575-592.
Makkonen, R., Tejwani, J., Venkateswaran, N., Regional Educational, L. W., National Center for
Education Evaluation and, Regional Assistance, & WestEd. (2016). How are teacher
evaluation data used in five Arizona districts? REL 2016-142. Washington, DC: Regional
Educational Laboratory West. Retrieved from

113
http://ezproxy.liberty.edu/login?url=http://search.ebscohost.com/login.aspx?direct=true&
db=eric&AN=ED565834&site=ehost-live&scope=site
Marginson, S., & Dang, T. K. A. (2017). Vygotsky's sociocultural theory in the context of
globalization. Asia Pacific Journal of Education, 37(1), 116-129. Retrieved from
http://ezproxy.liberty.edu/login?url=http://search.ebscohost.com/login.aspx?direct=true&
db=eric&AN=EJ1132141&site=ehost-
live&scope=site;http://dx.doi.org/10.1080/02188791.2016.1216827
Marks, H. M., & Printy, S. M. (2003). Principal leadership and school performance: An
integration of transformational and instructional leadership. Educational Administration
Quarterly, 39(3), 370-397.
Marsh, J. A., Bertrand, M., & Huguet, A. (2015). Using data to alter instructional
practice. Teachers College Record, 117(4), 1-40.
Marsh, J. A., & Farrell, C. C. (2015). How leaders can support teachers with data-driven
decision making: A framework for understanding capacity building. Educational
Management Administration & Leadership, 43(2), 269-289.
doi:10.1177/1741143214537229
Martinez, J. P. (2017). New Mexico's academic achievement gaps: A synthesis of status,
causes, and solutions. A white paper. Online Submission, Retrieved from
http://ezproxy.liberty.edu/login?url=http://search.ebscohost.com/login.aspx?direct=t
rue&db=eric&AN=ED575669&site=ehost-live&scope=site
Marzano, R. J., Waters, T., & McNulty, B. A. (2005) School leadership that works: From
research to results. Association for Supervision and Curriculum Development, d-
continent Research for Educational Learning. Aurora, CO: McREL.

114
May, H., & Supovitz, J. A. (2011). The scope of principal efforts to improve
instruction. Educational Administration Quarterly, 47(2), 332-352. Retrieved
from http://ezproxy.liberty.edu/login?url=http://search.ebscohost.com/login.aspx?direct=t
rue&db=eric&AN=EJ918005&site=ehost-
live&scope=site; http://dx.doi.org/10.1177/0013161X10383411
McCollum, J. A., Hemmeter, M. L., & Hsieh, W. (2013). Coaching teachers for emergent
literacy instruction using performance-based feedback. Topics in Early Childhood Special Education, 33(1), 28-37. doi:10.1177/0271121411431003
Mccormick, M. J., & Martinko, M. J. (2004). Identifying leader social cognitions: Integrating
the causal reasoning perspective into social cognitive theory Sage Publications Inc. doi:10.1177/107179190401000401
Mette, I. M., Range, B. G., Anderson, J., Hvidston, D. J., & Nieuwenhuizen, L. (2015). Teachers'
perceptions of teacher supervision and evaluation: A reflection of school improvement
practices in the age of reform. Education Leadership Review, 16(1), 16-30. Retrieved
from http://ezproxy.liberty.edu/login?url=http://search.ebscohost.com/login.aspx?direct=t
rue&db=eric&AN=EJ1105545&site=ehost-live&scope=site
Mette, I. M., & Riegel, L. (2018). Supervision, systems thinking, and the impact of American
school reform efforts on instructional leadership. Journal of Cases in Educational
Leadership, 21(4), 34-51. doi:10.1177/1555458918759696
Meyer, B., & Paxson, C. (2019). The double-edged sword of standardized testing. Faculty
Publications - College of Education. 14. Retrieved from
https://ir.library.illinoisstate.edu/fped/14 https://ir.library.illinoisstate.edu/cgi/viewcontent
.cgi?article=1015&context=fped

115
Mihaly, K., Schwartz, H. L., Opper, I. M., Grimm, G., Rodriguez, L., Mariano, L. T., . . . SEDL.
(2018). Impact of a checklist on principal-teacher feedback conferences following
classroom observations. REL 2018-285. Washington, DC: U.S. Department of Education,
Institute of Educational Sciences, National Center for Evaluation and Regional
Assistance, Regional Educational Laboratory Southwest. Retrieved from
http://ezproxy.liberty.edu/login?url=http://search.ebscohost.com/login.aspx?direct=true&
db=eric&AN=ED580182&site=ehost-live&scope=site
Militello, M., Bass, L., Jackson, K. T., & Wang, Y. (2013). How data are used and misused in
schools: Perceptions from teachers and principals. Education Sciences, 3(2), 98-120.
Retrieved from
http://ezproxy.liberty.edu/login?url=http://search.ebscohost.com/login.aspx?direct=true&
db=eric&AN=EJ1117980&site=ehost-live&scope=site
Miller, R. J., Goddard, R. D., Kim, M., Jacob, R., Goddard, Y., & Schroeder, P. (2016). Can
professional development improve school leadership? Results from a randomized control
trial assessing the impact of McREL’s balanced leadership program on principals in rural
Michigan schools. Educational Administration Quarterly, 52(4), 531-566.
doi:10.1177/0013161X16651926
Mireles-Rios, R., & Becchio, J. A. (2018). The evaluation process, administrator feedback, and
teacher self-efficacy. Journal of School Leadership, 28(4), 462-487.
doi:10.1177/105268461802800402
Mitchell, J., & Esquivel, J., (2017) New Mexico’s economy: current situation and outlook.
Albuquerque, NM: The University of New Mexico Bureau of Business & Economic
Research. Retrieved from https://bber.unm
116
.edu/media/presentations/NewMexicosEconomyCurrentSituationAndOutlook.pdf
Mitchell, R. M., Kenseler, L. A. W., & Tschannen-Moran, M. (2015). Examining the effects of
instructional leadership on school academic press and student achievement. Journal of
School Leadership, 25(2), 223-251. Retrieved from
http://ezproxy.liberty.edu/login?url=http://search.ebscohost.com/login.aspx?direct=true&
db=ofm&AN=102221900&site=ehost-live&scope=site
Moore Jr., D. L., Kuofie, M., Hakim, A., & Branch, R. (2016). Teachers' perceptions of
principals as instructional leaders and student academic achievement in elementary
schools. Journal of Marketing & Management, 7(1), 1-23. Retrieved from
http://ezproxy.liberty.edu/login?url=http://search.ebscohost.com/login.aspx?direct=t
rue&db=bth&AN=121382534&site=ehost-live&scope=site
Munro, J. H. (2014). Roundtable viewpoints: Educational leadership, Liberty University.
Lynchburg, VA: McGraw-Hill.
Murnane, R. J., Sharkey, N. S., & Boudett, K. P. (2005). Using student-assessment results to
improve instruction: Lessons from a workshop. Journal of Education for Students Placed
at Risk (JESPAR), 10(3), 269-280. doi:10.1207/s15327671espr1003_3
Nelson, A. M. (2016). An overview of the department of defense, senior executive service
Corp. International Journal of Business. 9(1), 1-29. Global Strategic Management, Inc.
Retrieved from
http://ezproxy.liberty.edu/login?url=https://search.ebscohost.com/login.aspx?direct=true
&db=bth&AN=117202243&site=ehost-live&scope=site
New Mexico Public Education Department (n.d.). Offices and Departments, Accountability,
Retrieved from https://webnew.ped.state.nm.us/bureaus/accountability/

117
Nichols-Barrer, I., Place, K., Dillon, E., & Gill, B. P. (2016). Testing college
readiness. Education Next, 16(3), 70-76. Retrieved from
http://ezproxy.liberty.edu/login?url=http://search.ebscohost.com/login.aspx?direct=t
rue&db=eric&AN=EJ1102472&site=ehost-
live&scope=site; http://educationnext.org/journal/summer-2016-vol-16-no-3/
Payne, R. K. (2005). A framework for understanding poverty (4th ed.). Highlands, TX: aha!
Process. Park, V., & Datnow, A. (2017). Ability grouping and differentiated instruction in an era of data-
driven decision making. American Journal of Education, 123(2), 281-000.
doi:10.1086/689930
Partnership for Assessment of Readiness for College and Careers. (2017). Final Technical
Report for the 2016 Administration. Retrieved from https://www.state.nj.us/education/assessment/district/PARCCTechReport16.pdf
Pham, K., & Heinemann, A. (2014). Partners with a purpose: District and teachers union create
an evaluation system that nurtures professional growth. Journal of Staff
Development, 35(6), 40-43. Retrieved from
http://ezproxy.liberty.edu/login?url=http://search.ebscohost.com/login.aspx?direct=true&
db=eric&AN=EJ1046806&site=ehost-
live&scope=site; http://learningforward.org/publications/jsd/jsd-blog/jsd/2014/11/21/jsd-
december-2014-teacher-evaluation
Range, B. G., Young, S., & Hvidston, D. (2013). Teacher perceptions about observation
conferences: What do teachers think about their formative supervision in one U.S. school
district? School Leadership & Management, 33(1), 61-77.

118
doi:10.1080/13632434.2012.724670
Ravitch, D., (2016). The death and life of the great American school system: How testing and
choice are undermining education. New York, NY: Basic Books.
Regan, S., (2016). How rural is New Mexico? University of New Mexico Bureau of
Business & Economic Research. Albuquerque, NM. Retrieved from
https://bber.unm.edu/blog/?p=364
Rigby, J. G., Larbi-Cherif, A., Rosenquist, B. A., Sharpe, C. J., Cobb, P., & Smith, T. (2017).
Administrator observation and feedback: Does it lead toward improvement in inquiry-
oriented math instruction? Educational Administration Quarterly, 53(3), 475-516.
doi:10.1177/0013161X16687006
Riggio, R. E., (2014). The 4 elements of transformational leaders: What makes a great leader?
How are leadership and parenting similar? Psychology Today. Retrieved from
https://www.psychologytoday.com/us/blog/cutting-edge-leadership/201411/the-4- elements-transformational-leaders
Salisbury, J., Goff, P., & Blitz, M. (2019). Comparing CALL and VAL-ED: An illustrative
application of a decision matrix for leadership feedback instruments. Journal of School
Leadership, 29(1), 84-112. doi:10.1177/1052684618825073
Saultz, A., White, R. S., Mceachin, A., Fusarelli, L. D., & Fusarelli, B. C. (2017). Teacher
quality, distribution, and equity in ESSA. Journal of School Leadership, 27(5), 652-674.
doi:10.1177/105268461702700503
Schifter, C. C., Natarajan, U., Ketehut, D. J., & Kirchgessner, A. (2014). Data-driven decision
making: Facilitating teacher use of student data to inform classroom instruction.
Contemporary Issues in Technology and Teacher Education, 14(4), 419-432. Retrieved

119
from http://www.citejournal.org/volume-14/issue-4-14/science/data-driven-
decision-making-facilitating-teacher-use-of-student-data-to-inform-classroom-
instruction
Schmoker, M., (2019). Focusing on the essentials. Educational Leadership, 77(1), 30-35.
Schunk (2016). Learning theories: An educational perspective (7th ed.).
Greensboro, NC: Pearson.
Shabani, K. (2016). Applications of Vygotsky’s sociocultural approach for teachers’ professional
development. Cogent Education, 3(1), 1252177. doi:10.1080/2331186X.2016.1252177 Sharplin, E. J., Stahl, G., & Kehrwald, B. (2016). "It's about improving my practice": The learner
experience of real-time coaching. Australian Journal of Teacher Education, 41(5), 119-
135. Retrieved
from http://ezproxy.liberty.edu/login?url=http://search.ebscohost.com/login.aspx?direct=t rue&db=eric&AN=EJ1102072&site=ehost-live&scope=site
Shatzer, R. H., Caldarella, P., Hallam, P. R., & Brown, B. L. (2014). Comparing the effects of
instructional and transformational leadership on student achievement: Implications for
practice. Educational Management Administration & Leadership, 42(4), 445-459.
Shen, J., Cooley, V. E., Reeves, P., Burt, W. L., Ryan, L., Rainey, J. M., & Yuan, W. (2010).
Using data for decision-making: Perspectives from 16 principals in Michigan,
USA. International Review of Education / Internationale Zeitschrift Für
Erziehungswissenschaft, 56(4), 435-456. doi:10.1007/s11159-010-9172-x
Sheng, Z., Wolff, L., Kilmer, L., & Yager, S. (2017). School administration manager:
Redefining the principal's role as an instructional leader. Journal of School
Leadership, 27(1), 119-145. Retrieved from

120
http://ezproxy.liberty.edu/login?url=http://search.ebscohost.com/login.aspx?direct=true&
db=ehh&AN=123192240&site=ehost-live&scope=site
Slavin, R. E., Cheung, A., Holmes, G., Madden, N. A., & Chamberlain, A. (2013). Effects of a
data-driven district reform model on state assessment outcomes. American Educational
Research Journal, 50(2), 371-396. Retrieved from http://www.jstor.org/stable/23526145
Sleegers, P. J. C., Thoonen, E. E. J., Oort, F. J., & Peetsma, T. T. D. (2014). Changing classroom
practices: The role of school-wide capacity for sustainable improvement. Journal of
Educational Administration, 52(5), 617-652. doi:10.1108/JEA-11-2013-0126
Spillane, J. (2015). Leadership and learning: Conceptualizing relations between school
administrative practice and instructional practice. Societies, 5(2), 277-294. Spillane, J. P., Halverson, R., & Diamond, J. B. (2001). Investigating school leadership practice:
A distributed perspective. Educational Researcher, 30(3), 23-28. Steinberg, M. P., & Donaldson, M. L. (2016). The new educational accountability:
Understanding the landscape of teacher evaluation in the post-NCLB era. Education
Finance and Policy, 11(3), 340-359.
Stotsky, S. (2015). Why Massachusetts should abandon the PARCC tests and the 2011 Coleman
et al english language arts standards on which the MCAS tests are based. Pioneer Institute for Public Policy Research, Retrieved from ERIC database. (ED565727). https://files.eric.ed.gov/fulltext/ED565727.pdf
Sun, J., Johnson, B., & Przybylski, R. (2016). Leading with data: An increasingly important
feature of school leadership. International Studies in Educational Administration
(Commonwealth Council for Educational Administration & Management
(CCEAM)), 44(3), 93-128. Retrieved from

121
http://ezproxy.liberty.edu/login?url=http://search.ebscohost.com/login.aspx?direct=t
rue&db=a9h&AN=121128230&site=ehost-live&scope=site
Teemant, A., Leland, C., & Berghoff, B. (2014). Development and validation of a measure of
critical stance for instructional coaching. Teaching & Teacher Education, 39, 136-147.
doi: 10.1016/j.tate.2013.11.008
Teh, B., McCullough, M., & Gill, B. P. (2010). Student achievement in New York City middle
schools affiliated with achievement first and uncommon schools. Final
report. Mathematica Policy Research, Inc. Retrieved from ERIC database (ED511094). https://files.eric.ed.gov/fulltext/ED511094.pdf
The Wallace Foundation (n. d.). Knowledge Center, School Leadership. Retrieved from
https://www.wallacefoundation.org/knowledge-center/school- leadership/pages/default.aspx
Uncommon Schools (n.d.). Prepared to succeed. Retrieved from https://uncommonschools.org/ United States Census Bureau QuickFacts: United States (2019). Retrieved from
https://www.census.gov/quickfacts/NM
van, der Lans., van, de Grift., van Veen, Klaas., & Fokkens-Bruinsma, M. (2016). Once is not
enough: Establishing reliability criteria for feedback and evaluation decisions based on
classroom observations. Studies in Educational Evaluation, 50, 88-95.
doi: 10.1016/j.stueduc.2016.08.001
van Geel, M., Keuning, T., Visscher, A. J., & Fox, J. (2016). Assessing the effects of a school-
wide data-based decision-making intervention on student achievement growth in primary
schools. American Educational Research Journal, 53(2), 360-394.
doi:10.3102/0002831216637346
122
Vygotsky, L. (1978) Mind in society: The development of higher psychological processes.
Cambridge, MA: Harvard University Press. Retrieved from Google Scholar
Wachen, J., Harrison, C., & Cohen-Vogel, L. (2018). Data use as instructional reform: Exploring
educators' reports of classroom practice. Leadership and Policy in Schools, 17(2), 296-
325. Retrieved from
http://ezproxy.liberty.edu/login?url=http://search.ebscohost.com/login.aspx?direct=true&
db=eric&AN=EJ1179446&site=ehost-
live&scope=site;http://dx.doi.org/10.1080/15700763.2016.1278244
Wang, Y., Bowers, A. J., & Fikis, D. J. (2017). Automated text data mining analysis of five
decades of educational leadership research literature: Probabilistic topic modeling of
EAQ articles from 1965 to 2014. Educational Administration Quarterly, 53(2), 289-323.
doi:10.1177/0013161X16660585
Wardrip, P. S., & Herman, P. (2018). ‘We’re keeping on top of the students’: Making sense of
test data with more informal data in a grade-level instructional team. Teacher
Development, 22(1), 31-50. doi:10.1080/13664530.2017.1308428
Warner, R. M., (2013). Applied statistics: From bivariate through multivariate techniques. Los
Angeles, CA: Sage.
Wood, R., & Bandura, A. (1989). Social cognitive theory of organizational
management. Academy of Management Review, 14(3), 361-384.
Yoon, S. Y. (2016). Principals' data-driven practice and its influences on teacher buy-in and
student achievement in comprehensive school reform models. Leadership and Policy in
Schools, 15(4), 500-523. Retrieved from

123
http://ezproxy.liberty.edu/login?url=http://search.ebscohost.com/login.aspx?direct=true&
db=eric&AN=EJ1111910&site=ehost-
live&scope=site;http://dx.doi.org/10.1080/15700763.2016.1181187
Young, M. D., Winn, K. M., & Reedy, M. A. (2017). The Every Student Succeeds Act:
Strengthening the focus on educational leadership. Educational Administration
Quarterly, 53(5), 705-726. Retrieved from
http://ezproxy.liberty.edu/login?url=http://search.ebscohost.com/login.aspx?direct=t
rue&db=eric&AN=EJ1160751&site=ehost-
live&scope=site;http: //dx.doi.org/10.1177/0013161X17735871

124
APPENDIX