ARTIFICIAL RECHARGE OF GROUNDWATER IN THE KÜÇÜK MENDERES ...

ARTIFICIAL RECHARGE AS POSSIBLE CAUSES OF OBSERVED
LONG –TERM CHANGE IN TRANSMISSIVITY OF THE SAN PEDRO FORMATION AQUIFERS, CENTRAL BASIN OF THE GREATER LOS ANGELES BASIN, CALIFORNIA
____________________________________
A Thesis
Presented to the
Faculty of
California State University, Fullerton
In Partial Fulfillment
Of the Requirements for the Degree
Master of Science
In
Geology
By
Sean Hunt
Approved by: Dr. William Laton Date Department of Geological Sciences Dr. John Foster Date Department of Geological Sciences Dr. Jeff Kuo Date Department of Civil and Environmental Engineering

ii
ABSTRACT Transmissivity values for the aquifers of the Upper San Pedro Formation of the Central Basin
of the greater Los Angeles Basin have increased since the implementation of artificial recharge.
To determine if the water used for artificial recharge is related to the observed increase in
transmissivity, a groundwater data collected from the Water Replenishment District of
Southern California (WRD) and the United States Geological Survey (USGS) from 1995 to
2002 was compared to the historical groundwater data collected by Piper and Garrett in 1953.
The results indicate that the hydrochemical facies of the groundwater of the aquifers of the
upper San Pedro Formation have been altered by the implementation of artificial recharge
particularly by water imported from the Colorado River and Northern California, not
reclaimed waters. These waters are characterized by higher calcium, sulfate, and total dissolved
solids (TDS). Although some mineral dissolution may be occurring, the evidence does not
support this process as a mechanism for increased transmissivity. Therefore, the increase in
transmissivity is more likely due to the physical changes to the aquifers and aquitards of the
Central Basin caused by extensive drilling, seasonal fluctuations and long-term over-pumping,
rather than a chemical change.

iii
TABLE OF CONTENTS ABSTRACT .......................................................................................................................................... ii
LIST OF FIGURES ............................................................................................................................ vi
LIST OF TABLES ............................................................................................................................... viii
ACKNOWLEDGMENTS ................................................................................................................ x
Chapter 1. INTRODUCTION .................................................................................................................. 1
2. DESCRIPTION OF AQUIFER SETTINGS ................................................................... 7
Basin Description ............................................................................................................... 7 Geological Description ...................................................................................................... 9 Basin Aquifers .................................................................................................................... 13
3. PREVIOUS WORK ................................................................................................................. 16
4. CENTRAL BASIN GROUNDWATER CONDITIONS .............................................. 20
Groundwater Recharge (Native/Artificial).................................................................... 20 Central Basin Groundwater Budget ................................................................................ 25 5. METHODS AND RESULTS ................................................................................................ 28
Transmissivity Map and Concentration Maps ............................................................. 28 Mixing Graphs ................................................................................................................... 30 Results .................................................................................................................................. 40 6. DISCUSSION............................................................................................................................ 49
Physical Indicators ............................................................................................................ 49 7. CONCLUSIONS ...................................................................................................................... 54
Conclusions ........................................................................................................................ 54
8. FUTURE RESEARCH Future Research .................................................................................................................... 56

iv
APPENDIX A CURRENT AND HISTORICAL CONCENTRATION GRAPHS ......... 57 Figure 1 – Site Map indicating the well location of the wells installed by the USGS and WRD from 1995 to 2002. ........................................................................................................... 58 Figure 2 -Current concentration of calcium (mg/L) within the groundwater of the aquifers of the San Pedro Formation (Contour Interval = 10 mg/L) ............................... 59 Figure 3 – Current Concentration of Magnesium (mg/L) of the groundwater of the Aquifers of the San Pedro Formation (Contour Interval = 5mg/L). ................................ 60 Figure 4 - Current Concentration of Sodium (mg/L) of the groundwater of the San Pedro Formation (Contour Interval = 10 mg/L) ......................................................... 61 Figure 5– Current Concentration of Bicarbonate (mg/L) of the groundwater of the Aquifers of the San Pedro Formation (Contour Interval = 10 mg/L). ............................ 62 Figure 6 - Current Concentration of Chloride (mg/L) of the groundwater of the Aquifers of the San Pedro Formation (Contour Interval = 10 mg/L) ............................. 63 Figure 7 – Current Concentration of Sulfate (mg/L) of the groundwater of the Aquifers of the San Pedro Formation (Contour Interval = 5 mg/L). ............................... 64 Figure 8 - Current Concentration of Total Dissolved Solids (mg/L) of the groundwater of the Aquifers of the San Pedro Formation (Contour Interval = 10 mg/L) ....................... 65 Figure 9 – Site Map indicating the well location of the wells used in Poland’s work Native and Contaminated Groundwater from Torrance to Santa Ana (Piper and Garrett, 1953. ........... 66 Figure 10 - Historical Concentration of Calcium (mg/L) of the groundwater of the Aquifers of the San Pedro Formation (Piper and Garrett, 1953) ........................................ 67 Figure 11 – Historical Concentration of Sodium (mg/L) of the groundwater of the Aquifers of the San Pedro Formation (Piper and Garrett, 1953). ........................................ 68 Figure 12 - Historical Concentration of Magnesium (mg/L) of the groundwater of the Aquifers of the San Pedro Formation (Piper and Garrett, 1953) ........................................ 69 Figure 13– Historical Concentration of Bicarbonate (mg/L) of the groundwater of the Aquifers of the San Pedro Formation (Piper and Garrett, 1953). ....................................... 70 Figure 14 - Historical Concentration of Chloride (mg/L) of the groundwater of the Aquifers of the San Pedro Formation (Piper and Garrett, 1953) ......................................... 71 Figure 15 – Historical Concentration of Sulfate (mg/L) of the groundwater of the Aquifers of the San Pedro Formation (Piper and Garrett, 1953). ........................................ 72 Figure 16 - Historical Concentration of Total Dissolved Solids (mg/L) of the groundwater of the Aquifers of the San Pedro Formation (Piper and Garrett, 1953) ............ 73

v
APPENDIX B MIXING GRAPHS ................................................................................................ 74 Figure 1 – Magnesium concentrations found in the nested groundwater monitoring wells for the Montebello Forebay Area of the Central Basin....................................................... 75 Figure 2 – Bicarbonate concentrations found in the nested groundwater monitoring wells for the Montebello Forebay Area of the Central Basin. ................................ 76 Figure 3 – Magnesium concentrations found in the nested groundwater monitoring wells for the Northern Pressure Area of the Central Basin. ......................................................... 77 Figure 4 – Bicarbonate concentrations found in the nested groundwater monitoring wells for the Northern Pressure Area of the Central Basin. ................................... 78 REFERENCES .................................................................................................................................... 79

vi
LIST OF FIGURES
Figures Page Figure 1- Los Angeles Central Basin Site Location Map .............................................................. 2 Figure 2 – Changes in Transmissivity Map...................................................................................... 6 Figure 3 - Hydrologic Sub-divisions of the Central Basin ............................................................ 8 Figure 4 - Site Map ............................................................................................................................... 11 Figure 5 - Generalized cross-section of the Central Basin ........................................................... 12 Figure 6 - Tritium concentrations in groundwater sampled in the Los Angeles ........................................................................................................................................... 18 Figure 7 Groundwater Elevation Contour Map for Fall 2001 ................................................... 21 Figure 8 - Generalized model of the hydrological system of the native and artificial recharge of the aquifers of the Central Basin, Los Angeles, California ...................................... 22 Figure 9 – Comparison of anion, cation and pH concentrations of Piper and Garrett’s (1953), Whittier Narrows, the Spreading Centers (Rio Hondo and San Gabriel) of the Montebello Forebay. ................................................................................................................ 24 Figure 10 – Comparison of total dissolved solids (TDS) concentrations of Piper and Garrett’s (1953), the Spreading Centers (Rio Hondo and San Gabriel) and the Montebello Forebay. ........................................................................................................................... 25 Figure 11 - Sulfate concentrations found in the nested groundwater monitoring wells for the Southern Pressure area of the Central Basin .................................................................... 34 Figure 12 - Sulfate concentrations found in the nested groundwater monitoring wells for the Northern Pressure area of the Central Basin. .................................................................... 35 Figure 13 – Calcium concentrations found in the nested groundwater monitoring wells for the Montebello Forebay of the Central Basin. ........................................................................ 36

vii
Figure 14 – Calcium concentrations found in the nested groundwater monitoring wells for the Northern Pressure Area of the Central Basin. ................................................................. 37 Figure 15 – Sodium concentrations found in the nested groundwater monitoring wells for the Montebello Forebay of the Central Basin. ........................................................................ 38 Figure 16 – Sodium concentrations found in the nested groundwater monitoring wells for the Northern Pressure Area of the Central Basin. ................................................................. 39 Figure 17 - Comparison of Historical and the Present Average Groundwater Chemical Signatures in the Montebello Forebay ............................................................................ 41 Figure 18 – Comparison of Historical and the Present Average Groundwater Chemical Signatures in the Northern Pressure Area ..................................................................... 42 Figure 19 – Current pH levels of the groundwater of the Aquifers of the San Pedro Formation .............................................................................................................................................. 44 Figure 20 - Sulfate vs. Chloride Concentrations found in the nested groundwater monitoring wells in the Southern Pressure Area of the Central Basin. ...................................... 47 Figure 21 – Central Basin San Pedro Formation Aquifer Piper Diagram. ................................ 48 Figure 22 – Generalized Cross-Section/Screen Interval ion ....................................................... 51 Figure 23 – Aquitard Thickness Map ............................................................................................... 53

viii
LIST OF TABLES Table Page 1 – Average Annual Water Balance 1970/71 – 1999/2000 (afy); 2000/01 Water Budget (afy). ......................................................................................................................................... 26 2 – Endmemebers – The concentration of the each of the analytes for the water entering into the Central Basin ........................................................................................................................ 32 3 - Represent the average concentration for each of the analytes within each of the four hydrochemical facies of the Central Basin. ............................................................................. 33

ix
With thanks to
Dr. William Laton Dr. John Foster
Dr. Jeff Kuo Dr. Diane Clemens-Knott Ted Johnson (WRDSC)
Michel Land (USGS) Rene Perez
Otto Figueroa and
Dr. Grace J. Fu
for their contributions and support.

1
CHAPTER 1
INTRODUCTION The demand for fresh water began to exceed the supply of surface water and shallow
groundwater as the land use within the Los Angeles Region changed from primarily agriculture
to urban residential and industrial. The completion of the Los Angeles aqueduct through the
San Fernando Valley in 1926 increased the supply of fresh water to the Los Angeles Region
(LARWQCB, 1989). Even with the additional water provided by the Los Angeles Aqueduct,
in the 1940s groundwater pumping had lowered the water table below sea level and altered the
groundwater flow dynamics of the Los Angeles Basin (Figure 1) (Poland et al., 1959a).
In 1948, additional water was delivered to the Los Angeles region via the Colorado River
Aqueduct, and artificial recharge with imported water in the Montebello Forebay began during
1949. Prior to artificial recharge, groundwater recharge of the Central Basin was dependent
upon surface water from inflow Los Angeles, Rio Hondo, and San Gabriel Rivers, surface run-
off and the groundwater underflow from the San Gabriel Basin to the north.

2
Figure 1 – Los Angeles Central Basin Site Location Map. CB = Central Basin; WCB = West Coast Basin; HB = Hollywood Basin; OC = Orange County; SGB = San Gabriel Basin; SFB = San Fernando Basin; SG = San Gabriel Mountains; MH = Merced Hills; PH = Puente Hills; NIFZ = Newport Inglewood Fault Zone; LAR = Los Angeles River; RHR = Rio Hondo River; SGR = San Gabriel River.
Despite the additional imported water, it was not until the responsibility for the protection and
management of groundwater of the Central and West Coast Basins was placed under the
direction of the newly formed Water Replenishment District of Southern California (WRD) in
1959 that over-drafting of the aquifers ceased. By reducing the overall pumping of
groundwater and increasing the volume of Colorado River water placed into the spreading

3
centers, WRD was able to increase and stabilize groundwater elevations throughout the Los
Angeles Basin (Riechard et al., 2002). However, the demand placed upon the groundwater
resources of the Los Angeles Basin still outweighed the supply.
Reclaimed water was introduced as an alternative source of groundwater recharge in
1961 and has increased from 5% to nearly 40% of total water recharged into the Montebello
Forebay (Water Replenishment District’s Regional Groundwater Monitoring Report Water
Years 1971-72 through 2001-2002). Reclaimed water is supplied by three Water Reclamation
Plants (WRP): Whittier Narrows WRP, San Jose Creek East and West WRP, and Pomona
WRP. In 1970, the State Water Project was completed and began delivering an additional 1.9
billion liters (430 million gallons) a day to the City of Los Angeles. With the exception of
seasonal fluctuations as observed by Bawden et al. (2001), the stabilization of the groundwater
levels has been achieved through the management of pumping and the addition of imported
and reclaimed water.
Though numerous studies have been conducted on possible health effects of using
reclaimed water (Toze et al., 2004; Schroeder and Andres, 2003; Dilon, 2002; Sumner and
Bradner, 1996; Sloss et al., 1994; Wilson et al., 1993; Asano, 1992; Bull et al., 1990; and Roberts
and Reinhard, 1982), the feasibility, groundwater “flow paths” and capacity of recharge basins
(Avisar and Clark, 2005; O’Reilly, 2004; Leserman and Ferry, 1997; Davisson et al., 1996;
Guymon et al., 1992; and Brose and Dozer, 1989) saltwater intrusion (Kulshan, 2002); and the
effects of seasonal groundwater fluctuations on tectonic movement within the Los Angeles
Basin (Bawden et. al., 2001), no studies have investigated the potential for artificial recharge to
induce mineral precipitation or dissolution and thereby affect the transmissivity of the aquifers
of the San Pedro Formation in the Los Angeles Basin.

4
As artificial recharge has increased in use globally, studies investigating the effects of
artificial recharge (Guo and Wang, 2004; Stuyfzand and Juhasz-Holterman, 2004; and Rinick-
Pfeiffer et al., 2002) on the distinct zones that have cation and anion concentrations
characterized within the defined composition categories known as the hydrochemical facies of
the groundwater has also increased (Freeze and Cherry, 1998), Such scientific studies have not
yet be compiled for the Central Basin. In addition, there have been no studies that have
investigated the possible degradation of the aquifers through mineral dissolution or
precipitation induced by the practice of artificial recharge and how this affects the hydrologic
conductivity of the aquifers within the Los Angeles Central Basin.
Figure 2 shows a plot of the difference between the transmissivity values recorded in
California State Departments of Water Resources Planned Utilization of the Ground Water Basins of
the Coastal Plan of Los Angeles County Bulletin 104A (commonly referred to as Bulletin 104A)
(DWR, 1961) to the transmissivity values observed today. In the Montebello Forebay,
transmissivity values have increased anywhere from 1,736 square meters per day (m2/day)
(14,000 gallon per foot per day (g/ft/d)) to 12,400 m2/day (100,000 g/ft/d). Along the
boundary between the Montebello Forebay and the Northern Pressure Area, transmissivity
values have increased a maximum of 24,304 m2/day (196,000 g/ft/d).
This paper presents evidence that artificial recharge of the Central Basin may have
altered the native hydrochemical facies of the Upper San Pedro Formation fresh water
aquifers. The objective of this thesis is to determine if the alteration of the native
hydrochemical facies induced by the practice of artificial recharge is directly related to the
observed increases in Upper San Pedro Formation aquifers transmissivity (see Figure 2) within
the Montebello Forebay and the Northern Pressure Area of the Central Basin.

5
Data collected by Piper during the 1950s (Piper and Garrett, 1953), the United States
Geological Survey (USGS) and the WRD between 1995 and 2003 (Riechard et al., 2003; and
Riechard et al., 2002), and the City of Whittier between 2000 and 2002 (City of Whittier Water
Quality Flyer, 2000 & 2002), were used in this study to model the hydrochemical conditions of
the Central Basin. The results of the modeling were used to produce cation-anion
concentration contour maps and mixing plots. The maps and graphs were used to determine
if mineral dissolution/ precipitation is occurring in the fresh water aquifers of the Upper San
Pedro Formation and therefore resulting in the observed change in transmissivity.

6
Figure 2 –Change in Transmissivity Map – Represents the difference in the values of transmissivity reported in Bulletin 104A and the transmissivity values recorded in well completion logs between 1990 and 2000 (WRD Files).

7
CHAPTER 2
DESCRIPTION OF AQUIFER SETTINGS
Basin Description
The Los Angeles Coastal Plain is the region bounded on the northwest by the Santa
Monica Mountains, on the north by the San Gabriel Mountains, on the east by the Puente
Hills, and the Pacific Ocean on the south and southwest. This area is divided into four
groundwater basins: Santa Monica, Hollywood, Central Basin and West Coast Basin (Riechard
et al., 2002; and DWR, 1961) (Figure 1).
The Central Basin is the largest basin within the Los Angeles Coastal Plain, covering
approximately 717 square kilometers (227 square miles). The Central Basin is by the
Hollywood Basin to the north; the Elysian, Repetto, Merced and Puente Hills (listed from
north to south) to the northeast; the Newport-Inglewood Fault Zone to the west and
southwestern Orange County to the east. The Newport-Inglewood fault zone is considered
the hydrologic boundary between the Central and West Coast Basin (Riechard et al., 2003; and
DWR, 1961).
The Central Basin has five sub-divisions: Los Angeles Forebay, Montebello Forebay,
Whittier Area, Northern Pressure Area, and Southern Pressure Area (Figure 3). The
designation of the boundary between the Los Angeles and Montebello Forebays or the “non-
pressure area” and the “pressure area” that lies to the south of the two Forebays, was first
noted by Mendenhall (1905a) and was later delineated by the California Department of Water

8
Resources Bulletin 104A (DWR, 1961). This boundary represents a change in hydrological
parameters of the underlying aquifers from a unconfined (non-pressure area) to a confining
aquifer system (pressure area). The Central Basin aquifers become deeper toward the south
from the Montebello Forebay to the Southern Pressure Area. Therefore, induced by ancient
oscillating shorelines, the aquitards between the aquifers of the San Pedro Formation, increase
in thickness and are more continuous within the pressure areas of the Central Basin.
Figure 3 - Hydrologic Sub-divisions of the Central Basin; Los Angeles Forebay, Montebello Forebay, Whittier Area, Northern Pressure Area, and the Southern Pressure Area. (NIFZ = New Port Inglewood Fault Zone)

9
Geological Description
Nearly continuous block downwarping of the Central basin and uplift of the hills of
the Los Angeles basin occurred until the mid-Miocene. Since that time the Central Basin has
experienced approximately 7.25 vertical kilometers (km) (4.5 vertical miles (mi)) of subsidence,
over a horizontal distance of 12.8 km (8 mi) (Yerkes et al., 1965). The depth of the
embayment increased by approximately 1.83 km (1.14 mi), with up to 1.53 km (0.96 mi) of
organic rich sediment, during the Late Miocene to Early Pliocene (5.3 ma) (DWR, 1961).
Rapid uplift of the marginal blocks at the end of the Pliocene (1.6 ma) , brought about by a
rapid transition from extension to oblique contraction and the deposition of large volumes of
coarse sediments in both the newly formed San Gabriel Basin and the Central Basin (Wright,
1991; Yerkes et al., 1965; and DWR, 1961).
During the Pleistocene, shallow basin conditions caused deposition to be more
responsive to sea-level change. In addition, rapidly uplifting mountains to the east formed
alluvial plains that moved the shoreline progressively to the west and south (Quinn, 1992).
Rivers, such as the ancestral San Gabriel and Rio Hondo, transported sand, gravel, cobble and
boulder sized sediment from the igneous and metamorphic rocks of the San Gabriel and San
Bernardino Mountains (Moran and Wiebe, 1992). Clastic sediments were effectively trapped
by uplift along the Newport-Inglewood Fault Zone (Quinn, 1992; and Harding, 1973).
The lower San Pedro Formation (early Pleistocene) is a sequence of coarse sands and
gravels interbedded with lenses of silt and clay is called the Sunnyside Aquifer (Callison, 1992).
The sediments of the Late Pleistocene to Holocene represent the transition from inner neritic
to nonmarine deposition (Callison, 1992) of unconsolidated sands, gravels, silts, clays and
marine sediments that make up the Upper San Pedro Formation aquifers (Silverado, Lynwood,

10
Jefferson, Hollydale) (Figure 4 and 5). Core samples collected by the USGS (Riechard et al.,
2002) indicate that the general mineral assemblages of the Lower and Upper San Pedro
Formation include plagioclase feldspar, potassium feldspar, quartz, mica, calcite, hornblende,
chlorite gypsum, kaolinite, smectite, and sepiolite at various percentages throughout the basin.
If mineral dissolution is occurring in the Montebello Forebay, increases in bicarbonate,
sodium, calcium, sulfate and magnesium would be in agreement with the mineral assemblage
of the Forebay.
Natural systems tend to move towards equilibrium; thus, if the solution (groundwater)
is undersaturated, minerals will be more likely to dissolve into the groundwater. As the
introduction of reclaimed recharge water has increased, it has resulted in the change of an
average pH value of the groundwater in the Montebello Forebay from a pH of 8 to 7.2 (Figure
19). This observed change in pH, from a basic to a neutral value, has possibly disrupted the
“equilibrium’ by increasing the solubility of the groundwater therefore resulting in the
dissolution of mineral within the matrix of the aquifers of the San Pedro Formation. For
example, the dissolution of calcite (calcium carbonate) into groundwater would result in the
increased concentrations of calcium and bicarbonate by means of the following reaction:
CaCO3 + H2O Ca2+ + HCO3- + OH-
CO2 + H20 HCO3- + H+

11
A
A’
Figure 4 – Site Map: The cross-section is presented in Figure 5.

12
Figure 5 – Generalized cross-section of the Central Basin (Adapted from WRD, 2001)
13
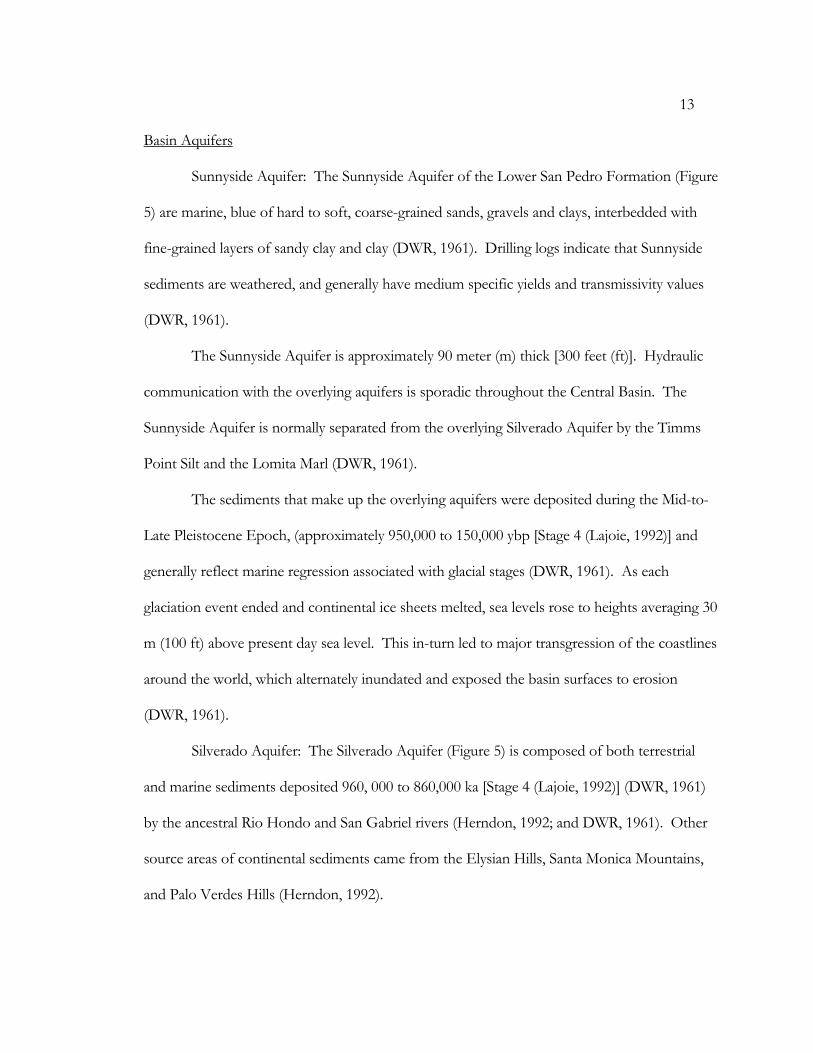
Basin Aquifers
Sunnyside Aquifer: The Sunnyside Aquifer of the Lower San Pedro Formation (Figure
5) are marine, blue of hard to soft, coarse-grained sands, gravels and clays, interbedded with
fine-grained layers of sandy clay and clay (DWR, 1961). Drilling logs indicate that Sunnyside
sediments are weathered, and generally have medium specific yields and transmissivity values
(DWR, 1961).
The Sunnyside Aquifer is approximately 90 meter (m) thick [300 feet (ft)]. Hydraulic
communication with the overlying aquifers is sporadic throughout the Central Basin. The
Sunnyside Aquifer is normally separated from the overlying Silverado Aquifer by the Timms
Point Silt and the Lomita Marl (DWR, 1961).
The sediments that make up the overlying aquifers were deposited during the Mid-to-
Late Pleistocene Epoch, (approximately 950,000 to 150,000 ybp [Stage 4 (Lajoie, 1992)] and
generally reflect marine regression associated with glacial stages (DWR, 1961). As each
glaciation event ended and continental ice sheets melted, sea levels rose to heights averaging 30
m (100 ft) above present day sea level. This in-turn led to major transgression of the coastlines
around the world, which alternately inundated and exposed the basin surfaces to erosion
(DWR, 1961).
Silverado Aquifer: The Silverado Aquifer (Figure 5) is composed of both terrestrial
and marine sediments deposited 960, 000 to 860,000 ka [Stage 4 (Lajoie, 1992)] (DWR, 1961)
by the ancestral Rio Hondo and San Gabriel rivers (Herndon, 1992; and DWR, 1961). Other
source areas of continental sediments came from the Elysian Hills, Santa Monica Mountains,
and Palo Verdes Hills (Herndon, 1992).

14
The Silverado Aquifer is composed of yellow to brown, coarse to fine sands and
gravels with interbedded yellow to brown silts and clays. Silverado Aquifer marine sediments
are primarily blue to gray sand, gravel, silt, and clay. Uncemented sands, fossils, and wood
fragments are also noted in boring logs of the marine sediments within the Silverado Aquifer
(DWR, 1961). Generally, the Silverado aquifer has high values of transmissivity ranging from
75,700 to 757,100 liters per foot per day (L/m/day) (20,000 to 200,000 g/ft/d).
The Silverado aquifer continuously underlies the Central Basin and is considered to be
in hydraulic conductivity at various locations with the overlying, Lynwood, and underlying,
Sunnyside, aquifers of the San Pedro Formation (DWR, 1961).
The Silverado Aquifer is separated from the underlying Sunnyside Aquifers by the
Timmus Pt. silt and Lomita Marl. Overlying fined-grained sediments separate the Silverado
from the Lynwood Aquifers.
Lynwood, Jefferson, and Hollydale Aquifers: The Lynwood, Jefferson and Hollydale
Aquifers (Figure 5) overlie the Silverado Aquifer. These aquifers are separated by layers of silts
and clays that underlie the Lakewood Formation of the Upper Pleistocene.
The Lynwood Aquifer is composed of a combination of continental and marine
sediments. The continental deposits are located in the vicinity of the Montebello Forebay and
are composed of yellow, brown and red coarse gravels, sands, silts, and clays. Based on drilling
logs, it is apparent that the major sources of the continental deposits were in the upper reaches
of the Rio Hondo and San Gabriel River watersheds (DWR, 1961). The marine sediments,
characterized by blue, gray, and black silts and clays, sands and gravels, are located in the area
within the basin surrounding the Montebello Forebay. Several sections, ranging in aerial extent
between less than 0.40 square kilometers (km2) [0.154 square miles (mi2)] to approximately 18.2

15
km2 (7.0 mi2), within the marine deposits of the Lynwood Aquifer are composed of fine-
grained sediment. In addition to these low hydraulic conductivity zones, some sections of the
marine sand and gravel deposits are moderately to highly cemented. These sediments appear
to have been deposited in shallow marine conditions (DWR, 1961).
The Jefferson and Hollydale Aquifers are mostly composed of fine-grained sediments;
however, gravel deposits within these aquifers are extensive within the area of the Whittier
Narrows and somewhat scattered throughout the basin (DWR, 1961). The sediments of the
Jefferson and Hollydale Aquifers were transported from their sources in the San Fernando and
San Gabriel valleys via the Los Angeles and San Gabriel Rivers into the Central Basin (DWR,
1961). The discontinuous nature of the sediments that make up the aquifers in the Central
Basin indicate that extensive erosion has occurred.

16
CHAPTER 3
PREVIOUS WORK Poland et al. (1959a), comprehensively characterized the aquifer system of the Los
Angeles coastal basins (Riechard et al., 2003). The California State Departments of Water
Resources Bulletin 104A (DWR, 1961) further characterized the groundwater systems of the
Los Angeles Basin. Bulletin 104A (DWR, 1961), identifying the compositions aquifers of the
Upper San Pedro Formation (Silverado, Lynwood, Jefferson, and Hollydale), along with their
corresponding aquifer thicknesses and transmissivity values. These two bodies of work
provide insight into the hydrochemical facies and hydrological properties of the freshwater
aquifers of the Upper San Pedro Formation prior to the implementation of the practice of
artificial recharge in the Central Basin.
Between 1961 and the early 1990s research into the hydrological characteristics of the
Central Basin focused on two areas: pumping/recharging activities and water quality issues.
The WRD (Water Replenishment District’s Regional Groundwater Monitoring Report Water
Years 1971-72 through 2001-2002) focused its research mainly in pumping and recharging
effects within the Central Basin. The WRD maintained vigilant monitoring activities that
included recording recharge levels, regulating pumping activities, and collecting some water
quality data. Water quality research focused on the health concerns and potential biological
ramifications brought about through the increase use of reclaimed water for the purpose of
artificial recharge (Sloss et al., 1994; Wilson et al., 1993; Asano, 1992; and Bull et al., 1990).

17
In 2002, the USGS released the Geological, Hydrological, and Water Quality Data from
Multiple-Well Monitoring Sites in the Central and West Coast Basin; Open-File Report 01-277
(Riechard et al., 2002) providing information on the geological, hydrological, and water quality
data from multiple-well monitoring sites in the Central and West Coast Basin from 1995 to
2000. Building on Open-File Report 01-277, the USGS published Geohydrology, Geochemistry, and
Groundwater Simulation-optimization of the Central and West Coast Basins in 2003 (Riechard et al.,
2003). Using tritium data collected from 1995-2000, the USGS determined the lateral and
vertical extent at which artificial recharge water has infiltrated the lower aquifer systems of the
Central Basin (Figure 6). Tritium, an unstable isotope used in a quantitative manner to
determine if the groundwater was in the atmosphere as water vapor either pre or post 1953,
allowed the USGS to determine the extent at which the recharge water from the Los Angeles
and Montebello Forebay has infiltrated into the Central Basin. The pattern of the distribution
of tritium data (Figure 6) is similar to that of the pattern of the change in transmissivity values
presented in Figure 1.
Model (Rinick-Pfeiffer et al., 2002) and field studies (Stuyfzand and Juhasz-Holterman,
2004) found that changes in transmissivity values may be due to mineral dissolution and
precipitation brought about by changes in the source water used for the recharge of aquifers.
Rinick-Pfeiffer et al. (2002) studied the interrelationships between biological, chemical and
physical processes as an analog to clogging in Aquifer Storage and Recovery (ASR) wells to
understand and predict bore-hole clogging issues in Southern Australia. Using laboratory

18
Figure – 6. Tritium concentrations in groundwater sampled in the Los Angeles Basin. The shaded gray areas show the approximate extent of recent water (>1TU) in the low aquifer systems, dashed where uncertain (Adapted from Riechard et al., 2003)
models simulating continuous injection of recycled water into an aquifer matrix, Rinick-
Pfeiffer et al. (2002) showed that hydraulic conductivity increased due to calcite dissolution in

19
the inlet end of the columns and decreased due to mineral precipitation of calcite in the
effluent zone of the model.
Stuyfzand and Juhasz-Holterman (2004), Guo and Wang (2004), have shown that
alterations in the hydrochemical facies induced by human activity (e.g., artificial recharge) have
the potential to induce geochemical reactions within fresh water aquifers and reduce water
quality. Stuyfzand and Juhasz-Holterman (2004) found that the displacement of native
groundwater resulted in the dissolution of various minerals (i.e., calcite). Guo and Wang
(2004), using the geochemical modeling code PHREEQC found that the hydrolysis of
bedrock within the alluvial aquifers of the Datong Basin, China, has been induced by
agricultural and industrial run-off. For example, concentrations of calcium have increased
from 114.9 milligrams/liter (mg/l) to 790 mg/l and concentrations bicarbonate increase from
324.8 mg/l to 6,375 mg/l. This has resulted in the oversaturation of groundwater with
calcium, sulfate, bicarbonate and sodium and is inducing mineral precipitation down-gradient
of the points of mineral dissolution.

20
CHAPTER 4
CENTRAL BASIN GROUNDWATER CONDITIONS The following section describes the natural and artificial recharge conditions of the
aquifer system. To put these conditions into perspective, the groundwater budget for the
Central Basin is also described. The impact of artificial recharge can then be accurately
assessed and the flow path defined.
Groundwater Recharge (Natural/Artificial) Prior to major artificial recharge (pre-1960s) and major urban development of the Los
Angeles Basin, groundwater recharge of the basin occurred by means of discharge of the Los
Angeles, San Gabriel and Rio Hondo Rivers into the Los Angeles and Montebello Forebay
(Figure 7) (DWR, 1961).
The Los Angeles River flows from the northeast to southwest entering the Central
Basin via the Los Angeles Narrows (Figure 2). The concrete-lined banks and channel bottom
of the Los Angeles River limit recharge into the Central Basin aquifers. Both the San Gabriel
and Rio Hondo Rivers enter the Central Basin through the Whittier Narrows of the Puente
Hills and on into the Montebello Forebay area. Additional sources of recharge occurred by
means of aerial recharge, surface run-off from the surrounding hills (Reppetto, Merced, etc.),
and underflow from the north of the basin via the Whittier Narrows from San Gabriel Basin.
In general, groundwater recharge of the Central Basin percolates into the aquifers of the

21
Montebello Forebay and flows towards the southwest-south to the eastern edge hydrological
barrier of the Newport-Inglewood Fault Zone (Figure 3, 7 and 8) (Riechard et al., 2002).
Figure 7- Groundwater Elevation Contour Map for Fall 2001. (Adapted from WRD’s Regional Groundwater Monitoring Report, Water Year 2001-2002)

22
Figure 8 – Generalized model of the hydrological system of the natural and artificial recharge of the aquifers of the Central Basin, Los Angeles, California (Adapted from WRD’s Regional Groundwater Monitoring Report, Water Year 2001-2002).

23
The coarse-grained sediments, merging of the aquifers, and synclinal structure of the
Central Basin makes the Montebello Forebay the main point of recharge for the aquifers for
the Central Basin. Recognizing the importance of the recharge capabilities of the Montebello
Forebay, two large spreading centers were constructed along the banks of the Rio Hondo and
San Gabriel Rivers for the purpose of artificial recharge from three main sources the Colorado
River, Northern California via the State Aqueduct and reclaimed water from three treatment
facilities (Figure 7 and 8) (DWR, 1961). Water imported for the Colorado River began to flow
into the basin via the Colorado aqueduct in the late 1940s and currently supplies roughly
14,487,000 cubic meters (m3) [11,725 acre/foot (acre/ft)] of water per year (Table 1) (WRD’s
Regional Groundwater Monitoring Report, Water Year 2003-2004). In 1961, reclaimed water
composed of 5% of the total artificial recharge and in 2004 comprises nearly 40% of the total
water used for recharge. The California State Water Project (beginning in 1970) supplies on
average an additional 24,280,000 m3 (19,650 acre/ft) for the purpose of artificial recharge of
the basin over the last 30 years (WRD’s Regional Groundwater Monitoring Report, Water
Year 2003-2004; Riechard et al., 2003; and DWR, 1961). Illustrated by Figure 8 are the
percentages of the water that make up the current total volume of the recharge water used for
the Central Basin which is further explained in detail in section 3.1 Central Basin Groundwater
Budget.
The chemical characteristic of the water imported into the basin varies from the native
chemical characteristics as recorded by Joseph Poland (Riechard et al., 2003; and Poland et al.,
1959a). Figure 9 below graphs the 30-year average concentrations of cations and anions and
pH of the water that is entering the Central Basin via the Montebello Forebay and compares
these concentrations to the data collected by Joseph Poland (1959a). The chemical

24
characteristics of the Colorado River, Northern California, and reclaimed water are represented
by the chemical concentrations recorded in the spreading centers.
0
50
100
150
200
250
Calcium Magnesium Sodium Bicarbonate Sulfate Chloride pH
Cation and Anion
Con
cent
ratio
n (p
pm)
Spreading Centers (30-year Average)
Montebello ForebayGroundwater (30-yearaverage)
Whittier Narrows (2003)
Piper and Garrett(1953)
Figure 9 – Comparison of anion, cation and pH concentrations of Piper and Garrett’s (1953), Whittier Narrows, the Spreading Centers (Rio Hondo and San Gabriel) of the Montebello Forebay. *Bicarbonate concentrations for the groundwater of the Whittier Narrows where not available in the literature provided by the City of Whittier. Figure 10 illustrates the 30-year average of total dissolved solids (TDS) for the
groundwater of the Montebello Forebay and the Spreading Centers and is compared to the
TDS concentrations recorded by Piper and Garrett (Piper and Garrett, 1953). Both figures 9
and 10 illustrate the difference in chemical characteristics between the native and imported

25
waters and the change in the hydrochemical facies of the groundwater of the Montebello
Forebay.
0
100
200
300
400
500
600
TDS
Con
cent
ratio
n (p
pm)
Spreading Centers(30-year Average)
Montebello ForebayGroundwater (30-yearaverage)
Piper and Garrett(1953)
Figure 10 – Comparison of total dissolved solids (TDS) concentrations of Piper and Garrett’s (1953), the Spreading Centers (Rio Hondo and San Gabriel) and the Montebello Forebay. *TDS concentrations for the Whittier Narrows where not available in the literature provided by the City of Whittier.
Central Basin Groundwater Budget Through coordination with the USGS (Riechard et al., 2003) and the WRD, these two

26
organizations have compiled the following 30-year average (1970/1971 to 1999/2000) and the
2000/2001 surface water inflow for the Central Basin:
Table 1 – Average Annual Water Balance 1970/1971 – 1999/2000 (afy); 2000/2001 Water Budget (afy) (Riechard et al., 2003).
Spreading Centers
Inflow Stormflow Imported Recycled Areal Recharge (Rain)
Barrier Injection
Net Underflow
Total (Inflow)
Central Basin (Average 1971-2000)
48,825 39,305 34,770 32,300 5,300 44,680 205,180
Percentage (Average 1971-2000)
23.79% 19.16% 16.95% 15.74% 2.58% 21.78% 100%
2000/2001 47,071 23,451 43,781 34,100 5,200 45,000 198,603 Percentage 23.70% 11.81% 22.0% 17.17% 2.61% 22.66% 100%
The significance of this table is its illustration of the amount of imported and recycled
water that has been used on average for the purpose of groundwater recharge over the last 30
years. Focusing on the water budget for the spreading centers, roughly 1.5x10⁸ m3 (122,900
acre/ft) of water is placed into the spreading centers per year. Of the total volume of recharge
water, 9.1x10⁷ m3 (74,100 acre/ft), 60% comes from imported sources or recycled water
(Riechard et al., 2003; and WRD’s Regional Groundwater Monitoring Report, Water Year
2000-2001). The water budget for the 2000/2001 water year shows that imported and recycled
water make-up 62% of the total water used for artificial recharge. Furthermore, the
2000/2001 water budget shows the increase in the use of recycled water for the purpose of
artificial recharge.

27
The water budget for the entire Central Basin indicates that on average, 40% of the
total water that is used for aquifer recharge of the basin is from the imported and reclaimed
sources. This estimation of 40% is excluding the percentage of the net underflow that is
composed of imported and recycled water. Therefore, the hydrochemical facies of the aquifers
becomes more characteristic of the imported and recycled water and as shown by previous
research. This change in hydrochemical facies could lead to geochemical reactions resulting in
the degradation of the physical properties of the aquifers.

28
CHAPTER 5
METHODS AND RESULTS
Transmissivity Map and Concentration Maps
Transmissivity is a measure of the amount of water that can be transmitted
horizontally through a unit width by the fully saturated thickness of the aquifer under a
hydraulic gradient of one (Fetter, 2001). Transmissivity (T) is the product of the hydraulic
conductivity (K) and saturated thickness (b) of the aquifer (T=Kb). Transmissivity can also be
determined during the development of groundwater production wells by measuring the
specific capacity [m3/d (gallons per minute {gpm})] divided by the amount of drawdown upon
the top of the water column in the well. This method was used to construct the transmissivity
maps in Bulletin 104 (DWR, 1961) (WRD Technical Bulletin, 2005).
To remain consistent with Bulletin 104 (DWR, 1961), 20 development logs of
production wells installed and screened in the Upper San Pedro Aquifers (Lynwood and
Silverado Aquifers) of the Central Basin from 1990 to present were used to construct a
“current” transmissivity map of the Central Basin. Each well log contained the production rate
in m3/day (gpm) produced by well, the duration of the aquifer test (minimum of 33 hours) and
the amount of drawdown the well experienced. Transmissivity was then calculated using the
following equation (Batu, 1999; Thomasson et al., 1960):

29
T= 1.042 (Q/Sw); for unconfined aquifers; (T=1500*Q/s)
T= 1.385 (Q/Sw); for confined aquifers; (T=2000*Q/s)
T= Transmissivity in m2/d (gpd/ft)
Q/s= Specific Capacity in m3/d (g/m/ft) divided by drawdown
Sw = drawdown in the pumped well after 1 day
Using the State Well Identification to locate the wells, the 20 production wells were
plotted onto a geocoded digital map of the Central Basin. A “current” transmissivity (CT)
contour map was then configured using the data available for the production wells. The CT
contour map was converted into a grid map by interpolating the transmissivity data with the
Geographical Information System (GIS) extension tool Vertical Mapper (version 2.5). The
method used for the interpolation was the Simplified Natural Neighbor Interpolation. The
settings for the interpolation were set at smoothed, with no overshoot, cell size of 1.52 meters
(m) (5 ft), an aggregation distance of 1.66 m (5.5 ft), and a grid dimension of 594 X 416.
Historical transmissivity data gathered from California Department of Water Resources
Bulletin 104A (DWR, 1961) was also gridded using the same procedures described above. The
transmissivity data was analyzed by overlaying the two grid maps and calculating the
differences between the two. Transmissivity values for the CT grid were subtracted from
those of the California Department of Water Resources Bulletin 104A (DWR, 1961) grid using
the GIS tools. These results were interpolated using the Natural Neighbor method (e.g.,
Figure 1).

30
The same grid method was used to construct the anion, cation, pH and total dissolved
solids (TDS) concentration contour maps for both the “current” and “historical” data sets,
(Appendix A).
Mixing Graphs
To determine if mineral dissolution/precipitation of calcite or gypsum was occurring
in the Upper San Pedro Aquifers, mixing graphs were constructed using the groundwater data
collected from USGS Open File Report 01-277 (Riechard et al., 2002), the WRD (WRD’s
Regional Groundwater Monitoring Report, Water Years 1971-1972 through 2002-2003), Piper
and Garrett (Piper and Garrett, 1953), and the City of Whittier (City of Whittier Technical
Bulletin 2000 and 2002). First, the possible end members or groundwater recharge sources of
hydrochemical facies were plotted onto a graph for each of the major cations and anions: the
historical groundwater signature (“native”) for the Central Basin provided through Piper and
Garrett’s work in the 1948-52 (Piper and Garrett, 1953); imported water from the Colorado
River and Northern California; recycled water (reclaimed water); the spreading centers (San
Gabriel and Rio Hondo rivers); and the underflow between the Whittier Narrows. This
analysis only enables one to assess whether the groundwater data are consistent with mixing
between plausible endmembers (Faure, 1995). If the data are not consistent, then other
processes (i.e., mineral dissolution/precipitation) should be considered and tested by modeling
using mineral stabilities (i.e., PHREEQ).
The endmembers, presented in Table 2, define the boundaries of possible water
signatures for a given anion or cation for the Central Basin. Second, the data obtained from
the USGS (Reiechard et al., 2002) and WRD (WRD’s Regional Groundwater Monitoring
Report, Water Years 1971-1972 through 2002-2003) databases (Table 2) were plotted on the

31
mixing graphs. If a datum was to plot outside the range of these specified end members, then
it would be possible that mineral precipitation or dissolution was occurring at that point within
the Central Basin (Figures 11–16 and Appendix B) (Faure, 1995).
This method was used for observing the groundwater at depth by aquifer (i.e.
Hollydale, Jefferson, Lynwood, Silverado, and Sunnyside) and by distance away from the
spreading centers (i.e., Montebello Forebay, Northern Pressure Area, and Southern Pressure
Area).

32
Table 2 – “End Members” – The concentration of the each of the analytes for the water entering into the Central Basin *X25 and X75 represent the variation from the mean.
Source TDS Ca Mg Na HCO3 SO4 Cl pH
Reclaimed Water
Average 572 61 18.79 111 270 110 114 7.12 Median 571 56 15.74 111 275 112 112 7.1 X25 558 55 15.37 108 250 102 107 7.08 X75 579 58 16.59 114 283 115 115 7.22 Standard Deviation 46.1 20.1 12.4 6.2 18.9 8.2 23.4 0.1
Imported Water
Average 435 47 19.97 69.7 121 152 73.5 8.16 Median 430 48 20.25 67.8 121 147 73.4 8.15 X25 409 45 18.27 63.3 118 137 64.7 8.06 X75 465 49 21.5 76.9 124 162 86.6 8.25 Standard Deviation 42.8 2.4 2.1 10.9 6.4 27.7 15.7 0.1
Spreading Centers
Average 471 58 16.64 78.1 172 132 77.8 7.67 Median 464 57 16.8 79.9 168 128 79.6 7.62 X25 446 55 15.87 72.9 156 120 73.4 7.32 X75 507 62 17.51 81.5 184 134 82.5 7.99 Standard Deviation 47.5 6.2 1.5 8.2 20.3 20.4 7.4 0.4
Montebello Forebay Groundwater
Average 486 79 15.73 58.5 195 62.7 129 7.7 Median 487 80 15.79 58.8 200 65.3 122 7.69 X25 453 72 14.56 54.1 194 56.4 114 7.59 X75 523 84 17.19 62.6 205 69 136 7.84 Standard Deviation 39.8 7.3 2.9 6.0 15.6 8.0 22.5 0.2
Piper and Garrett (1953)
Average 287 43 12.38 44.6 71.7 14 12.4 NA Median 273 48 13.6 34.8 75.1 11.8 10.6 NA X25 236 33 7.25 28.2 61.6 7.35 7.4 NA X75 330 55 18.05 60.1 82.9 22.2 15.4 NA Standard Deviation 68.9 17.6 6.7 23.0 14.5 9.0 6.6 NA
Whittier Narrows Underflow
Values NA 60.7 17.5 83.3 NA 107.3 60.7 NA

33
The data presented in Table 3 represent the general groundwater characteristics for each of the
four hydrochemical facies in the Central Basin.
Table 3 - Represent the average concentration for each of the analytes within each of the four hydrochemical facies of the Central Basin. *X25 and X75 represent the variation from the mean.
Section TDS Ca Mg Na HCO3 SO4 Cl pH
Montebello Forebay
Average 475.5 72.8 19.8 60.3 249.8 88.7 74.1 7.6 Median 523.5 83.9 17.0 58.8 215.0 125.4 68.8 7.4 X25 469.5 70.9 14.4 45.0 189.3 114.8 57.5 7.3 X75 573.0 99.1 19.2 74.1 241.8 143.8 88.0 7.7 Standard Deviation 101.1 20.9 7.2 20.3 40.0 21.7 55.6 0.1
Los Angeles Forebay
Average 363.5 61.8 12.4 50.9 190.2 91.5 52.0 5.6 Median 469.5 65.7 18.0 54.0 248.5 83.6 59.8 7.6 X25 383.3 58.4 14.3 45.4 221.8 77.0 23.5 7.5 X75 551.0 86.5 24.1 74.3 261.0 111.6 97.0 7.7 Standard Deviation 273.3 43.4 8.6 57.6 172.5 67.3 37.6 3.3
Northern Pressure Area
Average 397.3 53.9 12.0 71.9 235.1 74.2 51.0 7.6 Median 395.0 52.7 11.6 47.2 215.5 77.5 44.0 7.8 X25 315.8 36.4 7.0 39.3 202.8 49.8 20.7 7.6 X75 502.3 79.3 18.0 83.3 240.5 110.1 66.5 8.0 Standard Deviation 209.3 30.3 7.6 66.5 85.4 45.4 46.4 1.4
Southern Pressure Area
Average 259.8 28.2 3.7 65.6 195.2 24.1 24.0 7.9 Median 260.0 16.3 1.9 59.1 186.0 15.1 15.6 8.2 X25 225.5 7.3 0.6 46.7 170.0 7.5 13.3 7.9 X75 289.8 39.9 5.1 79.0 211.5 41.2 19.7 8.5 Standard Deviation 165.3 31.9 4.2 46.2 118.1 22.1 39.4 1.7

34
Figure 11 - Sulfate concentrations found in the nested groundwater monitoring wells in the Montebello Forebay of the Central Basin.
Mon
tebe
llo F
oreb
ay: S
ulfa
te v
s C
hlor
ide
(mg/
L)
050100
150
200
250
020
4060
8010
012
014
0
Chl
orid
e (m
g/L)
Sulfate (mg/L)
Pipe
r and
Gar
rett
(195
3)
Mon
tebe
llo F
oreb
ay
Spre
adin
g C
ente
rs
Whi
ttier
Nar
row
s
Impo
rted
Wat
er
Rec
laim
ed
Sulfa
te

35
Figure 12 - Sulfate concentrations found in the nested groundwater monitoring wells in the Northern Pressure area of the Central Basin.
Nor
ther
n Pr
essu
re A
rea:
Sul
fate
vs
Chl
orid
e (m
g/L)
020406080100
120
140
160
180
020
4060
8010
012
014
016
018
020
0
Chl
orid
e (m
g/L)
Sulfate (mg/L)
Pip
er a
nd G
arre
tt (1
953)
Mon
tebe
llo F
oreb
ay
Spr
eadi
ng C
ente
rs
Whi
ttier
Nar
row
s
Impo
rted
Wat
er
Rec
laim
ed
Sul
fate

36
Figure 13 – Calcium concentrations found in the nested groundwater monitoring wells in the Montebello Forebay of the Central Basin.
Mon
tebe
llo F
oreb
ay: C
alci
um v
s C
hlor
ide
(mg/
L)
020406080100
120
140
160
020
4060
8010
012
014
0
Chl
orid
e (m
g/L)
Calcium (mg/L)
Pipe
r and
Gar
rett
(195
3)
Mon
tebe
llo F
oreb
ay
Spre
adin
g C
ente
rs
Whi
ttier
Nar
row
s
Impo
rted
Wat
er
Rec
laim
ed
Cal
cium

37
Pipe
r and
Gar
rett
(195
3)
Mon
tebe
llo F
oreb
ay
Spre
adin
g C
ente
rs
Whi
ttier
Nar
row
s
Impo
rted
Wat
er
Rec
laim
ed
Cal
cium
Figure 14 – Calcium concentrations found in the nested groundwater monitoring wells in the Northern Pressure Area of the Central Basin.
Nor
ther
n Pr
essu
re A
rea:
Cal
cium
vs
Chl
orid
e (m
g/L)
050100
150
200
250
300
020
4060
8010
012
014
016
018
020
0
Chl
orid
e (m
g/L)
Calcium (mg/L)

38
Pip
er a
nd G
arre
tt (1
953)
Mon
tebe
llo F
oreb
ay
Spr
eadi
ng C
ente
rs
Whi
ttier
Nar
row
s
Impo
rted
Wat
er
Rec
laim
ed
Sod
ium
Figure 15 – Sodium concentrations found in the nested groundwater monitoring wells in the Montebello Forebay of the Central Basin.
Mon
tebe
llo F
oreb
ay: S
odiu
m v
s C
hlor
ide
(mg/
L)
050100
150
200
250
300
350
020
4060
8010
012
014
0
Chl
orid
e (m
g/L)
Sodium (mg/L)
39
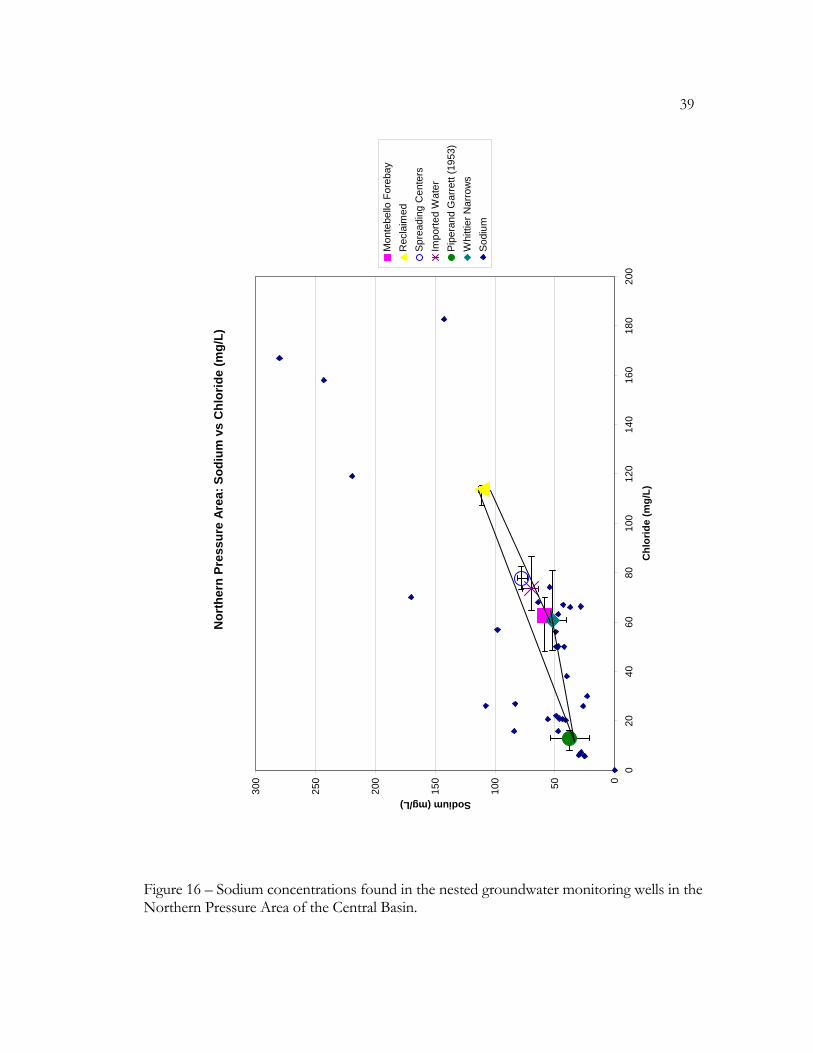
Figure 16 – Sodium concentrations found in the nested groundwater monitoring wells in the Northern Pressure Area of the Central Basin.
Nor
ther
n Pr
essu
re A
rea:
Sod
ium
vs
Chl
orid
e (m
g/L)
050100
150
200
250
300
020
4060
8010
012
014
016
018
020
0
Chl
orid
e (m
g/L)
Sodium (mg/L)
Pipe
rand
Gar
rett
(195
3)
Mon
tebe
llo F
oreb
ay
Spre
adin
g C
ente
rs
Whi
ttier
Nar
row
s
Impo
rted
Wat
er
Rec
laim
ed
Sodi
um

40
Results
Comparing the groundwater data collected by Piper and Garrett from 1948 to 1952
(Piper and Garrett, 1953) to the data collected by the WRD and the USGS from 1995 to 2002
for the Montebello Forebay and the Northern Pressure Area to investigate the possibility of
the mineral dissolution of gypsum, halite and/or calcite induced by the current practice of
artificial recharge. The Southern Pressure Area was excluded from investigations based on the
tritium data findings published by the USGS in 2003 (Riechard et al., 2003) that indicated that
the water used for artificial recharge has not infiltrated the area (Figure 10).
Figures 17 and 18 indicate that the concentrations of the specified analytes have
increase in concentration over the last 45 years. The most significant increase is in the
concentrations of total dissolved solids and sulfate concentrations at 65% and 719%,
respectively, for the Montebello Forebay and 58% and 668 %, respectively, for the Northern
Pressure Area. Bicarbonate concentrations have increase on average by 22% in the Montebello
Forebay and by 318% in the Northern Pressure Area. The increases in anion, cation and TDS
concentrations are similar to the findings of Rinick-Pfeiffer et al. (2000), Stuyfzand and Juhasz-
Holterman (2004), and Guo and Wang (2004).

41
65
91
18
68
17
208
321
6983
17
70
123
256
530
0
100
200
300
400
500
600
Na Ca Mg Cl SO4 HCO3 TDS
Cations and Anions
Con
cent
ratio
n (m
g/L)
MF-1
MF-2
Figure 17 - Comparison of Historical and the Present Average Groundwater Chemical Signatures in the Montebello Forebay (MF1 – Historical Average; MF2 Current Average).

42
3153
15 12 14
74
280
5272
17
60
91
228
440
0
100
200
300
400
500
600
Na Ca Mg Cl SO4 HCO3 TDS
Cantions and Anions
Con
cent
ratio
n (m
g/L)
NPA-1
NPA-2
Figure 18 – Comparison of Historical and the Present Average Groundwater Chemical Signatures in the Northern Pressure Area (NPA1- Historical Average; NPA2 Current Average). Figure 19 illustrates the range of groundwater pH values for the San Pedro aquifers
across the Central Basin. The modeled distribution of the pH values is similar to that of the
tritium data (Figure 10) collected by the USGS (Riechard et al., 2003 and Riechard et al., 2002).
This appears to indicate a correlation between the pH of the groundwater and the extent at
which the artificial recharge water has infiltrated into the basin. In addition, the pH values of
the Southern Pressure Area (pH 8.2 to 8.9) likely represents the pH value of the native

43
groundwater of the Central Basin as artificial recharge water has not infiltrated into this region
of the basin. Furthermore, the distribution presented in Figure 19 is reflected in the majority
of the contour concentrations maps of calcium, bicarbonate, sulfate and sodium for the
aquifers of the San Pedro Formation (Appendix A). Lowering of the pH values would
increase the solubility of the groundwater and therefore increase the possibility of mineral
dissolution within the aquifers of the Montebello Forebay and Northern Pressure Area.
Figure 19, displayed above, and the concentration contour maps attached in Appendix
A, show that groundwater concentrations of the specified analytes and the pH values have
increased over the last 45 years. To investigate further into whether these increases are due to
mineral dissolution, the mixing graphs were composed (Figures 11 through 16). If mineral
dissolution is occurring, the plotted concretions of the specified ion will lie outside of the
range of the ion concentrations of the native groundwater, imported water, recycled water, the
water flowing between the Whittier Narrows from the San Gabriel Basin (Figures 11 through
16). The error bars (X25 and X75; Table 2) represent the measured range of concentrations
from each of the waters described.

44
Figure 19 – Current pH levels of the groundwater of the Aquifers of the San Pedro Formation (Contour Interval = 0.1). The patterns or location of the project points plotted on Figures 11 through 16
indicated that there is no reason to invoke significant mineral dissolution/precipitation to

45
explain the temporal variation (Figure 21) in the chemistry of the groundwater for the
Montebello Forebay and Northern Pressure Area. If mineral dissolution was occurring in the
Central Basin, the projected points would plot outside of the range of the end members within
multiple figures. The few “outliers” that are plotted along the chloride axes represent the
introduction of reclaimed water into the system. Other outliers along the sulfate (Figure 11)
and calcium (Figure 12) axes in the Montebello Forebay are still within the plausible range of
the imported water and do not consistently lie outside of the plausible range within the other
figures (Figures 13 through 16) to suggest mineral dissolution.
Figures 11 and 12 plot the concentrations of sulfate to chloride ratios recorded for the
groundwater samples obtained from the groundwater monitoring wells located in the
Montebello Forebay and the Northern Pressure Area. The majority of project well points for
sulfate plotted in Figure 11 are clustered around the point plotted for the Spreading Centers
were as the project well points for sulfate plotted in Figure 12 are plotted between the plotted
spreading centers point and the plotted point of Piper’s and Garrett’s data (Piper and Garrett,
1953). The visual pattern displayed in these two figures indicates that the hydrochemical facies
of the groundwater within the individual aquifers of the Lower and Upper San Pedro
Formation is more related to the distance from the spreading centers than the depth of the
aquifer. This is in accordance with the geology of the Montebello Forebay, as there are no or
very few confining layers in the Montebello Forebay between the aquifers. Furthermore the
aquifers of the Lower and Upper aquifers shallow and in some regions merge in the
Montebello Forebay as indicated in Figures 5 and 8. For example, the pattern plotted in
Figure 11 indicated that the hydrochemical facies of the groundwater in the Montebello
Forebay is more representative of the water placed in the spreading centers than that of the

46
hydrochemical facies of that recorded by Piper and Garrett (Piper and Garret, 1953). Moving
down gradient or away from the spreading centers, located in the Montebello Forebay, into the
northern pressure area of the basin, the pattern of plotted points indicate that of mixing
between the water of the spreading center and that of “original” groundwater characteristics.
This same pattern of the plotted points shown in Figures 11 and 12 is repeated in Figures 13
and 14 (Calcium vs. Chloride) and Figures 15 through 16 (Sodium vs. Chloride).
To expand upon this observation, only the project well plot points of sulfate vs.
chloride concentrations in the Southern Pressure Area (Figure 20). As indicated in the tritium
data collected by the USGS (Riechard et. al, 2003) and pattern of mixing indicated by Figures
11, 12, 20, and 21 show that the hydrochemical facies of the groundwater of the Upper and
Lower San Pedro Formation is more characteristic of the “native” groundwater of the central
basin than that of the water of the spreading centers.
The observed pattern of mixing is again supported by the piper diagram displayed
below (Figure 21). This figure illustrates the phase of mixing between the artificial recharge
water and that of the nature hydrochemical facies of the Central Basin recorded by Piper and
Garrett (Piper and Garrett, 1953). Over a given period of time, the groundwater of the
aquifers of the San Pedro Formation within the southern pressure area will become more
representative of the hydrochemical facies of the water used for artificial recharge than that of
the hydrochemical facies observed by Piper and Garrett in the late 1940s and early 1950s.

47
Pipe
r and
Gar
rett
(195
3)
Mon
tebe
llo F
oreb
ay
Spre
adin
g C
ente
rs
Whi
ttier
Nar
row
s
Impo
rted
Wat
er
Rec
laim
ed
Sulfa
te
Figure 20 - Sulfate vs. Chloride Concentrations found in the nested groundwater monitoring wells in the Southern Pressure Area of the Central Basin.
Sout
hern
Pre
ssur
e Ar
ea: S
ulfa
te v
s C
hlor
ide
(mg/
L)
020406080100
120
140
160
180
050
100
150
200
250
Chl
orid
e (m
g/L)
Sulfate (mg/L)

48
Northern Pressure Area
Montebello Forebay
Figure 21 – Central Basin San Pedro Formation Aquifer Piper Diagram. The hollow squares represent the hydrochemical facies of the groundwater in the Montebello Forebay; the solid circles represent the hydrochemical facies of the groundwater found in the Northern Pressure Area; and the crosses represent the hydrochemical facies of the groundwater found in the Southern Pressure Area. The arrow represents the hydrologic flow of the groundwater from the Montebello Forebay to the Southern Pressure Area.

49
CHAPTER 6
DISCUSSION
Physical Indicators
Long-Term Pumping: Studies on the effects of long-term pumping on changes in
transmissivity were conducted by the USGS, in cooperation with the Arkansas Geological
Commission and the Arkansas Soil and Water Conservation Commission (Stanton et al.,
2000). The test was designed to replicate an aquifer test performed in 1947, thereby enabling
evaluation of any changes in hydraulic properties (transmissivity) and possible compaction of
the Sparta aquifer over the intervening 52 years of intensive water use. The results of the study
indicated that the transmissivity values computed from the 1999 aquifer test (drawdown and
recovery data) are in close agreement with the 1947 transmissivity values. The results of this
study indicate that there is no significant change in transmissivity due to long-term pumping.
Seasonal Fluctuations: Bawden et al. (2001), using satellite imaging, observed seasonal
fluctuations in the surface elevation of the Los Angeles Basin induced by season pumping
trends of groundwater. Such seasonal elevation oscillation brought about by the dewatering or
depressurizing the major aquifers of the basin could potentially result in the re-organization,
“packing” or fracturing of the matrices aquifers affecting the hydraulic conductivity of the
aquifers (Bawden et al., 2001). The fluctuation in elevation could also affect the thickness of
the aquifers which would intern influence the transmissivity of the major aquifers in the basin.
However, with a maximum gain in elevation of 2.3 m (7.6 ft) in various areas of the basin this

50
increase in potential thickness of the aquifers does not mathematically match the observed
change in transmissivity. Furthermore, it is not possible to determine which set of aquifers
were swelling based upon the data collected by Bawden et al. (2001).
Screen Intervals and Well Construction: There are approximately 550 production
wells throughout the Central Basin. A review of 440 groundwater production well records
obtained through the Department of Health Services, WRD and USGS, indicated that
approximately 75% of these wells are screened across multiple aquifers and have been active
for a minimum of 10 years. Pumping rates of the wells vary from the lower 545 m3/day too
26,160 m3/day (100s to 4,800 gpm). Based upon personal communications with the WRD
and the USGS (WRD communicate, June 2004), the activity of drilling and instillation of these
wells has perforated what hydraulic boundaries that exists between the “semi-confined
aquifers” between the transitional boundary of the Montebello Forebay and Northern Pressure
Area. These points of perforation have therefore become “new” points of hydraulic
communication between permeable matrixes (aquifers) that had not previously existed as
illustrated by Figure 22.

51
Figure 22 – Generalized Cross-Section/Screen Interval - Represents a generalize cross-section that illustrates how the installation of groundwater well screens across multiple aquifers could act as hydraulic conduits and affect the calculated transmissivity values recorded during an aquifer test.

52
Chapuis and Chenaf (2003) published a paper on the effects of monitoring wells and
pumping well pipe capacities on aquifer tests in confined aquifers. The findings of this study
indicated that the calculated transmissivity value based upon data collected from
pumping/aquifer tests can be influenced by water storage in monitoring and pumping wells
and can be used as a hydraulic conduit between aquifers. Therefore, the data collected during
a prolonged aquifer test could be potentially influenced by such an effect and would result in
unrepresentative data of the true values for transmissivity.
Further possible influences that could effects the data collected during the aquifer tests
is the added variable of screen intervals of other productions wells within the vicinity of the
cone of depressions (sphere of influence) of the well that is being pumped. These wells,
screened across multiple aquifers (Jefferson, Lynwood, etc.), would draw water from additional
aquifers and further influence the data collected during the duration of the aquifer test.
Comparing the modeled transmissivity map (Figure 2) to the Aquitard Thickness Map (Figure
23) that illustrates the hydrologic confining layer between the Silverado and the Lynwood
Aquifers, an observed pattern of increase in transmissivity is similar to the aquitard thickness
map.

53
Figure 23 – Aquitard Thickness Map represents the aquitard between the Silverado and Lynwood Aquifers across the Central Basin. The zones represent the thickness of the aquitard between the two aquifers. Therefore, the data used to construct the transmissivity map are possibly influenced by
the installation of multiple wells across the basin over the last seventy years and do not truly
reflect the true transmissivity of the aquifers of the San Pedro Formation.

54
CHAPTER 7
CONCLUSIONS
Conclusions
The findings of this thesis indicate that:
• The chemistry of artificial recharged waters does not appear to be of sufficient pH to
induced mineral dissolution or precipitations of gypsum, feldspars, calcite or halite in
the aquifers of the San Pedro Formation of the Central Basin.
• The hydrochemical facies of the Montebello Forebay represent the water
characteristics of the imported where the groundwater in the Northern Pressure Area
represents a broad zone of mixing between the native groundwater and the water
being used for artificial recharge (Figures 11 through 16, Figures 20 and 21, and
Appendix B).
• There is no supporting evidence of a direct relationship between the observed change
in transmissivity in the Silverado and Lynwood aquifers of the San Pedro Formation
(Figure 2) and mineral dissolution induced by the practice of artificial recharge in the
Central Basin.
• The observed changes in transmissivity are more likely due to the numerous wells in
the Central Basin being screened across multiple aquifers. Therefore, in areas where
the confining units are thin between the major aquifers of the San Pedro Formation, it

55
is more likely to affect the values recorded during pump tests that in turn affect the
calculated value of transmissivity, resulting in a false inflation in the values recorded for
transmissivity.

56
CHAPTER 8
FUTURE RESEARCH
Future Research In conclusion the observed change in transmissivity is not related to geochemical
reactions and therefore it must be related to physical changes that have occurred within the
Central Basin over the last seventy years. Plausible physical changes that could affect
transmissivity values are long-term pumping, the installment of numerous wells screened
across multiple aquifers, and seasonal groundwater fluctuations. Another plausible factor to
consider is how the technological advancements in groundwater well construction and drilling
methods would affect the values recorded during aquifer testing. Further investigation into the
hydraulic properties and physical parameters of the aquifers of the San Pedro Formation are
needed to fully understand and assess the observed results presented in this thesis for the
betterment of Southern California’s potable groundwater supply.

57
APPENDIX A
Current and Historical Concentration Graphs

Appendix A Figure 1 – Site Map indicating the well location of the wells installed by the USGS and WRD from 1995 to 2002. The information from these wells were used to model the “current concentration maps.”

59
Appendix A Figure 2- Current concentration of calcium (mg/L) within the groundwater of the aquifers of the San Pedro Formation (Contour Interval = 10 mg/L).

60
Appendix A Figure 3 – Current Concentration of Magnesium (mg/L) of the groundwater of the Aquifers of the San Pedro Formation (Contour Interval = 5mg/L).

61
Appendix A Figure 4 – Current Concentration of Sodium (mg/L) of the groundwater of the Aquifers of the San Pedro Formation (Contour Interval = 10 mg/L).

62
Appendix A Figure 5 – Current Concentration of Bicarbonate (mg/L) of the groundwater of the Aquifers of the San Pedro Formation (Contour Interval = 10 mg/L).

63
Appendix A Figure 6 – Current Concentration of Chloride (mg/L) of the groundwater of the Aquifers of the San Pedro Formation (Contour Interval = 10 mg/L).

64
Appendix A Figure 7 – Current Concentration of Sulfate (mg/L) of the groundwater of the Aquifers of the San Pedro Formation (Contour Interval = 5 mg/L).

65
Appendix A Figure 8 – Current Concentration of Total Dissolved Solids (mg/L) of the groundwater of the Aquifers of the San Pedro Formation (Contour Interval = 10 mg/L).

66
Appendix A Figure 9 – Site Map indicating the well location of the wells used in Poland’s work Native and Contaminated Groundwater from Torrance to Santa Ana (Piper and Garrett, 1953). The information from these wells were used to model the “historical concentration maps.”

67
Appendix A Figure 10 – Historical Concentration of Calcium (mg/L) of the groundwater of the Aquifers of the San Pedro Formation (Piper and Garrett, 1953). (Contour Interval = 10mg/L).

68
Appendix A Figure 11 – Historical Concentration of Sodium (mg/L) of the groundwater of the Aquifers of the San Pedro Formation (Piper and Garrett, 1953) (Contour Interval = 5 mg/L).

69
Appendix A Figure 12 – Historical Concentration of Magnesium (mg/L) of the groundwater of the Aquifers of the San Pedro Formation (Piper and Garrett, 1953) (Contour Interval = 10 mg/L).

70
Appendix A Figure 13 – Historical Concentration of Bicarbonate (mg/L) of the groundwater of the Aquifers of the San Pedro Formation (Piper and Garrett, 1953) (Contour Interval = 10 mg/L).

71
Appendix A Figure 14 – Historical Concentration of Chloride (mg/L) of the groundwater of the Aquifers of the San Pedro Formation (Piper and Garrett, 1953) (Contour Interval = 10 mg/L).

72
Appendix A Figure 15 – Historical Concentration of Sulfate (mg/L) of the groundwater of the Aquifers of the San Pedro Formation (Piper and Garrett, 1953)(Contour Interval = 5 mg/L).

73
Appendix A Figure 16 – Historical Concentration of Total Dissolved Solids (mg/L) of the groundwater of the Aquifers of the San Pedro Formation (Piper and Garrett, 1953) (Contour Interval = 200 mg/L).

74
APPENDIX B
MIXING GRAPHS

75
Appendix B Figure 1 – Magnesium concentrations found in the nested groundwater monitoring wells for the Montebello Forebay Area of the Central Basin.
Mon
tebe
llo F
oreb
ay: M
agne
sium
vs
Chl
orid
e (m
g/L)
05101520253035
020
4060
8010
012
014
0
Chl
orid
e (m
g/L)
Magnesium (mg/L)
Pip
er a
nd G
arre
tt (1
953)
Mon
tebe
llo F
oreb
ay
Spr
eadi
ng C
ente
rs
Whi
ttier
Nar
row
s
Impo
rted
Wat
er
Mag
nesi
um
Rec
laim
ed

76
Appendix B Figure 2 – Bicarbonate concentrations found in the nested groundwater monitoring wells for the Montebello Forebay Area of the Central Basin.
Mon
tebe
llo F
oreb
ay: B
icar
bona
te v
s C
hlor
ide
(mg/
L)
0
100
200
300
400
500
600
700
800
900
020
4060
8010
012
014
0
Chl
orid
e (m
g/L)
Bicarbonate (mg/L)
Pip
er a
nd G
arre
tt (1
953)
Mon
tebe
llo F
oreb
ay
Spr
eadi
ng C
ente
rs
Impo
rted
Wat
er
Bic
arbo
nate
Rec
laim
ed

77
Pip
er a
nd G
arre
tt (1
953)
Mon
tebe
llo F
oreb
ay
Spr
eadi
ng C
ente
rs
Whi
ttier
Nar
row
s
Impo
rted
Wat
er
Mag
nesi
um
Rec
laim
ed
Nor
ther
n Pr
essu
re A
rea:
Mag
nesi
um v
s C
hlor
ide
(mg/
L)
05101520253035
020
4060
8010
012
014
016
018
020
0
Chl
orid
e (m
g/L)
Magnesium (mg/L)

78
Appendix B Figure 3 – Magnesium concentrations found in the nested groundwater monitoring wells for the Northern Pressure Area of the Central Basin.
Appendix B Figure 4 – Bicarbonate concentrations found in the nested groundwater monitoring wells for the Northern Pressure Area of the Central Basin.
Nor
ther
n Pr
essu
re A
rea:
Bic
arbo
nate
vs
Chl
orid
e (m
g/L)
0
100
200
400
500
600
020
4060
8010
012
014
016
018
020
0
Chl
orid
e (m
g/L)
Bicarbona (mg/L)
Pip
er a
nd G
arre
tt (1
953)
Mon
tebe
llo F
oreb
ay
Spr
eadi
ng C
ente
rs
Impo
rted
Wat
er
Bic
arbo
nate
Rec
laim
ed
300
te

79
REFERENCES Asano, T. (1992). "Artificial Recharge of Groundwater with Reclaimed Municipal Wastewater:
Current Status and Proposal Criteria." Water Science Technology 25: 87-92. Avisar, D. and J. F. Clark (2005). "Evaluating travel times beneath an artificial recharge pond
using sulfur hexafluoride." Environmental and Engineering Geosciences 11(4): 309-317.
Batu, V. T. (1999). Aquifer Hydraulics: A Comprehensive Guide to Hydraulic Data Analysis.
New York, John Wiley and Sons. Bawden, G. W., W. Thatcher, et al. (2001). "Tectonic contraction across Los Angeles after
removal of groundwater pumping effects." Nature 412: 812-815. Brose, R. J. and G. J. Dozer (1989). "Groundwater recharge feasibility study of the Mojave
River basins, Mojave Desert, California." Symposium on Artificial Recharge of Groundwater 4: 21-31.
Bull, R. J., C. Gerba, et al. (1990). "Evaluation of the health risks associated with disinfection."
Critical Reviews in Environmental Control 20: 77-113. California, W. R. D. o. S. (Water Year 1971-1972). Regional Groundwater Monitoring Report:
32. Callison, J. (1992). Seawater Barrier. In: The Regressive Pleistocene Shoreline: Coastal
Southern California. South Coast Geological Society. Chapuis, R. P. and D. Chenaf (2003). "Effects of monitoring and pumping well pipe capacities
during pumping tests in confined aquifers." Canadian Geotechnical 40(6): 1093-1103. City of Whittier (2000). City of Whittier Water Quality Technical Bulletin. City of Whittier (2002). City of Whittier Water Quality Technical Bulletin. Davisson, M. L., G. B. Hudson, et al. (1996). Report on the Feasibility of Using Isotopes to
Source and Age Date Groundwater in Orange County Water District's Forebay Region, Orange County, California, Lawrence Livermore National Laboratory Isotope Science Division.

80
Dilon, P. (2002). Banking stormwater, reclaimed water and potable water in aquifers. Proceedings of the International groundwater conference on Sustainable development and management of groundwater resources in semi-arid regions. Netherlands.
Dolan, J. R., K. Sieh, et al. (1997). "Active tectonics, paleoseismology, and seismic hazards of
the Hollywood fault, northern Los Angeles basin, California." Geological Society of America Bulletin 109(12): 1595-1616.
Duffield, G.M. (2004). Aquifer Test Forum: Transmissivity from Specific Capacity. http://www.aquifertest.com/forum/transcap.asp; July 2005. (DWR), C. D. o. W. R. Bulletin No. 104; Planned Utilization of the Ground Water Basins of
the Coastal Plain of Los Angeles County, Appendix A. Ground Water Geology. Faure, G. (1995). Principles of Application of Geochemistry. Fetter, C. W. (2001). Applied Hydrogeology. Upper Saddle River, N.J., Prentice Hall. Freeze, R. A. and J. A. Cherry (1989). Groundwater. Englewood Cliffs, N.J., Prentice-Hall. Guo, H. and Y. Wang (2004). "Hydrogeochemical processes in shallow quaternary aquifers
from the northern part of Datong Basin, China." Applied Geochemistry 19: 19-27. Guymon, G. L., A. C. Bagtzoglou, et al. (1992). "A lumped stream-aquifer model to assess
reclaimed water impacts." Water Resources Bulletin 28(2): 361-370. Harding, T. P. (1973). "Newport-Inglewood trend, California- An example of wrenching style
of deformation." American Association of Petroleum Geologist Memoir 57: 91-116. Herndon, R. L. (1992). Hydrogeology of the Orange County groundwater basin- An overview.
In: The Regressive Pleistocene Shoreline: Coastal Southern California. South Coast Geological Society.
Kulshan, T. V. (2002). Analysis of saltwater intrusion in the West Coast and Central Los
Angeles Basins. Environmental Geology. Palo Alto, Stanford: 198. Lajoie, K.R., Ponti, D.J., et al. (1992) Emergent Marine Strandlines and Associated Sediments,
Costal California; A Record of Quaternary Sea-Level Fluctuations, Vertical Tectonic Movements, Climatic Changes, and Coastal Processes. The Regressive Pleistocene Shoreline; South Coast Geological Conference. Annual Field Trip Guide Book: No. 20.
Leserman, J. R. and W. K. Ferry (1997). Economics of water reclamation of groundwater
recharge and injection. AWWA Annual Conference, Atlanta, GA, American Water Works Association.

81
Los Angeles Regional Water Quality Control Board (1989), http://www.waterboards. ca.gov/losangeles/html/meetings/tmdl/Basin_plan/basin_plan.html, April 2004.
Mendenhall, W. C. (1905a). Development of Underground waters in the Central Coastal Plain
Region of Southern California. Washington D.C., United States Geological Survey. Moran, D. E. and K. H. Wiebe (1992). Holocene deposition and organic soils near Huntington
Beach, Orange County, California. In: The Regressive Pleistocene Shoreline: Coastal Southern California. South Coast Geological Society.
O'Reilly, A. M. (2004). A Method for Simulating Transient Ground-Water Recharge in Deep
Water-Table Settings in Central Florida by Using a Simple Water-Balance/Transfer-Function Model, United States Geological Survey: 49.
Piper, A. M. and A. A. Garrett (1953). Native and contaminated groundwater in the Long
Beach-Santa Ana area, California, United States Geological Survey: 320. Poland, J. F., A. Garrett, et al. (1959a). Geology, Hydrogeology, and Chemical Characters of
Ground Waters in the Torrance-Santa Monica Area, Los Angeles County, California, United States Geological Survey Water Supply Paper.
Quinn, J. P. (1992). Rancho La Brea: Geologic setting, late Quaternary depositional patterns
and mode of fossil accumulation. In: The Regressive Pleistocene Shoreline: Coastal Southern California. South Coast Geological Society.
Richard, J. and G. J. Dozer (1989). Groundwater recharge feasibility study of the Mojave River
basins, Mojave Desert, California. Symposium on Artificial Recharge of Groundwater, Tucson, AZ.
Riechard, E., S. Crawford, et al. (2002). Geological, Hydrological, and Water Quality Data
from Multiple-Well Monitoring Sites in the Central and West Coast Basin, Los Angeles County, California, 1995-2000. Sacramento, USGS: 1-127.
Riechard, E., M. Land, et al. (2003). Geohydrology, Geochemistry, and Groundwater
Simulation-optimization of the Central and West Cost Basins, Los Angeles County, California. Sacramento, California, U S Geological Survey: 1-84.
Rinick-Pfieffer, S. P., S. Dillon, et al. (2002). "Injection Well Clogging Processes during
Aquifer Storage and Recovery (ASR) with Reclaimed Water." Water Research 34: 2110-2119.
Roberts, P. V. and M. Reinhard (1982). "Contaminated transport in the groundwater
environment during recharge of reclaimed water." Bulletin-German Association of Water Resources and Land Improvement 3(13): 347-359.

82
Schroder, R. A. and R. Andres (2003). Transport and Fate of Water-Quality Indicators after 40 Years of Artificial Recharge with Treated Municipal Wastewater to the Central Ground-Water Basin in Los Angeles County. San Diego, United States Geological Survey. 0289: 6.
Sloss, E. M., D. McCaffey, et al. (1994). Groundwater Recharge with Reclaimed Water Birth
outcomes in Los Angeles County, 1982-1993. Los Angeles, Los Angeles Regional Water Quality Control Board.
Stanton, G. P. and P. D. Hays (2000). "The effects of 52 years of ground-water use on
hydraulic properties of the Sparta Aquifer northwest of El Dorado, Arkansas." Geological Society of America 32(3): 42.
Stuyfzand, P. J. and M. A. Juhasz-Holterman (2004). Riverbed filtration in the Netherlands:
well fields, clogging and geochemical reactions. NATO Advance Research Workshop: Clogging in Riverbank Filtrations, Bratislava, Netherlands.
Sumner, D. M. and L. A. Bradner (1996). Hydraulic characteristics and nutrient transport and
transformation beneath a rapid infiltrations basin, Reed Creek Improvement District, Orange County, Florida. Reston, VA, United States Geological Survey: 51.
Thomasson, H. G., F. H. Olmsted, et al. (1960). Geology, water resources and usable ground-
water storage capacity of part of Solano County, California, United States Geological Survey Water Supply Paper.
Toze, S., J. Hanna, et al. (2004). "Determination of water quality improvements due to artificial
recharge of treated effluent." International Association of Hydrological Sciences 285: 53-60.
Water Replenishment District of Southern California (WRD), 1973 Regional Groundwater
Monitoring Report Water Year 1972-1973.: 37. Water Replenishment District of Southern California (WRD), 1974 Regional Groundwater
Monitoring Report Water Year 1973-1974.: 37. Water Replenishment District of Southern California (WRD), 1975 Regional Groundwater
Monitoring Report Water Year 1974-1975.: 37. Water Replenishment District of Southern California (WRD), 1976 Regional Groundwater
Monitoring Report Water Year 197-1976.: 37. Water Replenishment District of Southern California (WRD), 1977 Regional Groundwater
Monitoring Report Water Year 1976-1977.: 37.
83
Water Replenishment District of Southern California (WRD), 1978 Regional Groundwater Monitoring Report Water Year 1977-1978.: 37.
Water Replenishment District of Southern California (WRD), 1979 Regional Groundwater Monitoring Report Water Year 1978-1979.: 37.
Water Replenishment District of Southern California (WRD), 1980 Regional Groundwater
Monitoring Report Water Year 1979-1980.: 37. Water Replenishment District of Southern California (WRD), 1981 Regional Groundwater
Monitoring Report Water Year 1980-1981.: 37. Water Replenishment District of Southern California (WRD), 1982 Regional Groundwater
Monitoring Report Water Year 1981-1982.: 37. Water Replenishment District of Southern California (WRD), 1983 Regional Groundwater
Monitoring Report Water Year 1982-1983.: 37. Water Replenishment District of Southern California (WRD), 1984 Regional Groundwater
Monitoring Report Water Year 1983-1984.: 37. Water Replenishment District of Southern California (WRD), 1985 Regional Groundwater
Monitoring Report Water Year 1984-1985.: 37. Water Replenishment District of Southern California (WRD), 1986 Regional Groundwater
Monitoring Report Water Year 1985-1986.: 37. Water Replenishment District of Southern California (WRD), 1987 Regional Groundwater
Monitoring Report Water Year 1986-1987.: 37. Water Replenishment District of Southern California (WRD), 1988 Regional Groundwater
Monitoring Report Water Year 1987-1988.: 37. Water Replenishment District of Southern California (WRD), 1989 Regional Groundwater
Monitoring Report Water Year 1988-1989.: 37. Water Replenishment District of Southern California (WRD), 1990 Regional Groundwater
Monitoring Report Water Year 1989-1990.: 37. Water Replenishment District of Southern California (WRD), 1991 Regional Groundwater
Monitoring Report Water Year 1990-1991.: 37. Water Replenishment District of Southern California (WRD), 1992 Regional Groundwater
Monitoring Report Water Year 1991-1992.: 37.

84
Water Replenishment District of Southern California (WRD), 1993 Regional Groundwater Monitoring Report Water Year 1992-1993.: 37.
Water Replenishment District of Southern California (WRD), 1994 Regional Groundwater
Monitoring Report Water Year 1993-1994.: 37. Water Replenishment District of Southern California (WRD), 1995 Regional Groundwater
Monitoring Report Water Year 1994-1995.: 37. Water Replenishment District of Southern California (WRD), 1996 Regional Groundwater
Monitoring Report Water Year 1995-1996.: 37. Water Replenishment District of Southern California (WRD), 1997 Regional Groundwater
Monitoring Report Water Year 1996-1997.: 37. Water Replenishment District of Southern California (WRD), 1998 Regional Groundwater
Monitoring Report Water Year 1997-1998.: 37. Water Replenishment District of Southern California (WRD), 1999 Regional Groundwater
Monitoring Report Water Year 1998-1999.: 37. Water Replenishment District of Southern California (WRD), 2000 Regional Groundwater
Monitoring Report Water Year 1999-2000.: 37. Water Replenishment District of Southern California (WRD), 2001 Regional Groundwater
Monitoring Report Water Year 2000-2001.: 37. Water Replenishment District of Southern California (WRD), 2002 Regional Groundwater
Monitoring Report Water Year 2001-2002.: 37. Water Replenishment District of Southern California (WRD), (Winter, 2005) Water Replenishment District of Southern California (WRD), (June 2004) Specific Capacity - A Measure of Well Performance, Well Problems, and Aquifer
Transmissivity: Part 1 of 2. V.2: 2 Wilson, L. G., A. Conroy, et al. (1993). "Fate of chlorination byproducts and nitrogen species
during effluent recharge and soil aquifer treatment (SAT)." Water Environmental Research 65: 726-734.
Wright, T. L. (1991). "Structural geology and tectonic evolution of the Los Angeles basin,
California. In: Biddle, K.T., ed., Active Margin Basins." American Association of Petroleum Geologist Memoir 52: 221-238.

85
Yerkes, R. F., T. H. McCulloh, et al. (1965). Geology of the Los Angeles Basin, United States Geological Survey: 57.