The Effects of Community Policing Practices and Related ...
32
0 The Effects of Community Policing Practices and Related Social Demographic Variables on City Crime Rates The Honors Program Final Senior Capstone Proposal Student’s Name: Keighan Richardson Faculty Sponsor: Professor Gregg Carter May 1 st , 2018
Transcript of The Effects of Community Policing Practices and Related ...

0
The Effects of Community Policing Practices and Related Social
Demographic Variables on City Crime Rates
The Honors Program
Final Senior Capstone Proposal
Student’s Name: Keighan Richardson
Faculty Sponsor: Professor Gregg Carter
May 1st, 2018

1
Abstract
Selected studies show that community policing practices help deter crime, meaning that an
inverse relationship exists between the two of them. This project does an in-depth analysis of this
relationship using a variety of control variables, all of which have been shown to be predictive of
crime. Crime is measured as the total crime rate (violent crimes + property crimes per 100,000
population). The data are city level, and my key control variables include city size, economic
inequality, race, educational level, and strength of gun laws. There are eight variables that define
community policing practices; they correlate strongly in a composite index has been developed
from them. I examine how well this index can predict the total crime rate, taking into
consideration the key control variables. In addition to the control variables, this project is
distinguished by the high quality of the data sets used – including the 2013 Law Enforcement
Management Administrative Statistics (LEMAS) study conducted in 2013 by the Bureau of
Justice Statistics. Key findings include that the proposed hypothesis that community policing
practices has an inverse relationship with crime rates was proven to be untrue by the data
analysis. The relationship is actually a positive relationship; meaning that community policing
practices rises as crime rates do. Another key finding was that the hypotheses for the social
demographic variables were all proven by the data analysis. One particularly important finding
was that gun regulation holds an inverse relationship with crime, as hypothesized, so the stronger
the gun regulation the less crime a city would experience.

2
Table of Contents Abstract…………………………………………………………………………………………...1
Part I: Motivation & Scope……………………………………………………………………...3
Development of Policing Practices…………………………………………………………...3
Community Policing Practices & Crime Rates……………………………………………...4
Control Variables……………………………………………………………………………...8
Poverty………………………………………………………………………………………8
Education……………………………………………………………………………………8
Race………………………………………………………………………………………….9
Gun Control Strength……………………………………………………………………..10
Final Heuristic Explanatory Model…………………………………………………………10
Part II: Data & Measurements………………………………………………………………...11
Population Definition and Unit of Analysis………………………………………………...11
Operational Definitions……………………………………………………………………...12
Part III: Findings……………………………………………………………………………….13
Bivariate……………………………………………………………………………………....13
Community Policing Practices and Total Crime Rate……………………………………...14
Poverty and Total Crime Rate………………………………………………………………15
Education and Total Crime Rate……………………………………………………………15
Race and Total Crime Rate…………………………………………………………………16
Gun Strength and Total Crime Rate………………………………………………………...17
Multivariable Model…………………………………………………………………………17
Part IV: Summary……………………………………………………………………………...18
Part V: References……………………………………………………………………………...19
Part VI: Acknowledgements…………………………………………………………………...22
Part VII: Appendix……………………………………………………………………………..23

3
Part I: Motivation & Scope
Development of Policing Practices
The manner in which policing in the U.S. has adapted over time mimics the development of
policing in England. As early as the colonies, policing was present in what now is the United
States. It took on two forms: informal and communal watch and the private-for-profit policing. In
1636, Boston created a night watch, New York followed in 1658, and Philadelphia in 1700.
Although it was not the most effective manner of controlling crime, a day watch was added in
Philadelphia in 1833 and to New York in 1844 (Potter 2013). The informal policing continued
well after the American Revolution.
It was not until the 1830s that idea of centralized police departments was first introduced
to the United States. Boston established the first American police force in 1838 and following
them was New York City in 1845. By the 1880s all the major cities has police forces in place
(Potter 2013). The characteristics of these departments are that they are publicly supported,
police officers are full-time employees, the departments developed permanent and fixed rules
and procedures, and they are held accountable to a central governmental authority. A key reason
for the need for police departments was urbanization. Informal watch and constable systems
could no longer handle and control the disorder as the cities grew in size and number. In addition
to the growth of populations, there were accounts that crime was increasing in these urban areas.
At the time, it was primarily mob violence directed at immigrants and African Americans.
Today, a lot of research has been done on what the best way of policing a community is and one
of the areas of examination are community policing practices.
In 1994, the United States Department of Justice instituted the Community Oriented
4
Police Service (COPS) Office whose mission is to improve public safety by the practice of
community policing. These practices attempt to involve addressing the root causes of criminal
and disorderly behavior, instead of responding to crimes after they have been committed. The
goal of community policing is to prevent crime and the atmosphere fear that are created by it.
Additionally, the practices promote the use of operational strategies and the development of
mutually beneficial relationships between the communities and the police officers that serve
these areas. These relationships make individuals in the communities stakeholders in their own
safety, law enforcement can better address the community’s needs, and the factors that lead to
crime (“Community Policing: FY 2017 Budget Request At A Glance”). The COPS Office has
programs that provide funding to more than 13,000 of the 16,000 law enforcement agencies.
With this funding more than 700,000 law enforcement personnel and community members have
been trained in community policing practices. This training includes crime controlling strategies,
police ethics and integrity, terrorism prevention and preparedness, school safety, partnership
building, problem-solving, and crime analysis. As of 2017, the COPS office has funded the
training of over 127,000 officers (“Community Policing: FY 2017 Budget Request at a Glance”).
Additionally, the office ensured that more than 4,736 additional law enforcement officer jobs
were created or saved.
Community Policing Practices & Crime Rates
Many current violent events ─ like the 2014 shooting of Michael Brown in Ferguson, MO, and
the shooting of police officers in 2015 that resulted from that specific shooting, as well as
incidents in Cleveland and Staten Island where there was use of deadly force by police officers ─
illustrate that new approaches to community-police relationships are sorely needed. A report
5
conducted by the Justice Department on policing in Ferguson revealed how bias can become
pervasively embedded in law enforcement practices on a local level (Maximino 2015).
A 2014, meta-study by Gill and her colleagues examined 25 different studies that
contained 65 independent assessments before and after the introduction of community-policing
practices (Gill et al. 2014). The findings from this article included that community policing
practices have a positive effect on citizen satisfaction, perception of disorder, and police
legitimacy. Other findings included only limited effects on crime reduction; in 27 of the 65
comparisons where official crime outcomes were analyzed, community policing was associated
with a 5% to 10% reduction in crime. Overall, approximately 80% of the studies of police trust
found that this was increased by community policing programs. Finally, the Gill et al. Meta-
analysis revealed that there is no evidence that community policing decreases citizens’ fear of
crime.
One way that the COPS office has attempted to reduce crime rates is through the carrot-
and-stick approach, which includes an increase in funding for school and community
development agencies especially for those that take teens and young adults off the streets by
recreational, educational, and job placement programs.
An example of a successful carrot-and-stick approach program is the Boston Gun Project
(BGP), which began in May of 1996. The goal of the project was to reduce gun violence by
disarming gang members. Prior to this project the homicides of those under 24 years of age
increased 230% from 1987 to 1990. From 1991 to 1995 the rates remained high at an average 44
youth homicides a year (Carroll & Madden 2012: 95-7). The Project sent gang unit police,
community agency street workers, and clergy to schools and street corners where gang members
frequented. The intention was to send a message that if you use a gun you will suffer the
6
maximum consequences and that if you carry a gun then law enforcement will find you and the
judicial system will make you suffer. The BGP involved close cooperation with the Federal
Bureau of Alcohol, Tobacco and Firearms (ATF) and the Boston Police Department. The carrot
side of this operation was to created and help street youths get job training and eventual job
placement through the Boston Private Industry Council (Carter 2017: 158-60). In 2001,
researchers at Harvard University and the City University of New York deemed the project a
huge success as there was a 63% decrease in youth homicides in Boston in the first two years.
Additionally, there was a decrease in the reports of “shots fired” called into the police and a
decrease in gun-assault incidents (Carter 2017: 159). All these reductions could not be attributed
to any other factors.
Similar program in East Los Angeles, Chicago, Kansas City in the late 1990s also
proved successful. As such, “direct patrol” strategies are now seen as critical in combating gun
crime. These projects led to the broader and more comprehensive Safe Neighborhoods initiative
from the U.S. Department of Justice.
The importance of community policing is highlighted in a study by Eck and Maguire
(2000). These researchers found that it is a misconception that increased spending on the police
automatically leads to a reduction in the crime rate. They found that the increasing in the size of
the police force so as to respond faster to 911 calls, to hire more unfocused random patrols, and
to increase arrests did not reduce serious crime. They observe that to reduce serious crime, there
needs to be community policing that pays attention to crime risk factors. The use of direct
community policing and proactive arrests have shown to reduce and prevent serious crime. The
police have the potential to impact crime and prevent it; however, only if certain methods are
used in certain conditions

7
To further this point, Braga, Welsh, and Schnell (2015) found that disorder-policing
strategies consistently reduce a variety of types of crimes. The term disorder-policing refers to
police focusing on social and physical disorder when attempting to reduce the serious crimes in a
neighborhood. There are different types of this kind of policing and they include community
policing, problem-oriented policing, third-party policing, and hot spot policing. The study
recommends that police departments should continue to use this type of policing as a way to
reduce their crime rates. However, aggressive order maintenance strategies that specifically
target individuals’ behavior does not have a large effect on the crime rate. In contrast, those
community-problem-solving techniques that seek to change the disorder conditions, such as
youth unemployment, can result in significant reductions in crime (they call this the “community
corporation model”).
Johnson (2017) studied the effects of the implementation of community policing on
crime in 9 communities of Carteret County, North Carolina. A correlational analyses revealed
that there were significant inverse associations between community-oriented policing and the
violent crime rates, crime clearance rates, and the property crime clearance rate. However, she
found no statistically significant correlations between crime rates and their clearance rates with a
variety of specific aspects of community policing including community policing policies,
community police training, mission statements including community policing, problem solving
activities, and community partnerships (for how these are measured see Part 2 of this project
Data & Measurements).
The Johnson study and the Gil et al. study noted above indicate a lack of relationship
between crime and several variables measuring community policing; similarly insignificant
findings are reported in Sozer (2008) and Roh et al. (1996).

8
In sum community policing is clearly associated with better feelings in the community about the
police and their actions, but, in the words of Gill (2014): “it is plausible…that COP [community
oriented policing] has no effect on crime.” This study will see if an inverse relationship between
community policing practices and crime exists.
Control Variables
Poverty
Violent and property crime have long been associated with poverty. (For textbook discussions
see, e.g., Crone 2016: 145, 290; Eitzen and Leedham 2004: 190). For example, Witt, Clark and
Fielding (1999) found that changes in the unemployment rate significantly affect street crime,
with falling rates reducing crime; they also found that rising weekly earnings for fulltime
working men reduces the crime rate. Relatedly, in an analysis of the National Crime
Victimization Surveys of 2008-2012, Harrell et al. (2014) found a strong association between
poverty and being the victim of violent crime.
Education
Jones-Webb and Wall (2008) report that a number of “studies have found that crime rates are
higher in neighborhoods with lower educational attainment.” In confirmation of this observation,
the Alliance for Excellent Education (2013) has calculated that the nation could save up to $18.5
billion in annual crime costs if the high school male graduation rate increased by 5 percentage
points. The Alliance report includes a state-by-state breakdown of estimated annual crime

9
savings; for example, savings vary from $14 million in New Hampshire to $215 million in
Nevada to $2.4 billion in California. The same increase in male high school graduates could also
decrease the overall annual number of assaults by almost 60,000; larceny by more than 37,000;
motor vehicle theft by more than 31,000; and burglaries by more than 17,000. Additionally
almost 1,300 murders, more than 3,800 occurrences of rape, and more than 1,500 robberies could
be prevented. Finally, Crone (2016:144-145) summarizes his review of the education-crime
literature with the observation that increasing education provides individuals “an avenue that will
provide them with skills that could give them good paying jobs, hence decreasing their incentive
to opt for criminal careers.”
Race
As in the case of poverty, violent and property crime have long been associated with the racial
structure of communities. More specifically, a high percentage of African Americans in a
community is associated with higher crime rates.
Homicide is the leading cause of death for young African-American men ages 15 to 34
(Center for Disease Control 2017); this rate is 12 times that for white men (Carter 2017:12;
Jones-Webb and Wall 2008). In an empirical study of 3,915 census blocks in ten major U.S.
cities, Jones-Webb and Wall (2008) found that social disadvantage is key in understanding why
the increasing proportion of African-Americans in a neighborhood or community is associated
with higher violent crime. More specifically, high proportions of African-Americans in a
community are associated with low levels of education and income, and with high levels of
female-headed households, which are in turn very strong predictors of homicide. Social
disadvantage theory suggests that homicide rates are higher in neighborhoods with a large
10
number of single-parent families as they have less time and resources to focus on family
behavior and social order in their communities.
Gun Control Strength
Advocates of strong gun control support their arguments with evidence that reveals a strong
inverse relationship between the strength of gun control laws and violent deaths. Thus, stronger
laws means fewer violent deaths, especially gun related deaths. For example, Carter (2017: 23)
shows that those states with a letter grade of A or B for the strength of firearms legislation as
graded by the Law Center to Prevent Gun Violence have a firearm death rate per 100,000
population of 6.4 (gun-related deaths from homicide, suicide, and accidents), while those states
with a letter grade of C or D have a rate of 10.4, and those states of a letter grade of F have a rate
of 14.3. Similarly, at the cross-national level the U.S. homicide rate, in general, and the murder-
by-gun rate, in particular, are dramatically higher than the comparable rates in other
industrialized democracies – such as those of Western Europe, Australia, Canada, and New
Zealand. Hemenway and Miller (2000) and Carter (2017: 8-11), among other researchers, link
the higher death rates in the U.S. to its relatively lax gun laws compared to the laws that exist in
its peer nations.
Final Heuristic Explanatory Model
The preceding literature review is summarized in the following Heuristic sketch:

11
Part II: Data & Measurements
Population Definition and Unit of Analysis
The data set created for the present study uses a variety of sources at the city-level analysis. A
U.S. city was included if it appeared in the Bureau of Justices Statistics LEMAS data file and
had a population of at least 10,000 people in 2013. LEMAS (“Law Enforcement Management
Administrative Statistics” date set) is a 2013 data set that gathers data from all 3,000 state and
local law enforcement agencies that employ at least 100 sworn officers, as well as a nationally
representative sample of smaller agencies. “Data obtained include agency responsibilities,
operating expenditures, job functions of sworn and civilian employees, officer salaries and

12
special pay, demographic characteristics of officers, weapons and armor policies, education and
training requirements, computers and information systems, vehicles, special units, and
community policing activities” (Bureau of Justice Statistics 2018). The LEMAS data set
provided information needed to create my community policing variables.
2013 crime data were taken from the FBI’s Uniform Crime Report (FBI 2014)
Data for my poverty, education, and race variables were taken from the American
Community Survey 5 year samples (US Census Bureau 2017).
Finally, data on the strength of gun control laws were taken from Carter (2017: 303-305).
Note that even though my unit of analysis is the city, the letter grade for strength of gun laws is
as at the state level; thus, every city in the same state, will get the same letter grade. Also, note
that the letter grades taken from Carter (2017) were translated into standard GPA numeric
equivalents (F=0; D-= 0.7;D=1.0; D+= 1.3;C-+ 1.7; C=2.0; C+=2.3; B-=2.7; B=3.0; B+=3.3; A-
= 3.7; A=4.0).
The final SPSS file contains 792 cities with full data on all variables.
Operational Definitions
Variable Description
Community Policing Practices (CPP)
COM_MIS2
COM_TRN_REG2
COM_TRN_INSRV2
COM_SARA2
8 different measures for CPP all coded 0=1
COM_MIS2: Community policing component in
mission statement; recoded as if 1=0; 2=0; 3=1
COM_TRN_REG2: At least 8 hours of community
policing training for recruits; recoded as if 3-5=0; 1-
2=1
COM_TRN_INSRV2: At least 8 hours of in-service
community policing training; recoded if 3-5=0; 1-2=1
COM_SARA2: SARA type problem-solving projects
actively encouraged; recoded if 2=0; 1=1

13
COM_COL2
COM_PTRN2
COM_BT2:
COM_SURV2:
*COMM_POLICE
COM_COL2: Patrol officers evaluated on
collaborative problem-solving projects; recoded if
2=0, 1=1
COM_PTRN2: Problem-solving partnership with
local civic-gov't-business organization; recoded if
2=0, 1=1
COM_BT2: Same patrol officers regular assigned to
same beat; recoded if 2=0,1=1
COM_SURV2: Department uses info from
community survey; recoded if 2=0,1=1
*Note that these 8 variables inter-correlate positively
and strongly and were thus summated into a single
scale(0-8) ;Cronbach’s alpha =0.627
Crime Rate
TOTAL_CRIME
Total Crime Rate per 100,000 population, that is
(number of violent crimes + the number of property
crimes) per 100,000 population.
Poverty
%_FAMILIES_BELOW_POV_LINE
Percentage of families of four below the federal
poverty line in the U.S. in 2013.
Education
COLLEGE_GRADS
The number of college graduates with a Bachelor’s
degree.
Race
BLACK
Total number of African Americans in a city
Gun Regulation
GUN_LAW_GRADE
Letter grade scale used to determine the strength of
the gun laws by state
Part III: Findings
Bivariate
For each bivariate relationship, the Pearson correlation coefficient and its significance level was
calculated. And in each case a simple table is presented to illustrate the relationship.

14
Community Policing Practices and Total Crime Rate
The COM_POLICING, TOTAL_CRIME correlation coefficient is .07 (sig =.050). Counter to
the prediction made in the introduction, but also, not totally unexpected, this correlation
coefficient is positive, not negative. Although it’s statistical significance level meets
conventional standards for significance (.05) it is extremely weak. Table 1 illustrates this positive
relationship by comparing the mean total crime rate of cities with a low level of community
policing practices versus cities with a high level of community policing practices.
Table 1
On the basis of the bivariate analysis, we can conclude that the level of community
policing practices is a poor predictor of a city’s crime rate. A post factum interpretation for the
unexpected positive correlation between community policing practices and total crime rate is that
community policing might better be considered as a dependent variable rather than an
independent variable. That is those communities with high crime rate levels have been motivated
to institute community policing.

15
Poverty and Total Crime Rate
The FAM_POV_RATE, TOTAL_CRIME correlation coefficient is .114 (sig = .001). As
predicted in the introduction, this correlation coefficient is significant and positive. Table 2
illustrates this positive relationship by comparing the mean total crime rate of cities with a low
level of family poverty versus cities with a high level of family poverty.
Table 2
On the basis of the bivariate analysis, we can conclude that the level of family poverty is a good
predictor of a city’s crime rate.
Education and Total Crime Rate
The COLLEGE_RATE, TOTAL_CRIME correlation coefficient is -.362 (sig =.000). As
predicted in the introduction, this correlation coefficient is significant and negative. Table 3
illustrates this negative relationship by comparing the mean total crime rate of cities with a low
percentage of college graduates versus cities with a high percentage of college graduates.
Table 3

16
On the basis of the bivariate analysis, we can conclude that the percentage of college graduates is
a good predictor of a city’s crime rate.
Race and Total Crime Rate
The PERBLACK, TOTAL_CRIME correlation coefficient is .450 (sig =.000). As predicted in
the introduction, this correlation coefficient is significant and positive. Table 4 illustrates this
positive relationship by comparing the mean total crime rate of cities with a low percentage of
blacks versus cities with a high percentage of blacks.
Table 4
On the basis of the bivariate analysis, we can conclude that the percentage of blacks is a good
predictor of a city’s crime rate.
17
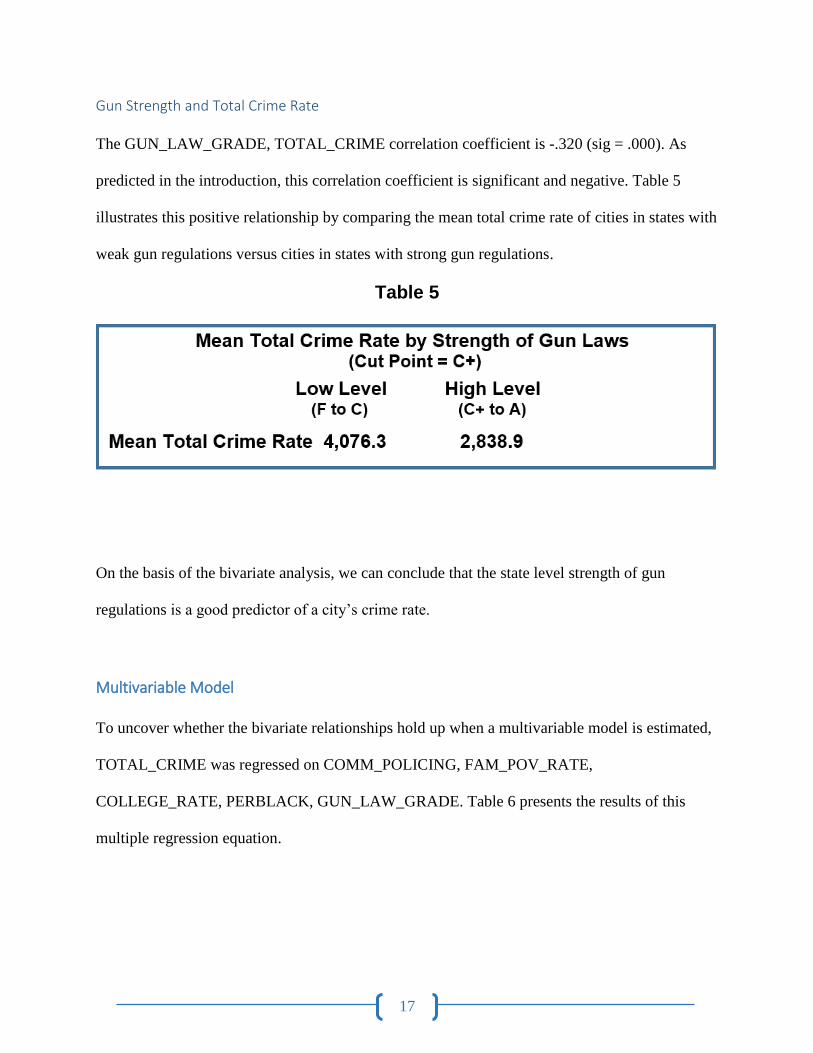
Gun Strength and Total Crime Rate
The GUN_LAW_GRADE, TOTAL_CRIME correlation coefficient is -.320 (sig = .000). As
predicted in the introduction, this correlation coefficient is significant and negative. Table 5
illustrates this positive relationship by comparing the mean total crime rate of cities in states with
weak gun regulations versus cities in states with strong gun regulations.
Table 5
On the basis of the bivariate analysis, we can conclude that the state level strength of gun
regulations is a good predictor of a city’s crime rate.
Multivariable Model
To uncover whether the bivariate relationships hold up when a multivariable model is estimated,
TOTAL_CRIME was regressed on COMM_POLICING, FAM_POV_RATE,
COLLEGE_RATE, PERBLACK, GUN_LAW_GRADE. Table 6 presents the results of this
multiple regression equation.

18
Inspection of the table reveals that all of the variables maintained the direction and
approximate strength of their bivariate relationship to TOTAL_CRIME, with the exception of
FAM_POV_RATE. The table clearly reveals that the percentage black, strength of gun
regulations, and the percentage of college graduates are all strong predictors of the total crime
rate. Finally, community policing practices are weakly and somewhat unexpectedly positively
related to crime. The most appealing interpretation of this last relationship is that community
policing should likely be considered as a dependent variable instead of an independent variable
regarding its relationship to crime.
Part IV: Summary
Even though the level of community policing practices has turned out to have what might be
considered a disappointing connection to the crime rate, this study in no way should detract from
the positive benefits of community policing practices. More particularly, and discussed in the
introduction Gill et al. (2014) found strong evidence that “community policing strategies have a
positive effect on citizen satisfaction and trust in the police” (as quoted in Maxamino 2015).

19
The present study highlights the importance of social disadvantage and its effect on
predicting crime. Most immediately increasing the level of education in a community is likely to
reduce its crime rate.
Finally, the state gun law variable was highly predictive of city level crime rates, which
highlights the need for the United States to continue the debate over gun control. This study
favors those in the debate who want stronger gun regulations.
A potential area for further research for this study is to examine how many police officers
in a specific police department engage in community policing practices and see if this is
comparable across similar city sizes with similar crime rates. Additionally, examining what
motivates police departments to start using community policing practice would be an interesting
extension of this project as it would decide if there was an issue of causal order in the
relationship between community policing practices and crime rates. One last area of research that
would be an interesting way to look at community policing and its results would be to see if the
demographic makeup of the police departments effects the outcomes of the practices. Meaning
the more similar demographic makeup of the police department to the community the better the
results and perceptions.
Part V: References
Braga, A. A., Welsh, B. C., & Schnell, C. (2015). Can Policing Disorder Reduce Crime? A
Systematic Review and Meta-analysis. Journal of Research in Crime and
Delinquency,52(4), 567-588. doi:10.1177/0022427815576576
Bureau of Justice Statistics (2018). Data Collection: Law Enforcement Management Aand
Administrative Statistics(LEMAS).
Carroll, W. F., & Madden, S. (2012). Boston Gun Project (BGP). In Guns in American

20
Society (2nd ed., Vol. 1, pp. 95-97). Santa Barbara, CA: ABC-CLIO.
Carter, G. L. (2012). Guns in American society. an encyclopedia of history, politics, culture, and
the law. Santa Barbara, CA: ABC-CLIO.
Center for Disease Control. 2017. Leading Cause of Death in 2014. Retrieved April 18, 2018.
Community Policing: FY 2017 Budget Request at a Glance. (n.d.). Retrieved April 16, 2018.
"Crime in the United States Home". FBI. N.p., 2017. Web. 11 May 2017.
Crime Rates Linked To Educational Attainment, 2013 Alliance Report Finds. (2013, September
12). Retrieved April 11, 2018
Eck, John E. and Edward R. Maguire, “Have Changes in Policing Reduced Violent Crime?
An Assessment of the Evidence,” in Alfred Blumstein and Joel Wallman, eds., The
Crime Drop in America, New York: Cambridge University Press, 2000, pp. 207–265.
Eitzen, D.S., & Leedham, C.S. (2004). Crime and crime control. In solutions to social problems:
Lessons from other societies (3rd ed. Pp. 190-208). Boston, MA: Allyn & Bacon.
FBI (Federal Bureau of Investigation). 2001. Uniform Crime Reports: Crime in the United
States, 2000. (accessed March 4, 2018).
Gill, C., Weisburd, D., Telep, C. W., Vitter, Z., & Bennett, T. (2014, August 02). Community-
oriented policing to reduce crime, disorder and fear and increase satisfaction and
legitimacy among citizens: A systematic review. Retrieved April 17, 2018.
Gius, M. (2016). The relationship between stand-your-ground laws and crime: A state-level
analysis. The Social Science Journal,53(3), 329-338. doi:10.1016/j.soscij.2016.01.001
Harrell, E., Langton, L., Berzofsky, M., Couzens, L., & Smiley- McDonald, H. (2014,
November). Household Poverty and Nonfatal Violent Victimization, 2008-2012(Rep. No.
NCJ 248384). Retrieved April 11, 2018, from Bureau of Justice Statistic website.

21
Hemenway, David, and Matthew Miller. 2000. “Firearm Availability and Homicide Rates
Across 26 high-Income Countries.” Journal of Trauma 49: 985-988.
Johnson, E. W. (2017). Community-Oriented Policing and Crime Rates and Crime Clearance
Rates in North Carolina (Unpublished doctoral dissertation). Walden University.
Retrieved April 11, 2018.
Jones-Webb, R., & Wall, M. (2008, September). Neighborhood Racial/Ethnic Concentration,
Social Disadvantage, and Homicide Risk: An Ecological Analysis of 10 U.S. Cities.
Retrieved April 12, 2018
"Law Enforcement Officers Killed and Assaulted Home". FBI. N.p., 2017. Web. 11 May
2017.
Maximino, M. (2015, March 11). Community-oriented policing strategies: Meta-analysis of
law enforcement practices. Journalist’s Resource, Shorenstein Center on Media, Politics,
and Public Polity (Harvard Kennedy Center) Retrieved April 11, 2018.
Moorhouse, John C. and Brent Wanner. n.d. “Does Gun Control Reduce Crime or
Does Crime Increase Gun Control?” Cato Journal (26.1):103–24. Retrieved May 27,
2017
Nagin, Daniel, “General Deterrence: A Review of the Empirical Evidence,” in Alfred
Blumstein, Jacqueline Cohen, and Daniel Nagin, eds., Deterrence and Incapacitation:
Estimating the Effects of Criminal Sanctions on Crime Rates,Washington, D.C.:
National Academy of Sciences, 1978, pp. 95–139.
Potter, Gary. 2013. “The History of Policing in the United States, Part 1.” EKU: Police
Studies Online. Retrieved May 5, 2017.
Rohe, W., Adams, R., and Arcury, T. (1996). Community Oriented Policing: The North 109
22
Carolina Experience. Center for Urban and Regional Studies, University of North
Carolina at Chapel Hill. Chapel Hill, North Carolina.
Sozer, M. A. (2008). Assessing the performance of community policing: The effect of community
policing practices on crime rates (Unpublished doctoral dissertation). Retrieved April 11,
2018.
Taylor, B., & Li, J. (2015, January 28). Do fewer guns lead to less crime? Evidence from
Australia. International Review of Law and Economics 42 Retrieved April 16, 2018.
United States Department of Justice. (2017). Law Enforcement Management and Administrative
Statistics. Web. 2 October 2017.
US Census Bureau. "American Community Survey (ACS)". Census.gov. N.p., 2017. Web. 11
May 2017.
Witt, Robert, Alan Clarke, and Nigel Fielding, “Crime and Economic Activity: A Panel Data
Approach,” British Journal of Criminology, 1999, 39(3), 391–400.
Part VI: Acknowledgements
This project would not have been able to be completed without the help of both Professor Carter
and Professor Enos. Professor Carter was a huge part of this project as he helped guide me
through the literature review and the data analysis. There were many twists and turns along the
way with this project as there were unexpected findings and Professor Carter helped me frame
these so that they were in fact important. As an editorial reviewer, Professor Enos offered me
insightful feedback on formatting and grammar issues as well as asking thought provoking
questions to push my research and understanding of the subject further.

23
Part VII: Appendix
Appendix A: Data File Description
Place of File Production: Smithfield, RI: Bryant University
BJS_AGENCYNAME - AGENCY NAME IN BJS UNIVERSE FILE
Variable Type: character
CITY - CITY
Variable Type: character
STATENAME - STATE
Variable Type: character
STATECODE - STATE ABBREVIATION
Variable Type: character
ZIPCODE - ZIP CODE
Variable Type: character
POP2012 - CENSUS BUREAU POPULATION ESTIMATE FOR 2012
Variable Type: numeric
Please note that only the first 50 response categories are displayed in the PDF codebook. To
view all response categories, please analyze the data file in the statistical package of your choice
(SAS, SPSS, Stata, R).
Mean: 212907.37
Minimum: 196.00
Maximum: 37955293.00
Standard Deviation: 1278507.38
FTSWORN - A1C.TOTAL NUMBER OF SWORN PERSONNEL ? FULL-TIME
Variable Type: numeric
Range of Missing Values (M): -9
Question
Please note that only the first 50 response categories are displayed in the PDF codebook. To
view all response categories, please analyze the data file in the statistical package of your choice
(SAS, SPSS, Stata, R).
Mean: 163.92
Minimum: 0.00
Maximum: 34454.00
Standard Deviation: 824.96
PERS_RESP_PATRL-A3A.PRIMARY DUTY? PATROL
Variable Type: Numeric
Question:
24
A3. As of January 1, 2013, how many FULL-TIME SWORN personnel performed the following
duties as their PRIMARY job responsibility? Count each officer or deputy only once. If none,
enter '0.'
a. Patrol duties (including community policing officers)
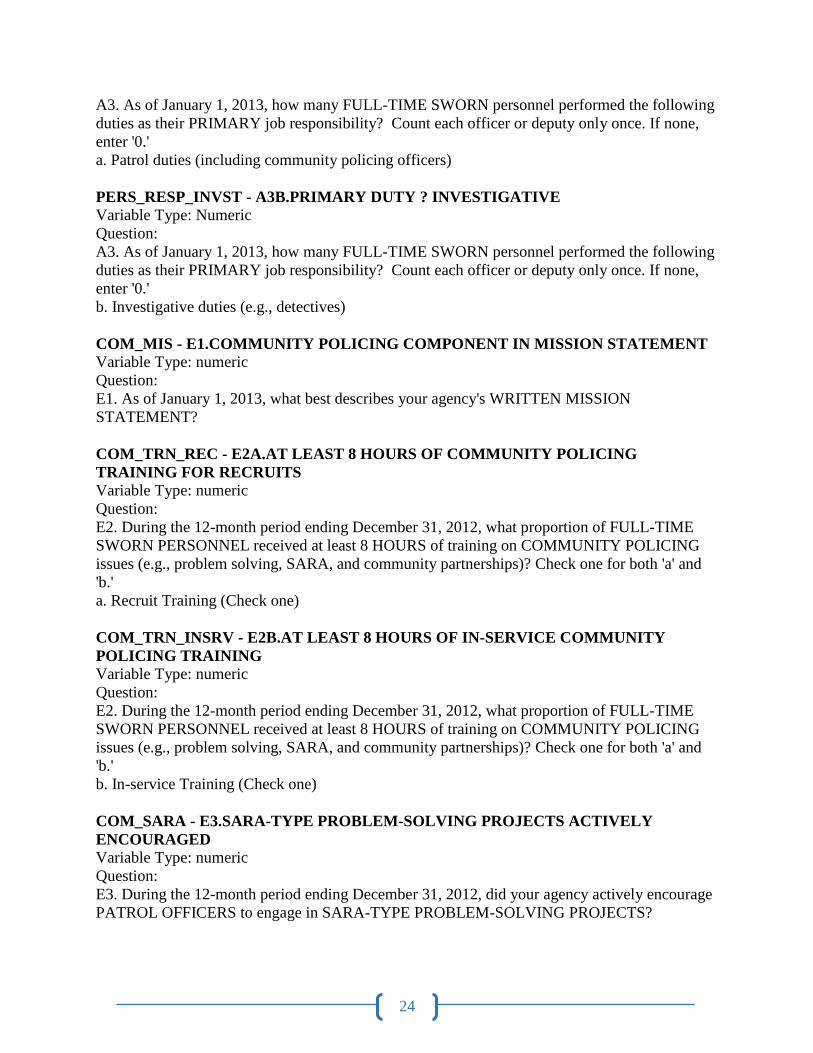
PERS_RESP_INVST - A3B.PRIMARY DUTY ? INVESTIGATIVE
Variable Type: Numeric
Question:
A3. As of January 1, 2013, how many FULL-TIME SWORN personnel performed the following
duties as their PRIMARY job responsibility? Count each officer or deputy only once. If none,
enter '0.'
b. Investigative duties (e.g., detectives)
COM_MIS - E1.COMMUNITY POLICING COMPONENT IN MISSION STATEMENT
Variable Type: numeric
Question:
E1. As of January 1, 2013, what best describes your agency's WRITTEN MISSION
STATEMENT?
COM_TRN_REC - E2A.AT LEAST 8 HOURS OF COMMUNITY POLICING
TRAINING FOR RECRUITS
Variable Type: numeric
Question:
E2. During the 12-month period ending December 31, 2012, what proportion of FULL-TIME
SWORN PERSONNEL received at least 8 HOURS of training on COMMUNITY POLICING
issues (e.g., problem solving, SARA, and community partnerships)? Check one for both 'a' and
'b.'
a. Recruit Training (Check one)
COM_TRN_INSRV - E2B.AT LEAST 8 HOURS OF IN-SERVICE COMMUNITY
POLICING TRAINING
Variable Type: numeric
Question:
E2. During the 12-month period ending December 31, 2012, what proportion of FULL-TIME
SWORN PERSONNEL received at least 8 HOURS of training on COMMUNITY POLICING
issues (e.g., problem solving, SARA, and community partnerships)? Check one for both 'a' and
'b.'
b. In-service Training (Check one)
COM_SARA - E3.SARA-TYPE PROBLEM-SOLVING PROJECTS ACTIVELY
ENCOURAGED
Variable Type: numeric
Question:
E3. During the 12-month period ending December 31, 2012, did your agency actively encourage
PATROL OFFICERS to engage in SARA-TYPE PROBLEM-SOLVING PROJECTS?

25
COM_NSARA - E4.NUMBER OF PATROL OFFICERS ENGAGED IN SARA-TYPE
PROBLEM-SOLVING PROJECTS
Variable Type: numeric
Question:
E4. During the 12-month period ending December 31, 2012, how many PATROL OFFICERS
were engaged in SARA TYPE PROBLEM-SOLVING PROJECTS? If none, enter '0.'
COM_COL - E5.EVALUATION CRITERIA FOR PATROL OFFICERS INCLUDES
COLLABORATIVE PROBLEM-SOLVING PROJECTS
Variable Type: numeric
Question:
E5. As of January 1, 2013, did your agency include COLLABORATIVE PROBLEM-SOLVING
PROJECTS in the evaluation criteria of PATROL OFFICERS?
COM_PTNR - E6.PROBLEM-SOLVING PARTNERSHIP OR WRITTEN AGREEMENT
WITH LOCAL ORGANIZATION
Variable Type: numeric
Question:
E6. During the 12-month period ending December 31, 2012, did your agency have a
PROBLEM-SOLVING PARTNERSHIP or WRITTEN AGREEMENT with any local civic,
business, or governmental organizations? This could include Memoranda of Understanding.
COM_BT - E7.SAME PATROL OFFICERS REGULARLY ASSIGNED
RESPONSIBILITY FOR AREAS OR BEATS Variable Type: numeric
Question:
E7. During the 12-month period ending December 31, 2012, did your agency regularly assign the
SAME patrol officers' primary responsibility for a particular AREA OR BEAT within your
agency's jurisdiction?
COM_NBT - E8.NUMBER OF PATROL OFFICERS REGULARLY GIVEN
RESPONSIBILITY FOR AREAS OR BEATS
Variable Type: numeric
Question:
E8. How MANY patrol officers were regularly given primary or exclusive responsibility for
particular AREAS OR BEATS? If none, enter '0.'
COM_SURV - E9.UTILIZED INFORMATION FROM COMMUNITY SURVEY
Variable Type: numeric
Question:
E9. During the 12-month period ending December 31, 2012, did your agency utilize information
from a SURVEY OF LOCAL RESIDENTS about crime, fear of crime, or satisfaction with law
enforcement?
POV_ALL_FAMILIES
Variable Type: numeric

26
Questions:
How many families were used for the sample size?
%_FAMILES_BELOW_POV_LINE
Variable Type: numeric
Question:
What is the percentage of families of four below the poverty line? The poverty line is when the
families income is below $25,100.
ESTIMATED_TOTAL
Variable Type: numeric
BLACK
Variable Type: numeric
Question: What is the total number of African Americans in each city?
COLLEGE_GRADS
Variable Type: numeric
Question: What is the total number of people with a Bachelor’s degree?
POPULATION_FBI
Variable Type: numeric
Question: What the population of a city is from the FBI?
VIOLENT_RAW
Variable Type: numeric
Question:
What is the violent crime rate for a given city?
PROPERTY_RAW
Variable Type: numeric
Question:
What is the property crime rate for a given city?
GUN_LAW_GRADE
Variable Type: numeric
Question:
How strong are the gun laws for a given state on a gpa scale?
VCRIME
Variable Type: numeric
Question:
Vcrime = (violent_raw/pop_fbi)*100,000
PCRIME
Variable Type: numeric

27
Question:
Pcrime = (property_raw/pop_fbi)*100,000
TOTAL_CRIME Variable Type: numeric
Question:
Total_crime = ((property_raw+violent_raw)/pop_fbi)*100,000
COLLEGE_RATE2
Variable Type: numeric
Question:
College_rate2 = (college_grad/estimated_total_for_college_grad)*100,000
COM_MIS2
Variable Type: numeric
Question:
COM_MIS2
If 1thru 2 = 0: no
3=1: yes
COM_TRN_REC2
Variable Type: numeric
Question:
COM_TRN_REC2
If 3 thru 5 = 0: no
If 1 thru 2 = 1: yes
COM_TRN_INSRV2
Variable Type: numeric
Question:
COM_TRN_INSRV2
If 3 thru 5 = 0: no
If 1 thru 2 = 1: yes
COM_ SARA2
Variable Type: numeric
Question:
COM_SARA2
If 2 = 0: no
If 1 = 1: yes
COM_COL2
Variable Type: numeric
Question:
COM_COL2
If 2 = 0: no

28
If 1 = 1: yes
COM_PTNR2
Variable Type: numeric
Question:
COM_PTNR2
If 2 = 0: no
If 1 = 1: yes
COM_BT2
Variable Type: numeric
Question:
COM_BT2
If 2 = 0: no
If 1 = 1: yes
COM_SURV2
Variable Type: numeric
Question:
COM_SURV2
If 2 = 0: no
If 1 = 1: yes
COM_POLICING
Variable Type:
Question:
COM_POLICING
If 2 = 0: no
If 1 = 1: yes
Appendix B: Basic Heuristic Model for Community Policing Practices and Crime Rates

29
Appendix C: Basic Heuristic Model for Poverty and Crime Rates
Appendix D: Basic Heuristic Model for Education and Crime Rates
30
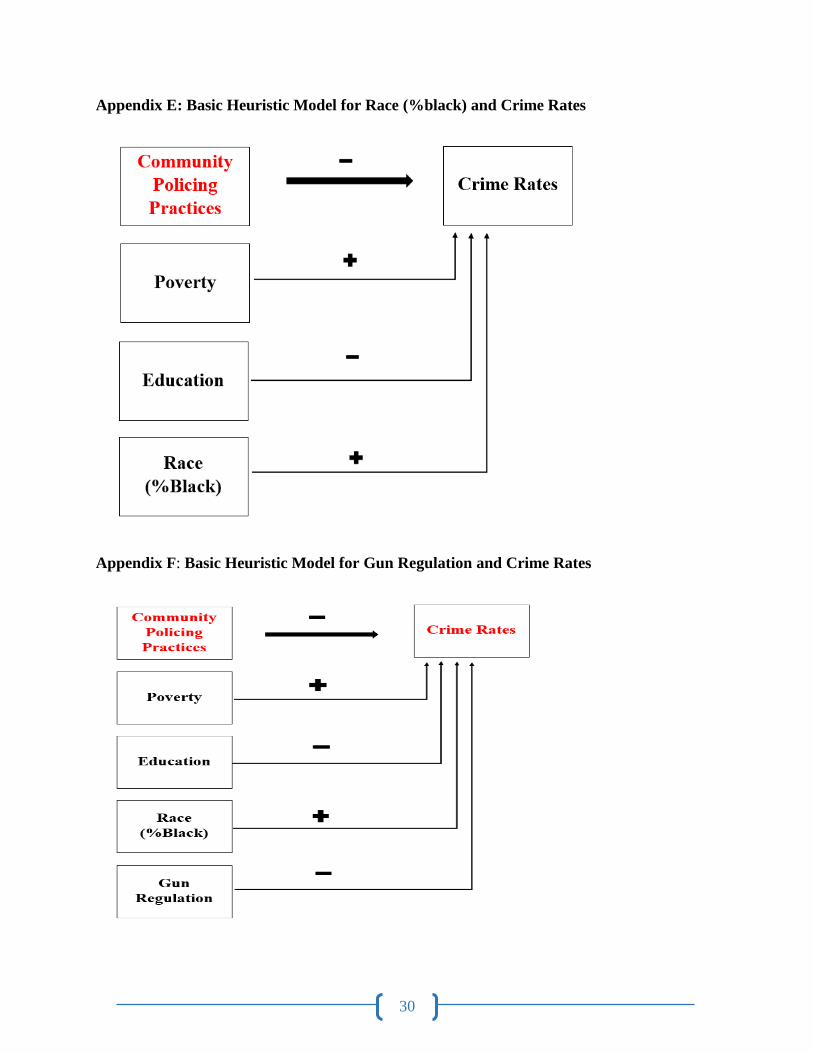
Appendix E: Basic Heuristic Model for Race (%black) and Crime Rates
Appendix F: Basic Heuristic Model for Gun Regulation and Crime Rates

31
Appendix G: Summary of Bivariate Analysis