The Effects of Cold Plasma Treatment on Sweet Basil ...
79
Seton Hall University eRepository @ Seton Hall Seton Hall University Dissertations and eses (ETDs) Seton Hall University Dissertations and eses Summer 7-31-2018 e Effects of Cold Plasma Treatment on Sweet Basil (Ocimum basilicum) Sauvelson Auguste [email protected] Follow this and additional works at: hps://scholarship.shu.edu/dissertations Part of the Analytical Chemistry Commons , Environmental Chemistry Commons , Food Chemistry Commons , Food Processing Commons , and the Medicinal-Pharmaceutical Chemistry Commons Recommended Citation Auguste, Sauvelson, "e Effects of Cold Plasma Treatment on Sweet Basil (Ocimum basilicum)" (2018). Seton Hall University Dissertations and eses (ETDs). 2584. hps://scholarship.shu.edu/dissertations/2584
Transcript of The Effects of Cold Plasma Treatment on Sweet Basil ...

Seton Hall UniversityeRepository @ Seton HallSeton Hall University Dissertations and Theses(ETDs) Seton Hall University Dissertations and Theses
Summer 7-31-2018
The Effects of Cold Plasma Treatment on SweetBasil (Ocimum basilicum)Sauvelson [email protected]
Follow this and additional works at: https://scholarship.shu.edu/dissertations
Part of the Analytical Chemistry Commons, Environmental Chemistry Commons, FoodChemistry Commons, Food Processing Commons, and the Medicinal-Pharmaceutical ChemistryCommons
Recommended CitationAuguste, Sauvelson, "The Effects of Cold Plasma Treatment on Sweet Basil (Ocimum basilicum)" (2018). Seton Hall UniversityDissertations and Theses (ETDs). 2584.https://scholarship.shu.edu/dissertations/2584

The Effects of Cold Plasma Treatment on Sweet Basil
(Ocimum basilicum)
By
Sauvelson Auguste
THESIS
Submitted to the Department of Chemistry and Biochemistry at Seton
Hall University in partial fulfilment of the requirements for the degree of
Master of Science
South Orange, New Jersey
August, 2018

ii
© 2018 Sauvelson Auguste

iii

iv
ACKNOWLEDGEMENTS
I would like to thank Father Gerald Buonopane and Dr. Jose Lopez of the Chemistry and
Biochemistry Department and Physics Department at Seton Hall University. The doors to Profs.
Buonopane and Lopez offices were always open whenever I ran into a trouble spot or had a
question about my research or writing. They consistently allowed this research to be my own
work, but steered me in the right direction whenever they thought I needed it.
I would also like to thank the support of others who were involved in the qualitative and
quantitative analysis of this research project, including Dr. Robert Augustine, who allowed part
of the work to be done in his lab, and Dr. Setrak K. Tanielyan, who put all of his energy in this
work. Without their passionate participation and input, the research could not have been
successfully directed.
I would also like to acknowledge Dr. Nicholas H. Snow of the Chemistry and Biochemistry
department at Seton Hall University as the reader of this thesis and I am gratefully indebted to
his very valuable comments on this thesis as well as his assistance.
Finally, I must express my very profound gratitude to my parents and to my friends Dan
Guerrero, Dr. Mary Berger, and Dr. Cosimo Antonacci for providing me with unfailing support
and continuous encouragement throughout my years of study and through the process of
researching and writing this thesis. This accomplishment would not have been possible without
them.
Thank you.
Auguste

v
Table of Contents
ACKNOWLEDGEMENTS ______________________________________________________________________________ IV
LIST OF FIGURES ___________________________________________________________________________________ VI
LIST OF TABLES ___________________________________________________________________________________ VII
ABSTRACT _______________________________________________________________________________________ VIII
CHAPTER 1 __________________________________________________________________________________________ 1
INTRODUCTION _____________________________________________________________________________________ 1
1.1. HEALTH BENEFITS OF SWEET BASIL (OCIMUM BASILICUM) ___________________________________________________ 7
1.2. GAS CHROMATOGRAPHY / MASS SPECTROMETRY (GC/MS) OF ESSENTIAL OILS __________________________________ 8
CHAPTER 2 _________________________________________________________________________________________ 10
EXPERIMENTAL ____________________________________________________________________________________ 10
2.1. MATERIALS _____________________________________________________________________________________ 10
2.2. METHODS AND APPARATUS _________________________________________________________________________ 10
2.2.1. ATMOSPHERIC COLD PLASMA JET (ACPJ) TREATMENT OF BASIL PLANTS _________________________________ 11
2.2.2. EXTRACTING THE ESSENTIAL OIL FROM THE PLANTS __________________________________________ 14
2.2.2.1. a. Soxhlet Extraction ________________________________________________________________________ 14
2.2.2.1. b. Extracting the essential oil from the plants, using soxhlet technique _________________________________ 15
2.2.2.2. HIGH PRESSURE REACTOR EXTRACTION _____________________________________________________ 15
2.2.3. METHOD DEVELOPMENT FOR QUANTITATIVE ANALYSIS OF BASIL OIL BY GAS
CHROMATOGRAPHY (GC). BUILDING MASS SPECTRAL LIBRARY FOR COMPOUNDS EXPECTED TO BE
FOUND IN BASIL PLANT EXTRACTS _________________________________________________________________ 19
2.2.3.1. INSTRUMENT CONDITIONS _______________________________________________________________________ 19
2.2.3.2. REFERENCE SAMPLE PREPARATION. ________________________________________________________________ 20
2.2.3.3. EXTRACTED OIL SAMPLE PREPARATION ____________________________________________________________ 23
2.2.3.4. DETERMINING THE RESPONSE FACTORS (RF) FOR EACH COMPONENT OF THE OIL COMPOSITION AND CALCULATIONS FOR
THE CONCENTRATION PROFILE IN ACTUAL OIL EXTRACTS _____________________________________________________ 23
CHAPTER 3 _________________________________________________________________________________________ 26
RESULTS AND DISCUSSION _________________________________________________________________________ 26
3.1 – GROWTH OF THE BASIL PLANTS UNDER ACPJ TREATMENT FROM GERMINATION, VEGETATION, AND FLOWERING _______ 26
3.1.1. - BIOLOGICAL ASPECT OF THE GROWTH USING ACPJ TREATMENT __________________________________________ 31
3.2. – QUALITATIVE ANALYSIS OF THE EXTRACTED ESSENTIAL OIL COMPONENTS ___________________________________ 31
3.3 - QUANTITATIVE ANALYSIS OF ESSENTIAL OILS RECOVERED FROM VARIOUS PARTS OF THE PLANTS IN THE CONTROL AND IN
THE PLASMA TREATED GROUPS. _________________________________________________________________________ 34
3.4 - THE EFFECT OF TEMPERATURE AND PRESSURE ON THE EXTRACTION OF BASIL PLANT ESSENTIAL OIL USING A HIGH-
PRESSURE REACTOR __________________________________________________________________________________ 39
3.5 ANALYSIS OF THE EFFECTS OF ATMOSPHERIC COLD PLASMA JET ________________________________ 42
CHAPTER 4 _________________________________________________________________________________________ 45
CONCLUSIONS _____________________________________________________________________________________ 45
APPENDIXES _______________________________________________________________________________________ 47
APPENDIX A. –MASS SPECTRA OF INDIVIDUAL COMPOUNDS POTENTIALLY PRESENT IN BASIL PLANT EXTRACTS ____________ 47
REFERENCES ______________________________________________________________________________________ 66

vi
List of Figures
FIGURE 1. CHEMICAL STRUCTURE OF THE COMPOUNDS IN SWEET BASIL FROM TABLE 1 ______ 6
FIGURE 2A. - APPARATUS OF ATMOSPHERIC COLD PLASMA JET SYSTEM __________________ 12
FIGURE 2B. - ATMOSPHERIC COLD PLASMA JET SYSTEM USED DURING THE EXPERIMENT, PICTURE
TAKEN BY THE AUTHOR DURING THE EXPERIMENT ________________________________ 12
FIGURE 3. IMAGE OF THE BODY TREATMENT FROM PLASMA JET, PICTURE TAKEN BY THE AUTHOR
DURING THE EXPERIMENT ___________________________________________________ 13
FIGURE 4. - AUTOMATED PARR REACTOR (A) AND ASSOCIATED VOLUMETRIC SYSTEM (B) PICTURE
TAKEN BY THE AUTHOR DURING THE EXPERIMENT ________________________________ 16
FIGURE 5. - SCHEMATIC OF THE PARR REACTOR HEAD ________________________________ 18
FIGURE 6. – CHROMATOGRAM OF STANDARD MIXTURE OF THE INDIVIDUAL COMPONENT FROM
FID SYSTEM _____________________________________________________________ 22
FIGURE 7. - TREATMENT EFFECTS ON THE GROWTH OF SWEET BASIL PLANTS ______________ 27
FIGURE 8. – MEASURING THE AVERAGE SURFACE AREA OF THE LEAVES FROM CONTROL TO
PLASMA TREATED PLANTS ON WEEK 12 _______________________________________ 29
FIGURE 9. – PHOTOS OF BASIL PLANTS AND THE PHYSICAL GROWTH ______________________ 30
FIGURE 10. COMPOSITION OF THE BASIL OIL FROM THE CONTROL GROUP (A) AND PLASMA
TREATED GROUPS (B - D) RECOVERED BY SOXHLET EXTRACTION WITH HEXANE. ________ 32
FIGURE 11. – EFFECTS OF COLD PLASMA ON EACH COMPONENT FOUND IN THE EXTRACTED PLANT 38
FIGURE 12A. EFFECT OF THE TEMPERATURE AND PRESSURE ON THE EXTRACTION OF SWEET BASIL
OIL. ____________________________________________________________________ 40
FIGURE 12B. – CONCENTRATION OF THE MAIN COMPONENTS FOUND AS A FUNCTION OF THE
TEMPERATURE AND PRESSURE OF THE EXTRACTION _______________________________ 41
FIGURE 13. - IMAGE OF THE BODY TREATMENT AT THE SURFACE OF THE PLANT LEAVES, PICTURE
TAKEN BY THE AUTHOR DURING THE EXPERIMENT ________________________________ 43

vii
List of Tables
Table 1. Components typically found in Sweet Basil (Ocimum basilicum) ________________5
Table 2. Calculations of the Concentration of the Standard Blend Solution of Oils__________21
Table 3. Response factor Calculate from Area Report of the Standard Mix_________________25
Table 4A. Concentrations (mg/ml) of the Extracted Basil Oil Components _________________35
Table 4B. Composition of the Basil Oil Extracts Derived from Various Sections of the Plant after
Plasma Treatment by the Standard Protocol _________________________________________36
Table B1. Standard Excel Spreadsheet used to calculate the Concentrations of the Individual
Components Found in Basil Extracts ______________________________________________64
Table B2. Concentration of the Basil Oil Extracts Derived from Various Sections of the Plant after
Plasma Treatment by the Standard Protocol_________________________________________65

viii
Abstract
The study discussed herein looks both to continue and to expand upon previous work conducted
here at Seton Hall University, which investigated the effect of cold plasma processing on sweet
basil and their essential oils. It was found that the application of cold plasma treatment increases
plant growth and eugenol concentration, which is an essential oil component and one of the
potential natural antioxidants used in food preservation. In this study, we considered methods for
increasing the production and harvesting of plants that produce essential oils such as sweet basil
(Ocimum basilicum). The study also incorporated more controls than the previous study which
served as a pilot of the present study. These controls included: more sample groups, i.e., seed
treated, plant body treatment once and twice a week; different parts of the basil plant were
separately treated, such as the leaves, stems, and flowers; and a standard distance of plasma
application was maintained. The main focus of the current study was to investigate in detail the
effect of the cold plasma treatment on the overall growth of the sweet basil plants, to optimize
the extraction protocol of the essential oils present, and to determine quantitatively the effect
which the plasma treatment plays on the distribution of the main compounds found in the control
and plasma treated plant groups. Sweet basil contains different components of essential oil such
as eucalyptol, linalool, estragole, eugenol, and methyl cinnamate. Results of this study showed
an increase of the essential oils extracted from the plant based on the plasma treatment. Also,
results showed an increase in the essential oil extracted from the basil plant according to the
intensity of the treatment either once a week or twice a week with 30 second per treatment.
Estragole was the predominant component in the leaves and linalool was predominant in the
flowers, both at the twice a week treatment.

1
Chapter 1
Introduction
Second only to the increase in agricultural production, the preservation and increased shelf life of
food products is paramount to meeting the growing global demand. One common type of food
preservation technique is to add antioxidants, which help to prevent or retard lipid oxidation. Lipid
oxidation is a deteriorative process that causes oil or fat to turn rancid and food to spoil. Two
synthetic antioxidants commonly used by the food industry are butylated hydroxyl anisole (BHA)
and butylated hydroxyl toluene (BHT). Although BHA and BHT are effective antioxidants, animal
studies have shown that they are potentially harmful to human health, as reviewed by Amorati [1].
BHA has been shown to promote the action of some carcinogens, and BHT potentially causes lung
damage [2,3,4]. These substances, however, have potential safety hazards. Food scientists have
been seeking alternative natural compounds as substitute antioxidants. Numerous studies have
shown such bioactive effects [5,6,7] with components originating in the plant’s essential oils.
Among these natural alternatives are certain groups of chemicals, which are found in various plant
species, called essential oils. Essential oils are aromatic oily liquids that are extracted from
different parts of a plant and have been shown to demonstrate antibacterial and antioxidant
potential for food preservation products due to their phenolic and polyphenolic constitution [8].
This effect can be measured by its scavenging activity of the free radical, DPPH (2-2-diphenyl-1-
picrylhydrazyl), the Folin-Ciocalteau method, (reducing power assay) and β-carotene method [9].
Previous studies have also reported that various mixtures of naturally occurring essential oils act
as active oxygen scavengers [10] and that these natural antioxidants can protect the human body
from free radicals and retard the progress of many chronic diseases [11]. Because of these benefits,
studying natural antioxidants has grown increasingly more common and important. Different

2
assays have been used to quantify the antioxidant activity. DPPH (2, 2-diphenyl-1-picrylhydrazyl)
free radical quenching assay is considered one of the most authentic assays for antioxidant study
[12, 17]. DPPH is an organic stable free radical which gives a purple color in solution and can be
detected with maximum absorption at 518 nm (λmax) by UV/Vis spectroscopy [13,14].
Sweet basil is one of the most common food preparation herbs used in the world. Ocimum
basilicum was used in our study for different reasons: economically (i.e., inexpensive) and
relatively quick to grow. Basil contains natural constituents that can be of benefit for human health,
including eugenol, estragole, linalool, and citronellol. These compounds are found in the ‘sweet
basil oil’ and are defined as enzyme-inhibiting oils that can help lower inflammation, which is at
the root of most diseases such as heart disease, rheumatoid arthritis and other chronic diseases.
Understanding the potential chemical components of sweet basil, prior research with basil
indicated that eugenol and estragole were the main chemical compounds; they are found to have
potent antioxidant, antiviral, and antimicrobial properties [15].
Compared to the synthetic antioxidants (BHA, BHT), sweet basil contains two natural components
(estragole and eugenol) that are suitable for food preservation. Eugenol was found to be the
predominant component found in the extracted basil oil between the plasma treated and non-treated
(control) plant using extraction by steam distillation [16] and GC-MS to identify the eugenol.
The word plasma comes from the ancient Greek, which means “moldable substance” or “jelly”. It
is describes the behavior of ionized atomic nuclei and electrons where each of the nuclei are
suspended in a movable environment of electrons. Plasma was first identified in a Crookes tube in
1879 by Sir William Crookes where he called it “radiant matter” [17].

3
The term plasma was first discovered in 1928 by Irving Langmuir and it is considered as the fourth
state of matter due to its structure substantially different from the three other states of matter such
as solid, liquid and gaseous [18,19]. In terms of physics, plasma is used for sterilization purposes
and composed of non-charged particles, molecules and radicals.
Plasma is formed when gases are left on constant current or between two electrodes where
electrons and ions are unrestricted during plasma generation. This phenomenon affects cell walls
of microorganisms. Studies show that plasma produces positive results in microbiological terms
in various foods, such as vegetables, fruit and meat products [20,21]. There are two types of
plasmas, cold and hot. The temperature of the ions of cold plasma is close to room temperature
and thus has application in food [22].
The prior study which utilized atmospheric cold plasma jet (ACPJ) technology, has shown plasma
treatment to be associated with an enhanced growth rate, an increase in the robustness of the plants,
and perhaps most significantly, an enhanced antioxidant effect [16]. Even though the beneficial
effects on the plant from the ACPJ treatment were noted, the mechanism causing the plant’s growth
and response is not yet understood. It is known that high-energy photons, excited free electrons,
ions and neutral gas particle species are all being generated within the plasma jet effluent but the
subsequent effect of each of these components on impact with the plant is yet to be determined.
Additionally, even beyond the physical collisions of these plasma constituents, there is also the
known reactive gas species such as N+, H2O2, OH-, H+, NO, singlet oxygen, O2, O3, N2O, and a
few others like CO2 and CO, that are formed and these activated chemicals are also suspected to
play a role in the plant’s response [23, 24]. The goal of this research is to understand the effect of
cold plasma treatment on sweet basil by using qualitative and quantitative analytical techniques to
analyze the essential oil extracted from sweet basil plants.

4
The current research is based on further study on the effects of cold plasma treatment on sweet
basil, including plasma’s potential effect on the chemical components of essential oil such as
estragole, linalool, ocimene, eugenol, etc. The list of the chemical components, potentially present
in sweet basil oil is shown in Table 1 and their chemical structures compiled in Figure 1.
Most of the components listed in Table 1 and Figure 1 belong to the terpene group which are part
of the largest class of natural products. These components are found in plants such as star anise
(Illicium verum), coriander (Coriandrum sativum), mint (mentha), and sweet basil (Ocimum
basilicum). Sweet basil is one of the plants of interest consumed by humans for its various
biological functions.

5
Table 1. Components Typically Found in Sweet Basil (Ocimum basilicum)
Components Formula
MW
(g/mole)
Density
(g/ml)
1 α-Pinene C10H16 136.24 0.858
2 Myrcene C10H16 136.24 0.791
3 β-Pinene C10H16 136.24 0.859
4 cis-Ocimene C10H16 136.24 0.818
5 Limonene C10H16 136.24 0.841
6 trans-Ocimene C10H16 136.24 0.818
7 Eucalyptol C10H18O 154.25 0.922
8 Linalool C10H18O 154.25 0.87
9 Camphor C10H16O 152.23 0.99
10 Estragole C10H12O 148.2 0.965
11 Terpineol C10H18O 154.25 0.934
12 Citronellol C10H20O 156.27 0.855
13 Geraniol C10H18O 154.25 0.879
14 Eugenol C10H12O2 164.2 1.067
15 Methyl Cinnamate C10H10O2 162.185 1.09
17 Ethyl Cinnamate C11H12O2 176. 21 1.05
Source: Valgimigli, L; Essential Oils as Natural Food Additives, New York, Nova Science
Publishers, 2012.
Note: This particular sequence components are based on the retention time of the standard GC
analysis.

6
Figure 1. Chemical Structure of the Compounds in Sweet Basil from Table 1

7
1.1. Health Benefits of Sweet Basil (Ocimum basilicum)
Basil leaves hold many significant plant-derived chemical compounds that are known to have
disease preventing and health promoting properties [25]. Basil herb contains many polyphenolic
flavonoids like orientin (flavone contains glucoside) and vicenin (a particular class of flavonoids
that carry some protection against radiation damage). Previous studies show that the above
polyphenolic components were utilized in in-vitro studies for their possible antioxidative
protection against radiation-induced lipid peroxidation in mouse liver [26].
Basil leaves contain also many health-benefiting components of essential oils, such as eucalyptol,
estragole, linalool, eugenol, citronellol, limonene, and terpineol. These components are known to
have anti-inflammatory and antibacterial properties [27].
The herb is low in calories and contains no cholesterol. However, it is one of the finest sources of
many essential nutrients, minerals, and vitamins. Basil contains exceptionally high levels of beta-
carotene, vitamin-A, kryptoxanthin, lutein, and zeaxanthin. These components act as protective
scavengers against oxygen-derived free radicals and reactive oxygen species (ROS) that can harm
human health [28].
Based on the literature, basil contains zeaxanthin, a yellow flavonoid carotenoid, it is selectively
absorbed into the retinal macula lutea where it is found to filter harmful UV rays from reaching
the retina. Studies suggest that common herbs, fruits, and vegetables that are rich in zeaxanthin
antioxidant help to protect from age-related macular disease (AMRD), especially in older adults
[29,30].
One hundred grams of fresh herb basil leaves contain astonishingly 5275 mg or 175% of daily-
required dose of vitamin A. Vitamin-A is known to have antioxidant properties and is essential for
vision. It is also required for maintaining healthy skin in the human body. Consumption of natural
foods rich in vitamin-A has been found to help protect their humans from lung and oral cavity
cancers. In addition, Vitamin K in basil is essential for the production of clotting factors in the
blood and plays a vital role in the bone strengthening and mineralization [31].
Besides other plants that contain different minerals used for human health, basil contains a good
amount of minerals such as, potassium, manganese, copper, and magnesium. Potassium is an
important component of cell and body fluids, which helps control heart rate and blood pressure.
Manganese is used in the human body as an important co-factor for the antioxidant enzyme,
superoxide dismutase [32, 33].

8
Basil leaves are an excellent source of iron. Its fresh leaves carry approximately 0.0317 mg/g
(about 26% of RDA) of iron. Iron is a component of hemoglobin inside the red blood cells and it
is one of the principal determinants of oxygen-carrying capacity of the blood [34].
1.2. Gas Chromatography / Mass Spectrometry (GC/MS) of Essential Oils
Different analytical methods have been used to analyze essential oils [35]. In 1952, modern gas-
chromatography was invented by Martin and James [36], since then it has become one of the most
important and widely applied analytical techniques in modern analytical chemistry. The beginning
of fused quartz bonded-phase capillary columns has led to very reproducible retention times and
reproducible columns from consignment to consignment [37], the succeeding coupling with an
“ion trap detector” (ITD) [Finnegan Corp., 1987] and introduction of computer searching
algorithms allowed unmistakable identification of essential oils (EOs) components based on
retention times, the interpretation of mass spectra and spectral library search using dedicated
software. Different types of detectors are coupled to capillary gas chromatography in order to
analyze essential oils, including “flame ionization detector” (FID), “electron capture detector”
(ECD), “thermal conductivity detector” (TCD). However the preceding detectors do not offer
analyte identification as compared to detectors that are specific for certain classes of compounds:
nitrogen-phosphorous detector (NPD), “flame photometric detector” (FPD), and “photo-ionization
detector” (PID). These types of detectors do not provide structural information about the analytes
[38].
Coupling of gas chromatography with mass spectrometry for separation yields better recovery of
the essential oils with an online spectroscopic detector technology. These techniques include gas
chromatography-mass spectrometry (GC-MS), GC- Fourier transform infrared spectroscopy (GC-
FTIR), GC-nuclear magnetic resonance of carbon 13 (GC-CNMR) [39, 40]. The above techniques
can obtain the structural information on the separated of essential oils components. GC-
olfactometry (GC-O) is one of the separation techniques mostly used in the industrial field of the
flavor and fragrances [41], which provides the characteristic configuration scent for essential oils
combinations. Over the last decades, the analytical methods have been remarkably improved with
broadened application in the analysis of essential oils (EOs). Different studies show that currently
GC–MS equipped with chiral column is one of the most complete instrumentations, able to furnish
specific data for quality control of essential oils.

9
Presently, the identification of essential oil components is usually carried out with the benefit of
gas chromatography/mass spectrometry (GC/MS) equipped with flame ionization detector (FID)
and mass selective detectors, and a capillary column which was used in the present study.

10
Chapter 2
Experimental
The main focus of this work was to investigate the effect of the cold plasma treatment on the sweet
basil plants by determining the changes taking place in the component profile of the isolated
essential oil possibly resulting from this treatment, to identify specific components, and determine
whether they have been enhanced or diminished by plasma.
2.1. Materials
The following chemicals α-Pinene, Myrcene, β-Pinene, cis-Ocimene, Limonene, trans-Ocimene,
Eucalyptol, Camphor, Linalool, Estragole, Terpineol, Citronellol, Geraniol, Eugenol, Methyl
Cinnamate, and Ethyl Cinnamate were purchased from Sigma-Aldrich Co (Saint-Louis, MO).
Hexane was purchased from Macron Fine Chemicals™ (Center Valley, PA USA). All of the
chemicals and solvents used for the research were of the highest analytical grade. Basil seeds,
produced by Burpee Garden Products Co (Warminster, PA), were purchased at a local Home
Depot store. Garden soil, vegetables and herbs mix with fertilizers and pot plants were also
purchased at a local Home Depot store in New Jersey.
2.2. Methods and Apparatus
To increase the germination rate of different plants, many studies have utilized cold plasma to treat
their seeds [16, 19, 52, and 53]. This study went beyond the others by applying atmospheric cold
plasma jet on the plant bodies such as stems (S), leaves (L), and flowers (F) with an increase in
the time treatment frequency. The study was further focused on different parameters which were
involved during the growth process (water uptake, humidity, temperature and pH of the fertilizers).
This study can help to evaluate and classify a series of reactive species that can be produced due
to a plasma effect. This practice would also help to understand the mechanism of their development
as explained by plasma physics, chemistry, and biology [42].
To understand the above aspects of the application of cold plasma on sweet basil, our experiment
was divided into different treatment groups: control group (no plasma treatment), seed treated plant

11
(only seeds were treated), body treatment once a week and plant body treatment twice a week
(their seeds were treated with plasma), as described below.
2.2.1. Atmospheric Cold Plasma Jet (ACPJ) Treatment of Basil Plants
The experimental setup of this study uses a high voltage power supply to energize a hollow steel
cylinder that serves as an electrode. The electrode is fitted into a Teflon® tube which serves as
both the gas propagation vessel as well as the dielectric material required for proper discharge
energetics—which is to say it transmits the high voltage electric charge. High-purity helium gas
serves as the medium for the plasma generated in Figures 2a & 2b. The plasma effluent can then
be easily manipulated to serve as the treatment source for the plants in the study. Basil seeds were
treated with ACPJ following the protocol from the previous study [16].
Approximately 500 seeds were placed in a glass petri dish and hand rotated for five minutes as the
plasma effluent from the ACPJ interacted with the seed layers from a distance of approximately
two centimeters. The jet that used during the seed treatment is showed in figure 3. The plasma was
formed with an applied electrical potential of 10 kV and at about 22 kHz frequency. The gas
medium for the plasma was ultra-high purity helium and was fed via a Cole Parmer® mass flow
controller at a flow rate of 5.00 standard liters per minute (SLM). After all seeds were treated with
the cold plasma, the planting process was divided into four groups. All plant groups were grown
in vegetable herb soil, and irrigated with tap water every other day from our lab.

12
Figure 2a. - Apparatus of Atmospheric Cold Plasma Jet System
Figure 2b. - Atmospheric Cold Plasma Jet System used During the Experiment, Picture
taken by the author during the experiment

13
Figure 3. Image of the Body Treatment from Plasma Jet, Picture taken by the author
during the experiment

14
Group A. Control group, seeds received no plasma treatment before planting.
Group B. Seeds treated with plasma before planting, no further plasma treatment.
Group C. Plasma seed-treatment as Group B. This group additionally receives plasma treatment
immediately after germination. Germination is a process that leads to the sprouting of a seedling
(young sporophyte develops from the seed embryo) from the seeds of the spermatophyte. Once
germination occurred, a one-week rest period was given before the plant-body plasma treatment
was initiated. The plant body (stems, leaves, and flowers) received cold plasma treatment once a
week (1X/W) for thirty seconds on average.
Group D. Plasma seed treatment like Group C, however, plasma plant-body treatment was
applied twice a week (2X/W).
As explained above, the plants were divided into four groups from control, seed treated, to body
treatment once a week and body treatment twice a week (GA, GB, GC, and GD where “G” stands
for group). Thirty seconds of the treatment were applied to the plants scheduled to receive body
treatment either once a week (group C) or twice a week (group D).
2.2.2. Extracting the Essential Oil from the Plants
2.2.2.1. a. Soxhlet Extraction
After fourteen weeks of the growth period, the plants were harvested and subjected to a soxhlet
extraction which, along with the steam distillation, is one of the techniques typically used to extract
essential oil.
Soxhlet extraction is a solid/liquid extraction. It involves the transfer of partially soluble
components of a solid to the liquid phase. The experimental set up for the soxhlet extraction
includes a soxhlet extractor, electric mantle heater, water condenser, and flash evaporator.
The soxhlet system requires elevated temperature (oC) which is determined by the boiling point
of the solvent used.
Soxhlet extraction is a continuous solid/liquid extraction where the solid contains the material to
be extracted. The solid is placed in a cellulose thimble, which is placed into the main chamber of
the soxhlet extractor and the solvent is allowed to pass the siphon arm with continuous refluxing.
The length of the soxhlet varies from 18 to 24 hours.

15
2.2.2.1. b. Extracting the essential oil from the plants, using soxhlet technique
After harvesting the plants from each group, the essential oil was extracted from different parts of
the plants (leaves, stems, flowers and whole plants). The experimental matrix was divided into
four groups, “GA” for control, “GB” for seed treated, “GC” for body treatment 1x/w, “GD” for
body treatment twice a week with the code names for each extraction given as follows:
GAL, GBL, GCL, and GDL - extracts in this group derived from leaves (L),
GAS, GBS, GCS and GDS - extracts in this group derived from stems (S),
GAF, GBF, GCF and GDF - extracts from flowers (F), and
GAM, GBM, GCM and GDM – extracts from the entire plant mixture (M)
Hexane was used as the extraction solvent.
2.2.2.2. High Pressure Reactor Extraction
Experiments were carried out in a specially designed reactor system, which enables one to
continuously monitor the progress of reactions, associated by gas evolution or gas uptake. The
reactor system consisted of a standard 100 mL stainless steel PARR Autoclave and a volumetric
module, shown in Figure 4. The reactor was of a design which allows the entire vessel to be
removed from the stand as a complete assembly for either charging or product recovery. The
reactor was equipped with a magnetically coupled drive with a permanent magnet for the inner
rotor, to which the stirring shaft was attached. A detailed picture of the reactor head and available
port attachments is shown in Figure 5. The first port, 1, accommodated a safety rapture disc
intended to release pressure when critical level was exceeded. Port 2 was a combination port which
held a liquid sampling and gas inlet valves. In our specific arrangement, the sampling valve was
used for siphoning out the liquid product without the need of opening the reactor. A deep tube
fitted with stainless steel frit at the tip of the tube allowed extraction of the liquid phase while
keeping the samples in the reactor for use in subsequent reactions. Port 3 was a second combination
port accommodating a pressure gage and a 1/8” stainless steel needle valve. The latter was used as
a primary gas inlet port for initially purging and pressurizing the reactor and the port itself was
connected to the volumetric section of the reactor system through a 1/8 “stainless steel tubing.

16
(a)
(b)
Figure 4. - Automated Parr Reactor (a) and Associated volumetric system (b) Picture
taken by the author during the experiment
H2
N2
CO
Vac
x
x
x
x
xx
x
1 1
11
5
4
3A2
3B
6

17
Port 4 was holding a J-type thermocouple while the remaining two ports can be fitted with a
cooling coil for accurate control of the reactor temperature in cases when exothermic reaction was
expected. In the current configuration, the cooling coil was removed to produce two additional
ports. The first additional port is left blank while the second additional port, 6 was fitted with ¼”
on/off valve used for loading the reaction solutions using gas tight syringes. A picture of the reactor
is shown in the inset of Figure 4a. (Source: Parr Operating Instruction Manual, Parr Instrument
Company, Moline, Illinois, USA)
The system was pressurized to appropriate pressure (300, 750 Psi), the reactor heated to the desired
temperature (40, 70, and 100 oC) and each extraction step was routinely carried for 20 hours similar
to soxhlet extraction at a stirring rate of 160 - 200 RPM. After this step, the reactor was cooled to
ambient temperature and the content of the reactor was collected without filtering the extracted
solution.
After each set of extraction, a rotary evaporator (model Büchi RE: 111) was used to remove the
solvent and collect the essential oil for analysis.

18
Figure 5. - Schematic of the Parr Reactor head
(Parr Operating Instruction Manual, Parr Instrument Company, 396M Series 4560 Operating
Instructions, Moline, Illinois, USA, Picture taken by the author during the experiment)
1
2
3
4
5
6

19
2.2.3. Method Development for Quantitative Analysis of Basil Oil by Gas
Chromatography (GC). Building Mass Spectral Library for Compounds Expected
to be found in Basil Plant Extracts
In the current study, both GC/FID and GC/MS were used for qualitative and quantitative analysis
of the essential oil extracts derived from the non-treated and plasma treated basil plants. The first
system, GC/FID, was used for routine quantitative analysis. The system was fitted with an
automatic sample injector and a data aquisition system allowing an uniterrupted analysis of a large
number of samples. The system generated an area report file which was automatically exported to
a compiled Excel spreadsheet via Dynamic Data Exhange Interface (DDEI) in which a spreadsheet
was used to calculate the concentration profile for each component of interest. The second system,
GC/MS, utilized in tandem with the GC/FID, was used mainly for identification of the compounds
found in the plant extracts. Both systems employed the HP5890 apparatus and were operated at
the same temperature program and used the same columns so that both systems produced the same
retention times for each component of the complex mix. In cases when the routine GC/FID analysis
revealed the presence of unexpected components, the parallel injection of the same sample in the
GC/MS system allowed for an accurate recognition of the peak of interest by fitting the retention
time and the mass spectra of the component of interest with those already available in the database.
2.2.3.1. Instrument Conditions
The GC/FID separation was carried out on a HP5890 Instrument fitted with HP7673 autoinjector
and the system itself was interfaced to PeakSimple Chromatography Data system Model 333,
manufactored by SRI Instruments. The GC/MS analysis was carried out on a HP5890 series II
equipped with 5971A mass selective detector and MS ChemStation HP G103AMS controlling the
both the GC and the MSD modules.
Both instruments were equipped with DB-624 fused silica capillary column (30 m x 0.25 mm ID,
1.40 m film thickness) using a standard temperature program with initial oven tempertaure of
70oC and ramp of 10oC/min. Unfortunately, using this set of parameters led to a poor separation
of limonene from the two isomers of ocimene. Increasing the initial temperaure to 90oC improved
significanty the separation and led to base line separation of these three components of interest.
The settings for the two temperature ramp stages are as follows:

20
Ramp 1: Initial temperature 90oC held 2 min, ramp 10oC /min to 200oC, hold 4 min
Ramp 2: 10oC/min to 240oC, hold 6 min. The injector and the detector temperature were held at
230 oC and 240 oC, respectively, with helium carrier gas flow rate of 40 cc/min at split ratio 39:1
and head pressure kept at 9 psi.
2.2.3.2. Reference Sample Preparation.
The model solution containing all potential reference compounds typically found in basil plant
extracts was made by blending 100 μl of each of the 15 reference components from Table 1 into
10 ml of hexane. The concentration of each compound in this standard mix was calculated and
listed in Table 2. Pentadecane was used as an internal standard in hexane with a concentration of
10 mg/ml. Prior to GC/MS analysis, the injection sample was prepared by combining 600 μl of the
model solution with 600 μl of the internal standard solution. The retention time of pentadecane
was not found to overlap with the retention times of the other basil components. A typical
chromatogram of standard components is shown in Figure 6.

21
Table 2. Calculations of the Concentration of the Standard Blend Solution
Components
Volume
initial Density
Mass
Calculate
Volume
Solution* Concentration
μl mg ml mg/ml
α-Pinene 100 0.858 85.8 11.5 7.5
Myrcene 100 0.791 79.1 11.5 6.9
β-Pinene 100 0.859 85.9 11.5 7.5
Limonene 100 0.841 84.1 11.5 7.3
Ocimene 100 0.818 81.8 11.5 7.1
Eucalyptol 100 0.922 92.2 11.5 8.0
Linalool 100 0.870 87.0 11.5 7.6
Camphor 100 0.990 99.0 11.5 8.6
Estragole 100 0.965 96.5 11.5 8.4
Terpineol 100 0.934 93.4 11.5 8.1
Citronellol 100 0.855 85.5 11.5 7.4
Geraniol 100 0.879 87.9 11.5 7.6
Eugenol 100 1.067 106.7 11.5 9.3
CAME 100 1.090 109.0 11.5 9.5
Pentadecane CAEE 100 1.050 105.0 11.5 9.1
* The standard samples were prepared by mixing 1.5 mL of the oil blend with 10 mL of
hexane into 10 mL stoppered graduated volumetric flask. The sample volume was
maintained with refrigerated storage conditions.

22
Figure 6. – Chromatogram of Standard Mixture of the Individual Component from FID System;
Column used, DB-624; injection: 5μl; split ratio: 39:1; initial temperature: 90 oC; holds 2 min;
Ramp 10 oC/min to 200 oC holds 4 min, Program A: Ramps 10 oC/min to 240 oC hold 6 min;
Injection and detector Temp: 230°C and 250°C

23
2.2.3.3. Extracted Oil Sample Preparation
Hexane was removed from the soxhlet extracts by rotoevaporation. The collected essential oil was
re-dissolved in hexane, the solution was quantitatively transferred into a 5 mL volumetric flask
and the final volume of the resulting solution was adjusted to the 5 mL mark with hexane. For the
preparation of the GC sample prior to injection, again 600 μl of the sample solution was combined
with 600 μl internal standard solution of pentadecane in hexane as described already in 2.2.3.2.
2.2.3.4. Determining the Response Factors (RF) for Each Component of the Oil
Composition and Calculations for the Concentration Profile in Actual Oil Extracts
As already mentioned, both GC/FID and GC/MS were used in parallel for identification and
quantitative analysis of the extracted samples. To achieve this, one needs to calculate the response
factor for each of the identified components, including the internal standard [43,44,45]. The
parameter RF as described by equation (1) below is usually calculated from a five level calibration
for each component of interest by the slope and intercept of the resulting regression between
concentrations and the resulting peak area derived from GC. In this particular study, given the time
constraints to complete the work, the response factors were calculated in Table 3 by a single point
calibration using a reference blend described in section 2.2.3.2.
𝐑𝐟 =
𝐂𝐗𝐂𝐈𝐒
𝐒𝐗𝐒𝐈𝐒
(1)
Where:
Rf is the response factor, CX and CIS are respective concentrations of the unknown component and
the internal standard, SX and SIS are the peak area of the same component and the internal standard.
Re-arranging equation (1) into equation (2) allows calculation of the unknown concentration of
the compound of interest based on the pre-determined Rf, the peak area ratio from the GC analysis
and the concentration of the added internal standard.
𝑪𝑿 = 𝑪𝑰𝑺 ∗ 𝑹𝒇 ∗𝑺𝑿
𝑺𝑰𝑺 (2)
This approach was used to program an Excel spreadsheet to calculate both the response factors for
the 16 compounds of the reference blend and the concentration of the compounds found in actual

24
plant extracts before and after particular plasma treatment (for calculations, see Table B1 and B2
given in Appendix B).

25
Table 3. Response Factor Calculated from Area Report of the Standard Mix
Components Sx
(components)
S (IS) Sx/SIS *RF = (Cx/Cis)/(Sx/Sis)
a-Pinene 51.627 122.260 0.422 1.77
Myrcene 47.370 122.260 0.387 1.78
b-Pinene 33.347 122.260 0.273 2.74
Limonene 60.175 122.260 0.492 1.49
Ocimene 53.670 122.260 0.439 1.62
Eucalyptol 87.263 122.260 0.714 2.05
Linalool 61.867 122.260 0.506 1.50
Camphor 78.200 122.260 0.640 1.35
Estragole 75.900 122.260 0.621 1.35
Terpineol 37.740 122.260 0.309 2.63
Citronellol 62.838 122.260 0.514 1.45
Geraniol 69.013 122.260 0.564 1.35
Eugenol 75.042 122.260 0.614 1.51
CAME 76.084 122.260 0.622 1.52
Pentadecane 122.265 122.260 1.000 1.00
CAEE 84.891 122.260 0.694 1.32
* These numbers are calculated from the area report from the second OB14 (abbreviation of
the mixture) test mixture. For method verification purposes, the OB14 test mix was kept in a
refrigerator and re-analyzed frequently to verify the consistency of the response factors for
each components.

26
Chapter 3
Results and Discussion
According to the previous pilot study, cold plasma treatment has been found to increase the growth
of sweet basil plant [16]. To investigate this effect, we planted and harvested sweet basil in our lab
where the main focus was to investigate the effects of cold plasma treatment on sweet basil using
different types of treatment: control [not treated (GA)], seed treated (GB), body treatment once a
week (GC), and body treatment twice a week (GD). After the treatment of the seeds, all seeds
changed color from black to purple. Right after the ACPJ treatment, the seeds were directly planted
in the area designed for the experiment. The focal point of the study was on the growth of the basil
plants and the physical effects of the ACPJ on the plants before and after the treatment. Chemical
analysis was conducted on the extracted essential oil components.
3.1 – Growth of the Basil Plants under ACPJ Treatment from Germination,
Vegetation, and Flowering
The results show effects of the plasma treatment on the plant growth in Figure 7. A week after the
germination, plasma treatment was applied to the group set to receive treatment once a week
(1X/week) and twice a week (2 X /week). Later, some plants in both groups died due (what we
speculate to be) too early of an application of the plasma. This statement was supported by the
similar deaths in the group set to receive plasma treatment once a week (1X/week), but at a lower
rate. However, more death was observed in the group that received treatment twice a week and
reduced the plant growth during the first five weeks of the treatment as compare to the control and
seed treated plants. The issue of plant death led us to investigate other biologic issues such as lack
of hormone (auxin) or damage of salt bridge that facilitates water and nutrient uptake from the
roots (aquaporin) [46]. Aquaporin is describe as the water channel of the cell plant, which is to
facilitate water in and out of the cell and preventing the passage of ions and other solutes to the
cell plants. Given a rest period from plasma treatment, the plants recovered quickly and grew faster
in the last two weeks than the controls. Since then, they became more robust, stronger in their
stems and larger in their leaves compared to the control group.

27
Figure 7. - Treatment Effects on the Growth of Sweet Basil Plants

28
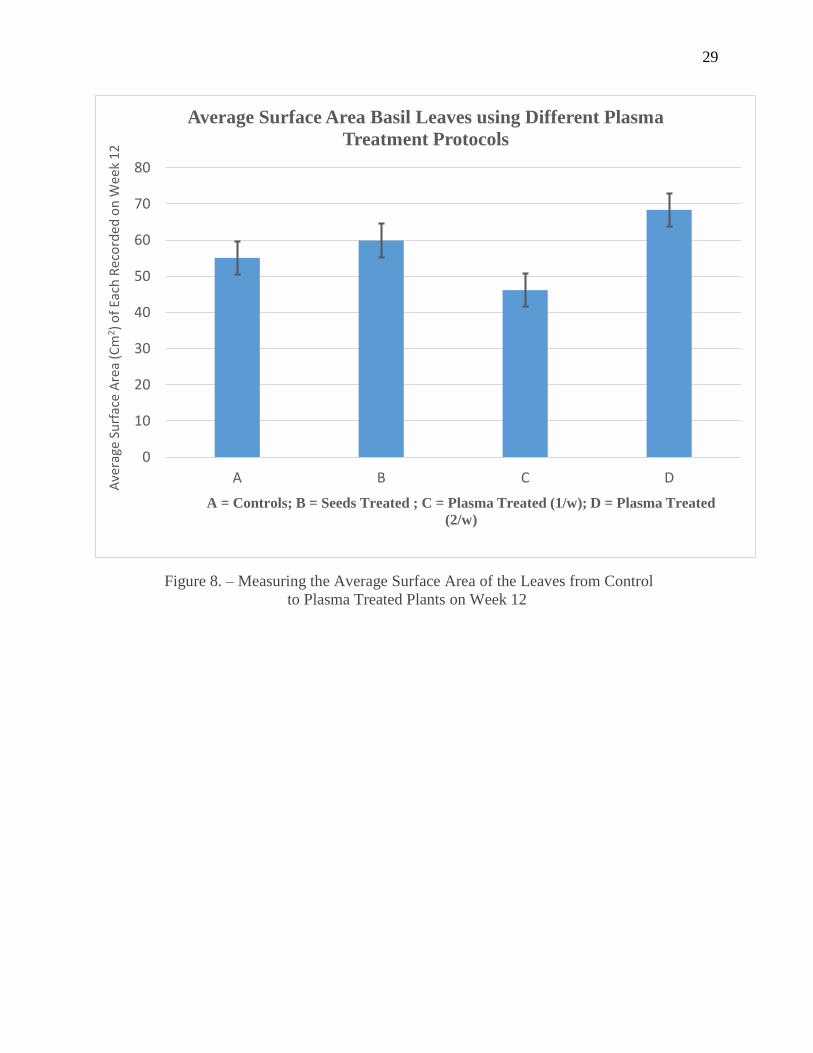
Figure 8 showed the approximately average surface area of the leaves measured at the end of the
growth. The plants treated with ACPJ showed growth increase in their leaves and stems throughout
the study especially in the last week of the measurement. While plants grew, physical observations
showed the leaves and the stems became stronger, larger, and more robust in the plant that received
double treatment with the plasma than the control. The length and width of the leaves were
measured in randomly selected groups of ten plants from each group where the lengths were
measured from the stem to the leaf tip and the width across the middle of the leaf and the
approximate average surface area (S = length * Width) was calculated.
The determination of the surface area shows a clear effect in the plant groups that received plasma
body treatment twice a week compared to the control group. The group that received double
treatment grew faster in height in the last week as shown in Figure 8 and Figure 9 as well as in
their leaves. Also, the plants required more water, their leaves became larger and greener as they
grew up.
29
Figure 8. – Measuring the Average Surface Area of the Leaves from Control
to Plasma Treated Plants on Week 12
0
10
20
30
40
50
60
70
80
A B C D
Ave
rage
Su
rfac
e A
rea
(Cm
2)
of
Each
Rec
ord
ed o
n W
eek
12
A = Controls; B = Seeds Treated ; C = Plasma Treated (1/w); D = Plasma Treated
(2/w)
Average Surface Area Basil Leaves using Different Plasma
Treatment Protocols

30
Figure 9. – Photos of basil plants and the physical growth. (A): Control; (B): Seeds treated with
Atmospheric Cold Plasma Jet (ACPJ); (C): Seeds Treated and body treatment once a week
(1X/W), and (D): Seeds Treated and body treatment twice a week (2X/W)

31
3.1.1. - Biological Aspect of the Growth Using ACPJ Treatment
Throughout the plant growth, different biological aspects were detected during the plant cycle.
One of the most important aspects was nutrient uptake via water coming from the plant roots. As
the plant received plasma treatment, the moisture of the soil was measured with a soil moisture
meter placed on each pot of the plant where the moisture soil was recorded. More water was needed
by the plants that received plasma treatment as compared to the control because the soil became
less moist than the control.
As the plants received plasma treatment at the early stage, they suffered stress and displayed yellow
to brown discoloration from leaves to stems, and later the plants died.
Applications of the cold plasma treatment at the early stages of vegetation might be detrimental
to the plant’s cell walls [47]. Since the cell wall is affected by the different stage of the plant, the
early application of the plasma treatment might cause a negative impact on different parts of plants
cell walls. Consequently, after the plants started their recovery from plasma treatment, certain
physical observations potentially occurred in terms of biological, physical, and chemical effects.
These effects occurred in the plants which facilitated better transport of water and nutrients from
the roots to other parts of the plants. Similar studies have shown that plasma treatment produces
positive results in certain foods, vegetables, fruit, and meat products [48].
3.2. – Qualitative Analysis of the Extracted Essential Oil Components
The concentrations of the extracted components varied between the control and the treated
samples. Figure 10 consists of four vertical panels labeled A1-A3 (control), B1-B3 (seed treated),
C1– C3 (once a week treatment), and D1 – D3 (twice a week treatment). The panels show the
sample extracts from each part of the plant, i.e., leaves, stems, and flowers.
Different components, extracted from leaves and flowers show some similarity in composition,
however they vary in relative amount in each group. In contrast, extracts from the stems contained
insignificant amounts of components of essential oil.

32
Effect of Cold Plasma on Different Parts of the Plants
Figure 10. Composition of the Basil Oil from the control group (A) and Plasma treated
groups (B - D) Recovered by Soxhlet extraction with hexane.
Components identified in order according to the standard mix, Eucalyptol (7), Linalool (8),
Estragole (10), Eugenol (14), CAME (15). Internal standard pentadecane (16)
Composition in Control sample (A)
Retention time, min
8 10 12 14 16 18 20 22 24
8
10
16
Retention time, min
8 10 12 14 16 18 20 22 24
Retention time, min
8 10 12 14 16 18 20 22 24
8 10 12 14 16 18 20 22 24
8 10 12 14 16 18 20 22 24
8 10 12 14 16 18 20 22 24
8 10 12 14 16 18 20 22 24
8 10 12 14 16 18 20 22 24
8 10 12 14 16 18 20 22 24
8 10 12 14 16 18 20 22 24
8 10 12 14 16 18 20 22 24
Retention time, min
8 10 12 14 16 18 20 22 24
7 8
10
1415
16In Flowers (A3)
In Stems (A2)
In Leaves (A1)
Composition in Seed treated sample (B)
8
10
In Flowers (B3)
In Stems (B2)
In Leaves (B1)
1415
7
10
7
15
14
16
16
15
In Leaves (C1)
In Stems (C2)
In Flowers (C3)
Composition in Body treated 1X (C)
8
10
10
10
8
1616
16
15
10
8
Composition in Body treated 2X (D)
In Leaves (D1)
In Stems (D2)
In Flowers (D3)
16 16 16
1616
14 1477
887 7 715

33
The GC profile of the oil extracts recovered from various parts of the plant clearly shows that (a)
there are some significant differences in the product distribution in the leaves and in the flowers
and (b) the ACPJ treatment had effect on the level of estragole and linalool formed in each group
of the experimental matrix. The composite data from Figure 10, representing the product
composition in extracts collected from various parts of the basil plants, can be summarized as
follows.
Product Distribution in Leaves (Figures 10 A1, B1, C1, & D1)
In extracts from leaves, estragole, 10, was found to be dominant in the control group, it decreased
in seed treated, increased in the body treatment once a week, and continued to increase in the “body
treatment twice a week” groups. In addition, linalool, 8, in the leaves was found in relatively low
amount in the control, seeds treated and “once a week” treatment, while it increased in the double
treatment group. Surprisingly, eugenol, 14, was not found in the leaves from seed to double
treatment, but it was found in minor amount in the control. Eucalyptol, 7, was detected in relative
low concentration in both the control and in the seed treated group while it increased in the body
treated plants. Overall extraction from the leaves showed five components of the essential oil in
the control group: eucalyptol, linalool, estragole, eugenol, and cinnamic acid methyl ester
(CAME). Similar composition (except eugenol) was routinely detected in plasma treated groups.
In general, linalool and estragole are the two dominant components present in the leaf extracts in
both the control and in the plasma treated plant groups.
Product Distribution in Stems (Figures 10 A2, B2, C2, & D2)
Extraction from the stems did not show any significant presence of components in control and
treated plants. Stems are used to support the plants and transport nutrients and water from the roots
throughout the different part of the plants. Since a major role of the plant stems is to facilitate the
transportation of water and nutrients to other parts of the plants, the stems do not have a large
amount of the components as other plant parts. In most plants the stems are exposed aboveground,
however in some types of plants they are hidden below the ground. The stems of the sweet basil
are exposed above ground and have been defined as a “central axis” to which all other parts of the

34
plants are attached [49]. In the growth of the plant, the stem accomplishes the role of storing and
transporting nutrients for photosynthesis.
Product Distribution in the Flowers (Figures 10 A3, B3, C3, & D3)
Compared to the leaves and the stems, the essential oil components isolated from flowers are
present in relative higher amounts than in the other parts of the plants. Linalool, 8, is predominant
in the flowers with a higher amount in the control, less in seed treated, with an increase in once
and twice a week treatment protocols. Once a week treatment in the flowers (C3) showed some
complexity in the analysis due to contamination during the extraction process. Similar to linalool,
estragole, 10, was found in a higher amount in the control, less in seeds and once a week treatment,
with an increase in double body treatment. Eugenol, 14, was found in the body treatment (1X/W)
to be at the highest level among the other groups extracted from the flowers comparable to first
preliminary study. Note that compared to the leaves, five components of essential oil were found
in the flowers: eucalyptol, linalool, estragole, eugenol, and CAME. CAME, 15, was not identified
in the two body treatment groups (1X & 2X) while linalool and estragole were the two dominant
components of the essential oil found in the flowers.
3.3 - Quantitative analysis of Essential Oils Recovered from Various parts of the
Plants in the Control and in the Plasma Treated Groups.
The response factor was used to calculate the concentration of each component determined by the
analysis. Equation 2 (section 2.2.3.4) was used to calculate the absolute concentration of each
component based on its peak area. Table 4 shows the concentration of the compounds extracted
from each part of the plant, including the total of the entire plant (“mixture”). For ten grams of
fresh basil leaves, the highest concentration (1.579 mg/ml) was observed in the double body
treatment, Figure 11a. For example, for ten grams of fresh leaves, estragole concentration was
1.071 mg/ml, 0.394 mg/ml, 0.826 mg/ml, and 1.579 mg/ml, respectively, for the control group,
seed treated, body treatment once a week, and body treatment twice a week groups in Table 4A.
Estragole was found with the highest concentration in the leaves, as shown in Table 4B and Table
B2 in the Appendix B.

35
* The assignment of the above symbols are previously described and explained in section 2.2.2.1.b. of the method.

36
Note: the description of the above symbols are previously explained in section 2.2.2.1.b. of the method.

37
In the distribution of the stem extraction, no significant essential oil was identified, Figure 11b. In
the flower extraction, linalool and estragole were predominant with the highest concentration from
five grams of fresh flowers extracted. Linalool was found to be higher in concentration from
control to the treatment, 1.978mg/g, 0.942mg/g, 1.13mg/g, and 1.766mg/g, respectively. Second
to linalool in concentration was estragole. In the flower, the concentration decreased in the seed
treated and increased in the body treatment groups, shown in Figure 11c and Table 2.
When it comes to total plant extraction (M), the concentration of the essential oil components
calculated could not be compared to the leaf and flower extraction due to non-proportionality mass
of each part on the plants, as shown in Figure 11d.
Over all, five components of the basil essential oil were identified in the study: eucalyptol, linalool,
estragole, eugenol, and cinnamic acid methyl ester (CAME). Based on the previous study,
estragole and eugenol are two main essential oil components that are effective food preservatives
and can potentially replace synthetic antioxidants, butylated hydroxyl-anisole (BHA) and
butylated hydroxyl-toluene (BHT) [16].
The pilot study found an increase of eugenol in the plasma-treated plant compared to the
commercial basil oil that contains linalool and estragole as the main essential oil components [16].
The pilot study used steam distillation for the extraction technique. However, the present study
found five main components from control to treatment with a potent difference in their
concentration by using soxhlet extraction, as shown in Figure 11. Further research will be helpful
to compare the two extraction methods.

38
Effect of Cold Plasma Treatment on Sweet Basil Plant under Soxhlet Extraction
Figure 11. – Effects of cold plasma on each component found in the extracted plant: a) leaves, b)
stems; c) flowers, and d) extraction of the whole plant with unequal amounts of each part of the
plant.

39
3.4 - The Effect of Temperature and Pressure on the Extraction of Basil Plant
Essential Oil using a High-Pressure Reactor
To look for a better recovery of the extraction of essential oil over soxhlet extraction, a high-
pressure reactor was used with approximately three grams of dry basil. The extraction was set at
three different temperatures and pressure conditions. The time of the extraction was similar to
soxhlet extraction. Results are similar between the two techniques since five components were
identified in both: eucalyptol, linalool, estragole, eugenol, and CAME shown in Figure 12a.
However, the results showed the higher the temperature the higher the concentration of the
components. In the high-pressure reactor extraction, estragole was found at the highest
concentration, followed by linalool, eucalyptol, cinnamic acid ethyl ester, and eugenol, shown in
Figure 12b.

40
Effect of the Temperature and Pressure of the Extraction System
Figure 12A. Effect of the temperature and pressure on the extraction of sweet basil oil.
Eucalyptol (7), Linalool (8), Estragole (10), Eugenol (14), CAME (15), and internal standard of
Pentadecane (16)

41
Figure 12B. – Concentration of the main components found as a function of
the temperature and pressure of the extraction

42
The above graph in Figure 12b shows results of the effect of temperature/pressure under different
conditions from 40 to 100 oC and 300 to 750 Psi. Under high pressure (300Psi) and low temperature
(40 oC), low concentration of the components was found. As temperature increased, the
concentration increased and dropped with an increase in the pressure. An increase of the essential
oil components was identified by using high pressure reactor condition.
3.5 Analysis of the Effects of Atmospheric Cold Plasma Jet
The above results reveal certain questions on the application of the cold plasma. What caused the
effects of atmospheric cold plasma in the plants? Since plasma is composed of equal numbers of
positively charged ions and negatively charged electrons, which plasma components are
responsible for the plant’s growth?
The mass flow controller indicated that gas velocity of the helium did not exceed five liters
standard per minute (LSM) from the plasma jet, Figure 2b. With 5 LSM the flow speed could not
affect the plants as compared to the previous study, which used the same mass flow controller [16].
During the plasma treatment, we did not see immediate effects, the observed effects happened
slowly throughout the growth of the plants.
In addition, to evaluate the effects of cold plasma radiation, randomly selected plants from each
group were placed next to the discharge tube, where visible and UV radiations of the plasma jet
both have maximal values. There was no effect at the surface of the plants, which was observed
during the particular treatment. The contact of the jet to the plants might create some inner reaction,
which is not visibly observed right away, Figure 13.

43
Figure 13. - Image of the body treatment at the surface of the plant leaves, Picture taken
by the author during the experiment

44
Physically, to have a good understanding of the effects of electric fields and ions of the cold plasma
in the plants, we have kept approximately the same distance between the plant surface and the jet
exit. Past research with plasma jets using argon or helium gas have shown ionization streamers
traveling with velocities in the range of 104–106 m/s that are orders of magnitude faster than the
gas flow velocities [50]. The highest densities of electrons and ions inside an argon plasma
measured under similar conditions with helium plasma have maximal values of 1018 m−3 and
electron temperature does not exceed 4.5 eV (electron-volt) [51, 52]
Daily observations were made and weekly measurement were taken to improve the effects of the
plasma. A drastic change was observed in the plants during the last stage of vegetation due to
plasma treatment: growth increased in the stems and leaves where plants required more water
daily, Figures 7-9. These changes would later clarify our understanding after the plants were
extracted and analyzed by the GC. In this study, the components of essential oils were found at
different concentrations from control to seed treated and body treatment, Figures 11, 12. Therefore,
the applications of the atmospheric cold plasma jet treatment in the plant stimulate, and speed up
the plant growth at a certain rate. In addition, plasma stimulates the production of the essential oil
components.
Research conducted by others such as Thirumdas et al., demonstrated that: “Plasma treatment
facilitates the release of bound phenolic compounds during extraction processes, which in turn
increases antioxidant properties. Therefore, it can be concluded that the use of low temperature
plasmas, a novel technology in grain processing, not only maintained the high nutritional values
of basmati rice flour, but also provided better functional properties” [53]. This particular research
on cold plasma treatment of flour and the work presented in this Thesis on sweet basil and its
essential oils are both clear evidence that using cold plasma treatment on botanicals holds much
promise in agriculture and food production and processing.

45
Chapter 4
Conclusions
The present investigation on sweet basil showed important effects of ACPJ treatment on sweet
basil. Results show that the concentration of the essential oil components extracted from different
treatments depends on treatment intensity. Estragole was found to be in the highest concentration
in the leaves as compared to the flowers. Linalool had the highest concentration in the flowers
followed by estragole, eugenol, eucalyptol, and methyl cinnamate. Results show that the highest
concentration of the essential oil found in the plant, either the leaves or flowers, are based on the
treatment time. The incorporation of the additional treatment groups in this study compared to the
previous pilot study provides a clearer picture of the chemical and physical effects of plasma
processing on basil and potentially in other botanicals.
Sweet basil cultivated in the lab was found to have a high content of essential oil, whose dominant
component in the leaves was estragole. In addition this work found that geraniol, eucalyptol,
linalool, and eugenol were found in larger amounts in the leaves. The highest amount of essential
oil found in the flowers was linalool, followed by estragole, eucalyptol, eugenol, cinnamic acid
ethyl ether, and CAME.
The identification of the essential oils was marked by a low proportion of eugenol, which varied
from 0.099mg to 1.043mg as compared that reported in the pilot study [16], which showed a higher
eugenol concentration. The natural essential oils are valued because they can be used as food
preservatives and have medicinal applications. The present study on sweet basil has shown that
the cold plasma treatment significantly affects the plant growth and the products found in the
essential oil extracts.
The main components in the leaves were found to be the estragole and linalool. In the flowers,
linalool was the predominant compound found to be nearly 20 fold higher in concentration
followed by estragole and in significantly lower level, eugenol, eucalyptol, and methyl cinnamate.

46
The most surprising results from the double-frequency plasma treatment was the significantly
higher level of estragole and linalool isolated from the leaves. The same double-frequency
treatment had little effect on the product distribution in the basil flowers.
In addition this study demonstrated that soxhlet extraction, a high pressure reactor approach
improved extraction efficiency. With high pressure, the product profiles remained the same as
soxhlet, however high pressure resulted in higher yield. However, future investigations might
further focus on the different extraction techniques of essential oils, such as accelerated solvent
extraction (ASE) and high temperature/pressure condition as these have not been investigated and
might demonstrate improved extracted of essential oils from plants treated with cold plasmas.

47
Appendixes
Appendix A. –Mass Spectra of Individual Compounds Potentially Present in Basil Plant
Extracts
Figure A1. Chromatogram of alpha-Pinene Standard

48
Figure A2. Chromatogram of Myrcene Standard

49
Figure A3. Chromatogram of beta-Pinene Standard

50
Figure A4. Chromatogram of Cis-Ocimene Standard

51
Figure A5. Chromatogram of Limonene Standard

52
Figure A6. Chromatogram of Trans- Ocimene Standard

53
Figure A7. Chromatogram of Eucalyptol Standard

54
Figure A8. Chromatogram of Linalool Standard

55
Figure A9. Chromatogram of Camphor Standard

56
Figure A10. Chromatogram of Estragole Standard

57
Figure A11. Chromatogram of Terpineol Standard

58
Figure A12. Chromatogram of Citronellol Standard

59
Figure A13. Chromatogram of Geraniol Standard

60
Figure A14. Chromatogram of Eugenol Standard

61
Figure A15. Chromatogram of Methyl Cinnamate Standard

62
Figure A16. Chromatogram of Pentadecane Standard

63
Figure A17. Chromatogram of Ethyl Cinnamate Standard

64
Appendix B
Table B1. Standard excel spreadsheet used to calculate the concentrations of
the individual components found in basil extracts
Calculations for concentration standard stock solution of oils
# Name V init Density Mass calc Volume solut*
μl mg ml
Initial stock standard mix sample
Volume of each component, μl 100 1 a-Pinene 100 0.858 85.8 11.5
Total Volume stock in hexane, ml 11.5 2 Myrcene 100 0.791 79.1 11.5
3 b-Pinene 100 0.859 85.9 11.5
4 Limonene 100 0.841 84.1 11.5
Initial standard solut 5 Ocimene 100 0.818 81.8 11.5
Internal standard PentaDecane 6 Eucalyptol 100 0.922 92.2 11.5
Mass taken, g 1 7 Linalool 100 0.870 87 11.5
Volume solvent hexane, ml 100 8 Camphor 100 0.990 99 11.5
Concentration, mg/ml 10 9 Estragol 100 0.965 96.5 11.5
10 Terpinol 100 0.934 93.4 11.5
Make GC sample 11 Citronelol 100 0.855 85.5 11.5
Take stock, μl 600 12 Geraniol 100 0.879 87.9 11.5
Take Int stand sol, μl 600 13 Eugenol 100 1.067 106.7 11.5
14 Me-Cin 100 1.090 109 11.5
Extracted solution to volume,ml 5 15 Pent decane
16 Et-Cin 100 1.050 105 11.5
* = 10 ml hexane + 1.5 ml total oil = 11.5 cc
** - IS solution is Pentadecane in hexanes, 10 mg /ml Solution for analysis made in GC vilas by taking:
xx μl of Stock and xx μl of IS solution ** 600μl # Comp S (comp) S (IS) S x/S IS RF = (Cx/Cis)/
Concentr Name Concentr Conc PentDec Ratio Cx/ (Sx/Sis)
mg/ml mg/ml mg/ml C int stand
Taken from CF 109
7.5 a-Pinene 3.73 5.00 0.7461 1 a-Pin 368.7433 447.4328 0.824 1.76683889
6.9 Myrcene 3.44 5.00 0.6878 2 Myr 300.04 447.4328 0.671 1.77526552
7.5 b-Pinene 3.73 5.00 0.7470 3 b-Pin 275.9374 447.4328 0.617 2.73860538
7.3 Limonene 3.66 5.00 0.7313 4 Lim 365.479 447.4328 0.817 1.48581591
7.1 Ocimene 3.56 5.00 0.7113 5 Ocim 330.44 447.4328 0.739 1.62034786
8.0 Eucalyptol 4.01 5.00 0.8017 6 Eucalyptol 215.02 447.4328 0.481 2.05009
7.6 Linalool 3.78 5.00 0.7565 7 Lin 386.4582 447.4328 0.864 1.49501912
8.6 Camphor 4.30 5.00 0.8609 8 Cam 355.3666 447.4328 0.794 1.3459137
8.4 Estragol 4.20 5.00 0.8391 9 Est 463.847 447.4328 1.037 1.3516744
8.1 Terpinol 4.06 5.00 0.8122 10 Terpinol 275.3046 447.4328 0.615 2.63106472
7.4 Citronelol 3.72 5.00 0.7435 11 Cit 366.8368 447.4328 0.820 1.44654415
7.6 Geraniol 3.82 5.00 0.7643 12 Ger 440.6678 447.4328 0.985 1.35407669
9.3 Eugenol 4.64 5.00 0.9278 13 Eug 486.5762 447.4328 1.087 1.51162566
9.5 Me-Cin 4.74 5.00 0.9478 14 CA_me 340.2438 447.4328 0.760 1.52306346
PentaDec 5.00 5.00 1.0000 15 PentaDec 447.4328 447.4328 1.000 0.99995665
9.1 Et-Cin 4.57 5.00 0.9130 16 CA_ee 454.7932 447.4328 1.016 1.31495883
Area report standart mix. Taken from CF 109

65
Table B2. Concentration of the basil oil extracts derived from various sections
of the plant after plasma treatment by the standard protocol.
Absolute Concentrations (mg) in the 5 mL volumetric flask in mg quantity1. Section DI-DL is wet leeves (10g) hexane extraction Symbol M stands for mix. Symbol A=control,
2. Section DM-DP is wet stems (10g), Hexane extraction Symbol B=seed treated, Symbol C=body treatment 1x week for 30sec, D=body treatment 2x per week (30 sec)
3. Section DQ-DT is wet flowers (5g) , Hexane extract
4. Section DY-EB is wet mix (10g), Ethanol extract.
ComponentsGAL GBL GCL GDL GAS GBS GCS GDS GAF GBF GCF GDF GAM GBM GCM GDM GAM-ET GBM-ET GCM-ET GDM-ET
a-Pin 0.000 0.000 0.000 0.000 0.000 0.000 0.000 0.000 0.000 0.000 0.000 0.000 0.000 0.000 0.000 0.000 0.000 0.000 0.000 0.000 a-Pin
Myr 0.000 0.000 0.000 0.000 0.000 0.000 0.000 0.000 0.000 0.000 0.000 0.000 0.000 0.000 0.000 0.000 0.000 0.000 0.000 0.000 Myr
b-Pin 0.000 0.000 0.000 0.000 0.000 0.000 0.000 0.000 0.000 0.000 0.000 0.000 0.000 0.000 0.000 0.000 0.000 0.000 0.000 0.000 b-Pin
Lim 0.000 0.000 0.000 0.000 0.000 0.000 0.000 0.000 0.000 0.000 0.000 0.135 0.000 0.000 0.000 0.000 0.000 0.000 0.000 0.000 Lim
Ocim 0.000 0.000 0.000 0.000 0.000 0.000 0.000 0.000 0.000 0.000 0.000 0.000 0.000 0.000 0.000 0.000 0.000 0.000 0.000 0.000 Ocim
Eucalyptol 0.522 0.232 0.791 0.797 0.000 0.000 0.000 0.000 0.575 0.586 0.542 0.633 0.940 0.313 0.390 0.665 0.804 0.348 1.028 1.089 Eucalyptol
Lin 0.445 0.224 0.391 1.726 0.174 0.000 0.000 0.000 9.893 4.714 5.655 8.829 3.523 1.724 2.021 2.402 2.516 1.693 5.723 5.773 Lin
Cam 0.000 0.000 0.000 0.000 0.000 0.000 0.000 0.000 0.000 0.000 0.000 0.000 0.000 0.000 0.000 0.000 0.000 0.000 0.000 0.000 Cam
Est 5.354 1.971 4.130 7.897 0.265 0.000 0.200 0.323 5.566 2.430 1.096 2.609 3.047 4.091 4.443 3.500 5.633 2.690 7.552 7.106 Est
Terpinol 0.000 0.000 0.000 0.000 0.000 0.000 0.000 0.000 0.000 0.000 0.000 0.000 0.000 0.000 0.000 0.000 0.000 0.000 0.000 0.000 Terpinol
Cit 0.000 0.000 0.000 0.000 0.000 0.000 0.000 0.000 0.000 0.000 0.000 0.000 0.000 0.000 0.000 0.000 0.000 0.000 0.000 0.000 Cit
Ger 0.552 0.000 0.000 0.000 0.000 0.000 0.000 0.000 0.000 0.000 0.000 0.000 0.000 0.000 0.000 0.000 0.000 0.000 0.000 0.000 Ger
Eug 0.322 0.099 0.342 0.000 0.000 0.000 0.000 0.000 0.434 0.375 1.043 0.274 0.545 0.000 0.299 1.474 0.324 0.000 0.950 0.733 Eug
CA_me 0.000 0.000 0.000 0.000 0.000 0.000 0.000 0.000 0.361 0.000 0.457 0.209 0.128 0.000 0.111 0.000 0.503 0.226 0.972 0.734 CA_me
CA_ee 0.000 0.000 0.000 0.000 0.000 0.000 0.000 0.000 0.365 0.000 0.000 0.094 0.000 0.000 0.000 0.000 0.000 0.000 0.000 0.000

66
References
1. Amorati, R.; Foti, MC. Valgimigli, L.; “Antioxidant activity of essential oils”, J. Agr. Food
Chem. 2013, 61 (46), 10835–10847.
2. Nera, EA.; Lok, E.; Iverson, F.; Ormsby, E.; Karpinski, KF.; Clayson, DB.; “Short-term
pathological and proliferative effects of butylated hydroxyl-anisole and other phenolic
antioxidants in the forestomach of Fischer 344 rats”, Toxicol. 1984, 32, 197-213.
3. Parke, DV; Lewis, DF; “Safety aspects of food preservatives”, Food Addit, Contam 1992,
9, 561-577.
4. Lim, ASL; Rabeta, MS.; “Proximate analysis, mineral content and antioxidant capacity of
milk apple, Malay apple and water apple”, Int. Food Res J. 2013, 20, 2, 673–679.
5. Rabenhorst, J.; “Production of methoxyphenol-type natural aroma chemicals by
biotransformation of eugenol with a new Pseudomonas sp”. Appl. Microbiol Biotechnol.
1996, 46, 470 – 474.
6. Mallavarapu, Gopal, R.; Ramesh, S.; Chandrasekhara, R. S.; Rajeswara Rao, B. R.; Kaul,
P. N.; Bhattacharya, A. K.; "Investigation of the essential oil of cinnamon leaf grown at
Bangalore and Hyderabad". Flavour and Fragrance Journal, 1995, 10, 4, 239–242.
7. Jayasinghe, C.; Gotoh, N.; Aoki, T.; Wada, S.; “Phenolic composition and antioxidant
activity of sweet basil (Ocimum basilicum L.)”, J. Agr. Food Chem. 2003, 51, 4442– 4449.
8. Valgimigli L. “Essential oils: an overview on origins, chemistry, properties and uses”, in:
Valgimigli L, editor. Essential oils as natural food additives, New York, Nova Science
Publishers, 2012, pp 1-24.
9. Lai, L. S.; Chou, S.T.; Chao, W.W.; “Studies on the Antioxidative activities of Hsian-Tso
(Mesona procumbens Hemsl) leaf gum”, Journal of Agricultural and Food Chemistry, 49
2001, 963-968.
10. Duh; “Antioxidant activity of burdock (Arctium lappa Linne): its scavenging effect on
free radical and active oxygen”, Journal of the American Oil Chemist's Society, 75 1998,
455-465.
11. Kinsella, J.E.; Frankel, E.; German, B.; Kanner, J.; “Possible mechanism for the protective
role of the antioxidant in wine and plant foods”, Food Technology, 47 1993, pp. 85-89.

67
12. Joana, SB.; Érica, OB.; Beatriz, CS.; Paula, FM.; Vitor, CA.; Jesuí, VV.; “Evaluation of
solvent effect on the extraction of phenolic compounds and antioxidant capacities from the
berries application of principal component analysis” Chem. Cent J. 2014, 8, 48–56.
13. Isabel, CFR.; Ferreira, Paula, B.; Miguel, VB.; Lillian, B.; “Free-radical scavenging
capacity and reducing power of wild edible mushrooms from northeast Portugal individual
cap and stipe activity”. Food Chem. 2007, 4, 1511–1516.
14. Amarowicz, R.; Pegg, RB.; Rahimi, PM.; Barl, B.; Weil, JA.; “Free-radical scavenging
capacity and antioxidant activity of selected plant species from the Canadian
prairies”, Food Chem. 2004, 5, 551–562.
15. Juntachote, T.; Berghofer, E.; “Antioxidative properties and stability of ethanolic extracts
of holy basil and Galangal”, Food Chem. 2005, 92, 2, 193–202.
16. Buonopane, G.J.; Antonacci, C.; Lopez, J.; “Effect of Cold Plasma Processing on
Botanicals and Their Essential Oils”, Plasma Medicine, 2016, 6, (3–4): 315–324.
17. Goldston, R.J.; Rutherford, P. H.; Introduction to Plasma Physics. Taylor & Francis.
1995, p. 1−2.
18. Fernández, A.; Shearer N.; Wilson, D.; and Thompson, A.; "Effect of microbial loading
on the efficiency of cold atmospheric gas plasma inactivation of Salmonella enterica
serovar Typhimurium", International Journal of Food Microbiology, 2012, 152, (3), 175-
180.
19. Kim, H.; Jayasena, D.; Yong H.; and Jo, C.; "Quality of Cold Plasma Treated Foods of
Animal Origin", Cold Plasma in Food and Agriculture, 2016, 273-291.
20. Pasquali, F. ; Stratakos, A.; Koidis, A.; Berardinelli, A.; Cevoli, C.; Ragni, L.; Mancusi,
R.; Manfreda, G.; and Trevisani, M.; "Atmospheric cold plasma process for vegetable leaf
decontamination: A feasibility study on radicchio (red chicory, Cichorium intybus L.)",
Food Control, 2016, (60), 552-559.
21. M. Moisan, J. Barbeau, S. Moreau, J. Pelletier, M. Tabrizian and L. Yahia, "Low-
temperature sterilization using gas plasmas: a review of the experiments and an analysis of
the inactivation mechanisms", International Journal of Pharmaceutics, 2001, 226, (1-2), 1-
21.
22. H. Lee, J. Kim, M. Chung and S. Min, "Cold plasma treatment for the microbiological
safety of cabbage, lettuce, and dried figs", Food Microbiology, 2015, 51, 74-80.

68
23. Gazeli, K.; Svarnas, P.; “Investigation on streamers propagating into a helium jet in air at
atmospheric pressure: Electrical and optical emission analysis”, Journal of Applied
Physics, 2013, 114, 103304.
24. Gazeli K.; Noel, C.; Clement, F.; Dauge, C.; Svarnas, P.; and Belmonte, T.; “Plasma
Sources”, Sci. Technol. 2013, 22, 025020.
25. Nordqvist, Joseph. "Why everyone should eat basil." Medical News Today. MediLexicon,
Intl., 3 Jan. 2018, Web.4 Apr. 2018. www.medicalnewstoday.com/articles/266425.php.
26. Denise, Brentan.; Silva, Izabel; Cristina, Casanova; Turatti; “Mass Spectrometry of
Flavonoid Vicenin-2, Based Sunlight Barriers in Lychnophora species”, Scientific Reports
2014, volume 4, 4309.
27. Juntachote, T.; Berghofer, E.; “Antioxidative properties and stability of ethanolic extracts
of holy basil and Galangal”, Food Chem. 2005, 92, 2, 193–202.
28. Gutierrez, J.; Barry-Ryan, C.; Bourke, P.; “The antimicrobial efficacy of plant essential oil
combinations and interactions with food ingredients”, Int. J. Food Microbiol. 2008, 124,
91-97.
29. Emily, Y.; Chew; “Lutein, Zeaxanthin and Omega-3 Fatty Acids for Age-Related Macular
Degeneration The Age-Related Eye Disease Study 2 (AREDS2) Randomized Clinical
Trial”, JAMA, 2013, Vol 309, 19.
30. Liu, R.; Wang, T.; Zhang, B.; Qin, L.; Wu, C.; Li, Q.; Ma, L.; "Lutein and zeaxanthin
supplementation and association with visual function in age-related macular
degeneration". Invest. Ophthalmologic. Vis. Sci. 2014, 56, 1, 252–8.
31. Gobbo-Neto, L.; “Evaluation of the Anti-inflammatory and antioxidant activities of di-C-
glucosyl flavones from Lychnophora ericoides (Asteraceae)”, Planta Med. 2005, 71, 3–6.
32. Ashraf, Y.; El-Dakar; “Possibility of using basil (Ocimum basilicum) supplementation in
Gilthead sea bream (Sparus aurata) diet”, The Egyptian Journal of Aquatic Research,
2015, 41, 203-210.
33. Amirkhani, N.; Firouzbakhsh, F.; “Protective effects of basil (Ocimum basilicum)
ethanolic extract supplementation diets against experimental Aeromonas hydrophila
infection in common carp (Cyprinuscarpio)”, Aquac. Res., 2013, 1-9.
34. https://www.nutrition-and-you.com/basil-herb.html (accessed March 14, 2018).

69
35. Zellner, B. A.; Dugo, P.; Dugo, G.; Mondello, L.; Baser, K. H. C.; Buchbauer, G.;
Analysis of essential oils, Science, Technology and Applications, CRC Press, Boca Raton
2010, 151-184.
36. James, A. T.; Martin, A. J. P.; Biochem. J.; 1952, 50, 679 – 690.
37. Jennings, W. G. J.; High. Resolut. Chromatgr. 1979, 2, 221 – 224.
38. Dressler, M.; Selective Gas Chromatographic Detectors; Elsevier Science Publishers:
Amsterdam, Netherlands, 1986.
39. Lacroix, B.; Huvenne, J. P.; Deveaux, M.; J. Chromatogr. 1989, 492, 109 – 136.
40. Duquesnoy, E.; Marongiu, B.; Castola V.; Piras, A.; Porcedda, S.; Casanova, J.; Nat.
Prod. Commun, 2010, 5, 1995 – 1998.
41. D’Acampaora, Z. B.; Dugo, P.; Dugo, G.; Mondello, L.; J. Chromatogr. A. 2008, 1186,
123 – 143.
42. Turner, M.; Physics of Cold Plasma, “Fundamentals and Applications”. Dublin, Ireland:
Academic Press. 2016.
43. Mohamed, M. A.; Ibrahim, M.E.; Wahba, H.E.; and Khalid, K.A.; “Yield and essential oil
of sweet basil affected by chemical and biological fertilizers”. Res. J. Med. Plant, 2016,
10, 246-253.
44. Adams, R.P.; Identification of Essential Oil Components by Gas Chromatography / Mass
Spectroscopy. Second Ed. Allured Publishing Corporation, Carol Stream, IL, USA. ISBN-
13: 9780931710421, Pages: 469, 1995.
45. Rome, K.; & McIntyre; “An Intelligent use of Relative Response Factors in Gas
Chromatography-Flame Ionization Detection”. Chromatography Today, 2012, 52.
46. Péret, Benjamin; Guowei, Li; Jin, Zhao; & Leah, Band, R.; “Auxin regulates aquaporin
function to facilitate lateral root emergence”, Nature Cell Biology 2012, 14, 991–998.
47. Pasquali, F.; Stratakos, A.; Koidis, A.; Berardinelli, A.; Cevoli, C.; Ragni, L.; Mancusi,
R.; Manfreda, G.; and Trevisani, M. "Atmospheric cold plasma process for vegetable leaf
decontamination: A feasibility study on radicchio (red chicory, Cichorium intybus L.)",
Food Control, 2016, vol.60, 552 -559.
48. Kim, H.; Jayasena, D.; Yong, H.; and Jo, C.; "Quality of Cold Plasma Treated Foods of
Animal Origin", Cold Plasma in Food and Agriculture, 2016, pp.273-291.
70
49. Ben, G.; Bareja; “The Plant Stem, Functions, Parts and Classifications”, 2010,
http://www.cropsreview.com/plant-stem.html, Accessed March 15, 2018.
50. Lu, X.; Naidis, G.V.; Laroussi, M. K.; “Ostrikov Guided ionization waves: theory and
experiments” Phys. Rep., 540 2014, 123-166
51. Hubner, S.; Hofmann, S.; Van Veldhuizen, E.M.; Bruggeman, P.J.; “Electron densities
and energies of a guided argon streamer in argon and air environments”, Plasma Sources
Sci. Technol., 22, 2013, Article 065011 (8).
52. Alexander, G.; Volkova, Kunning; Xub, G.; Vladimir, Kolobovcd, I.; “Cold plasma
interactions with plants: Morphing and movements of Venus flytrap and Mimosa pudica
induced by argon plasma jet”, Bioelechem.2017.07.011, Vol (18), 2017, 100- 105.
53. Thirumdas, R.; Deshmukh, RR; Annapure, US; “Effect of low temperature plasma on the
functional properties of basmati rice flour”, J. Food Sci. Technol. 2016, Jun; 53, 6, 2742-
2751.