The effects of alphabet and expertise on letter perception
57
1 The effects of alphabet and expertise on letter perception Robert W. Wiley, Colin Wilson, and Brenda Rapp Department of Cognitive Science Johns Hopkins University Running head: Effects of expertise on letter perception Author for correspondence: Robert W. Wiley Department of Cognitive Science Johns Hopkins University 237 Krieger Hall 3400 North Charles Street Baltimore, MD 21211 Manuscript
Transcript of The effects of alphabet and expertise on letter perception

1
The effects of alphabet and expertise on letter perception
Robert W. Wiley, Colin Wilson, and Brenda Rapp Department of Cognitive Science
Johns Hopkins University
Running head: Effects of expertise on letter perception
Author for correspondence: Robert W. Wiley Department of Cognitive Science Johns Hopkins University 237 Krieger Hall 3400 North Charles Street Baltimore, MD 21211
Manuscript
robertwiley
Typewritten Text
Copyright 2016 by the American Psychological Association, Inc. This article may not exactly replicate the authoritative document published in the APA journal. It is not the copy of record. http://dx.doi.org/10.1037/xhp0000213
robertwiley
Typewritten Text
robertwiley
Sticky Note
Accepted set by robertwiley

2
Abstract
Long-standing questions in human perception concern the nature of the visual features that
underlie letter recognition and the extent to which the visual processing of letters is
affected by differences in alphabets and levels of viewer expertise. We examined these
issues in a novel approach using a same-different judgment task on pairs of letters from the
Arabic alphabet with two participant groups—one with no prior exposure to Arabic and one
with reading proficiency. Hierarchical clustering and linear mixed-effects modeling of
reaction times and accuracy provide evidence that both the specific characteristics of the
alphabet and observers’ previous experience with it affect how letters are perceived and
visually processed. The findings of this research further our understanding of the multiple
factors that affect letter perception and support the view of a visual system that dynamically
adjusts its weighting of visual features as expert readers come to more efficiently and
effectively discriminate the letters of the specific alphabet they are viewing.
Keywords
letter perception, Arabic alphabet, reading, expertise, visual features

Introduction
3
Introduction
Experimental psychologists have investigated letter perception since the founding days of
the discipline (Javal, 1881; Cattell, 1886). Letters have been of such interest because of their
critical role in reading and because—as relatively simple visual objects—their study can
provide insights into object recognition more generally. According to feature detection
theories1, a key component of object recognition is the response of visual cortex to specific
features of a visual stimulus (for a review see Palmer, 1999 and for letter perception
specifically Grainger et al., 2008). Consistent with this view, Pelli et al. (2006) presented
arguments that human readers employ a feature-detection approach to letter recognition as
opposed to other approaches such as template matching. Within this general framework,
considerable research has been directed at identifying the set of features used in letter
recognition, with recent work by Fiset and colleagues (2008, 2009) arguing for a specific set
of ten visual features for letter recognition, most of which had support from previous
research.
The vast majority of the work on visual feature processing in letter recognition has
involved proficient adult readers of languages that use the Roman alphabet (but see
Changizi et al., 2006; Gibson et al., 1962; Pelli et al., 2006; Treiman, 2011; Wang & Cavanagh,
1993). Therefore, it is unclear from the literature the extent to which the visual feature set
and visual processes used in letter recognition are the same across different alphabets and
different levels of expertise/proficiency. In this regard, previous work has shown that
performance on tasks involving letter perception may be generally affected by experience
1 Feature detection theories are distinguished from alternatives such as template-matching or exemplar-based accounts which propose that objects are recognized by a process that compares the whole object to a prototype or template, rather than making use of local features within the stimulus. While ideal observer analyses have shown that template matching may be more efficient than feature detection, empirical findings indicate that normal literate adults may not adopt this approach (Pelli et al. 2006, Fiset et al., 2008; Tjan, Braje, Legge & Kersten, 1995).

Introduction
4
and various knowledge-based factors (Egeth & Blecker, 1971; Wang et al., 1994) and,
furthermore, there is evidence that literacy can affect activation in occipital cortex (Dehaene,
et al., 2010). However, the experimental designs and analytic techniques employed have not
usually allowed researchers to determine if these factors affect visual feature processing
itself or if they affect other aspects of performing the particular experimental tasks. In the
research reported here, we use the novel approach of applying linear mixed-effects
modeling (LMEM; Baayen et al., 2008; Barr et al., 2013) to the analysis of reaction time and
accuracy data from same/different judgments of Arabic letters carried out by naïve and
expert readers of Arabic. This allows us to make progress on several fronts. First, the use of
the Arabic alphabet allows us to compare visual processing of Arabic and Roman letters
(reported in Fiset et al. 2008, 2009). Second, the use of viewers with different levels of
expertise allows us to examine the effects of experience on visual processing of letters.
Third, the analytic approach adopted allows us to better localize the observed behavioral
effects to visual processes themselves . In this way, this research allows us to investigate if
and how the visual processing of letters is consistent (universal) across stimulus sets and
viewer expertise. Addressing these issues is not only important for a deeper understanding
of the cognitive machinery of letter identification, it is also relevant for guiding the teaching
of first and second language reading as well as the rehabilitation of reading in the visually
impaired or those with acquired perceptual deficits due to neural injury.
On notions of universality
It is important to indicate from the outset that there are various positions regarding the
universality of visual feature processing across stimulus sets and tasks and the effects of
learning on visual feature representation and processing. Briefly, as indicated by Schyns et
al. (1998), one general position is that the visual feature set is fixed and another is that it is

Introduction
5
flexible and can be rapidly affected by learning (e.g. Pelli et al., 2006) and shaped by the
specific demands of the learning task and other factors (e.g., alphabet and expertise).
However, even if we assume that the feature set is flexible there are still a variety of ways of
thinking about that flexibility. For example, one is that learning may affect the set of visual
feature per se by adding or subtracting features or otherwise changing the nature of the
features (for a review, see Schyns et al., 1998). Another is that the feature set itself is
actually fixed, but that the ranking or relative importance of features can be affected by
learning and experience (e.g. Haider & Frensch, 1996; Livingston & Andrews, 1995). It is not
clear how, or even if, it is possible to distinguish between these two interpretations of the
flexibility view. This is especially true if one assumes a fixed feature set with a possible
ranking = 0. In that case, evidence of “new” features would be interpreted as moving the
ranking of an existing feature to a value greater than 0. Despite these interpretative
difficulties it is nonetheless possible to further our understanding of whether and how
alphabet and expertise affect visual feature processing during letter recognition. Evidence
that these factors do affect letter feature processing would, at a general level, provide
further evidence of the dynamic nature of the visual system and, at a specific level, provide
insight into some of the particular characteristics of visual letter processing and learning.
The challenge of isolating visual feature processing: Effects of experience
Because any behavioral task involves numerous processing stages and representational
types, the perennial challenge for cognitive research is to identify, amongst the many
processes involved in a task, the one(s) that are affected by the experimental manipulations
or factors of interest. In this paper we make a distinction between “knowledge-based factors”
as effects that stem from the activation of knowledge that is associated with the stimuli
(such as phonological names and motoric stroke patterns) but unrelated to their visual
Introduction
6
feature processing, and “visual expertise” as effects of extensive experience with visual
processing of the stimuli. The problem is that either of these can affect performance on
tasks commonly used to investigate visual perception and the challenge is to distinguish
these types of factors from one another.
In terms of the question of the influence of expertise on visual processing, despite
the common assumption that the basic machinery of vision is universal, there is also
evidence that experience with a stimulus set can influence performance on perceptual tasks
(e.g., for a review see Schyns et al., 1998, and also: Delorme et al., 2004; Grill-Spector &
Kanwisher, 2005; Schyns & Oliva, 1999; and for letters specifically: Lupyan et al, 2010). For
example, there is considerable evidence that with overlearned stimuli (such as letters, word
or faces; Wolfe, 2000) task-irrelevant information may become active and affect
performance. Along these lines, neuroimaging studies involving visually presented letters
have shown activity in neural areas that represent the motor programs used to write letters
(James & Atwood, 2009) as well as activity related to the abstract identity of letters and
their spoken names (Rothlein & Rapp, 2014). However, although effects of familiarity and
training on perceptual judgments and processing have been well-documented, it still
remains unclear exactly how early in visual processing these effects of learning extend (see
Wolfe, 2000 for a review), in other words it is unclear if these observed effects of learning
and expertise are due to changes in visual processing per se.
The literature reveals inconsistent results regarding possible influence of what we
are referring to as knowledge-based factors on letter perception. Simpson et al. (2013),
using subjective similarity ratings for letter pairs, concluded that any effects of letter-sound
or identity knowledge were “not strong enough to mask the effect of visual similarity” (p.
436) Consistent with this, Courrieu et al. (2004) found no evidence of phonological

Introduction
7
encoding affecting perceptual judgments in simultaneous same/different judgments.
Lupyan et al. (2010) also reported no evidence of letter identity knowledge on simultaneous
same/different judgments (with stimuli consisting of the pairs Bb, Bp, BB, and bb), but did
find such effects with stimulus onset asynchronies greater than zero. In contrast, others
have argued for the influence of non-visual knowledge on various visual tasks. In work
following up on Lupyan et al (2010), Chen and Proctor (2012) found the influence of letter
identity information both with simultaneous and delayed presentation. Mueller &
Weidemann (2012) also found evidence of the influence of abstract letter category in
experiments in which participants had to identify target letters between pre- and post-
masks while the content of the masks was manipulated. With regard to other knowledge-
based factors, Treiman & Kessler (2004) reported that the interaction between the visual
similarity of letters and the phonological similarity of their names influences the learning of
letters by children. In short, even this brief, non-exhaustive review indicates that findings
regarding the influence of factors that are not strictly visual in nature on visual processing
of letters are mixed. Given this state of the literature it cannot be safely assumed that
knowledge-based factors will not influence the perceptual judgments that form the basis of
researchers’ inferences regarding the effects of expertise and alphabet on visual processing.
Clearly, a better understanding of the role of these factors is needed and, if effects of
knowledge-based factors are indeed present, it would be helpful to have a means for
extracting their contributions from the data obtained in perceptual tasks.
In this research, we adopt the regression analysis approach of LMEM that is well
suited to statistically extracting the contributions of experience-based factors in order to
evaluate their significance and more successfully isolate visual feature processing itself. We
specifically consider the influence of the following knowledge-based factors: letter name
similarity, motor similarity, alphabetic order, abstract identity, and Roman alphabet

Introduction
8
similarity (the perceived similarity of Arabic letters to Roman letters). Most of these could
be relevant only to experienced readers of Arabic (e.g., letter name, motor similarity,
alphabetic order), while others (e.g., Roman alphabet similarity) may be relevant to both
groups of participants. By including these variables in the statistical models we are able to
get a view of the visual feature processing in letter identification that is less biased by the
influence of these knowledge-based factors.
Visual feature processing in letter identification.
With regard to the universality of visual feature processing across alphabets, Pelli et al.
(2006) compared the performance of human observers in identifying letters (from a
number of different alphabets) embedded in Gaussian noise to an ideal observer and
concluded that the mental computations subserving object recognition are the same for
letters as for any other object, and that, regardless of the alphabet, letter identification can
be achieved by the detection of approximately seven independent visual features. In the
research we report on here, the choice of Arabic letter stimuli will allow us to determine
how well the specific features proposed on the basis of the Roman alphabet by Fiset et al
(2008, 2009) generalize to Arabic.
In Wolfe’s review (2000) of research on the basic feature set of vision, he identified
8-10 basic feature dimensions (color, orientation, motion, size, curvature, depth, Vernier
offset, gloss, intersection and spatial position/phase) (see also Palmer, 1999). In terms of
specific features used in letter identification, using an image classification approach with
Roman letters (Bubbles method; Gosselin & Schyns, 2001), Fiset et al. (lower- and
uppercase letters, 2008; uppercase only, 2009) proposed a set of ten visual features for
letters: lines (horizontal, vertical, oblique right and left), curves (open to the top, bottom,
left, and right), intersections, and terminations—effectively a subset of those enumerated

Introduction
9
by Wolfe (2000). Fiset et al. especially underscored the role of horizontal lines and
terminations proposing : “we are confident that the prime importance of terminations and
horizontals, in particular, and the relative importance of the other features for human
participants is due to constraints imposed by the human visual system rather than
constraints imposed by the stimuli or analyses,” (p. 33). Thus, they seem to propose a
fundamental role for these features that is determined by the nature of the visual system
itself and might not be expected to vary with alphabet (stimulus set) or expertise. Although
methodologically creative and sound, the Bubbles method does require the presentation of
degraded stimuli, leaving open the question of how well the Fiset et al. feature set
generalizes to normal viewing conditions.
Previous work on visual features and early visual processes has involved a wide
range of tasks including: visual search (Malinowski & Hübner, 2001; Treisman & Gelade,
1980), same-different judgments (e.g., Podgorny & Garner, 1979; Courrieu, Farioli, &
Grainger, 2004), letter naming (e.g., Gervais et al., 1984; Keren & Baggen, 1981), and explicit
similarity ratings (e.g., Boles & Clifford, 1989; Simpson et al., 2013). The research we report
on here shares with many of these approaches the assumption that letter confusability
reveals similarity and that, in turn, similarity reveals underlying visual feature
representations. In other words, it is assumed that two letters are confused with one
another (or are difficult to discriminate) (e.g., A and R) because they share visual features.
In this approach, letter confusability matrices are typically developed and the similarity
structure of the matrices is then evaluated to infer underlying visual features.
However, the various tasks used to generate confusion matrices have specific
strengths and weaknesses. For example, although letter naming paradigms have strong
ecological validity, errors rates on these tasks are usually very low, and to increase error
Introduction
10
rates, single letter stimuli are typically presented for naming under abnormal visual
conditions such as eccentric presentation, visual degradation, brief exposure duration, etc.
(for a review, Mueller & Weidemann, 2012). This raises the concern that the visual feature
sets derived from confusions elicited under abnormal viewing conditions might not
correspond to those involved under normal conditions (Fiset et al., 2008; Pelli et al., 2006).
On the other hand, a task such as explicit visual similarity ratings of letter pairs allows for
normal viewing conditions but may be especially susceptible to strategies and the influence
of knowledge (e.g., letter names) that should be irrelevant to judging if two shapes are
physically identical or not. In the research we report on here, we have chosen to examine
data from speeded same-different judgments for letter pairs as this task allows for normal
viewing conditions, while somewhat limiting the use of strategies and the influence of task
irrelevant knowledge. The patterns of reaction time and accuracy obtained from this task
can be analyzed to reveal the underlying visual representations that can then be evaluated
for effects of alphabet and expertise. We specifically assume that longer response times and
lower accuracy for same/different judgments reflect greater discrimination difficulties and,
hence, greater similarity.
With regard to specific visual features, we examined 15 feature types selected
largely on the basis of the previous literature: oriented lines (horizontal, vertical, slant right,
slant left), oriented curves (open left, right, up, down), intersections, terminations, closed
space, cyclicity, and symmetry (the latter three proposed by Gibson, 1969, among others) as
well as two novel features related to characteristics of the Arabic alphabet: dots (diacritics)
and closed curves2. The choice of alphabet, task, participant groups and analytic approach
2 In Arabic, many letters are distinguished solely on the basis of the number and location of diacritics. As for “closed curves”, there are a number of curves (e.g., و and ف ) that are so small that the approach of Fiset et al., (2008 and 2009) to treat closed curves (such as in the letter O) as four separate open, oriented curves did not seem appropriate.

Introduction
11
allowed us to evaluate whether and to what extent the visual processing of these features is
consistent across levels of expertise and alphabet.
The Arabic alphabet: A brief overview.
The Arabic alphabet is used today for writing not only the Arabic language but also several
other languages with millions of speakers, including Persian and Urdu. The Arabic alphabet
is usually considered to have 28 letters representing consonants and three long vowels.
Short vowels are indicated only by diacritic marks above or below the consonant after
which they occur phonologically and are not usually included in text written for adult
readers. Both individual letters and whole words are written in cursive from right to left,
with spaces occurring only between words or after a non-ligating letter. The ligation, or
attachment, between letters is taught as part of the letter-form (much as the ligations are
taught in cursive letters in the Roman alphabet for letters such as "p" or "w"). However, 6
of the 28 letters do not attach to the following letter, creating small gaps within the
structure of the words. There are two characteristics of this writing system that are highly
distinct from the Roman alphabet. First, each letter is described as having a form that
encodes whether it is in the initial, medial, final, or isolated position (see Figure 1).
Positions do not refer to absolute position in the whole word but rather position within so-
called “subwords” (Lorigo & Govindaraju, 2006) that are formed by the gaps between non-
ligating letters. Another distinctive feature is the use of diacritic marks (dots) to distinguish
one letter from another. Several shapes are distinguished only by the number of dots (zero
to three) and their location (above, below, or within the shape). Note that this differs from
the dots in “i” and “j”, which are not distinctive. Figure 1 illustrates key characteristics
of the Arabic alphabet that will be relevant to this study.

Introduction
12
The current study.
In sum, there has been long-standing interest in understanding the effects of experience and
knowledge on visual processing and, specifically, whether visual feature processing itself is
affected by these factors. A fundamental challenge for research on this topic has been to
identify the contribution of knowledge-based and other factors on the perceptual judgments
that serve as the data base from which to infer visual processing characteristics. The study
we report on here, through the comparison of the performance of naïve and expert viewers
of Arabic and the application of LMEM analyses addresses the following questions, both
methodological and theoretical: 1) Is LMEM a useful tool in the analysis of perceptual
judgment data allowing for the identification of possible knowledge-based factors and, in so
doing, providing a clearer view of visual processing? 2) Are there specific knowledge-based
factors that influence perceptual judgments of letters? 3) Is visual feature processing
comparable for Arabic and Roman letters? And, if not, how do they differ? 4) Is visual
processing itself affected by expertise with a stimulus set (alphabet)? The answers to these
questions are relevant to our understanding of letter perception and processing and also
have implications for visual object processing more generally.

Results
13
Methods
Participants
A naïve group (NG, n= 25) consisted of Johns Hopkins University undergraduates with normal or
corrected-to-normal vision who reported no knowledge of Arabic or a language with an Arabic
script. The NG participants were compensated with course credit. One NG participant was dropped
from the analyses for failing to complete the second testing session. An expert group (EG, n= 25)
consisted of adults literate in Arabic recruited from the wider Johns Hopkins University community.
Eligibility was determined by completion of a screener assessing Arabic reading and writing and
participants were compensated with $10 per session. The group consisted of individuals who either
learned Arabic as their first language, as a second language from one or more parent who was a
native speaker, or as an academic subject in school. One EG participant was dropped due to
experimenter error.
Stimuli
The Arabic alphabet consists of 28 letter identities that correspond to 54 unique shapes when
including the allographic variants. To reduce trial numbers, 45 letter shapes were selected such
that the excluded shapes differed from included shapes only in the number or location of diacritic
marks. The font Adobe Arabic size 24 was used (letters varied from 0.17°-0.31° and, 0.05°-0.35° of
visual angle in height and width respectively). Pilot testing indicated that naïve observers could
easily discriminate these stimulus sizes. Five size-matched symbols (tilde, open parenthesis,
asterisk, closed curly bracket, and less-than sign) were used for practice trials.
Procedure
Results
14
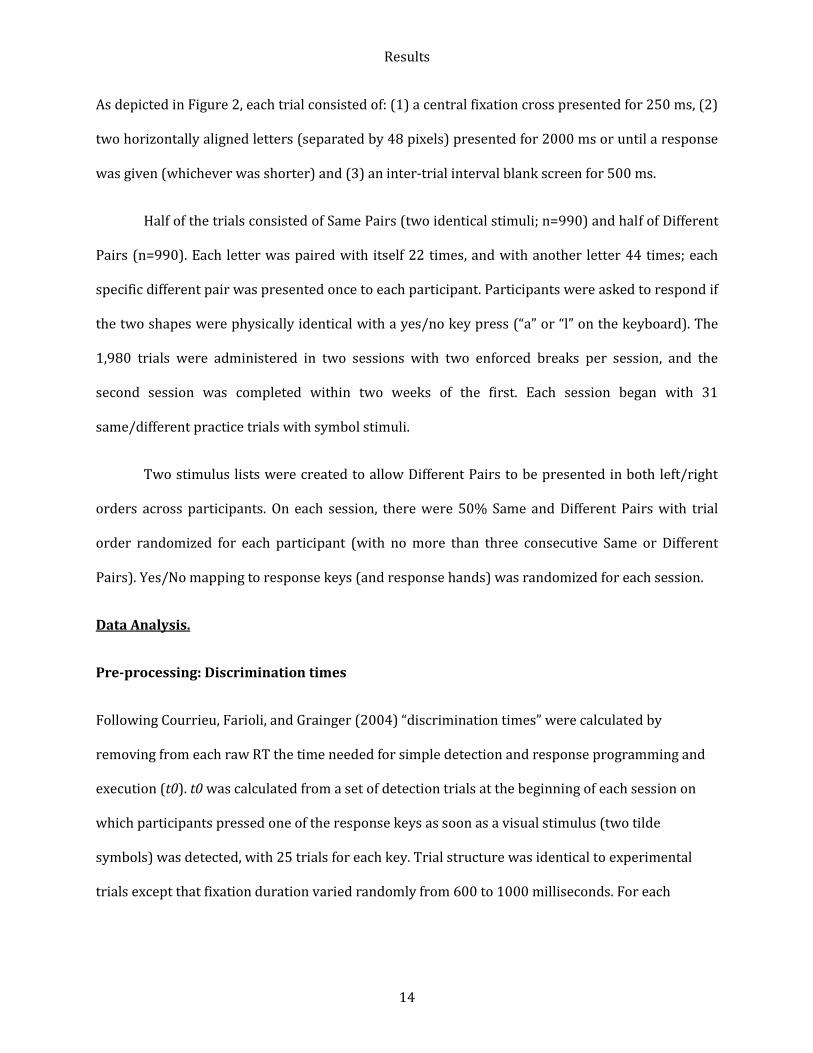
As depicted in Figure 2, each trial consisted of: (1) a central fixation cross presented for 250 ms, (2)
two horizontally aligned letters (separated by 48 pixels) presented for 2000 ms or until a response
was given (whichever was shorter) and (3) an inter-trial interval blank screen for 500 ms.
Half of the trials consisted of Same Pairs (two identical stimuli; n=990) and half of Different
Pairs (n=990). Each letter was paired with itself 22 times, and with another letter 44 times; each
specific different pair was presented once to each participant. Participants were asked to respond if
the two shapes were physically identical with a yes/no key press (“a” or “l” on the keyboard). The
1,980 trials were administered in two sessions with two enforced breaks per session, and the
second session was completed within two weeks of the first. Each session began with 31
same/different practice trials with symbol stimuli.
Two stimulus lists were created to allow Different Pairs to be presented in both left/right
orders across participants. On each session, there were 50% Same and Different Pairs with trial
order randomized for each participant (with no more than three consecutive Same or Different
Pairs). Yes/No mapping to response keys (and response hands) was randomized for each session.
Data Analysis.
Pre-processing: Discrimination times
Following Courrieu, Farioli, and Grainger (2004) “discrimination times” were calculated by
removing from each raw RT the time needed for simple detection and response programming and
execution (t0). t0 was calculated from a set of detection trials at the beginning of each session on
which participants pressed one of the response keys as soon as a visual stimulus (two tilde
symbols) was detected, with 25 trials for each key. Trial structure was identical to experimental
trials except that fixation duration varied randomly from 600 to 1000 milliseconds. For each

Results
15
participant, t0 was calculated as the average of the 20 fastest reaction times for each key and then
subtracted from the RT for each experimental trial in which the participant pressed that key.
Analysis 1: Hierarchical clustering analysis
To visualize the similarity relationships between the 45 shapes, hierarchical clustering analysis
(HCA) was carried out for both discrimination times (t0-adjusted reaction times) and accuracies of
the Different Pairs for the NG and EG groups. The data for the HCA consisted of four 45x45
confusion matrices. For accuracy data, each matrix cell value corresponds to the average of the
mean cross-participant accuracies for the two horizontal presentation orderings of a pair.
Discrimination time matrices were calculated as follows: For each cell, the discrimination times on
correct trials for each participant were normalized so that the average value for each participant
was equal to 1, and then the cross-participant medians of the normalized discrimination times were
entered into the cell. The matrix was symmetrized by taking the mean value of the two presentation
orders of each letter pair. Finally, the reciprocal of each normalized discrimination time was used to
transform the matrix into a dissimilarity matrix, providing a measure of “perceptual distance”
between letter pairs (values closer to zero represent letters that are more difficult to distinguish).
The confusion matrices were transformed by a multidimensional scaling procedure (“stats”
library in R, version 3.0.1 [R Core Team, 2013]) into a set of coordinates in a high-dimensional
space, and the Euclidean distances between these coordinates were used to develop four
dendrograms (via the Ward method of minimum variance, Murtagh & Legendre, 2011). The
dendrograms provide a compact overview of the similarity relations amongst letters and a starting
point for understanding similarities of and differences between the two participant groups.
However, inferences based on quantitative analyses relied on the results of the LMEM, described
just below.
Analysis 2: Model-based analyses

Results
16
To address key questions of interest we examined four models using linear mixed-effects modeling
(LMEM). Model 1 had the normalized discrimination times (log-transformed to address positive
skew) as the dependent variable, and included fixed effects for 15 predictors of visual similarity and
the interactions between each of these factors and group (NG versus EG). The normalized
discrimination times were used for the LMEM rather than raw reaction times so that the dependent
measure was the same as what was used in the hierarchical clustering analysis. Model 2 was
identical to Model 1 but additionally included the six predictors for knowledge-based factors;
Models 3 and 4 were analogous to 1 and 2 but had accuracy as the dependent variable, and were
performed with generalized linear mixed models for binomial data (‘‘lme4” library, version 1.1-7
[Bates, Maechler, Bolker, & Walker, 2014] in R [R Core Team, 2013]). These analyses were
conducted only on the Different Pairs.
The models had maximal random effects structures consistent with the experimental design
(Barr et al., 2013) and model convergence. Specifically, by participant, both random intercepts by
and random slopes for each of the fixed effects were included. By item, only random intercepts
were included. Correlations between the random slopes and intercepts by participant led to model
non-convergence and therefore were omitted.
Knowledge-based predictors. Abstract letter identity: Each letter pair was assigned a value to
represent whether or not the letters were allographs of the same letter identity (either 1 or -1, sum-
coding). Motor stroke similarity: An inventory of the strokes used to write the letters was developed,
based on review of videos of the EG writing performance (following methods in Rapp & Caramazza,
1997). Each letter was then described by its set of stroke bigrams (pairs of consecutive strokes),
and the proportion of shared stroke bigrams was calculated for each letter pair. Letter-name
similarity: The proportion of shared distinctive features for the names of each letter pair (e.g., place,
manner, voicing, and sonorant/obstruent status for consonants; Bailey & Hahn, 2004). Alphabetic

Results
17
distance: To account for spatial effects of alphabetic position (Gevers, Reynvoet, & Fias, 2003; Jonas
et al. 2011) analogous to those reported for the mental number line (Dehaene, Bossini, & Giraux,
1993) the difference in the position (1-28) of each letter in the modern Arabic hija’i order was
calculated for each letter pair (with allographs of the same letter assigned the same position).
Roman alphabet similarity: The average subjective visual similarity of each of the letters in a pair to
Roman letters/digits. A separate study was conducted with a new set of 24 naïve participants who
were asked to respond to individual Arabic letters with the first digit or Roman letter that came to
mind as being similar, and to rate the strength of this similarity from 1 to 5. The stimuli and viewing
conditions were the same as in the main experiment. Roman alphabet similarity scores were computed
for each pair of Arabic letters by calculating the proportion of all the participants (n=24) who judged
that both letters of a given pair most resembled the same letter of the Roman alphabet; this proportion was
then multiplied by the average rating (for the two letters) of the rated strength of the similarity.
Visual feature predictors. Fifteen visual features were included, based both on the literature and
examination of the hierarchical clustering analyses. We used the ten features reported by Fiset et al.
(2008): 4 line types (horizontal, vertical, slanted right and slanted left), 4 curve types (open to the
top, bottom, left and right), intersections, and terminations, henceforth the “10 feature set”. Five
additional features included two features salient in written Arabic: dots (diacritics) and closed
curves and also three other features proposed previously in the literature on visual recognition of
Roman letters: closed space, cyclicity, and symmetry3-- the “15 feature set”. Note that lines were
classified as being slanted only if they were >20° off of the horizontal or vertical. The full
decomposition of the 45 Arabic letter stimuli is depicted in Figure 3.
The visual feature similarity of each letter pair presented in the Different Pair trials was
determined for each of the visual feature dimensions by calculating the number of shared features,
3 Fiset et al. presumably did not include these features as these cannot be evaluated with the Bubbles method, precluding comparison with Fiset et al. on these features.

Results
18
divided by the total number of features for the pair. To this end, each letter was decomposed into a
list of features (see Table 1 for an example). All features (except cyclicity, symmetry and closed
space) had to be visible within a circular “window” with a 4-pixel diameter (proportional to the
window within which terminations and intersections were defined in Fiset et al., 2008),. Lines were
considered to be slanted only if they were ≥ 20° off the horizontal or vertical. Curves were
categorized as open to the left, right, top, or bottom except for those that closed within the 4 pixel
window. Each termination was assigned to one of the following 8 locations: top, bottom, left, right,
or any possible conjunction of two of these locations (e.g., top left or bottom right). Intersections
were categorized as L, T, or X. A feature was considered to be shared between two letters only if it
matched in orientation/position (e.g., a pair of letters shared an intersection only if both letters had
an L intersection, and not if one had an L and the other had a T or X). Note that while terminations
and intersections were sub-categorized in this way for purposes of computing overlap, these sub-
categories were not assigned individual predictors in the analyses (i.e., there were not 8
termination predictors, one for each location).
Model-based analyses. The models were used to address the following issues: (1) The role of
knowledge-based factors: Models 1 and 2 (normalized discrimination time) and 3 and 4 (accuracy)
were compared to determine: a) whether or not the knowledge-based predictors contribute
significantly to model fit (using Chi-square tests for nested models), b) the magnitude of the
contribution of the specific knowledge-based factors to the performance of the EG and NG (using R2
measures), and (c) if (and how) the inclusion of these factors affects the contributions of the visual
features. (2) Effects of expertise on visual feature processing. The beta weights of the 15 visual
feature predictors for the NG and EG groups, and corresponding interaction terms, were examined
to assess differences between the groups in terms of the relative importance of the features for
predicting RT and accuracy. (3) Effects of expertise, alphabet and case on visual feature rankings.
Using a cross-validation approach, comparisons with the relative rankings of the visual features for

Results
19
the Roman alphabet (as reported in Fiset et al. 2008, 2009) were carried out to determine the
extent to which the visual features rankings were comparable: within vs. across levels of expertise,
across the two alphabets, and across upper and lower case for the Roman alphabet. A) Across levels
of expertise: Participants from a given group (NG or EG) were randomly assigned to two split halves,
new feature rankings were obtained by LMEM for each (half) group, and the Spearman correlation
between the rankings of the two (half) groups was recorded. This process was repeated 20 times
for each group and each measure, and then each of the 4 sets of 20 correlations were transformed
to Fisher-z scores and averaged to provide the overall ranking correlation (mean and CI) for
“Within Arabic-Within group”. Then, following a similar procedure, the rankings obtained from the
split-halves were correlated across groups (e.g. NG RT with EG RT, NG accuracy with EG accuracy,
etc.) and the 4 sets of 20 correlation values were Fisher Z-transformed and averaged to estimate
the “Within Arabic-Across groups” ranking correlation (mean and CI). Both the within and across
Arabic group analyses were carried out for both the 10 and the 15 feature sets. The resulting Within
vs. Across group comparison was carried out by 95% confidence intervals on the differences
between means. B) Across alphabets: The three rankings of the 10 feature set for the Roman
alphabet reported by Fiset et al. (2008 lower- and uppercase; 2009 uppercase) were correlated
with the rankings obtained for Arabic from each of the split-half models. These Spearman
correlations were Fisher-z transformed and averaged, with differences assessed again by
confidence intervals. C) Across Case within the Roman alphabet: Finally, the correlation between the
two rankings for uppercase Roman letters reported by Fiset et al. (2008, 2009) as well as the
average pairwise correlation between those two rankings and the lowercase ranking (2008) are
reported as a further point of comparison.
Analysis 3: Same Pairs and visual complexity.
The data from the Same Pairs was used in the following way to determine whether the
visual complexity of letters affects perception and, if so, whether the effect is different for

Results
20
naïve and expert viewers. The visual complexity of each letter was represented by its total
number of visual features (calculated as described above)4; over the set of 45 letters,
complexity values ranged from 4 to 15 features (mean = 7.33). The correlation between
visual complexity and both average discrimination time and accuracy was calculated for
each participant. The Fisher z-transformation was applied to each correlation before
averaging the NG and EG separately, and then back-transformed to the Pearson’s r. 95%
confidence intervals are provided for each average correlation and for the difference
between the groups.
Results
Panoramic overview of the similarity space provided by HCA.
Overall RTs and Accuracies. The mean raw reaction times and discrimination times (t0-adjusted
reaction times) on correct trials and accuracies by participant group and by pair type are reported
in Table 2. With regard to t0 detection times, the average adjustment made to the raw reaction
times was 264ms for the EG and 252ms for the NG, and the difference of 12 ms was not statistically
different from 0, 95% CI [-8, 31]. In terms of discrimination times, the EG was slower than the NG
by 35ms [-7, 78] and mean discrimination time for Different Pairs was slower than for Same Pairs
by 7 ms [-4, 17]. With regard to accuracy, the EG was more accurate than the NG on average by
1.9%, [-0.3, 4.2] and overall accuracy was higher on Different Pairs than Same Pairs by 1.6%, [0.8,
2.4]. However, as indicated by the fact that the CI’s of the differences include 0, none of these
differences were significant except for the contrast between Different and Same pairs.
4 The measure of “perimetric complexity” (Pelli et al., 2006), perimeter squared over ink area, was also calculated and used as a measure of complexity. The same pattern of results was obtained with both this measure and the total number of visual features measure, however we report results only for the latter as it was found to correlate significantly more highly with both discrimination time and accuracy.

Results
21
Dendrograms. For comparison purposes, the RT dendrogram for the NG (Figure 4, top left)
was color-coded and then the color applied to each letter-shape was held constant across the other
three dendrograms to facilitate visual comparisons across the figures.
From visual inspection of the dendrograms one might hypothesize a set of features that
accounts for the structure of the trees, an approach taken in various previous studies (e.g., Gilmore
et al., 1977; Loomis, 1982; Boles & Clifford, 1989; Courrieu et al., 2004). For example, in the NG RT
dendrogram (Figure 4, top left) there are several large clusters of shapes that share salient visual
features: the large red cluster contains letters with curves open to the left; the orange cluster
consists of short shapes with closed or nearly closed space; the green cluster contains large open
curves oriented in the same direction, etc. Finer distinctions exist within these clusters, with many
of the closest pairs distinguished only by diacritics.
With regard to effects of expertise, there are a few striking differences between the EG and
NG RT dendrograms (Figure 4, top left and top right). For example, within the large red NG cluster,
for the EG there is a green, a blue, and a red letter (ك , ب , and ك). The considerable visual
dissimilarity between these shapes suggests that other factors may have made these letters difficult
to discriminate, accounting for their proximity in the dendrogram. In fact, the shape ك is likely
grouped with ك because both are allographs of “kaf”. The shape ب shares a similar motor pattern
with ك (a vertical stroke down, followed by a horizontal stroke to the left, ending in a curving
stroke up to the left, and then each followed by a pen lift to place a diacritic mark), suggesting that
motor similarities may affect same/different judgments. Along similar lines, the EG accuracy
dendrogram (Figure 4, bottom right) also reveals several divergent clusters where the differences
are predictable given the shared name/identity between the shapes.

Results
22
Likewise, a comparison of the NG’s RT and accuracy (Figure 4, top left and bottom left)
dendrograms reveals similar groupings, with some exceptions. Especially striking is the tri-colored
cluster on the right: ب , ه , and س. NG participants reported that these three letters looked similar
to the Roman letters o, u, and w, an indication of possible biases derived from knowledge of familiar
letter shapes, an issue we pursue in the next analysis.
Inspection of the dendrograms leads to the following conclusions: (1) The highly structured
visually-based groupings clearly indicate that the same/different judgment task generates both RT
and accuracy data that are appropriate for investigating visual feature processing. Nonetheless,
while visual inspection is a useful tool, a more systematic and quantitative approach is needed. (2)
Some of the discrepancies between the NG and EG dendrograms suggest expertise-based
differences. However, it will be important to distinguish between-group differences that arise at the
level of visual feature processing from those that do not. The dendrogram results suggest that the
latter may include biases due to various types of knowledge (e.g., such as knowledge of letter
names/identities). The dendrograms underscore the point that to evaluate the effects of expertise
and alphabet on visual feature processing, it will be necessary to first identify relatively unbiased
visual feature sets for the two participant groups.
The contributions of knowledge-based factors.
Chi-square comparisons of Models 1 vs. 2 and 3 vs. 4 allow for evaluation of the role of knowledge-
based factors (on discrimination times and accuracy respectively) by comparing the fits of models
that don’t include knowledge-based factors vs. those that do. The results of these comparisons
reveal a significantly better fit both for Model 2 for discrimination times (χ2 (18) = 4505, p <
0.0001) and for Model 4 for accuracy (χ2 (18) = 347, p < 0.0001). The superior fits of Models 2 and 4
provide clear evidence of the contribution of knowledge-based factors to same/different
judgments. Another measure of the influence of knowledge-based factors is a comparison of the
variance accounted for by Model 2 vs. Model 1 and Model 4 vs, Model 3. The R2 for generalized
Results
23
linear mixed-effect models, proposed by Nakagawa & Schielzeth (2013), provides a measure of
variance explained by the fixed- and random-effects combined (conditional R2, or R2c). For
discrimination times, Model 1 has R2c = 0.077 which more than doubles in Model 2, R2c = 0.162. For
accuracy, Model 3 has R2c = 0.278, which increases in Model 4 R2c = 0.312. This indicates that
knowledge-based factors uniquely explain 8.5% of the variance in discrimination times and 3.4% in
accuracy (52% and 11% of the total variance explained by Models 2 and 4, respectively).5
Consideration of the beta-weights and t-/z-values6 of the specific knowledge-based factors
(Table 3) indicates that the two groups are similar (with no significant interaction between groups)
in that: (a) Trial Order significantly (at a threshold of t-/z- greater than 2; equivalent to an alpha of
0.05) predicts faster and less accurate responses with increasing trial order indicating increasing
speed accuracy trade-offs during the course of the experiment and (b) There are no significant
effects or interactions for either Alphabetic Order or Phonological Similarity.
However, factors that interact with group (NG/EG) reveal the different knowledge types
that the two groups bring to the task: (a) While Roman Alphabet Similarity predicts slower and less
accurate responses for both the EG and the NG, the effect is significantly larger for the NG compared
to the EG (differences: β = 0.025, t = 4.64 for reaction time and β = -0.181, z = -3.41 for accuracy)
and (b) Shared Identity (Figure 5) and Motoric Stroke Similarity are better predictors for the EG,
such that greater similarity for letter pairs on these factors predicts slower response times
(differences: β = -0.041, t = -1.20 for Shared Identity and β = -0.013, t = -2.53 for Motoric Stroke
Similarity) and lower accuracy (differences; β = 1.429, z= 3.77 for Shared Identity and β = 0.072, z =
5 When considering magnitude of these R2 measures it should be kept in mind that the LMEMs have the ambitious goal of modeling individual trials. One consequence of this is that noise inherent to the data is not “averaged out” as no averaging by participants or items is carried out. It is likely that much of the remaining unexplained variance is due to intra-individual variability: for example, basic t0 detection times varied widely within participants (standard deviations ranging 75ms and 216ms). Further support for this explanation is the fact that simplified models in which participants and items are averaged together, R2 measures for this data set reached as high as 0.7. 6 All models determined interactions with “Group” as a sum-coded variable, 1 indicating NG and -1 indicating EG. To obtain within-group significance of t-/z-values, the models were rerun separately for the NG and EG, dropping the “Group” variable. Beta-weights were made comparable across predictors by standardizing each predictor to have a variance of 1.

Results
24
1.48 for Motoric Stroke Similarity). These differences indicate that the EG is less influenced than the
NG by knowledge of Roman letter shapes, and, furthermore, that the EG is affected by knowledge of
how letters are written and whether or not letters are allographs—two knowledge types that
depend on expertise with the Arabic alphabet.
In addition to establishing the contribution of knowledge-based factors to predicting overall
discrimination times and accuracies it is important to determine if the inclusion of these factors in
the models has an impact on the rankings of the visual feature sets. Differences in visual feature
beta magnitudes and rankings for Model 1 vs. 2 and Model 3 vs. 4 for the two groups indicate that
“erroneous”7 conclusions regarding feature values would have been drawn if the knowledge-based
factors had not been included (Figure 6). The four comparisons reveal that the average ranking
change is 1.4 (out of 15 ranks), with changes ranging from 0 to 7 ranks. In addition to changes in the
rankings of the visual features, there are also changes in the specific features that constitute
statistically significant predictors of discrimination times and accuracy. Specifically, slants right
becomes a significant predictor for both EG and NG discrimination time, while seven features are no
longer significant predictors in one or more of the models that include knowledge-based factors.
Effects of expertise on visual feature processing.
An examination of the visual feature rankings and beta weights in Models 2 and 4 for the EG and NG
reveals similarities and differences across the two groups. First, as can be seen in Figure 7, there are
a number of important similarities between the NG and the EG, namely: (1) The most important
feature for both groups (ranking 1st) for both discrimination time and accuracy is the one that is
largely unique to Arabic: the diacritic marks; (2) Terminations and slants-right are all also
significant predictors for both groups for both measures, and closed space, curves-right and
7 To be clear, conclusions would be erroneous with regard to visual feature processing but not necessarily with regard to other conclusions. In other words, the importance of identifying and “excluding” the contribution of knowledge-based factors is necessarily dependent on the empirical question one is addressing.

Results
25
verticals are significant for both groups for at least one of the dependent measures,; (3) Curves-top,
closed curves, slants-left and symmetry are not significant for either group.
Importantly, notable indicators of the effect of expertise on visual feature processing are
provided by the interactions of specific visual feature predictors with the group predictor: (1)
There is a trend for the EG to be slower relative to the NG to respond to pairs with matching
intersections and vertical lines (differences: β = 0.008, t = -1.73 and β = -0.008, t = -1.78,
respectively), (2) the NG is significantly slower relative to the EG to respond to pairs sharing
horizontals, closed curves, and cyclicity (differences: β =-0.010, t = 2.25; β = 0.011, t = 2.06; and β =
0.009, t = 2.07, respectively) and shows a trend to be slower than the EG with pairs sharing diacritic
marks (difference: β = 0.009, t = 1.66), (3) the NG is significantly less accurate in responding to
pairs sharing curves-right (difference: β = -0.093, z = -1.97) and shows a trend to lower accuracy in
responding to pairs of symmetric letters (difference: β = -0.103, z = -1.66). It should be noted that
significant interactions between EG and NG exist in Models 1 and 3 as well, indicating that
differences in how the two groups process the visual features that were apparent in Models 2 and 4
are not simply an artifact of the inclusion of the knowledge-based factors.
Visual complexity and expertise. The Same Pairs provide a valuable opportunity to evaluate
the effect of visual complexity –computed as number of features- on discrimination time and
accuracy. The average correlation between discrimination time on correct Same Pair trials and the
total number of visual features in a letter is r = 0.655 for the NG, 95% CI [0.543, 0.745] and for the
EG r = -0.295 [-0.492, -0.070]; the difference in the Fisher z-scores of 1.09 is significant [0.80, 1.37].
Accuracy patterns in precisely the same way: the correlation between the number of visual features
and average accuracy was -0.143 [-0.331, 0.078] for the NG and 0.350 [0.165, 0.512] for the EG; the
difference in z-scores of 0.50 is significant [0.22, 0.78]. In summary, more complex letters are
correlated with significantly faster and more accurate “same” responses for the EG relative to the
NG.

Results
26
Effects of expertise, alphabet and case on visual feature rankings.
These analyses consider if visual feature processing is affected by expertise, alphabet and/or case,
comparing the feature rankings for EG and NG to one another as well as comparing them to those
reported by Fiset et al. (2008, 2009) for the Roman alphabet (2008: lowercase (LC) and uppercase
(UC); 2009: UC only (Tables 4 and 5).
Feature rankings. Fiset et al. (2008, 2009) argued that terminations and horizontals are the
most important features for letter detection. This claim was based on their finding that these two
features were most highly ranked for both uppercase (for the 2008 and 2009 participant groups)
and lowercase Roman letters. As indicated in Table 4 (reporting rankings for only the 10 features
evaluated by Fiset et al.), the results we observed with Arabic letters (based on LMEM, Models 2
and 4) replicate the importance of terminations, which is a significant factor that ranks 1st for the
EG and 3rd for the NG for both discrimination time and accuracy. However, horizontals present a
more mixed picture as they are a significant factor ranking 2nd for NG discrimination time and EG
accuracy, but are a non-significant factor for NG accuracy (ranking 8th) and EG discrimination time
(ranking 9th). In contrast to the high ranking of horizontals, Fiset and colleagues found verticals to
be particularly unimportant to human observers (ranking 8th out of 10 for both studies of UC and
6th for LC Roman alphabet); for Arabic we found that they are comparable to horizontals in that
they were a significant factor for the EG for discrimination time (ranking 4th)) and for the NG for
accuracy (also ranking 4th). Strikingly, while curves-right were the lowest ranked factor for Fiset et
al. for both studies of UC letters and 9th of 10 for LC, they are the top ranked factor for the NG in
both discrimination and accuracy and are highly ranked for the EG (3rd and 5th).
Statistical comparison of feature rankings within and across alphabets and case. Table 5
presents the average correlations between the rankings of the features within and across expertise
groups, alphabets and case, based on the split-half cross-validation procedures described in the
Data Analysis section. The average Within Arabic-Within Groups (i.e. cross-validated rankings of

Results
27
the EG and NG for both discrimination time and accuracy) is 0.517, 95% CI [0.454, 0.575] based on
the 10-feature set and 0.629 [0.589, 0.665] based on the full 15-feature set. These correlations are
larger than the Within Arabic-Across-Groups average ranking correlations of 0.396 [0.390, 0.402]
for the 10-feature set and 0.545 [0.541, 0.548] for the 15-feature set. The difference between the
Fisher z-scores for the two Within vs. Across -Arabic comparisons is significant, z = 0.153 [0.069,
0.236] and 0.128 [0.065, 0.190] for the 10- and 15-feature sets respectively, indicating the feature
rankings were significantly different for the NG and EG.
In addition, we see much lower across alphabet ranking correlations: the average ranking
correlation of Arabic with Roman LC is just 0.183 [0.128, 0.237] and with Roman UC is 0.193 [0.160,
0.225]. The Fisher z-scores for these average correlations are both significantly lower than the
Within Arabic-Across Groups correlations, 0.234 [0.178, 0.291] and 0.224 [0.189, 0.249]. As a point
of comparison, the correlation between the two rankings for the Roman UC presented in Fiset et al.,
2008 and 2009, is 0.927, and the average correlation within-Roman, across-case is 0.464. Taken as
a whole, these results indicate that not only are the feature ranking differences between the EG and
NG reliable, but they are also more similar to each other than they are to the feature rankings of the
Roman alphabet.

General Discussion
28
General Discussion
We examined the response times and accuracies of participants who were asked to judge if pairs of
visually presented letters were physically identical or not. The innovative aspects of the research
were the choice of alphabet: Arabic, and the participants: expert or inexperienced readers of Arabic.
The combination of stimuli, participants, task and analytic methods (LMEM: linear mixed effects
modeling) allowed us to specifically evaluate visual feature processing of Arabic letters in naïve
(NG) and expert (EG) viewers. Based on this approach the work produced a number of novel
findings: 1) We find clear evidence that knowledge-based factors (such as letter identity) influence
perceptual judgments, 2) We show that analytic methods such as LMEM can provide a means for
removing the contributions of these knowledge-based factors to more clearly identify the
characteristics of the visual processing itself, 3) We demonstrate that when this approach is applied
the evidence indicates that both the nature of the stimulus set (the alphabet) and also the level of
expertise with it influence visual processing itself, and (4) We are able to identify specific
differences and similarities in the visual feature processing of Arabic and Roman letters.
Knowledge-based factors: Post-perceptual effects
A key finding of this research is that even when given the same visual shapes and asked to make
“low-level” judgments of physical identity, observers behave differently depending on at least some
non-visual knowledge that they bring to task. Specifically we found that models that included task-
irrelevant “knowledge-based” predictors in addition to the visual feature predictors provided
significantly better fits to overall reaction times and accuracies and, in fact, the knowledge-based
predictors accounted for 52% and 11% of the total variance explained by the models for
discrimination time and accuracy, respectively.

General Discussion
29
The perceptual decisions of experienced readers of Arabic (but not the naïve group) were
affected by their knowledge of the motoric patterns used to produce letters as well as their
knowledge of the shared identity/name of allographs (Figure 5). The latter result is comparable to
findings from other paradigms involving Roman alphabet stimuli that have reported that judgments
of physical identity are slower for visually dissimilar cross-case letters pairs (e.g., A-a) than for
other visually dissimilar pairs (V-a) (Lupyan et al., 2010). This knowledge is clearly irrelevant for
shape matching judgments. Although one cannot rule out that this knowledge affects the visual
feature space itself, it would seem prudent/conservative to assume that these factors affect
judgment times and accuracies at later processing stages (e.g. abstract letter identification or
decision processes). While these effects are interesting in their own right, more important is that
they reveal that consideration of the influence of these factors is important for work on visual
feature processing. This is because correlations between similarity on knowledge-based
dimensions and visual feature dimensions can “contaminate” inferences about visual feature
processing if they are not taken into account. In our findings, while the overall feature rankings
change only an average of 1.4 ranks when knowledge-based factors are included, specific features
change by as many as 7 ranks, and there are also changes in the specific features that cross the
statistical significance threshold. Therefore, it is likely that inclusion of such factors in an LMEM
approach provides a better characterization of visual processing.
Learning effects: Early vs. late and bottom-up vs. top-down.
In addition to the effects of knowledge-based factors, this study identified effects of learning
(alphabet and expertise) on visual processing itself. We discuss these findings in more detail in
subsequent sections, however, we thought it would be useful to first deal with the difficult issues
relating to drawing inferences about whether the effects of visual learning that we report arise
early or late or are the result of bottom-up or top-down processing.

General Discussion
30
The learning effects we report naturally raise a number of important questions regarding
the manner in which the visual system adjusts to the visual attributes of different stimulus sets and
the locus of changes that arise with expertise. In the Introduction this was discussed in the context
of the universality of feature sets and whether these are fixed or flexible. The results of this study
clearly indicate that learning affects visual processing and, therefore, a natural question concerns
how “early” these learning effects/visual flexibility arises. One possibility is that there is ” early”
flexibility and readers proficient in multiple alphabets have feature sets and configurations that are
unlike those of monolingual readers of either script. Also consistent with early flexibility is that
feature weighting/re-weighting occurs dynamically on-line based on the current context/task
demands. These notions of early flexibility contrast with “late flexibility” according to which the
differences in feature processing across alphabets and case arise after basic feature processing has
occurred with a fixed set of features and, at these later stages flexibility affects the way in which the
basic features are combined, attended to, etc. One potentially relevant source of information might
come from bi-scriptal individuals and a comparison of their feature rankings from both alphabets.
Such a comparison could reveal rankings that differ flexibly depending on the alphabet they are
viewing or rankings that are stable but different from those of mono-scriptal individuals. Such data
would certainly provide further insights into the characteristics of visual learning, however, it is
important to underscore that distinguishing between early and later sources of flexibility is really
not possible without a detailed theory that allows for an independent means for establishing
whether effects arise early or later. .
Similar difficulties arise when considering the orthogonal issue of whether the effects that
we report occur during feedforward, bottom-up visual processing (early or late) or during top-
down processing in which “higher” levels of processing -or even other modalities of information-
influence the state of “lower” visual processing levels. Given the many arguments for top-down
processing based on behavioral and neuroimaging findings (e.g., in the context of letter perception

General Discussion
31
specifically, see Lupyan et al., 2010; but also see Chen & Proctor, 2012 and Klemfuss et al., 2012 for
alternate accounts of findings that have been used to argue for top-down effects on perception) we
cannot rule out that some or all of the effects we report are not due to top-down processes that
attentionally (or otherwise) bias visual feature processing. While we acknowledge that these
questions are both interesting and important, there is much controversy regarding criteria for
establishing these effects (Awh et al., 2012; Lyons, 2011; Leonard & Egeth, 2008; Pylyshyn, 1999)
and this study was not designed to tackle these issues. Therefore, while we believe that our findings
provide clear evidence of learning and flexibility in visual feature processing itself (rather than
post-perceptual decision processing) we are not able to assign the effects to specific levels or stages
of visual processing.
Visual learning: Effects of alphabet.
Pelli et al. (2006) proposed that letter identification, for any alphabet, requires 7 ± 2 visual features.
Our findings for the Arabic alphabet are consistent with this claim as we found that of the 15
feature types we evaluated there were 7 different features with statistically significant beta values
for either RT or accuracy (or both) for the EG and 10 features for the NG.
In terms of the specific features themselves, we compared our findings with Arabic to those
reported by Fiset et al. (2008, 2009) from two studies involving Roman letters. Differences in
experimental paradigms, such as the smaller size of our stimuli and the larger set of possibilities
(45 letter-shapes versus 26) should be kept in mind when comparing the results. Nonetheless,
there were a number of noteworthy similarities and differences. In terms of similarities, we found
support for Fiset et al.’s proposal regarding the importance of terminations, which they consistently
found to be the single most important feature for letter identification of both uppercase (UC) and
lowercase (LC) Roman letters. In our study, terminations were highly ranked for both the NG and
EG, for both RT and accuracy, with rankings ranging from 1-3. Fiset et al. (2008) suggested that the

General Discussion
32
fact that there are neurons in primary monkey cortex that are highly responsive to terminations
(e.g., Hubel & Wiesel, 1968) may indicate that these features are detected very early in the course of
visual processing. This would be consistent with their prominent role across alphabets and case.
In terms of differences between our findings and those of Fiset et al., perhaps the most
salient one concerns horizontals and verticals. Fiset et al. found a dissociation between these, such
that while horizontals was the second most important predictor, verticals were only ranked 8th (6th
for LC). The difference between horizontals and verticals led Fiset et al. (2008) to propose that the
human visual system may not be well equipped to process verticals. In contrast, we didn’t find a
difference between them, as both features were significant predictors for both groups for either RT
or Accuracy and were also similarly ranked. Another salient divergence with the Fiset et al. findings
concerns curves open to the right, which was the lowest ranked factor for the Fiset et al.
participants for UC and 9th of 10 for LC, but was highly ranked for the NG for both RT and accuracy
(1st) and highly ranked for the EG in RT (3rd). Finally, it is important to mention that of the 5 feature
types we considered that were not evaluated by Fiset et al. (diacritics, closed curves, symmetry,
cyclicity, and closed space) diacritics and closed space were two of the most highly ranked
predictors for the NG and EG for both RT and accuracy (Table 5).
What can be made of these similarities and differences? As we have indicated both in the
Introduction and just above, it is a profound challenge for experimental studies of vision to identify
the locus of effects within the visual system. While we generally assume that properties of early
visual processing should manifest themselves across stimulus types, it does not follow that effects
observed across stimulus types necessarily arise early in the system. Thus, although the
convergence across alphabets and empirical approaches regarding the importance of terminations
is certainly consistent with the claim that they correspond to features that are detected early in
visual processing, one should be cautious in drawing strong conclusions in this regard. At a

General Discussion
33
minimum, however, this convergence highlights the important role of these features at some
relatively basic, shared level of visual processing.
The divergence across studies regarding horizontals, vertical and curves-right points to
important differences in the visual processing of the different alphabets (stimulus sets). The strong
convergence across methods (same/different judgments vs. Bubbles image classification) with
regard to terminations suggests that the observed differences are not likely due to the differences
in methods. Instead, these divergences suggest a visual system that flexibly weights features in a
way that is, to some considerable extent, driven by the similarity structure of the stimulus set. This
conclusion is also supported by the findings regarding ranking correlations within and across
alphabet and case. These correlations indicate the following: (1) Visual feature processing is most
similar for the same letters of a given alphabet, for different measures (discrimination time and
accuracy for the Arabic alphabet) and even when evaluated with different groups of participants
with differences in expertise (EG and NG). (2) This stands in stark contrast with the across-alphabet
(Arabic/Roman) feature rankings where the correlations are much lower. (3) Across case (upper
and lower case within the Roman alphabet) represents an intermediate situation. The difference
between cross-case and within-case correlations for the Roman alphabet indicates a clear effect of
case but, additionally, the fact that the cross-case correlations are still higher than the cross-
alphabet correlations is an indication that there is greater similarity in visual feature processing
within the Roman alphabet (despite case differences) than between the Roman and Arabic
alphabets.
Visual learning: Effects of expertise.
A primary goal of this research was to investigate whether and how expertise affects visual feature
processing. Before discussing differences between the groups, it is important to first note that there
were a great many similarities between the naïve and expert participants. The average ranking

General Discussion
34
correlation across the two groups and measures viewing the Arabic alphabet was 0.545, notably
higher than the average across-alphabet correlations of 0.183/0.193 for LC and UC Roman letters,
respectively. In addition to the overall ranking similarity between the NG and EG, salient specific
similarities included the high ranking of diacritic marks, closed space, curves-right and
terminations.
However, there were important differences between the groups that support the conclusion
that expertise does in fact affect visual processing a finding that is consistent with many findings in
the literature regarding visual learning (e.g., Pelli et al., 2006). First, with regard to specific features,
intersections were significant predictors of discrimination time for the EG but not the NG and there
were several features that were significant predictors of discrimination time for the NG but not the
EG: horizontals, curves-left, cyclicity and curves-bottom. Importantly, two of those features
(horizontals and cyclicity) also interacted statistically significantly with the group factor, and thus
are the most associated with expertise. We hypothesize that horizontals and cyclicity have a
“dispreferred” status for the EG because in text reading, unlike the situation with the single-letter
same/different task, Arabic letters are most often ligated to one another to form words, altering the
diagnosticity of these two features. Figure 8 illustrates that horizontal lines and cyclicity are
ubiquitous in Arabic words, as the ligation of letters to one another forms contiguous horizontal
lines in the sub-word, and the number of letters which have “teeth” (small vertical peaks) align to
create stretches of the cyclicity feature. Thus, horizontal lines and cyclicity are not especially useful
features for identifying individual Arabic letters because in the context of whole words they occur
as features that span multiple letters. This highlights the point that expertise in letter identification
largely involves the tuning of visual processes and representations for word reading.
Second, analysis of performance on Same Pairs revealed that, for the NG, the greater the
visual complexity of the letter, the slower and less accurate the responses. In striking contrast, for

General Discussion
35
the EG, increasing complexity led to faster RTs and greater accuracy. These results reveal not only
that the naïve observer has more difficulty processing more complex letters, but that for the expert
observer more complex letters may be easier to identify, perhaps because they are more distinctive.
For expert observers one possibility is that with expertise, features may become “bundled” together
to form fewer features that are each more internally complex. This type of learning would be
consistent with findings regarding certain types of experience-dependent perceptual learning
(Goldstone, 1998; Sireteanu & Rettenbach, 2000; Kellman & Garrigan, 2009) and visual crowding,
where more complex targets have been shown to be more readily identified amongst less complex
flankers (Bernard & Chung, 2011; Chanceaux et al., 2014).
Implications for applications
For teachers of written Arabic as a first or second language it may be helpful to understand
that becoming proficient in identifying Arabic letters involves learning to process/attend to fewer
visual features overall. Furthermore, the features that show a significant interaction between the
two groups (Figure 7) may provide some specific instructional guidance. The interactions reveal
that there are certain features –intersections and verticals- that tend to be weighted more strongly
by expert compared to naïve readers and it may be useful to explicitly draw learners’ attention to
these features. In contrast, there are a number of features that novices weight more heavily than
the experts. These may need to be de-emphasized, including: horizontals, curves-left, curves-right,
and symmetry. The feature “horizontals” is a particularly good example in this regard. Fiset et al.
(2008, 2009) emphasized the significance of horizontals in the perception of Roman letters,
however, for Arabic letters most of the horizontal segments occur in the ligatures between letters,
and do not, therefore, play an important role in distinguishing between letter identities. Second
language learners with a first language that uses the Roman alphabet may bring the high weighting
of horizontals to their learning of Arabic, something that will not serve them in good stead. The

General Discussion
36
methodology used in this study could potentially be used in diagnostic testing for identifying the
feature weighting for individual students and then tailors teaching accordingly, encouraging the
deployment of attention to the critical features. Of course, whether or not explicit instruction based
on these findings can actually accelerate the learning process would need to be empirically
evaluated.
The finding that motor stroke similarity significantly affected both the time and accuracy of
same/different judgments for the expert group may be relevant to current debates regarding the
role of handwriting in literacy (e.g., Deardorff, 2011; Guan et al, 2011; James & Engelhardt, 2012).
With the rise of keyboarding relative to handwriting, there is great interest from teachers,
curriculum developers, parents and students to understand the relevance of handwriting for
literacy development. The findings from this study are consistent with others in the behavioral
(Babcock & Freyd, 1988; Longcamp et al., 2005; James & Gauthier, 2009) and neuroimaging
(Longcamp et al., 2003; James & Gauthier, 2006; James & Atwood, 2009) literatures that have
reported that handwriting codes are active when viewing letters or reading words. Clearly
handwriting is not necessary for literacy, as children who are paralyzed learn to read and adults
who become paralyzed do not lose their reading abilities. What needs to be addressed empirically is
whether handwriting confers any advantage to the learning process, adds any efficiency to the
experienced reader, or provides any redundancy that is beneficial in cases of neural injury.
Conclusions
This study reveals a visual system that can be understood as dynamically adjusting its weighting of
visual features in ways that, at least in part, reflect the characteristics of the stimulus set (the
alphabet) that it is faced with. We also find clear evidence that visual feature processing is
susceptible to learning as expert readers come to more efficiently and effectively discriminate the
letters of the alphabet they are viewing, relying on fewer features and different feature weightings.

General Discussion
37
Furthermore, the findings indicate that while visual complexity is an obstacle to be overcome for
early learners, the expert viewer is able to exploit complexity for improved performance.

Tables and Figures
38
Figure 1. Examples illustrating properties of the Arabic script. A) From right to left, the
isolated, initial, medial, and final forms (allographs) of the letter “ba”. The ligatures are
circled, illustrating that -apart from the ligatures- the shapes of the isolated and final
forms, and initial and medial forms, are identical. B) Four forms of the letter “ba” (in
gray) embedded within words: initial and final forms on the right (“bitalab”) or medial
and isolated forms on the left (“albawwab”). This also illustrates the spacing structure
both within and across words. C) One of the sets of letters (“ya”, “nuun”, “tha”, “ta” and
“ya”) differentiated only by their diacritics. D) One of the three letters that have 4
different shapes even after accounting for the ligation.

Tables and Figures
39
Figure 2. Trial structure for the same-
different judgment task.

Tables and Figures
40
Figure 3. A
representative set of
the letter shapes used
in the experiment. Each
of the features into
which they were
decomposed for
purposes of computing
feature overlap is
indicated in red. The 15
different visual
features were used as
predictors in Models 1-
4.

Tables and Figures
41
Table 1. Example of the calculation of shared features for a pair of Arabic letters.
Features 1 vertical line 1 vertical line 1 termination-top 1 closed curve 1 termination-bottom 1 termination-bottom symmetric 1 T-intersection closed space Total 4 5 Shared 1 vertical line, 1 termination-bottom
Visual Feature Predictors Verticals = 2/9 = 0.222 Terminations = 2/9 = 0.222

Tables and Figures
42
Table 2. Mean raw reaction time, t0-adjusted reaction time (discrimination time), and accuracy per group (EG, NG) and stimulus type (Same, Different).
Raw Reaction Time (ms) Same 95% CI Different 95% CI Mean 95% CI EG 598 [569, 628] 625 [597, 652] 611 [592, 631] NG 564 [527, 600] 565 [527, 603] 564 [539, 590]
Mean 581 [558, 604] 595 [571, 619] 588 [565, 610] Discrimination Time (ms) Same 95% CI Different 95% CI Mean 95% CI
EG 339 [307, 372] 356 [326, 385] 347 [318, 377] NG 313 [282, 345] 311 [277, 344] 312 [280, 344]
Mean 325 [305, 348] 333 [311, 356] 330 [309, 351]
Accuracy (%) Same 95% CI Different 95% CI Mean 95% CI EG 94.9 [93.1, 96.7] 95.8 [94.1, 97.4] 95.3 [93.7, 97.0] NG 92.3 [90.1, 94.4] 94.6 [93.4, 95.8] 93.4 [91.8, 95.0]
Mean 93.6 [92.2, 95.0] 95.2 [94.2, 96.2] 94.4 [93.3, 95.5]

Tables and Figures
43
Figure 4. Hierarchical clustering of 45 Arabic letter shapes based on reaction time (top) and accuracy
(bottom) for the NG (left) and EG (right). Color gradient is linked to the NG reaction time clustering and
held constant across all other dendrograms. The height at which a cluster branches reflects the relative
similarity of all of the letters in the cluster, such that items in lower branches are more similar; however,
the left-to-right ordering within a cluster is arbitrary (e.g., for the purple cluster in the NG RT dendrogram
containing “alif” and two allographs of “lam”, one cannot know which of the allographs is more similar to
“alif”).

Tables and Figures
44
Table 3. Standardized beta-weights for the predictors corresponding to knowledge-based factors for RT (Model 2, top) and accuracy (Model 4, bottom). Bold indicates values considered statistically significant at p < 0.05.
RT EG NG Interaction
Knowledge-based Factor: Std. Beta t-value Std. Beta t-value Std. Beta t-value
Shared Identity 0.091 3.14 0.049 1.77 -0.041 -1.20 Trial Order -0.116 -6.26 -0.124 -8.51 -0.005 -0.41
Roman Alphabet Similarity 0.021 4.77 0.045 9.95 0.025 4.64 Alphabetic Order -0.003 -0.61 0.001 0.15 0.004 0.65
Phonological Similarity 0.007 1.23 0.001 0.19 -0.006 -0.91
Motoric Stroke Similarity 0.017 3.86 0.004 0.09 -0.013 -2.53
Accuracy EG NG Interaction
Knowledge-based Factor: Std. Beta z-value Std. Beta z-value Std. Beta z-value
Shared Identity -1.225 -3.67 0.115 0.44 1.429 3.77 Trial Order -0.276 -5.10 -0.127 -2.28 0.141 1.81
Roman Alphabet Similarity -0.173 -4.53 -3.220 -7.26 -0.181 -3.41 Alphabetic Order 0.027 0.58 0.036 0.83 -0.009 -0.16
Phonological Similarity -0.026 -0.61 -0.067 -1.55 -0.051 -0.97 Motoric Stroke Similarity -0.099 -2.26 -0.060 -1.54 0.072 1.48

Tables and Figures
45
Figure 5. Effect of same-identity on Different Pair judgments for the NG and EG, raw reaction
time on correct trials (left) and accuracy (right). * significant interaction between groups, p <
0.05. Error bars reflect standard error of the mean by participants.

Tables and Figures
46
EG RT Model 1 Model 2 EG Accuracy Model 3 Model 4
std. beta Rank
std. beta Rank
std. beta Rank
std. beta Rank
Diacritics 0.0264 2 * 0.0210 1 * Diacritics -0.2276 1 * -0.1740 1 *
Closed Space 0.0339 1 * 0.0203 2 * Closed Space -0.1768 3 * -0.1253 2 *
Terminations 0.0251 3 * 0.0136 3 * Terminations -0.2276 2 * -0.1008 3 *
Intersections 0.0195 4 * 0.0124 4 * Horizontals -0.1323 4 * -0.0983 4 *
Curves-Right 0.0168 5 * 0.0118 5 * Slants Right -0.0812 7 * -0.0919 5 *
Verticals 0.0137 6 * 0.0098 6 * Curves-Left -0.1032 5 * -0.0598 6
Slants Right 0.0119 7 † 0.0079 7 * Curves-Right -0.0329 14 -0.0543 7
Curves-Bottom 0.0063 8 0.0055 8 Verticals -0.0692 9 * -0.0509 8
Slants Left 0.0037 11 0.0033 9 Intersections -0.0700 8 -0.0426 9
Curves-Left 0.0061 9 0.0030 10 Cyclicity -0.0842 6 * -0.0360 10
Horizontals 0.0012 13 0.0028 11 Curves-Bottom -0.0623 10 -0.0242 11
Cyclicity 0.0052 10 -0.0002 12 Closed Curves -0.0374 13 -0.0147 12
Symmetry -0.0024 14 -0.0016 13 Curves-Top -0.0392 12 -0.0092 13
Curves-Top 0.0035 12 -0.0034 14 Slants Left -0.0455 11 0.0001 14
Closed Curves -0.0078 15 -0.0076 15 Symmetry 0.0748 15 0.0669 15
NG RT Model 1 Model 2 NG Accuracy Model 3 Model 4
std. beta Rank
std. beta Rank
std. beta Rank
std. beta Rank
Diacritics 0.0361 1 * 0.0301 1 * Diacritics -0.2586 1 * -0.2054 1 *
Curves-Right 0.0207 4 * 0.0163 2 * Curves-Right -0.1450 3 * -0.1409 2 *
Closed Space 0.0222 3 * 0.0152 3 * Slants Right -0.1136 5 * -0.1345 3 *
Horizontals 0.0116 8 * 0.0132 4 * Terminations -0.2500 2 * -0.1156 4 *
Terminations 0.0247 2 * 0.0132 5 * Verticals -0.0964 7 * -0.0793 5 *
Curves-Left 0.0192 5 * 0.0121 6 * Closed Curves -0.0900 8 * -0.0734 6 †
Cyclicity 0.0139 6 * 0.0088 7 * Closed Space -0.0878 9 -0.0692 7
Curves-Bottom 0.0122 7 * 0.0086 8 * Intersections -0.0732 10 -0.0607 8
Slants Right 0.0075 10 0.0078 9 * Curves-Left -0.1360 4 * -0.0576 9
Intersections 0.0063 11 0.0039 10 Curves-Top -0.1127 6 * -0.0486 10
Closed Curves 0.0053 12 0.0038 11 Horizontals -0.0523 12 -0.0327 11
Slants Left 0.0019 14 0.0027 12 Curves-Bottom -0.0684 11 † -0.0314 12
Verticals 0.0031 13 0.0019 13 Symmetry -0.0180 14 -0.0270 13
Curves-Top 0.0100 9 * 0.0017 14 Cyclicity -0.0487 13 0.0019 14
Symmetry -0.0006 15 -0.0004 15 Slants Left -0.0011 15 0.0072 15
Figure 6. The 15 visual features as ranked by the absolute value of the standardized beta-weights in models without (Model 1 and 3) and with (Model 2 and 4) predictors for knowledge-based factors. Note: significant variable at * p < 0.05, † p < 0.10

Tables and Figures
47
Figure 7. Standardized beta-weights of the visual feature predictors for reaction time (Model 2)
and accuracy (Model 4). Features are sorted from most to least important based on the EG (left
columns). Note that negative correlations for accuracy indicate that accuracy decreases with
increased visual similarity.

Tables and Figures
48
Table 4. Rankings of 10 visual feature types for the identification of Roman uppercase (UC) and lowercase (LC) letters from Fiset et al. (2008, 2009) and for Arabic letters for the Naïve and Expert Groups (NG and EG) from Model 2 (DT, discrimination time) and Model 4 (Accuracy) in the current study.
Feature Roman
UC 2008 Roman
UC 2009 Roman LC 2008
NG -DT
NG - Accuracy
EG -DT
EG - Accuracy
Terminations 1 1 1 3 3 1 1 Horizontals 2 2 2 2 8 9 2 Intersections 3 6 10 7 5 2 7 Curves-Left 4 3 7 4 6 8 4 Slants Right 5 4 3 6 2 5 3
Slants Left 6 5 8 8 10 7 10 Curves-Top 7 7 4 10 7 10 9 Verticals 8 8 6 9 4 4 6 Curves-Bottom 9 9 5 5 9 6 8 Curves-Right 10 10 9 1 1 3 5

Tables and Figures
49
Table 5. Estimated mean correlations (Spearman's) of visual feature rankings and 95% confidence intervals based on empirical percentiles obtained by split-half cross-validation. UC=upper case; LC=lower case; Groups = EG, NG (expert and naïve); measures= discrimination time, accuracy; 10 = the 10 features types in Fiset et al. (see Table 4); 15 = the 15 feature types examined in this study (Figures 5, 6).
mean 95% Confidence
Interval
Within Arabic-Within measures and groups (10) 0.517 [0.454, 0.575] Within Arabic-Within measures and groups (15) 0.629 [0.589, 0.665]
Within Arabic-Across measures and groups (10) 0.396 [0.390, 0.402] Within Arabic-Across measures and groups (15) 0.545 [0.541, 0.548]
Across alphabet (Arabic/Roman LC) 0.183 [0.128, 0.237] Across alphabet (Arabic/Roman UC) 0.193 [0.160, 0.225]
Within Roman-Within Uppercase* 0.927
Within Roman-Across Case* 0.464
*based on rankings reported by Fiset et al. (2008, 2009)

Tables and Figures
50

Tables and Figures
51
Figure 8. Example of four Arabic letters (top, from right to left, “ba”, “seen”, “ya”, and
“taw”) written in isolated forms as appearing in the same/different task, and the
same four letters written as a word (bottom line), which creates one continuous
horizontal line through the whole word as well as a long cyclic feature.

52
Author contributions
R. Wiley and B. Rapp developed the experimental questions and experimental design. Data
collection was carried out by R. Wiley who performed the statistical analyses in collaboration with
C. Wilson. The manuscript was written by B. Rapp and R. Wiley with input from C. Wilson.
Acknowledgements
We thank Howard Egeth for guidance with the literature and input on an earlier draft and the
support of NIH grant DC012283 to B. Rapp.

References
53
1. Awh, E., Belopolsky, A. V., & Theeuwes, J. (2012). Top-down versus bottom-up attentional control: a failed theoretical dichotomy. Trends in Cognitive Sciences, 16(8), 437–443.
2. Baayen, R. H., Davidson, D. J., & Bates, D. M. (2008). Mixed-effects modeling with crossed random effects for subjects and items. Journal of Memory and Language, 59(4), 390–412.
3. Babcock, M. K., & Freyd, J. J. (1988). Perception of dynamic information in static handwritten forms. The American Journal of Psychology, 111–130.
4. Bailey, Todd M., and Ulrike Hahn. (2005). Phoneme similarity and confusability. Journal of Memory and Language, 52(3), 339–362.
5. Barr, D. J., Levy, R., Scheepers, C., & Tily, H. J. (2013). Random effects structure for confirmatory hypothesis testing: Keep it maximal. Journal of Memory and Language, 68(3), 255–278.
6. Bates, D., Maechler, M., & Bolker, B. & Walker, S. (2014). lme4: Linear mixed-effects models using Eigen and S4. R Package version 1.1-7.
7. Bernard, J.-B., & Chung, S. T. L. (2011). The dependence of crowding on flanker complexity and target-flanker similarity. Journal of Vision, 11(8), 1–1.
8. Boles, D. B., & Clifford, J. E. (1989). An upper- and lowercase alphabetic similarity matrix, with derived generation similarity values. Behavior Research Methods, Instruments, & Computers, 21(6), 579.
9. Cattell, J. M. (1886). Uber die Tragheit der Netzhaut und des Sehcentrums. Philosophische Studien, 3, 94–127.
10. Chanceaux, M., Mathot, S., & Grainger, J. (2014). Effects of number, complexity, and familiarity of flankers on crowded letter identification. Journal of Vision, 14(6), 7–7.
11. Changizi, M. A., Zhang, Q., Ye, H., & Shimojo, S. (2006). The structures of letters and symbols throughout human history are selected to match those found in objects in natural scenes. The American Naturalist, 167(5), E117–E139.
12. Chen, J., & Proctor, R. W. (2012). Influence of category identity on letter matching: Conceptual penetration of visual processing or response competition? Attention, Perception, & Psychophysics, 74(4), 716–729.
13. Courrieu, P., Farioli, F., & Grainger, J. (2004). Inverse discrimination time as a perceptual distance for alphabetic characters. Visual Cognition, 11(7), 901–919.
14. Deardorff, Julie. (2011, June 15). The many health perks of good handwriting. Chicago Tribune. Retrieved from http://www.chicagotribune.com/lifestyles/health/sc-health-0615-child-health-handwriti20110615-story.html
15. Dehaene, S., Bossini, S., & Giraux, P. (1993). The mental representation of parity and number magnitude. Journal of Experimental Psychology: General, 122(3), 371.

References
54
16. Dehaene, S., Pegado, F., Braga, L. W., Ventura, P., Filho, G. N., Jobert, A., … Cohen, L. (2010). How Learning to Read Changes the Cortical Networks for Vision and Language. Science, 330(6009), 1359–1364.
17. Delorme, A., Rousselet, G. A., Macé, M. J.-M., & Fabre-Thorpe, M. (2004). Interaction of top-down and bottom-up processing in the fast visual analysis of natural scenes. Cognitive Brain Research, 19(2), 103–113.
18. Egeth, H., & Blecker, D. (1971). Differential effects of familiarity on judgments of sameness and difference. Perception & Psychophysics, 9(4), 321–326.
19. Fiset, D., Blais, C., Éthier-Majcher, C., Arguin, M., Bub, D. N., & Gosselin, F. (2008). Features for uppercase and lowercase letter identification. Psychological Science, 19(11), 1161-1168.
20. Fiset, D., Blais, C., Arguin, M., Tadros, K., Éthier-Majcher, C., Bub, D., & Gosselin, F. (2009). The spatio-temporal dynamics of visual letter recognition. Cognitive Neuropsychology, 26(1), 23–35.
21. Gervais, M. J., Harvey, L. O., & Roberts, J. O. (1984). Identification confusions among letters of the alphabet. Journal of Experimental Psychology: Human Perception and Performance, 10(5), 655.
22. Gevers, W., Reynvoet, B., & Fias, W. (2003). The mental representation of ordinal sequences is spatially organized. Cognition, 87(3), B87–B95.
23. Gibson, E. J. (1969). Principles of perceptual learning and development. East Norwalk, CT: Appleton-Century-Crofts.
24. Gibson, E. P., Gibson, J. J., Pick, A. D., & Osser, H. (1962). A developmental study of the discrimination of letter-like forms. Journal of Comparative and Physiological Psychology, 55(6), 897-906.
25. Gilmore, G. C., Hersh, H., Caramazza, A., & Griffin, J. (1979). Multidimensional letter similarity derived from recognition errors. Perception & Psychophysics, 25(5), 425–431.
26. Goldstone, R. L. (1998). Perceptual learning. Annual Review of Psychology, 49(1), 585–612.
27. Gosselin, Frédéric, and Philippe G. Schyns. (2001). Bubbles: a technique to reveal the use of information in recognition tasks. Vision research, 41(17), 2261-2271.
28. Grainger, J., Rey, A., & Dufau, S. (2008). Letter perception: from pixels to pandemonium. Trends in Cognitive Sciences, 12(10), 381–387.
29. Grill-Spector, K., & Kanwisher, N. (2005). Visual recognition as soon as you know it is there, you know what it is. Psychological Science, 16(2), 152–160.
30. Guan, C. Q., Liu, Y., Chan, D. H. L., Ye, F., & Perfetti, C. A. (2011). Writing strengthens orthography and alphabetic-coding strengthens phonology in learning to read Chinese. Journal of Educational Psychology, 103(3), 509–522.

References
55
31. Haider, H., & Frensch, P. A. (1996). The role of information reduction in skill acquisition. Cognitive Psychology, 30(3), 304–337.
32. James, K. H., & Atwood, T. P. (2009). The role of sensorimotor learning in the perception of letter-like forms: Tracking the causes of neural specialization for letters. Cognitive Neuropsychology, 26(1), 91–110.
33. James, K. H., & Engelhardt, L. (2012). The effects of handwriting experience on functional brain development in pre-literate children. Trends in Neuroscience and Education, 1(1), 32–42.
34. James, K. H., & Gauthier, I. (2006). Letter processing automatically recruits a sensory–motor brain network. Neuropsychologia, 44(14), 2937–2949.
35. James, K. H., & Gauthier, I. (2009). When writing impairs reading: Letter perception’s susceptibility to motor interference. Journal of Experimental Psychology: General, 138(3), 416–431.
36. Javal, M. (1881). L'evolution de la typographie consideree dans ses rapports avec l'hygiene de la vue. Revue Scientifique, 27, 802–813.
37. Jonas, C. N., Taylor, A. J. G., Hutton, S., Weiss, P. H., & Ward, J. (2011). Visuo-spatial representations of the alphabet in synaesthetes and non-synaesthetes: Visuo-spatial alphabets. Journal of Neuropsychology, 5(2), 302–322.
38. Kellman, P. J., & Garrigan, P. (2009). Perceptual learning and human expertise. Physics of Life Reviews, 6(2), 53–84.
39. Keren, G., & Baggen, S. (1981). Recognition models of alphanumeric characters. Perception & Psychophysics, 29(3), 234–246.
40. Klemfuss, N., Prinzmetal, W., & Ivry, R. B. (2012). How does language change perception: A Cautionary note. Frontiers in Psychology, 3, 1-6.
41. Leonard, C. J., & Egeth, H. E. (2008). Attentional guidance in singleton search: An examination of top-down, bottom-up, and intertrial factors. Visual Cognition, 16(8), 1078–1091.
42. Livingston, K. R., & Andrews, J. K. (1995). On the Interaction of Prior Knowledge and Stimulus Structure in Category Learning. The Quarterly Journal of Experimental Psychology Section A, 48(1), 208–236.
43. Longcamp, M., Anton, J.-L., Roth, M., & Velay, J.-L. (2003). Visual presentation of single letters activates a premotor area involved in writing. NeuroImage, 19(4), 1492–1500.
44. Longcamp, M., Zerbato-Poudou, M.-T., & Velay, J.-L. (2005). The influence of writing practice on letter recognition in preschool children: A comparison between handwriting and typing. Acta Psychologica, 119(1), 67–79.
45. Loomis, J. M. (1982). Analysis of tactile and visual confusion matrices. Perception & Psychophysics, 31(1), 41–52.

References
56
46. Lorigo, L. M., and V. Govindaraju. (2006). Offline Arabic handwriting recognition: A Survey. IEEE Transactions On Pattern Analysis and Machine Intelligence, 28(5), 712–724.
47. Lupyan, G., Thompson-Schill, S. L., & Swingley, D. (2010). Conceptual Penetration of Visual Processing. Psychological Science, 21(5), 682–691.
48. Lyons, J. (2011). Circularity, reliability, and the cognitive penetrability of perception. Philosophical Issues, 21(1), 289–311.
49. Malinowski, P., & Hübner, R. (2001). The effect of familiarity on visual-search performance: Evidence for learned basic features. Perception & Psychophysics, 63(3), 458–463.
50. Mitterer, H., Horschig, J. M., Müsseler, J., & Majid, A. (2009). The influence of memory on perception: It’s not what things look like, it’s what you call them. Journal of Experimental Psychology: Learning, Memory, and Cognition, 35(6), 1557.
51. Mueller, S. T., & Weidemann, C. T. (2012). Alphabetic letter identification: Effects of perceivability, similarity, and bias. Acta Psychologica, (139), 19–37.
52. Murtagh, F., & Legendre, P. (2014). Ward’s Hierarchical Agglomerative Clustering Method: Which Algorithms Implement Ward’s Criterion? Journal of Classification, 31(3), 274–295.
53. Nakagawa, S., & Schielzeth, H. (2013). A general and simple method for obtaining R 2 from generalized linear mixed-effects models. Methods in Ecology and Evolution, 4(2), 133–142.
54. Norris, D., McQueen, J. M., & Cutler, A. (2000). Merging information in speech recognition: Feedback is never necessary. Behavioral and Brain Sciences, 23(03), 299–325.
55. Palmer, S. E. (1999). Vision science: Photons to phenomenology (Vol. 1). Cambridge, MA: MIT press.
56. Pelli, D. G., Burns, C. W., Farell, B., & Moore-Page, D. C. (2006). Feature detection and letter identification. Vision Research, 46(28), 4646–4674.
57. Podgorny, P., & Garner, W. R. (1979). Reaction time as a measure of inter-and intraobject visual similarity: Letters of the alphabet. Perception & Psychophysics, 26(1), 37–52.
58. Pylyshyn, Z. (1999). Is vision continuous with cognition? The case for cognitive impenetrability of visual perception. Behavioral and Brain Sciences, 22(3), 341–365.
59. Rapp, B, and A Caramazza. 1997. From Graphemes to abstract letter shapes: Levels of representation in written spelling. Journal of Experimental Psychology: Human Perception and Performance, 23(4), 1130–52.
60. Rothlein, D., & Rapp, B. (2014). The similarity structure of distributed neural responses reveals the multiple representations of letters. NeuroImage, 89, 331–344.

References
57
61. Schyns, P. G., Goldstone, R. L., & Thibaut, J.-P. (1998). The development of features in object concepts. Behavioral and Brain Sciences, 21(01), 1–17.
62. Schyns, P. G., & Oliva, A. (1999). Dr. Angry and Mr. Smile: When categorization flexibly modifies the perception of faces in rapid visual presentations. Cognition, 69(3), 243–265.
63. Simpson, I. C., Mousikou, P., Montoya, J. M., & Defior, S. (2012). A letter visual-similarity matrix for Latin-based alphabets. Behavior Research Methods, 45(2), 431–439.
64. Sireteanu, R., & Rettenbach, R. (2000). Perceptual learning in visual search generalizes over tasks, locations, and eyes. Vision Research, 40, 2925–2949.
65. Treiman, R. (2011). Similarities Among the Shapes of Writing and Their Effects on Learning. Written Language And Literacy, 14(1), 39–57.
66. Treiman, R., & Kessler, B. (2004). The role of letter names in the acquisition of literacy. Advances in Child Development and Behavior, 31, 105–135.
67. Treisman, A. M., & Gelade, G. (1980). A feature-integration theory of attention. Cognitive psychology, 12(1), 97-136.
68. Wang, Q. & Cavanagh, P. (1993). Acquiring familiarity effects in visual-search with Chinese characters. Investigative Ophthalmology & Visual Science, 34(4) 1236-1236.
69. Wang, Q., Cavanagh, P., & Green, M. (1994). Familiarity and pop-out in visual search. Perception & Psychophysics, 56(5), 495–500.
70. Wolfe, J. (2000). Visual attention. In K. K. De Valois (Ed.), Seeing (2nd edition), 335–386. Academic Press.