The Effectiveness of a Short Food Frequency Questionnaire
76
Georgia State University ScholarWorks @ Georgia State University Nutrition eses Department of Nutrition Fall 12-15-2010 e Effectiveness of a Short Food Frequency Questionnaire in Determining the Adequacy of Vitamin D Intake in Children Caitlin Russell Georgia State University Follow this and additional works at: hps://scholarworks.gsu.edu/nutrition_theses Part of the Nutrition Commons is esis is brought to you for free and open access by the Department of Nutrition at ScholarWorks @ Georgia State University. It has been accepted for inclusion in Nutrition eses by an authorized administrator of ScholarWorks @ Georgia State University. For more information, please contact [email protected]. Recommended Citation Russell, Caitlin, "e Effectiveness of a Short Food Frequency Questionnaire in Determining the Adequacy of Vitamin D Intake in Children." esis, Georgia State University, 2010. hps://scholarworks.gsu.edu/nutrition_theses/18
Transcript of The Effectiveness of a Short Food Frequency Questionnaire
Georgia State UniversityScholarWorks @ Georgia State University
Nutrition Theses Department of Nutrition
Fall 12-15-2010
The Effectiveness of a Short Food FrequencyQuestionnaire in Determining the Adequacy ofVitamin D Intake in ChildrenCaitlin RussellGeorgia State University
Follow this and additional works at: https://scholarworks.gsu.edu/nutrition_theses
Part of the Nutrition Commons
This Thesis is brought to you for free and open access by the Department of Nutrition at ScholarWorks @ Georgia State University. It has been acceptedfor inclusion in Nutrition Theses by an authorized administrator of ScholarWorks @ Georgia State University. For more information, please [email protected].
Recommended CitationRussell, Caitlin, "The Effectiveness of a Short Food Frequency Questionnaire in Determining the Adequacy of Vitamin D Intake inChildren." Thesis, Georgia State University, 2010.https://scholarworks.gsu.edu/nutrition_theses/18


NOTICE TO BORROWERS
All theses deposited in the Georgia State University library must be used in accordance
with the stipulations prescribed by the author in the preceding statement. The author of
this thesis is:
Caitlin S. Russell
3978 Land O’ Lakes Drive
Atlanta, GA 30342
The director of this thesis is:
Anita M. Nucci, PhD, RD, LD
Assistant Professor and Graduate Program Director
Division of Nutrition, School of Health Professions
College of Health and Human Sciences
Georgia State University
Atlanta, Georgia 30302

VITA
Caitlin S. Russell
ADDRESS: 3978 Land O’ Lakes Drive
Atlanta, GA 30342
EDUCATION: M.S. 2010 Georgia State University
Health Sciences
B.A. 1994 Sweet Briar College
French
PROFESSIONAL EXPERIENCE:
Director, Tradeshows 2001-2004
AMC, Inc., Atlanta, GA
Web & Graphic Designer 2000-2001
ExpoExchange, LLC, Decatur, GA
Executive Director, International Development 1997-2000
AMC, Inc., Atlanta, GA
Assistant English Teacher 1994-1996
Japan Exchange & Teaching Program, Kimitsu, Japan
PROFESSIONAL SOCIETIES AND ORGANIZATIONS:
Treasurer, Greater Atlanta Dietetic Association 2010-present
American Dietetic Association 2006-present
Georgia Dietetic Association 2006-present
Greater Atlanta Dietetic Association 2006-present
AWARDS AND PUBLICATIONS:
American Dietetic Association’s Outstanding Dietetics Student Award 2010
Georgia State University’s Outstanding Didactic Program in 2010
Dietetics Award – Graduate Student
Georgia Dietetic Association’s Outstanding Student – Didactic Program 2010
Dean’s List – Georgia Perimeter College Dunwoody Center 2004
Dean’s List – Georgia Perimeter College Clarkston Campus 2004
The Georgia State University Signal, Vol. 74, Issue 27; 2007
Fast, cheap and healthy recipes
ABSTRACT
THE EFFECTIVENESS OF A SHORT FOOD FREQUENCY QUESTIONNAIRE IN
DETERMINING THE ADEQUACY OF VITAMIN D INTAKE IN CHILDREN
by
Caitlin S. Russell
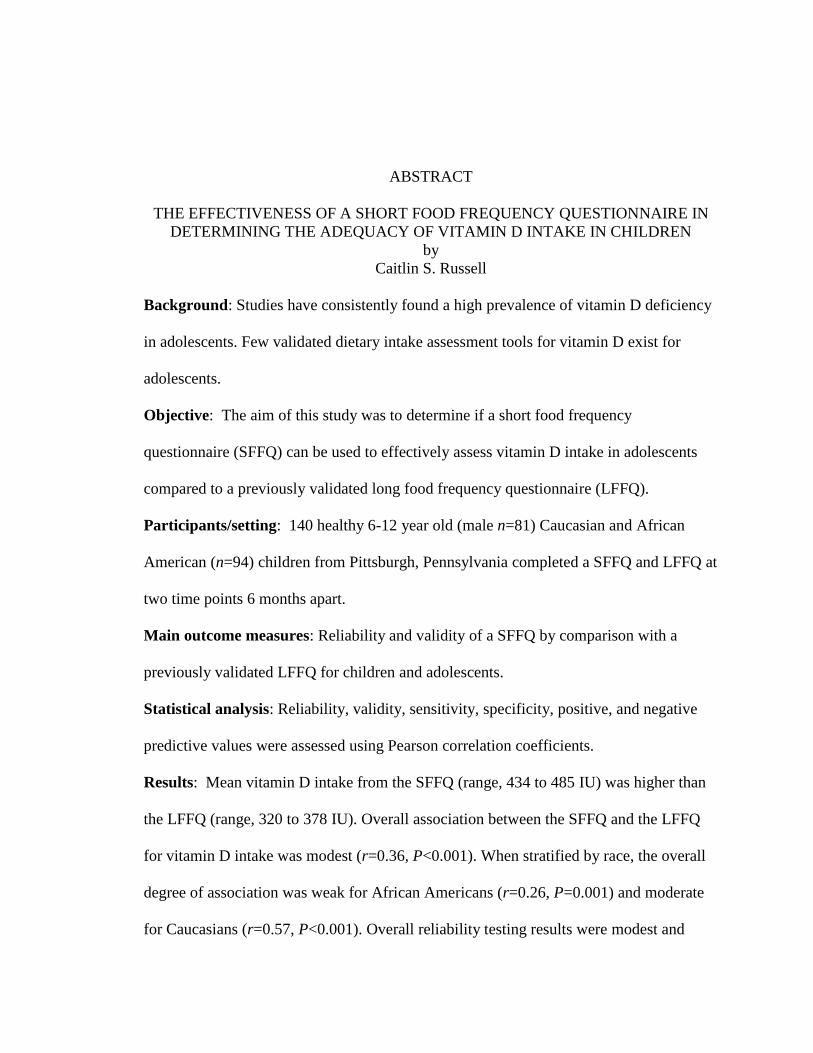
Background: Studies have consistently found a high prevalence of vitamin D deficiency
in adolescents. Few validated dietary intake assessment tools for vitamin D exist for
adolescents.
Objective: The aim of this study was to determine if a short food frequency
questionnaire (SFFQ) can be used to effectively assess vitamin D intake in adolescents
compared to a previously validated long food frequency questionnaire (LFFQ).
Participants/setting: 140 healthy 6-12 year old (male n=81) Caucasian and African
American (n=94) children from Pittsburgh, Pennsylvania completed a SFFQ and LFFQ at
two time points 6 months apart.
Main outcome measures: Reliability and validity of a SFFQ by comparison with a
previously validated LFFQ for children and adolescents.
Statistical analysis: Reliability, validity, sensitivity, specificity, positive, and negative
predictive values were assessed using Pearson correlation coefficients.
Results: Mean vitamin D intake from the SFFQ (range, 434 to 485 IU) was higher than
the LFFQ (range, 320 to 378 IU). Overall association between the SFFQ and the LFFQ
for vitamin D intake was modest (r=0.36, P<0.001). When stratified by race, the overall
degree of association was weak for African Americans (r=0.26, P=0.001) and moderate
for Caucasians (r=0.57, P<0.001). Overall reliability testing results were modest and
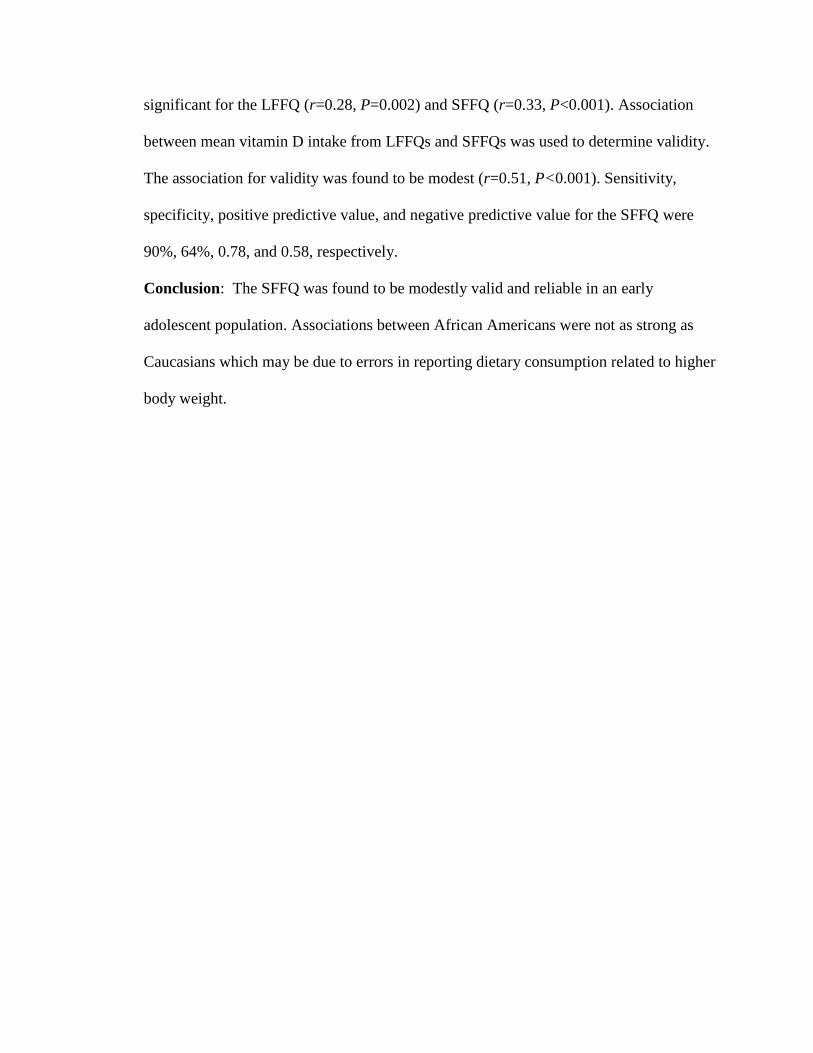
significant for the LFFQ (r=0.28, P=0.002) and SFFQ (r=0.33, P<0.001). Association
between mean vitamin D intake from LFFQs and SFFQs was used to determine validity.
The association for validity was found to be modest (r=0.51, P<0.001). Sensitivity,
specificity, positive predictive value, and negative predictive value for the SFFQ were
90%, 64%, 0.78, and 0.58, respectively.
Conclusion: The SFFQ was found to be modestly valid and reliable in an early
adolescent population. Associations between African Americans were not as strong as
Caucasians which may be due to errors in reporting dietary consumption related to higher
body weight.

THE EFFECTIVENESS OF A SHORT FOOD FREQUENCY QUESTIONNAIRE IN
DETERMINING THE ADEQUACY OF VITAMIN D INTAKE IN CHILDREN
by
Caitlin S. Russell
A Thesis
Presented in Partial Fulfillment of Requirements for the Degree of
Master of Science in Health Sciences
The College of Health and Human Sciences
Division of Nutrition
Georgia State University
Atlanta, Georgia
2010

ii
ACKNOWLEDGMENTS
I owe my deepest gratitude to Dr. Anita Nucci for her patience, constant support and
advisement throughout this process. I am honored to have received her invaluable insight
into research publishing. I would also like to thank Dr. Vijay Ganji and Barbara Hopkins
for their expert assistance in writing this thesis. Also, thank you to Barbara for her
indispensible guidance throughout my graduate studies. I am grateful for Dr. Kumaravel
Rajakumar and his staff for beginning the initial research and for their support while
writing this manuscript. Finally, I am indebted to my husband Scott Russell and my
daughters Eva and Julia for their encouragement and unwavering support during these
past years. Without them and the rest of my loving family and friends, I literally could
not have accomplished this.
iii
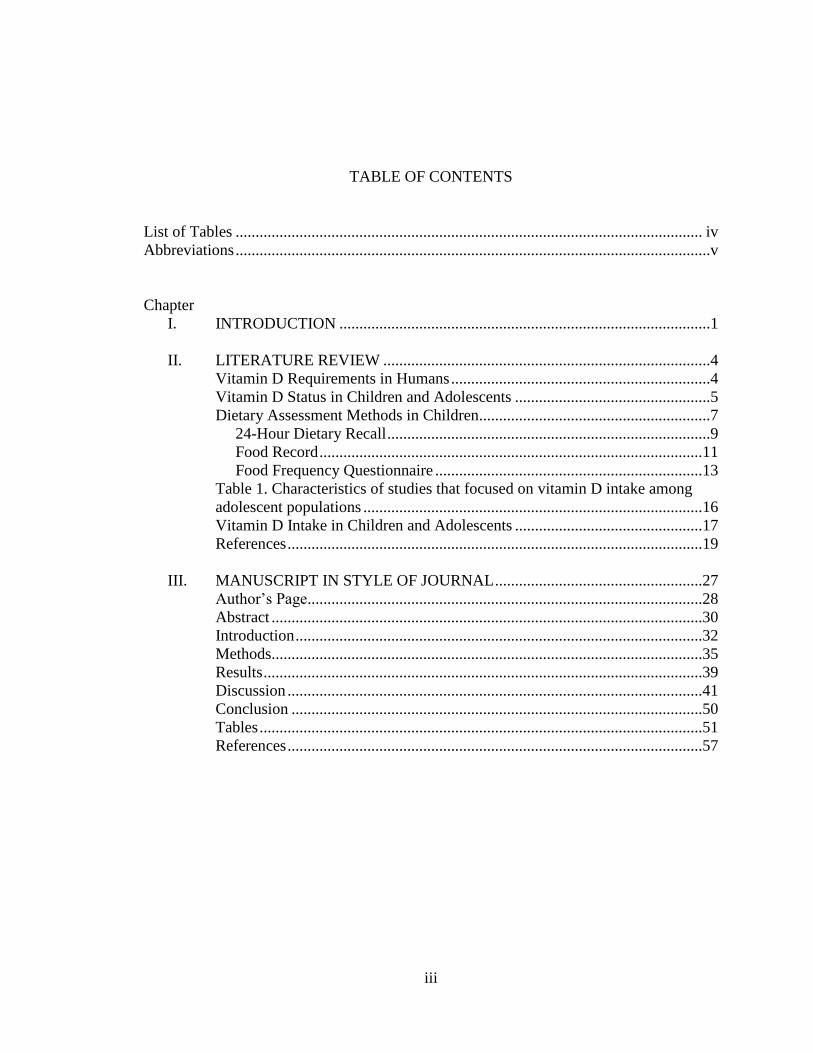
TABLE OF CONTENTS
List of Tables ..................................................................................................................... iv
Abbreviations .......................................................................................................................v
Chapter
I. INTRODUCTION .............................................................................................1
II. LITERATURE REVIEW ..................................................................................4
Vitamin D Requirements in Humans .................................................................4
Vitamin D Status in Children and Adolescents .................................................5
Dietary Assessment Methods in Children..........................................................7
24-Hour Dietary Recall .................................................................................9
Food Record ................................................................................................11
Food Frequency Questionnaire ...................................................................13
Table 1. Characteristics of studies that focused on vitamin D intake among
adolescent populations .....................................................................................16
Vitamin D Intake in Children and Adolescents ...............................................17
References ........................................................................................................19
III. MANUSCRIPT IN STYLE OF JOURNAL ....................................................27
Author’s Page...................................................................................................28
Abstract ............................................................................................................30
Introduction ......................................................................................................32
Methods............................................................................................................35
Results ..............................................................................................................39
Discussion ........................................................................................................41
Conclusion .......................................................................................................50
Tables ...............................................................................................................51
References ........................................................................................................57

iv
LIST OF TABLES
Table Page
1. Mean age and median weight, height and body mass index measures by visit and
race .............................................................................................................................51
2. Reported intake of milk, dairy products, and vitamin D-fortified orange juice
per day from the short food frequency questionnaire .................................................52
3. Vitamin D intake for the long (LFFQ) and short food frequency questionnaire
(SFFQ) by visit and race ............................................................................................53
4. Association between the long (LFFQ) and short food frequency questionnaires
(SFFQ) for vitamin D intake by visit and race ...........................................................54
5. Reliability test for vitamin D intake between two long food frequency
questionnaires (LFFQs) administered 6 months apart and two short food
frequency questionnaires (SFFQs) administered 6 months apart ...............................55
6. Probability statistics results for the short food frequency questionnaire
(SFFQ) ........................................................................................................................56

v
ABBREVIATIONS
1,25(OH)2D 1,25-dihydroxyvitamin D
25(OH)D 25-hydroxyvitamin D
AAP American Academy of Pediatrics
AI Adequate Intake
BMI Body Mass Index
cm centimeter
CSFII Continuing Survey of Food Intakes by Individuals
DRI Dietary Reference Intake
EAR Estimated Average Requirement
FFQ Food Frequency Questionnaire
GA Georgia
IOM Institute of Medicine
IU International Units
kg kilogram
L liter
LFFQ Long Food Frequency Questionnaire
µg microgram
mL milliliter
ng nanogram
NHANES National Health and Nutrition Examination Survey
nmoL nanomole

vi
NPV Negative Predictive Value
oz ounce
PA Pennsylvania
PPV Positive Predictive Value
RDA Recommended Dietary Allowance
SBNM School-Based Nutrition Monitoring
SFFQ Short Food Frequency Questionnaire
UPMC University of Pittsburgh Medical Center
U.S. United States of America
USDA United States Department of Agriculture
UVB Ultra-violet B
1
CHAPTER I
THE EFFECTIVENESS OF A SHORT FOOD FREQUENCY QUESTIONNAIRE IN
DETERMINING THE ADEQUACY OF VITAMIN D INTAKE IN CHILDREN
Introduction
Several studies have reported the excessive prevalence of vitamin D insufficiency
among children (1-9). The primary role of vitamin D in humans is to maintain serum
calcium and phosphorus concentrations at levels that support proper cell function and
bone mineralization (10,11). In children, deficiency of vitamin D is associated with
rickets, when growing bones fail to mineralize. When a subject is deficient in vitamin D,
calcium absorption is only 10 – 15% of what is normally absorbed, resulting in decreased
bone mineralization and secondary hyperparathyroidism (12). Maintaining adequate
vitamin D and calcium status during childhood may reduce the risk of developing chronic
diseases such as osteoporosis, multiple sclerosis, hypertension, osteomalacia, and certain
cancers, as well as reduce the risk of bone fracture, falls, depression, certain autoimmune
diseases, muscle weakness, and cardiovascular disease later in life (11,13-15). Immune
function and inflammation reduction are also regulated by vitamin D (16). Several factors
determine vitamin D status and these include dietary intake of vitamin D, skin
pigmentation, season, and latitude of residence (14,16). Because vitamin D is found in
very few foods, fortified food and beverages provide the U.S. population with most of its
dietary vitamin D. Fish liver oil, fatty fish, and egg yolks are natural sources of vitamin D
(15,16). Researchers have measured the prevalence of vitamin D deficiency in healthy
adolescents using serum 25-hydroxyvitamin D (25(OH)D) as a marker and dietary

2
assessment methods (2-4). These studies have consistently found a high prevalence of
vitamin D deficiency or insufficiency in adolescents. Subjects with the lowest serum
25(OH)D tended to be African American, obese, and those who did not consume vitamin
D-rich foods (2).
There is a range of dietary assessment methods that help determine individual and
population nutritional intakes and habits. These methods play an essential role in
establishing when a segment of the population is at risk for nutritional problems. There
are limited data available on validated dietary assessment tools for adolescents (17-20).
Previously validated tools include a food frequency questionnaire (FFQ) that provided
reasonable estimates on vitamin D intake in children when compared to 3-day diaries
(21), a calcium FFQ that was moderately associated with estimates from 24-hour dietary
recalls in middle-school-aged children (22), a FFQ that showed good test-retest reliability
for assessing food intake in schoolchildren when compared with observed food intake
(23), and a FFQ that suitably ranked food and nutrient intake of adolescents when
compared with food records (24). Fumagalli and colleagues (25) measured dietary intake
in 5-10 year olds comparing 3-day dietary records with a FFQ that had previously been
validated for use in adults. They found that the FFQ appears to overestimate usual energy
and nutrient intakes in children and that portion sizes need to be adjusted before adoption
of this instrument in children. When designing a valid assessment tool for this age group,
consideration should be given to the populations’ age, reading level, ability to understand
questions, ability to understand conceptual thinking, and whether an adult caretaker will
assist in completing the assessment (26).

3
At the Primary Care Center of the Children’s Hospital of Pittsburgh of the
University of Pittsburgh Medical Center (UPMC), Rajakumar and colleagues conducted a
Vitamin D and Sunlight study between June 2006 and March 2008. This study was
designed to determine the seasonal variation of vitamin D insufficiency in healthy 6-12
year old pre- and early adolescent African American and Caucasian children residing in
Pittsburgh, PA. Included in this initial study was an evaluation of nutrition intake using
both a long food frequency questionnaire (LFFQ) and a short food frequency
questionnaire (SFFQ). For the current study, a secondary analysis was performed on the
data generated from Rajakumar’s initial investigation. By way of validity and
reproducibility tests, the secondary analysis aimed to determine if the SFFQ could
effectively assess vitamin D intake in adolescents compared to the LFFQ. It is important
to use validity and reproducibility components because any interpretation of a FFQ
should include the degree to which a questionnaire can truly measure dietary intake (17).
We hypothesized that there will be no difference between adolescents’ vitamin D intake
calculated from a SFFQ when compared to a validated LFFQ.
4
CHAPTER II
Literature Review
Vitamin D Requirements in Humans
The primary role of vitamin D in humans is to maintain cellular calcium
concentrations within the homeostatic 8-10 mg/dL range. Vitamin D, or its biologically
active form 1,25-dihydroxyvitamin D (1,25(OH)2D), regulates calcium and phosphorus
metabolism in the intestine and bone. Without adequate vitamin D, the small intestines
only absorb about 10 – 15% of dietary calcium (15). Low serum calcium stimulates
parathyroid hormone (PTH) which, along with 1,25(OH)2D, increases decalcification of
bone leading to osteoporosis in adults and rickets in children (27). Having a sufficient
concentration of serum vitamin D has been shown to reduce diastolic and systolic blood
pressures in hypertensive patients and possibly decrease the risk of developing type 1
diabetes, cardiovascular disease, osteoporosis, and certain cancers such as prostate,
breast, colon, and esophagus (10,15).
Vitamin D can be obtained through the diet and from supplements. Vitamin D is
synthesized in the epidermis of the skin after its exposure to ultraviolet-B (UVB)
radiation from sunlight, turning 7-dehydrocholesterol (provitamin D3) into previtamin D3,
which later becomes thermodynamically stable vitamin D3. This stable form of vitamin D
is called cholecalciferol and later becomes 25(OH)D (calcidiol) (15). However, when
skin is protected from UVB radiation by melanin pigment, sunscreen, and clothing,
cutaneous vitamin D production is greatly diminished (14). Living at a high latitude
reduces the amount of vitamin D that can be synthesized in the skin since fewer solar
5
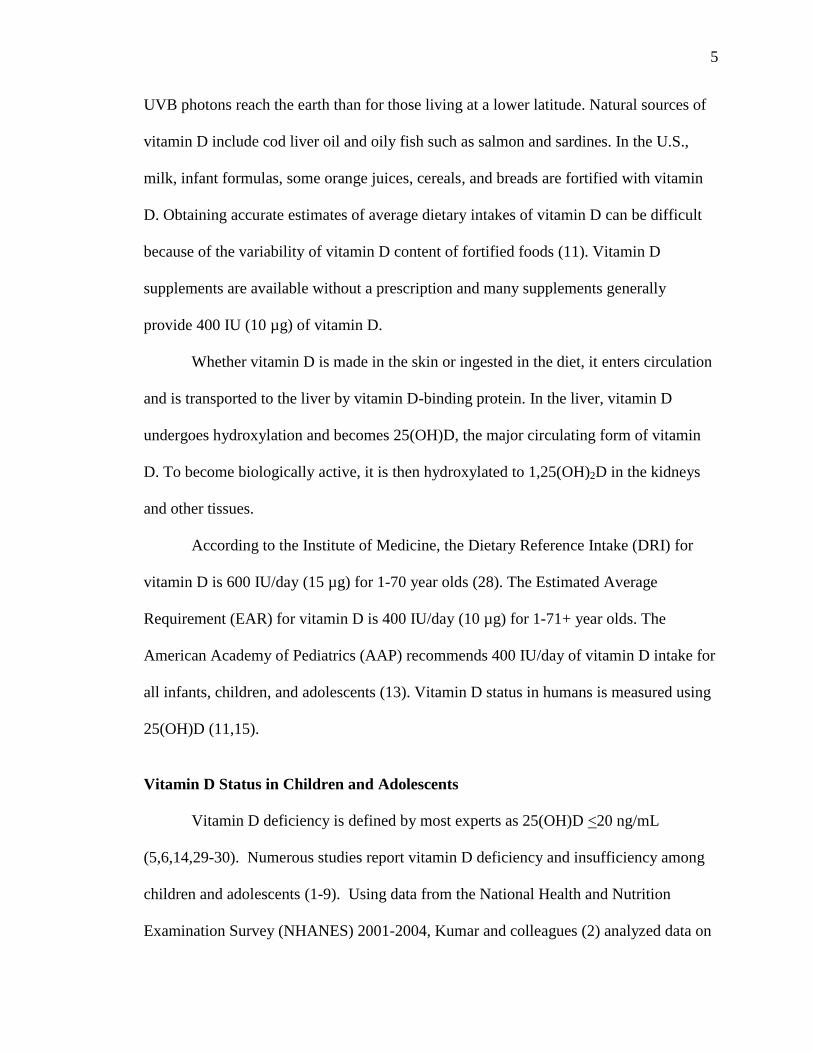
UVB photons reach the earth than for those living at a lower latitude. Natural sources of
vitamin D include cod liver oil and oily fish such as salmon and sardines. In the U.S.,
milk, infant formulas, some orange juices, cereals, and breads are fortified with vitamin
D. Obtaining accurate estimates of average dietary intakes of vitamin D can be difficult
because of the variability of vitamin D content of fortified foods (11). Vitamin D
supplements are available without a prescription and many supplements generally
provide 400 IU (10 µg) of vitamin D.
Whether vitamin D is made in the skin or ingested in the diet, it enters circulation
and is transported to the liver by vitamin D-binding protein. In the liver, vitamin D
undergoes hydroxylation and becomes 25(OH)D, the major circulating form of vitamin
D. To become biologically active, it is then hydroxylated to 1,25(OH)2D in the kidneys
and other tissues.
According to the Institute of Medicine, the Dietary Reference Intake (DRI) for
vitamin D is 600 IU/day (15 µg) for 1-70 year olds (28). The Estimated Average
Requirement (EAR) for vitamin D is 400 IU/day (10 µg) for 1-71+ year olds. The
American Academy of Pediatrics (AAP) recommends 400 IU/day of vitamin D intake for
all infants, children, and adolescents (13). Vitamin D status in humans is measured using
25(OH)D (11,15).
Vitamin D Status in Children and Adolescents
Vitamin D deficiency is defined by most experts as 25(OH)D <20 ng/mL
(5,6,14,29-30). Numerous studies report vitamin D deficiency and insufficiency among
children and adolescents (1-9). Using data from the National Health and Nutrition
Examination Survey (NHANES) 2001-2004, Kumar and colleagues (2) analyzed data on

6
children and adolescents and found that 25(OH)D deficiency was common among 1-21
year old persons. In this nationally representative segment of the U.S. population, 61% or
50.8 million of the children had 25(OH)D concentrations between 15 and 29 ng/mL.
Children with lower 25(OH)D concentration were girls, non-Hispanic blacks, obese and
those who spent more time in front of a television, playing video games, or using a
computer. Vitamin D deficiency was also associated with hypertension, low HDL
concentrations, and elevated PTH concentrations. Suboptimal vitamin D status was also
common among healthy, low-income, minority children in Atlanta, GA (9). Cole and
colleagues reported that 22% of the children in their study (n=290) had vitamin D
deficiency and 74% had insufficiency. The study authors predicted that vitamin D intake
would not influence vitamin D status in this study which was true. At a Boston primary
care center, Gordon and colleagues (5) studied 380 pediatric patients and found that 12%
were vitamin D deficient and 40% were below an accepted optimal threshold. Among the
participants who had vitamin D deficiency, 32.5% showed evidence of demineralization
after wrist and knee radiographic assessments. In light of growing data that support
vitamin D’s immunomodulatory effects, study authors stated that their findings support
recommendations that vitamin D supplementation should be made available for all young
children. The Atlanta and Boston studies contradict the assumption that children living at
lower latitudes exhibit better vitamin D status than children living at higher latitudes.
Using <15 ng/mL as deficient, Gordon and colleagues (3) found that 24.1%
(n=307) of 11-18 year old children were vitamin D deficient, 42% were vitamin D
insufficient (<20 ng/mL), and 4.6% were severely vitamin D deficient (<8ng/mL). They
found that African American adolescents were more likely to be vitamin D deficient than

7
other ethnic groups, which corresponds with lower vitamin D production among
individuals with darker skin pigmentation. They also suggested additional research on
health outcomes among children and adolescents after vitamin D supplementation. In
order to estimate the proportion of vitamin D insufficiency among the pediatric African
American population, Rajakumar and colleagues (4) studied the response among 42
preadolescent African American children who were given 400 IU of vitamin D daily for
one month. They found that 49% of the subjects were vitamin D insufficient (10-20
ng/mL) at baseline. After one month of supplementation, the mean 25(OH)D
concentration significantly increased in the vitamin D insufficient group, however, 18%
persisted to be vitamin D insufficient. Study authors explained that the short duration of
the study and minimal dosage of vitamin D supplementation might explain the persistent
insufficiency at the end of the trial. They concluded that preadolescent African
Americans residing in the Northeast were at risk of low vitamin D concentrations. In a
southeastern U.S. prospective study, Willis and colleagues (8) found that vitamin D status
declined with age for African American and Caucasian girls aged 4-8 years old. In this
population, 18% of the participants had 25(OH)D concentration below 20 ng/mL. They
found an inverse relationship between circulating 25(OH)D and muscle mass, indicating
that an increase in fat-free soft tissue may have an increased utilization of vitamin D. This
raises the question of whether more vitamin D is required during periods of growth
among adolescents.
Dietary Assessment Methods in Children
As children grow from birth through adolescence, they undergo enormous social,
emotional, physical, and cognitive development. There are many factors that influence

8
this growth, including environmental factors, genetics, and nutritional status (26). To
understand the dietary intake habits of adolescents, it is important to monitor their
nutritional behavior using methods that quantify what is consumed. An important
prerequisite for monitoring the nutritional status in children is the accurate assessment of
nutrient intake using validated tools that have been shown to accurately portray
consumption patterns. There are various methods used to assess children’s dietary intake,
ranging from food records, 24-hour dietary recalls, FFQs, and combinations of all three
(18-25,31-44). Due to the challenging nature of dietary assessment tools, some of which
require concerted effort to complete on behalf of the respondent, these methods are prone
to reporting error, and dietary intakes may be erroneously interpreted (45). Subjects must
be able to retrieve dietary information from memory and accurately estimate portion
sizes. When a child is too young to complete an assessment on his own, parents and
caregivers must be able to reliably estimate what the child has consumed. Parents and
caregivers may be able to report intake from the home setting but may not accurately
assess what is consumed at school and outside the home. It is essential to develop valid
assessment tools for adolescents, which reduce response burden and achieve precise
estimation of actual nutrient intake (18,20,37).
Dietary assessment methods can assess macro- and micronutrient components of
the diet. Variability is lowest among nutrients that are consumed on a regular basis such
as protein, fat, and carbohydrate. Micronutrient intake, such as vitamin D, is the most
variable and requires many days of records to accurately capture true intake, though it is
not known exactly how many days are needed (45).

9
24-Hour Dietary Recall
A 24-hour dietary recall is a snapshot of what a person has recently eaten. It is
usually a consultation, either in person or on the telephone, between a participant and
trained personnel who interview the subject about everything he has eaten and drank over
the past 24-hour period (18). The participant does not have to be motivated to complete
any sort of dietary record when participating in a 24-hour dietary recall. A nutrient
analysis program is needed in order to assess intake after a skilled nutritionist records the
information. Limitations of this method include subjects not recalling all consumed
foods, reporting information they feel the clinician wants to hear, and needing to collect
multiple recalls in order to determine usual intake (17). As diet is known to vary from
day to day, a 24-hour recall does not give an accurate portrayal of long-term eating habits
for an individual, but it does provide estimates of population means for nutrients (18).
Validity of 24-hour recalls depends on how accurately an individual can recall his intake
in terms of both food eaten and portion sizes. Validity is also dependent on how
accurately the trained personnel codes the intake recorded during the interview and how
comprehensive the nutrient database is that is used to analyze the recorded food (17).
Faggiano and colleagues (46) completed a validation trial in which subjects’ (n=103)
actual food consumption was compared with their recollection of consumption on the
following day. All food chosen for consumption was recorded and weighed before and
after the meal. For the recall, researchers used photographs of each type of dish served,
including seven different portion sizes for each dish. The following day, subjects were
interviewed on what they consumed during the prior meal. Subjects overestimated
portion sizes by >20% for six foods and underestimated portion sizes by <20% for four
foods. Those who ate more than average tended to underreport and those who ate less

10
than average tended to overreport intake. This phenomenon is generally referred to as flat
slope syndrome. In a 2009 validation study, Baxter and colleagues (47) investigated the
effects of the elapsed time between a meal and the interview (retention interval) on the
accuracy of 4th
graders reporting dietary intake during 24-hour recalls. The children were
observed eating two school meals and later interviewed to obtain 24-hour recall. Two
target periods were used: prior 24 hours (immediately preceding the interview) and
previous day (midnight to midnight of the day before the interview). Interviews were
conducted in the morning, afternoon, and evening. Researchers found that accuracy was
better for prior 24 hours than previous day recalls and the best accuracy was obtained in
the afternoon and evening. After analyzing data in 2010 from the same 2009 retention-
interval validation study, Baxter and colleagues (48) concluded that shortening the
retention interval of dietary intake and report increases accuracy for reporting
macronutrients among this age-group.
Reliability, which is also referred to as reproducibility or precision, expresses the
degree to which an investigator is able to obtain the same results when a method is
repeated under similar conditions (17). If a certain method is used to assess dietary intake
and it does not give consistent results after repeated use under the same conditions, the
method cannot be considered reliable. Using a USDA-funded School-Based Nutrition
Monitoring (SBNM) secondary-level student questionnaire, Hoelscher and colleagues
(49) analyzed reproducibility results for 8th
grade middle school students’ food choice
behavior. Using test-retest study design for reproducibility, researchers administered the
survey to students at two timepoints. They found that most questions on the SBNM
questionnaire had acceptable reproducibility. For questions on food choices from the

11
previous day, agreement was 70% or greater (r=0.66). As this questionnaire only
represented one day and was not typical intake at the individual level, authors
emphasized that it is appropriate to use their study findings to characterize groups, as in
cross-sectional studies, but it is not appropriate for tracking individuals’ food intake over
time. Also using a test-retest study design for reproducibility of questionnaire items,
Penkilo and colleagues (50) measured reproducibility coefficients of an elementary
school-level SBNM questionnaire among 4th
graders. Food and meal choice questions
had relatively good reproducibility, however mean percent agreement was lower for the
elementary school-level SBNM questionnaire versus the secondary school-level SBNM
questionnaire mentioned previously (78.4% vs. 86.0% respectively). The authors
concluded that the questionnaire could be a valuable tool for epidemiological studies
when it is necessary to assess dietary intake in a large number of children in a relatively
short time period.
Food Record
Similar to the 24-hour dietary recall, the food record is based on actual foods and
amounts consumed by an individual on one or more specific days (17). As with 24-hour
recalls, the food record is used primarily as a means to assess the validity of a FFQ when
the questionnaire is used as the primary collection instrument (17,21,24-26,32-34,40,42-
44,51). There is considerable flexibility afforded for dietary data analysis when using a
food record since this method can accommodate any level of diverse food description
detail, which is also true with the 24-hour recall method. Also known as a food diary, the
food record consists of a detailed listing of all food and beverages consumed by an
individual for one or more days. To reduce relying on memory, intake should be recorded

12
by the subject at the time of consumption and the subject should be trained on the proper
way to keep an accurate log (21,37). The food record is then reviewed by trained
personnel in order to ensure sufficient detail of food descriptions, preparations, and
amounts (17,32). An advantage of using a food record is that, if subjects are compliant
with instructions, the foods and amounts eaten are recorded immediately and relying on
memory is not necessary, unlike with 24-hour recalls. Keeping a food record requires a
high level of motivation for the subject, which can lead to poor response rates if subjects
are not inspired to keep accurate records. Taylor and colleagues (32) designed a study to
determine the validity of a food frequency questionnaire compared to a 4-day food record
for assessing calcium and vitamin D intake in adolescent girls with and without anorexia
nervosa. Daily calcium and vitamin D intake did not differ between the food record and
questionnaire. They found that there was better compliance with the questionnaire than
with the food record, which reflects the general sentiment that food records are
burdensome to complete. Multiple food record days are needed in order to correctly
assess usual individual intake. The number of days necessary for an accurate estimation
of intake depends on the daily variability of the nutrient of interest. Basiotis and
colleagues (52) used food records from 29 participants who completed a 365 consecutive-
day food record to determine the number of days of intake needed to estimate average
nutrient intakes for individuals and groups of individuals. Food energy and 18 nutrients,
except vitamin D, were analyzed. The number of days of food intake records needed to
predict the usual nutrient intake of an individual varied substantially among individuals
for the same nutrient and within individuals for different nutrients. Food energy required
31 days to predict usual intake (the least) and vitamin A required 433 days (the most).

13
For estimating mean nutrient intake for the group, 3 days were needed for food energy
and 41 days were needed for vitamin A. Authors concluded that for even larger groups,
fewer days of food records would be necessary. The Basiotis study, as well as a paper by
Nelson and colleagues (53) that presents a comprehensive picture of within- and
between-subject variation in nutrient intake, suggest that the minimum number of days of
intake required for characterizing usual intake for energy and macronutrients ranges from
3-10 days. For food components, such as vitamins and minerals, with large day-to-day
variability, the number of days required may range from 20 to >50 days (17). Participant
motivation and logistics make this situation impractical for most researchers. In order to
assess intake of energy and macronutrients, 4-5 days of food record intake are
customarily selected as a reasonable compromise. For nutrients with high within-person
variability that are found in few food sources such as vitamins and minerals, FFQs
specifically designed to assess these micronutrients are usually selected as the method of
choice.
Food Frequency Questionnaire
The 24-hour dietary recall and the food record differ in their methods of data
collection from the FFQ. Whereas the 24-hour recall and the food record report specific
foods and amounts consumed on a particular day, the FFQ is based on an individual’s
perception of typical intake over a period of time, usually from 1 month to a year (17,18).
When designing a FFQ, decisions about whether to measure intake of specific nutrients
or whether there is a need for a more comprehensive dietary assessment are critical.
There are many factors to consider when designing a questionnaire, which include
whether the primary objective is to rank individuals or to get a measure of absolute intake

14
of a nutrient. Also, the questionnaire must include food items that are consumed
reasonably often by a majority of individuals. Developing the food list for a questionnaire
takes careful consideration and can be approached by various methods: a review of
published food composition tables using foods that contain large amounts of the nutrient
of interest; or start with a long list of foods and reduce the list by pilot testing the
questionnaire. Stepwise regression is a more sophisticated approach and has been used,
among other approaches, to develop questionnaires that measured a fairly comprehensive
list of nutrients that needed to fit in a relatively small amount of space (54,55). FFQs can
be “short” or “long” depending on the number of questions included. In large
epidemiological studies, it may not be feasible to collect multiple days of dietary intake
via the 24-hour dietary recall or the food record. Therefore, the FFQ is generally the most
appropriate method for measuring intake in this situation. A number of studies have used
FFQs to investigate relationships between dietary intake and disease outcomes or to just
assess energy, macronutrient, and micronutrient intakes in a pediatric population (19-
25,32,33,36-44). In order to determine validity of their FFQ, most of these studies
compared their questionnaire with either food records or dietary recalls. Only three
studies (21,32,33) were found that focused on vitamin D intake among adolescent
populations, and the studies are summarized in Table 1. Using 3-day diaries for reference,
Marshall and colleagues (21) investigated the relative validities of the Iowa Fluoride
Study questionnaire and the Block Kids’ Food Questionnaire in assessing vitamin D
intakes. Children completed the Iowa Fluoride Study nutrient questionnaire (n=223), the
Block Kids’ Food Questionnaire (n=129) and 3-day diaries during similar time periods.
Nutrient correlations between intakes estimated from 3-day diaries and questionnaires

15
were similar for vitamin D intake. The authors concluded that a dietary assessment
method that targets specific foods or nutrients could be as effective at estimating intakes
as a more comprehensive assessment tool. They also stated that it is important to consider
major dietary sources of the relevant nutrient and dietary habits of the population of
interest when designing a targeted nutrient tool. Using a 3-day food record as a reference,
Marshall and colleagues (33) designed a study to evaluate the validity of a beverage
frequency questionnaire in assessing calcium and vitamin D intakes. They found that
their questionnaire could provide a relative estimate of vitamin D intake. As consumers
are decreasing their milk intake and increasing their soft drink and energy drink intake,
they are consuming fewer beverages that contribute vital nutrients to the total diet such as
calcium and vitamin D.

16
Table 1. Characteristics of studies that focused on vitamin D intake among adolescent
populations
Author/year
publication
Participants/age
group
Dietary method(s)/
reference method
Findings Limitations
Taylor et al.
(32) (2009)
57 girls with
anorexia nervosa
50 healthy girls
12-18 years
FFQ
4d food record
Greater compliance
with FFQ (99%) than
food record (71%).
Daily vitamin D intake
from food record and
FFQ did not differ.
Strong correlations
observed for daily
vitamin D intake
derived from FFQ vs
food record (r=0.78,
P<0.0001).
Vitamin D concentrations
were not measured as
biomarker of intake.
Socioeconomic status and
parental education, which
can affect dietary reporting,
were not collected.
Marshall et
al. (21)
(2008)
223 children
completed Iowa
Fluoride Study
questionnaire and
3 d food record at
9 years;
129 children
completed the
Block Kids’ Food
Questionnaire
and 3 d food
record at 8.3
years
Iowa Fluoride
Study targeted
nutrient
questionnaire
Block Kids’ Food
Questionnaire
3 d food record
Correlations with food
records for vitamin D
intakes reported on
Iowa Fluoride Study
questionnaires were
similar to correlations
with vitamin D reported
on Block Kids’ Food
Questionnaire.
Percentage of exact
agreement was lower
for vitamin D for
intakes reported on
Iowa Fluoride Study
questionnaires
compared to Block
Kids’ Food
Questionnaires relative
to food records.
Targeted nutrient
questionnaires were not
administered before
standard 3 d food record,
leading to potential bias.
Parents reported data and
may not know what/how
much children are eating.
Subjects reporting data may
not remember specifics of
intake. Participants
primarily Caucasian from
narrow geographic region –
not a representative sample
of the general population.
Results not generalizable to
wider population.
Marshall et
al. (33)
(2003)
240 children
6 months-5 years
Quantitative
beverage
questionnaire
3 d food record
Correlations between
mean daily nutrient
intakes estimated from
questionnaires and food
record were 0.60-0.80
for vitamin D.
Targeted beverage
questionnaire was not
administered before
standard 3 d food record,
leading to potential bias.
Parents reported data and
may not know what/how
much children consumed.
Participants primarily
Caucasian from narrow
geographic region – not a
representative sample of the
general population. Results
should not be generalized to
wider population.

17
Vitamin D Intake in Children and Adolescents
The EAR for vitamin D is 400 IU/day (10 µg) for children age 1-13 years and the
RDA is 600 IU/day (15 µg) (28). According to food consumption data collected in
NHANES 1988-1994 (NHANES III), the 1994-1996 Continuing Survey of Food Intakes
by Individuals (CSFII 1994-1996), and the 1998 Supplemental Children’s Survey, the
majority of Americans are not consuming the Adequate Intake (AI) of vitamin D (56).
Although dairy was the largest food source of calcium and vitamin D, some avoided
dairy products due to taste or lactose intolerance. For these persons, fortified juices can
provide an alternative source of vitamin D. Using NHANES 2005-2006 data, Bailey and
colleagues (57) estimated vitamin D intakes from food and dietary supplements.
Participants completed two 24-hour recalls and a questionnaire. Among 9-13 year olds,
24% of males and 32% of females used a daily supplement containing vitamin D. Mean
vitamin D intake among this age group was 8.4 µg or 336 IU/day for males and 8.0 µg or
320 IU/day for females. The prevalence of meeting the AI for vitamin D through diet was
53% and 47% among 9-13 year old males and females, respectively. When dietary
supplement use was included, 66% of 9-13 year old males met the AI for vitamin D and
53% of 9-13 year old females met the AI for vitamin D. Decreased dairy consumption
relates to inadequate intake of key nutrients, including vitamin D (58). Using data from
CSFII 1994-1996, 1998 and NHANES 1999-2000 reports, Fulgoni and associates (59)
showed that African American males across all age groups had significantly lower dairy
intake than did their non-African American counterparts. Likewise, African American
females age 2-18 years consumed significantly less dairy when compared with non-
African Americans. In a segment of the population that is already at risk of low serum

18
vitamin D concentrations due to darker skin pigmentation, these results indicate a need
for increased education about the role vitamin D plays in our health and the risks of not
consuming enough vitamin D-fortified foods and beverages or a vitamin D supplement.
FFQs are typically validated by comparing results with food records as the
reference method (18,21,24-26,32-34,36-40,43,44). Statistical tests are used to determine
whether the two instruments reported similar values for nutrients. These tests assess
reliability and validity, and statistical analysis includes paired sample t tests, Pearson’s
correlation coefficients, Spearman correlations, Fisher’s exact test, Wilcoxon rank sum
test, weighted K statistics, and percentages of exact agreement.

19
REFERENCES
1. Weng FL, Shults J, Leonard MB, Stallings VA, Zemel BS. Risk factors for low
serum 25-hydroxyvitamin D concentrations in otherwise healthy children and
adolescents. Am J Clin Nutr. 2007;86:150-158.
2. Kumar J, Muntner P, Kaskel FJ, Hailpern SM, Melamed ML. Prevalence and
associations of 25-hydroxyvitamin D deficiency in US children: NHANES 2001-
2004. Pediatrics. 2009;124:e362-370.
3. Gordon CM, DePeter KC, Feldman HA, Grace E, Emans SJ. Prevalence of
vitamin D deficiency among healthy adolescents. Arch Pediatr Adolesc Med.
2004;158:531-537.
4. Rajakumar K, Fernstrom JD, Janosky JE, Greenspan SL. Vitamin D insufficiency
in preadolescent African-American children. Clin Pediatr. 2005;44:683-692.
5. Gordon CM, Feldman HA, Sinclair L, Williams AL, Kleinman PK, Perez-
Rossello J, Cox JE. Prevalence of vitamin D deficiency among healthy infants and
toddlers. Arch Pediatr Adolesc Med. 2008;162:505-512.
6. Dong Y, Pollock N, Stallmann-Jorgensen IS, Gutin B, Lan L, Chen TC, Keeton
D, Petty K, Holick MF, Zhu H. Low 25-hydroxyvitamin D levels in adolescents:
race, season, adiposity, physical activity, and fitness. Pediatrics. 2010;125:1104-
1111.

20
7. Looker AC, Dawson-Hughes B, Calvo MS, Gunter EW, Sahyoun NR. Serum 25-
hydroxyvitamin D status of adolescents and adults in two seasonal subpopulations
from NHANES III. BONE. 2002;30:771-777.
8. Willis CM, Laing EM, Hall DB, Hausman DB, Lewis RD. A prospective analysis
of plasma 25-hydroxyvitamin D concentrations in white and black prepubertal
females in the southeastern United States. Am J Clin Nutr. 2007;85:124-130.
9. Cole CR, Grant FK, Tangpricha V, Swaby-Ellis ED, Smith JL, Jacques A, Chen
H, Schleicher RL, Ziegler TR. 25-hydroxyvitamin D status of healthy, low-
income, minority children in Atlanta, Georgia. Pediatrics. 2010;125:633-639.
10. Shils ME, Shike M, Ross C, Caballero B, Cousins R. Modern Nutrition in Health
and Disease. 10th ed. Baltimore, MD: Lippincot Williams & Wilkins; 2005.
11. Linus Pauling Institute Micronutrient Research for Optimum Health: Vitamin D.
http://lpi.oregonstate.edu/infocenter/vitamins/vitaminD/. Updated November 7,
2008. Accessed November 22, 2009.
12. Misra M, Pacaud D, Petryk A, Collett-Solberg PF, Kappy M. Vitamin D
deficiency in children and its management: review of current knowledge and
recommendations. Pediatrics. 2008;122:398-417.
13. Wagner CL, Greer FR. Prevention of rickets and vitamin D deficiency in infants,
children, and adolescents. Pediatrics. 2008;122:1142-1152.
14. Holick MF. Vitamin D deficiency. N Engl J Med. 2007;357:266-281.
15. Holick MF. Vitamin D: importance in the prevention of cancers, type 1 diabetes,
heart disease, and osteoporosis. Am J Clin Nutr. 2004;79:362-371.

21
16. National Institutes of Health: Dietary Supplement Fact Sheet: Vitamin D.
http://dietary-supplements.info.nih.gov/factsheets/vitamind.asp#h3. Updated
November 13, 2009. Accessed November 22, 2009.
17. Willet W. Nutritional Epidemiology. 2nd ed. New York, NY: Oxford University
Press; 1998.
18. Rockett HR, Berkey CS, Colditz GA. Evaluation of dietary assessment
instruments in adolescents. Curr Opin Clin Nutr Metab Care. 2003;6:557-562.
19. Rockett HR, Wolf AM, Colditz GA. Development and reproducibility of a food
frequency questionnaire to assess diets of older children and adolescents. J Am
Diet Assoc. 1995;95:336-340.
20. Rockett HR, Berkey CS, Colditz GA. Comparison of a short food frequency
questionnaire with the Youth/Adolescent Questionnaire in the Growing Up Today
Study. Int J Pediatr Obes. 2007;2:31-39.
21. Marshall TA, Eichenberger Gilmore JM, Broffitt B, Stumbo PJ, Levy SM.
Relative validity of the Iowa Fluoride Study targeted nutrient semi-quantitative
questionnaire and the block kids' food questionnaire for estimating beverage,
calcium, and vitamin D intakes by children. J Am Diet Assoc. 2008;108:465-472.
22. Harnack LJ, Lytle LA, Story M, Galuska DA, Schmitz K, Jacobs DR, Gao S.
Reliability and validity of a brief questionnaire to assess calcium intake of
middle-school-aged children. J Am Diet Assoc. 2006;106:1790-1795.
23. de Assis MAA, Kupek E, Guimaraes D, Calvo MCM, de Andrade DF, Bellisle F.
Test-retest reliabiltiy and external validity of the previous day food questionnaire
for 7-10-year-old school children. Appetite. 2008;51:187-193.

22
24. Araujo MC, Yokoo EM, Pereira RA. Validation and calibration of a
semiquantitative food frequency questionnaire designed for adolescents. J Am
Diet Assoc. 2010;110:1170-1177.
25. Fumagalli F, Pontes Monteiro J, Sartorelli DS, Vieira MN, de Lourdes Pires
Bianchi M. Validation of a food frequency questionnaire for assessing dietary
nutrients in Brazilian children 5 to 10 years of age. Nutrition. 2008;24:427-432.
26. Ortiz-Andrellucchi A, Henriquez-Sanchez P, Sanchez-Villegas A, Pena-Quintana
L, Mendez M, Serra-Majem L. Dietary assessment methods for micronutrient
intake in infants, children and adolescents: a systematic review. Br J Nutr.
2009;102 Suppl 1:S87-117.
27. Holick MF. Vitamin D and bone health. J Nutr. 1996;126:1159S-1164S.
28. Institute of Medicine of the National Academies. Dietary Reference Intakes for
Calcium and Vitamin D. Washington, DC. National Academy of Sciences,
November 2010.
29. Bischoff-Ferrari HA, Giovannucci E, Willett WC, Dietrich T, Dawson-Hughes B.
Estimation of optimal serum concentrations of 25-hydroxyvitamin D for multiple
health outcomes. Am J Clin Nutr. 2006;84:18-28.
30. Gilbert-Diamond D, Baylin A, Mora-Plazas M, Marin C, Arsenault JE, Hughes
MD, Willett WC, Villamor E. Vitamin D deficiency and anthropometric
indicators of adiposity in school-age children: a prospective study. Am J Clin
Nutr. 2010 epub ahead of print 1-6.
31. Mascarenhas MR, Zemel B, Stallings VA. Nutritional assessment in pediatrics.
Nutrition. 1998;14:105-115.

23
32. Taylor C, Lamparello B, Kruczek K, Anderson EJ, Hubbard J, Misra M.
Validation of a food frequency questionnaire for determining calcium and vitamin
D intake by adolescent girls with anorexia nervosa. J Am Diet Assoc.
2009;109:479-485, 485 e471-473.
33. Marshall TA, Eichenberger Gilmore JM, Broffitt B, Levy SM, Stumbo PJ.
Relative validation of a beverage frequency questionnaire in children ages 6
months through 5 years using 3-day food and beverage diaries. J Am Diet Assoc.
2003;103:714-720; discussion 720.
34. Wu H, Gozdzik A, Barta JL, Wagner D, Cole DE, Vieth R, Parra EJ, Whiting SJ.
The development and evaluation of a food frequency questionnaire used in
assessing vitamin D intake in a sample of healthy young Canadian adults of
diverse ancestry. Nutr Res. 2009;29:255-261.
35. Bandini LG, Schoeller DA, Cyr HN, Dietz WH. Validity of reported energy
intake in obese and nonobese adolescents. Am J Clin Nutr. 1990;52:421-425.
36. Bellu R, Ortisi MT, Riva E, Banderali G, Cucco I, Giovannini M. Validity
assessment of a food frequency questionnaire for school-age children in northern
Italy. Nutr Res. 1995;15:1121-1128.
37. Rockett HR, Breitenbach M, Frazier AL, Witschi J, Wolf AM, Field AE, Colditz
GA. Validation of a youth/adolescent food frequency questionnaire. Prev Med.
1997;26:808-816.
38. Cullen KW, Watson K, Zakeri I. Relative reliability and validity of the Block
Kids Questionnaire among youth aged 10 to 17 years. J Am Diet Assoc.
2008;108:862-866.

24
39. Slater B, Philippi ST, Fisberg RM, Latorre MR. Validation of a semi-quantitative
adolescent food frequency questionnaire applied at a public school in Sao Paulo,
Brazil. Eur J Clin Nutr. 2003;57:629-635.
40. Watson JF, Collins CE, Sibbritt DW, Dibley MJ, Garg ML. Reproducibility and
comparative validity of a food frequency questionnaire for Australian children
and adolescents. Int J Behav Nutr Phys Act. 2009;6:62.
41. Buzzard IM, Stanton CA, Figueiredo M, Fries EA, Nicholson R, Hogan CJ,
Danish SJ. Development and reproducibility of a brief food frequency
questionnaire for assessing the fat, fiber, and fruit and vegetable intakes of rural
adolescents. J Am Diet Assoc. 2001;101:1438-1446.
42. Zemel BS, Carey LB, Paulhamus DR, Stallings VA, Ittenbach RF. Quantifying
Calcium Intake in School Age Children: Development and Validation of the
Calcium Counts!© Food Frequency Questionnaire. Am J Hum Biol. 2010;22:180-
186.
43. Klohe DM, Clarke KK, George GC, Milani TJ, Hanss-Nuss H, Freeland-Graves J.
Relative validity and reliability of a food frequency questionnaire for a triethnic
population of 1-year-old to 3-year-old children from low-income families. J Am
Diet Assoc. 2005;105:727-734.
44. Hacker-Thompson A, Robertson TP, Sellmeyer DE. Validation of two food
frequency questionnaires for dietary calcium assessment. J Am Diet Assoc.
2009;109:1237-1240.
45. Livingstone MB, Robson PJ, Wallace JM. Issues in dietary intake assessment of
children and adolescents. Br J Nutr. 2004;92 Suppl 2:S213-222.

25
46. Faggiano F, Vineis P, Cravanzola D, Pisani P, Xompero G, Riboli E, Kaaks R.
Validation of a method for the estimation of food portion size. Epidemiology.
1992;3:379-382.
47. Baxter SD, Hardin JW, Guinn CH, Royer JA, Mackelprang AJ, Smith AF.
Fourth-grade children's dietary recall accuracy is influenced by retention interval
(target period and interview time). J Am Diet Assoc. 2009;109:846-856.
48. Baxter SD, Guinn CH, Royer JA, Hardin JW, Smith AF. Shortening the retention
interval of 24-hour dietary recalls increases fourth-grade children's accuracy for
reporting energy and macronutrient intake at school meals. J Am Diet Assoc.
2010;110:1178-1188.
49. Hoelscher DM, Day RS, Kelder SH, Ward JL. Reproducibility and validity of the
secondary level School-Based Nutrition Monitoring student questionnaire. J Am
Diet Assoc. 2003;103:186-194.
50. Penkilo M, George GC, Hoelscher DM. Reproducibility of the School-Based
Nutrition Monitoring Questionnaire among fourth-grade students in Texas. J Nutr
Educ Behav. 2008;40:20-27.
51. Brunner E, Stallone D, Juneja M, Bingham S, Marmot M. Dietary assessment in
Whitehall II: comparison of 7 d diet diary and food-frequency questionnaire and
validity against biomarkers. Br J Nutr. 2001;86:405-414.
52. Basiotis PP, Welsh SO, Cronin FJ, Kelsay JL, Mertz W. Number of days of food
intake records required to estimate individual and group nutrient intakes with
defined confidence. J Nutr. 1987;117:1638-1641.
26
53. Nelson M, Black AE, Morris JA, Cole TJ. Between- and within-subject variation
in nutrient intake from infancy to old age: estimating the number of days required
to rank dietary intakes with desired precision. Am J Clin Nutr. 1989;50:155-167.
54. Willett WC, Sampson L, Stampfer MJ, Rosner B, Bain C, Witschi J, Hennekens
CH, Speizer FE. Reproducibility and validity of a semiquantitative food
frequency questionnaire. Am J Epidemiol. 1985;122:51-65.
55. Mark SD, Thomas DG, Decarli A. Measurement of exposure to nutrients: an
approach to the selection of informative foods. Am J Epidemiol. 1996;143:514-
521.
56. Moore C, Murphy MM, Keast DR, Holick MF. Vitamin D intake in the United
States. J Am Diet Assoc. 2004;104:980-983.
57. Bailey RL, Dodd KW, Goldman JA, Gahche JJ, Dwyer JT, Moshfegh AJ, Sempos
CT, Picciano MF. Estimation of total usual calcium and vitamin D intakes in the
United States. J Nutr. 2010;140:817-822.
58. Marshall TA, Eichenberger Gilmore JM, Broffitt B, Stumbo PJ, Levy SM. Diet
quality in young children is influenced by beverage consumption. J Am Coll Nutr.
2005;24:65-75.
59. Fulgoni V, 3rd, Nicholls J, Reed A, Buckley R, Kafer K, Huth P, DiRienzo D,
Miller GD. Dairy consumption and related nutrient intake in African-American
adults and children in the United States: continuing survey of food intakes by
individuals 1994-1996, 1998, and the National Health And Nutrition Examination
Survey 1999-2000. J Am Diet Assoc. 2007;107:256-264.

27
CHAPTER III
Manuscript in style of Journal

28
AUTHORS’ PAGE 1
The Effectiveness of a Short Food Frequency Questionnaire in Determining the 2
Adequacy of Vitamin D Intake in Children 3
Key Words: nutritional assessment; food frequency questionnaire; adolescents; vitamin D 4
Word Count – Abstract: 293 5
Word Count – Text: 4,893 6
Anita M. Nucci, PhD, RD, LD; Assistant Professor and Graduate Program Director; 7
Division of Nutrition, School of Health Professions, College of Health and Human 8
Sciences, Georgia State University; P.O. Box 3995, Atlanta, GA, 30302-3995; Phone: 9
(404) 413-1234; Fax: (404) 413-1228; [email protected] 10
Caitlin Sundby Russell, MS; 3978 Land O’ Lakes Drive, Atlanta, GA, 30342; Phone: 11
(404) 816-3455; [email protected] 12
Barbara Hopkins, MMSc, RD, LD; Clinical Instructor and Didactic Program in Dietetics 13
Director; Division of Nutrition, School of Health Professions, College of Health and 14
Human Sciences, Georgia State University; P.O. Box 3995, Atlanta, GA, 30302-3995; 15
Phone: (404) 413-1238; Fax: (404) 413-1228; [email protected] 16
Kumaravel Rajakumar, MD; Associate Professor of Pediatrics; Children’s Hospital of 17
Pittsburgh of UPMC; Children's Oakland Medical Building, 3420 Fifth Avenue, 18
Pittsburgh, PA, 15213; Phone: (412) 692-6000; Fax (412) 692-6660; 19
Corresponding Author: Anita M. Nucci 21

29
Author for Reader Requests for Reprints: Anita M. Nucci 22

30
ABSTRACT 23
Background: Studies have consistently found a high prevalence of vitamin D deficiency 24
in adolescents. Few validated dietary intake assessment tools for vitamin D exist for 25
adolescents. 26
Objective: The aim of this study was to determine if a short food frequency 27
questionnaire (SFFQ) can be used to effectively assess vitamin D intake in adolescents 28
compared to a previously validated long food frequency questionnaire (LFFQ). 29
Participants/setting: 140 healthy 6-12 year old (male n=81) Caucasian and African 30
American (n=94) children from Pittsburgh, Pennsylvania completed a SFFQ and LFFQ at 31
two time points 6 months apart. 32
Main outcome measures: Reliability and validity of a SFFQ by comparison with a 33
previously validated LFFQ for children and adolescents. 34
Statistical analysis: Reliability, validity, sensitivity, specificity, positive, and negative 35
predictive values were assessed using Pearson correlation coefficients. 36
Results: Mean vitamin D intake from the SFFQ (range, 434 to 485 IU) was higher than 37
the LFFQ (range, 320 to 378 IU). Overall association between the SFFQ and the LFFQ 38
for vitamin D intake was modest (r=0.36, P<0.001). When stratified by race, the overall 39
degree of association was weak for African Americans (r=0.26, P=0.001) and moderate 40
for Caucasians (r=0.57, P<0.001). Overall reliability testing results were modest and 41
significant for the LFFQ (r=0.28, P=0.002) and SFFQ (r=0.33, P<0.001). Association 42
between mean vitamin D intake from LFFQs and SFFQs was used to determine validity. 43
The association for validity was found to be modest (r=0.51, P<0.001). Sensitivity, 44

31
specificity, positive predictive value, and negative predictive value for the SFFQ were 45
90%, 64%, 0.78, and 0.58, respectively. 46
Conclusion: The SFFQ was found to be modestly valid and reliable in an early 47
adolescent population. Associations between African Americans were not as strong as 48
Caucasians which may be due to errors in reporting dietary consumption related to higher 49
body weight. 50

32
The Effectiveness of a Short Food Frequency Questionnaire in Determining the 51
Adequacy of Vitamin D Intake in Children 52
INTRODUCTION 53
Several studies have reported the excessive prevalence of vitamin D insufficiency 54
among children (1-9). The primary role of vitamin D in humans is to maintain serum 55
calcium and phosphorus concentrations at levels that support proper cell function and 56
bone mineralization (10,11). In children, deficiency of vitamin D is associated with 57
rickets, when growing bones fail to mineralize. When a subject is deficient in vitamin D, 58
calcium absorption is only 10 – 15% of what is normally absorbed, resulting in decreased 59
bone mineralization and secondary hyperparathyroidism (12). Maintaining adequate 60
vitamin D and calcium status during childhood may reduce the risk of developing chronic 61
diseases such as osteoporosis, multiple sclerosis, hypertension, osteomalacia, and certain 62
cancers, as well as reduce the risk of bone fracture, falls, depression, certain autoimmune 63
diseases, muscle weakness, and cardiovascular disease later in life (11,13-15). Immune 64
function and inflammation reduction are also regulated by vitamin D (16). Several factors 65
determine vitamin D status and these include dietary intake of vitamin D, skin 66
pigmentation, season, and latitude of residence (14,16). Because vitamin D is found in 67
very few foods, fortified food and beverages provide the U.S. population with most of its 68
dietary vitamin D. Fish liver oil, fatty fish, and egg yolks are natural sources of vitamin D 69
(15,16). Researchers have measured the prevalence of vitamin D deficiency in healthy 70
adolescents using serum 25-hydroxyvitamin D (25(OH)D) as a marker and dietary 71
assessment methods (2-4). These studies have consistently found a high prevalence of 72
vitamin D deficiency or insufficiency in adolescents. Subjects with the lowest serum 73

33
25(OH)D tended to be African American, obese, and those who did not consume vitamin 74
D-rich foods (2). 75
There is a range of dietary assessment methods that help determine individual and 76
population nutritional intakes and habits. These methods play an essential role in 77
establishing when a segment of the population is at risk for nutritional problems. There 78
are limited data available on validated dietary assessment tools for adolescents (17-20). 79
Previously validated tools include a food frequency questionnaire (FFQ) that provided 80
reasonable estimates on vitamin D intake in children when compared to 3-day diaries 81
(21), a calcium FFQ that was moderately associated with estimates from 24-hour dietary 82
recalls in middle-school-aged children (22), a FFQ that showed good test-retest reliability 83
for assessing food intake in schoolchildren when compared with observed food intake 84
(23), and a FFQ that suitably ranked food and nutrient intake of adolescents when 85
compared with food records (24). Fumagalli and colleagues (25) measured dietary intake 86
in 5-10 year olds comparing 3-day dietary records with a FFQ that had previously been 87
validated for use in adults. They found that the FFQ appears to overestimate usual energy 88
and nutrient intakes in children and that portion sizes need to be adjusted before adoption 89
of this instrument in children. When designing a valid assessment tool for this age group, 90
consideration should be given to the populations’ age, reading level, ability to understand 91
questions, ability to understand conceptual thinking, and whether an adult caretaker will 92
assist in completing the assessment (26). 93
At the Primary Care Center of the Children’s Hospital of Pittsburgh of the 94
University of Pittsburgh Medical Center (UPMC), Rajakumar and colleagues conducted a 95
Vitamin D and Sunlight study between June 2006 and March 2008. This study was 96
34
designed to determine the seasonal variation of vitamin D insufficiency in healthy 6-12 97
year old pre- and early adolescent African American and Caucasian children residing in 98
Pittsburgh, PA. Included in this initial study was an evaluation of nutrition intake using 99
both a long food frequency questionnaire (LFFQ) and a short food frequency 100
questionnaire (SFFQ). For the current study, a secondary analysis was performed on the 101
data generated from Rajakumar’s initial investigation. By way of validity and 102
reproducibility tests, the secondary analysis aimed to determine if the SFFQ could 103
effectively assess vitamin D intake in adolescents compared to the LFFQ. It is important 104
to use validity and reproducibility components because any interpretation of a FFQ 105
should include the degree to which a questionnaire can truly measure dietary intake (17). 106
We hypothesized that there will be no difference between adolescents’ vitamin D intake 107
calculated from a SFFQ when compared to a validated LFFQ. 108

35
METHODS 109
Study Design 110
The Vitamin D and Sunlight study was an observational study designed to 111
determine the seasonal variation of vitamin D insufficiency, and to assess its risk factors 112
and metabolic impact in healthy 6-12 year old pre-and early adolescent African American 113
and Caucasian children residing in Pittsburgh, PA. A total of 140 participants were 114
enrolled in the initial study between the summer months of June-September 2006 and the 115
winter months of December 2007-March 2008. There was no intervention and 116
participants were seen at 2 time points, with the initial visit being either in the summer or 117
winter and the follow-up visit occurring 6 months later. Blood was drawn at both visits to 118
determine serum concentrations of calcium, phosphorus, albumin, serum PTH, 25(OH)D 119
and 1,25(OH)2D. Subjects completed a LFFQ and a SFFQ at both timepoints in order to 120
assess sunlight exposure and dietary intake of vitamin D and calcium. The initial study 121
was approved by the Institutional Review Board of the University of Pittsburgh. Written 122
informed consent was obtained from parents at recruitment of the initial study and 123
participants’ assent was obtained prior to enrollment. The Institutional Review Board at 124
Georgia State University approved the secondary analysis study. 125
126
Subjects 127
The initial study used a convenience sample of patients with a mean age of 9.1 128
years at the time of recruitment. Participants were recruited from the Primary Care Center 129
of the Children’s Hospital of Pittsburgh of the University of Pittsburgh Medical Center 130
(UPMC) and from the surrounding area. Inclusion criteria included healthy 6-12 year old 131

36
pre- and early adolescent African American and Caucasian children residing in 132
Pittsburgh, PA. Children with hepatic or renal disease, metabolic rickets, malabsorptive 133
disorders, cancer, or those on treatment with anticonvulsants or systemic glucocorticoids 134
were excluded. 135
136
Data Collection 137
Study participants received a clinical exam at their initial and six month visit to 138
gather anthropometric information including weight (kg), height (cm) and body mass 139
index (BMI) (kg/m2). BMI was calculated from weight and height at baseline and follow-140
up. Dietary intake was recorded by participants at both time points using a SFFQ and a 141
LFFQ. BMI was evaluated using the 2000 Centers for Disease Control and Prevention 142
growth charts, where overweight is determined by a BMI value between the 85th
and 95th
143
percentile and obesity >95th
percentile (27,28). 144
145
The SFFQ. 146
Rajakumar and colleagues adapted a questionnaire, developed by Dr. Michael 147
Holick (Boston University Medical Center) that assessed vitamin D intake in adults, to 148
address vitamin D intake and sunlight exposure in pre- and early adolescents. The 149
questionnaire included 21 questions for the patient/parent to complete. Subjects were 150
asked if they take a multivitamin, vitamin D supplement, or cod liver oil, how many 151
servings of milk, cheese, yogurt, and vitamin D-fortified orange juice they consume per 152
day, and how often they consume fish and dried mushrooms per month. The remaining 153
questions documented sun exposure and sunscreen use. 154

37
155
The LFFQ. 156
Subjects also completed a LFFQ at baseline and at the follow-up visit. The LFFQ 157
is an eating survey designed by the Harvard Medical School, copyright ©1995 Brigham 158
and Women’s Hospital. The LFFQ was used as the gold standard against the SFFQ. The 159
LFFQ is a semiquantitative FFQ that consists of 7 food groups with 152 questions and 160
requests information on dietary intake over the past year. 161
162
Data Analyses. 163
In order to quantify the dietary intake of vitamin D, completed SFFQs were 164
analyzed using the Food Processor SQL (version 10.4.0, ESHA Research; Salem, OR) by 165
the Clinical Nutrition Department at the Children’s Hospital of Pittsburgh of UPMC. 166
LFFQ data forms were analyzed at Brigham and Women’s Hospital. Nutrient intake data 167
comprised 17 nutrients including total energy, dietary calcium, and dietary vitamin D. 168
For the current study, variables and data distribution were analyzed for normality 169
using the Kolmogorov-Smirnov test (P<0.05). Normality testing revealed that most 170
anthropometric data were not normally distributed (Table 1). Mean values were used for 171
age and vitamin D intake while median values were used for weight, height and BMI. 172
The Wilcoxon Signed-Rank test was used to examine differences in BMI between the 173
initial and 6 month visit. The Mann-Whitney U test was used to determine if there was a 174
significant difference between BMI by race at each time point. A summary of SFFQ 175
responses for multivitamin, calcium supplement, and vitamin D supplement use, as well 176
as dairy, and vitamin D-fortified orange juice consumption was determined using 177

38
frequency statistics. Vitamin D intake (IU) was found to be normally distributed for both 178
the LFFQ and SFFQ for most groups. Pearson’s correlation was used to determine the 179
correlation coefficient between the LFFQ and the SFFQ for vitamin D intake. The 180
correlation coefficient “r” indicates the strength of the relationship and the value can 181
range from -1.0 to +1.0. A correlation coefficient of near +1.0 implies perfect 182
correlation. Correlations were interpreted using the following guidelines: 0.0–0.3 as 183
weak, 0.3–0.6 as modest and 0.6–1.0 as good. Reliability testing was done using 184
Pearson’s correlation between the LFFQ and SFFQ completed at the initial visit and 185
corresponding LFFQ and SFFQ completed 6 months later. Validity of the SFFQ and 186
LFFQ was evaluated by comparing mean vitamin D intake from the two LFFQs with the 187
two SFFQs. External validity of the SFFQ was evaluated via sensitivity, specificity, 188
positive predictive value (PPV), and negative predictive value (NPV) equations. 189
Sensitivity refers to the test instrument (SFFQ) and describes the proportion of 190
participants who were correctly identified as having met the American Academy of 191
Pediatrics’ (AAP) recommendation for vitamin D (400 IU/day). Specificity also refers to 192
the test instrument, but describes the proportion of participants who were correctly 193
identified as not having met the AAP’s recommendation for vitamin D. PPV measures 194
the probability that a person who tests positive for meeting the AAP’s recommendation 195
truly consumed 400 IU/day. NPV measures the probability that a person who tests 196
negative for meeting the AAP’s recommendation actually consumed less vitamin D. 197
Statistical analyses were done using IBM® SPSS® Statistics 18 (version 18, 2010, IBM 198
Corp, Armonk, NY). 199

39
RESULTS 200
The study sample (n=140) consisted of 67% African American (n=94). At the 6 201
month follow-up (n=122), the sample consisted of 68% African American (n=83). For 202
the 6 month visit, 18 participants were lost due to follow-up. At both time points, 58% of 203
the participants were boys. The majority of data is missing for one participant in the 6 204
month follow-up group and has been excluded from the data analysis. In African 205
Americans, BMI ranged from 13.8 to 35.3 kg/m2
for the initial and 6 month visits, with 206
46% of observations above the 85th
percentile at the initial visit and 50% at the 6 month 207
visit. For Caucasians, BMI ranged from 14.3 to 32.0 kg/m2, with 25% and 28% of 208
observations above the 85th
percentile at the initial visit and 6 month visit, respectively. 209
At the initial visit, 24% of African Americans were obese compared with 12% of 210
Caucasians. Six months later, 29% of African Americans were obese compared with 12% 211
of Caucasians. A significant difference in BMI was found between the initial and 6 212
month visits for Caucasians (16.3 vs. 17.1 kg/m2, P<0.01) and African Americans (18.3 213
vs. 19.1 kg/m2, P<0.001) (Table 1). There was a significant difference between BMI by 214
race at the initial and at the 6 month visit (P<0.05). 215
At the initial visit, 24% (n=34) of participants reported taking a multivitamin, 216
while 33% (n=39) reported multivitamin use at the follow-up visit. Only 1 participant 217
reported taking a vitamin D supplement at the initial and 6 month visit. Reported intake 218
of milk, dairy products, and vitamin D-fortified orange juice from the SFFQ is shown in 219
Table 2. Median milk intake per day for participants at the initial and six month visit was 220
two 8-oz servings of milk. Median daily cheese consumption was one 1-oz serving for 221
the initial visit and one and one-half 1-oz servings at the follow up visit. Median daily 222

40
intake of other dairy products (i.e. Lactaid®, chocolate milk, yogurt) was minimal. Mean 223
vitamin D intake stratified by visit and race is shown in Table 3. Mean values for vitamin 224
D intake for the LFFQ were significantly lower than for the SFFQ at both timepoints 225
(P<0.001). There are intra-group differences between LFFQs and SFFQs at the initial and 226
6 month follow-up visits. 227
Associations between the LFFQ and the SFFQ for vitamin D intake by race and 228
visit timepoint are shown in Table 4. With the exception of African Americans at the 6 229
month visit, the associations between the 2 FFQs for vitamin D intake were significant 230
(P<0.01). For all pairs, the degree of association between the LFFQ and the SFFQ was 231
modest (r=0.36). After stratifying the population by race, the degree of correlation 232
between the LFFQ and the SFFQ was weak (r=0.26) for African Americans and modest 233
for Caucasians (r=0.57). 234
Reliability test results for vitamin D intake between the two LFFQs administered 235
6 months apart and the two SFFQs administered 6 months apart are shown in Table 5. 236
With the exception of African Americans for the LFFQs, the reliability of the 2 237
questionnaires is modest and is statistically significant (P<0.01) for all groups. 238
Association or validity between the average vitamin D intake from the two LFFQs 239
and the two SFFQs administered 6 months apart (n=119) was modest (r=0.51) and 240
significant (P<0.001). Probability statistics for predicting whether the SFFQ is able to 241
identify participants who have or have not met the AAP’s recommendation for vitamin D 242
are shown in Table 6. The SFFQ was tested against the LFFQ for sensitivity, specificity, 243
PPV, and NPV. In this evaluation, 90% of participants were correctly identified as having 244
met the AAP’s recommendation for vitamin D (400 IU/day). Of these participants, the 245
41
probability (PPV) that they actually consumed >400 IU/day was 0.78. This indicates that 246
the SFFQ is very sensitive and that the probability of the result being true is high. 247
According to the SFFQ, 64% of participants were correctly identified as not having met 248
the AAP’s recommendation; the probability that these participants actually consumed 249
<400 IU/day was 0.58. This indicates that the SFFQ is less specific than it is sensitive; 250
however, out of those who did not consume 400 IU/day, the likelihood of this result 251
being false is low. 252
253
DISCUSSION 254
This study was designed to evaluate the reliability and validity of a SFFQ in 255
determining vitamin D intake among adolescents using a LFFQ as a reference. There are 256
limited data available on adolescent behavior in regards to dietary consumption habits 257
(18,19). The adolescents’ level of independence and their caretakers’ unawareness of the 258
foods they consume further complicate assessing adolescent dietary consumption (29). 259
Developing a valid tool that accurately measures vitamin D consumption in children is 260
important in order to assess factors that optimize adequate vitamin D status. Shortening a 261
long FFQ to a targeted short FFQ would provide a quick and accurate estimate of the 262
nutrient of interest. Constructing and evaluating a less burdensome tool (the SFFQ) that 263
specifically targets a certain nutrient (vitamin D) is important in order to assess the 264
vitamin D status in a vulnerable segment of the population. 265
Rajakumar’s initial study is significant because there are a limited number of 266
dietary assessment instruments that are specifically designed for assessing vitamin D 267
intake in adolescents (18,19,30). Accurately assessing the dietary intake of the adolescent 268

42
population is essential in order to monitor their nutritional status. Valid assessment is also 269
crucial for determining links between diet and health (31). It is important to evaluate the 270
effectiveness of Rajakumar’s SFFQ because this instrument could be used in future large 271
epidemiological studies to estimate the vitamin D intake of an adolescent population. 272
Estimating vitamin D consumption in adolescents is important because of the significant 273
role this nutrient plays in establishing peak bone mass, as well as potentially preventing 274
or delaying adult-onset diseases (10,13). Since studies have shown that vitamin D 275
deficient status in US children is prevalent, it is important to have an instrument that will 276
quickly assess an adolescent’s vitamin D intake. Subsequent intervention can take place 277
if subjects are found to be deficient. 278
For the total population in our study, the mean vitamin D intake, assessed by the 279
SFFQ, was 142 IU and 90 IU higher than the LFFQ at the initial visit and 6 month 280
follow-up visit, respectively. This is not surprising given that our SFFQ’s primary focus 281
was on vitamin-D-rich foods, whereas the LFFQ assessed all foods eaten over a one year 282
period, not concentrating specifically on one nutrient. Despite the higher reported vitamin 283
D intake by the SFFQ, associations between the short and long FFQs ranged from modest 284
for the entire population (r=0.36) and weak for African Americans (r=0.26) to modest for 285
Caucasians (r=0.57). Using a 3-day diary for validation purposes, Marshall and 286
colleagues (21) found that vitamin D intake estimates were lower on targeted nutrient 287
questionnaires compared to food diaries. Our findings differ perhaps due to the open-288
ended nature of food diaries, which allow a more comprehensive assessment of nutrient 289
intake and thus accumulate more nutrient-specific data. FFQs assess specific foods or 290
nutrients and may leave out a food that is routinely eaten by a participant. 291

43
At the 6 month visit, we found a weak relation (r=0.19) between the LFFQ and 292
SFFQ for African Americans. Kaaks and colleagues (32) report that, when compared to 293
normal weight subjects, obese subjects usually underreported food intake regardless of 294
dietary assessment technique used. Similarly, Bandini and colleagues (33) found that 295
obese adolescents underreported food intake significantly more than nonobese 296
adolescents. This could explain the weak relation seen in the African American segment 297
of our study. 298
Reliability was assessed by comparing vitamin D intake data from the same 299
questionnaire administered at two separate time points. Associations were weak for the 300
entire population for the LFFQs administered six months apart (r=0.28) and modest for 301
the entire population for the SFFQs administered 6 months apart (r=0.33). Validity was 302
assessed by comparing vitamin D intake data collected using different methods (LFFQ 303
and SFFQ) at two time points. Using unadjusted values of vitamin D intake, validity 304
testing revealed modest association (r=0.51). Based on sensitivity and specificity, it is 305
deduced that the SFFQ is more accurate in measuring the proportion of people who met 306
the AAP’s recommendation for vitamin D than measuring the proportion of people who 307
did not meet the AAP’s recommendation. 308
The United States Department of Agriculture’s (USDA) MyPyramid recommends 309
2-3 cups from the milk group per day for children (34). In general, 1 cup in the milk 310
group is defined as 1 cup of milk or yogurt, 1.5-oz of natural cheese, or 2-oz of processed 311
cheese. The reported median intake our sample consumed from the milk group per day 312
was 3.05 cups at the initial visit and 3.65 cups at the 6 month follow up visit, which 313
slightly exceeds the USDA guideline. 314
44
This is the first study to assess vitamin D-only intake data from a SFFQ designed 315
specifically to measure vitamin D consumption in adolescents. Other studies have 316
assessed total macronutrient and select micronutrient intakes or types of foods eaten in 317
children (23-25,35); however, only 4 studies included relations between mean daily 318
vitamin D intake estimated from questionnaires and food records in children and young 319
adults (21,36-38). Taylor and colleagues (37) performed a study to determine the validity 320
of a FFQ for assessing calcium and vitamin D intake in 12-18 year old anorexic and 321
healthy girls. Researchers validated the FFQ with 4-day food records. They found that 322
subjects demonstrated greater compliance with the FFQ than with the food record. They 323
also observed a strong association (r=0.78) between daily vitamin D intake derived from 324
the FFQ and the food record. The researchers concluded that the FFQ was useful in 325
maximizing the information regarding calcium and vitamin D intake in a segment of the 326
population that is vulnerable to nutrient deficiencies. Our SFFQ had similar or better 327
validity than reported in other studies of one or more micronutrient-focused FFQs 328
(22,38,39). Hacker-Thompson and colleagues (39) compared 2 calcium-focused 329
questionnaires to 3-day diet records. They found modest association between the 330
questionnaires and the diet records (r=0.37). Harnack and colleagues (22) found good 331
reliability (r=0.74) of a calcium FFQ administered twice, with 1 week between 332
administrations. Validity showed a modest association between the calcium FFQ and the 333
dietary recall (r=0.43). Wu and colleagues (38) evaluated the validity of a FFQ for 334
assessing vitamin D and used a 7-day food diary for reference. Validity of the FFQ was 335
good (r=0.60). 336

45
Using a 3-day diary as a reference, Marshall and colleagues (21) investigated the 337
relative validities of the Iowa Fluoride Study questionnaire and the Block Kids’ Food 338
Questionnaire in assessing vitamin D intakes. Children completed the Iowa Fluoride 339
Study nutrient questionnaire (n=223), the Block Kids’ Food Questionnaire (n=129), and 340
3-day diaries during similar time periods. Associations between intakes estimated from 3-341
day diaries and the 2 questionnaires were modest for vitamin D intake and virtually 342
identical to our validation findings (r=0.51). Study authors concluded that a dietary 343
assessment method that targets specific foods or nutrients can be as effective at 344
estimating intakes as a more comprehensive assessment tool. They also stated that it was 345
important to consider major dietary sources of the relevant nutrient and dietary habits of 346
the population of interest when designing a targeted nutrient tool. Using a 3-day food 347
record as reference, Marshall and colleagues (36) designed a study to evaluate the 348
validity of a beverage frequency questionnaire in assessing calcium and vitamin D 349
intakes. They found that their questionnaire could provide a relative estimate of vitamin 350
D intake. The validity of our vitamin D-focused SFFQ compared favorably with the 351
results of Marshall’s beverage questionnaire. Researchers stated that as beverage intake 352
patterns change, with decreased milk intake and increased soft drink and energy drink 353
intake, this leaves fewer beverages contributing vital nutrients such as calcium and 354
vitamin D to the total diet. A study by Araujo and colleagues (24) estimated the validity 355
of dietary intake data from a FFQ designed specifically for adolescents living in Brazil 356
and demonstrated that their FFQ was a suitable tool for ranking adolescent’s energy and 357
nutrient intake. Study authors stated that aiding tools such as food models and 358
photographs should be used to reduce bias when reporting food intake portions. 359

46
Estimating vitamin D intake in children is important because of the role of 360
vitamin D in various important biological functions that include accruing peak bone 361
mass. Increased melanin causes decreased cutaneous production of previtamin D3, putting 362
African Americans at higher risk of vitamin D deficiency (40). For those who live > 40 363
degrees north all year or < 40 degrees from November to early March, there is 364
insufficient ultraviolet B (UVB) radiation from the sun for vitamin D synthesis (11). 365
Experts disagree about what constitutes vitamin D deficiency (1,3,9,10,13,14,16,41-42). 366
Proposed cutoff values for deficient 25(OH)D range from 10 ng/mL to 30 ng/mL. 367
In November 2010, the Institute of Medicine (IOM) revised the Dietary Reference 368
Intakes (DRIs) for vitamin D. The new recommendations include an EAR of 400 IU/day 369
for all age groups. The Recommended Dietary Allowance (RDA) is 600 IUs for persons 370
age 1-70 years (43). In a 2008 publication, the American Academy of Pediatrics (AAP) 371
revised their recommendation that all infants, children, and adolescents have a minimum 372
daily intake of 400 IU of vitamin D, up from 200 IU/day (13). In our total study 373
population using the SFFQ, 54% reportedly met 400 IU/day and 30% met 600 IU/day at 374
the initial visit. At the follow-up visit, these percentages reduced to 46% and 23%, 375
respectively. 376
377
Vitamin D Insufficiency in Children 378
Among the scientific community, there is mounting consensus that vitamin D 379
insufficiency is more widespread than originally thought (1-9). Research has shown that a 380
large percentage of adolescents living in the northern hemisphere are frequently vitamin 381
D deficient, particularly African Americans. Otherwise healthy children may not show 382

47
clinical signs of vitamin D deficiency, but when serum 25(OH)D concentration is 383
measured, vitamin D deficiency is present in many US adolescents. Using data from the 384
National Health and Nutrition Examination Survey (NHANES) 2001-2004, Kumar and 385
colleagues (1) analyzed data on children and adolescents and found that vitamin D 386
deficiency was common among 1-21 year old persons and was associated with adverse 387
cardiovascular risks. In this nationally representative sample of the U.S. population, 61% 388
(50.8 million) of the children had vitamin D concentrations between 15 and 29 ng/mL, 389
considered vitamin D deficient in this study. Only 4% of the children had taken 400 IU of 390
vitamin D/day for 30 days. In our study, only 1 child out of 140 reported taking a vitamin 391
D supplement on a regular basis. In Kumar’s study, children with lower vitamin D 392
concentrations were girls, non-Hispanic blacks, obese, and those who spent more time in 393
front of a television, playing video games, or using a computer. Deficiency was also 394
associated with hypertension, low HDL concentration, and elevated PTH. Suboptimal 395
vitamin D status was also common among healthy, low-income, minority children in 396
Atlanta, GA (8). Cole and colleagues reported that 22% of the children in their study 397
(n=290) had vitamin D deficiency (<20 ng/mL) and 74% had insufficiency (<30 ng/mL). 398
Fortified milk provided most dietary vitamin D (62%), comparing favorably with our 399
study where milk was the most consumed source of dietary vitamin D. Cole and 400
colleagues concluded that vitamin D intake did not influence vitamin D status. At a 401
Boston primary care center, Gordon and colleagues (4) studied 380 pediatric patients and 402
found that 12% were vitamin D deficient (<20 ng/mL) and 40% were below an accepted 403
optimal threshold (<30 ng/mL). Multivitamin use was reported in 25% of subjects and 404
69% of subjects reported occasional consumption of fortified milk. Among the 405

48
participants who had vitamin D deficiency, 32.5% showed evidence of demineralization 406
after wrist and knee radiographic assessments. In light of growing data that support 407
vitamin D’s immunomodulatory effects, study authors stated that their findings support 408
recommendations that vitamin D supplementation should be made available for all young 409
children. The Atlanta and Boston studies contradict the assumption that children living at 410
lower latitudes exhibit better vitamin D status than children living at higher latitudes. 411
412
Food Frequency Questionnaires 413
FFQs that assess nutrient intake in adolescents are uncommon. Although dietary 414
recalls and food records allow for a comprehensive evaluation of dietary habits, they 415
require a substantial commitment from the subjects which can lead to noncompliance and 416
increased dropout rates (21). Therefore, the FFQ has become the primary method for 417
assessing intake in large, population-based studies. The FFQ can also be specialized to 418
identify specific nutrient intake (44). The FFQ estimates food intake over a period of time 419
and is usually less expensive and takes less time to complete than a 24-hour recall and a 420
food record (18). Nutrition assessment instruments like the SFFQ in our study are easy to 421
administer, low-cost, simple to complete, reproducible, and accurate (19). The use of 422
FFQs can be a consistent and precise method for describing habitual dietary intake. 423
Before a FFQ is used in an epidemiological study, it should be validated to see if it 424
actually measures the aspect of the diet it was intended to assess (17). Although Klohe 425
and colleagues did not exclusively determine vitamin D status, they developed and 426
validated a FFQ for low-income children, and found that the FFQ yielded excellent 427
reliability and acceptable validity when compared to a 3-day diet record (45). This 428

49
demonstrates that FFQs can be reliable tools for assessing dietary consumption patterns 429
in youth. 430
Due to variations in adolescents’ literacy levels and their limited knowledge of 431
foods, developing an assessment tool that accurately reports nutrient intake is challenging 432
(46). We were unable to adjust the analysis for energy intake because energy intake was 433
not mentioned in the SFFQ. However, no association was found between calories and 434
vitamin D for the LFFQ; we felt using the unadjusted values for the SFFQ was justified. 435
Another limitation was the relatively small sample size of our study, which may have 436
affected the statistical power for vitamin D intake assessment. In addition to the SFFQ 437
and the LFFQ, a 3-day food record was completed by fewer than half of the participants. 438
The food record was to be used to further validate the SFFQ. However, the data from 439
many of the food records were incomplete, and did not represent an accurate description 440
of macro- and micronutrient consumption. Therefore, it was determined not to use the 441
food record data in this secondary analysis. 442
Future studies should involve continued evaluation of this micronutrient 443
assessment instrument, especially among populations vulnerable to vitamin D deficiency. 444
Using biological markers such as 25(OH)D could improve the reliability and validity of 445
this instrument. As FFQs can provide valuable feedback, which is useful for evaluating 446
micronutrient policy initiatives, the SFFQ used in this study could be used in large-scale 447
surveys to monitor vitamin D intake in segments of the population at risk for deficiency. 448
Additional studies are needed to document the effects of screening otherwise healthy 449
children for and treatment of deficient vitamin D status. 450

50
Conclusion 451
The SFFQ is a reasonably valid and reliable tool that can be used to assess 452
vitamin D intake in adolescents. The SFFQ would serve well as a tool for identifying 453
children with low vitamin D intake who may benefit from a vitamin D nutrition 454
intervention designed for increasing vitamin D consumption. 455

51
Tables 456
Table 1. Mean age and median weight, height and body mass index measures by visit and 457
race 458
Initial Visit
Total
(n=140)
African American
(n=94)
Caucasian
(n=46)
Age (y)a 9.1 + 1.7
8.9 + 1.7
9.5 + 1.7
Weight (kg)b 32.1 (26.8-39.4) 34.5 (27.5-39.1) 31.2 (24.9-41.6)
Height (cm)b 133.5 (126.8-140.8) 131.9 (127.0-139.8) 135.4 (126.5-145.6)
Body mass index (kg/m2)b 17.8 (16.2-20.4) 18.3 (16.6-21.0)*‡ 16.3 (15.4-19.2)**
6 Month Visit (n=122) (n=83) (n=39)
Age (y)a
9.6 + 1.7
9.5 + 1.7 10.0 + 1.8
Weight (kg)b 34.1 (28.8-42.8) 35.0 (29.0-42.7) 33.4 (27.8-45.7)
Height (cm)b 136.3 (129.5-143.2) 135.5 (129.5-142.2) 137.9 (128.2-145.6)
Body mass index (kg/m2)b 18.2 (16.6-21.6) 19.1 (16.7-22.4)‡ 17.1 (15.8-20.0)
aMean + SD 459
bMedian (Interquartile range of 25%-75% of the study population) 460
*Comparison of median BMI between initial and 6 month visit (P<0.001): Wilcoxon 461
Signed-Rank test 462
**Comparison of median BMI between initial and 6 month visit (P<0.01): Wilcoxon 463
Signed-Rank test 464
‡Comparison of BMI by race (P<0.05): Mann Whitney U test 465

52
Table 2. Reported intake of milk, dairy products, and vitamin D-fortified orange juice 466
per day from the short food frequency questionnaire 467
n Range Median (25%-75%)a
Initial visit
Milk (8 oz) 137 0.0 – 10.0 2.0 (1.0-3.0)
Soy, Lactaid® or chocolate milk (8 oz) 106 0.0 – 4.5 0.0 (0.0-1.0)
Cheese (1 oz or 1 slice) 133 0.0 – 8.0 1.0 (1.0-2.0)
Yogurt (1 cup) 129 0.0 – 5.0 0.05 (0.0-1.0)
Fortified orange juice (8 oz) 107 0.0 – 3.0 0.20 (0.0-1.0)
6 month visit
Milk (8 oz) 119 0.0 – 10.0 2.0 (1.0-3.0)
Soy, Lactaid® or chocolate milk (8 oz) 92 0.0 – 4.0 0.0 (0.0-1.0)
Cheese (1 oz or 1 slice) 110 0.0 – 8.0 1.5 (1.0-2.0)
Yogurt (1 cup) 106 0.0 – 4.0 0.15 (0.0-1.0)
Fortified orange juice (8 oz) 92 0.0 – 4.0 0.35 (0.0-1.0)
aInterquartile range of 25%-75% of the study population
468

53
Table 3. Vitamin D intake for the long (LFFQ) and short food frequency questionnaire 469
(SFFQ) by visit and racea 470
Initial Visit
Total
(n=140)
IU
African American
(n=94)
IU
Caucasian
(n=46)
IU
LFFQ 332 +180* 320 +168* 357 +201*
SFFQ 474 +288 485 +319 452 +215
6 Month Visit (n=122) (n=83) (n=39)
LFFQ 349 +200* 334 +185* 378 +227
SFFQ 439 +234 440 +222 434 +263
aValues are mean + SD 471
*Mean values for the LFFQ were lower than for the SFFQ (P<0.01 to 0.001): Paired-472
Samples t-Test 473
Conversion equation: 40 IU = 1 µg 474

54
Table 4. Association between the long (LFFQ) and short food frequency questionnaires 475
(SFFQ) for vitamin D intake by visit and race 476
LFFQ and SFFQ
n ra P value
b
Total 257 0.36 <0.001
African American 172 0.26 0.001
Caucasian 85 0.57 <0.001
Initial Visit
Total 138 0.35 <0.001
African American 92 0.32 0.002
Caucasian 46 0.48 0.001
6 Month Visit
Total 119 0.38 <0.001
African American 80 0.19 0.087
Caucasian 39 0.66 <0.001
aPearson correlation coefficient 477
bSignificance for r statistic
478

55
Table 5. Reliability test for vitamin D intake between two long food frequency 479
questionnaires (LFFQs) administered 6 months apart and two short food frequency 480
questionnaires (SFFQs) administered 6 months apart 481
LFFQsa SFFQs
a
n r P value n r P value
Total 119 0.28 0.002 120 0.33 <0.001
African American 79 0.09 0.428 80 0.31 0.006
Caucasian 40 0.52 0.001 40 0.41 0.008
aTest for reliability: Pearson correlation coefficient 482

56
Table 6. Probability statistics results for the short food frequency questionnaire (SFFQ) 483
Total
(258 pairs)
Sensitivitya 0.896
Specificityb 0.644
Positive Predictive Valuec 0.776
Negative Predictive Valued 0.578
aProportion of participants who were correctly identified as having met AAP vitamin D 484
recommendation (400 IU/day) 485
bProportion of participants who were correctly identified as not having met AAP 486
recommendation 487
cProbability that a person who tested positive for meeting AAP recommendation truly 488
consumed >400 IU/day 489
dProbability that a person who tested negative for meeting the AAP recommendation 490
actually consumed <400 IU/day 491

57
References 492
1. Kumar J, Muntner P, Kaskel FJ, Hailpern SM, Melamed ML. Prevalence and 493
associations of 25-hydroxyvitamin D deficiency in US children: NHANES 2001-494
2004. Pediatrics. 2009;124:e362-370. 495
2. Gordon CM, DePeter KC, Feldman HA, Grace E, Emans SJ. Prevalence of 496
vitamin D deficiency among healthy adolescents. Arch Pediatr Adolesc Med. 497
2004;158:531-537. 498
3. Rajakumar K, Fernstrom JD, Janosky JE, Greenspan SL. Vitamin D insufficiency 499
in preadolescent African-American children. Clin Pediatr. 2005;44:683-692. 500
4. Gordon CM, Feldman HA, Sinclair L, Williams AL, Kleinman PK, Perez-501
Rossello J, Cox JE. Prevalence of vitamin D deficiency among healthy infants and 502
toddlers. Arch Pediatr Adolesc Med. 2008;162:505-512. 503
5. Dong Y, Pollock N, Stallmann-Jorgensen IS, Gutin B, Lan L, Chen TC, Keeton 504
D, Petty K, Holick MF, Zhu H. Low 25-hydroxyvitamin D levels in adolescents: 505
race, season, adiposity, physical activity, and fitness. Pediatrics. 2010;125:1104-506
1111. 507
6. Looker AC, Dawson-Hughes B, Calvo MS, Gunter EW, Sahyoun NR. Serum 25-508
hydroxyvitamin D status of adolescents and adults in two seasonal subpopulations 509
from NHANES III. BONE. 2002;30:771-777. 510
7. Willis CM, Laing EM, Hall DB, Hausman DB, Lewis RD. A prospective analysis 511
of plasma 25-hydroxyvitamin D concentrations in white and black prepubertal 512
females in the southeastern United States. Am J Clin Nutr. 2007;85:124-130. 513
58
8. Cole CR, Grant FK, Tangpricha V, Swaby-Ellis ED, Smith JL, Jacques A, Chen 514
H, Schleicher RL, Ziegler TR. 25-hydroxyvitamin D status of healthy, low-515
income, minority children in Atlanta, Georgia. Pediatrics. 2010;125:633-639. 516
9. Weng FL, Shults J, Leonard MB, Stallings VA, Zemel BS. Risk factors for low 517
serum 25-hydroxyvitamin D concentrations in otherwise healthy children and 518
adolescents. Am J Clin Nutr. 2007;86:150-158. 519
10. Shils ME, Shike M, Ross C, Caballero B, Cousins R. Modern Nutrition in Health 520
and Disease. 10th ed. Baltimore, MD: Lippincot Williams & Wilkins; 2005. 521
11. Linus Pauling Institute Micronutrient Research for Optimum Health: Vitamin D. 522
http://lpi.oregonstate.edu/infocenter/vitamins/vitaminD/. Updated November 7, 523
2008. Accessed November 22, 2009. 524
12. Misra M, Pacaud D, Petryk A, Collett-Solberg PF, Kappy M. Vitamin D 525
deficiency in children and its management: review of current knowledge and 526
recommendations. Pediatrics. 2008;122:398-417. 527
13. Wagner CL, Greer FR. Prevention of rickets and vitamin D deficiency in infants, 528
children, and adolescents. Pediatrics. 2008;122:1142-1152. 529
14. Holick MF. Vitamin D deficiency. N Engl J Med. 2007;357:266-281. 530
15. Holick MF. Vitamin D: importance in the prevention of cancers, type 1 diabetes, 531
heart disease, and osteoporosis. Am J Clin Nutr. 2004;79:362-371. 532
16. National Institutes of Health: Dietary Supplement Fact Sheet: Vitamin D. 533
http://dietary-supplements.info.nih.gov/factsheets/vitamind.asp#h3. Updated 534
November 13, 2009. Accessed November 22, 2009. 535

59
17. Willet W. Nutritional Epidemiology. 2nd ed. New York, NY: Oxford University 536
Press; 1998. 537
18. Rockett HR, Berkey CS, Colditz GA. Evaluation of dietary assessment 538
instruments in adolescents. Curr Opin Clin Nutr Metab Care. 2003;6:557-562. 539
19. Rockett HR, Wolf AM, Colditz GA. Development and reproducibility of a food 540
frequency questionnaire to assess diets of older children and adolescents. J Am 541
Diet Assoc. 1995;95:336-340. 542
20. Rockett HR, Berkey CS, Colditz GA. Comparison of a short food frequency 543
questionnaire with the Youth/Adolescent Questionnaire in the Growing Up Today 544
Study. Int J Pediatr Obes. 2007;2:31-39. 545
21. Marshall TA, Eichenberger Gilmore JM, Broffitt B, Stumbo PJ, Levy SM. 546
Relative validity of the Iowa Fluoride Study targeted nutrient semi-quantitative 547
questionnaire and the block kids' food questionnaire for estimating beverage, 548
calcium, and vitamin D intakes by children. J Am Diet Assoc. 2008;108:465-472. 549
22. Harnack LJ, Lytle LA, Story M, Galuska DA, Schmitz K, Jacobs DR, Gao S. 550
Reliability and validity of a brief questionnaire to assess calcium intake of 551
middle-school-aged children. J Am Diet Assoc. 2006;106:1790-1795. 552
23. de Assis MAA, Kupek E, Guimaraes D, Calvo MCM, de Andrade DF, Bellisle F. 553
Test-retest reliabiltiy and external validity of the previous day food questionnaire 554
for 7-10-year-old school children. Appetite. 2008;51:187-193. 555
24. Araujo MC, Yokoo EM, Pereira RA. Validation and calibration of a 556
semiquantitative food frequency questionnaire designed for adolescents. J Am 557
Diet Assoc. 2010;110:1170-1177. 558

60
25. Fumagalli F, Pontes Monteiro J, Sartorelli DS, Vieira MN, de Lourdes Pires 559
Bianchi M. Validation of a food frequency questionnaire for assessing dietary 560
nutrients in Brazilian children 5 to 10 years of age. Nutrition. 2008;24:427-432. 561
26. Ortiz-Andrellucchi A, Henriquez-Sanchez P, Sanchez-Villegas A, Pena-Quintana 562
L, Mendez M, Serra-Majem L. Dietary assessment methods for micronutrient 563
intake in infants, children and adolescents: a systematic review. Br J Nutr. 564
2009;102 Suppl 1:S87-117. 565
27. Centers for Disease Control and Prevention. Overweight and Obesity. Defining 566
Childhood Overweight and Obesity. 567
http://www.cdc.gov/obesity/childhood/defining.html. Updated October 20, 2009. 568
Accessed October 12, 2010. 569
28. Centers for Disease Control and Prevention. Clinical Growth Charts. 570
http://www.cdc.gov/growthcharts/clinical_charts.htm#Set1. Updated August 4, 571
2009. Accessed October 12, 2010. 572
29. Zemel BS, Carey LB, Paulhamus DR, Stallings VA, Ittenbach RF. Quantifying 573
Calcium Intake in School Age Children: Development and Validation of the 574
Calcium Counts!© Food Frequency Questionnaire. Am J Hum Biol. 2010;22:180-575
186. 576
30. Rockett HR, Breitenbach M, Frazier AL, Witschi J, Wolf AM, Field AE, Colditz 577
GA. Validation of a youth/adolescent food frequency questionnaire. Prev Med. 578
1997;26:808-816. 579
31. Livingstone MB, Robson PJ, Wallace JM. Issues in dietary intake assessment of 580
children and adolescents. Br J Nutr. 2004;92 Suppl 2:S213-222. 581

61
32. Kaaks R, Ferrari P, Ciampi A, Plummer M, Riboli E. Part H. Advances in the 582
statistical evaluations and interpretation of dietary data. Uses and limitations of 583
statistical accounting for random error correlations, in the validation of dietary 584
questionnaire assessments. Public Health Nutr. 2002;5:969-976. 585
33. Bandini LG, Schoeller DA, Cyr HN, Dietz WH. Validity of reported energy 586
intake in obese and nonobese adolescents. Am J Clin Nutr. 1990;52:421-425. 587
34. United States Department of Agriculture. MyPyramid.gov. Inside the Pyramid. 588
http://www.mypyramid.gov/pyramid/milk_amount.aspx#. Updated September 28, 589
2010. Accessed November 8, 2010. 590
35. Bellu R, Ortisi MT, Riva E, Banderali G, Cucco I, Giovannini M. Validity 591
assessment of a food frequency questionnaire for school-age children in northern 592
Italy. Nutr Res. 1995;15:1121-1128. 593
36. Marshall TA, Eichenberger Gilmore JM, Broffitt B, Levy SM, Stumbo PJ. 594
Relative validation of a beverage frequency questionnaire in children ages 6 595
months through 5 years using 3-day food and beverage diaries. J Am Diet Assoc. 596
2003;103:714-720; discussion 720. 597
37. Taylor C, Lamparello B, Kruczek K, Anderson EJ, Hubbard J, Misra M. 598
Validation of a food frequency questionnaire for determining calcium and vitamin 599
D intake by adolescent girls with anorexia nervosa. J Am Diet Assoc. 600
2009;109:479-485, 485 e471-473. 601
38. Wu H, Gozdzik A, Barta JL, Wagner D, Cole DE, Vieth R, Parra EJ, Whiting SJ. 602
The development and evaluation of a food frequency questionnaire used in 603

62
assessing vitamin D intake in a sample of healthy young Canadian adults of 604
diverse ancestry. Nutr Res. 2009;29:255-261. 605
39. Hacker-Thompson A, Robertson TP, Sellmeyer DE. Validation of two food 606
frequency questionnaires for dietary calcium assessment. J Am Diet Assoc. 607
2009;109:1237-1240. 608
40. Chen TC, Chimeh F, Lu Z, Mathieu J, Person KS, Zhang A, Kohn N, Martinello 609
S, Berkowitz R, Holick MF. Factors that influence the cutaneous synthesis and 610
dietary sources of vitamin D. Arch Biochem Biophys. 2007;460:213-217. 611
41. Bischoff-Ferrari HA, Giovannucci E, Willett WC, Dietrich T, Dawson-Hughes B. 612
Estimation of optimal serum concentrations of 25-hydroxyvitamin D for multiple 613
health outcomes. Am J Clin Nutr. 2006;84:18-28. 614
42. Moore CE, Murphy MM, Holick MF. Vitamin D intakes by children and adults in 615
the United States differ among ethnic groups. J Nutr. 2005;135:2478-2485. 616
43. Institute of Medicine of the National Academies. Dietary Reference Intakes for 617
Calcium and Vitamin D. Washington, DC. National Academy of Sciences, 618
November 2010. 619
44. Nelms M, Sucher K, Long S. Nutrition Therapy and Pathophysiology. Belmont, 620
CA: Thomson Brooks/Cole; 2007. 621
45. Klohe DM, Clarke KK, George GC, Milani TJ, Hanss-Nuss H, Freeland-Graves J. 622
Relative validity and reliability of a food frequency questionnaire for a triethnic 623
population of 1-year-old to 3-year-old children from low-income families. J Am 624
Diet Assoc. 2005;105:727-734. 625

63
46. Buzzard IM, Stanton CA, Figueiredo M, Fries EA, Nicholson R, Hogan CJ, 626
Danish SJ. Development and reproducibility of a brief food frequency 627
questionnaire for assessing the fat, fiber, and fruit and vegetable intakes of rural 628
adolescents. J Am Diet Assoc. 2001;101:1438-1446. 629