Environment and Human Rights. - Bihar Human Rights Commission

The Effect of Winning Coalition Size on Human Rights Protections: An Instrumental
Variable Analysis
Alida Pecanin
Advisor: Professor Anna Harvey
New York University Department of Politics
April 2014

! Pecanin 1
Abstract:
Do more democratic political institutions lead to increased protections for human rights? Existing work describes a positive relationship between democratic institutions and human rights protections (Poe and Tate 1994; Fein 1995; BDM et al. 2003). Endogeneity issues are not accounted for in existing work, however, undermining any inferences drawn from these results. This thesis tests whether existing findings withstand accounting for the endogeneity of institutions. More specifically, this thesis tests whether the results reported in BDM et al. (2003), suggesting that larger sizes of the group whose support is essential for the leader’s survival (the winning coalition) increase human rights, are robust to the implementation of an instrumental variable design. The instrumental variable design used by Acemoglu et al. (2001) is adapted so that an instrumental variable (early European settler mortality rates in colonies) is used to predict the endogenous independent variable (winning coalition size). Predicted values of winning coalition size are then used to predict levels of rights protections. Results suggest that the log of capped settler mortality is a good predictor of winning coalition size, and that the relationship between predicted winning coalition size and human rights is positive and significant. Results also indicate that we cannot reject the hypothesis that winning coalition size is actually exogenous to levels of rights protections. These results confirm those reported in BDM et al. (2003). More democratic institutions do appear to lead to increases in rights protections, even after addressing endogeneity concerns.

! Pecanin 2
Research Question
Existing work in political science has found that political institutions help to explain the
variation in the promotion of human rights across countries. Countries in which citizens can hold
leaders politically accountable for their actions tend to promote public goods like increased
protections for human rights.
However, existing work has failed to account for the endogeneity of political institutions.
This paper aims to explore whether existing findings of the effect of institutions on rights
withstand accounting for the endogeneity of those institutions. More specifically, an instrumental
variable approach is applied to Bueno de Mesquita et al.’s work in The Logic of Political
Survival (2003) in order to test whether there is a robust relationship between winning coalition
size and human rights promotion. In an instrumental variable setup, an exogenous third variable
is used to predict the endogenous independent variable, and then those predicted values are used
to predict the dependent variable. The benefit of this approach is that it can adjust for both
observed and unobserved confounding effects.
To apply an instrumental variable setup to The Logic of Political Survival, early
European settler mortality in colonies will be used to predict Bueno de Mesquita et al.’s
measurement of political institutions: winning coalition size. The winning coalition is the group
of people in the country whose support is essential for the leader to stay in power. Predicted
values of winning coalition size are then used to predict measures of human rights protections.
Literature Review
Democracy and Human Rights

! Pecanin 3
There is a widespread consensus that more democratic political institutions are associated
with higher levels of rights protections. Some studies characterize this association as a linear one
(Poe and Tate 1994). Others suggest that the relationship is an inverted U shape, with the most
atrocious violations committed by countries that are partly democratic (Fein 1995). Other
scholars suggest a threshold relationship, where below a certain level, democracy has no impact
on human rights (Davenport and Armstrong 2004; Bueno de Mesquita et al. 2005).
In “Repression of Human Rights To Personal Integrity In The 1980s: A Global Analysis”
(1994), Steven Poe and C. Neal Tate examine various facets of political and economic
institutions and their effects on human rights repression. The institutions they examine include
participation in civil or international war, economic development, and population growth and
size, among other variables. The main institution that they focus on in their work, however, is
democracy level, which is measured in two ways: 1) the Vanhanen index (1990), which
concentrates exclusively on the electoral aspects of countries, and 2) the Freedom House index
for political rights. Poe and Tate use ranking systems of countries based on reports from
Amnesty International and the U.S. Department of State to measure human rights abuses. These
rankings take into account repressive government acts such as torture, imprisonment, and
political killings/executions. Poe and Tate’s causal mechanism rests on the idea that democracies
allow for political tools such as parties and elections that enable the citizens to carry their
interests into government and organize to oust abusive leaders. Such factors hold politicians
accountable for their actions and hinder them from committing repressive acts. Poe and Tate
employ an ordinary least squares regression (OLS) of democracy and human rights abuses across
a sample of 153 countries from the 1980s. They find that democracy has a strong impact on

! Pecanin 4
whether the state represses human rights in that as a country becomes more democratic, human
rights repressions decrease.
This work, however, fails to address the problem of the endogeneity of political
institutions. An endogeneity problem arises when there is a factor related to the dependent
variable that is also related to the independent variable, yet is unaccounted for in the model.
There could be a third variable that affects both democracy levels and government repression of
human rights, and there is a problem when this third variable is difficult or impossible to
measure. Failing to control for the endogenous nature of political institutions makes it hard to
find a convincing causal relationship between the variables. An example of such a variable could
be the internalized preferences or sentiments of the leader and citizens. When citizens hold
preferences that are relatively more democratic, they could try to influence policymakers to both
make the country more democratic and increase human rights protections. Similarly, leaders
could hold democratic values. Such values would influence both the democratic strength of the
country and the amount of human rights repressions. However, these preferences are hard to
truly measure. Any means used to measure preferences, whether it be surveys or other means,
cannot truly measure preferences because people might misrepresent their views or be reluctant
to share such views. If, for example, a survey were circulated throughout an autocratic country
asking whether citizens preferred a more democratic system, the citizens would be reluctant to
express their true views because they would fear punishment from their oppressive government.
While Poe and Tate suggest a linear relationship between democracy and human rights,
Helen Fein characterizes the relationship between political institutions and human rights abuses
(or, as she calls them, “life-integrity violations”) as an inverted U shape in her work “More
Murder in the Middle: Life-Integrity Violations and Democracy in the World, 1987” (1995).

! Pecanin 5
Fein examines the relationship between life-integrity violations and freedom in 145 states during
1987. She aims to discover if the relationship between democratic institutions and life-integrity
violations is linear or if the relationship is an inverted U shape, with fewer violations committed
in total democracies and total autocracies than in countries that are only partly democratic or
partly autocratic.
Fein creates her own measurement of life-integrity violations, called the LIVA scale,
based on content analysis and evaluation of patterns of violation reported in the Amnesty
International 1988 Report. In her sample she includes 145 countries during 1987. To measure
democracy Fein uses the rankings of Raymond D. Gastil in his annual “Comparative Study of
Freedom” from 1988. These rankings classify states as “Free,” “Partly Free,” and “Not Free”
based on sub-classifications of Political Rights and Civil Liberties. Using these variables Fein
creates a series of tables from which she gleans data suggesting that partly free states and unfree
states both commit similar numbers of violations, but partly free states are more likely to commit
violations at the worst level than are unfree states. This confirms the idea that the relationship
between democracy and life-integrity violations is an inverted U shape, where we can expect the
most severe human rights violations to be committed in states that are partly free, a relationship
which she dubs as “More Murder In The Middle.” Ultimately, her data strongly suggests that an
increase in freedom in unfree states allows for the people to better organize movements against
their unfree state, and therefore provokes greater state repression.
However, Fein’s findings also fall victim to the problem of the endogeneity of democracy
levels in a nation. As mentioned before, a country’s democracy level is measured by whether a
country is labeled “Free,” “Partly Free,” and “Not Free,” which depends upon sub-classifications
of Political Rights and Civil Liberties, which are themselves measurements of the strength of

! Pecanin 6
human rights in a country. This measurement strategy allows for reverse causality, where the
dependent variable, human rights abuses, has an impact on the degree of democracy in a country.
It could be that more human rights abuses increase the likelihood that a country will be
categorized as “Partly Free” or “Not Free” on the Gastil democracy scale. The possibility of
reverse causality in the measurement of democracy calls into question any relationship found. It
cannot be determined whether the relationship found is because democracy impacts human rights,
or because human rights impacts democracy. Therefore, no relationship found through this
model is definitive.
Bueno de Mesquita et al.’s The Logic of Political Survival (2003) estimates the effect of
winning coalition size (W) on the Freedom House indexes for civil liberties and protection of
political rights. Bueno de Mesquita et al. define the winning coalition as the subset of a country’s
population whose support endows the leadership with political power. Both rights indexes are on
a seven-point scale, where higher numbers indicate fewer civil liberties or protections of political
rights. This data is available for 140 countries spanning 1972-1999. Bueno de Mesquita et al.’s
causal mechanism rests on the idea that when a leader is faced with a relatively large winning
coalition, the leader will need to provide goods in order to please the winning coalition. Pleasing
the winning coalition allows the leader to stay in office. A large winning coalition influences the
leader to offer goods that appeal to a large group of people, and human rights are such goods.
Regressing the data strongly suggests that both civil liberties and political rights are very
dependent on coalition size. The larger the winning coalition is, the stronger the country’s
commitment to civil liberties and political rights. Bueno de Mesquita et al. also discover that
countries characterized as democratic that have presidential systems do better at advancing civil
liberties and are somewhat better at protecting political rights than are parliamentary systems.
! Pecanin 7
However, these findings are not entirely convincing. An OLS regression of W and human
rights does not fix the nonrandom assignment of W. The particular size of W in a country is the
result of many factors, some of which could also affect human rights protections. Even though
Bueno de Mesquita et al. control for variables such as wealth, population, and region, it is very
likely that there are other variables for which their model does not account. For example, the
preferences of citizens and leaders may lead them to advocate both for or against democracy and
for or against human rights. The problem that arises is that these preferences cannot be truly
measured and controlled for in the model and, since they are uncontrolled for, any relationship
found cannot be said to be definitive due to the influence of this omitted factor.
In “Democracy and the Violation of Human Rights: A Statistical Analysis from 1976 to
1996” (2004) Davenport and Armstrong find that their regressions strongly point towards a
threshold relationship between democracy and human rights abuses, where below a certain level,
democracy has no impact on human rights violations. To measure the level of democracy in
political institutions they use Polity IV’s Polity index, where a score of 10 indicates a highly
democratic country and a score of 0 indicates a highly autocratic country. To measure human
rights abuses, they look at the database developed by Poe and Tate (1994) and Poe, Tate, and
Keith (1999). It assigns a level of human rights abuses on a country based upon various aspects
such as civil war, international war, and military control, among other variables. All variables are
taken from 1976 to 1996. Davenport and Armstrong argue for the threshold relationship on the
grounds that countries that are partially democratic do not have political institutions that are
strong enough to deter repressive actions. They note that political institutions essential to
deterring human rights violations, such as the legislature’s constraints on the executive, are not
strong enough to effectively prevent the executive from acting as he wishes. They surmise that

! Pecanin 8
only above a certain level can a country gain institutions strong enough to prevent repressive
behavior by leaders.
Davenport and Armstrong find that in any country with a Polity score below 7, adopting
more democratic institutions will not lessen human rights violations. Their data also suggests that
above a Polity of 7, adopting more democratic institutions influences human rights repression in
a negative and roughly linear way, which means that as countries adopt more democratic
institutions, human rights repressions are expected to decrease.
Similarly, Bueno de Mesquita et al. (2005) find a threshold relationship in their study.
Like Davenport and Armstrong (2004), Bueno de Mesquita et al. use Polity IV’s Polity index to
measure the level of democracy. In an attempt to identify which dimensions of political
institutions affect human rights, they also look at various dimensions of institutions, such as the
presence of party competition, whether there are elections, whether there are executive
constraints, and other variables. They study human rights abuses using the five-point political
terror scale (PTS), in which higher scores indicate higher levels of human rights violations.
Bueno de Mesquita et al.’s findings indicate that political participation at the level of
multiparty competition is more significant than other dimensions in reducing human rights
abuses. Their findings also indicate a threshold relationship between democratic institutions and
human rights, where below a Polity score of 6, countries that adopt more democratic political
institutions will not greatly lower human rights violations. Adopting more democratic institutions
only lowers human rights violations when the country’s Polity score is at 6 or above.
The causal mechanism behind such findings, as told by Bueno de Mesquita et al., seems
to be that democracy is reliable in reducing human rights abuses only when its institutions are
such that they ensure accountability on the part of the leader. The reform of one aspect of

! Pecanin 9
political institutions is not enough to ensure political accountability; it is necessary for all
institutions to become more democratic. For example, elections alone do not ensure
accountability; other institutions such as party competition, government transparency, and
constraints on the executive are necessary. As such, Bueno de Mesquita et al. surmise that such
institutions are only fully formed when a country achieves a certain level of democracy wherein
leaders are truly held accountable to their constituents and prevented from committing human
rights abuses.
Davenport and Armstrong (2004) and Bueno de Mesquita et al. (2005) both find a
threshold relationship democracy level and human rights violations. Even though the works
strongly suggest that there is a threshold relationship, they both do not take into account that
democracy levels are endogenous. While Davenport and Armstrong and Bueno de Mesquita et al.
both control for factors such as wealth and population, their results are called into question
because there exist factors that affect both democracy level and human rights abuses, but are
unaccounted for in their works. An example of such a factor could be the hidden democratic
culture in the country. If there exist organizations or communities that attempt to influence
citizens, politicians, leaders, or other individuals to change their views to become more
democratic, then we could see a change in the democratic level of the country. Additionally,
since democratic views tend to focus on freedoms for citizens (such as the right to vote, freedom
of speech, due process, etc.), any organization attempting to promote democratic views could
also influence human rights protections. The existence of such organizations, or such views, is
typically restrained in an autocratic country, therefore making it essential for these organizations
to hide their existence. It would then be hard to measure the democratic culture because such
views and attempts to democratize are driven into hiding for fear of prosecution.

! Pecanin 10
In their work “Political Survival and Endogenous Institutional Change” (2008), Bruce
Bueno de Mesquita and Alastair Smith discuss the question that leaders must resolve when faced
with internal revolutionary threats: to appease the revolutionaries and offer more public goods
like increased rights protections, or repress rights such as freedom of assembly and information
in order to hinder their organizational ability. Bueno de Mesquita and Smith argue that the
decision that leaders make in stopping the revolutionary threat depends on the type of revenue
sources the nation relies on.
Political institutions are measured using Bueno de Mesquita et al.’s (2003) measure of
winning coalition size (W) and Polity IV’s Democracy-Autocracy index. Central to their analysis
is the presence of a certain type of revenue source, unearned income/resources, which are
resources that do not require labor from the people, such as easily extracted resources (i.e., oil) or
foreign aid. Bueno de Mesquita and Smith use the World Bank’s (2005) World Development
Indicators to find the measurement of oil and aid as a percentage of GDP. Core Public Goods,
the dependent variable, is constructed by combining Freedom House’s indexes for Civil Liberties
and Political Rights and variables from Arthur Banks’ (2001) Cross-National Time-Series data.
Revolutionary threats are constructed with the use of Banks’ dataset, where they combine the
number of anti-government demonstrations, the number of riots, the number of government
strikes, the number of attempted assassinations, and the number of revolutions. Using these
variables, Bueno de Mesquita and Smith conduct an OLS regression of how political institutions
and free resources (the independent variables) affect the provision of Core Public Goods as a
function of the presence of a revolutionary threat on the government.
The OLS regressions strongly point towards unearned income as the deciding factor of
whether public goods like rights protections are contracted in the presence of a revolutionary
! Pecanin 11
threat. The results also suggest that increasing winning coalition size offers the best prospects for
citizens of the country to achieve long-term economic and social welfare. Bueno de Mesquita
and Smith surmise that the reasoning behind this observed relationship is that increasing winning
coalition size increases political competition and leader accountability in a way that in order to
stay in office, leaders must produce policies that the public find favorable, such as economic and
social welfare.
The flaw in Bueno de Mesquita and Smith’s work is similar to the flaw in other works in
that they overlook the endogeneity of political institutions. While their data strongly points
towards unearned income as the deciding factor in whether leaders contract human rights, we
cannot definitely say that this relationship is causal because there are omitted factors that could
influence both variables, but are difficult, or impossible, to truly measure, such as democratic
preferences in the population or democratic culture within the country.
Causal Model
Many works suggest that more democratic political institutions promote human rights
and hinder their repression. Bueno de Mesquita et al. (2003) introduce the idea that winning
coalition size may be the driving force behind this observed relationship.
The Logic of Political Survival (2003) introduces the idea of a winning coalition as an
element of the selectorate theory. This theory aims to explain how institutions influence the goals
of leaders, making some leaders more civic-minded and more prone to enact good public policies.
The theory assumes that all polities are made up of three groups, with the largest group
being all the residents within the state. Then there is the selectorate, which is made up of all
individuals who have some say in expressing their preferences for who they want in office. The

! Pecanin 12
winning coalition is the smallest group, whose support is essential if the incumbent wants to stay
in office.
The leader’s number one concern is staying in power, which is done by keeping his
winning coalition happy. His secondary concern is maximizing the amount of state revenue that
is not spent on the winning coalition. In countries with a small winning coalition, everyone wants
to be in the coalition because its members receive perks in the form of private goods from the
leader. The leader hopes that as long as he gives his winning coalition these goods, they will
continue to support him. In countries with large winning coalitions, however, it is too costly for
the leader to give out private goods to every single member of his winning coalition. This would
leave him and the country in debt. Therefore, he is able to please all members of his winning
coalition while maximizing the revenue that is left over for him to enjoy by providing public
goods that benefit all residents of the nation.
In terms of politics, public goods are general public policies that no one can be excluded
from enjoying (nonexcludable) and that can be enjoyed by all residents of the country at the
same time (nonrivalrous). Common examples of public goods promulgated by leaders include
national defense, communication and transportation infrastructure, antipollution legislation, and
government transparency. Similarly, human rights are commonly regarded as public goods.
Human rights are nonexcludable in that once laws protecting freedoms are enacted, they are
applied equally to all citizens of the country. Additionally, human rights are nonrivalrous in that
all citizens enjoy these freedoms simultaneously.
A leader will promote human rights (a public good), then, when his winning coalition is
sufficiently large enough that his profit is maximized when he provides public goods.

! Pecanin 13
Problems with Causal Inference
The problem with existing empirical studies is that they are unable to establish causality
because political institutions are not randomly assigned across countries. Preferences of leaders,
policymakers, and citizens are only a few factors that may have a large influence on both the
adoption of political institutions and human rights protections. Failure to address the endogeneity
in political institutions, then, calls into question the validity of the causal relationship between
political institutions and human rights.
Endogeneity is defined as a correlation between the independent variable and the error
term. This typically means that there is an omitted variable that is not accounted for in the model
yet that interacts with both variables. In these situations, the observed association between the
dependent and independent variable is likely to be misleading because it partly reflects omitted
factors that are related to both variables. If these factors could be measured and held constant in a
regression, the omitted variables bias would be eliminated. However, there exist factors that
influence both the dependent and independent variables but are hard to measure. An inability to
measure such factors means that they cannot be controlled for in a regression.
Simply regressing human rights on political institutions will not solve the problem of
endogeneity; another approach is necessary. Daron Acemoglu, Simon Johnson, and James A
Robinson address the endogeneity of political institutions by using an instrumental variable
(early European settler mortality rates in Europe’s overseas colonies) to predict the endogenous
independent variable (political institutions in former colonies) in their work, “The Colonial
Origins of Comparative Development: An Empirical Investigation” (2001). Isolating an
exogenously determined component of political institutions addresses concerns about the
endogeneity of this variable. This strategy works because it finds a variable, Z, which is

! Pecanin 14
correlated with the independent variable, yet unrelated to the dependent variable. This allows us
to predict the independent variable consistently without having data on omitted variables such as
the preferences of the people and the leader.
Acemoglu, Johnson, and Robinson (2001) measure political institutions as the average
protection against expropriation risk, and their dependent variable is GDP. Expropriation is when
the government takes privately owned land. This variable is measured using data from Political
Risk Services (William D. Coplin et al. 1991), which reports a value between 0 and 10 for each
country and year, with 0 corresponding to the lowest protection against expropriation. Political
Risk Services determines values for protection against expropriation through an analysis of
events or qualities of the government that could influence a country to take land. The existence
of ethnic tensions, government corruption, and internal/external conflicts are examples of the
types of events or qualities that PRS assesses in order to determine a country’s score. AJR use
this score to measure political institutions because it is expected that former colonies with low
scores in protection against expropriation correspond to AJR’s notion of an “extractive state,” in
which the colonizer kept the colony solely to extract as much natural resources as possible,
without trying to set up any political institutions that would favor a protection of ownership of
land.
The reasoning behind using European mortality rates in colonies is that Europeans would
look at these rates when deciding whether or not to emigrate to certain colonies. Colonies with
lower European mortality rates saw an influx of European settlement. Once settled, Europeans
then wanted to mimic the institutions of their home country and therefore set up political
institutions that hinged on popular support, which continue on to today. Colonies with higher
mortality rates, called “extractive states,” were not favored by Europeans for settlement and,

! Pecanin 15
therefore, were primarily exploited for economic concerns. The institutions in such colonies,
therefore, tended to be more authoritarian than the colonies favored for settlement.
Acemoglu, Johnson, and Robinson (2001) argue that these early institutions persisted to
the present and, therefore, are good determinants for today’s institutions. Indeed, regressions
found in “The Colonial Origins of Comparative Development” show high correlations between
mortality rates and European settlements in colonies; between European settlements and early
institutions; and between early institutions and institutions today. Ultimately, their data suggests
that protections against expropriation have an influence on a country’s wealth.
It is important to note that Acemoglu, Johnson, and Robinson measure institutions
differently than do BDM et al. Winning coalition is more truly a measure of political institutions
than is the PRS expropriation risk measure. The higher the value for W, the larger the group of
people whose support the leader needs to stay in power. The PRS measure of expropriation risk,
on the other hand, is more of a measure of economic stability in that it predicts the stability of
property rights for individuals or businesses. Stable property rights could exist in part because of
the design of political institutions, but also in part because of factors exogenous to political
institutions. My design, by applying the Acemoglu et al approach to the BDM et al. winning
coalition measure, will use a cleaner measure of political institutions.
Research Design
My project addresses the endogeneity of political institution by adapting Acemoglu,
Johnson, and Robinson’s study, using early European settler mortality rates to predict winning
coalition size. It aims to contribute to the discussion of the relationship between political
institutions and human rights by extending AJR to look at human rights as the dependent

! Pecanin 16
variable, and an actual measure of political institutions (W) as the endogenous independent
variable.
I employ a two-stage least regression (instrumental variable approach). The first stage
involves regressing the endogenous variable (political institutions, as measured by winning
coalition size) on the exogenous (instrumental) variable (early European settler mortality rates).
Results from the first stage should exhibit a significant relationship between early European
settler mortality rates and winning coalition size. The second stage takes the predicted values for
the winning coalition and regresses human rights measurements on them.
Testable Hypotheses
The goal of this paper is to test whether Bueno de Mesquita et al.’s initial findings
regarding the relationship between democracy and human rights remain robust using an
instrumental variables approach. The central hypothesis is that countries with larger winning
coalitions promote more human rights relative to countries with small winning coalitions.
Additionally, it is hypothesized that early European settler mortality rates in colonies are a good
predictor of winning coalition size.
The independent variable, political institutions, is measured using winning coalition size.
The type of regime (military/nonmilitary), the openness of elections for the executive, how the
executive is chosen, and the level of party competition within the nation dictate the winning
coalition size. Human rights are measured in terms of civil liberties and the protection of political
rights. It is expected that as winning coalition size increases, the level of human rights within the
nation increases as well. In other words, winning coalition size is expected to have a positive

! Pecanin 17
relationship on human rights. This is expected because an increase in winning coalition size
signifies a country that is becoming more democratic, which makes the leader more accountable.
I also include several control variables. Following Acemoglu, Johnson, and Robinson and
Hall and Jones (1999), I include absolute latitude as a measure of social infrastructure. Hall and
Jones reason that absolute latitude is correlated with Western influence, which leads to good
institutions. Regional dummies are also included, with dummies for Africa, Asia, and other
continents, with America as the omitted group. Following Rafael La Porta et al. (1998, 1999),
David Landes (1998 Chapters 19 and 20), and North et al. (1998), Acemoglu, Johnson, and
Robinson add controls for the identity of the colonizer (British or French colonial dummies) and
legal origin (French legal dummy). These works argue that former British colonies prospered
relative to former French, Spanish, and Portuguese colonies due to the political institutions and
culture they inherited from Britain. Similarly, it is thought that legal origin could have an impact
on political institutions, so French legal origin is controlled. It should be noted that in this sample,
every country has either a French or British legal origin (many countries that are not French
colonies nonetheless have French legal origins).
Description of Data
Early European Settler Mortality Rate in Colonies
The data for the early European settler mortality in colonies is provided by Daron
Acemoglu on his website. He has the original dataset from Colonial Origins, which includes the
log of settler mortality for over 100 former colonies, though he uses only 63 of those in his study.
My study uses data on 67 of these former colonies. The settler mortality variable was constructed
using data on the mortality rates of soldiers, bishops, and sailors stationed in the colonies

! Pecanin 18
between the seventeenth and nineteenth centuries.
In 2012 David Albouy challenged the reliability of the settler mortality data in "The
Colonial Origins of Comparative Development: An Empirical Investigation: Comment" (2012).
Albouy argues that Acemoglu, Johnson, and Robinson’s original work found a relationship that
is not robust. Albouy claims that there are two major problems: first, the Latin America data and
some of the African data is unreliable; second, that AJR mix information from peacetime and
“campaign” episodes. Specifically, Albouy recommends dropping all data from Latin America
and much of Africa (almost 60% of the sample) and adding a “campaign” dummy.
In their response, “The Colonial Origins of Comparative Development: An Empirical
Investigation: Reply” (2012), AJR addressed the reliability of their data. In particular, they
showed that their results were robust to capping the rate of settler mortality at 250/1000 deaths.
Systematic capping of settler mortality reduces the influence of outliers and potentially
unrepresentative observations in a way that is consistent across all countries. I also use the log of
the capped mortality rate as an instrument for winning coalition size; this data is provided by
Daron Acemoglu on his website.
Winning Coalition
To construct the winning coalition measure I combined data from the Polity IV dataset
from the Center for Systemic Peace and the Banks dataset from the Cross-National Time-Series
Data Archive. The procedure adds 1 point to the index of W for each of the following conditions:
if REGTYPE (regime type) (Banks) is nonmilitary, if XRCOMP is greater than or equal to 2
(meaning that the executive was not chosen on a hereditary or unopposed election basis) (Polity
IV), if XROPEN is greater than 2 (meaning that the executive is chosen in a more open setting
than hereditary) (Polity IV), and if PARCOMP equals 5 (meaning that there is a competitive

! Pecanin 19
party system) (Polity IV). The variable is then normalized so that it varies between 0 and 1. My
winning coalition measure is the average winning coalition for each country between the years of
2000-2006.
Human Rights
Freedom House offers two measures of human rights that are accessible through the
Freedom House website. One is the civil liberties index and the other is the political rights index.
In both indexes, the highest possible score is 7, which is associated with lower levels of civil
liberties or protection of political rights, and the lowest score is 1, which is associated with
higher levels of civil liberties or protection of political rights. For this project, the index is
inverted so that a score of 7 indicates the highest level of protections and 1 indicates the lowest
levels of protections. Data is available for over 200 countries and disputed territories from 1973-
2013, but for this paper I will only include data for each country in my sample averaged from
2007-2013.
Controls
Latitude is taken from Acemoglu, Johnson, and Robinson’s dataset. They follow the
literature of Gallop et al (1998) and Hall and Jones (1999) in using the absolute value measure of
latitude, which measures distance from the equator scaled from 0 to 1. Regional dummy
variables are constructed using Acemoglu, Johnson, and Robinson, which creates a group for
Asia, Africa, Other, and America, with America being the omitted group. In this project, only
two countries, Australia and New Zealand, make up the Other group. Controls for the identity of
the colonizer are also included. Dummy variables are utilized for British and French former
colonies, with other colonizing powers as the omitted group. The countries that make up the base
sample had either a French or British legal origin, so a French legal origin is utilized.

! Pecanin 20
In order to test the causal story motivating the use of settler mortality as an instrument for
winning coalition size, I also use a set of additional variables. These are: percent European
settlers in 1900, W at independence, and W in 1900. Percent European in 1900 documents the
percentage of those of European descent in a country’s population in 1900. This data is taken
from AJR’s dataset for “Colonial Origins”. This data is available for all colonies and is scaled
between 0 and 1, with a 1 indicating that 100% of the population is European. W at
independence represents the winning coalition size in a given country in its first year of
independence. W size is scaled from 0 to 1, with 1 indicating the highest winning coalition size.
W in 1900 corresponds to the winning coalition size in 1900. Following Acemoglu et al,
countries that were still colonies in 1900 are coded 0 because they are not independent. W at
independence and W in 1900 are taken from the dataset provided by BDM et al. (2003).
Table 1 reports summary statistics.
Empirical Method and Results
A two stage least squares approach requires two equations, the first of which is:
(Winning Coalition) = a + b1 (Log of Settler Mortality in Colonies) + X + ε.
Winning Coalition measures the size of the group that selects the leader. a is the Winning
Coalition intercept and b1 is the slope of the instrumental variable (log of settler mortality). It is
expected that b1 will be negative, which would signal that as settler mortality increases, winning
coalition size is expected to decrease. X is a vector representing control variables. ε is the error
term.

! Pecanin 21
The second equation is:
Human Rights = a + b1 (Predicted Winning Coalition) + X + ε.
Human Rights are measured using the Civil Liberties and Political Rights indexes. a is the
Human Rights intercept and b1 is the slope of the predicted value of winning coalition that we
found in the previous equation. It is expected that b1 will be positive, which would signal that as
the winning coalition size increases (meaning that the country is becoming more democratic),
human rights protections would increase as well. X is a vector representing control variables. ε is
the error term.
OLS Regressions
Table 2 reports ordinary least-squares (OLS) regressions of Civil Liberties and Political
Rights on Winning Coalition. The linear regressions are as follows:
Human Rights = a + b1 (Winning Coalition) + X + ε.
Human Rights refers to the value of protections of Civil Liberties or Political Rights in a country.
a is the Human Rights intercept while b1 is the coefficient of interest, which measures the effect
of the winning coalition on human rights. X is a vector representing the control variables. I
expect a country’s value on the Civil Liberties and Political Rights indexes to increase as
Winning Coalition increases.

! Pecanin 22
Table 2.1 reports estimates using Civil Liberties as the dependent variable. Column (1)
shows that there is a strong correlation between Winning Coalition and Civil Liberties. At the
99% confidence level, when Winning Coalition increases by one unit, protections of civil
liberties will increase by 4.562 points on the Civil Liberties index. It should be noted that an
increase of one unit in Winning Coalition is the equivalent of an authoritarian regime radically
changing into a full democracy. This relationship is visually illustrated in Figure 1, which plots
the regression estimated in Table 2.1, Column (1). In Column (2) latitude is added as a control.
The coefficient for Winning Coalition suggests that, at the 99% confidence level, a one-unit
increase in Winning Coalition will result in a 4.471 increase in Civil Liberties. Latitude is not
significant.
Columns (3) and (4) exclude Neo-Europes, the United States, New Zealand, Australia,
and Canada, from the regression. This is done in order to see whether these countries drive the
significance that is seen in Columns (1) and (2). We can see that the Neo-Europes do not drive
significance because Winning Coalition still retains its significance without these countries. In
Column (3), at the 99% confidence level, when Winning Coalition increases by one unit, Civil
Liberties will increase by 4.148. In Column (4), at the 99% confidence level, when Winning
Coalition increases by one unit, Civil Liberties will increase by 4.184. Latitude is not significant.
Columns (5) and (6) exclude African countries from the regression. Results are still robust when
this is done. In Column (5), at the 99% confidence level, when Winning Coalition increases by
one unit, Civil Liberties will increase by 6.240. Column (6) controls for latitude. In Column (6),
at the 99% confidence level, when Winning Coalition increases by one unit, Civil Liberties will
increase by 5.730. Latitude is significant in this column where, at the 99% confidence level,
when latitude increases by one unit, Civil Liberties are expected to increase by 2.634. It should

! Pecanin 23
be noted that the higher the absolute latitude, the further a country is from the equator, so,
controlling for institutions, more northern and more southern countries hold an advantage.
Columns (7) and (8) add regional dummies for Asia, Africa, and Other, although Column
(7) excludes latitude. In Column (7) the coefficient for Winning Coalition is still significant,
though lower, suggesting that a one-unit increase in Winning Coalition will result in a 3.599
point increase in the Civil Liberties index. Africa, Asia, and Other are significant as well. At the
99% confidence level, a country’s protections of Civil Liberties will be .687 points lower if they
are an African country. The data also suggests that, at the 99% confidence level, a country’s
protections of Civil Liberties will be 1.029 points lower if they are an Asian country.
Additionally, at the 99% confidence level, it is expected that a country’s protections of Civil
Liberties will be .801 points higher if they are in the category of Other. It should be noted,
though, that only two countries, Australia and New Zealand, are in this group. Therefore, this
significance is misleading because of the low number of observations for this group.
Table 2.2 reports OLS estimates for Political Rights as the dependent variable. Column
(1) regresses Winning Coalition and Political Rights without controls. It suggests that, at the 99%
confidence level, a one-unit increase in Winning Coalition will result in a 6.114 point increase on
the Political Rights index. This relationship is visually depicted in Figure 1. Column (2) includes
a control for latitude. At the 99% confidence level, a one-unit increase in Winning Coalition will
result in a 6.026 point increase on the Political Rights index. Latitude is also positive and
significant, which suggests that the farther a country is from the equator, the more Political
Rights protections it is expected to have. At the 90% confidence level, it is expected that a one-
unit increase in latitude will result in a 1.339 increase in Political Rights.

! Pecanin 24
Columns (3) and (4) exclude Neo-Europes. In Column (3), at the 99% confidence level,
when Winning Coalition increases by one unit, Civil Liberties will increase by 5.864. Winning
Coalition retains its significance but the coefficient is .25 lower as a result of controlling for
Neo-Europes. In Column (4), at the 99% confidence level, when Winning Coalition increases by
one unit, a country will increase by 5.920!points!on!the!Political!Rights!index.!Latitude!is!not!
significant. Columns (5) and (6) exclude African countries from the regression. In Column (5),
at the 99% confidence level, when Winning Coalition increases by one unit, Political Rights will
increase by 6.750. Column (6) controls for latitude while excluding African countries. In
Column (6), at the 99% confidence level, when Winning Coalition increases by one unit,
Political Rights will increase by 6.279. Latitude is also significant in this column.
Columns (7) and (8) control for region. In Column (7), at the 99% confidence level, when
Winning Coalition increases by one unit, Political Rights are expected to increase by 4.978
points on the Political Rights index. The regional controls for Africa and Asia are also significant.
At the 95% confidence level, if a country is located is Africa, Political Rights should decrease
by .901 points on the Political Rights index. Also, at the 90% confidence level, if a country is
Asian, Political Rights should decrease by 1.106 points on the Political Rights index. In Column
(8), with latitude taken into account along with regional dummies, at the 99% confidence level,
we can expect that a one unit increase in Winning Coalition will result in a 4.976 point increase
in Political Rights protections. Africa and Asia retain significance, while Latitude and Other are
not.
Overall, Tables 2.1 and 2.2 show a strong correlation between Winning Coalition and
human rights as measured on the Civil Liberties and Political Rights indexes.
! Pecanin 25
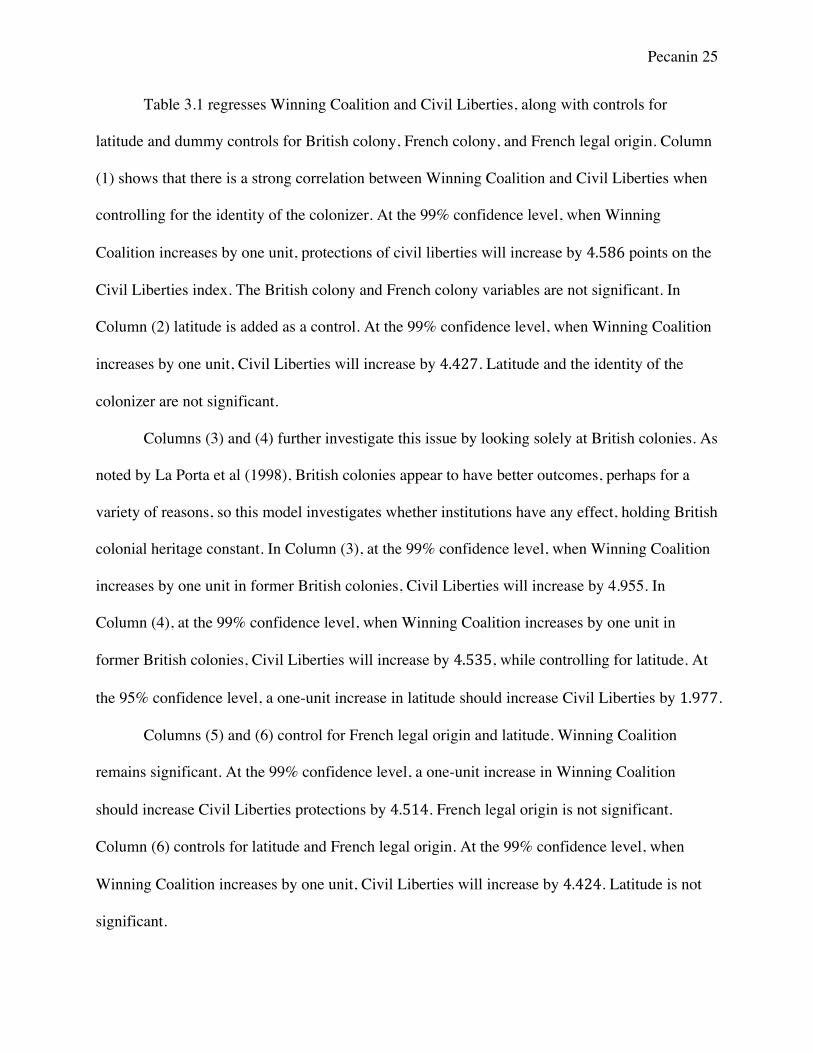
Table 3.1 regresses Winning Coalition and Civil Liberties, along with controls for
latitude and dummy controls for British colony, French colony, and French legal origin. Column
(1) shows that there is a strong correlation between Winning Coalition and Civil Liberties when
controlling for the identity of the colonizer. At the 99% confidence level, when Winning
Coalition increases by one unit, protections of civil liberties will increase by 4.586 points on the
Civil Liberties index. The British colony and French colony variables are not significant. In
Column (2) latitude is added as a control. At the 99% confidence level, when Winning Coalition
increases by one unit, Civil Liberties will increase by 4.427. Latitude and the identity of the
colonizer are not significant.
Columns (3) and (4) further investigate this issue by looking solely at British colonies. As
noted by La Porta et al (1998), British colonies appear to have better outcomes, perhaps for a
variety of reasons, so this model investigates whether institutions have any effect, holding British
colonial heritage constant. In Column (3), at the 99% confidence level, when Winning Coalition
increases by one unit in former British colonies, Civil Liberties will increase by 4.955. In
Column (4), at the 99% confidence level, when Winning Coalition increases by one unit in
former British colonies, Civil Liberties will increase by 4.535, while controlling for latitude. At
the 95% confidence level, a one-unit increase in latitude should increase Civil Liberties by 1.977.
Columns (5) and (6) control for French legal origin and latitude. Winning Coalition
remains significant. At the 99% confidence level, a one-unit increase in Winning Coalition
should increase Civil Liberties protections by 4.514. French legal origin is not significant.
Column (6) controls for latitude and French legal origin. At the 99% confidence level, when
Winning Coalition increases by one unit, Civil Liberties will increase by 4.424. Latitude is not
significant.

! Pecanin 26
Table 3.2 reports estimates using Political Rights as a dependent variable, including
controls for latitude, British colony, French colony, and French legal origin. Column (1) controls
just for the identity of the colonizer. At the 99% confidence level, when Winning Coalition
increases by one unit, Political Rights will increase by 5.675!points. British colony and French
colony variables are not significant. Column (2) controls for latitude as well as the identity of the
colonizer. At the 99% confidence level, when Winning Coalition increases by one unit, Political
Rights will increase by 5.485. Latitude is also significant. At the 90% confidence level, when
latitude increases by one unit, protections of Political Rights increase by 1.535. Identity of
colonizer is again not significant.
Columns (3) and (4) look only at British colonies. In Column (3), at the 99% confidence
level, when Winning Coalition increases by one unit in former British colonies, Political Rights
will increase by 5.548. In Column (4), at the 99% confidence level, an increase in Winning
Coalition by one unit will increase Political Rights by 5.034 points. Columns (5) and (6) control
for French legal origin and latitude. At the 99% confidence level, a one-unit increase in Winning
Coalition will increase Civil Liberties protections by 5.998 points. The coefficient for French
legal origin is not significant. Column (6) controls for latitude and French legal origin. At the
99% confidence level, when Winning Coalition increases by one unit, Political Rights will
increase by 5.998. Latitude is significant. At the 90% confidence level, when latitude increases
by one unit, Political Rights are expected to increase by 1.336. Legal origin is again insignificant.
Overall, Tables 2.1-3.2 show that, in OLS regressions, Winning Coalition size has large
and significant positive relationships with Civil Liberties and Political Rights across all models.
These results are consistent with those reported in BDM et al (2003). However, it is important to
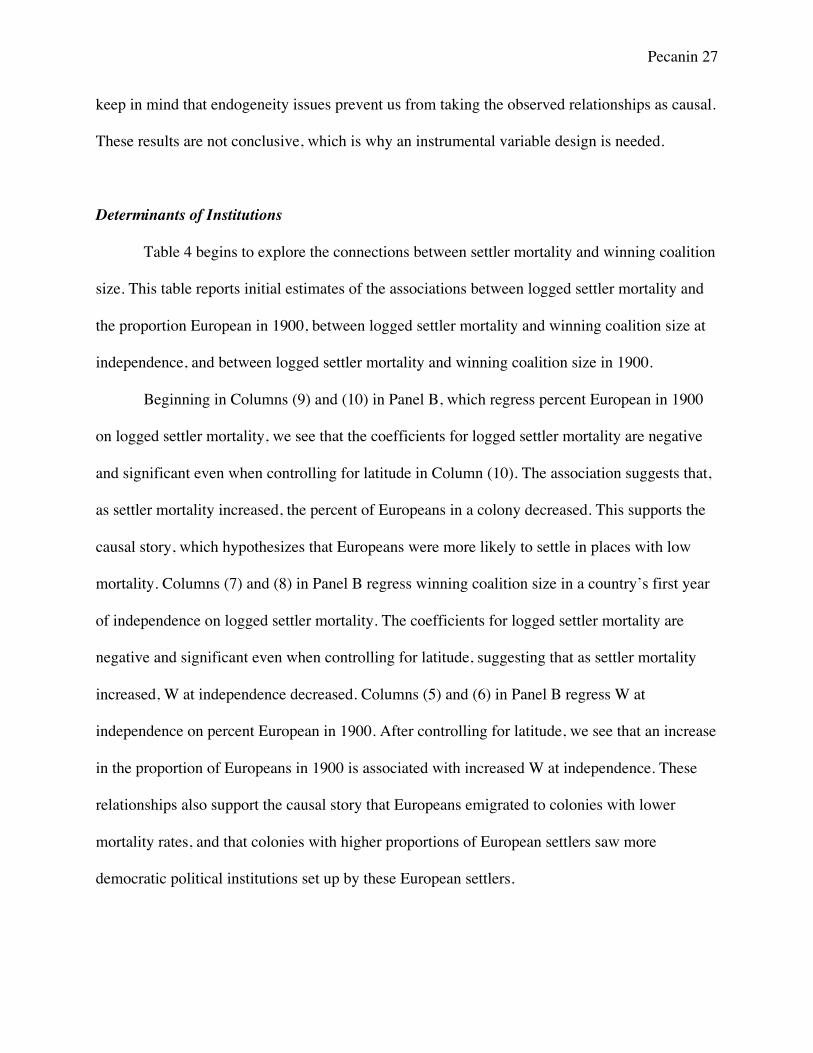
! Pecanin 27
keep in mind that endogeneity issues prevent us from taking the observed relationships as causal.
These results are not conclusive, which is why an instrumental variable design is needed.
Determinants of Institutions
Table 4 begins to explore the connections between settler mortality and winning coalition
size. This table reports initial estimates of the associations between logged settler mortality and
the proportion European in 1900, between logged settler mortality and winning coalition size at
independence, and between logged settler mortality and winning coalition size in 1900.
Beginning in Columns (9) and (10) in Panel B, which regress percent European in 1900
on logged settler mortality, we see that the coefficients for logged settler mortality are negative
and significant even when controlling for latitude in Column (10). The association suggests that,
as settler mortality increased, the percent of Europeans in a colony decreased. This supports the
causal story, which hypothesizes that Europeans were more likely to settle in places with low
mortality. Columns (7) and (8) in Panel B regress winning coalition size in a country’s first year
of independence on logged settler mortality. The coefficients for logged settler mortality are
negative and significant even when controlling for latitude, suggesting that as settler mortality
increased, W at independence decreased. Columns (5) and (6) in Panel B regress W at
independence on percent European in 1900. After controlling for latitude, we see that an increase
in the proportion of Europeans in 1900 is associated with increased W at independence. These
relationships also support the causal story that Europeans emigrated to colonies with lower
mortality rates, and that colonies with higher proportions of European settlers saw more
democratic political institutions set up by these European settlers.

! Pecanin 28
Columns (3) and (4) in Panel B regress W in 1900 on logged settler mortality. The
coefficients for logged settler mortality are again negative and significant even when controlling
for latitude, suggesting that an increase in logged settler mortality decreased W in 1900.
Columns (1) and (2) in Panel B regress W in 1900 on percent European in 1900. The coefficients
for percent European in 1900 are positive and significant even when controlling for latitude,
suggesting that an increase in the proportion of Europeans in a country led to a higher winning
coalition size in 1900. Results from these columns follow the causal story, which hypothesizes
that countries with lower mortality and consequently higher proportions of European settlers saw
the construction of more democratic institutions.
Columns (7) and (8) in Panel A regress winning coalition size in 2000-2006 on the log of
settler mortality. In both columns, the coefficients on logged settler mortality are negative and
significant, suggesting that increases in logged settler mortality are still associated with
decreased winning coalition size today. This negative relationship between log of settler
mortality and winning coalition size in 2000-2006 is depicted in Figure 2, without controls.
Columns (5) and (6) in Panel A speak to the effect of the proportion of Europeans in 1900 on
winning coalition size in 2000-2006. Results are positive and significant, which suggest that
increases in the proportion of Europeans in 1900 are still associated with increased winning
coalition size today. These associations suggest that the effects of variation in settler mortality on
political institutions still persist today.
Finally, Columns (3) and (4) in Panel A regress W between 2000-2006 on W at
independence, and Columns (1) and (2) in Panel A regress W between 2000-2006 on W in 1900.
While W at independence is not a good predictor of W between 2000 and 2006, W in 1900 is a
very good predictor of W between 2000 and 2006, even when controlling for latitude in Column

! Pecanin 29
(2). This relationship suggests that the causal story is correct in assuming that political
institutions set up in 1900 have influenced the institutions we see today.
Two-Stage Least Squares Regressions
Table 5.1 uses log of settler mortality as an instrument, winning coalition as the
endogenous independent variable, and Civil Liberties as the dependent variable. In Panel B,
Column (1), at the 99% confidence level, when log of settler mortality increases by one unit,
winning coalition is expected to decrease in size by .08 points. The log of settler mortality has an
F statistic of 10.04. The corresponding second stage results in Column (1), Panel A suggest that
at the 99% confidence level, a one unit increase in winning coalition size results in a 5.04 point
increase in Civil Liberties. However, the p value for the endogeneity test (.66) suggests that we
cannot reject the null that winning coalition size is exogenous to Civil Liberties, implying that
OLS results are preferable. Column (2) controls for latitude. The log of settler mortality has an F
statistic of 10.19. At the 99% confidence level, when log of settler mortality increases by one
unit, winning coalition is expected to decrease in size by .08 points. Second stage results in
Column (2), Panel A suggest that at the 99% confidence level, a one unit increase in winning
coalition size results in a 4.44 point increase in Civil Liberties. However, the p value in this
column also suggests that we cannot reject the exogeneity of winning coalition size, implying
that an OLS model is preferable.
Columns (3) and (4) exclude Neo-Europes in order to see if the significance exhibited in
Columns (1) and (2) are driven by the presence of America, Australia, Canada, and New Zealand.
In Column (3), Panel B, the log of settler mortality has an F statistic of 4.33 and, in Column (4),
Panel B, the log of settler mortality has an F statistic of 4.83. In the second stage, coefficients on

! Pecanin 30
winning coalition size are still significant and positive in both columns, suggesting that
significance is not being driven by the presence of the Neo-Europes. Second stage values,
however, are lower when excluding Neo-Europes, suggesting that the high values we see in
Columns (1) and (2) are driven by Neo-Europes. However, we again cannot reject the null that
winning coalition size is in fact exogenous to Civil Liberties.
Columns (5), (6), (7), and (8), which exclude Africa (Columns (5) and (6)) and control
for region (Columns (7) and (8)), report very low F statistics (.68 and below). This means that
logged settler mortality is not a good instrument for winning coalition size in these models. As a
result, we cannot interpret the second stage estimates for these models.
Table 5.2 replicates Table 5.1 but with Political Rights as the dependent variable. First
stage results in Table 5.2 are the same as in Table 5.1. In the second stage, Column (1), Panel A
shows that at the 99% confidence level, a one unit increase in winning coalition size results in a
6.74 point increase in Political Rights. Second stage results in Column (2), Panel A suggest that
at the 99% confidence level, a one unit increase in winning coalition size results in a 6.16 point
increase in Political Rights. Similar to Columns (3) and (4) in Table 5.1, the second stage
coefficients on winning coalition size remain significant and positive even when excluding Neo-
Europes. However, as in Table 5.1, p values are sufficiently high in the first four columns so that
we cannot reject the null that winning coalition size is exogenous, meaning that OLS models are
preferable. Finally, as with the first stage results for Columns (5), (6), (7), and (8) in Table 5.1,
the corresponding columns in Table 5.2 exhibit very low F statistics and the corresponding
second stage estimates cannot be interpreted.
Table 6.1 uses log of settler mortality as an instrument, winning coalition as the
endogenous independent variable, and Civil Liberties as the dependent variable with colonial

! Pecanin 31
dummies. In Panel B, Column (1), at the 90% confidence level, when log of settler mortality
increases by one unit, winning coalition is expected to decrease in size by .053 points. The log of
settler mortality has an F statistic of 3.05. The corresponding second stage results in Column (1),
Panel A suggest that at the 95% confidence level, a one unit increase in winning coalition size
results in a 5.08 point increase in Civil Liberties. However, the p value for the endogeneity test
(.80) suggests that we cannot reject the null that winning coalition size is exogenous to Civil
Liberties, implying that OLS results are preferable. Column (2) controls for latitude. The log of
settler mortality has an F statistic of 2.15. First and second stage results in Column (2) are not
significant.
Columns (3) and (4) look at British colonies only. In Panel B, Column (3), at the 95%
confidence level, when log of settler mortality increases by one unit, winning coalition is
expected to decrease in size by .086 points. The log of settler mortality has an F statistic of 4.94.
The corresponding second stage results in Column (3), Panel A suggest that at the 99%
confidence level, a one unit increase in winning coalition size results in a 4.55 point increase in
Civil Liberties. However, the endogeneity p value in this column (.732) also suggests that we
cannot reject the exogeneity of winning coalition size, implying that an OLS model is preferable.
In Panel B, Column (4), at the 90% confidence level, when log of settler mortality increases by
one unit, winning coalition is expected to decrease in size by .073 points. The log of settler
mortality has an F statistic of 3.31. The corresponding second stage results in Column (4) are not
significant, suggesting that once controlled for latitude, British colonies do not see an increase in
human rights when winning coalition increases.
Columns (5) and (6) control for French legal origin. In Panel B, Column (5), at the 99%
confidence level, when log of settler mortality increases by one unit, winning coalition is
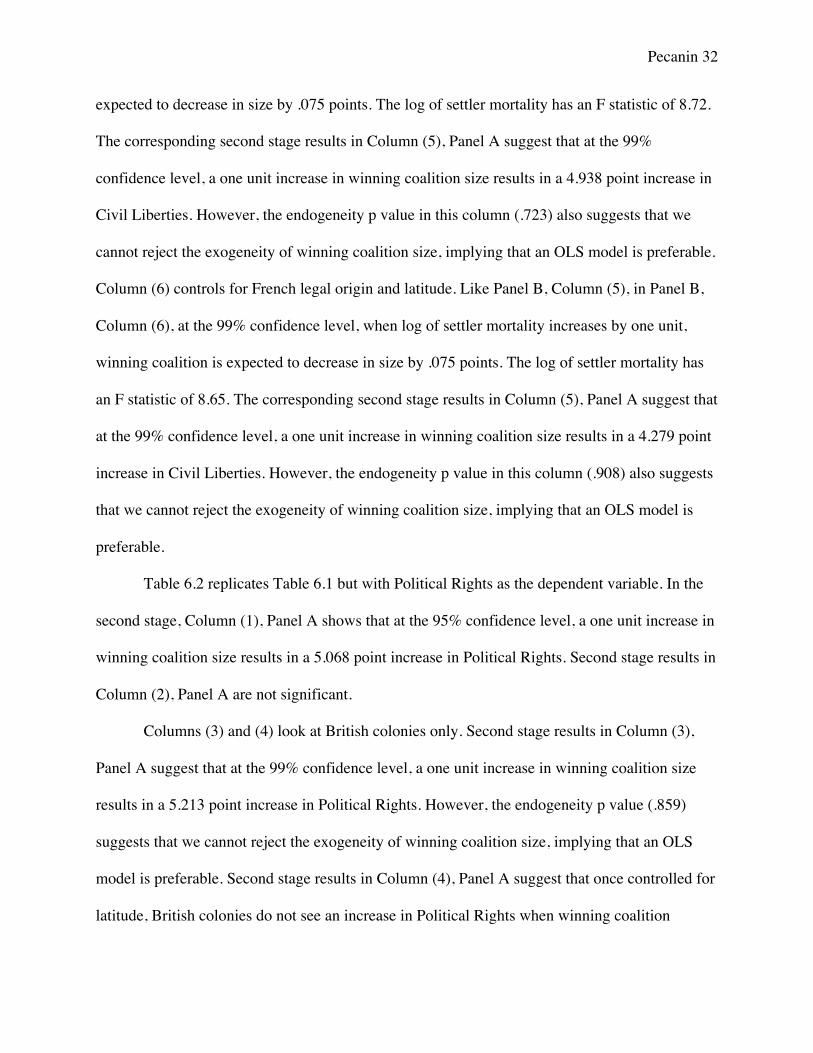
! Pecanin 32
expected to decrease in size by .075 points. The log of settler mortality has an F statistic of 8.72.
The corresponding second stage results in Column (5), Panel A suggest that at the 99%
confidence level, a one unit increase in winning coalition size results in a 4.938 point increase in
Civil Liberties. However, the endogeneity p value in this column (.723) also suggests that we
cannot reject the exogeneity of winning coalition size, implying that an OLS model is preferable.
Column (6) controls for French legal origin and latitude. Like Panel B, Column (5), in Panel B,
Column (6), at the 99% confidence level, when log of settler mortality increases by one unit,
winning coalition is expected to decrease in size by .075 points. The log of settler mortality has
an F statistic of 8.65. The corresponding second stage results in Column (5), Panel A suggest that
at the 99% confidence level, a one unit increase in winning coalition size results in a 4.279 point
increase in Civil Liberties. However, the endogeneity p value in this column (.908) also suggests
that we cannot reject the exogeneity of winning coalition size, implying that an OLS model is
preferable.
Table 6.2 replicates Table 6.1 but with Political Rights as the dependent variable. In the
second stage, Column (1), Panel A shows that at the 95% confidence level, a one unit increase in
winning coalition size results in a 5.068 point increase in Political Rights. Second stage results in
Column (2), Panel A are not significant.
Columns (3) and (4) look at British colonies only. Second stage results in Column (3),
Panel A suggest that at the 99% confidence level, a one unit increase in winning coalition size
results in a 5.213 point increase in Political Rights. However, the endogeneity p value (.859)
suggests that we cannot reject the exogeneity of winning coalition size, implying that an OLS
model is preferable. Second stage results in Column (4), Panel A suggest that once controlled for
latitude, British colonies do not see an increase in Political Rights when winning coalition
! Pecanin 33
increases. Columns (5) and (6) control for French legal origin. Second stage results in Column
(5), Panel A suggest that at the 99% confidence level, a one unit increase in winning coalition
size results in a 6.432 point increase in Political Rights. However, a high endogeneity p value
(.777) implies that the OLS model is preferable. Second stage results in Column (5), Panel A
suggest that at the 99% confidence level, a one unit increase in winning coalition size results in a
5.793 point increase in Political Rights. Again, the p value suggests that the OLS model is
preferable.
Overall, Tables 5.1, 5.2, 6.1, and 6.2 suggest that, where logged settler mortality is a good
predictor of winning coalition size today, increases in winning coalition size are very closely
associated with large increases in civil liberties and political rights in both OLS and 2SLS
models. The similarity between the OLS and 2SLS findings implies that we generally cannot
reject the null that winning coalition size is exogenous to both civil liberties and political rights,
and that the OLS results are therefore preferable.
These results are strongly supportive of the results reported in BDM et al (2003).
However, there are models wherein logged settler mortality is not a good predictor of winning
coalition size today. It is possible that the log of capped settler mortality will be a more
consistent exogenous predictor of winning coalition size.
Tables 7.1, 7.2, 8.1, and 8.2 use log of settler mortality capped at 250 deaths per 1000 as
the instrument. The relationship between log of capped settler mortality and winning coalition
size in 2000-2006 is depicted in Figure 3, which shows a negative relationship between the two
variables. This figure suggests than an increase in capped settler mortality has a negative impact
on W today.

! Pecanin 34
Table 7.1 uses log of capped settler mortality as an instrument, winning coalition as the
endogenous independent variable, and Civil Liberties as the dependent variable. In Panel B,
Column (1), at the 99% confidence level, when log of capped settler mortality increases by one
unit, winning coalition is expected to decrease in size by .136 points. The log of capped settler
mortality has an F statistic of 32.58. The corresponding second stage results in Column (1), Panel
A suggest that at the 99% confidence level, a one unit increase in winning coalition size results
in a 5.085 point increase in Civil Liberties. However, the p value for the endogeneity test (.528)
suggests that we cannot reject the null that winning coalition size is exogenous to Civil Liberties,
implying that OLS results are preferable. Column (2) controls for latitude. The log of capped
settler mortality has an F statistic of 36.18. At the 99% confidence level, when log of capped
settler mortality increases by one unit, winning coalition is expected to decrease in size by .139
points. Second stage results in Column (2), Panel A suggest that at the 99% confidence level, a
one unit increase in winning coalition size results in a 4.62 point increase in Civil Liberties.
However, the p value in this column (.861) also suggests that we cannot reject the exogeneity of
winning coalition size, implying that an OLS model is preferable.
Columns (3) and (4) exclude Neo-Europes. In Column (3), Panel B, the log of capped
settler mortality has an F statistic of 13.92 and, in Column (4), Panel B, the log of settler
mortality has an F statistic of 14.48. In the second stage, coefficients on winning coalition size
are still significant and positive in both columns, suggesting that significance is not being driven
by the presence of the Neo-Europes. Second stage values, however, are lower when excluding
Neo-Europes, suggesting that the high values we see in Columns (1) and (2) are driven by Neo-
Europes. Again, we cannot reject the null that winning coalition size is in fact exogenous to Civil
Liberties.

! Pecanin 35
Columns (5) and (6) exclude African countries. In Panel B, Column (5), at the 90%
confidence level, when log of capped settler mortality increases by one unit, winning coalition is
expected to decrease in size by .06 points. The log of capped settler mortality has an F statistic of
3.91. The corresponding second stage results in Column (5), Panel A suggest that at the 99%
confidence level, a one unit increase in winning coalition size results in a 9.061 point increase in
Civil Liberties. Column (6) controls for latitude. The log of capped settler mortality has an F
statistic of 3.48. At the 90% confidence level, when log of capped settler mortality increases by
one unit, winning coalition is expected to decrease in size by .05 points. Second stage results in
Column (6), Panel A suggest that at the 95% confidence level, a one unit increase in winning
coalition size results in a 6.1 point increase in Civil Liberties. However, the endogeneity p values
in these columns suggest that we cannot reject the exogeneity of winning coalition size, implying
that an OLS model is preferable. Second stage results for Columns (5) and (6) are significantly
higher than in Columns (1) and (2) which looks at the whole sample, suggesting that the low
results in Columns (1) and (2) are driven by African countries.
Columns (7) and (8) control for latitude and region. In Panel B, Column (7), at the 99%
confidence level, when log of capped settler mortality increases by one unit, winning coalition is
expected to decrease in size by .08 points. The log of capped settler mortality has an F statistic of
7.77. The corresponding second stage results in Column (7), Panel A suggest that at the 90%
confidence level, a one unit increase in winning coalition size results in a 3.917 point increase in
Civil Liberties when controlling for region. However, the p value for the endogeneity test (.877)
suggests that we cannot reject the null that winning coalition size is exogenous to Civil Liberties,
implying that OLS results are preferable. Column (7) controls for latitude in addition to region.
The log of capped settler mortality has an F statistic of 9.33. At the 99% confidence level, when

! Pecanin 36
log of settler mortality increases by one unit, winning coalition is expected to decrease in size
by .084 points. Second stage results in Column (6), Panel A are not significant.
Table 7.2 replicates Table 7.1 but with Political Rights as the dependent variable. First
stage results in Table 7.2 are the same as in Table 7.1. In the second stage, Column (1), Panel A
shows that at the 99% confidence level, a one unit increase in winning coalition size results in a
7.04 point increase in Political Rights. Second stage results in Column (2), Panel A suggest that
at the 99% confidence level, a one unit increase in winning coalition size results in a 6.62 point
increase in Political Rights. Similar to Columns (3), (4), (5), and (6) in Table 7.1, the second
stage coefficients on winning coalition size remain significant and positive even when excluding
Neo-Europes and African countries. Columns (7) and (8) control for region. In the second stage,
Column (7), Panel A shows that at the 95% confidence level, a one unit increase in winning
coalition size results in a 6.54 point increase in Political Rights. In the second stage, Column (8),
Panel A shows that at the 95% confidence level, a one unit increase in winning coalition size
results in a 6.02 point increase in Political Rights. However, as in Table 7.1, p values are
sufficiently high in the first four columns so that we cannot reject the null that winning coalition
size is exogenous, meaning that OLS models are preferable.
Table 8.1 uses log of capped settler mortality as an instrument, winning coalition as the
endogenous independent variable, and Civil Liberties as the dependent variable with colonial
dummies. In Panel B, Column (1), at the 99% confidence level, when log of capped settler
mortality increases by one unit, winning coalition is expected to decrease in size by .124 points.
The log of capped settler mortality has an F statistic of 16.61. The corresponding second stage
results in Column (1), Panel A suggest that at the 99% confidence level, a one unit increase in
winning coalition size results in a 4.903 point increase in Civil Liberties. However, the p value
! Pecanin 37
for the endogeneity test (.79) suggests that we cannot reject the null that winning coalition size is
exogenous to Civil Liberties, implying that OLS results are preferable. Column (2) controls for
latitude. The log of capped settler mortality has an F statistic of 17.40. At the 99% confidence
level, when log of capped settler mortality increases by one unit, winning coalition is expected to
decrease in size by .12 points. The corresponding second stage results in Column (2), Panel A
suggest that at the 99% confidence level, a one unit increase in winning coalition size results in a
4.201 point increase in Civil Liberties. However, the p value for the endogeneity test (.871)
suggests that we cannot reject the null that winning coalition size is exogenous to Civil Liberties,
implying that OLS results are preferable
Columns (3) and (4) look at British colonies only. In Panel B, Column (3), at the 99%
confidence level, when log of capped settler mortality increases by one unit, winning coalition is
expected to decrease in size by .15 points. The log of capped settler mortality has an F statistic of
16.42. The corresponding second stage results in Column (3), Panel A suggest that at the 99%
confidence level, a one unit increase in winning coalition size results in a 5.349 point increase in
Civil Liberties. In Panel B, Column (4), at the 99% confidence level, when log of capped settler
mortality increases by one unit, winning coalition is expected to decrease in size by .146 points.
The log of capped settler mortality has an F statistic of 14.19. The corresponding second stage
results in Column (4), Panel A suggest that at the 99% confidence level, a one unit increase in
winning coalition size results in a 4.115 point increase in Civil Liberties. However, the
endogeneity p value in Columns (3) and (4) suggests that we cannot reject the exogeneity of
winning coalition size, implying that an OLS model is preferable.
Columns (5) and (6) control for French legal origin. In Panel B, Column (5), at the 99%
confidence level, when log of capped settler mortality increases by one unit, winning coalition is

! Pecanin 38
expected to decrease in size by .14 points. The log of capped settler mortality has an F statistic of
27.05. The corresponding second stage results in Column (5), Panel A suggest that at the 99%
confidence level, a one unit increase in winning coalition size results in a 4.919 point increase in
Civil Liberties. Column (6) controls for French legal origin and latitude. In Panel B, Column (6),
at the 99% confidence level, when log of capped settler mortality increases by one unit, winning
coalition is expected to decrease in size by .15 points. The log of capped settler mortality has an
F statistic of 30.4. The corresponding second stage results in Column (5), Panel A suggest that at
the 99% confidence level, a one unit increase in winning coalition size results in a 4.388 point
increase in Civil Liberties. However, the endogeneity p value in Columns (5) and (6) suggests
that we cannot reject the exogeneity of winning coalition size, implying that an OLS model is
preferable.
Table 8.2 replicates Table 8.1 but with Political Rights as the dependent variable. In the
second stage, Column (1), Panel A shows that at the 99% confidence level, a one unit increase in
winning coalition size results in a 5.815 point increase in Political Rights. In the second stage,
Column (2), Panel A shows that at the 99% confidence level, a one unit increase in winning
coalition size results in a 4.934 point increase in Political Rights. Like Columns (1) and (2) in
Table 8.1, endogeneity p values suggest that we cannot reject the exogeneity of winning coalition
size, implying that an OLS model is preferable.
Columns (3) and (4) look at British colonies only. Second stage results in Column (3),
Panel A suggest that at the 99% confidence level, a one unit increase in winning coalition size
results in a 6.352 point increase in Political Rights. Second stage results in Column (4), Panel A
suggest that at the 99% confidence level, a one unit increase in winning coalition size results in a
4.969 point increase in Political Rights. Columns (5) and (6) control for French legal origin.

! Pecanin 39
Second stage results in Column (5), Panel A suggest that at the 99% confidence level, a one unit
increase in winning coalition size results in a 6.593 point increase in Political Rights. Second
stage results in Column (5), Panel A suggest that at the 99% confidence level, a one unit increase
in winning coalition size results in a 6.09 point increase in Political Rights. Like Table 8.1,
endogeneity p values suggest that we cannot reject the exogeneity of winning coalition size,
implying that an OLS model is preferable.
Overall, Tables 7.1, 7.2, 8.1, and 8.2, suggest that the log of capped settler mortality is a
very good instrument for winning coalition size between 2000 and 2006. Second stage results
suggest that winning coalition does indeed have a large positive effect on human rights. However,
the observed high p values imply that we generally cannot reject the null that winning coalition
size is exogenous to both civil liberties and political rights, and that the OLS results are therefore
preferable.
To further test for robustness, Tables 9.1, 9.2, 10.1, and 10.2 use European settlement
percentages in 1900 as the instrument, winning coalition size in 2000-2006 as the endogenous
independent variable, and Civil Liberties or Political Rights as the dependent variable. The
relationship between European settlement and winning coalition size in 2000-2006 is depicted in
Figure 4. This figure displays a positive relationship between the proportions of European
settlers and winning coalition, suggesting that an increase in the proportion of European settlers
in 1900 leads to increased W size.
Table 9.1 uses the proportion of European settlement in a colony in 1900 as an instrument,
winning coalition as the endogenous independent variable, and Civil Liberties as the dependent
variable. In Panel B, Column (1), at the 99% confidence level, when proportion European in
1900 increases by one unit, winning coalition is expected to increase in size by .531 points. The

! Pecanin 40
proportion European in 1900 has an F statistic of 68.38. The corresponding second stage results
in Column (1), Panel A suggest that at the 99% confidence level, a one unit increase in winning
coalition size results in a 7.315 point increase in Civil Liberties. The p value for the endogeneity
test (0.00) suggests that we can reject the null that winning coalition size is exogenous to Civil
Liberties, implying that the Two-Stage Least Squares is preferred of the OLS model. Column (2)
controls for latitude. Proportion European in 1900 has an F statistic of 65.47. At the 99%
confidence level, when proportion European in 1900 increases by one unit, winning coalition is
expected to increase in size by .643 points. Second stage results in Column (2), Panel A suggest
that at the 99% confidence level, a one unit increase in winning coalition size results in a 6.787
point increase in Civil Liberties. Like in Column (1), the endogeneity p value (0.00) suggests that
we can reject the null that winning coalition and Civil Liberties are exogenous, suggesting that
the Two-Stage Least Squares model is preferable.
Columns (3) and (4) exclude Neo-Europes. In Column (3), Panel B, the proportion
European in 1900 has an F statistic of 25.19 and, in Column (4), Panel B, the proportion
European in 1900 has an F statistic of 34.27. In the second stage, coefficients on winning
coalition size are still significant and positive in both columns, suggesting that significance is not
being driven by the presence of the Neo-Europes. Again, we can reject the null that winning
coalition size is in fact exogenous to Civil Liberties.
Columns (5) and (6) exclude African countries. In Panel B, Column (5), at the 99%
confidence level, when proportion European in 1900 increases by one unit, winning coalition is
expected to increase in size by .341 points. The proportion European in 1900 has an F statistic of
33.90. The corresponding second stage results in Column (5), Panel A suggest that at the 99%
confidence level, a one unit increase in winning coalition size results in a 9.424 point increase in
! Pecanin 41
Civil Liberties. The p value for the endogeneity test (0.01) suggests that we can reject the null
that winning coalition size is exogenous to Civil Liberties, implying that Two-Stage Least
Squares results are preferable. Column (6) controls for latitude. The proportion European in 1900
has an F statistic of 11.39. At the 99% confidence level, when proportion European in 1900
increases by one unit, winning coalition is expected to increase in size by .536 points. Second
stage results in Column (6), Panel A suggest that at the 99% confidence level, a one unit increase
in winning coalition size results in a 7.058 point increase in Civil Liberties. The p value in this
column (.12) suggests that we can plausibly reject the exogeneity of winning coalition size and
Civil Liberties.
Columns (7) and (8) control for latitude and region. In Panel B, Column (7), at the 99%
confidence level, proportion European in 1900 increases by one unit, winning coalition is
expected to increase in size by .272 points. The proportion European in 1900 has an F statistic of
18.9. The corresponding second stage results in Column (7), Panel A suggest that at the 99%
confidence level, a one unit increase in winning coalition size results in a 10.25 point increase in
Civil Liberties when controlling for region. Column (7) controls for latitude in addition to region.
The proportion European in 1900 has an F statistic of 16.11. At the 99% confidence level, when
proportion European in 1900 increases by one unit, winning coalition is expected to increase in
size by .383 points. Second stage results in Column (6), Panel A suggest that at the 99%
confidence level, a one unit increase in winning coalition size results in a 8.578 point increase in
Civil Liberties. P values in Columns (7) and (8) suggest that we can reject the exogeneity of
winning coalition size, implying that a Two-Stage Least Squares model is preferable.
Table 9.2 replicates Table 9.1 but with Political Rights as the dependent variable. First
stage results in Table 9.2 are the same as in Table 9.1. In the second stage, Column (1), Panel A

! Pecanin 42
shows that at the 99% confidence level, a one unit increase in winning coalition size results in a
8.19 point increase in Political Rights. Second stage results in Column (2), Panel A suggest that
at the 99% confidence level, a one unit increase in winning coalition size results in a 7.61 point
increase in Political Rights. Similar to Columns (3), (4), (5), and (6) in Table 9.1, the second
stage coefficients on winning coalition size remain significant and positive even when excluding
Neo-Europes and African countries. P values for Columns (3), (4), and (5) suggest that Two-
Stage Least Squares models are preferred. The endogeneity p value for Column (6) (.62),
however, suggests that we cannot reject the exogeneity of winning coalition. Similar to Columns
(7) and (8) in Table 9.1, the second stage coefficients on winning coalition remain significant
and positive when controlling for region and latitude. The endogeneity p value in Column (7)
(.11) suggests that we could we could reject the null that winning coalition size is exogenous,
meaning that Two-Stage Least Squares results are preferable. The p value for Column (8), on the
other hand, is high enough where we cannot reject the null that winning coalition size is
exogenous, meaning that OLS models are preferable.
Table 10.1 uses European settlement in 1900 as the instrument, winning coalition as the
endogenous independent variable, and Civil Liberties as the dependent variable with colonial
dummies. In Panel B, Column (1), at the 99% confidence level, when proportion European in
1900 increases by one unit, winning coalition is expected to increase in size by .443 points. The
proportion European in 1900 has an F statistic of 41.16. The corresponding second stage results
in Column (1), Panel A suggest that at the 99% confidence level, a one unit increase in winning
coalition size results in a 8.217 point increase in Civil Liberties. The p value for the endogeneity
test (0.00) suggests that we can reject the null that winning coalition size is exogenous to Civil
Liberties, implying that Two-Stage Least Squares results are preferable. Column (2) controls for

! Pecanin 43
latitude. Proportion European in 1900 has an F statistic of 28.19. At the 99% confidence level,
when proportion of European increases by one unit, winning coalition is expected to increase in
size by .516 points. The corresponding second stage results in Column (2), Panel A suggest that
at the 99% confidence level, a one unit increase in winning coalition size results in a 8.035 point
increase in Civil Liberties. The p value for the endogeneity test (0.00) suggests that we can reject
the null that winning coalition size is exogenous to Civil Liberties, implying that Two-Stage
Least Squares results are preferable
Columns (3) and (4) look at British colonies only. In Panel B, Column (3), at the 99%
confidence level, when proportion European in 1900 increases by one unit, winning coalition is
expected to increase in size by .425 points. The proportion of European has an F statistic of
31.82. The corresponding second stage results in Column (3), Panel A suggest that at the 99%
confidence level, a one unit increase in winning coalition size results in a 7.3 point increase in
Civil Liberties. In Panel B, Column (4), at the 99% confidence level, when proportion European
in 1900 increases by one unit, winning coalition is expected to increase in size by .425 points.
The proportion of European in 1900 has an F statistic of 10.42. The corresponding second stage
results in Column (4), Panel A suggest that at the 99% confidence level, a one unit increase in
winning coalition size results in a 6.535 point increase in Civil Liberties. Endogeneity p values
suggest that we can reject the null that winning coalition size is exogenous to Civil Liberties,
implying that Two-Stage Least Squares results are preferable
Columns (5) and (6) control for French legal origin. In Panel B, Column (5), at the 99%
confidence level, when proportion European in 1900 increases by one unit, winning coalition is
expected to increase in size by .518 points. The proportion European in 1900 has an F statistic of
53.09. The corresponding second stage results in Column (5), Panel A suggest that at the 99%

! Pecanin 44
confidence level, a one unit increase in winning coalition size results in a 7.372 point increase in
Civil Liberties. Column (6) controls for French legal origin and latitude. In Panel B, Column (6),
at the 99% confidence level, when proportion European in 1900 increases by one unit, winning
coalition is expected to increase in size by .630 points. The proportion European in 1900 has an
F statistic of 51.93. The corresponding second stage results in Column (5), Panel A suggests that
at the 99% confidence level, a one unit increase in winning coalition size results in a 6.82 point
increase in Civil Liberties. The endogeneity p values suggest that we can reject the exogeneity of
winning coalition size, implying that a Two-Stage Least Squares model is preferable.
Table 10.2 replicates Table 10.1 but with Political Rights as the dependent variable. In
the second stage, Column (1), Panel A shows that at the 99% confidence level, a one unit
increase in winning coalition size results in a 8.12 point increase in Political Rights. In the
second stage, Column (2), Panel A shows that at the 99% confidence level, a one unit increase in
winning coalition size results in a 7.34 point increase in Political Rights. Like Columns (1) and
(2) in Table 10.1, endogeneity p values suggest that we can reject the exogeneity of winning
coalition size.
Columns (3) and (4) look at British colonies only. Second stage results in Column (3),
Panel A suggest that at the 99% confidence level, a one unit increase in winning coalition size
results in a 7.098 point increase in Political Rights. Second stage results in Column (4), Panel A
suggest that at the 99% confidence level, a one unit increase in winning coalition size results in a
5.24 point increase in Political Rights. Columns (5) and (6) control for French legal origin.
Second stage results in Column (5), Panel A suggest that at the 99% confidence level, a one unit
increase in winning coalition size results in a 8.088 point increase in Political Rights. Second
stage results in Column (5), Panel A suggest that at the 99% confidence level, a one unit increase

! Pecanin 45
in winning coalition size results in a 7.474 point increase in Political Rights. Except for Column
(4), endogeneity p values suggest that we can reject the exogeneity of winning coalition size,
implying that a Two-Stage Least Squares model is preferable.
Conclusion
Many studies of political institutions suggest that as countries adopt more democratic
institutions, human rights abuses decrease and human rights protections increase (Poe and Tate
1994; Fein 1995; Davenport and Armstrong 2004; Bueno de Mesquita et al. 2005). Results from
Bueno de Mesquita et al. (2003) suggest that winning coalition size could be the driving factor
behind human rights protections. As winning coalition size increases, leaders offer more public
goods, including in the form of human rights protections.
However, existing results may be misleading due to the possible endogeneity of political
institutions. Existing studies are unable to establish causality because political institutions are not
randomly assigned across countries. Preferences of leaders, policymakers, and citizens are only a
few factors that may have a large influence on both the adoption of political institutions and the
presence of human rights protections. Failure to address the endogeneity of political institutions,
then, calls into question the validity of the causal relationship between political institutions and
human rights.
This thesis has set out to investigate whether results in Bueno de Mesquita et al. (2003)
survive strategies that address the possible endogeneity of political institutions. In particular, I
used an instrumental variable design modeled on that used in Acemoglu et al. (2001). The first
stage involves regressing the endogenous variable (winning coalition size) on the exogenous
instrumental variables used in Acemoglu et al. (2001, 2012) (early European settler mortality
! Pecanin 46
rates and capped mortality rates). The second stage takes the predicted values for winning
coalition size and regresses human rights measurements on them.
The log of capped settler mortality proved to be a better predictor of winning coalition
size than log of settler mortality. Second stage results were positive and significant, confirming
the relationship found in Bueno de Mesquita et al (2003). However, high p values meant that we
could not reject the null that winning coalition is exogenous, suggesting that OLS results might
be preferable.
Results from using percent European in 1900 as an instrument for winning coalition size
between 2000 and 2006 further confirmed the robustness of the results reported in Bueno de
Mesquita et al. (2003), suggesting that increasing winning coalition size does indeed increase
human rights protections.
Overall, the findings reported here suggest that more democratic political institutions do
in fact have a causal relationship with increased protections for human rights. These findings
underscore the importance of aiding countries to attain democratic status. By aiding developing
democracies through the creation of institutions that hinge on popular support, we can hold
leaders more accountable and promote human rights internationally.
The construction of the winning coalition variable clues us into ways in which we can
make political institutions more democratic. Winning coalition is constructed using the type of
regime (military/nonmilitary), the openness of elections for the executive, how the executive is
chosen, and the level of party competition. It follows that if we can change nations from military
to nonmilitary, we can increase winning coalition size and a positive effect would be human
rights promotion. Similarly, making elections more open, allowing for the executive to be chosen

! Pecanin 47
by popular support (not hereditarily), or increasing the level of party competition could feasibly
increase winning coalition size and result in more human rights promotions.

! Pecanin 48
Works Cited
Acemoglu, Daron, Simon Johnson, and James A. Robinson. 2001. “The Colonial Origins of Comparative Development: An Empirical Investigation.” No. w7771. National Bureau of Economic Research.
Acemoglu, Daron, Simon Johnson, and James A. Robinson. 2012. “The Colonial Origins of Comparative Development: An Empirical Investigation: Reply.” American Economic Review.
Albouy, David (2004a) “The Colonial Origins of Comparative Development: A Reinvestigation of the Data”, University of California-Berkeley, July.
Albouy, David (2004b) “The Colonial Origins of Comparative Development: A Reexamination Based on Improved Settler Mortality Data,” University of California-Berkeley, December.
Albouy, David (2006) “The Colonial Origins of Comparative Development: An Investigation of the Settler Mortality Data,” unpublished paper, University of California-Berkeley.
Albouy, David Y. "The Colonial Origins of Comparative Development: An Empirical Investigation: Comment." The American Economic Review 102.6 (2012): 3059-3076.
Bueno De Mesquita, Bruce, and Alastair Smith. 2009. "Political Survival and Endogenous Institutional Change." Comparative Political Studies 42.2: 167-197.
Bueno de Mesquita, Bruce, George R. Downs, Alastair Smith, and Feryal Marie Cherif. 2005. “Thinking inside the Box: A Closer Look at Democracy and Human Rights.” International Studies Quarterly 49 (3): 439-58.
Bueno de Mesquita, Bruce, Alastair Smith, Randolph M. Siverson, and James D. Morrow. 2003. The Logic of Political Survival. Cambridge, MA: MIT Press.
Coplin, William D.; O'Leary, Michael K. and Sealy, Tom. A Business Guide to Political Risk for International Decisions, 2nd Ed. New York: Political Risk Services, 1991.
Davenport, Christian, and David A. Armstrong, II. 2004. “Democracy and the Violation of Human Rights: A Statistical Analysis from 1976 to 1996.” American Journal of Political Science 48 (3): 538-54.
Fein, Helen. 1995. ‘‘More Murder in the Middle: Life-Integrity Violations and Democracy in the World, 1987.’’ Human Rights Quarterly 17 (1): 170–92.
Gastil, Raymond D. "The Comparative Study of Freedom." Freedom at Issue 82 (1985).
Hall, Robert E. and Charles I. Jones."Why Do Some Countries Produce So Much More Out-put Per Worker Than Others?" Quarterly Journal of Economics, February 1999, 114(1), pp. 83-116.

! Pecanin 49
La Porta, Rafael, Florencio Lopez-de-Silanes, Andrei Shleifer, and Robert W. Vishny. "Law and Finance." Journal of Political Economy, December 1998, 106(6), pp. 1113-55.
Landes, David S. The Wealth and Poverty of Nations: Why Some Are So Rich and Some So Poor. New York: W.W. Norton& Co., 1998.
North, Douglass C., William Summerhill, and Barry Weingast. "Order, Disorder and Economic Change: Latin America vs. North America. "Unpublished manuscript, Hoover Institution, Stanford University, 1998.
Poe, Steven C., and C. Neal Tate. 1994. "Repression of human rights to personal integrity in the 1980s: a global analysis." American Political Science Review 88.04: 853-872.
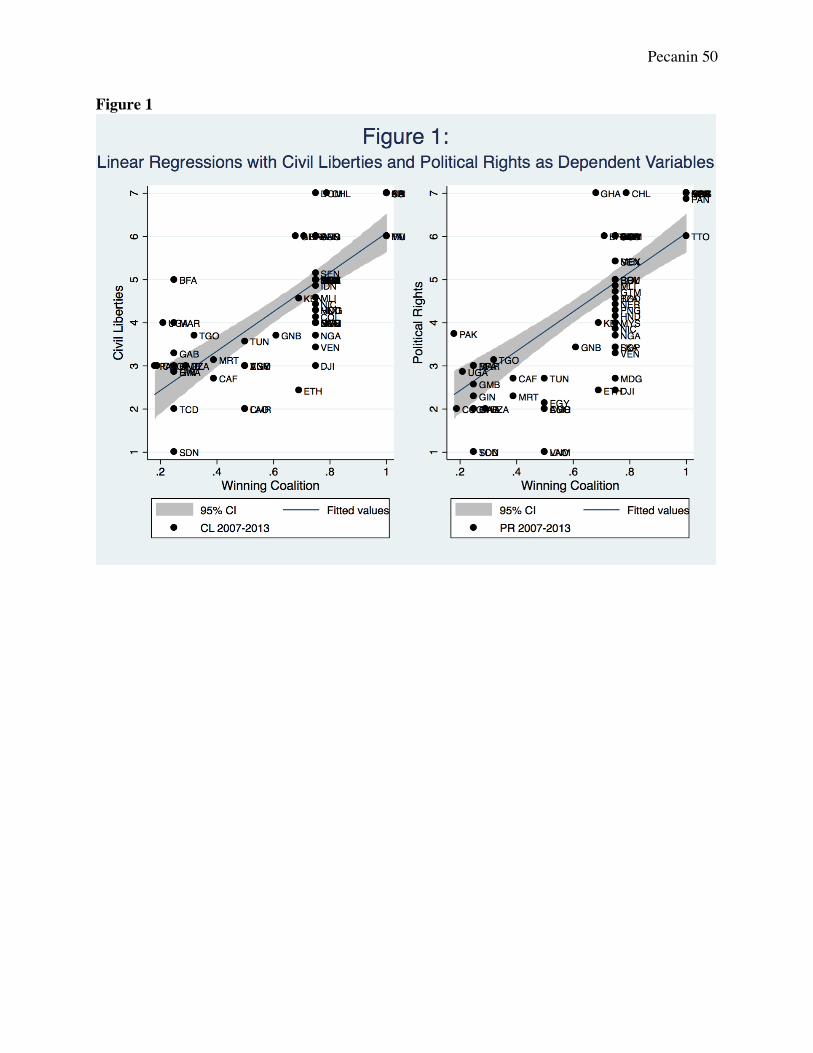
! Pecanin 50
Figure 1

! Pecanin 51
Figure 2
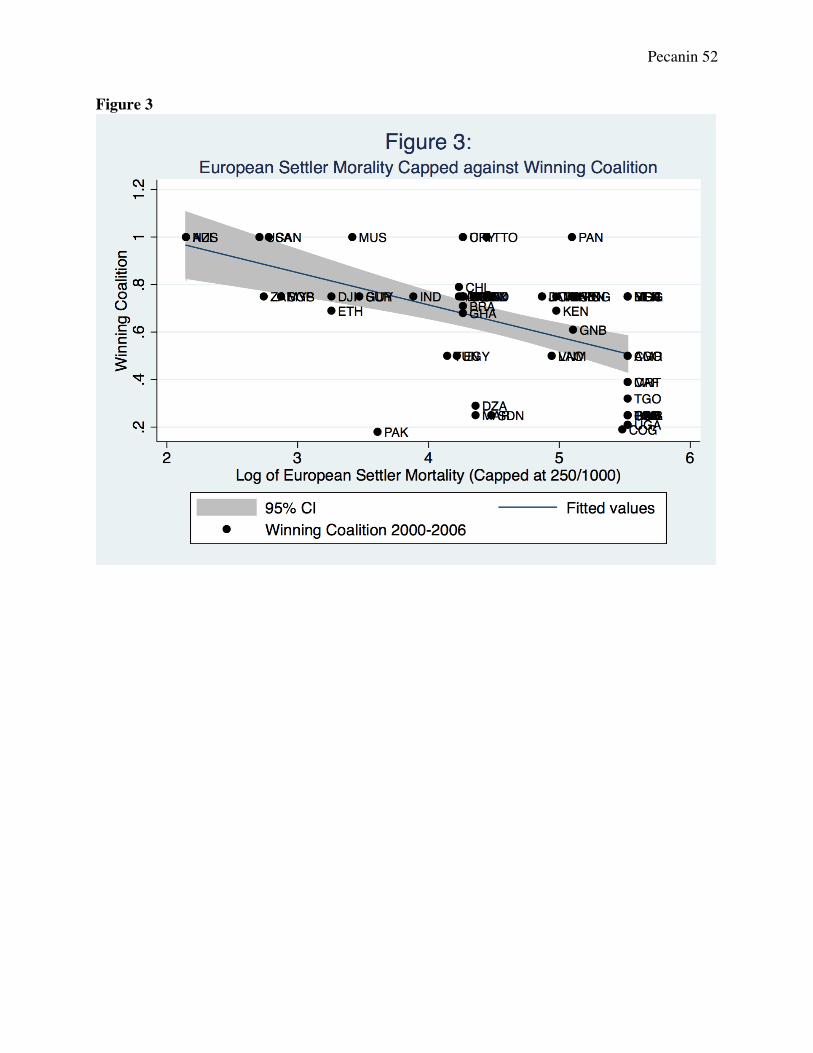
! Pecanin 52
Figure 3

! Pecanin 53
Figure 4

! Pecanin 54
Table 1
VARIABLES Observations Mean Standard
Deviation Min Max
Winning Coalition 2000-2006 67 0.65 0.24 0.18 1 Civil Liberties 2007-2013 67 4.47 1.48 1 7 Political Rights 2007-2013 67 4.29 1.86 1 7 Log of Settler Mortality 67 4.69 1.20 2.15 7.99 Log of Settler Mortality Capped 67 4.49 .92 2.15 5.52 Absolute Latitude 67 0.18 0.15 0.01 0.78 European Settlements in 1900 67 .15 .25 0 1 W in Independence 67 .57 .24 0 1 W in 1900 67 .15 .28 0 1
Dummy Variables Asia 67 0 1 Africa 67 0 1 Other 67 0 1 Neo-Europe 67 0 1 British Colony 67 0 1 French Colony 67 0 1 French Legal Origin 67 0 1

! Pecanin 55
Table 2.1: OLS Regression of Winning Coalition and Civil Liberties
(1) (2) (3) (4) (5) (6) (7) (8) Base
Sample Base
Sample Excluding
Neo-Europe
Excluding Neo-
Europe
Excluding Africa
Excluding Africa
Base Sample
Base Sample
Winning Coalition 4.562*** 4.471*** 4.148*** 4.184*** 6.240*** 5.730*** 3.599*** 3.597*** (0.500) (0.504) (0.529) (0.545) (1.196) (0.921) (0.629) (0.626) Latitude 1.375 0.757 2.634*** 0.910 (0.861) (1.023) (0.866) (0.804) Africa -0.687** -0.663* (0.339) (0.333) Asia -1.029*** -0.977*** (0.306) (0.311) Other 0.801*** 0.640** (0.219) (0.245) Constant 1.519*** 1.324*** 1.720*** 1.570*** 0.301 0.185 2.600*** 2.420*** (0.362) (0.388) (0.365) (0.444) (0.997) (0.727) (0.563) (0.579) Observations 67 67 63 63 35 35 67 67 R-squared 0.554 0.572 0.487 0.492 0.580 0.657 0.619 0.626
Robust standard errors in parentheses *** p<0.01, ** p<0.05, * p<0.1

! Pecanin 56
Table 2.2: OLS Regression of Winning Coalition and Political Rights
(1) (2) (3) (4) (5) (6) (7) (8) Base
Sample Base
Sample Excluding
Neo-Europe
Excluding Neo-
Europe
Excluding Africa
Excluding Africa
Base Sample
Base Sample
Winning Coalition 6.114*** 6.026*** 5.864*** 5.920*** 6.750*** 6.279*** 4.978*** 4.976*** (0.494) (0.501) (0.547) (0.539) (1.992) (1.860) (0.832) (0.816) Latitude 1.339* 1.163 2.434* 0.952 (0.765) (0.964) (1.242) (0.715) Africa -0.901** -0.876** (0.430) (0.423) Asia -1.106** -1.052** (0.489) (0.496) Other 0.371 0.203 (0.223) (0.211) Constant 0.331 0.141 0.452 0.223 -0.0200 -0.127 1.651** 1.462** (0.367) (0.359) (0.377) (0.401) (1.673) (1.437) (0.717) (0.682) Observations 67 67 63 63 35 35 67 67 R-squared 0.630 0.641 0.579 0.586 0.497 0.544 0.677 0.682
Robust standard errors in parentheses *** p<0.01, ** p<0.05, * p<0.1

! Pecanin 57
Table 3.1: OLS Regression of Winning Coalition and Civil Liberties with Colony Controls
(1) (2) (3) (4) (5) (6) Base
Sample Base
Sample British
Colonies Only
British Colonies
Only
Base Sample
Base Sample
Winning Coalition 4.586*** 4.427*** 4.955*** 4.535*** 4.514*** 4.424*** (0.596) (0.610) (0.856) (0.879) (0.519) (0.529) Latitude 1.286 1.977** 1.374 (0.891) (0.796) (0.851) British Colony 0.300 0.198 (0.274) (0.278) French Colony 0.154 0.0232 (0.363) (0.378) French Legal Origin -0.147 -0.145 (0.257) (0.250) Constant 1.352*** 1.294*** 1.391* 1.269 1.649*** 1.453*** (0.483) (0.485) (0.703) (0.751) (0.444) (0.475) Observations 67 67 23 23 67 67 R-squared 0.561 0.576 0.692 0.733 0.556 0.574
Robust standard errors in parentheses *** p<0.01, ** p<0.05, * p<0.1

! Pecanin 58
Table 3.2: OLS Regression of Winning Coalition and Political Rights with Colony Controls
(1) (2) (3) (4) (5) (6) Base
Sample Base
Sample British
Colonies Only
British Colonies
Only
Base Sample
Base Sample
Winning Coalition 5.675*** 5.485*** 5.548*** 5.034*** 5.998*** 5.911*** (0.597) (0.622) (0.869) (0.944) (0.509) (0.517) Latitude 1.535* 2.422* 1.336* (0.800) (1.314) (0.757) British Colony 0.320 0.198 (0.319) (0.326) French Colony -0.384 -0.540 (0.398) (0.425) French Legal Origin -0.352 -0.351 (0.309) (0.301) Constant 0.626 0.557 1.036 0.886 0.642 0.452 (0.500) (0.485) (0.738) (0.693) (0.481) (0.477) Observations 67 67 23 23 67 67 R-squared 0.651 0.664 0.634 0.678 0.638 0.649
Robust standard errors in parentheses *** p<0.01, ** p<0.05, * p<0.1

! Pecanin 59
Table 4: Determinants of Institutions
(1) (2) (3) (4) (5) (6) (7) (8) (9) (10)
Panel A Dependent Variable is Winning Coalition 2000-2006
W in 1900 0.348*** 0.345***
(0.061) (0.067)
W at 0.184 0.193
Independence (0.116) (0.120)
European 0.531*** 0.643***
Settlements in 1900 (0.064) (0.079)
Log of Settler -0.078*** -0.079***
Mortality (0.025) (0.025)
Latitude 0.028 0.205 -0.381** -0.01
(0.203) (0.221) (0.154) (0.177)
Constant 0.597*** 0.592*** 0.542*** 0.499*** 0.570*** 0.625*** 1.018*** 1.021***
(0.034) (0.045) (0.071) (0.087) (0.031) (0.039) (0.111) (0.114)
Observations 67 67 67 67 67 67 67 67
R-squared 0.158 0.158 0.035 0.050 0.305 0.344 0.158 0.158
F-Statistic 32.37 16.21 2.54 1.62 68.38 37.14 10.04 5.11
Dependent Variable is W in 1900
Dependent Variable is W at Independence
Dependent Variable is European Settlements
in 1900 Panel B
European 0.611*** 0.648*** 0.163 0.268*
Settlements in 1900 (0.202) (0.224) (0.117) (0.143)
Log of Settler -0.066** -0.055** -0.047* -0.056* -0.103*** -0.08***
Mortality (0.026) (0.023) (0.026) (0.029) (0.032) (0.027)
Latitude -0.124 0.310 -0.358 -0.260 0.681**
(0.157) (0.259) (0.269) (0.233) (0.301)
Constant 0.057** 0.074** 0.455*** 0.347** 0.551*** 0.602*** 0.798*** 0.888*** 0.633*** 0.397**
(0.024) (0.037) (0.146) (0.142) (0.035) (0.048) (0.120) (0.153) (0.169) (0.155)
Observations 67 67 67 67 67 67 67 67 67 67
R-squared 0.311 0.314 0.084 0.109 0.028 0.061 0.055 0.077 0.253 0.396
F-Statistic 9.16 4.40 6.43 3.64 1.93 1.76 3.31 2.02 10.5 9.4
Robust standard errors in parentheses *** p<0.01, ** p<0.05, * p<0.1

! Pecanin 60
Table 5.1: 2SLS Log of Settler Mortality Dependent Variable: Civil Liberties
(1) (2) (3) (4) (5) (6) (7) (8) Base
Sample Base
Sample Excluding
Neo-Europe
Excluding Neo-
Europe
Excluding Africa
Excluding Africa
Base Sample
Base Sample
Panel A: Two-Stage Least Squares Winning Coalition 5.044*** 4.439*** 3.373* 3.257* 11.80 7.448 2.764 1.401 (1.225) (1.266) (1.863) (1.779) (7.246) (7.312) (5.339) (5.437) Latitude 1.381 0.608 2.205 0.919 (0.921) (1.070) (2.206) (0.911) Asia -1.172 -1.355 (0.928) (0.935) Africa -0.945 -1.341 (1.722) (1.753) Other 0.955 1.044 (1.011) (1.035) Constant 1.207 1.344* 2.204* 2.175* -4.018 -1.065 3.281 4.208 (0.795) (0.762) (1.144) (1.146) (5.618) (5.311) (4.351) (4.430)
Panel B: First Stage for Winning Coalition in 2000-2006 Log of Settler -0.078*** -0.079*** -0.057** -0.059** -0.031 -0.019 -0.023 -0.024 Mortality (0.025) (0.025) (0.027) (0.027) (0.038) (0.035) (0.029) (0.03) Latitude -0.01 -0.209 0.204 -0.038 (0.177) (0.191) (0.165) (0.149) Asia -0.175*** -0.177** (0.065) (0.068) Africa -0.285*** -0.284*** (0.058) (0.058) Other 0.135** 0.139* (0.066) (0.07) Constant 1.018*** 1.021*** 0.901*** 0.947*** 0.906*** 0.814*** 0.914*** 0.927*** (0.111) (0.114) (0.127) (0.116) (0.160) (0.143) (0.127) (0.135) Observations 67 67 63 63 35 35 67 67 P-Value Endogeneity Test
0.661 0.977 0.667 0.588 0.190 0.795 0.871 0.657
F-Statistic First Stage
10.04 10.19 4.33 4.83 .68 .28 .61 .67
Robust standard errors in parentheses *** p<0.01, ** p<0.05, * p<0.1

! Pecanin 61
Table 5.2: 2SLS Log of Settler Mortality Dependent Variable: Political Rights
(1) (2) (3) (4) (5) (6) (7) (8)
Base Sample
Base Sample
Excluding Neo-
Europe
Excluding Neo-
Europe
Excluding Africa
Excluding Africa
Base Sample
Base Sample
Panel A: Two-Stage Least Squares Winning Coalition 6.737*** 6.161*** 5.988** 5.771** 13.94 11.91 4.643 3.220 (1.443) (1.478) (2.450) (2.291) (9.905) (13.77) (6.403) (6.345) Latitude 1.315* 1.139 1.027 0.959 (0.788) (1.028) (3.604) (0.700) Asia -1.164 -1.354 (1.167) (1.101) Africa -1.004 -1.418 (2.037) (2.022) Other 0.433 0.526 (1.186) (1.203) Constant -0.072 0.058 0.374 0.320 -5.602 -4.227 1.924 2.892 (0.944) (0.915) (1.516) (1.497) (7.628) (10.06) (5.231) (5.200)
Panel B: First Stage for Winning Coalition in 2000-2006 Log of Settler -0.078*** -0.079*** -0.057** -0.059** -0.031 -0.019 -0.023 -0.024 Mortality (0.025) (0.025) (0.027) (0.027) (0.038) (0.035) (0.029) (0.03) Latitude -0.01 -0.209 0.204 -0.038 (0.177) (0.191) (0.165) (0.149) Asia -0.175*** -0.177** (0.065) (0.068) Africa -0.285*** -0.284*** (0.058) (0.058) Other 0.135** 0.139* (0.066) (0.070) Constant 1.018*** 1.021*** 0.901*** 0.947*** 0.906*** 0.814*** 0.914*** 0.927*** (0.111) (0.114) (0.127) (0.116) (0.160) (0.143) (0.127) (0.135) Observations 67 67 63 63 35 35 67 67 P-Value Endogeneity Test
0.664 0.926 0.959 0.948 0.212 0.564 0.958 0.769
F-Statistic First Stage
10.04 10.19 4.33 4.83 .68 .28 .61 .67
Robust standard errors in parentheses *** p<0.01, ** p<0.05, * p<0.1
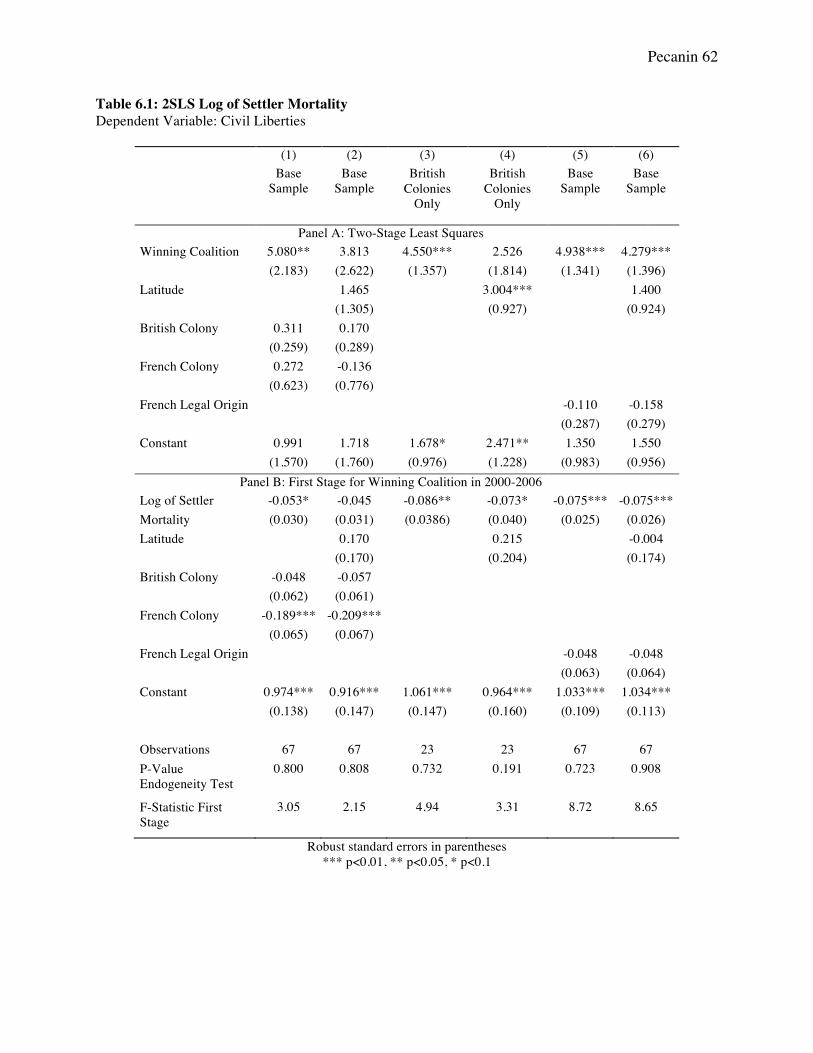
! Pecanin 62
Table 6.1: 2SLS Log of Settler Mortality Dependent Variable: Civil Liberties
(1) (2) (3) (4) (5) (6) Base
Sample Base
Sample British
Colonies Only
British Colonies
Only
Base Sample
Base Sample
Panel A: Two-Stage Least Squares Winning Coalition 5.080** 3.813 4.550*** 2.526 4.938*** 4.279*** (2.183) (2.622) (1.357) (1.814) (1.341) (1.396) Latitude 1.465 3.004*** 1.400 (1.305) (0.927) (0.924) British Colony 0.311 0.170 (0.259) (0.289) French Colony 0.272 -0.136 (0.623) (0.776) French Legal Origin -0.110 -0.158 (0.287) (0.279) Constant 0.991 1.718 1.678* 2.471** 1.350 1.550 (1.570) (1.760) (0.976) (1.228) (0.983) (0.956)
Panel B: First Stage for Winning Coalition in 2000-2006 Log of Settler -0.053* -0.045 -0.086** -0.073* -0.075*** -0.075*** Mortality (0.030) (0.031) (0.0386) (0.040) (0.025) (0.026) Latitude 0.170 0.215 -0.004 (0.170) (0.204) (0.174) British Colony -0.048 -0.057 (0.062) (0.061) French Colony -0.189*** -0.209*** (0.065) (0.067) French Legal Origin -0.048 -0.048 (0.063) (0.064) Constant 0.974*** 0.916*** 1.061*** 0.964*** 1.033*** 1.034*** (0.138) (0.147) (0.147) (0.160) (0.109) (0.113) Observations 67 67 23 23 67 67 P-Value Endogeneity Test
0.800 0.808 0.732 0.191 0.723 0.908
F-Statistic First Stage
3.05 2.15 4.94 3.31 8.72 8.65
Robust standard errors in parentheses *** p<0.01, ** p<0.05, * p<0.1

! Pecanin 63
Table 6.2: 2SLS Log of Settler Mortality Dependent Variable: Political Rights
(1) (2) (3) (4) (5) (6) Base
Sample Base
Sample British
Colonies Only
British Colonies
Only
Base Sample
Base Sample
Panel A: Two-Stage Least Squares Winning Coalition 5.068** 3.150 5.213*** 2.820 6.432*** 5.793*** (2.331) (3.190) (1.742) (2.682) (1.564) (1.624) Latitude 2.217* 3.553** 1.357* (1.337) (1.517) (0.803) British Colony 0.306 0.091 (0.316) (0.369) French Colony -0.529 -1.146 (0.685) (0.947) French Legal Origin -0.315 -0.361 (0.348) (0.336) Constant 1.069 2.169 1.272 2.211 0.337 0.531 (1.701) (2.205) (1.287) (1.750) (1.169) (1.146)
Panel B: First Stage for Winning Coalition in 2000-2006 Log of Settler -0.053* -0.045 -0.086** -0.073* -0.075*** -0.075*** Mortality (0.030) (0.031) (0.039) (0.040) (0.025) (0.026) Latitude 0.170 0.215 -0.004 (0.170) (0.204) (0.174) British Colony -0.048 -0.057 (0.062) (0.061) French Colony -0.189*** -0.209*** (0.065) (0.067) French Legal Origin -0.048 -0.048 (0.063) (0.064) Constant 0.974*** 0.916*** 1.061*** 0.964*** 1.033*** 1.034*** (0.138) (0.147) (0.147) (0.160) (0.109) (0.113) Observations 67 67 23 23 67 67 P-Value Endogeneity Test
0.796 0.435 0.859 0.359 0.777 0.941
F-Statistic First Stage 3.05 2.15 4.94 3.31 8.72 8.65
Robust standard errors in parentheses *** p<0.01, ** p<0.05, * p<0.1

! Pecanin 64
Table 7.1: 2SLS Log of Settler Mortality Capped at 250/1000 Dependent Variable: Civil Liberties
(1) (2) (3) (4) (5) (6) (7) (8) Base
Sample Base
Sample Excluding
Neo-Europe Excluding
Neo-Europe Excluding
Africa Excluding
Africa Base
Sample Base
Sample
Panel A: Two-Stage Least Squares Winning Coalition 5.085*** 4.620*** 3.686*** 3.637*** 9.061*** 6.100** 3.917* 3.417 (0.991) (1.029) (1.409) (1.375) (2.415) (3.094) (2.271) (2.195) Latitude 1.348 0.669 2.542** 0.910 (0.886) (1.019) (1.276) (0.776) Asia -0.974** -1.008** (0.474) (0.442) Africa -0.589 -0.719 (0.802) (0.774) Other 0.742* 0.673 (0.448) (0.432) Constant 1.180* 1.232** 2.01** 1.927** -1.890 -0.0841 2.341 2.567 (0.650) (0.626) (0.869) (0.887) (1.885) (2.247) (1.871) (1.793)
Panel B: First Stage for Winning Coalition in 2000-2006 Log of Settler -0.136*** -0.139*** -0.120*** -0.122*** -0.06* -0.05* -0.08*** -0.084*** Mortality Capped (0.024) (0.023) (0.0321) (0.032) (0.03) (0.027) (0.0287) (0.028) Latitude -0.082 -0.201 0.138 -0.099 (0.144) (0.186) (0.166) (0.127) Asia -0.174** -0.179** (0.067) (0.07) Africa -0.250*** -0.250*** (0.049) (0.049) Other 0.02 0.028 (0.06) (0.068) Constant 1.257*** 1.289*** 1.180*** 1.221*** 1.022*** 0.956*** 1.152*** 1.190*** (0.103) (0.101) (0.146) (0.131) (0.131) (0.110) (0.121) (0.118) Observations 67 67 63 63 35 35 67 67 P-Value Endogeneity Test
0.528 0.861 0.716 0.656 0.295 0.901 0.877 0.927
F-Statistic First Stage
32.58 36.18 13.92 14.48 3.91 3.48 7.77 9.33
Robust standard errors in parentheses *** p<0.01, ** p<0.05, * p<0.1

! Pecanin 65
Table 7.2: 2SLS Log of Settler Mortality Capped at 250/1000 Dependent Variable: Political Rights (1) (2) (3) (4) (5) (6) (7) (8) Base
Sample Base
Sample Excluding
Neo-Europe
Excluding Neo-
Europe
Excluding Africa
Excluding Africa
Base Sample
Base Sample
Panel A: Two-Stage Least Squares Winning Coalition 7.042*** 6.617*** 6.608*** 6.516*** 10.33*** 7.990* 6.544** 6.023** (1.063) (1.100) (1.757) (1.674) (3.423) (4.440) (2.680) (2.589) Latitude 1.232 1.258 2.006 0.947 (0.768) (0.975) (1.710) (0.717) Asia -0.836 -0.872 (0.700) (0.637) Africa -0.417 -0.553 (0.942) (0.909) Other 0.082 0.01 (0.507) (0.498) Constant -0.270 -0.222 -0.013 -0.165 -2.798 -1.373 0.374 0.609 (0.691) (0.668) (1.072) (1.080) (2.630) (3.240) (2.208) (2.121)
Panel B: First Stage for Winning Coalition in 2000-2006 Log of Settler -0.136*** -0.139*** -0.120*** -0.122*** -0.06* -0.05* -0.08*** -0.084*** Mortality Capped (0.024) (0.023) (0.032) (0.032) (0.03) (0.027) (0.029) (0.028) Latitude -0.082 -0.201 0.138 -0.099 (0.144) (0.186) (0.166) (0.127) Asia -0.174** -0.179** (0.067) (0.070) Africa -0.25*** -0.25*** (0.049) (0.049) Other 0.02 0.028 (0.062) (0.068) Constant 1.257*** 1.289*** 1.180*** 1.221*** 1.022*** 0.956*** 1.152*** 1.190*** (0.103) (0.101) (0.146) (0.131) (0.131) (0.110) (0.121) (0.118) Observations 67 67 63 63 35 35 67 67 P-Value Endogeneity Test
0.374 0.571 0.657 0.708 0.335 0.694 0.528 0.658
F-Statistic First Stage
32.58 36.18 13.92 14.48 3.91 3.48 7.77 9.33
Robust standard errors in parentheses *** p<0.01, ** p<0.05, * p<0.1

! Pecanin 66
Table 8.1: 2SLS Log of Settler Mortality Capped at 250/1000 Dependent Variable: Civil Liberties
(1) (2) (3) (4) (5) (6) Base
Sample Base
Sample British
Colonies Only
British Colonies
Only
Base Sample
Base Sample
Winning Coalition 4.903*** 4.201*** 5.349*** 4.115*** 4.919*** 4.388*** (1.426) (1.605) (1.198) (1.194) (1.108) (1.167) Latitude 1.351 2.192** 1.380 (1.069) (0.872) (0.898) British Colony 0.307 0.188 (0.259) (0.270) French Colony 0.229 -0.035 (0.463) (0.520) French Legal Origin -0.112 -0.148 (0.274) (0.266) Constant 1.121 1.450 1.113 1.520* 1.363* 1.477* (1.016) (1.060) (0.906) (0.852) (0.818) (0.804) Log of Settler -0.124*** -0.120*** -0.151*** -0.146*** -0.140*** -0.145*** Mortality Capped (0.031) (0.029) (0.037) (0.039) (0.027) (0.026) Latitude 0.065 0.06 -0.09 (0.130) (0.211) (0.146) British Colony -0.108* -0.110* (0.061) (0.061) French Colony -0.166*** -0.173*** (0.062) (0.063) French Legal Origin 0.0226 0.026 (0.0626) (0.063) Constant 1.294*** 1.266*** 1.291*** 1.259*** 1.262*** 1.299*** (0.137) (0.129) (0.134) (0.146) (0.104) (0.100) Observations 67 67 23 23 67 67 P-Value Endogeneity Test
0.791 0.871 0.617 0.609 0.656 0.970
F-Statistic First Stage
16.61 17.40 16.42 14.19 27.05 30.4
Robust standard errors in parentheses *** p<0.01, ** p<0.05, * p<0.1
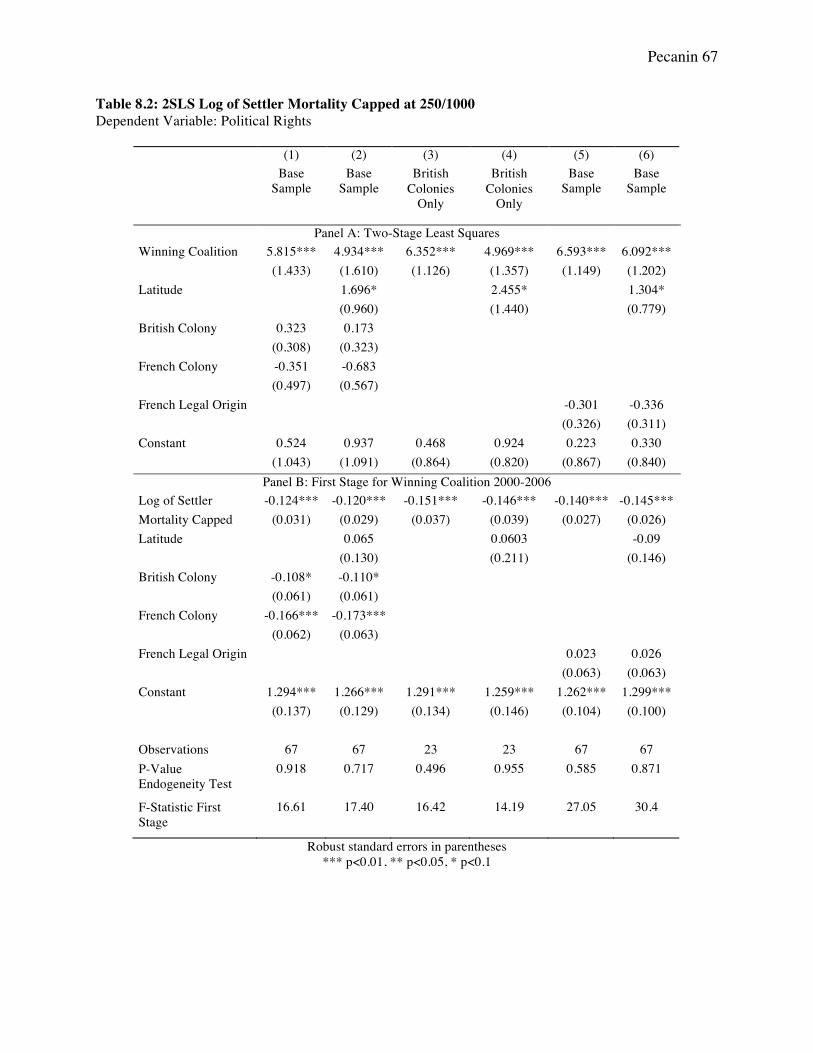
! Pecanin 67
Table 8.2: 2SLS Log of Settler Mortality Capped at 250/1000 Dependent Variable: Political Rights
(1) (2) (3) (4) (5) (6) Base
Sample Base
Sample British
Colonies Only
British Colonies
Only
Base Sample
Base Sample
Panel A: Two-Stage Least Squares Winning Coalition 5.815*** 4.934*** 6.352*** 4.969*** 6.593*** 6.092*** (1.433) (1.610) (1.126) (1.357) (1.149) (1.202) Latitude 1.696* 2.455* 1.304* (0.960) (1.440) (0.779) British Colony 0.323 0.173 (0.308) (0.323) French Colony -0.351 -0.683 (0.497) (0.567) French Legal Origin -0.301 -0.336 (0.326) (0.311) Constant 0.524 0.937 0.468 0.924 0.223 0.330 (1.043) (1.091) (0.864) (0.820) (0.867) (0.840)
Panel B: First Stage for Winning Coalition 2000-2006 Log of Settler -0.124*** -0.120*** -0.151*** -0.146*** -0.140*** -0.145*** Mortality Capped (0.031) (0.029) (0.037) (0.039) (0.027) (0.026) Latitude 0.065 0.0603 -0.09 (0.130) (0.211) (0.146) British Colony -0.108* -0.110* (0.061) (0.061) French Colony -0.166*** -0.173*** (0.062) (0.063) French Legal Origin 0.023 0.026 (0.063) (0.063) Constant 1.294*** 1.266*** 1.291*** 1.259*** 1.262*** 1.299*** (0.137) (0.129) (0.134) (0.146) (0.104) (0.100) Observations 67 67 23 23 67 67 P-Value Endogeneity Test
0.918 0.717 0.496 0.955 0.585 0.871
F-Statistic First Stage
16.61 17.40 16.42 14.19 27.05 30.4
Robust standard errors in parentheses *** p<0.01, ** p<0.05, * p<0.1
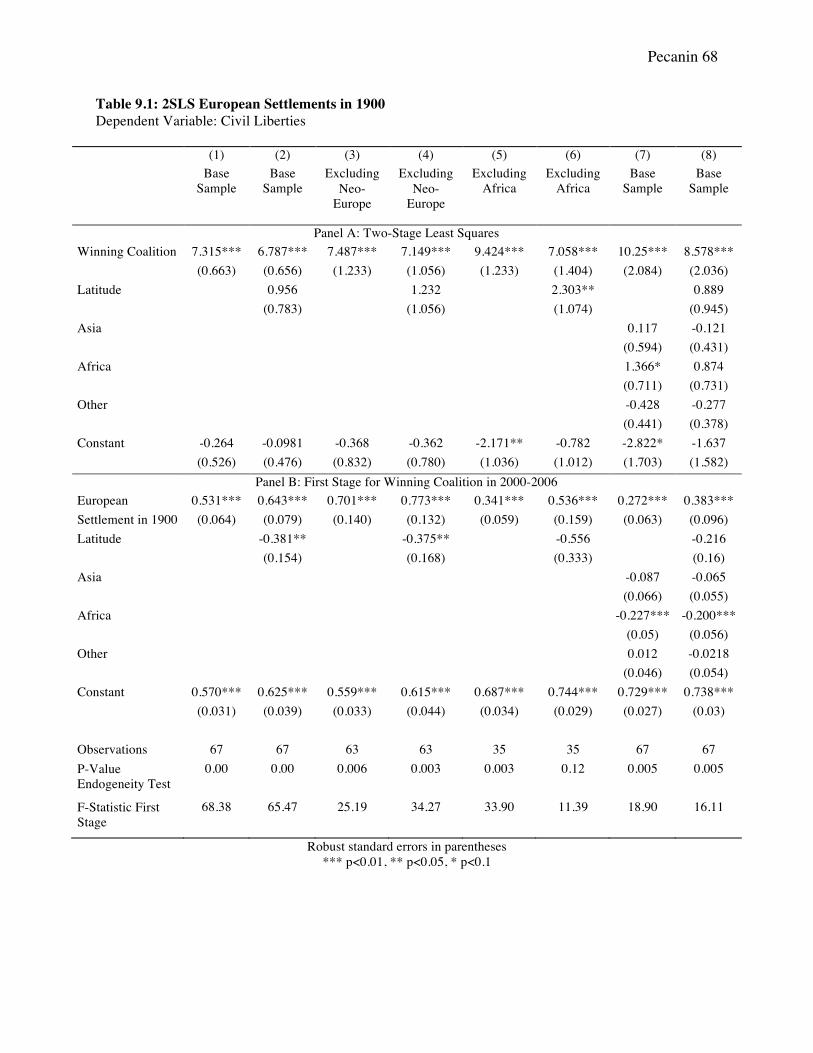
! Pecanin 68
Table 9.1: 2SLS European Settlements in 1900 Dependent Variable: Civil Liberties
(1) (2) (3) (4) (5) (6) (7) (8) Base
Sample Base
Sample Excluding
Neo-Europe
Excluding Neo-
Europe
Excluding Africa
Excluding Africa
Base Sample
Base Sample
Panel A: Two-Stage Least Squares Winning Coalition 7.315*** 6.787*** 7.487*** 7.149*** 9.424*** 7.058*** 10.25*** 8.578*** (0.663) (0.656) (1.233) (1.056) (1.233) (1.404) (2.084) (2.036) Latitude 0.956 1.232 2.303** 0.889 (0.783) (1.056) (1.074) (0.945) Asia 0.117 -0.121 (0.594) (0.431) Africa 1.366* 0.874 (0.711) (0.731) Other -0.428 -0.277 (0.441) (0.378) Constant -0.264 -0.0981 -0.368 -0.362 -2.171** -0.782 -2.822* -1.637 (0.526) (0.476) (0.832) (0.780) (1.036) (1.012) (1.703) (1.582)
Panel B: First Stage for Winning Coalition in 2000-2006 European 0.531*** 0.643*** 0.701*** 0.773*** 0.341*** 0.536*** 0.272*** 0.383*** Settlement in 1900 (0.064) (0.079) (0.140) (0.132) (0.059) (0.159) (0.063) (0.096) Latitude -0.381** -0.375** -0.556 -0.216 (0.154) (0.168) (0.333) (0.16) Asia -0.087 -0.065 (0.066) (0.055) Africa -0.227*** -0.200*** (0.05) (0.056) Other 0.012 -0.0218 (0.046) (0.054) Constant 0.570*** 0.625*** 0.559*** 0.615*** 0.687*** 0.744*** 0.729*** 0.738*** (0.031) (0.039) (0.033) (0.044) (0.034) (0.029) (0.027) (0.03) Observations 67 67 63 63 35 35 67 67 P-Value Endogeneity Test
0.00 0.00 0.006 0.003 0.003 0.12 0.005 0.005
F-Statistic First Stage
68.38 65.47 25.19 34.27 33.90 11.39 18.90 16.11
Robust standard errors in parentheses *** p<0.01, ** p<0.05, * p<0.1

! Pecanin 69
Table 9.2: 2SLS European Settlements in 1900 Dependent Variable: Political Rights
(1) (2) (3) (4) (5) (6) (7) (8) Base
Sample Base
Sample Excluding
Neo-Europe
Excluding Neo-
Europe
Excluding Africa
Excluding Africa
Base Sample
Base Sample
Panel A: Two-Stage Least Squares Winning Coalition 8.188*** 7.606*** 8.775*** 8.350*** 9.100*** 6.710*** 8.063*** 6.284*** (0.715) (0.747) (1.308) (1.149) (1.563) (1.907) (1.806) (1.761) Latitude 1.053 1.552 2.326* 0.946 (0.779) (1.049) (1.261) (0.733) Asia -0.575 -0.827 (0.638) (0.529) Africa 0.0514 -0.472 (0.640) (0.643) Other -0.199 -0.038 (0.341) (0.299) Constant -1.012* -0.829 -1.368 -1.361 -1.845 -0.441 -0.864 0.397 (0.567) (0.539) (0.895) (0.839) (1.349) (1.450) (1.520) (1.430)
Panel B: First Stage for Winning Coalition in 2000-2006 European 0.531*** 0.643*** 0.701*** 0.773*** 0.341*** 0.536*** 0.272*** 0.383*** Settlements in 1900 (0.064) (0.079) (0.140) (0.132) (0.059) (0.159) (0.063) (0.096) Latitude -0.381** -0.375** -0.556 -0.216 (0.154) (0.168) (0.333) (0.162) Asia -0.087 -0.065 (0.066) (0.055) Africa -0.227*** -0.200*** (0.050) (0.056) Other 0.011 -0.022 (0.046) (0.054) Constant 0.570*** 0.625*** 0.559*** 0.615*** 0.687*** 0.744*** 0.729*** 0.738*** (0.031) (0.039) (0.033) (0.044) (0.034) (0.029) (0.027) (0.03) Observations 67 67 63 63 35 35 67 67 P-Value Endogeneity Test
0.004 0.013 0.022 0.02 0.089 0.62 0.11 0.39
F-Statistic First Stage
68.38 65.47 25.19 34.27 33.90 11.39 18.90 16.11
Robust standard errors in parentheses *** p<0.01, ** p<0.05, * p<0.1

! Pecanin 70
Table 10.1: 2SLS European Settlements in 1900 Dependent Variable: Civil Liberties
(1) (2) (3) (4) (5) (6) Base
Sample Base
Sample British
Colonies Only
British Colonies
Only
Base Sample
Base Sample
Panel A: Two-Stage Least Squares Winning Coalition 8.217*** 8.035*** 7.301*** 6.535*** 7.372*** 6.821*** (0.989) (1.086) (0.859) (1.186) (0.727) (0.708) Latitude 0.232 0.955 0.954 (1.010) (1.486) (0.786) British Colony 0.385 0.363 (0.307) (0.323) French Colony 1.020** 0.960* (0.454) (0.527) French Legal Origin 0.098 0.0567 (0.320) (0.294) Constant -1.300* -1.198 -0.267 0.072 -0.366 -0.158 (0.755) (0.758) (0.796) (0.734) (0.676) (0.605)
Panel B: First Stage of Winning Coalition in 2000-2006 European 0.443*** 0.516*** 0.425*** 0.561*** 0.518*** 0.630*** Settlement in 1900 (0.069) (0.097) (0.0754) (0.174) (0.071) (0.087) Latitude -0.209 -0.398 -0.372** (0.173) (0.404) (0.158) British Colony -0.042 -0.0285 (0.054) (0.053) French Colony -0.167*** -0.140** (0.059) (0.068) French Legal Origin -0.041 -0.033 (0.055) (0.054) Constant 0.650*** 0.665*** 0.612*** 0.666*** 0.600*** 0.647*** (0.034) (0.037) (0.0) (0.073) (0.052) (0.053) Observations 67 67 23 23 67 67 P-Value Endogeneity Test
0.00 0.00 0.003 0.07 0.00 0.00
F-Statistic First Stage
41.16 28.19 31.82 10.42 53.09 51.93
Robust standard errors in parentheses *** p<0.01, ** p<0.05, * p<0.1

! Pecanin 71
Table 10.2: 2SLS European Settlements in 1900 Dependent Variable: Political Rights
(1) (2) (3) (4) (5) (6) Base
Sample Base
Sample British
Colonies Only
British Colonies
Only
Base Sample
Base Sample
Panel A: Two-Stage Least Squares Winning Coalition 8.121*** 7.342*** 7.098*** 5.242*** 8.088*** 7.474*** (1.015) (1.095) (0.948) (1.367) (0.827) (0.824) Latitude 0.993 2.315 1.062 (0.894) (1.462) (0.774) British Colony 0.377 0.283 (0.318) (0.316) French Colony 0.199 -0.058 (0.430) (0.485) French Legal Origin -0.174 -0.219 (0.364) (0.336) Constant -1.161 -0.726 -0.06 0.761 -0.831 -0.598 (0.771) (0.780) (0.887) (0.912) (0.786) (0.723)
Panel B: First Stage for Winning Coalition in 2000-2006 European 0.443*** 0.516*** 0.425*** 0.561*** 0.518*** 0.630*** Settlement in 1900 (0.069) (0.097) (0.075) (0.174) (0.071) (0.087) Latitude -0.209 -0.398 -0.372** (0.173) (0.404) (0.158) Brit -0.042 -0.029 (0.054) (0.053) Franc -0.167*** -0.140** (0.059) (0.068) French Legal Origin -0.041 -0.033 (0.055) (0.053) Constant 0.650*** 0.665*** 0.612*** 0.666*** 0.600*** 0.647*** (0.034) (0.037) (0.06) (0.073) (0.052) (0.053) Observations 67 67 23 23 67 67 P-Value Endogeneity Test
0.007 0.03 0.09 0.832 0.006 0.018
F-Statistic First Stage
41.16 28.19 31.82 10.42 53.09 51.93
Robust standard errors in parentheses *** p<0.01, ** p<0.05, * p<0.1