The Effect of White Mineral Trioxide Aggregate on ...
94
I The Effect of White Mineral Trioxide Aggregate on Migration, Proliferation, and Odontoblastic Differentiation of Stem Cells from the Apical Papilla. By Robert S. Schneider Dissertation submitted in partial fulfillment Of the requirements for the degree of Masters of Science in Endodontics The University of Michigan 2013 Thesis Committee Associate Professor Tatiana M. Botero, Chair Associate Professor Daniel J. Chiego Professor Graham R. Holland Professor Jan C. H. Hu Professor Jacques E. Nör
Transcript of The Effect of White Mineral Trioxide Aggregate on ...
I
The Effect of White Mineral Trioxide Aggregate on
Migration, Proliferation, and Odontoblastic
Differentiation of Stem Cells from the Apical Papilla.
By
Robert S. Schneider
Dissertation submitted in partial fulfillment
Of the requirements for the degree of
Masters of Science in Endodontics
The University of Michigan
2013
Thesis Committee
Associate Professor Tatiana M. Botero, Chair
Associate Professor Daniel J. Chiego
Professor Graham R. Holland
Professor Jan C. H. Hu
Professor Jacques E. Nör

II
Acknowledgements Thesis Committee
Tatiana M. Botero
Daniel J. Chiego
Graham R. Holland
Jan C. C. Hu
Jacques E. Nör
Special Thanks
Songtao Shi
Funding
American Association of Endodontics Foundation Grant
CRSE Graduate Master’s Funding
Research Lab
Kristy Warner
Zhaocheng Zhang
Miscellaneous
Neville J. McDonald
Turki Alhazzazi
Ali Aminlari
Arthur Lamia
III
List of Tables and Figures: Table 1: SCAP Cell Migration Table 2: SCAP Cell Proliferation Figure 1: SCAP Cell Migration 30 Minutes Figure 2: SCAP Cell Migration 60 Minutes Figure 3: SCAP Cell Migration 3 Hours Figure 4: SCAP Cell Migration 6 Hours Figure 5: SCAP Cell Migration 12 Hours Figure 6: SCAP Cell Migration 24 Hours Figure 7: SCAP Cell Migration 48 Hours Figure 8: SCAP Cell Migration 72 Hours Figure 9: SCAP Cell Proliferation Day 1 Figure 10: SCAP Cell Proliferation Day 3 Figure 11: SCAP Cell Proliferation Day 5 Figure 12: SCAP Cell Proliferation Day 7 Figure 13: SCAP Cell Proliferation Day 9 Figure 14: SCAP Cell Proliferation Day 11 Figure 15: SCAP Cell Proliferation Day 14 Figure 16: SCAP Cell Differentiation in Plain Media Figure 17: SCAP Cell Differentiation in FBS Media Figure 18: SCAP Cell MEPE Expression at 7 days Figure 19: SCAP Cell DSPP Expression at 7 days Figure 20: SCAP Cell DMP-1 Expression at 7 days Figure 21: SCAP Cell MEPE Expression at 14 days Figure 22: SCAP Cell DSPP Expression at 14 days Figure 23: SCAP Cell DMP-1 Expression at 14 days Figure 24: SCAP Cell MEPE Expression at 21 days Figure 24: SCAP Cell DSPP Expression at 21 days Figure 26: SCAP Cell DMP-1 Expression at 21 days Figure 27: Calcium Enriched Media SCAP Cell Migration 30 Minutes Figure 28: Calcium Enriched Media SCAP Cell Migration 60 Minutes Figure 29: Calcium Enriched Media SCAP Cell Migration 3 Hours Figure 30: Calcium Enriched Media SCAP Cell Migration 6 Hours Figure 31: Calcium Enriched Media SCAP Cell Migration 12 Hours Figure 32: Calcium Enriched Media SCAP Cell Migration 24 Hours Figure 33: Calcium Enriched Media SCAP Cell Migration 48 Hours Figure 34: Calcium Enriched Media SCAP Cell Migration 72 Hour Figure 35: Calcium Enriched Media SCAP Cell Proliferation Day 1 Figure 36: Calcium Enriched Media SCAP Cell Proliferation Day 3 Figure 37: Calcium Enriched Media SCAP Cell Proliferation Day 5 Figure 38: Calcium Enriched Media SCAP Cell Proliferation Day 7 Figure 39: Calcium Enriched Media SCAP Cell Proliferation Day 9 Figure 40: Calcium Enriched Media SCAP Cell Proliferation Day 11 Figure 41: Calcium Enriched Media SCAP Cell Proliferation Day 14
IV
Figure 42: SCAP Cell Differentiation in Calcium Enriched Media Figure 43: SCAP Cell MEPE Expression after 7 days of exposure to Calcium Enriched Media Figure 44: SCAP Cell DSPP Expression after 7 days of exposure to Calcium Enriched Media Figure 45: SCAP Cell DMP-1 Expression after 7 days of exposure to Calcium Enriched Media Figure 46: SCAP Cell MEPE Expression after 14 days of exposure to Calcium Enriched Media Figure 47: SCAP Cell DSPP Expression after 14 days of exposure to Calcium Enriched Media Figure 48: SCAP Cell DMP-1 Expression after 14 days of exposure to Calcium Enriched Media Figure 49: SCAP Cell MEPE Expression after 21 days of exposure to Calcium Enriched Media Figure 50: SCAP Cell DSPP Expression after 21 days of exposure to Calcium Enriched Media Figure 51: SCAP Cell DMP-1 Expression after 21 days of exposure to Calcium Enriched Media Figure 52: Flow Cytometry Analysis Figure 53: Gray MTA Pilot Studies, in Transwell-Inserts Figure 54: Gray MTA Pilot Studies, in Wells
V
Abstract Introduction: White Mineral Trioxide Aggregate (WMTA) is a biocompatible dental
material with osteoinductive and osteogenic properties recommended for use in
regenerative endodontic protocols. There is no evidence on the potential effect of WMTA
on the migration, proliferation, and odontoblastic differentiation of Stem Cells from
Apical Papilla (SCAP). Our hypothesis is that WMTA will induce migration,
proliferation, and odontoblastic differentiation in SCAP cells. Methods: SCAP cell
migration was assessed by transwell-migration assay at 30 minutes to 72 hours,
proliferation by WST-1 assay at 1 to 14 days and odontoblastic differentiation by RNA
expression of odontoblastic markers at 7, 14 and 21 days. Calcium enriched media was
used to determine the role of calcium during this cellular activation. The cell population
was characterized by flow cytometry. Results: WMTA significantly increased the
migration of SCAP cells at 6 hours and media containing 0.3 and 0.03 mmol calcium ions
significantly increased SCAP cell migration after 24 hours. WMTA significantly
increased proliferation on days 1 and 5, while calcium enriched media showed a
significant increase on day 7. SCAP cell proliferation was influenced strongly by the
presence of both 2% and 10% FBS in the media. Odontoblastic markers were seen
consistently in all samples, indicating a mixed cell population, which was confirmed by
flow cytometry. Conclusions: WMTA showed a significant effect on the migration and
proliferation of SCAP cells. Calcium enriched media significantly increased SCAP cell
migration and proliferation. Media containing FBS significantly increased SCAP cell
proliferation, even at the lower 2% concentration.
Page 1 of 76
Chapter 1 –INTRODUCTION An immature tooth with an open apex and a necrotic pulp poses a challenging clinical
problem (1, 2). Dental caries, dens evaginatus or trauma can result in bacterial invasion
of the pulp space, leading to necrosis (3). The bacterial infection leads to pulpal necrosis,
apical periodontitis and the cessation of root development, which in turn results in fragile
and thin root dentin walls (1, 2). This weakened root structure is highly susceptible to
fracture (2). Traditional methods to aid in apexification using calcium hydroxide have
been shown to weaken the radicular dentin even further, complicating the restorative
treatment to a greater degree (4). Similar consequences are found after the traumatic
avulsion of immature permanent incisors, most often seen in children between 8 to11
years of age (5). Avulsion results in severe damage to the tissues involved in the
developing root and pulpal structures (6, 7). This extensive damage halts root
development and offers a relatively poor prognosis that often leads to the loss of the tooth,
with a survival rate of only 57.3 months as reported by Pohl et al (8). In light of the
complications seen with traditional apexification methods, several recent studies have
begun to look at the possibility of using stem cells to regenerate the pulpo-dentin
complex and induce continued root development (1-3, 9, 10).
Adult stem cells are multipotential progenitor cells that have the ability to
differentiate into many cell types. They are found throughout the body, including the
odontogenic tissues (11). There is tremendous potential for dental stem cells to induce
dentinogenesis, apexogenesis, and the regeneration of the dental pulp (9, 12-14). Stem
Cells from the Apical Papilla (SCAP) are found in the apical papilla of immature
Page 2 of 76
permanent human teeth during root formation (14, 15). The apical papilla is induced by
the Primary Enamel Knot during the early stages of tooth development and plays an
important role in the development of the tooth by moving apically to continue forming
the radicular dentin as well as forming the dental pulp (13). Huang and collaborators,
have speculated that as a precursor to the radicular pulp, SCAP cells may give rise to
odontoblasts and Dental Pulp Stem Cells (DPSCs) (16). As a progenitor cell line and the
source of primary odontoblasts that are involved in root dentin formation, SCAP may
prove to be an excellent source of cells for regeneration of the pulpo-dentin complex (16).
Studies by Sonoyama have shown that SCAP cells proliferated 2-3 times faster than other
pulp organ cells in culture and that they were as potent in both osteogenic and
odontogenic differentiation as Mesenchymal Stem Cells (MSCs) (14, 15). Recent studies
have shown that MSCs and human dental pulp cells react favorably to the presence of
dental materials such as Mineral Trioxide Aggregate (MTA, Dentsply Endodontics, Tulsa,
OK), which has been shown to be biocompatible and to promote cell growth (12, 17-21).
MTA has been used since the early 1990’s (22). The main components of unset
white MTA (WMTA) are tricalcium silicate, dicalcium silicate, tricalcium aluminate,
bismuth oxide, and calcium sulphate dehydrate (22, 23). The composition of gray MTA is
similar, except that it contains tetracalcium aluminoferrite (22, 23). The composition of
set MTA is mostly calcium silicate hydrate (C-S-H) and calcium hydroxide (Ca(OH)2).
A large release of calcium ions results from the dissociation of Ca(OH)2 and the
decomposition of the C-S-H (22, 24). Ca(OH)2 formation is greatest at 4 to 24 hours and
present in the maximum amount at 7 days, but decreases by day 30, yielding a high
calcium ion release that declines over 5 weeks (22, 24, 25). It has excellent
Page 3 of 76
biocompatibility and has been used in root end fillings, perforation repair, pulp capping,
and apexification procedures (12, 22, 26). MTA has been shown to stimulate hard tissue
formation, pulp cell migration, proliferation, and differentiation into odontoblast-like
cells (12, 17, 19). A recent study by Kim et al., investigated the gene expression in
human pulp cells exposed to MTA for 72 hours, in which 109 genes were up-regulated
more than 2 fold and 69 genes down regulated by more than half, indicating that MTA’s
effects on cells can be detected within the first hours of contact with the material (18).
The high calcium ion release of MTA leads to the hypothesis that it is responsible for the
biological response (27).
Calcium ions have been shown to be a potent signaling molecule in many cell
types and to play a role in the regulation of most cellular physiologic processes (27-33).
Migration of mesenchymal stem cells, bone marrow-derived progenitor cells, and tumor
cells are affected by calcium ion concentration (28-30). Human dental pulp cells were
shown to have a similar increase in proliferation rates when exposed to media containing
MTA and media containing exogenous calcium ions at the same concentration (27). In
addition, the mineralization potential of human periodontal ligament cells and adipose-
derived stem cells is promoted with increased calcium ion concentrations (31, 32). The
differentiation of pulpal cells into odontoblasts may also be influenced by the levels of
calcium ions present in the surrounding environment (33). The ability of calcium ions to
influence cell migration, proliferation, and differentiation makes it a sensible choice to
explore in regenerative endodontic procedures.
Regenerative endodontics has received growing interest in recent years (1, 3, 34).
Numerous case studies have shown that following disinfection with triple antibiotic paste,
Page 4 of 76
MTA used in conjunction with a stimulated cell source from induced bleeding at the open
apex can result in continued root development in immature teeth that present with open
apices and necrotic pulps (1, 3, 34, 35). Lovelace et al., have shown that the induction of
bleeding at the apex releases a higher concentration of MSCs as compared to the
concentration found in the systemic circulation (34). The authors note that while the
exact source of these stem cells is, as yet, unknown, it is suspected to be the apical papilla
(34).
The rationale for this present study emerged after a review of the literature
reporting the effects of MTA on odontogenic stem cell populations. The literature has
shown that MTA promotes healing and induces hard tissue formation in vivo when used
in clinical situations such as pulp capping, perforation repair, root end filling, and
apexification procedures (12, 22, 26). The review has also shown that SCAP cells are
present in the area of the developing root and are capable of high proliferation rates as
well as odontoblastic differentiation (14-16). There is a limited number of studies
evaluating the mechanism of action of White MTA as well as its effect on the migration,
proliferation, and odontoblastic differentiation of SCAP cells.
MTA promotes a favorable wound healing environment and increases cell
survival (12). Mesenchymal Stem Cells (MSCs) have shown a significant increase in
proliferation rates after 7 days as compared to controls. Results of a transwell migration
study also showed a significant increase in the migration of MSCs in the presence of
MTA. The ability of MTA to promote migration, adhesion, and proliferation in these
cells mimics key wound healing phases (17). MTA has been shown to affect pulp cells,
but not SCAP cells, within 72 hours and to initiate expression of the putative
Page 5 of 76
odontoblastic markers DSPP, DMP-1, and MEPE in 7-14 days (12, 18, 36). The
expression of these markers correlates to the Ca(OH)2 formation from MTA at 24 hours
to 7 days and is concurrent with the large calcium ion release (22, 24, 25). The possible
correlation between the expression of odontoblastic markers and MTA’s calcium release
has not been investigated.
SCAP cells have higher proliferation and doubling rates and increased migration
when compared to DPSC (37). They were recently shown to produce odontoblast like
cells and dentin like tissue onto existing dentinal walls and MTA plugs in an in vivo study
by Huang et al (37). This was an observation by the authors, who did not investigate the
effect of MTA on SCAP cells. The study was designed to investigate the effect of poly-
D,L-lactide/glycolide scaffolds seeded with either SCAP cells or DPSC. The seeded
scaffolds were placed in a 6-7mm x 1-2.5mm human root fragment with a MTA plug in
one end and exposed to the growth factors sequestered in the dentin of the root fragment.
More relevant to our topic, the authors note “The most interesting and important finding
of this study is the formation of a continuous layer of dentin-like tissue with uniform
thickness on the existing canal dentin walls and the MTA cement surface, especially with
SCAP-seeded samples” (37). The incidental finding of the uniform dentinal layer on the
MTA plug leads us to the speculation that the SCAP cells were recruited into the area by
the MTA plug. This has yet to be investigated.
The understanding of the role of Stem Cells from Apical Papilla in the
regeneration process of injured immature teeth could provide a valuable treatment
option for the retention of compromised immature permanent teeth. This effort
Page 6 of 76
could be enhanced by MTA’s ability to promote migration, proliferation, and
differentiation of stem cells.
Hypothesis: White mineral trioxide aggregate can induce migration, proliferation and
differentiation in stem cells from the apical papilla.
Null Hypothesis: White mineral trioxide aggregate cannot induce migration,
proliferation and differentiation in stem cells from the apical papilla.
Our goal is to identify if WMTA plays a role in the migration, proliferation, and
differentiation of SCAP cells and to understand the role of the calcium ion release
associated to this induction.
The following specific aims will address this hypothesis:
1) To assess whether WMTA induces migration of SCAP cells.
2) To assess whether WMTA induces proliferation of SCAP cells.
3) To assess whether WMTA induces differentiation of SCAP cells into odontoblast-like
cells measured by the expression of putative odontoblastic markers: dentin
sialophosphoprotein (DSPP), dentin matrix protein (DMP-1), and matrix extracellular
phosphoglycoprotein (MEPE).
4) To determine if calcium ions released from WMTA are responsible for inducing the
migration, proliferation, and odontoblastic differentiation induced in SCAP cells.

Page 7 of 76
To facilitate the reading, the next chapters are organized according to aims. Each chapter
contains a description of the methods used and results.
Page 8 of 76
Chapter 2 – SCAP CELL MIGRATION To determine whether WMTA induces migration in SCAP cells, a trans-well migration
assay was used. The SCAP cells were challenged with 1 or 24 hour set WMTA and as
control groups plain or 10% FBS medium were used starting from 1/2 hour up to 72
hours exposure. The first portion of this materials and methods section contains a
description of the general materials and methods that were used with all the experiments.
After this, each chapter will describe in detail the methods used for the experiment
related to each aim.
Materials and Methods
Cell Culture
The SCAP cells used in all experiments were provided by Dr. Songtao Shi (University of
Southern California, Los Angeles, USA). All cell culture tasks were carried out under a
laminar flow hood. A passage Zero SCAP cell vial stored at -80°C was thawed in a 37ºC
warm water bath and the contents transferred to a T-75 flask (BD Falcon, San Jose, CA)
with 10ml of minimal essential medium alpha Eagle (α-MEM) supplemented with 10%
fetal bovine serum (FBS) and 1% penicillin/streptomycin (Hereinafter “10% FBS
media”) and incubated at 37ºC in 5% CO2 and 100% humidity. After 24 hours, the media
was removed by vacuum pipetting and 10ml of fresh media was added. Cells were
allowed to grow until reaching 80% confluence. At that point the media was removed by
vacuum pipetting and the cells were passaged by adding 3ml of 0.025% Trypsin-EDTA
to the flask and incubating for 5 minutes until the cells detached from the flask and were
visualized floating in the media. Five milliliters of 10% FBS media was added to
Page 9 of 76
inactivate the Trypsin-EDTA. The contents of the flask were transferred to a 15ml
conical tube (BD Falcon, San Jose, CA) and centrifuged for 5 minutes at 1000 RPM at
4ºC. The media was removed via vacuum pipetting and the pellet of cells was re-
suspended in 6ml of 10% FBS media. Three 2ml aliquots of re-suspended cells were then
placed in 3 T-75 flasks each containing 10ml of 10% FBS media and incubated at 37ºC in
5% CO2 and 100% humidity. Cells were used between passages 3 and 5.
MTA Preparation
White MTA ProRoot (Dentsply Endodontics, Tulsa, OK) was mixed per the
manufacturer’s recommendations. Specifically, 100mg of WMTA was mixed with 35µl
of sterile water under a laminar flow hood in a sterile Dappen Dish (Keystone Industries,
Cherry Hill, NJ) for approximately 1 minute. Ten milligram pellets were formed by
placing the mixed WMTA into the large groove of a Lee MTA Pellet Forming Block (G.
Hartzell & Son, Concord, CA) with the mixing spatula. The pellets were then placed in a
100 mm Cell Culture Dish (BD Falcon, San Jose, CA) and allowed to set for 1 hour or 24
hours at 37ºC in 5% CO2 and 100% humidity.
Transwell Migration Assay
SCAP cell migration was assessed by using a Transwell Migration Assay. SCAP cells
were prestained with Cell Tracker Green (CTG) (Invitrogen Corp., Carlsbad, CA) as
follows: the media from a T-75 flask containing passage 4 SCAP cells at 80% confluence
was removed by vacuum pipetting and 3ml of plain α-MEM media (Hereinafter “plain
media”) plus 6µl of 10mM CTG stock solution were added to the flask (a 2µM final
Page 10 of 76
concentration of CTG). The flask was incubated at 37ºC in 5% CO2 and 100% humidity
for 30 minutes. The plain media with CTG was removed by vacuum pipetting and 10ml
of 10% FBS media was added to the flask and incubated for 30 minutes at 37ºC in 5%
CO2 and 100% humidity. The plain media was removed by vacuum pipetting and the
cells were harvested by adding 3ml of 0.025% Trypsin-EDTA to the flask and incubating
it for 5 minutes until the cells detached from the flask and were visualized floating in the
media. Five milliliters of 10% FBS media was added to inactivate the Trypsin-EDTA.
The contents of the flask were transferred to a 15ml conical tube (BD Falcon, San Jose,
CA) and centrifuged for 5 minutes at 1000 RPM at 4ºC. The media was removed via
vacuum pipetting and the pellet of cells was re-suspended in 5ml of plain media. Cells
were counted using a hemocytometer with the sample created by placing 100µl of re-
suspended cells in 900µl of plain media into a 2ml Eppendorf tube. 1x10⁵ cells in 250µl
of plain media were seeded into the upper chambers of transwell 8-µm-size pore
FluoroBlok 24 well multiwell system membrane filters (BD Falcon, San Jose, CA)
(Hereinafter “FluoroBlok inserts”). The lower chambers of the 24 well multiwell system
contained 500µl of plain media. The FluoroBlok inserts were placed into the lower
chambers of the 24 well multiwell system and incubated for 4 hours at 37ºC in 5% CO2
and 100% humidity to allow for attachment of the cells to the membrane filter. After 4
hours, the FluoroBlok inserts were transferred to a new set of lower chambers of the 24
well multiwell system which contained the following test conditions: plain media with 1
hour set WMTA, plain media with 24 hour set WMTA, plain media, α-MEM
supplemented with 2% FBS and 1% penicillin/streptomycin (Hereinafter “2% FBS
media”) with 1 hour set WMTA, 2% FBS media with 24 hour set WMTA, 3.0mmol Ca
Page 11 of 76
media, 0.3mmol Ca media, 0.03mmol Ca media, 2% FBS media, and 10% FBS media.
One pellet of WMTA was used in each well that contained WMTA and 500µl of media
was used in each well. The plate was incubated at 37ºC in 5% CO2 and 100% humidity.
Cells that migrated to the bottom of the FluoroBlok inserts were read by fluorescence at
485/585 nm using a microplate reader (Genius; Tecan, Grödig, Austria) at 30 minutes, 60
minutes, 3, 6, 12, 24, 48, and 72 hours. This experiment was repeated 3 times in triplicate.
Statistical Analysis
The Statistical Anlaysis was completed with the support of the University of Michigan’s
Center for Statistical Consultation and Research (CSCAR). All data was analyzed using
one-way ANOVA with a Bonferroni comparison and a P value less than or equal to 0.05.
The analysis was completed using SigmaStat 2.0 Software (Systat Software, San Jose,
California). This process was repeated for the remaining experiments.
Results
WMTA Significantly Increased SCAP Cell Migration at 6 Hours
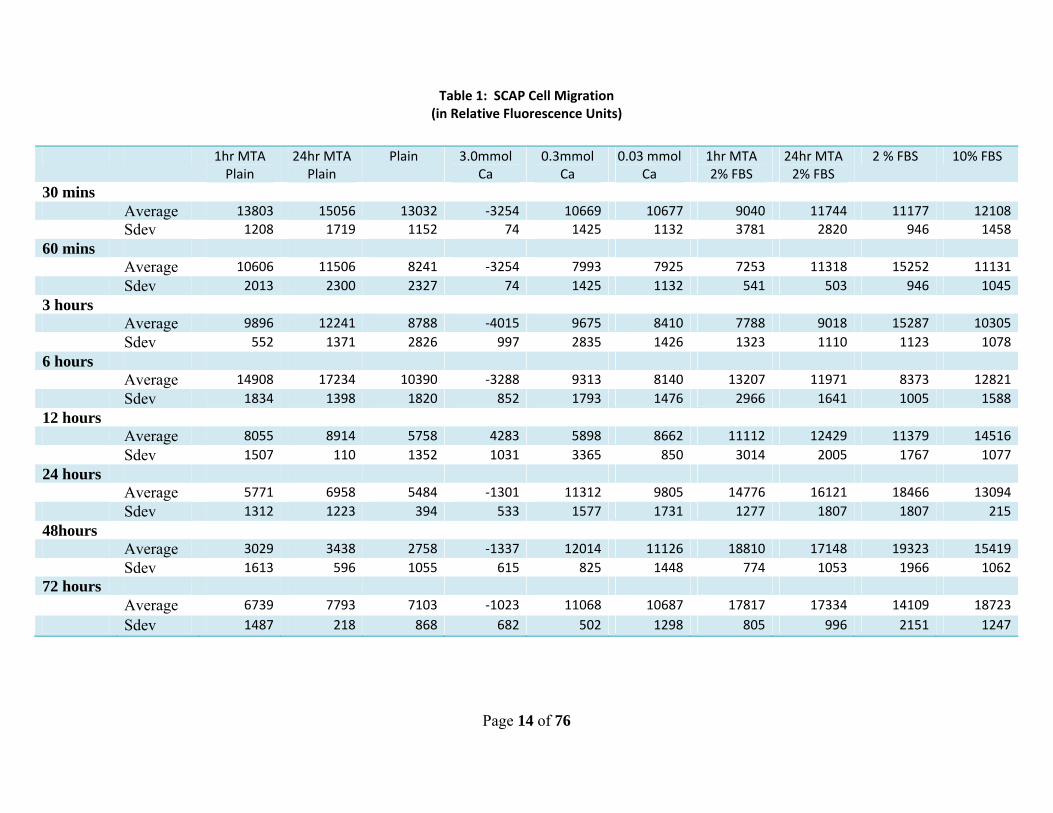
The results for the transwell migration assay are described in relative fluorescence units
(RFU) and are listed in Table 1. There were no significant differences between any
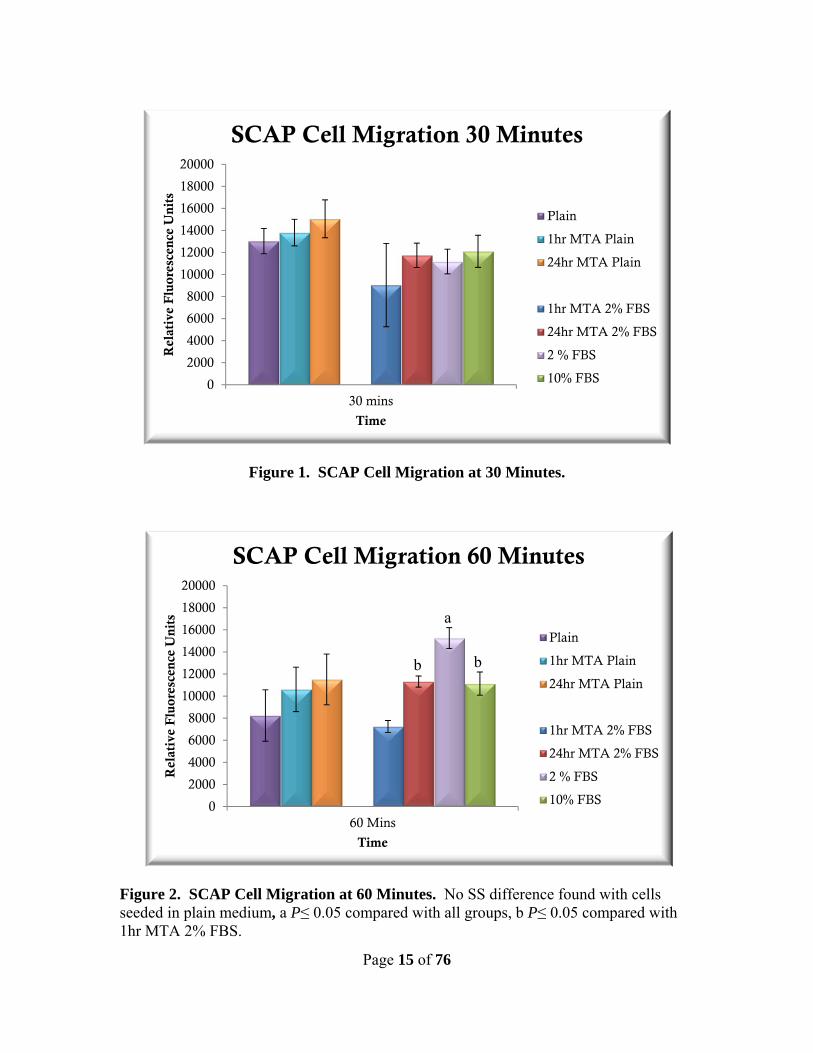
groups at the 30 minute reading (Figure 1). During the 60 minute reading, there were no
significant differences among the plain media groups; however there was a significant
increase in migration for the 2% FBS media group as compared to all groups (P =
<0.002). Both the 24 hour set WMTA with 2% FBS media and the 10% FBS media
groups showed a significant increase in migration as compared to the 1 hour set WMTA
Page 12 of 76
with 2% FBS media (P = <0.001, Figure 2). No significant differences were observed in
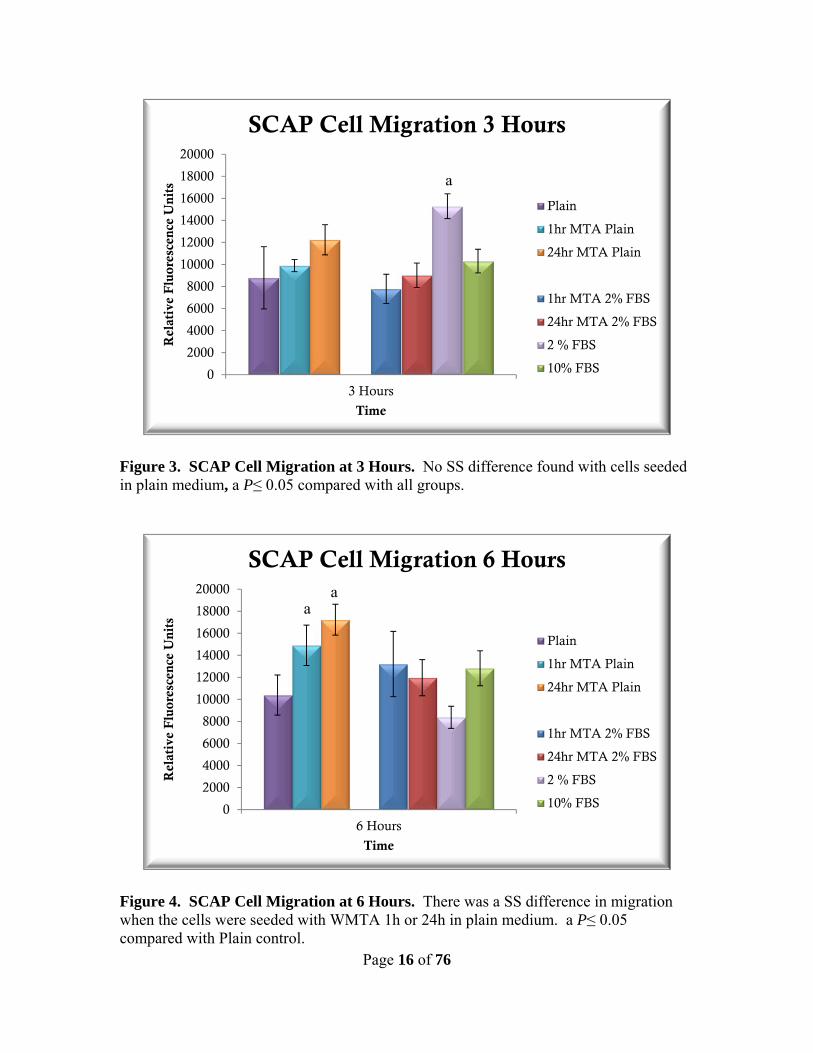
the plain media groups at the 3 hour reading. The 2% FBS group did show a significant
increase in migration as compared to the remaining FBS groups in the 3 hour reading
(P = <0.004, Figure 3). The 6 hour reading showed that both 1 and 24 hour set WMTA
in plain media had significantly increased migration as compared to the plain media
control (P = <0.038). There was no difference observed in the FBS media groups (Figure
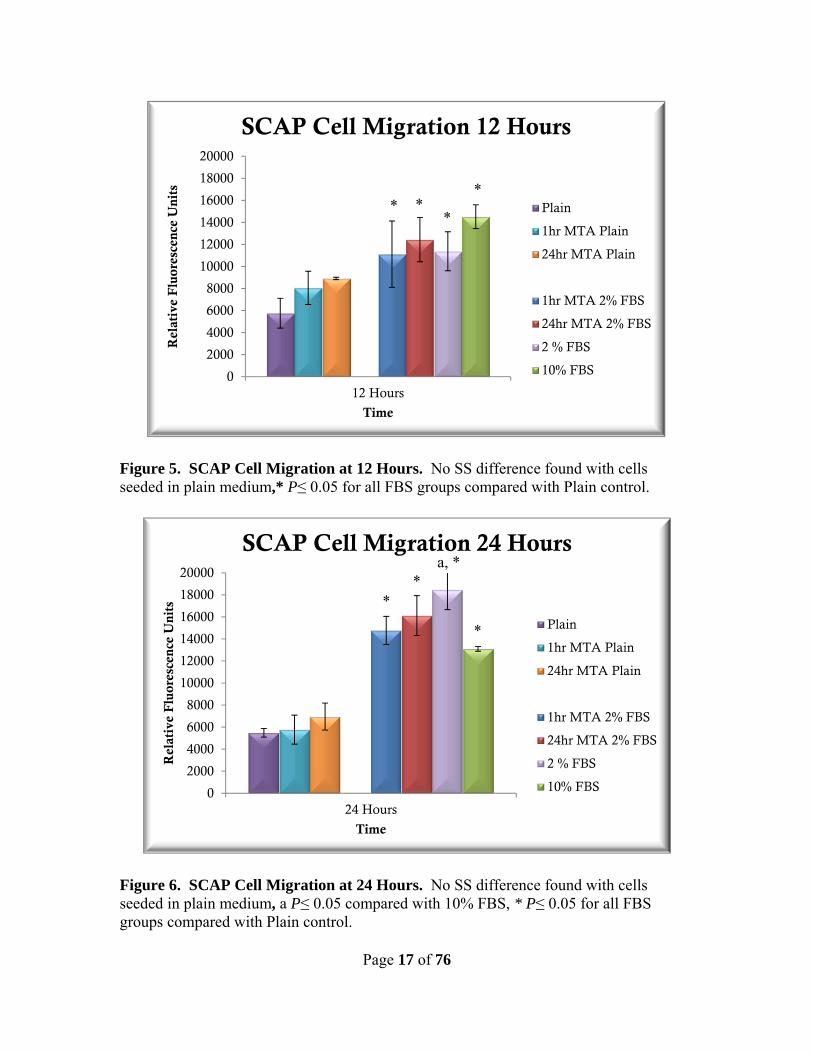
4). No significant differences were observed between the any of the plain media groups
or any of the FBS media groups in the 12 hour reading (Figure 5). The 24 hour reading
showed no differences in the plain media groups. A significant difference was observed
between the 2% and 10% FBS groups, with the 2% FBS group showing increased
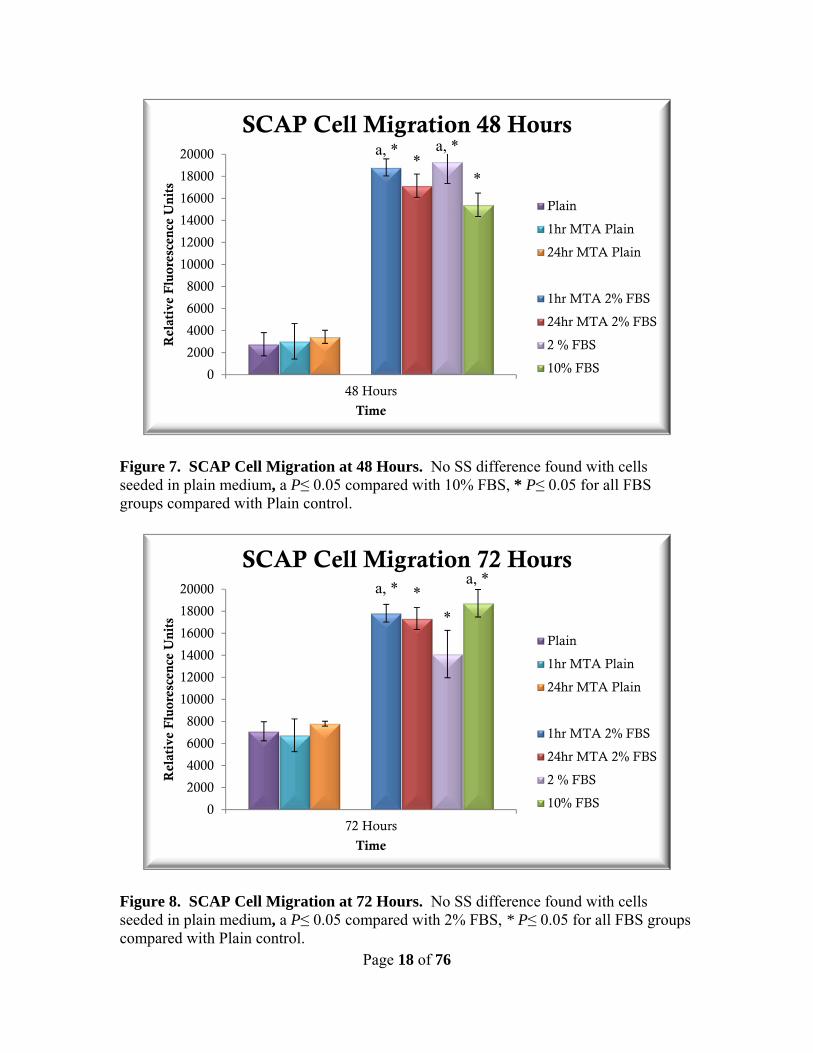
migration (P = 0.008, Figure 6). During the 48 hour reading, the only significant
differences seen were in the FBS containing media groups where the 10% FBS group
showed significantly less migration than both the 2% FBS media and 1 hour WMTA with
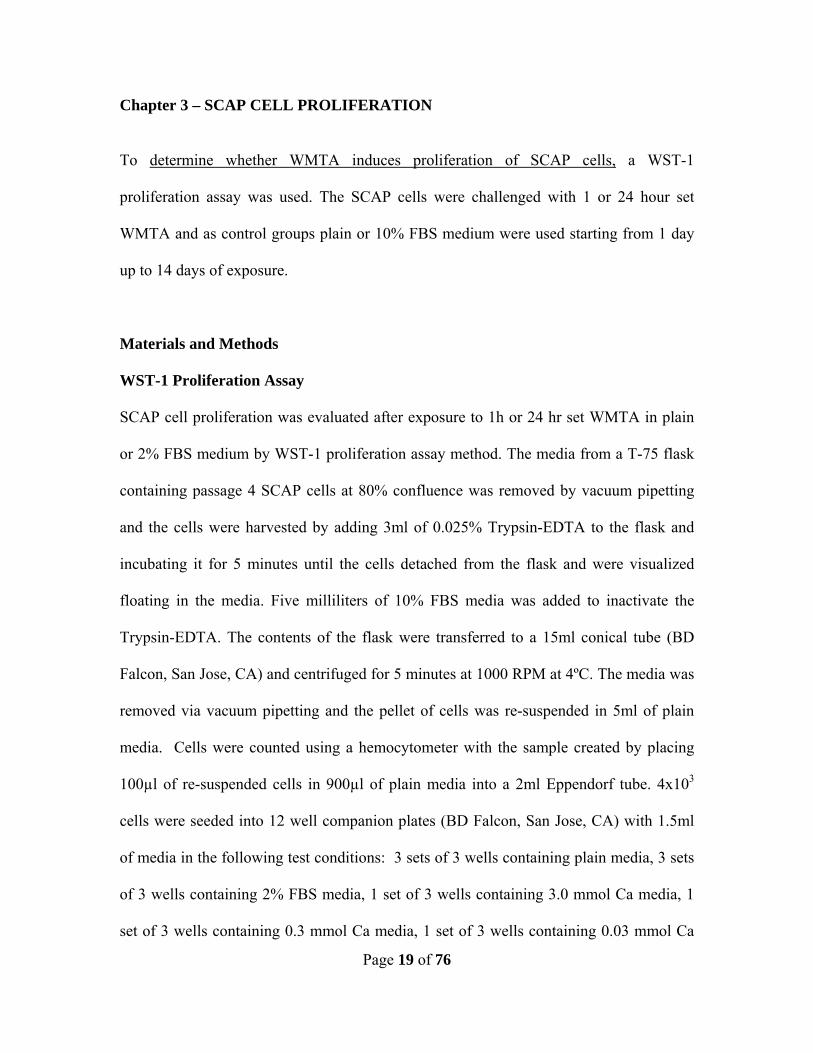
2% FBS media group (P = <0.05, Figure 7). There were no significant differences seen
in the plain media groups during the 72 hour reading, however both the 10% FBS media
group and the 1 hour WMTA with 2% FBS media group showed significantly increased
migration when compared to the 2% FBS media group (P = <0.047, Figure 8). Media
containing both 2% and 10% FBS induced a significant increase in migration as
compared to the plain media groups after 12 hours (P = <0.05, Figures 5-8) and media
with 2% FBS also showed a significant increase in migration at both 60 minutes and 3
hours (P = <0.05, Figures 2 & 3).

Page 13 of 76
In summary, we found that migration of SCAP cells was induced after 6 hours of
exposure to 1h or 24 h set WMTA in plain medium. Other times of exposure did not
show any significant differences.
Page 14 of 76
Table 1: SCAP Cell Migration (in Relative Fluorescence Units)
1hr MTA Plain
24hr MTA Plain
Plain 3.0mmol Ca
0.3mmol Ca
0.03 mmol Ca
1hr MTA 2% FBS
24hr MTA 2% FBS
2 % FBS 10% FBS
30 mins Average 13803 15056 13032 -3254 10669 10677 9040 11744 11177 12108 Sdev 1208 1719 1152 74 1425 1132 3781 2820 946 1458 60 mins Average 10606 11506 8241 -3254 7993 7925 7253 11318 15252 11131 Sdev 2013 2300 2327 74 1425 1132 541 503 946 1045 3 hours Average 9896 12241 8788 -4015 9675 8410 7788 9018 15287 10305 Sdev 552 1371 2826 997 2835 1426 1323 1110 1123 1078 6 hours Average 14908 17234 10390 -3288 9313 8140 13207 11971 8373 12821 Sdev 1834 1398 1820 852 1793 1476 2966 1641 1005 1588 12 hours Average 8055 8914 5758 4283 5898 8662 11112 12429 11379 14516 Sdev 1507 110 1352 1031 3365 850 3014 2005 1767 1077 24 hours Average 5771 6958 5484 -1301 11312 9805 14776 16121 18466 13094 Sdev 1312 1223 394 533 1577 1731 1277 1807 1807 215 48hours Average 3029 3438 2758 -1337 12014 11126 18810 17148 19323 15419 Sdev 1613 596 1055 615 825 1448 774 1053 1966 1062 72 hours Average 6739 7793 7103 -1023 11068 10687 17817 17334 14109 18723 Sdev 1487 218 868 682 502 1298 805 996 2151 1247
Page 15 of 76
Figure 1. SCAP Cell Migration at 30 Minutes.
Figure 1. SCAP Cell Migration at 30 Minutes Figure 2. SCAP Cell Migration at 60 Minutes. No SS difference found with cells seeded in plain medium, a P≤ 0.05 compared with all groups, b P≤ 0.05 compared with 1hr MTA 2% FBS.
0
2000
4000
6000
8000
10000
12000
14000
16000
18000
20000
30 mins
Rel
ativ
e F
luo
resc
ence
Un
its
Time
SCAP Cell Migration 30 Minutes
Plain
1hr MTA Plain
24hr MTA Plain
1hr MTA 2% FBS
24hr MTA 2% FBS
2 % FBS
10% FBS
0
2000
4000
6000
8000
10000
12000
14000
16000
18000
20000
60 Mins
Rel
ativ
e F
luo
resc
ence
Un
its
Time
SCAP Cell Migration 60 Minutes
Plain
1hr MTA Plain
24hr MTA Plain
1hr MTA 2% FBS
24hr MTA 2% FBS
2 % FBS
10% FBS
b b
a
Page 16 of 76
Figure 3. SCAP Cell Migration at 3 Hours. No SS difference found with cells seeded in plain medium, a P≤ 0.05 compared with all groups.
Figure 4. SCAP Cell Migration at 6 Hours. There was a SS difference in migration when the cells were seeded with WMTA 1h or 24h in plain medium. a P≤ 0.05 compared with Plain control.
0
2000
4000
6000
8000
10000
12000
14000
16000
18000
20000
3 Hours
Rel
ativ
e F
luo
resc
ence
Un
its
Time
SCAP Cell Migration 3 Hours
Plain
1hr MTA Plain
24hr MTA Plain
1hr MTA 2% FBS
24hr MTA 2% FBS
2 % FBS
10% FBS
0
2000
4000
6000
8000
10000
12000
14000
16000
18000
20000
6 Hours
Rel
ativ
e F
luo
resc
ence
Un
its
Time
SCAP Cell Migration 6 Hours
Plain
1hr MTA Plain
24hr MTA Plain
1hr MTA 2% FBS
24hr MTA 2% FBS
2 % FBS
10% FBS
a
a a
Page 17 of 76
Figure 5. SCAP Cell Migration at 12 Hours. No SS difference found with cells seeded in plain medium,* P≤ 0.05 for all FBS groups compared with Plain control.
Figure 6. SCAP Cell Migration at 24 Hours. No SS difference found with cells seeded in plain medium, a P≤ 0.05 compared with 10% FBS, * P≤ 0.05 for all FBS groups compared with Plain control.
0
2000
4000
6000
8000
10000
12000
14000
16000
18000
20000
12 Hours
Rel
ativ
e F
luo
resc
ence
Un
its
Time
SCAP Cell Migration 12 Hours
Plain
1hr MTA Plain
24hr MTA Plain
1hr MTA 2% FBS
24hr MTA 2% FBS
2 % FBS
10% FBS
0
2000
4000
6000
8000
10000
12000
14000
16000
18000
20000
24 Hours
Rel
ativ
e F
luo
resc
ence
Un
its
Time
SCAP Cell Migration 24 Hours
Plain
1hr MTA Plain
24hr MTA Plain
1hr MTA 2% FBS
24hr MTA 2% FBS
2 % FBS
10% FBS
a, *
* * *
*
* *
*
Page 18 of 76
Figure 7. SCAP Cell Migration at 48 Hours. No SS difference found with cells seeded in plain medium, a P≤ 0.05 compared with 10% FBS, * P≤ 0.05 for all FBS groups compared with Plain control.
Figure 8. SCAP Cell Migration at 72 Hours. No SS difference found with cells seeded in plain medium, a P≤ 0.05 compared with 2% FBS, * P≤ 0.05 for all FBS groups compared with Plain control.
0
2000
4000
6000
8000
10000
12000
14000
16000
18000
20000
48 Hours
Rel
ativ
e F
luo
resc
ence
Un
its
Time
SCAP Cell Migration 48 Hours
Plain
1hr MTA Plain
24hr MTA Plain
1hr MTA 2% FBS
24hr MTA 2% FBS
2 % FBS
10% FBS
0
2000
4000
6000
8000
10000
12000
14000
16000
18000
20000
72 Hours
Rel
ativ
e F
luo
resc
ence
Un
its
Time
SCAP Cell Migration 72 Hours
Plain
1hr MTA Plain
24hr MTA Plain
1hr MTA 2% FBS
24hr MTA 2% FBS
2 % FBS
10% FBS
a, * a, *
a, * a, *
* *
* *
Page 19 of 76
Chapter 3 – SCAP CELL PROLIFERATION
To determine whether WMTA induces proliferation of SCAP cells, a WST-1
proliferation assay was used. The SCAP cells were challenged with 1 or 24 hour set
WMTA and as control groups plain or 10% FBS medium were used starting from 1 day
up to 14 days of exposure.
Materials and Methods
WST-1 Proliferation Assay
SCAP cell proliferation was evaluated after exposure to 1h or 24 hr set WMTA in plain
or 2% FBS medium by WST-1 proliferation assay method. The media from a T-75 flask
containing passage 4 SCAP cells at 80% confluence was removed by vacuum pipetting
and the cells were harvested by adding 3ml of 0.025% Trypsin-EDTA to the flask and
incubating it for 5 minutes until the cells detached from the flask and were visualized
floating in the media. Five milliliters of 10% FBS media was added to inactivate the
Trypsin-EDTA. The contents of the flask were transferred to a 15ml conical tube (BD
Falcon, San Jose, CA) and centrifuged for 5 minutes at 1000 RPM at 4ºC. The media was
removed via vacuum pipetting and the pellet of cells was re-suspended in 5ml of plain
media. Cells were counted using a hemocytometer with the sample created by placing
100µl of re-suspended cells in 900µl of plain media into a 2ml Eppendorf tube. 4x10³
cells were seeded into 12 well companion plates (BD Falcon, San Jose, CA) with 1.5ml
of media in the following test conditions: 3 sets of 3 wells containing plain media, 3 sets
of 3 wells containing 2% FBS media, 1 set of 3 wells containing 3.0 mmol Ca media, 1
set of 3 wells containing 0.3 mmol Ca media, 1 set of 3 wells containing 0.03 mmol Ca
Page 20 of 76
media, and 1 set of 3 wells containing 10% FBS media. Cell culture transwell inserts, 3-
µm-size pore (BD Falcon, San Jose, CA), were placed into each well. Two WMTA
pellets were placed into the transwell inserts of the test groups as follows: plain media
with 1 hour set WMTA, plain media with 24 hour set WMTA, 2% FBS media with 1
hour set WMTA, and 2% FBS media with 24 hour set WMTA. The plates were
incubated at 37ºC in 5% CO2 and 100% humidity and the media changed every 3 days.
The plates were evaluated at 1, 3, 5, 7, 9, 11 and 14 days via WST-1 Proliferation Assay.
The WST-1 proliferation assay was performed as follows: the transwell inserts
were removed and discarded, the media was removed via vacuum pipetting and 300µl of
new media containing 30µl of WST-1 reagent (Roche, Mannheim, Germany) (1:10
dilution) was added to each well. The plates were incubated at 37ºC in 5% CO2 and 100%
humidity for 1 hour. One-hundred microliters of media plus WST-1 reagent was
transferred from each well in the 12 well plate to a single well in a 96 well plate.
Controls of WST-1 reagent in a 1:10 dilution with plain, 2% FBS, and 10% FBS media
were also placed in wells of the 96 well plate. The absorbance (450mm-685mm) was
determined in a microplate reader (Genius; Tecan, Grödig, Austria). This experiment
was repeated 3 times in triplicate.
Results
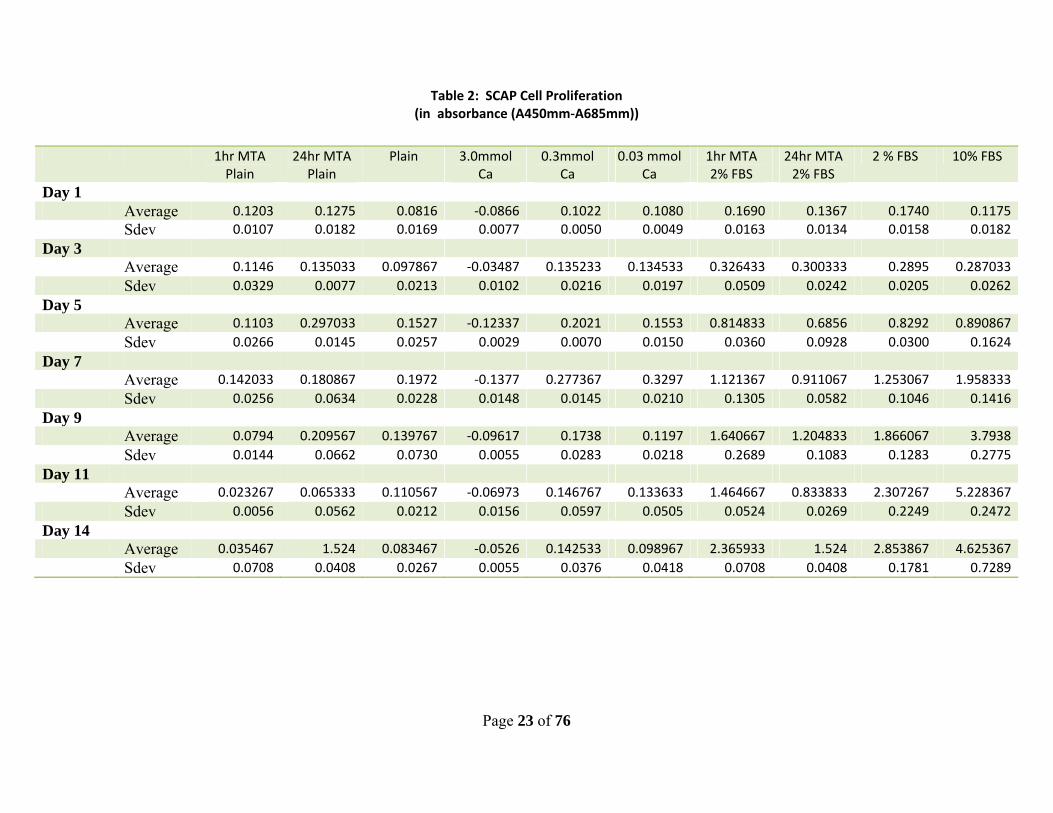
WMTA Significantly Increased SCAP Cell Proliferation after 1 and 5 Days of
exposure.
The results for the WST-1 proliferation assay are described in absorbance (A450mm-
A685mm) and are listed in Table 2. After 1 day, both 1 and 24 hour set WMTA in plain
Page 21 of 76
media showed a significant increase SCAP proliferation as compared to the plain media
control (P = 0.023 and P = 0.008, respectively). In the FBS media group, a significant
increase in proliferation was seen in both the 1 hour set WMTA with 2% FBS (P =
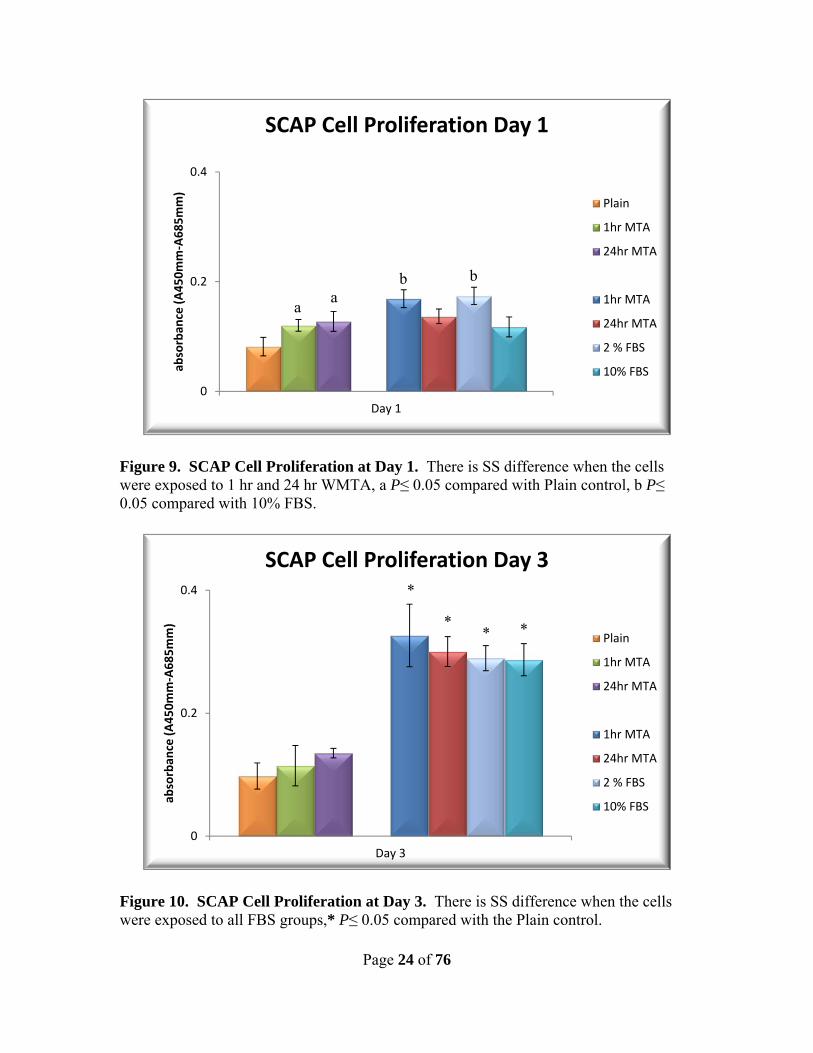
0.018) and the 2% FBS media group (P = 0.011, Figure 9). There were no significant
differences between any groups on day 3 reading (Figure 10). A significant increase in
proliferation was seen in the 24 hour set WMTA with plain media group as compared to
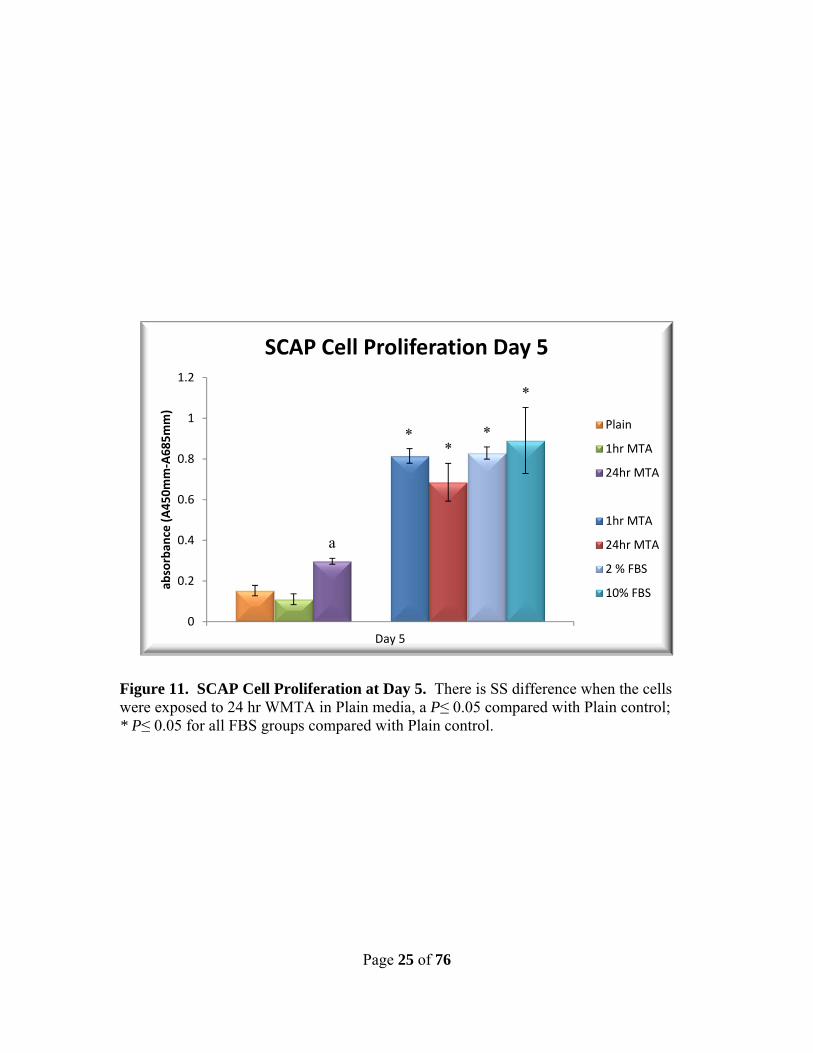
the plain media control on day 5 reading (P = 0.023, Figure 11). No significant
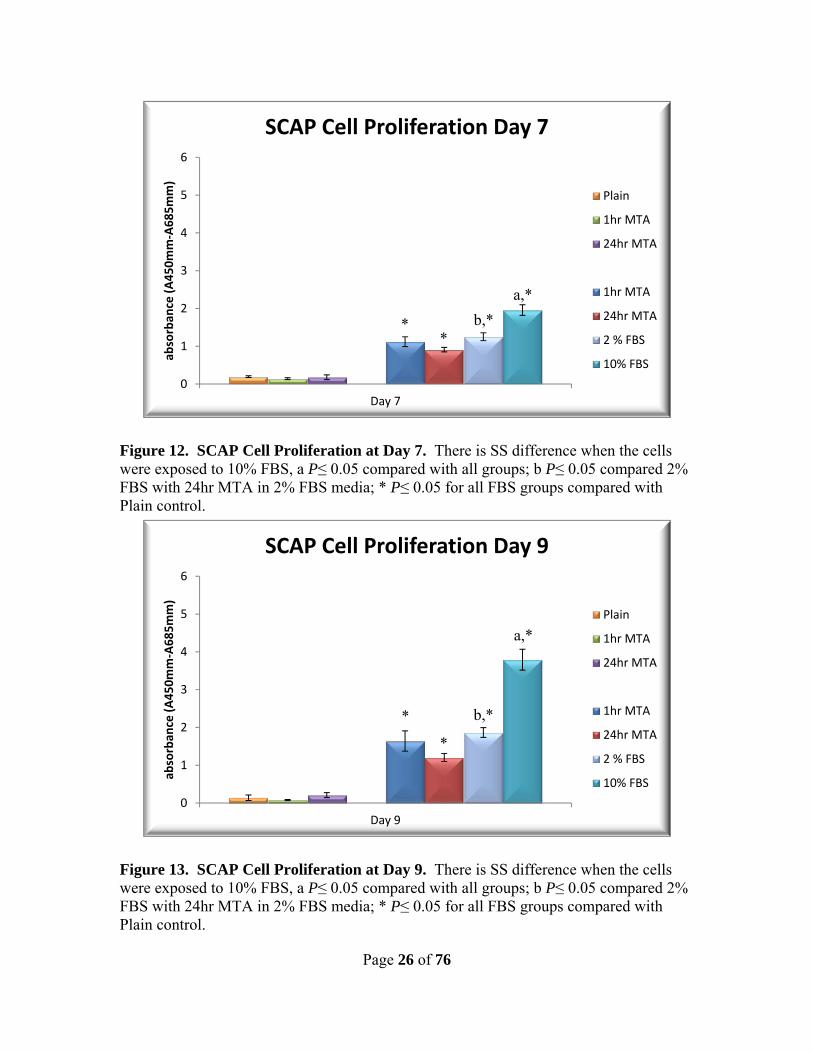
differences were seen between any of the plain media groups at both the 7 and 9 day
readings, however the 2% FBS group showed increased proliferation as compared to the
24 hour set WMTA with 2% FBS group (P = <0.025). The 10% FBS group had
significantly increased SCAP cell proliferation when compared to all other groups (P =
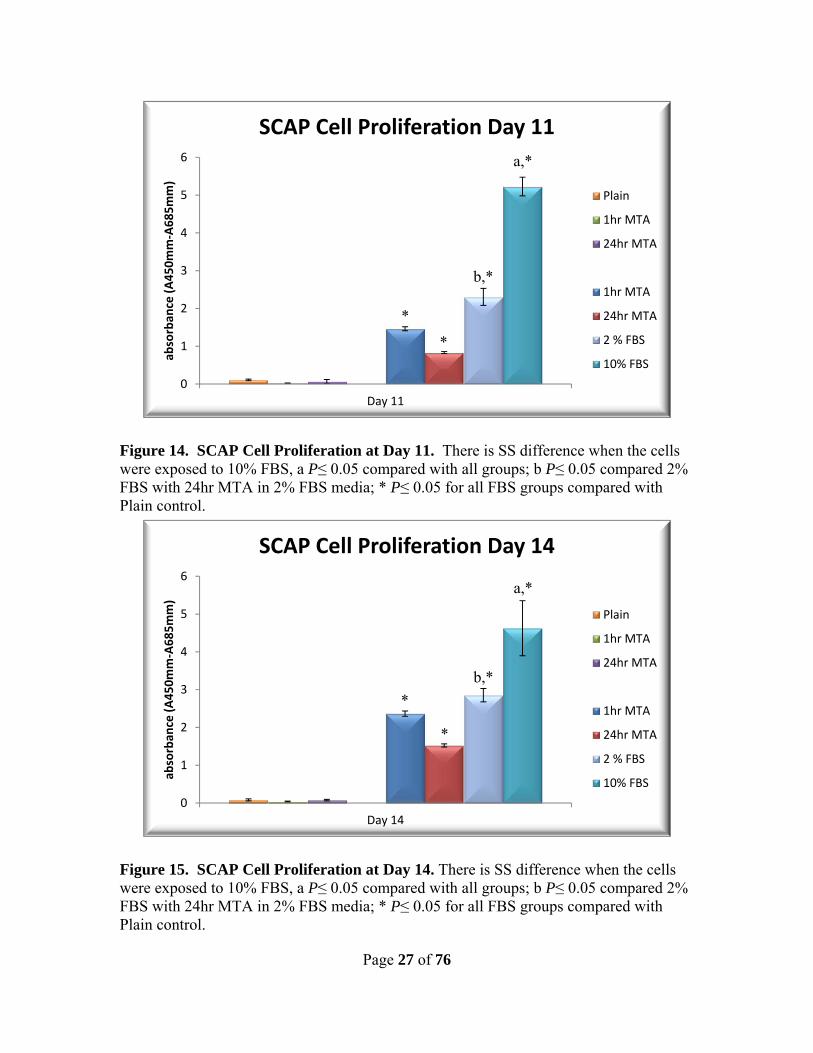
<0.001, Figures 12 & 13). At the 11 day reading no differences were seen in any of the
plain media groups. In the FBS media groups, all groups showed significantly increased
proliferation to 24 hour set WMTA with 2% FBS group (P = <0.008). The 2% FBS
media group showed a significant increase as compared to 24 hour set WMTA with 2%
FBS group (P = <0.001), but significantly less proliferation as compared to the 10% FBS
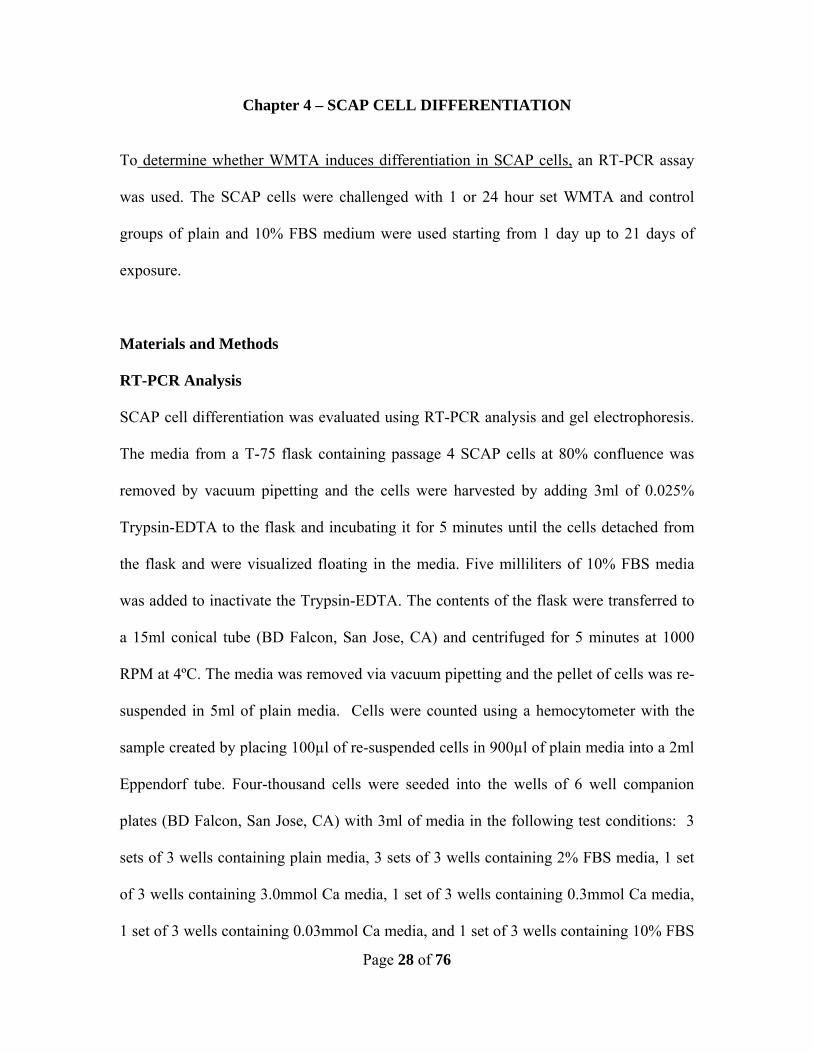
group (P = <0.001, Figure 14). The 2% FBS group showed increased proliferation as
compared to the 24 hour set WMTA with 2% FBS group (P = 0.011) and the 10% FBS
group had significantly increased SCAP cell proliferation when compared to all other
groups (P = <0.002) at the 14 day reading. There were no differences seen in the plain
media groups (Figure 15).
In Summary we found that SCAP cells exposed to 1 h or 24 h set WMTA in Plain
medium showed a statistically significant difference in proliferation after 1 and 5 days of

Page 22 of 76
exposure. The 10% FBS group showed a constant increase in proliferation over time after
3 days of exposure.
Page 23 of 76
Table 2: SCAP Cell Proliferation (in absorbance (A450mm-A685mm))
1hr MTA Plain
24hr MTA Plain
Plain 3.0mmol Ca
0.3mmol Ca
0.03 mmol Ca
1hr MTA 2% FBS
24hr MTA 2% FBS
2 % FBS 10% FBS
Day 1 Average 0.1203 0.1275 0.0816 -0.0866 0.1022 0.1080 0.1690 0.1367 0.1740 0.1175 Sdev 0.0107 0.0182 0.0169 0.0077 0.0050 0.0049 0.0163 0.0134 0.0158 0.0182 Day 3 Average 0.1146 0.135033 0.097867 -0.03487 0.135233 0.134533 0.326433 0.300333 0.2895 0.287033 Sdev 0.0329 0.0077 0.0213 0.0102 0.0216 0.0197 0.0509 0.0242 0.0205 0.0262 Day 5 Average 0.1103 0.297033 0.1527 -0.12337 0.2021 0.1553 0.814833 0.6856 0.8292 0.890867 Sdev 0.0266 0.0145 0.0257 0.0029 0.0070 0.0150 0.0360 0.0928 0.0300 0.1624 Day 7 Average 0.142033 0.180867 0.1972 -0.1377 0.277367 0.3297 1.121367 0.911067 1.253067 1.958333 Sdev 0.0256 0.0634 0.0228 0.0148 0.0145 0.0210 0.1305 0.0582 0.1046 0.1416 Day 9 Average 0.0794 0.209567 0.139767 -0.09617 0.1738 0.1197 1.640667 1.204833 1.866067 3.7938 Sdev 0.0144 0.0662 0.0730 0.0055 0.0283 0.0218 0.2689 0.1083 0.1283 0.2775 Day 11 Average 0.023267 0.065333 0.110567 -0.06973 0.146767 0.133633 1.464667 0.833833 2.307267 5.228367 Sdev 0.0056 0.0562 0.0212 0.0156 0.0597 0.0505 0.0524 0.0269 0.2249 0.2472 Day 14 Average 0.035467 1.524 0.083467 -0.0526 0.142533 0.098967 2.365933 1.524 2.853867 4.625367 Sdev 0.0708 0.0408 0.0267 0.0055 0.0376 0.0418 0.0708 0.0408 0.1781 0.7289
Page 24 of 76
Figure 9. SCAP Cell Proliferation at Day 1. There is SS difference when the cells were exposed to 1 hr and 24 hr WMTA, a P≤ 0.05 compared with Plain control, b P≤ 0.05 compared with 10% FBS.
Figure 10. SCAP Cell Proliferation at Day 3. There is SS difference when the cells were exposed to all FBS groups,* P≤ 0.05 compared with the Plain control.
0
0.2
0.4
Day 1
abso
rban
ce (A
450m
m-A
685m
m)
SCAP Cell Proliferation Day 1
Plain
1hr MTA
24hr MTA
1hr MTA
24hr MTA
2 % FBS
10% FBS
0
0.2
0.4
Day 3
abso
rban
ce (A
450m
m-A
685m
m)
SCAP Cell Proliferation Day 3
Plain
1hr MTA
24hr MTA
1hr MTA
24hr MTA
2 % FBS
10% FBS
a a
b b
*
* * *
Page 25 of 76
Figure 11. SCAP Cell Proliferation at Day 5. There is SS difference when the cells were exposed to 24 hr WMTA in Plain media, a P≤ 0.05 compared with Plain control; * P≤ 0.05 for all FBS groups compared with Plain control.
0
0.2
0.4
0.6
0.8
1
1.2
Day 5
abso
rban
ce (A
450m
m-A
685m
m)
SCAP Cell Proliferation Day 5
Plain
1hr MTA
24hr MTA
1hr MTA
24hr MTA
2 % FBS
10% FBS
a
* *
*
*
Page 26 of 76
Figure 12. SCAP Cell Proliferation at Day 7. There is SS difference when the cells were exposed to 10% FBS, a P≤ 0.05 compared with all groups; b P≤ 0.05 compared 2% FBS with 24hr MTA in 2% FBS media; * P≤ 0.05 for all FBS groups compared with Plain control.
Figure 13. SCAP Cell Proliferation at Day 9. There is SS difference when the cells were exposed to 10% FBS, a P≤ 0.05 compared with all groups; b P≤ 0.05 compared 2% FBS with 24hr MTA in 2% FBS media; * P≤ 0.05 for all FBS groups compared with Plain control.
0
1
2
3
4
5
6
Day 7
abso
rban
ce (A
450m
m-A
685m
m)
SCAP Cell Proliferation Day 7
Plain
1hr MTA
24hr MTA
1hr MTA
24hr MTA
2 % FBS
10% FBS
0
1
2
3
4
5
6
Day 9
abso
rban
ce (A
450m
m-A
685m
m)
SCAP Cell Proliferation Day 9
Plain
1hr MTA
24hr MTA
1hr MTA
24hr MTA
2 % FBS
10% FBS
a,* b,*
a,*
b,*
* *
*
*
Page 27 of 76
Figure 14. SCAP Cell Proliferation at Day 11. There is SS difference when the cells were exposed to 10% FBS, a P≤ 0.05 compared with all groups; b P≤ 0.05 compared 2% FBS with 24hr MTA in 2% FBS media; * P≤ 0.05 for all FBS groups compared with Plain control.
Figure 15. SCAP Cell Proliferation at Day 14. There is SS difference when the cells were exposed to 10% FBS, a P≤ 0.05 compared with all groups; b P≤ 0.05 compared 2% FBS with 24hr MTA in 2% FBS media; * P≤ 0.05 for all FBS groups compared with Plain control.
0
1
2
3
4
5
6
Day 11
abso
rban
ce (A
450m
m-A
685m
m)
SCAP Cell Proliferation Day 11
Plain
1hr MTA
24hr MTA
1hr MTA
24hr MTA
2 % FBS
10% FBS
0
1
2
3
4
5
6
Day 14
abso
rban
ce (A
450m
m-A
685m
m)
SCAP Cell Proliferation Day 14
Plain
1hr MTA
24hr MTA
1hr MTA
24hr MTA
2 % FBS
10% FBS
a,*
b,*
a,*
b,*
* *
*
*
Page 28 of 76
Chapter 4 – SCAP CELL DIFFERENTIATION
To determine whether WMTA induces differentiation in SCAP cells, an RT-PCR assay
was used. The SCAP cells were challenged with 1 or 24 hour set WMTA and control
groups of plain and 10% FBS medium were used starting from 1 day up to 21 days of
exposure.
Materials and Methods
RT-PCR Analysis
SCAP cell differentiation was evaluated using RT-PCR analysis and gel electrophoresis.
The media from a T-75 flask containing passage 4 SCAP cells at 80% confluence was
removed by vacuum pipetting and the cells were harvested by adding 3ml of 0.025%
Trypsin-EDTA to the flask and incubating it for 5 minutes until the cells detached from
the flask and were visualized floating in the media. Five milliliters of 10% FBS media
was added to inactivate the Trypsin-EDTA. The contents of the flask were transferred to
a 15ml conical tube (BD Falcon, San Jose, CA) and centrifuged for 5 minutes at 1000
RPM at 4ºC. The media was removed via vacuum pipetting and the pellet of cells was re-
suspended in 5ml of plain media. Cells were counted using a hemocytometer with the
sample created by placing 100µl of re-suspended cells in 900µl of plain media into a 2ml
Eppendorf tube. Four-thousand cells were seeded into the wells of 6 well companion
plates (BD Falcon, San Jose, CA) with 3ml of media in the following test conditions: 3
sets of 3 wells containing plain media, 3 sets of 3 wells containing 2% FBS media, 1 set
of 3 wells containing 3.0mmol Ca media, 1 set of 3 wells containing 0.3mmol Ca media,
1 set of 3 wells containing 0.03mmol Ca media, and 1 set of 3 wells containing 10% FBS
Page 29 of 76
media. Three micrometer-size pore transwell cell culture inserts (BD Falcon, San Jose,
CA) were placed into each well. Three WMTA pellets were placed into the transwell
inserts of the test groups as follows: plain media with 1 hour set WMTA, plain media
with 24 hour set WMTA, 2% FBS media with 1 hour set WMTA, and 2% FBS media
with 24 hour set WMTA. The plates were incubated at 37ºC in 5% CO2 and 100%
humidity and the media changed every 3 days. The plates were evaluated at 7, 14 and 21
days via RT-PCR Analysis.
The RNA isolation was performed with the use of an RNeasy Mini Kit (Qiagen,
Valencia, CA) The media was removed from all wells in the 6 well plate by vacuum
pipetting and the cells were harvested by adding 200µl of freshly mixed RLT lysis buffer
(15ml RLT lysis buffer + 150µl 2-merceptoethanol) to each well and vigorously scraping
with a cell scraper (Corning Inc., Corning, NY) for 2 cycles of 2 minutes per well. The
contents of the wells were then agitated by gentle pipetting and transfered to a collection
tube supplied in the kit. All 3 wells for each condition were combined into a single
collection tube (600µl total volume). The collected sample was placed in a QIAshredder
(Qiagen, Valencia, CA) and centrifuged at 13,000 RPM for 2 minutes at 4ºC. The
QIAshredder insert was discarded and 600µl of 70% alcohol was added to the tube. Half
of the sample was placed in a Mini Spin Column from the RNeasy kit and centrifuged at
13,000 RPM for 2 minutes at 4ºC. The remaining sample was passed through the same
Mini Spin Column. The solution that passed into the collection tube was discarded and
700µl of Buffer RW1 was adding to the Mini Spin Column and centrifuged at 13,000
RPM for 15 seconds at 4ºC. The solution that passed into the collection tube was
discarded and 500µl of Buffer RPE was adding to the Mini Spin Column and centrifuged
Page 30 of 76
twice at 13,000 RPM for 15 seconds at 4ºC. The collection tube was discarded. The Mini
Spin Column placed on a new collection tube centrifuged at 13,000 RPM for 2 minutes at
4ºC. The Mini Spin Column was rotated 180° and centrifuged at 13,000 RPM for 1
minute at 4ºC. The Mini Spin Column transferred to a new Eppendorf tube and 35µl of
RNase-Free Water was added to the middle of the Mini Spin Column, which was then
centrifuged at 13,000 RPM for 1 minute at 4ºC. The solution that passed into the
Eppendorf tube was collected by pipette and placed again in the middle of the Mini Spin
Column and centrifuged at 13,000 RPM for 1 minute at 4ºC. The Mini Spin Column was
discarded and the purified RNA sample was contained in the Eppendorf tube. The purity
of the RNA sample was measured on cuvette/spectrophotometer a by placing 1µl of RNA
sample into 100µl of RNase-free water and reading the optical density. Working
solutions were standardized to 100ng for the RT-PCR reactions.
RT-PCR was performed using SuperScript III Platinum kit (Invitrogen Corp.,
Carlsbad, CA). The primer sequences used were as follows: GAPDH (sense 5′
gaccccttcattgacctcaact 3′; antisense 5′ caccaccttcttgatgtcatc 3′; 683-bp amplicon); DSPP
(sense 5′ gaccccttcattgacctcaact 3′, antisense 5′ tgccatttgctgtgatgttt 3′; 181-bp amplicon);
DMP-1 (sense 5′ caggagcacaggaaaaggag 3′, antisense 5′ ctggtggtatcttgggcact 3′; 213-bp
amplicon); and MEPE (sense 5′ gcaaaagcacccatcgtatt 3′, antisense 5′
ctgccctctacaaggctgac 3′; 385-bp amplicon). For each sample, 5µl of 100ng working
solution was placed in a 0.2ml PCR tube with 25µl of 2X Reaction Mix, 2µl sense primer,
2µl anti-sense primer, 1µl Taq enzyme, and 15µl of RNase-free water. The PCR tube
was tightly capped and placed in a Mastercycler gradient machine (Eppendorf North
America, Hauppauge, NY). Polymerase chain reaction (PCR) was performed with 35
Page 31 of 76
cycles of denaturation at 94°C for 45 sec, annealing at 57°C for 45 sec, and extension at
72°C for 60 sec.
The RT-PCR products were evaluated by electrophoresis in 2% agarose gels
stained with ethidiumbromide. The 2% agarose gels were made by combining 2g
UltraPure agarose (Invitrogen Corp., Carlsbad, CA) with 100ml TAE (1X) buffer in a
125ml Erlenmeyer flask and microwaving for 1-1.5 minutes until the solution was clear,
then adding 5µl of ethidiumbromide to the flask and swirling to mix thoroughly. The gel
mixture was then poured into a 15cm x 10 cm Gel Caster (Bio-Rad, Hercules, CA) with a
20 well comb and allowed to set for 45 minutes. Well #1 in each gel was loaded with 5µ
of loading dye and 10µl of 100kb Plus DNA Ladder (Life Technologies, Grand Island,
NY), 15µl of sample and 5µl of dye were loaded into the sample wells. The gels were
connected to a Bio-Rad Power Pak 300 (Bio-Rad, Hercules, CA) and run at 80V for 45
minutes. Gel photographs were taken with a Kodak EDAS 290. A densitometric analysis
was performed using ImageJ software (NIH). This experiment was repeated 3 times in
triplicate.
Results
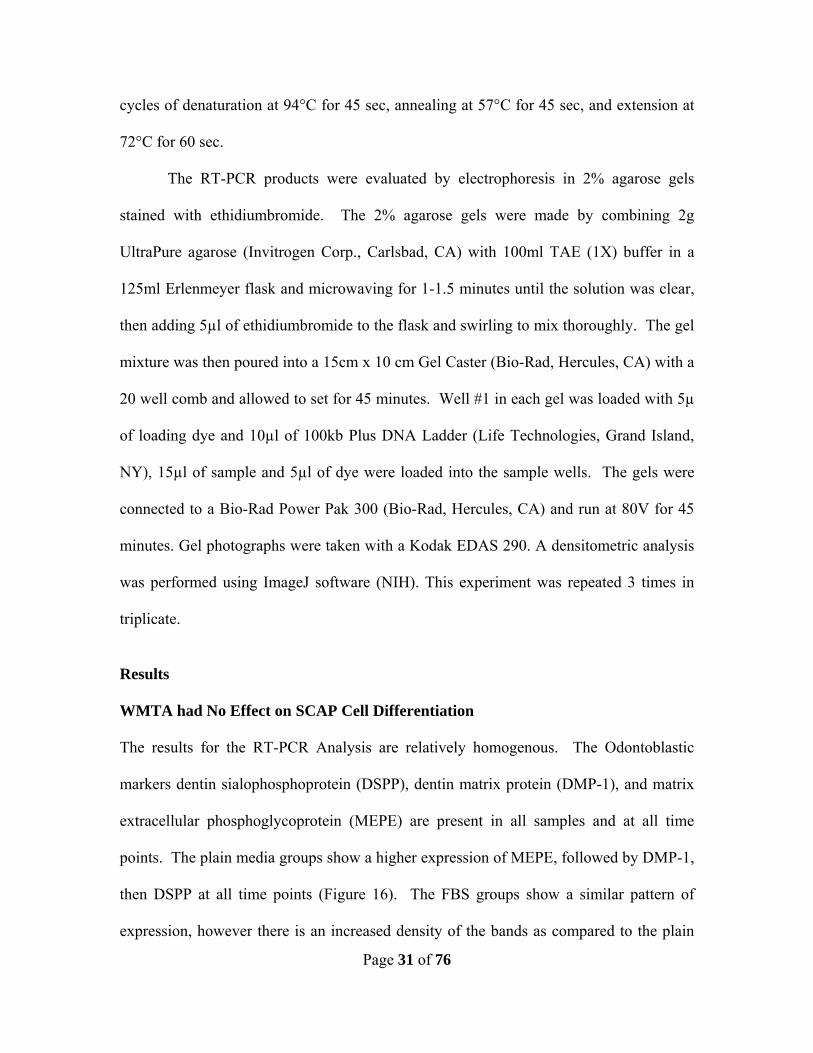
WMTA had No Effect on SCAP Cell Differentiation
The results for the RT-PCR Analysis are relatively homogenous. The Odontoblastic
markers dentin sialophosphoprotein (DSPP), dentin matrix protein (DMP-1), and matrix
extracellular phosphoglycoprotein (MEPE) are present in all samples and at all time
points. The plain media groups show a higher expression of MEPE, followed by DMP-1,
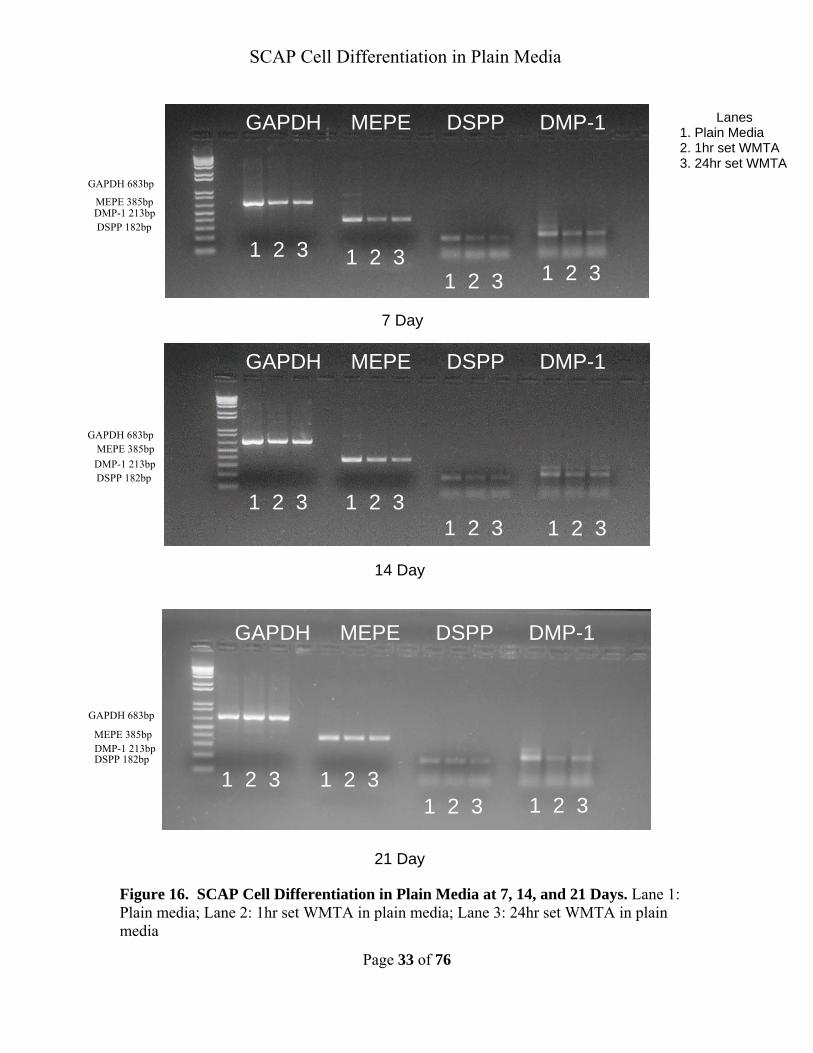
then DSPP at all time points (Figure 16). The FBS groups show a similar pattern of
expression, however there is an increased density of the bands as compared to the plain

Page 32 of 76
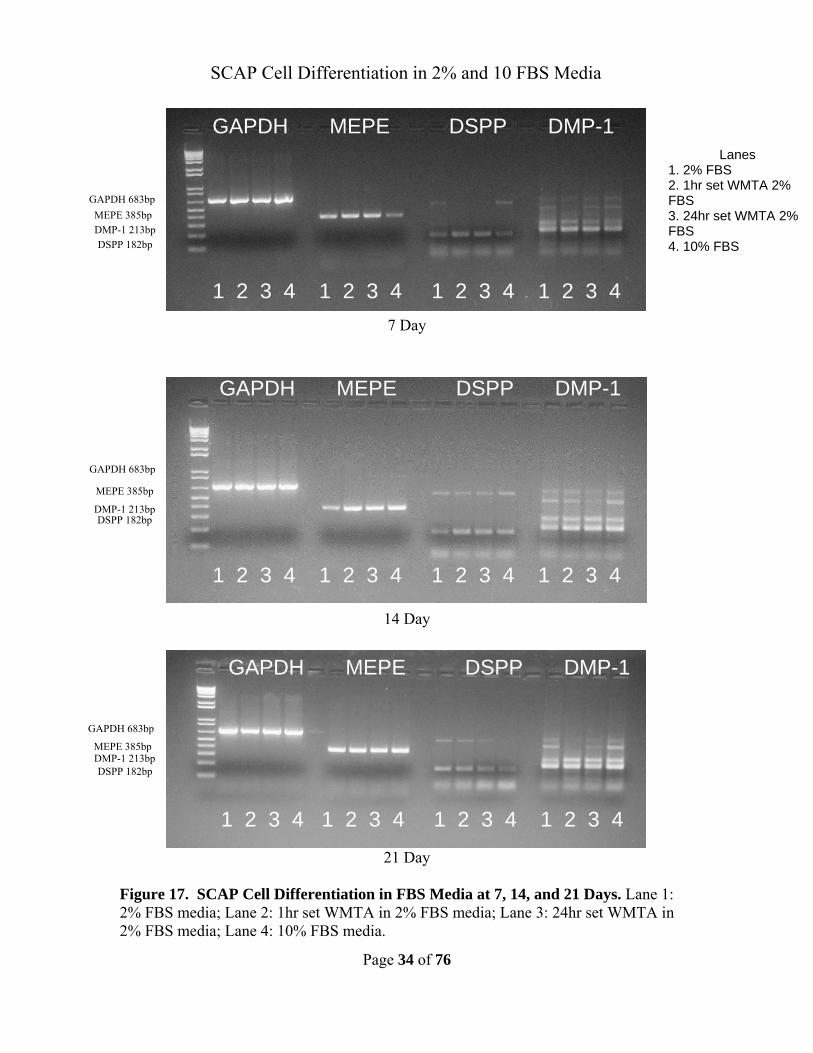
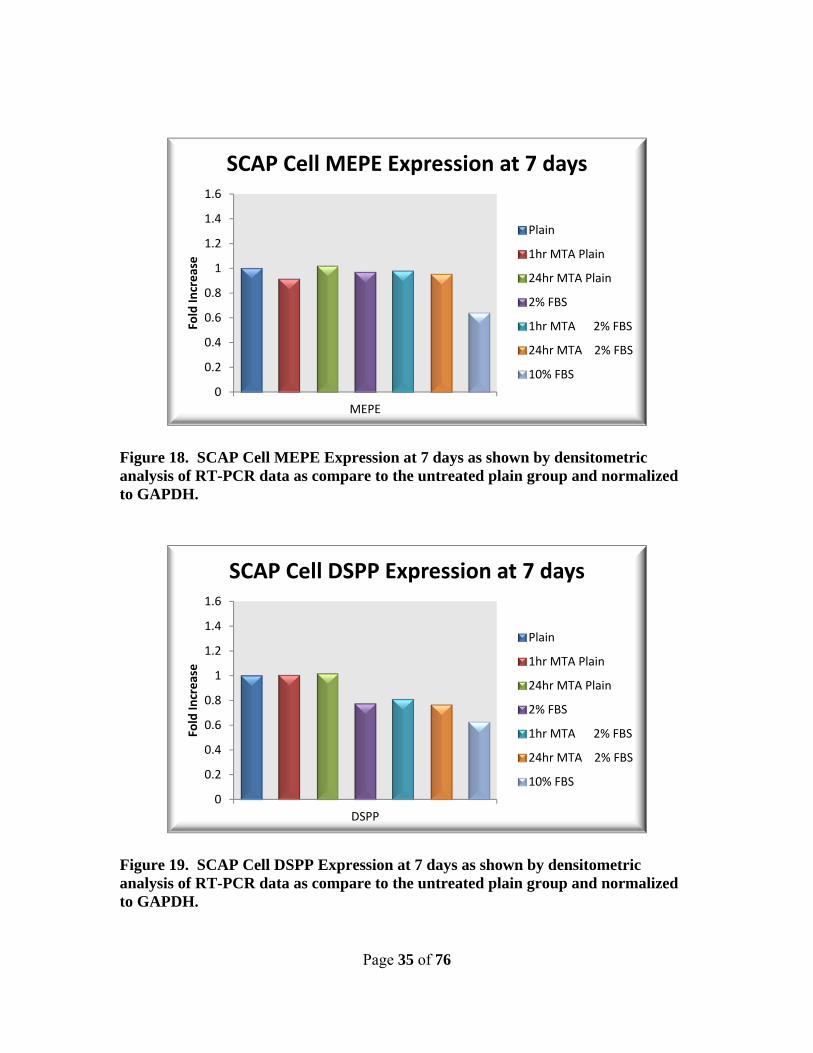
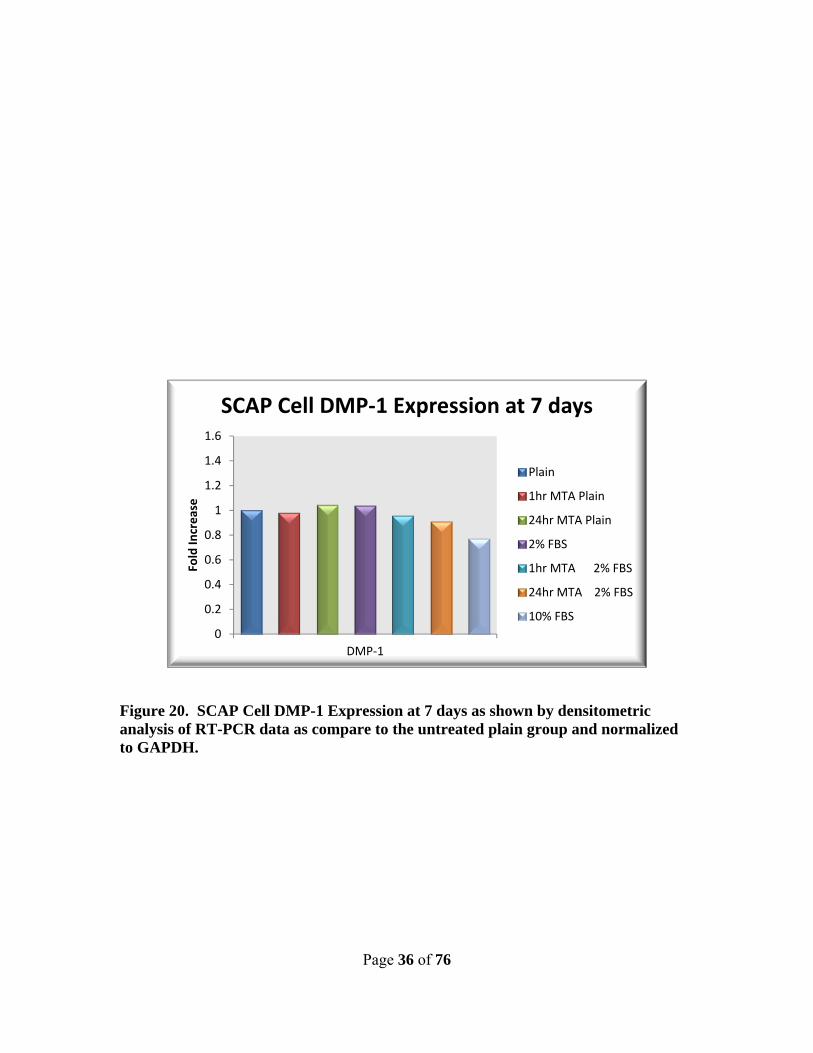
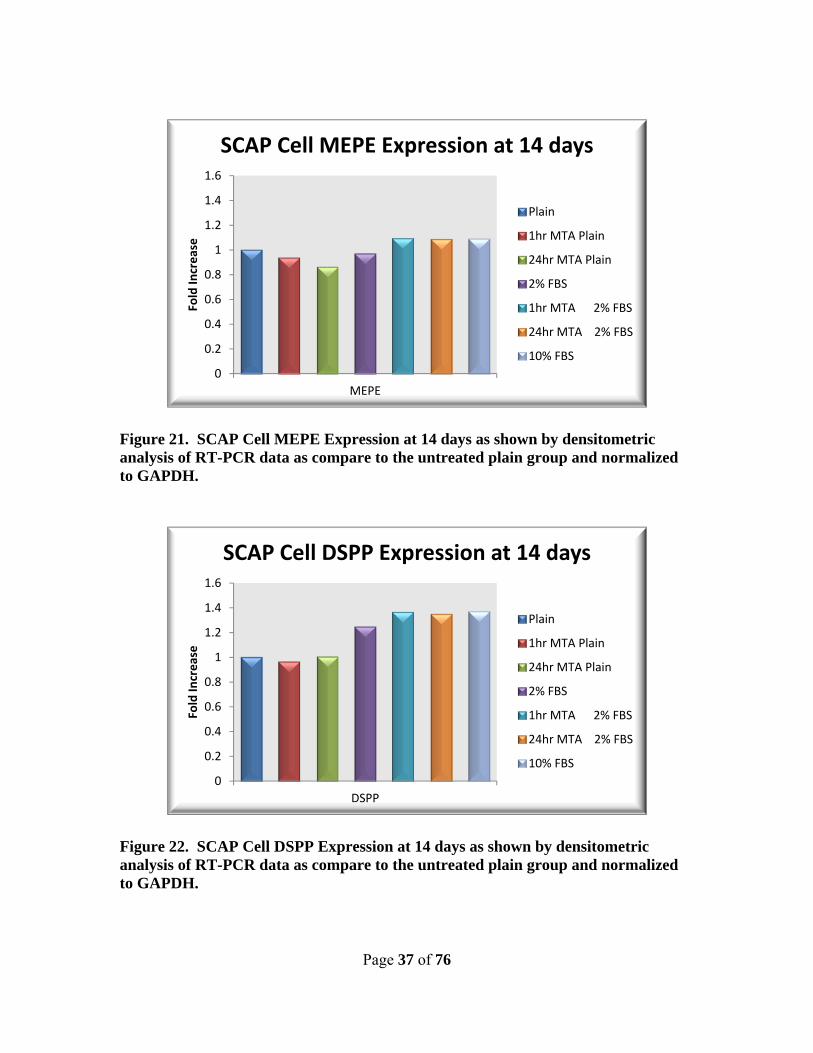
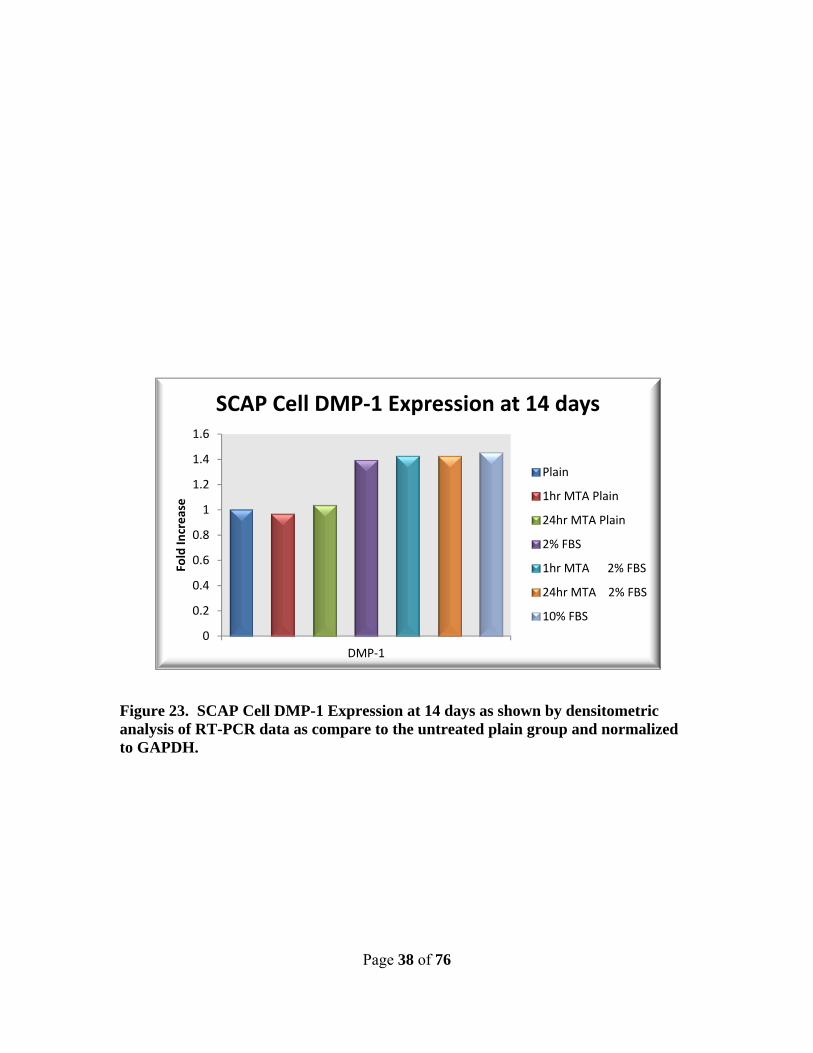
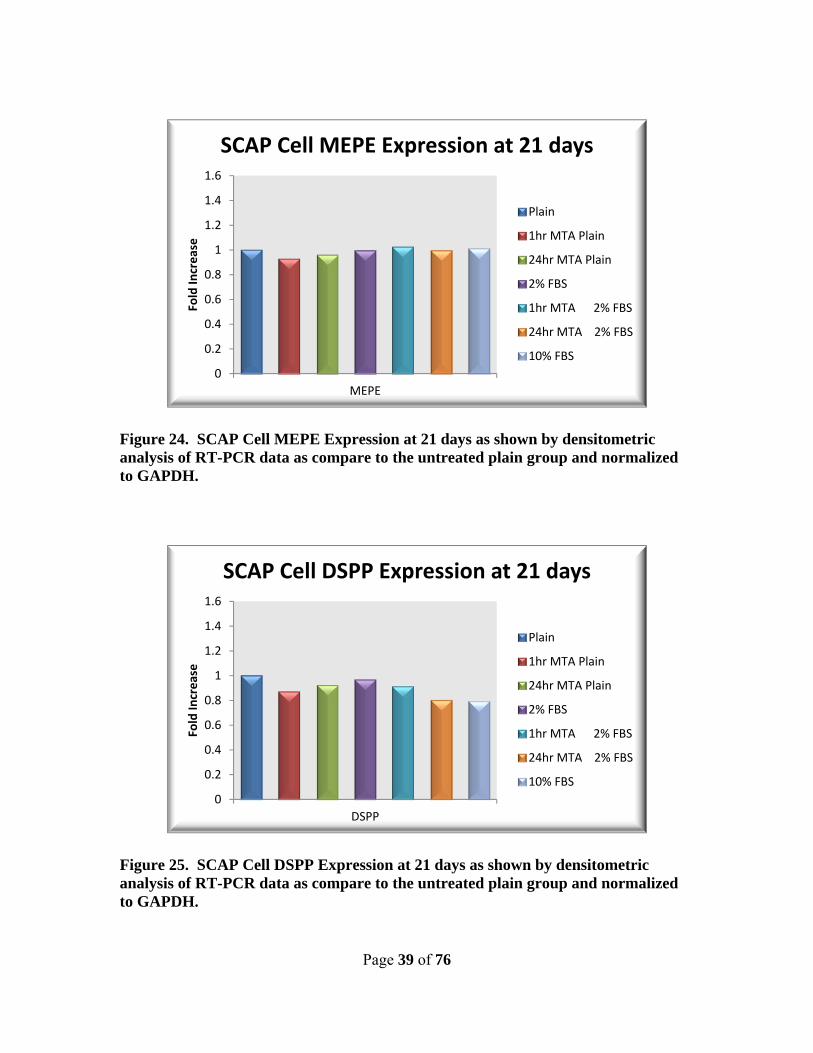
media groups (Figure 17). There was no increase in expression for any marker from the
WMTA groups with either Plain media or FBS media as shown by densiometric analysis
(Figure 18-26).
Page 33 of 76
Figure 16. SCAP Cell Differentiation in Plain Media at 7, 14, and 21 Days. Lane 1: Plain media; Lane 2: 1hr set WMTA in plain media; Lane 3: 24hr set WMTA in plain media
7 Day
14 Day
21 Day
Lanes 1. Plain Media 2. 1hr set WMTA 3. 24hr set WMTA
GAPDH MEPE DSPP DMP-1
SCAP Cell Differentiation in Plain Media
GAPDH MEPE DSPP DMP-1
GAPDH MEPE DSPP DMP-1
1 2 3 1 2 3 1 2 3 1 2 3
1 2 3 1 2 3 1 2 3 1 2 3
1 2 3 1 2 3 1 2 3 1 2 3
DSPP 182bp
DSPP 182bp
DSPP 182bp
DMP-1 213bp MEPE 385bp
GAPDH 683bp
DMP-1 213bp MEPE 385bp
GAPDH 683bp
DMP-1 213bp
GAPDH 683bp
MEPE 385bp
Page 34 of 76
7 Day
14 Day
21 Day
Figure 17. SCAP Cell Differentiation in FBS Media at 7, 14, and 21 Days. Lane 1: 2% FBS media; Lane 2: 1hr set WMTA in 2% FBS media; Lane 3: 24hr set WMTA in 2% FBS media; Lane 4: 10% FBS media.
Lanes 1. 2% FBS 2. 1hr set WMTA 2% FBS 3. 24hr set WMTA 2% FBS 4. 10% FBS
GAPDH MEPE DSPP DMP-1
SCAP Cell Differentiation in 2% and 10 FBS Media
GAPDH MEPE DSPP DMP-1
GAPDH MEPE DSPP DMP-1
1 2 3 4 1 2 3 4 1 2 3 4 1 2 3 4
1 2 3 4 1 2 3 4 1 2 3 4 1 2 3 4
1 2 3 4 1 2 3 4 1 2 3 4 1 2 3 4
DSPP 182bp
GAPDH 683bp
DMP-1 213bp MEPE 385bp
DSPP 182bp
DSPP 182bp
DMP-1 213bp
DMP-1 213bp
MEPE 385bp
MEPE 385bp
GAPDH 683bp
GAPDH 683bp
Page 35 of 76
Figure 18. SCAP Cell MEPE Expression at 7 days as shown by densitometric analysis of RT-PCR data as compare to the untreated plain group and normalized to GAPDH.
Figure 19. SCAP Cell DSPP Expression at 7 days as shown by densitometric analysis of RT-PCR data as compare to the untreated plain group and normalized to GAPDH.
0
0.2
0.4
0.6
0.8
1
1.2
1.4
1.6
MEPE
Fold
Incr
ease
SCAP Cell MEPE Expression at 7 days
Plain
1hr MTA Plain
24hr MTA Plain
2% FBS
1hr MTA 2% FBS
24hr MTA 2% FBS
10% FBS
0
0.2
0.4
0.6
0.8
1
1.2
1.4
1.6
DSPP
Fold
Incr
ease
SCAP Cell DSPP Expression at 7 days
Plain
1hr MTA Plain
24hr MTA Plain
2% FBS
1hr MTA 2% FBS
24hr MTA 2% FBS
10% FBS
Page 36 of 76
Figure 20. SCAP Cell DMP-1 Expression at 7 days as shown by densitometric analysis of RT-PCR data as compare to the untreated plain group and normalized to GAPDH.
0
0.2
0.4
0.6
0.8
1
1.2
1.4
1.6
DMP-1
Fold
Incr
ease
SCAP Cell DMP-1 Expression at 7 days
Plain
1hr MTA Plain
24hr MTA Plain
2% FBS
1hr MTA 2% FBS
24hr MTA 2% FBS
10% FBS
Page 37 of 76
Figure 21. SCAP Cell MEPE Expression at 14 days as shown by densitometric analysis of RT-PCR data as compare to the untreated plain group and normalized to GAPDH.
Figure 22. SCAP Cell DSPP Expression at 14 days as shown by densitometric analysis of RT-PCR data as compare to the untreated plain group and normalized to GAPDH.
0
0.2
0.4
0.6
0.8
1
1.2
1.4
1.6
MEPE
Fold
Incr
ease
SCAP Cell MEPE Expression at 14 days
Plain
1hr MTA Plain
24hr MTA Plain
2% FBS
1hr MTA 2% FBS
24hr MTA 2% FBS
10% FBS
0
0.2
0.4
0.6
0.8
1
1.2
1.4
1.6
DSPP
Fold
Incr
ease
SCAP Cell DSPP Expression at 14 days
Plain
1hr MTA Plain
24hr MTA Plain
2% FBS
1hr MTA 2% FBS
24hr MTA 2% FBS
10% FBS
Page 38 of 76
Figure 23. SCAP Cell DMP-1 Expression at 14 days as shown by densitometric analysis of RT-PCR data as compare to the untreated plain group and normalized to GAPDH.
0
0.2
0.4
0.6
0.8
1
1.2
1.4
1.6
DMP-1
Fold
Incr
ease
SCAP Cell DMP-1 Expression at 14 days
Plain
1hr MTA Plain
24hr MTA Plain
2% FBS
1hr MTA 2% FBS
24hr MTA 2% FBS
10% FBS
Page 39 of 76
Figure 24. SCAP Cell MEPE Expression at 21 days as shown by densitometric analysis of RT-PCR data as compare to the untreated plain group and normalized to GAPDH.
Figure 25. SCAP Cell DSPP Expression at 21 days as shown by densitometric analysis of RT-PCR data as compare to the untreated plain group and normalized to GAPDH.
0
0.2
0.4
0.6
0.8
1
1.2
1.4
1.6
MEPE
Fold
Incr
ease
SCAP Cell MEPE Expression at 21 days
Plain
1hr MTA Plain
24hr MTA Plain
2% FBS
1hr MTA 2% FBS
24hr MTA 2% FBS
10% FBS
0
0.2
0.4
0.6
0.8
1
1.2
1.4
1.6
DSPP
Fold
Incr
ease
SCAP Cell DSPP Expression at 21 days
Plain
1hr MTA Plain
24hr MTA Plain
2% FBS
1hr MTA 2% FBS
24hr MTA 2% FBS
10% FBS
Page 40 of 76
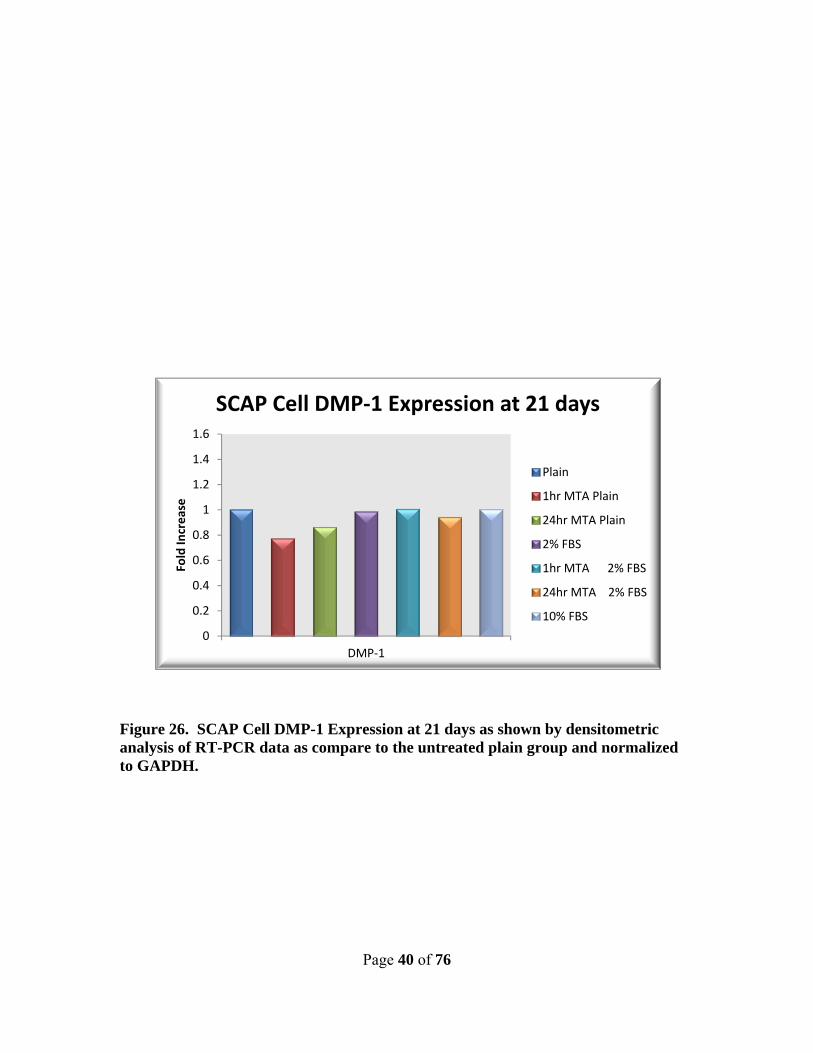
Figure 26. SCAP Cell DMP-1 Expression at 21 days as shown by densitometric analysis of RT-PCR data as compare to the untreated plain group and normalized to GAPDH.
0
0.2
0.4
0.6
0.8
1
1.2
1.4
1.6
DMP-1
Fold
Incr
ease
SCAP Cell DMP-1 Expression at 21 days
Plain
1hr MTA Plain
24hr MTA Plain
2% FBS
1hr MTA 2% FBS
24hr MTA 2% FBS
10% FBS
Page 41 of 76
Chapter 5 – CALCIUM ENRICHED MEDIA
To determine whether calcium enriched medium induces migration, proliferation or
differentiation in SCAP cells, all the assays previously described were used. The SCAP
cells were challenged with 3.0mmol, 0.3mmol, and 0.03mmol free calcium ions and
control groups of plain, 2% FBS, and 10% FBS medium were used.
Materials and Methods
Calcium Enriched Media Preparation
The calcium enriched media was prepared by making a 1M CaCl2 stock solution by
dissolving 5.549g of anhydrous CaCl2 in 50ml of plain α-MEM media. The desired serial
dilutions of 3.0mmol, 0.3mmol, and 0.03mmol free calcium ions were then made by
taking 5µl of 1M stock solution into 5ml of plain α-MEM media to form the 3.0mmol Ca
media. Then 500 µl of the 3.0mmol Ca media was added to 4.5ml of plain α-MEM to
form the 0.3mmol Ca media. Finally, 500 µl of the 0.3mmol Ca media was added to
4.5ml of plain α-MEM to form the 0.03mmol Ca media.
Calcium Enriched Media Experiments
The three previous experiments were all conducted using calcium enriched media as
previously described in each chapter’s Materials and Methods section. The calcium
enriched media was used as an additional experimental condition in each experimental
trial.
Page 42 of 76
Results
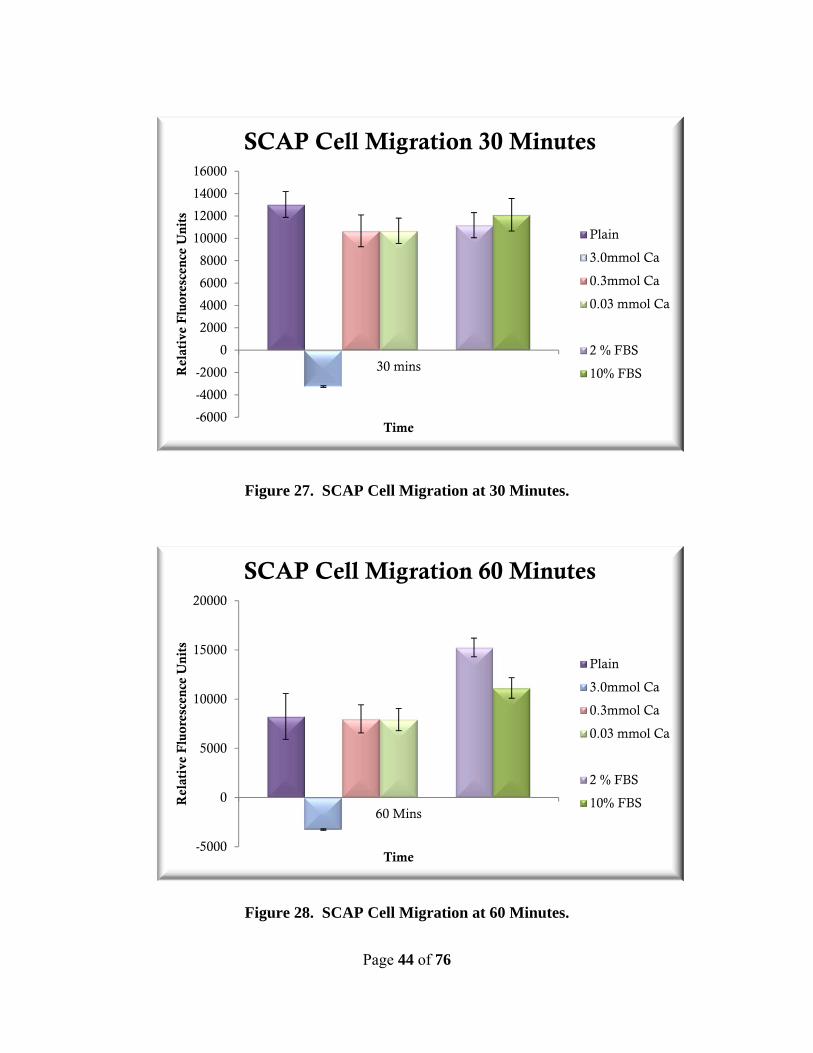
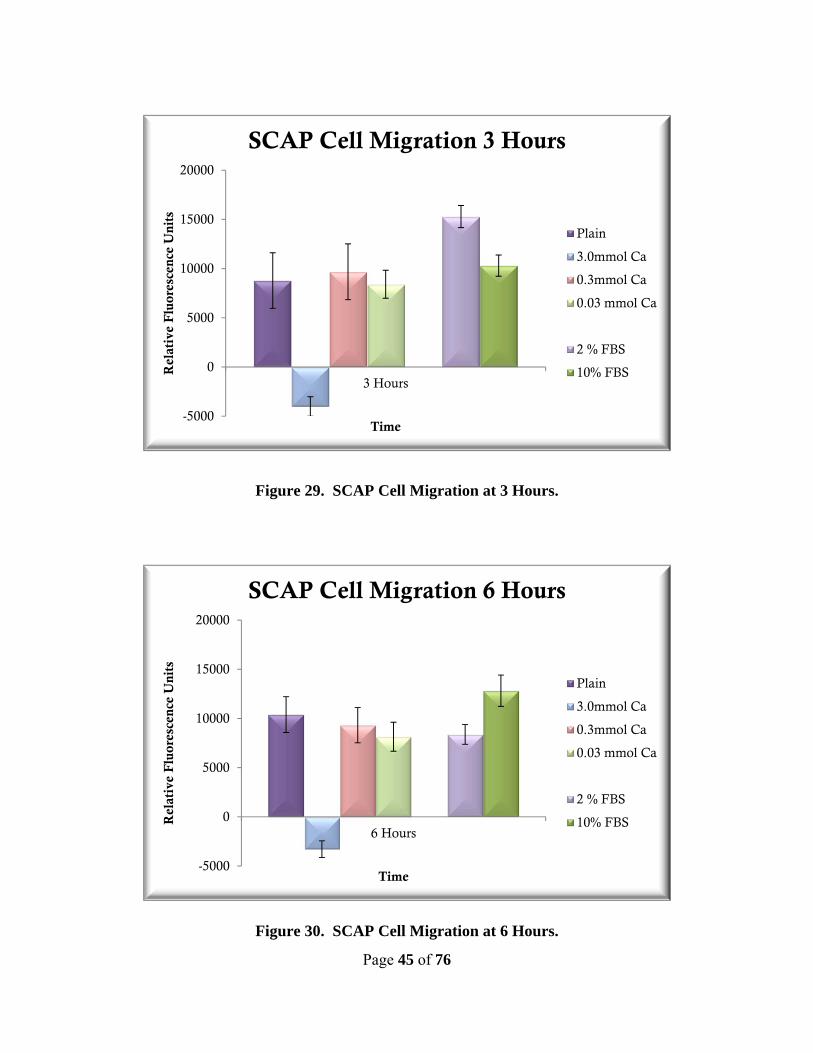
Calcium Enriched Media Significantly Increased SCAP Cell Migration
The results for the Calcium Enriched Media transwell migration assay are described in
relative fluorescence units (RFU) and are listed in Table 1. The 3.0 mmol calcium
enriched media group was cytotoxic and therefore showed no significant migration at any
time point. No significant increase in SCAP cell migration was seen in either the
0.3mmol or 0.03mmol calcium enriched media groups as compared to the plain control
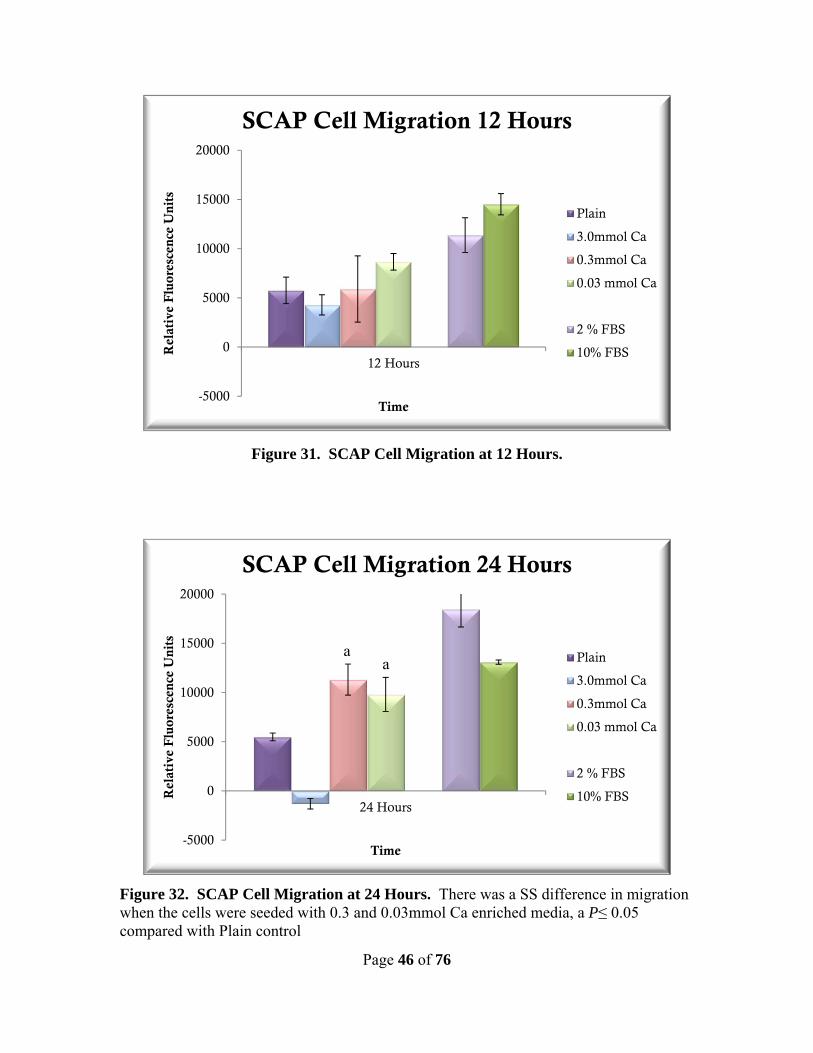
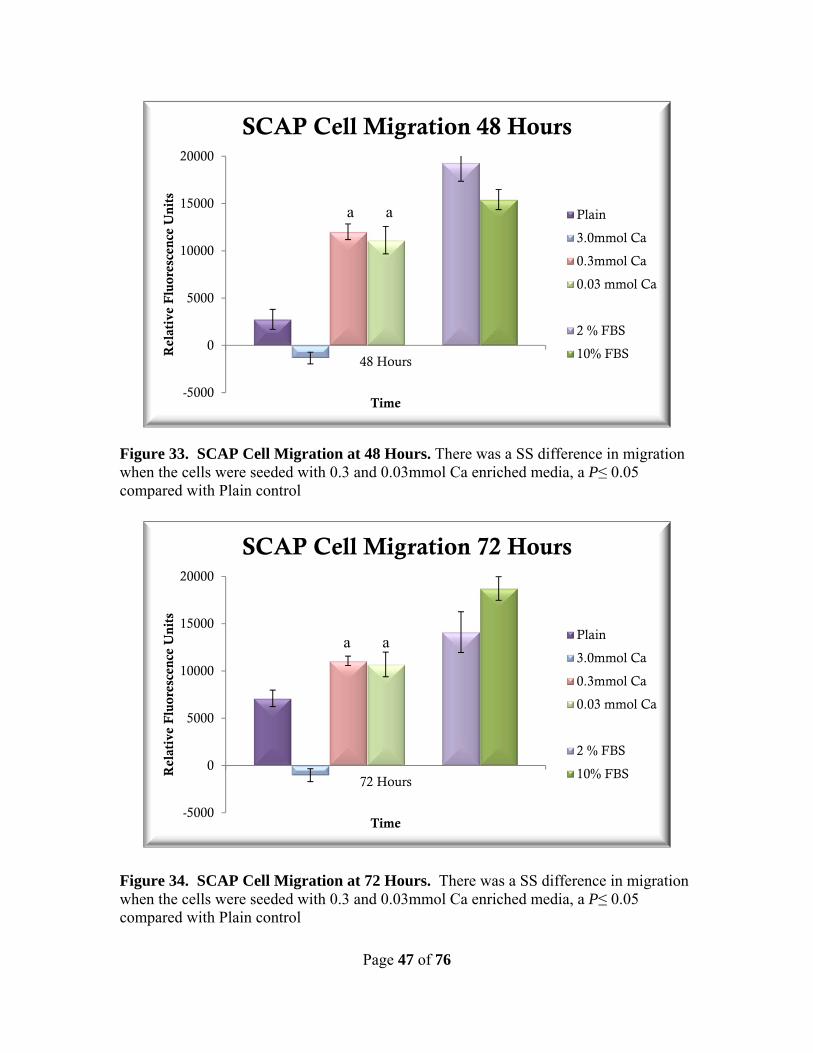
for the time points from 30 minutes to 12 hours (Figures 27-31). The 0.3mmol calcium
enriched media group showed a significant increase in migration starting at 24 hours (P =
0.001, Figure 32), 48 hours (P = <0.001, Figure 33), and 72 hours (P = 0.003, Figure 34).
The 0.03mmol calcium enriched media group also showed a significant increase in SCAP
cell migration starting at 24 hours (P = 0.011, Figure 32), 48 hours (P = <0.001, Figure
33), and 72 hours (P = 0.006, Figure 34).
Calcium Enriched Media Significantly Increased SCAP Cell Proliferation
The results for the Calcium Enriched Media WST-1 proliferation assay are described as
absorbance at (A450mm-A685mm) and are listed in Table 2. The 3.0 mmol calcium
enriched media group was cytotoxic and therefore showed no SCAP cell proliferation at
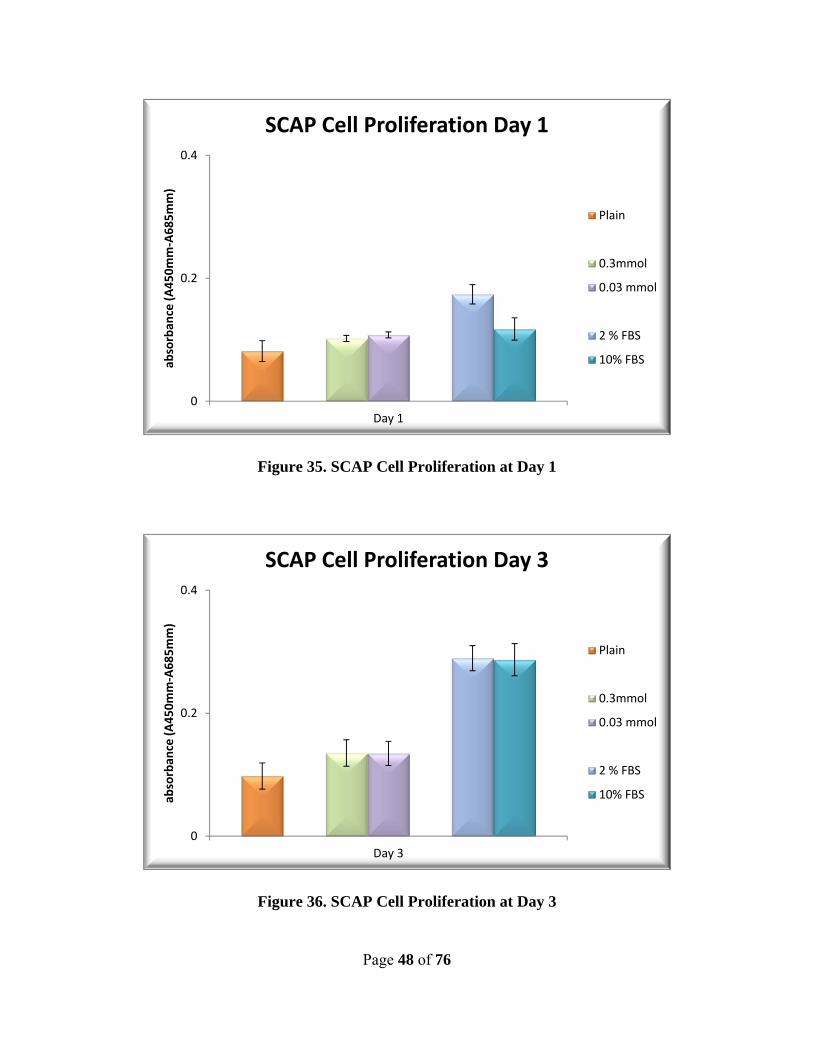
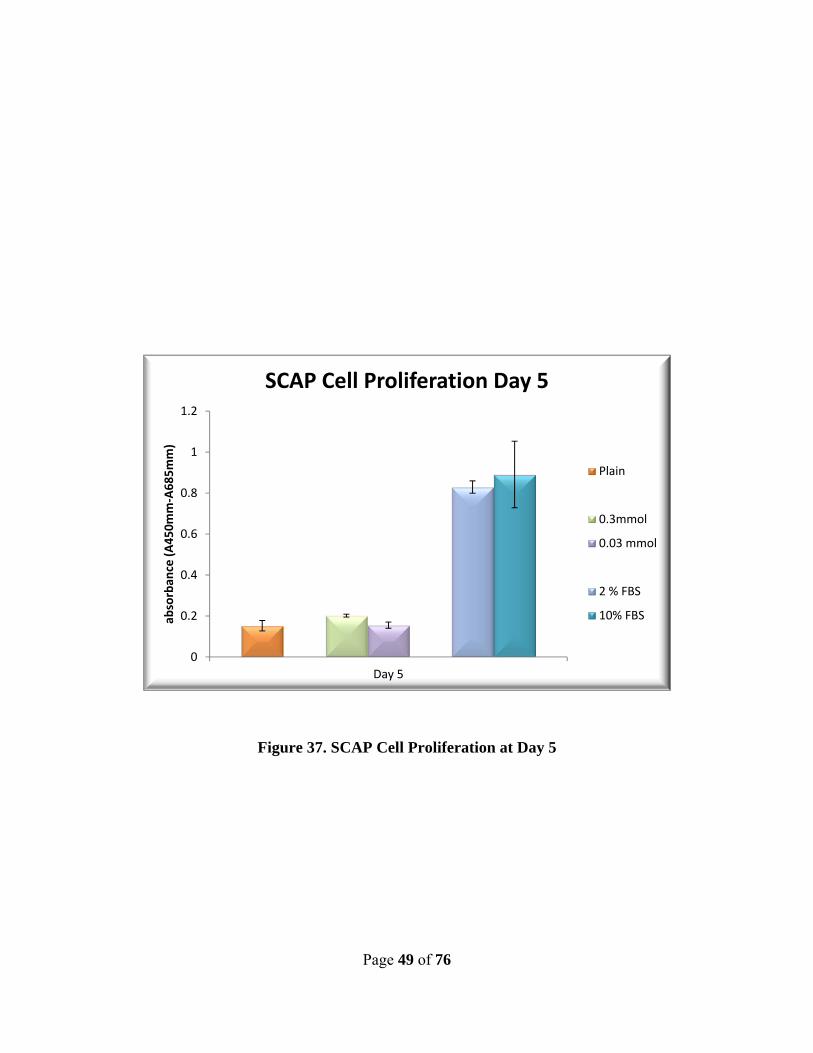
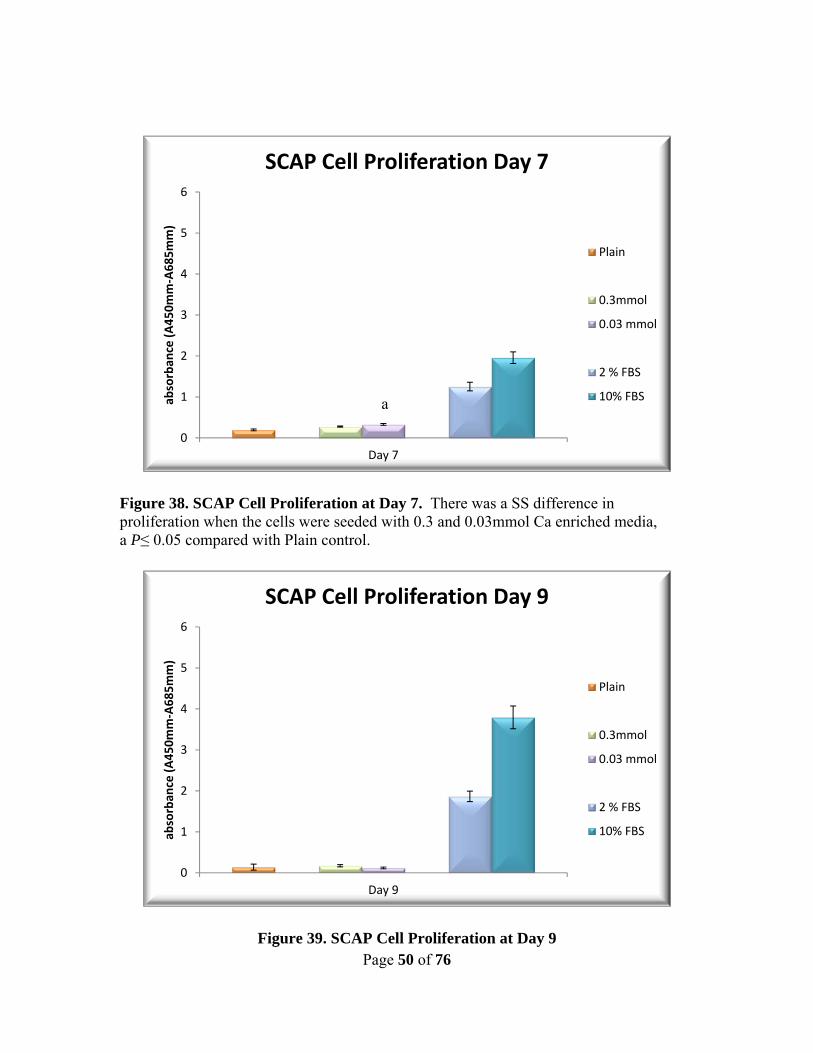
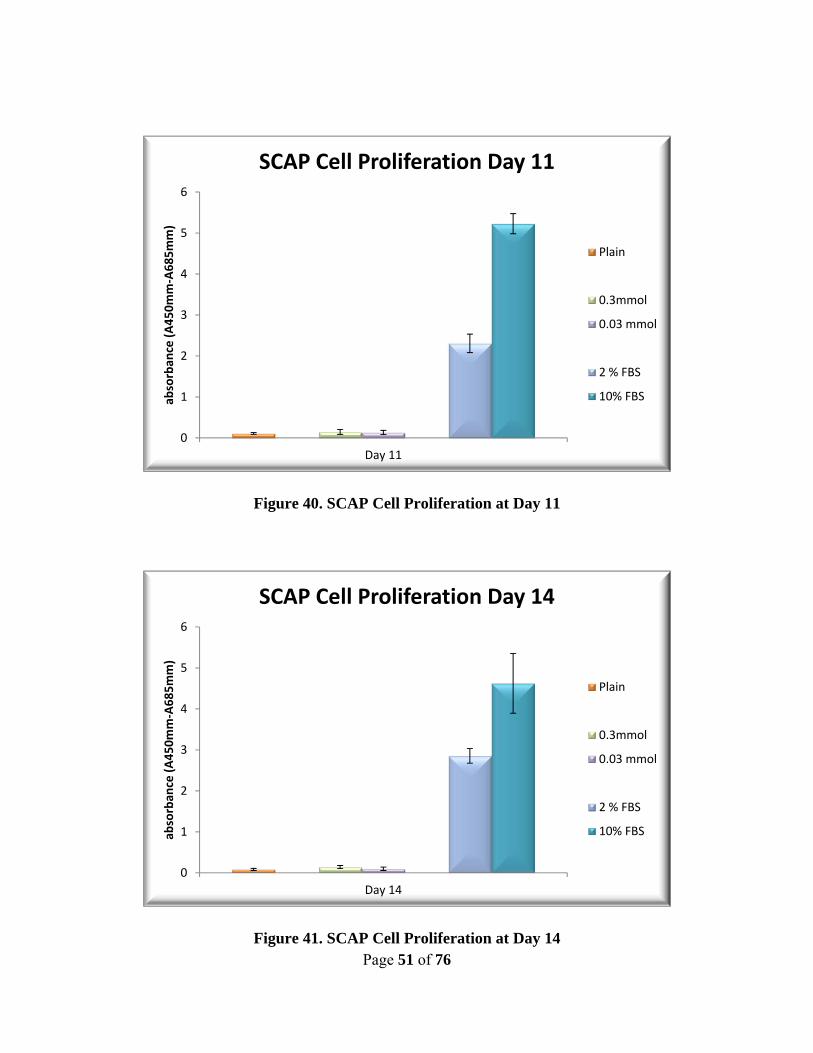
any time point. Only the 0.03mmol calcium enriched media group showed a significant
increase in SCAP cell proliferation at the 7 day time point (P = 0.006, Figure 38). All
other readings showed no significant effect on proliferation for either calcium enriched
media group (Figures 35-41).
Page 43 of 76
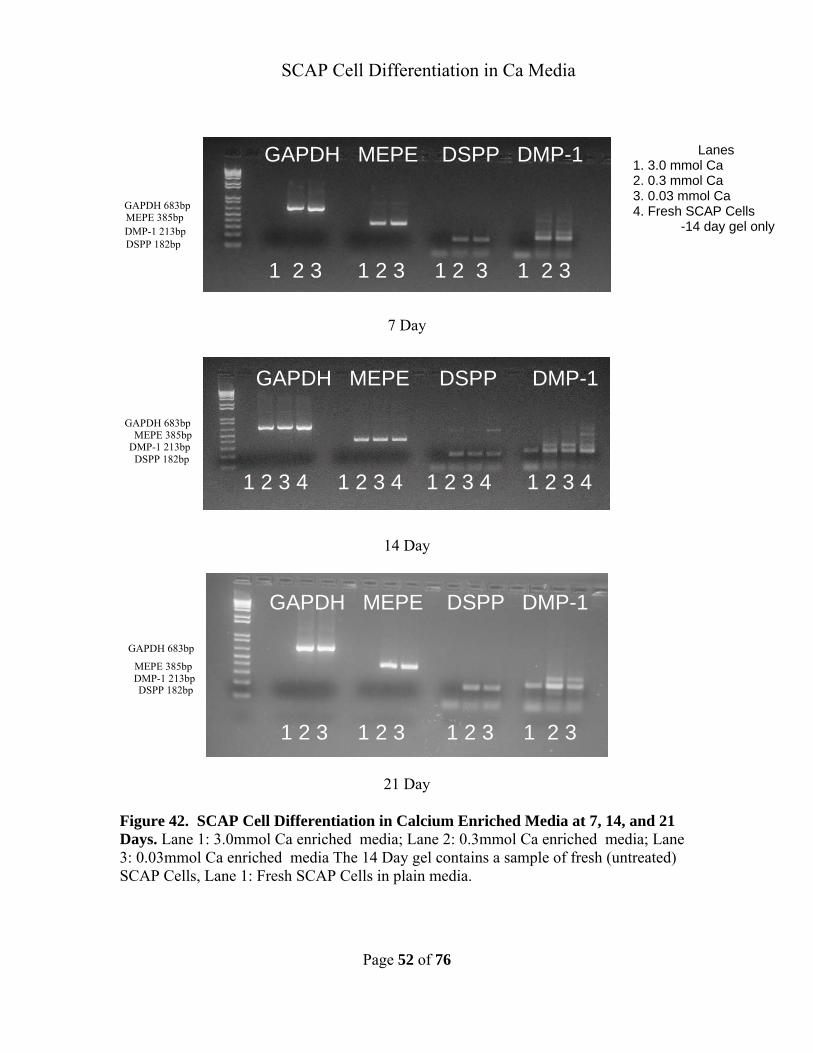
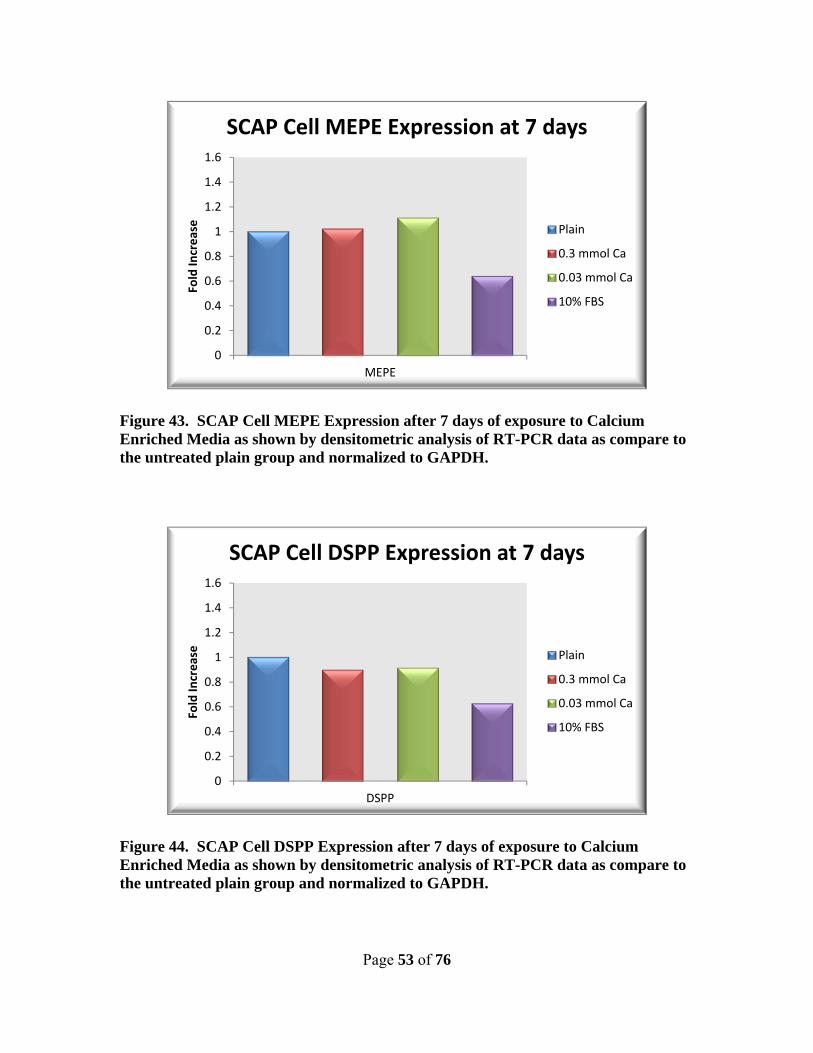
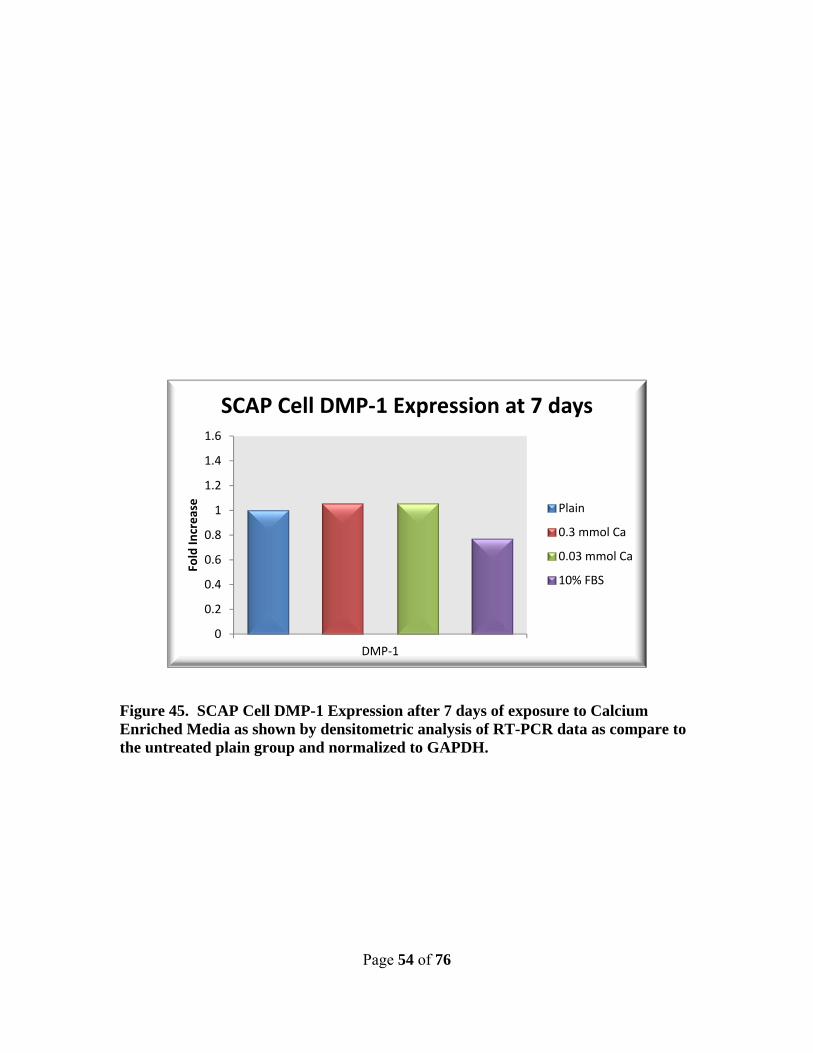
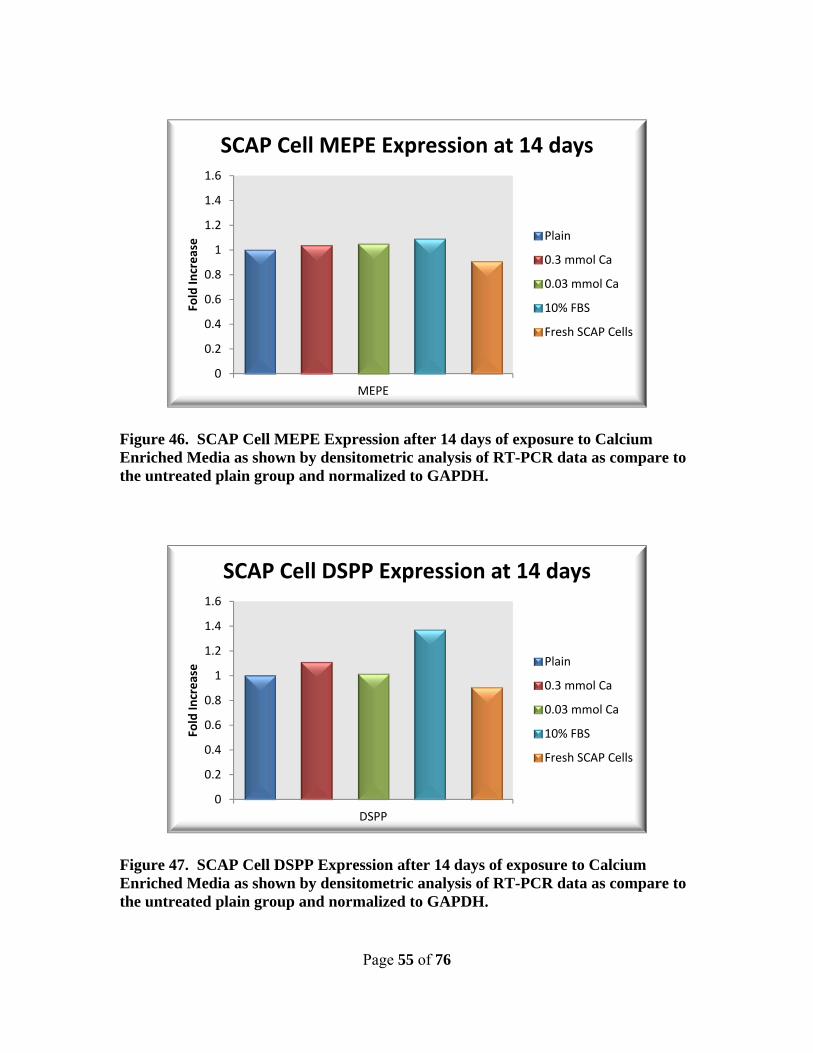
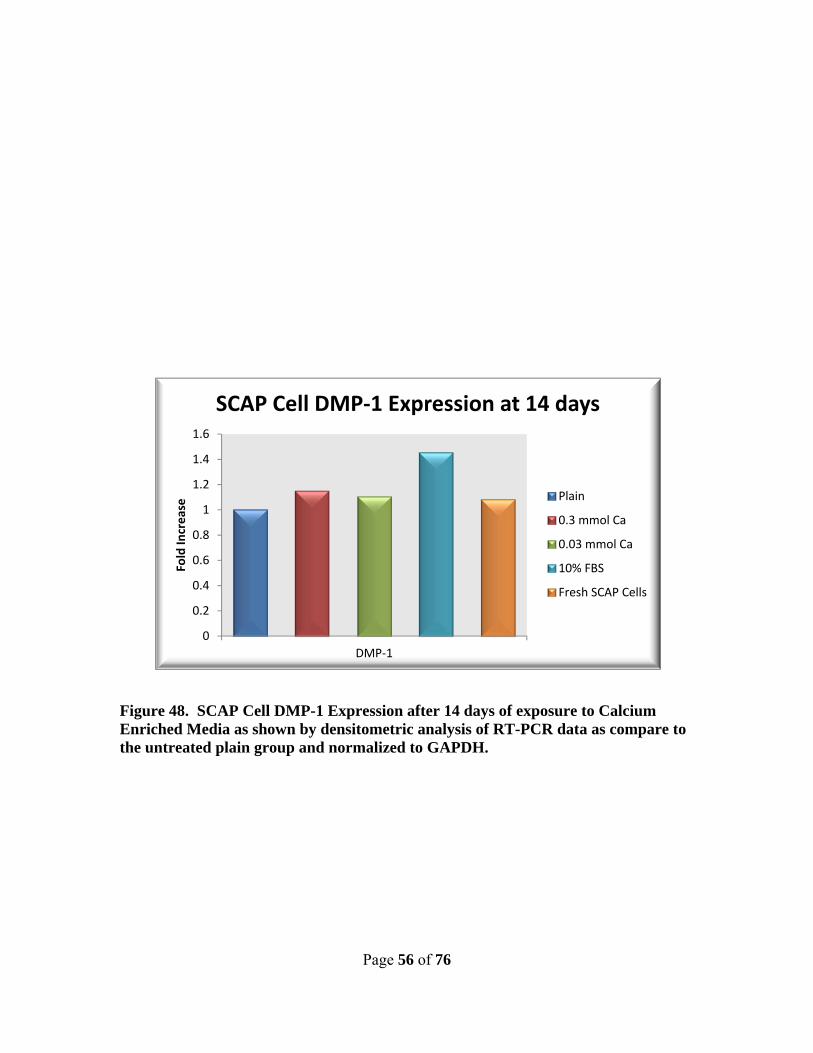
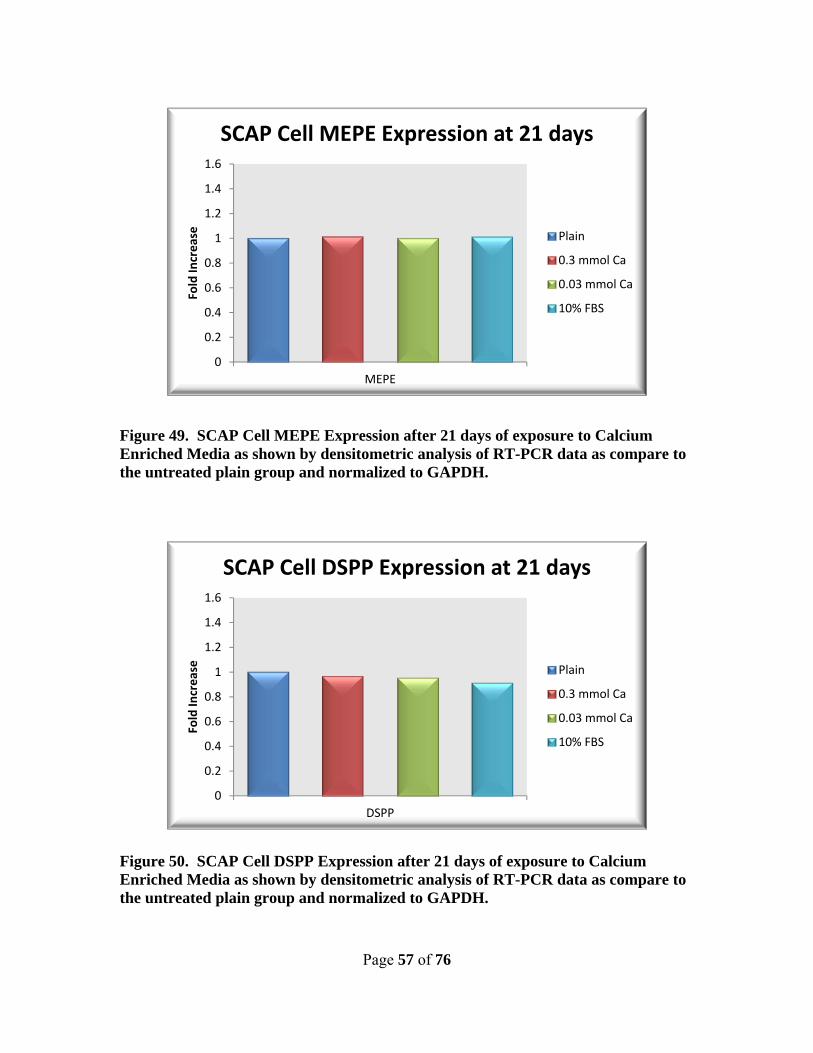
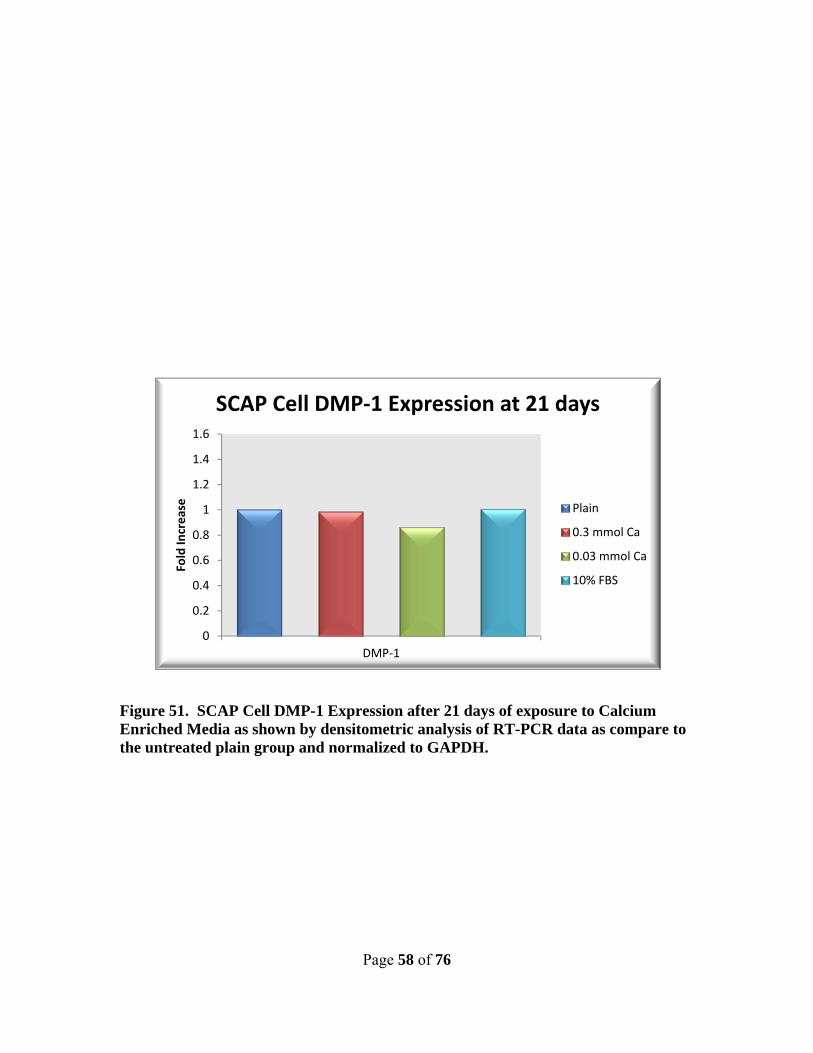
Calcium Enriched Media had No Effect on SCAP Cell Differentiation
The results for the Calcium Enriched RT-PCR Analysis are displayed in Figure 42. The
3.0 mmol calcium enriched media group was cytotoxic and no bands were seen in any
gels for all three time points. The Odontoblastic markers DSPP, DMP-1, MEPE are
present in all samples and at all time points. Both groups show a higher expression of
MEPE, followed by DMP-1, then DSPP at all-time points. No difference in expression
was seen in any marker for either calcium enriched media group and the controls (Figures
43-51). A sample of whole SCAP cells, which were taken directly from a flask as a
control is shown on the 14 day gel. They show the same levels of expression as the
calcium enriched media group and both the plain media and FBS media groups (Figures
42 and 46-48).
In Summary we found that SCAP cells exposed to 0.3mmol or 0.03mmol calcium
enriched media showed a statistically significant difference in migration after 24 hours
and that SCAP cells exposed to 0.03mmol calcium enriched media showed a statistically
significant difference in proliferation at 7 days, but no induction was seen in terms of
dentinogenesis differentiation.
Page 44 of 76
Figure 27. SCAP Cell Migration at 30 Minutes.
Figure 28. SCAP Cell Migration at 60 Minutes.
-6000
-4000
-2000
0
2000
4000
6000
8000
10000
12000
14000
16000
30 minsRel
ativ
e F
luo
resc
ence
Un
its
Time
SCAP Cell Migration 30 Minutes
Plain
3.0mmol Ca
0.3mmol Ca
0.03 mmol Ca
2 % FBS
10% FBS
-5000
0
5000
10000
15000
20000
60 Mins
Rel
ativ
e F
luo
resc
ence
Un
its
Time
SCAP Cell Migration 60 Minutes
Plain
3.0mmol Ca
0.3mmol Ca
0.03 mmol Ca
2 % FBS
10% FBS
Page 45 of 76
Figure 29. SCAP Cell Migration at 3 Hours.
Figure 30. SCAP Cell Migration at 6 Hours.
-5000
0
5000
10000
15000
20000
3 Hours
Rel
ativ
e F
luo
resc
ence
Un
its
Time
SCAP Cell Migration 3 Hours
Plain
3.0mmol Ca
0.3mmol Ca
0.03 mmol Ca
2 % FBS
10% FBS
-5000
0
5000
10000
15000
20000
6 Hours
Rel
ativ
e F
luo
resc
ence
Un
its
Time
SCAP Cell Migration 6 Hours
Plain
3.0mmol Ca
0.3mmol Ca
0.03 mmol Ca
2 % FBS
10% FBS
Page 46 of 76
Figure 31. SCAP Cell Migration at 12 Hours.
Figure 32. SCAP Cell Migration at 24 Hours. There was a SS difference in migration when the cells were seeded with 0.3 and 0.03mmol Ca enriched media, a P≤ 0.05 compared with Plain control
-5000
0
5000
10000
15000
20000
12 Hours
Rel
ativ
e F
luo
resc
ence
Un
its
Time
SCAP Cell Migration 12 Hours
Plain
3.0mmol Ca
0.3mmol Ca
0.03 mmol Ca
2 % FBS
10% FBS
-5000
0
5000
10000
15000
20000
24 Hours
Rel
ativ
e F
luo
resc
ence
Un
its
Time
SCAP Cell Migration 24 Hours
Plain
3.0mmol Ca
0.3mmol Ca
0.03 mmol Ca
2 % FBS
10% FBS
a a
Page 47 of 76
Figure 33. SCAP Cell Migration at 48 Hours. There was a SS difference in migration when the cells were seeded with 0.3 and 0.03mmol Ca enriched media, a P≤ 0.05 compared with Plain control
Figure 34. SCAP Cell Migration at 72 Hours. There was a SS difference in migration when the cells were seeded with 0.3 and 0.03mmol Ca enriched media, a P≤ 0.05 compared with Plain control
-5000
0
5000
10000
15000
20000
72 Hours
Rel
ativ
e F
luo
resc
ence
Un
its
Time
SCAP Cell Migration 72 Hours
Plain
3.0mmol Ca
0.3mmol Ca
0.03 mmol Ca
2 % FBS
10% FBS
-5000
0
5000
10000
15000
20000
48 Hours
Rel
ativ
e F
luo
resc
ence
Un
its
Time
SCAP Cell Migration 48 Hours
Plain
3.0mmol Ca
0.3mmol Ca
0.03 mmol Ca
2 % FBS
10% FBS
a a
a a
Page 48 of 76
Figure 35. SCAP Cell Proliferation at Day 1
Figure 36. SCAP Cell Proliferation at Day 3
0
0.2
0.4
Day 1
abso
rban
ce (A
450m
m-A
685m
m)
SCAP Cell Proliferation Day 1
Plain
0.3mmol
0.03 mmol
2 % FBS
10% FBS
0
0.2
0.4
Day 3
abso
rban
ce (A
450m
m-A
685m
m)
SCAP Cell Proliferation Day 3
Plain
0.3mmol
0.03 mmol
2 % FBS
10% FBS
Page 49 of 76
Figure 37. SCAP Cell Proliferation at Day 5
0
0.2
0.4
0.6
0.8
1
1.2
Day 5
abso
rban
ce (A
450m
m-A
685m
m)
SCAP Cell Proliferation Day 5
Plain
0.3mmol
0.03 mmol
2 % FBS
10% FBS
Page 50 of 76
Figure 38. SCAP Cell Proliferation at Day 7. There was a SS difference in proliferation when the cells were seeded with 0.3 and 0.03mmol Ca enriched media, a P≤ 0.05 compared with Plain control.
Figure 39. SCAP Cell Proliferation at Day 9
0
1
2
3
4
5
6
Day 7
abso
rban
ce (A
450m
m-A
685m
m)
SCAP Cell Proliferation Day 7
Plain
0.3mmol
0.03 mmol
2 % FBS
10% FBS
0
1
2
3
4
5
6
Day 9
abso
rban
ce (A
450m
m-A
685m
m)
SCAP Cell Proliferation Day 9
Plain
0.3mmol
0.03 mmol
2 % FBS
10% FBS
a
Page 51 of 76
Figure 40. SCAP Cell Proliferation at Day 11
Figure 41. SCAP Cell Proliferation at Day 14
0
1
2
3
4
5
6
Day 11
abso
rban
ce (A
450m
m-A
685m
m)
SCAP Cell Proliferation Day 11
Plain
0.3mmol
0.03 mmol
2 % FBS
10% FBS
0
1
2
3
4
5
6
Day 14
abso
rban
ce (A
450m
m-A
685m
m)
SCAP Cell Proliferation Day 14
Plain
0.3mmol
0.03 mmol
2 % FBS
10% FBS
Page 52 of 76
7 Day
14 Day
21 Day Figure 42. SCAP Cell Differentiation in Calcium Enriched Media at 7, 14, and 21 Days. Lane 1: 3.0mmol Ca enriched media; Lane 2: 0.3mmol Ca enriched media; Lane 3: 0.03mmol Ca enriched media The 14 Day gel contains a sample of fresh (untreated) SCAP Cells, Lane 1: Fresh SCAP Cells in plain media.
GAPDH MEPE DSPP DMP-1 Lanes 1. 3.0 mmol Ca 2. 0.3 mmol Ca 3. 0.03 mmol Ca 4. Fresh SCAP Cells
-14 day gel only
SCAP Cell Differentiation in Ca Media
1 2 3 4 1 2 3 4 1 2 3 4 1 2 3 4
1 2 3 1 2 3 1 2 3 1 2 3
1 2 3 1 2 3 1 2 3 1 2 3
GAPDH MEPE DSPP DMP-1
GAPDH MEPE DSPP DMP-1
DSPP 182bp
GAPDH 683bp MEPE 385bp DMP-1 213bp
DSPP 182bp
DSPP 182bp
DMP-1 213bp
DMP-1 213bp
GAPDH 683bp
GAPDH 683bp
MEPE 385bp
MEPE 385bp
Page 53 of 76
Figure 43. SCAP Cell MEPE Expression after 7 days of exposure to Calcium Enriched Media as shown by densitometric analysis of RT-PCR data as compare to the untreated plain group and normalized to GAPDH.
Figure 44. SCAP Cell DSPP Expression after 7 days of exposure to Calcium Enriched Media as shown by densitometric analysis of RT-PCR data as compare to the untreated plain group and normalized to GAPDH.
0
0.2
0.4
0.6
0.8
1
1.2
1.4
1.6
MEPE
Fold
Incr
ease
SCAP Cell MEPE Expression at 7 days
Plain
0.3 mmol Ca
0.03 mmol Ca
10% FBS
0
0.2
0.4
0.6
0.8
1
1.2
1.4
1.6
DSPP
Fold
Incr
ease
SCAP Cell DSPP Expression at 7 days
Plain
0.3 mmol Ca
0.03 mmol Ca
10% FBS
Page 54 of 76
Figure 45. SCAP Cell DMP-1 Expression after 7 days of exposure to Calcium Enriched Media as shown by densitometric analysis of RT-PCR data as compare to the untreated plain group and normalized to GAPDH.
0
0.2
0.4
0.6
0.8
1
1.2
1.4
1.6
DMP-1
Fold
Incr
ease
SCAP Cell DMP-1 Expression at 7 days
Plain
0.3 mmol Ca
0.03 mmol Ca
10% FBS
Page 55 of 76
Figure 46. SCAP Cell MEPE Expression after 14 days of exposure to Calcium Enriched Media as shown by densitometric analysis of RT-PCR data as compare to the untreated plain group and normalized to GAPDH.
Figure 47. SCAP Cell DSPP Expression after 14 days of exposure to Calcium Enriched Media as shown by densitometric analysis of RT-PCR data as compare to the untreated plain group and normalized to GAPDH.
0
0.2
0.4
0.6
0.8
1
1.2
1.4
1.6
MEPE
Fold
Incr
ease
SCAP Cell MEPE Expression at 14 days
Plain
0.3 mmol Ca
0.03 mmol Ca
10% FBS
Fresh SCAP Cells
0
0.2
0.4
0.6
0.8
1
1.2
1.4
1.6
DSPP
Fold
Incr
ease
SCAP Cell DSPP Expression at 14 days
Plain
0.3 mmol Ca
0.03 mmol Ca
10% FBS
Fresh SCAP Cells
Page 56 of 76
Figure 48. SCAP Cell DMP-1 Expression after 14 days of exposure to Calcium Enriched Media as shown by densitometric analysis of RT-PCR data as compare to the untreated plain group and normalized to GAPDH.
0
0.2
0.4
0.6
0.8
1
1.2
1.4
1.6
DMP-1
Fold
Incr
ease
SCAP Cell DMP-1 Expression at 14 days
Plain
0.3 mmol Ca
0.03 mmol Ca
10% FBS
Fresh SCAP Cells
Page 57 of 76
Figure 49. SCAP Cell MEPE Expression after 21 days of exposure to Calcium Enriched Media as shown by densitometric analysis of RT-PCR data as compare to the untreated plain group and normalized to GAPDH.
Figure 50. SCAP Cell DSPP Expression after 21 days of exposure to Calcium Enriched Media as shown by densitometric analysis of RT-PCR data as compare to the untreated plain group and normalized to GAPDH.
0
0.2
0.4
0.6
0.8
1
1.2
1.4
1.6
DSPP
Fold
Incr
ease
SCAP Cell DSPP Expression at 21 days
Plain
0.3 mmol Ca
0.03 mmol Ca
10% FBS
0
0.2
0.4
0.6
0.8
1
1.2
1.4
1.6
MEPE
Fold
Incr
ease
SCAP Cell MEPE Expression at 21 days
Plain
0.3 mmol Ca
0.03 mmol Ca
10% FBS
Page 58 of 76
Figure 51. SCAP Cell DMP-1 Expression after 21 days of exposure to Calcium Enriched Media as shown by densitometric analysis of RT-PCR data as compare to the untreated plain group and normalized to GAPDH.
0
0.2
0.4
0.6
0.8
1
1.2
1.4
1.6
DMP-1
Fold
Incr
ease
SCAP Cell DMP-1 Expression at 21 days
Plain
0.3 mmol Ca
0.03 mmol Ca
10% FBS
Page 59 of 76
Chapter 6 –QUESTIONS RAISED DURING EXPERIMENTATION
During the experimental stages of this research, several questions arose regarding
the results we found and those in previous reports. The expression of odontoblastic
markers found in untreated SCAP cells by RT-PCR led us to question whether our cell
population had already under gone differentiation or was a mixed population with a lower
number of stem cells. We decided to characterize the cell population by using flow
cytometry and to evaluate cells at different passages.
Materials and Methods
Flow Cytometric Analysis
SCAP cells from passages 2 and 10 were evaluated by Flow Cytometry to characterize
the cell population of each passage. A buffer solution of 2% FBS in PBS (hereinafter
“buffer”) was made for use in the dilution of the antibodies. The media from a T-75 flask
containing passage 2 and 10 SCAP cells at 80% confluence was removed by vacuum
pipetting and the cells were harvested by adding 3ml of 0.025% Trypsin-EDTA to the
flask and incubating it for 5 minutes until the cells detached from the flask and were
visualized floating in the media. Five milliliters of 10% FBS media was added to
inactivate the Trypsin-EDTA. The contents of the flask were transferred to a 15ml
conical tube (BD Falcon, San Jose, CA) and centrifuged for 5 minutes at 1000 RPM at
4ºC. The media was removed via vacuum pipetting and the pellet of cells was re-
suspended in 5ml of plain media. Cells were counted using a hemocytometer with the
sample created by placing 100µl of re-suspended cells in 900µl of plain media into a 2ml
Eppendorf tube. 5x10⁵ cells were seeded into 5ml polystyrene round-bottom tubes (BD
Page 60 of 76
Falcon, San Jose, CA) and centrifuged for 5 minutes at 1000 RPM at 4ºC. The
supernatant was discarded via gentle vacuum pipetting and the pellet of cells was re-
suspended in 100µl of 5% bovine serum albumin (BSA) and incubated on ice for 30
minutes. The samples were then centrifuged for 5 minutes at 1000 RPM at 4ºC and the
supernatant was discarded via gentle vacuum pipetting. The pellet of cells was re-
suspended in 1ml of PBS, centrifuged for 5 minutes at 1000 RPM at 4ºC, the supernatant
was discarded via gentle vacuum pipetting, and this step was repeated with an additional
1ml of PBS (Hereinafter “wash cycle”). A control sample from each passage was then re-
suspended with 100µl of buffer and incubated in the dark on ice until read by flow
cytometry. The supernatant from the remaining tubes was discarded via gentle vacuum
pipetting and the samples divided into 3 groups based on the antibody staining received.
In the CD146 group, the pellet of cells was re-suspended in 100µl of 1:11 (1µl
antibodies/11µl buffer) human CD146-APC antibodies (Milenyi Biotec, Auburn, CA)
and incubated in the dark on ice for 30 minutes. The samples were then centrifuged for 5
minutes at 1000 RPM at 4ºC and the supernatant was discarded via gentle vacuum
pipetting and a wash cycle performed. The supernatant was discarded via gentle vacuum
pipetting and samples from each passage were then re-suspended with 100µl of buffer
and incubated in the dark on ice until read by flow cytometry. Next, in the CD24 group
the pellet of cells was re-suspended in 100µl of 2:10 (2µl antibodies/10µl buffer) PE
mouse anti-human CD24 antibodies (BD Pharmingen, San Jose, CA) and incubated in the
dark on ice for 30 minutes. The samples were then centrifuged for 5 minutes at 1000
RPM at 4ºC and the supernatant was discarded via gentle vacuum pipetting and a wash
cycle performed. The supernatant was discarded via gentle vacuum pipetting and samples
Page 61 of 76
from each passage were then re-suspended with 100µl of buffer and incubated in the dark
on ice until read by flow cytometry. Then, in the STRO-1-FITC group the pellet of cells
was re-suspended in 100µl of 1:25 (1µl antibodies/25µl buffer) mouse anti-STRO-1
primary antibodies (Invitrogen Corp., Carlsbad, CA) and incubated in the dark on ice for
60 minutes. The samples were then centrifuged for 5 minutes at 1000 RPM at 4ºC and the
supernatant was discarded via gentle vacuum pipetting and a wash cycle performed. The
supernatant was discarded via gentle vacuum pipetting and a control sample from each
passage was then re-suspended with 100µl of buffer and incubated in the dark on ice until
read by flow cytometry. The pellet of cells in the remaining tubes were re-suspended in
100µl of 1:100 (1µl antibodies/100µl buffer) FITC rabbit anti-mouse IgG conjugate
antibodies (Invitrogen Corp., Carlsbad, CA) and incubated in the dark on ice for 30
minutes. The samples were then centrifuged for 5 minutes at 1000 RPM at 4ºC and the
supernatant was discarded via gentle vacuum pipetting and a wash cycle performed. The
supernatant was discarded via gentle vacuum pipetting and samples from each passage
were then re-suspended with 100µl of buffer and incubated in the dark on ice until read
by flow cytometry. A control tube of cells stained with only the FITC rabbit anti-mouse
IgG conjugate antibodies for each passage was also made. All samples were re-
suspended with a pipette prior to flow cytometry. The samples were processed at the
University of Michigan Life Science Center Flow Cytometry Core on a BD FACSAria3
Flow Cytometry machine using the BD FACSDiva software and 10,000 events. This
experiment was repeated 4 times in triplicate.
Page 62 of 76
Results
The Number of CD24+ Cells Decreased to Zero by Passage 10
The results for the Flow Cytometric Analysis are displayed as the percentage of cells in
total sample population and shown in Figure 52. The percentage of cells that were
CD24+ in passage 2 was 3.9%, which decreased to 0% in the passage 10 cells. Passage 2
cells were CD146+ in 73.2% of the population decreasing to 60% of the cell population
in the passage 10 cells. Only 5.1% of the cell population was STRO-1+ in the passage 2
cells. This number decreased to 0.8% in the passage 10 cells.
In Summary we can conclude that the cells used for most of the experiments were
between passages 4 and 6 and that they were of a mixed population where the percentage
of stem cells, analyzed by CD24, CD146 and STRO-1 markers, was reduced while the
experiments were conducted.
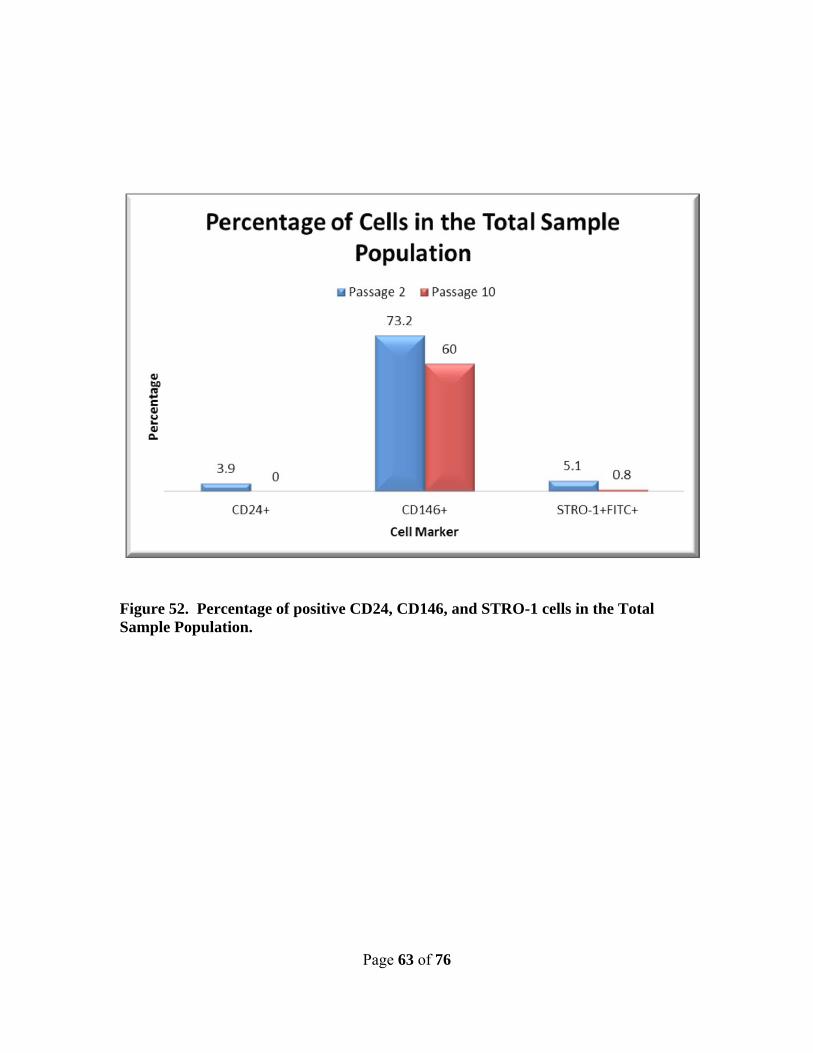
Page 63 of 76
Figure 52. Percentage of positive CD24, CD146, and STRO-1 cells in the Total Sample Population.
Page 64 of 76
While many studies reported significant increases in both migration and proliferation of
cells with MTA, our results were more subtle. We noted the extensive use of Gray MTA
(12, 17, 19, 27) instead of WMTA as well as the fact that in some studies the cells were
in direct contact with the MTA (12, 17, 38). Also, these studies used a much larger
amount of MTA. So we began to question whether the GMTA has a different effect on
cells then WMTA, whether the direct contact enhances this effect, and whether the
amount of MTA used has any bearing on the effects seen. Here we considered it
important to evaluate our WMTA results to GMTA as pilot studies to further explore
these questions.
Materials and Methods
Gray MTA Pilot Studies SCAP cell proliferation in the presence of gray MTA (GMTA) (Gray MTA ProRoot
Dentsply Endodontics, Tulsa, OK) was evaluated using the WST-1 proliferation assay
method. The media from a T-75 flask containing passage 4 SCAP cells at 80%
confluence was removed by vacuum pipetting and the cells were harvested by adding 3ml
of 0.025% Trypsin-EDTA to the flask and incubating it for 5 minutes until the cells
detached from the flask and were visualized floating in the media. Five milliliters of 10%
FBS media was added to inactivate the Trypsin-EDTA. The contents of the flask were
transferred to a 15ml conical tube (BD Falcon, San Jose, CA) and centrifuged for 5
minutes at 1000 RPM at 4ºC. The media was removed via vacuum pipetting and the
pellet of cells was re-suspended in 5ml of plain media. Cells were counted using a
hemocytometer with the sample created by placing 100µl of re-suspended cells in 900µl
Page 65 of 76
of plain media into a 2ml Eppendorf tube. 4x10³ cells were seeded into the wells of 12
well companion plates (BD Falcon, San Jose, CA) with 1.5ml of media in the following
test conditions: 7 sets of 3 wells containing 2% FBS media, 1 set of 3 wells containing
plain media, and 1 set of 3 wells containing 10% FBS media. 3-µm-size pore transwell
cell culture inserts (BD Falcon, San Jose, CA) were placed into each well. Twenty-four
hour set GMTA and WMTA pellets were placed into the transwell inserts of 6 sets of the
wells containing 2% FBS media as follows: 3 pellets of GMTA, 6 pellets of GMTA, 9
pellets of GMTA; and 3 pellets of WMTA, 6 pellets of WMTA, 9 pellets of WMTA.
Additionally, 4x10³ cells were seeded into the wells of 12 well companion plates (BD
Falcon, San Jose, CA) with 1.5ml of media in the following test conditions: 7 sets of 3
wells containing 2% FBS media, 1 set of 3 wells containing plain media, and 1 set of 3
wells containing 10% FBS media. Prior to cell seeding, GMTA and WMTA pellets were
freshly mixed and placed wet into the 6 sets of the wells that would contain 2% FBS
media as follows: 3 pellets of GMTA, 6 pellets of GMTA, 9 pellets of GMTA; and 3
pellets of WMTA, 6 pellets of WMTA, 9 pellets of WMTA. The wet GMTA and
WMTA pellets were spread over the bottom surface of the well to provide a uniform
thickness covering the bottom of the well. The plates were then placed in an incubator
and allowed to set for 24 hours at 37ºC in 5% CO2 and 100% humidity. The plates were
incubated at 37ºC in 5% CO2 and 100% humidity and the media changed every 3 days.
The plates were evaluated 7 days via WST-1 proliferation assay.
The WST-1 proliferation assay was performed as previously described in Chapter
3. These experiments were repeated twice in triplicate.
Page 66 of 76
Results Indirect GMTA Significantly Increased SCAP Cell Proliferation The results for the Gray MTA Pilot Studies are described as absorbance at (A450mm-
A685mm). In the study where the MTA was placed in transwell-inserts, all 3 groups
with GMTA showed significantly increased SCAP cell proliferation as compared to the
WMTA groups (P = <0.001, Figure 53). All 3 WMTA groups showed significantly
decreased proliferation as compared to the 2% FBS control (P = <0.002). No difference
was seen between either the GMTA or WMTA groups when the MTA was placed
directly in the well, however both GMTA and WMTA significantly decreased SCAP cell
proliferation as compared to the 2% and 10% FBS controls (P = <0.05, Figure 54).
In Summary we found that all GMTA groups showed significantly increased SCAP cell
proliferation as compared to the WMTA groups after 7 days of exposure.
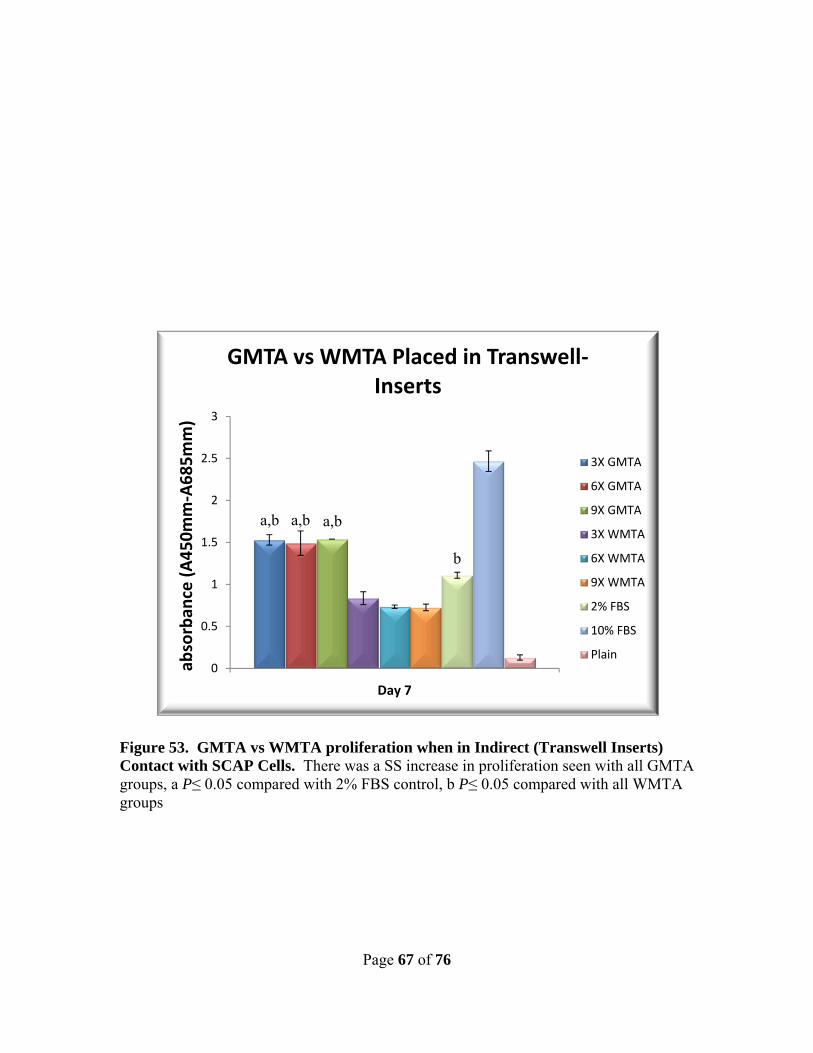
Page 67 of 76
Figure 53. GMTA vs WMTA proliferation when in Indirect (Transwell Inserts) Contact with SCAP Cells. There was a SS increase in proliferation seen with all GMTA groups, a P≤ 0.05 compared with 2% FBS control, b P≤ 0.05 compared with all WMTA groups
0
0.5
1
1.5
2
2.5
3
abso
rban
ce (A
450m
m-A
685m
m)
Day 7
GMTA vs WMTA Placed in Transwell-Inserts
3X GMTA
6X GMTA
9X GMTA
3X WMTA
6X WMTA
9X WMTA
2% FBS
10% FBS
Plain
a,b
b
a,b a,b
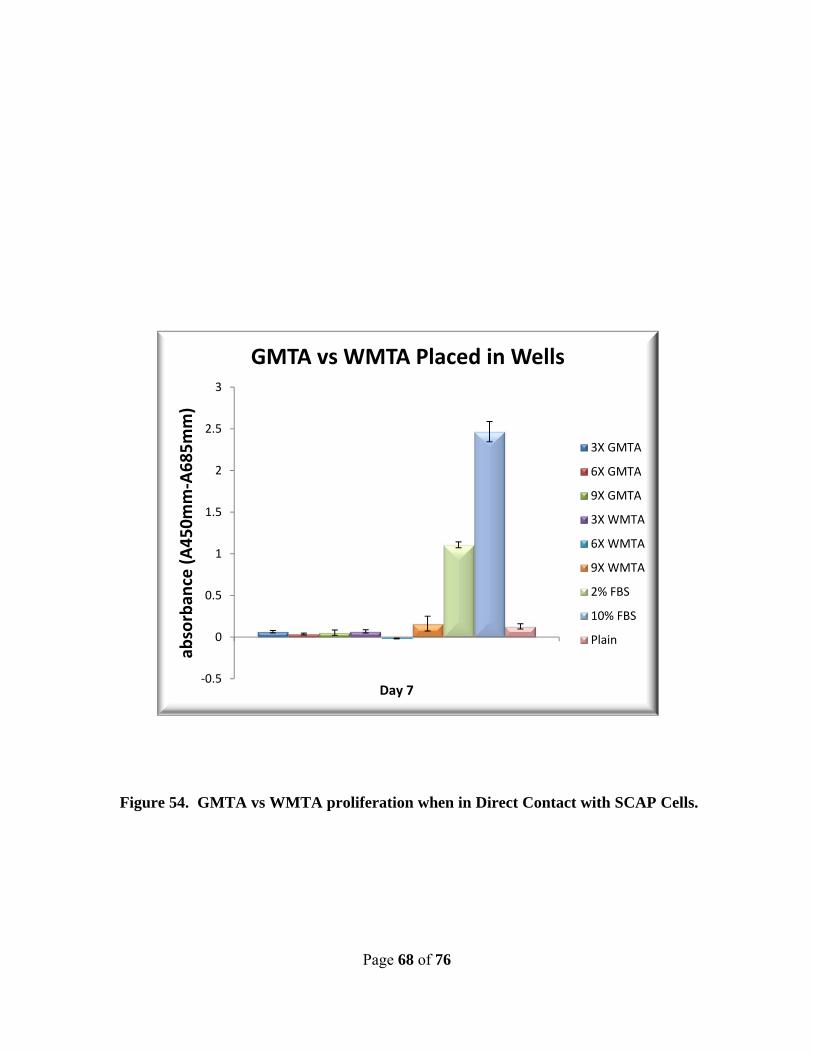
Page 68 of 76
Figure 54. GMTA vs WMTA proliferation when in Direct Contact with SCAP Cells.
-0.5
0
0.5
1
1.5
2
2.5
3
abso
rban
ce (A
450m
m-A
685m
m)
Day 7
GMTA vs WMTA Placed in Wells
3X GMTA
6X GMTA
9X GMTA
3X WMTA
6X WMTA
9X WMTA
2% FBS
10% FBS
Plain
Page 69 of 76
Chapter 7 – DISCUSSION
Pulpal regeneration in the immature tooth aims to ensure the continued development of
the root, gaining width of the dentinal walls and length of the root. The increased width
of dentin will help in strengthening the weak and thin root structure that is often seen in
these cases (35, 39). The source of the stem cells responsible for the continued
development of the root structure has yet to be identified, however SCAP cells have been
postulated as a likely source (34). The properties of SCAP cells regarding their robust
growth and multi-potentiality make them an attractive target for tissue regeneration and
other efforts to enhance the regeneration of the pulp-dentin complex (14, 15, 40). Efforts
to increase the attraction and differentiation of SCAP cells are being investigated more
commonly today, including growth factors such as basic fibroblast growth factor (bFGF)
and materials such as MTA (17, 40). MTA has been shown to promote cell growth and
odontoblastic differentiation, two very important processes for pulp regeneration (17, 41,
42). The possible synergistic interaction between the potent SCAP cells and MTA to
enhance the regeneration of the pulp-dentin complex is what inspired this study.
In this study, we were able to show a significant increase in SCAP cell migration
after 6 hours and proliferation after 24 hours of exposure to WMTA. We also
demonstrated that calcium enriched media significantly increased SCAP cell migration
after 24 hours. Under the conditions used here with a mixed population of SCAP cells,
we did not find any odontoblastic differentiation as analyzed by RT-PCR gene expression.
Through the use of Flow Cytometry, we were able to characterize our population of
mixed cells and show the decrease of stem cell markers commonly used to identify SCAP
Page 70 of 76
cells. We also demonstrated that GMTA had a stronger effect than WMTA on SCAP cell
proliferation.
After 6 hours, we found an increase in SCAP cell migration in contact with media
containing 1 or 24 hour set WMTA. At 1/2, 1, 3, and 12 hour periods, we saw an
increased trend in cell migration, but it was not statistically significant. Our results are
consistent with previous studies that have shown an increase in migration with the use of
WMTA (17), although we did not see as strong of an increase. This could be due to the
fact that in that study hMSCs were used, which could have inherently different migration
ability or stem cell proportions; or the difference in laboratory technique as the MTT
Assay was used to measure cell migration. Our migration results comparing media
containing FBS with plain media are consistent with the literature.
Our study showed a significant increase in SCAP cell proliferation for either 1 or
24 hour set WMTA in plain media and for the 24 hour set WMTA in plain media at 5
days. Previous reports in the literature have shown little effect of WMTA on cell
proliferation until 21 days and the MTA used was not cytotoxic to cells during the earlier
time points tested (12, 17, 27, 43). With the exception of the day 1 and day 5 readings,
we are in agreement with these results. It should also be noted that the previous studies
used FBS containing media and our findings using 10% FBS are in agreement with these
results. It is our plain media results that differ from these studies which used FBS
containing media and no other studies have investigated the effect of WMTA using plain
media. One of the most interesting findings in our study is the dramatic impact that FBS
has on SCAP cell proliferation, even at a lower concentration of 2%. Other reports in the
literature have used GMTA and shown a significant increase in the proliferation of the
Page 71 of 76
cell types studied (12, 27). It should also be noted that no one has studied the effect of
MTA on SCAP cells directly and only hDPCs and hMSCs have been used for those
studies (12, 17, 18). While the cell types are very similar if not related in lineage, there
may be untold differences.
It was the disparity in the use of GMTA that led us to complete 2 different pilot
studies using GMTA. After reviewing the literature, a number of issues became clear.
Many of the studies used much larger amounts of MTA than we did; the MTA was in
direct contact or indirect contact with the cells; and the GMTA seemed to more
dramatically influence the cells than the WMTA did. Our results with GMTA indirectly
contacting SCAP cells show the same significant increase as the other studies have
shown (27). Our results do agree with the literature regarding direct contact with MTA
(12, 17) as no significant increase was seen after 7 days.
The results of our RT-PCR Analysis were unexpected. We saw expression of the
Odontoblastic markers DSPP, DMP-1, MEPE in all samples and at all time points, even
on the untreated cells. These cells showed the same expression pattern and this pattern
even held true for our calcium enriched media groups. These results were not consistent
with the odontoblastic differentiation that other studies have found (18, 19, 41, 44). This
pattern seemed to suggest that we had a mixed cell population with a low percentage of
undifferentiated cells and the SCAP cells had begun to differentiate during the culturing
period prior to starting the experiments.
To evaluate the stage of differentiation of the SCAP cells, we evaluated the
presence of the cell markers by Flow Cytometry. Our Flow Cytometry results showed
lower CD24+ and SRTO-1+ percentages than originally reported by Sonoyama in 2006,
Page 72 of 76
even for the cells at passage 2. Only the percentage of CD146+ cells was in agreement
(14). We saw that the CD24+ cells dropped to zero by passage 10. This is crucial as
CD24 is considered the identifying marker for SCAP cells (14, 15). It appears that the
cells were already differentiated towards an odontablastic lineage by the expression of
odontoblastic markers DSPP, MEPE and DMP-1 or that the percentage of cells
expressing these markers was so low that it was difficult to identify their differentiation
process.
Although in our hypothesis and aims we were looking for the role of the calcium
released in the medium from WMTA, we could not measure this release with the
protocols tested. Instead, the use of enriched calcium media helped in part to mimic this
effect. There is little in the current literature regarding the effect of calcium ions on the
dental pulp stem cells. Only one study done on dental pulp cells has correlated the effect
of the calcium released from GMTA with proliferation (27). However, our proliferation
study only partially agreed with this study after 7 days of exposure, whereas that study
showed a concentration dependent increase in proliferation after 12 days. This is likely
explained by the fact that our calcium enriched media was plain media without FBS or
other growth factors. In our study both concentrations of the calcium enriched media
showed a significant increase in SCAP cell migration after 24 hours. Calcium is well
known as an intracellular signaling molecule and has been shown to increase the
chemotaxis and migration of hMSCs (28, 29). In this light, our results should be
expected, but to the best of our knowledge they have not been reported before.
The results of our experiments point us in several new directions. The use of
Flow Cytometry to select the stem cells from the mixed SCAP population would help us
Page 73 of 76
to understand the effects of WMTA on these cells. We have also shown in a pilot study
that a clear difference exists between both GMTA and WMTA in terms of cell
proliferation. We have also shown that a minimal 2% FBS concentration can influence
cells as much as the 10% FBS concentration that is so often used. It is also possible that
the effects of the FBS are overpowering the true effects of the agent we are studying. A
future study should be done to titrate the FBS and see if there are any changes in the
results of our experiments. Finally, the effect of calcium ions on the cells needs to be
investigated more thoroughly. The large release of calcium ions by set MTA results from
the dissociation of calcium hydroxide and the decomposition of calcium silicate hydrate,
the two main components of set MTA. The greatest rate of Ca(OH)2 formation during
the setting of MTA occurs between 4 to 24 hours (22, 24, 25). Future studies into the
amount of calcium ions released by MTA at 1 and 24 hours and it’s availability to nearby
cells needs to be investigated.
In conclusion, we have shown that WMTA can induce SCAP cell migration and
proliferation while using a mixed population of SCAP cells; SCAP cells in our
population are at different stages of differentiation, and that calcium enriched media
increased SCAP cell migration and proliferation. The use of calcium releasing materials,
such as MTA, could have biologic impact on the recruitment of cells into a tooth root
undergoing dentinogenesis. Future investigations are needed to determine if a more
undifferentiated population of SCAP cells has a different reaction regarding migration,
proliferation, and differentiation to the released compounds or final products of set MTA.
Page 74 of 76
D. References Cited:
1. Bose R, Nummikoski P, Hargreaves K. A retrospective evaluation of radiographic outcomes in immature teeth with necrotic root canal systems treated with regenerative endodontic procedures. Journal of Endodontics. [Comparative Study]. 2009 Oct;35(10):1343-9. 2. Wilkinson KL, Beeson TJ, Kirkpatrick TC. Fracture resistance of simulated immature teeth filled with resilon, gutta-percha, or composite. Journal of Endodontics. 2007 Apr;33(4):480-3. 3. Jung IY, Lee SJ, Hargreaves KM. Biologically based treatment of immature permanent teeth with pulpal necrosis: a case series. Journal of Endodontics. 2008 Jul;34(7):876-87. 4. Cvek M. Prognosis of luxated non-vital maxillary incisors treated with calcium hydroxide and filled with gutta-percha. A retrospective clinical study. Endod Dent Traumatol. 1992 Apr;8(2):45-55. 5. Tzigkounakis V, Merglova V, Hecova H, Netolicky J. Retrospective clinical study of 90 avulsed permanent teeth in 58 children. Dent Traumatol. 2008 Dec;24(6):598-602. 6. Pohl Y, Filippi A, Kirschner H. Results after replantation of avulsed permanent teeth. I. Endodontic considerations. Dent Traumatol. 2005 Apr;21(2):80-92. 7. Pohl Y, Filippi A, Kirschner H. Results after replantation of avulsed permanent teeth. II. Periodontal healing and the role of physiologic storage and antiresorptive-regenerative therapy. Dent Traumatol. [Evaluation Studies]. 2005 Apr;21(2):93-101. 8. Pohl Y, Wahl G, Filippi A, Kirschner H. Results after replantation of avulsed permanent teeth. III. Tooth loss and survival analysis. Dent Traumatol. 2005 Apr;21(2):102-10. 9. Friedlander LT, Cullinan MP, Love RM. Dental stem cells and their potential role in apexogenesis and apexification. International Endodontic Journal. 2009;42(11):955-62. 10. Nör JE. Buonocore Memorial Lecture. Operative Dentistry. 2006;31(6):633-42. 11. Gronthos S, Mankani M, Brahim J, Robey PG, Shi S. Postnatal human dental pulp stem cells (DPSCs) in vitro and in vivo. Proc Natl Acad Sci U S A. 2000 Dec 5;97(25):13625-30. 12. Paranjpe A, Zhang H, Johnson JD. Effects of Mineral Trioxide Aggregate on Human Dental Pulp Cells after Pulp-capping Procedures. Journal of Endodontics. 2010;36(6):1042-7. 13. Tziafas D, Kodonas K. Differentiation potential of dental papilla, dental pulp, and apical papilla progenitor cells. J Endod. 2010 May;36(5):781-9. 14. Sonoyama W, Liu Y, Fang D, Yamaza T, Seo BM, Zhang C, et al. Mesenchymal stem cell-mediated functional tooth regeneration in swine. PLoS One. [Research Support, N.I.H., Intramural Research Support, Non-U.S. Gov't]. 2006;1:e79. 15. Sonoyama W, Liu Y, Yamaza T, Tuan R, Wang S, Shi S, et al. Characterization of the Apical Papilla and Its Residing Stem Cells from Human Immature Permanent Teeth: A Pilot Study. Journal of Endodontics. 2008;34(2):166-71.
Page 75 of 76
16. Huang GTJ, Gronthos S, Shi S. Mesenchymal Stem Cells Derived from Dental Tissues vs. Those from Other Sources: Their Biology and Role in Regenerative Medicine. Journal of Dental Research. 2009;88(9):792-806. 17. D'Antò V, Di Caprio MP, Ametrano G, Simeone M, Rengo S, Spagnuolo G. Effect of Mineral Trioxide Aggregate on Mesenchymal Stem Cells. Journal of Endodontics. 2010;36(11):1839-43. 18. Kim Y-B, Shon W-J, Lee W, Kum K-Y, Baek S-H, Bae K-S. Gene Expression Profiling Concerning Mineralization in Human Dental Pulp Cells Treated with Mineral Trioxide Aggregate. Journal of Endodontics. 2010;36(11):1831-8. 19. Min K-S, Yang S-H, Kim E-C. The Combined Effect of Mineral Trioxide Aggregate and Enamel Matrix Derivative on Odontoblastic Differentiation in Human Dental Pulp Cells. Journal of Endodontics. 2009;35(6):847-51. 20. Min K, Park H, Lee S, Park S, Hong C, Kim H, et al. Effect of Mineral Trioxide Aggregate on Dentin Bridge Formation and Expression of Dentin Sialoprotein and Heme Oxygenase-1 in Human Dental Pulp. Journal of Endodontics. 2008;34(6):666-70. 21. Nair PNR, Duncan HF, Pitt Ford TR, Luder HU. Histological, ultrastructural and quantitative investigations on the response of healthy human pulps to experimental capping with mineral trioxide aggregate: a randomized controlled trial. International Endodontic Journal. 2007;0(0):071026203843001-??? 22. Chedella SCV, Berzins DW. A differential scanning calorimetry study of the setting reaction of MTA. International Endodontic Journal. 2010;43(6):509-18. 23. Camilleri J, Montesin F, Brady K, Sweeney R, Curtis R, Ford T. The constitution of mineral trioxide aggregate. Dental Materials. 2005;21(4):297-303. 24. Camilleri J. Hydration mechanisms of mineral trioxide aggregate. International Endodontic Journal. 2007;40(6):462-70. 25. Camilleri J. Characterization of hydration products of mineral trioxide aggregate. International Endodontic Journal. 2008;41(5):408-17. 26. Felippe WT, Felippe MC, Rocha MJ. The effect of mineral trioxide aggregate on the apexification and periapical healing of teeth with incomplete root formation. Int Endod J. 2006 Jan;39(1):2-9. 27. Takita T, Hayashi M, Takeichi O, Ogiso B, Suzuki N, Otsuka K, et al. Effect of mineral trioxide aggregate on proliferation of cultured human dental pulp cells. International Endodontic Journal. [Research Support, Non-U.S. Gov't]. 2006 May;39(5):415-22. 28. Aguirre A, Gonzalez A, Planell JA, Engel E. Extracellular calcium modulates in vitro bone marrow-derived Flk-1+ CD34+ progenitor cell chemotaxis and differentiation through a calcium-sensing receptor. Biochemical and biophysical research communications. [Research Support, Non-U.S. Gov't]. 2010 Feb 26;393(1):156-61. 29. Schraufstatter IU, DiScipio RG, Khaldoyanidi SK. Alpha 7 subunit of nAChR regulates migration of human mesenchymal stem cells. J Stem Cells. [Research Support, N.I.H., Extramural Research Support, Non-U.S. Gov't]. 2009;4(4):203-15. 30. Wondergem R, Ecay TW, Mahieu F, Owsianik G, Nilius B. HGF/SF and menthol increase human glioblastoma cell calcium and migration. Biochemical and biophysical research communications. 2008 Jul 18;372(1):210-5.
Page 76 of 76
31. Choi HD, Noh WC, Park JW, Lee JM, Suh JY. Analysis of gene expression during mineralization of cultured human periodontal ligament cells. J Periodontal Implant Sci. 2011 Feb;41(1):30-43. 32. McCullen SD, Zhan J, Onorato ML, Bernacki SH, Loboa EG. Effect of varied ionic calcium on human adipose-derived stem cell mineralization. Tissue engineering Part A. 2010 Jun;16(6):1971-81. 33. Kardos TB, Hunter AR, Hanlin SM, Kirk EE. Odontoblast differentiation: a response to environmental calcium? Endod Dent Traumatol. [Review]. 1998 Jun;14(3):105-11. 34. Lovelace TW, Henry MA, Hargreaves KM, Diogenes A. Evaluation of the delivery of mesenchymal stem cells into the root canal space of necrotic immature teeth after clinical regenerative endodontic procedure. Journal of Endodontics. [Research Support, Non-U.S. Gov't]. 2011 Feb;37(2):133-8. 35. Torabinejad M, Turman M. Revitalization of tooth with necrotic pulp and open apex by using platelet-rich plasma: a case report. Journal of Endodontics. 2011 Feb;37(2):265-8. 36. Casagrande L, Demarco FF, Zhang Z, Araujo FB, Shi S, Nor JE. Dentin-derived BMP-2 and Odontoblast Differentiation. Journal of Dental Research. 2010;89(6):603-8. 37. Huang GT, Yamaza T, Shea LD, Djouad F, Kuhn NZ, Tuan RS, et al. Stem/progenitor cell-mediated de novo regeneration of dental pulp with newly deposited continuous layer of dentin in an in vivo model. Tissue Eng Part A. 2010 Feb;16(2):605-15. 38. Hernandez EP, Botero TM, Mantellini MG, McDonald NJ, Nor JE. Effect of ProRoot MTA mixed with chlorhexidine on apoptosis and cell cycle of fibroblasts and macrophages in vitro. International Endodontic Journal. [Research Support, Non-U.S. Gov't]. 2005 Feb;38(2):137-43. 39. Pramila R, Muthu MS. Regeneration potential of pulp-dentin complex: Systematic review. Journal of Conservative Dentistry. 2012;15(2):97. 40. Wu J, Huang GTJ, He W, Wang P, Tong Z, Jia Q, et al. Basic Fibroblast Growth Factor Enhances Stemness of Human Stem Cells from the Apical Papilla. Journal of Endodontics. 2012;38(5):614-22. 41. Zhao X, He W, Song Z, Tong Z, Li S, Ni L. Mineral trioxide aggregate promotes odontoblastic differentiation via mitogen-activated protein kinase pathway in human dental pulp stem cells. Molecular Biology Reports. 2011;39(1):215-20. 42. Reyes-Carmona JF, Felippe MS, Felippe WT. Biomineralization Ability and Interaction of Mineral Trioxide Aggregate and White Portland Cement With Dentin in a Phosphate-containing Fluid. Journal of Endodontics. 2009;35(5):731-6. 43. Moghaddame-Jafari S, Mantellini MG, Botero TM, McDonald NJ, Nor JE. Effect of ProRoot MTA on pulp cell apoptosis and proliferation in vitro. Journal of Endodontics. [Research Support, Non-U.S. Gov't]. 2005 May;31(5):387-91. 44. Masuda-Murakami Y, Kobayashi M, Wang X, Yamada Y, Kimura Y, Hossain M, et al. Effects of mineral trioxide aggregate on the differentiation of rat dental pulp cells. Acta Histochem. [Research Support, Non-U.S. Gov't]. 2010 Sep;112(5):452-8.
i
Appendix
Lab Protocols
Cell Culture
The SCAP cells used in all experiments were provided by Dr. Songtao Shi (University of
Southern California, Los Angeles, USA). All cell culture tasks were carried out under a
laminar flow hood. A passage Zero SCAP cell vial stored at -80°C was thawed in a 37ºC
warm water bath and the contents transferred to a T-75 flask (BD Falcon, San Jose, CA)
with 10ml of minimal essential medium alpha Eagle (α-MEM) supplemented with 10%
fetal bovine serum (FBS) and 1% penicillin/streptomycin (Hereinafter “10% FBS
media”) and incubated at 37ºC in 5% CO2 and 100% humidity. After 24 hours, the media
was removed by vacuum pipetting and 10ml of fresh media was added. Cells were
allowed to grow until reaching 80% confluence. At that point the media was removed by
vacuum pipetting and the cells were passaged by adding 3ml of 0.025% Trypsin-EDTA
to the flask and incubating for 5 minutes until the cells detached from the flask and were
visualized floating in the media. Five milliliters of 10% FBS media was added to
inactivate the Trypsin-EDTA. The contents of the flask were transferred to a 15ml
conical tube (BD Falcon, San Jose, CA) and centrifuged for 5 minutes at 1000 RPM at
4ºC. The media was removed via vacuum pipetting and the pellet of cells was re-
suspended in 6ml of 10% FBS media. Three 2ml aliquots of re-suspended cells were then
placed in 3 T-75 flasks each containing 10ml of 10% FBS media and incubated at 37ºC in
5% CO2 and 100% humidity. Cells were used between passages 3 and 5.
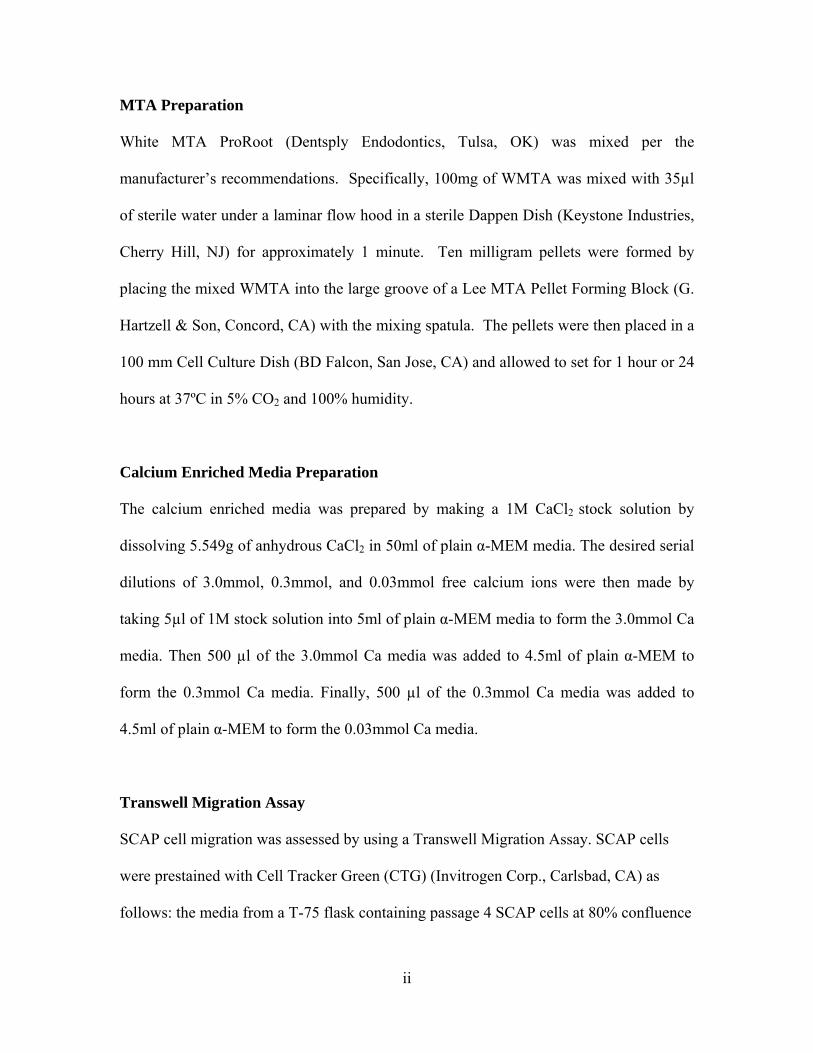
ii
MTA Preparation
White MTA ProRoot (Dentsply Endodontics, Tulsa, OK) was mixed per the
manufacturer’s recommendations. Specifically, 100mg of WMTA was mixed with 35µl
of sterile water under a laminar flow hood in a sterile Dappen Dish (Keystone Industries,
Cherry Hill, NJ) for approximately 1 minute. Ten milligram pellets were formed by
placing the mixed WMTA into the large groove of a Lee MTA Pellet Forming Block (G.
Hartzell & Son, Concord, CA) with the mixing spatula. The pellets were then placed in a
100 mm Cell Culture Dish (BD Falcon, San Jose, CA) and allowed to set for 1 hour or 24
hours at 37ºC in 5% CO2 and 100% humidity.
Calcium Enriched Media Preparation
The calcium enriched media was prepared by making a 1M CaCl2 stock solution by
dissolving 5.549g of anhydrous CaCl2 in 50ml of plain α-MEM media. The desired serial
dilutions of 3.0mmol, 0.3mmol, and 0.03mmol free calcium ions were then made by
taking 5µl of 1M stock solution into 5ml of plain α-MEM media to form the 3.0mmol Ca
media. Then 500 µl of the 3.0mmol Ca media was added to 4.5ml of plain α-MEM to
form the 0.3mmol Ca media. Finally, 500 µl of the 0.3mmol Ca media was added to
4.5ml of plain α-MEM to form the 0.03mmol Ca media.
Transwell Migration Assay
SCAP cell migration was assessed by using a Transwell Migration Assay. SCAP cells
were prestained with Cell Tracker Green (CTG) (Invitrogen Corp., Carlsbad, CA) as
follows: the media from a T-75 flask containing passage 4 SCAP cells at 80% confluence
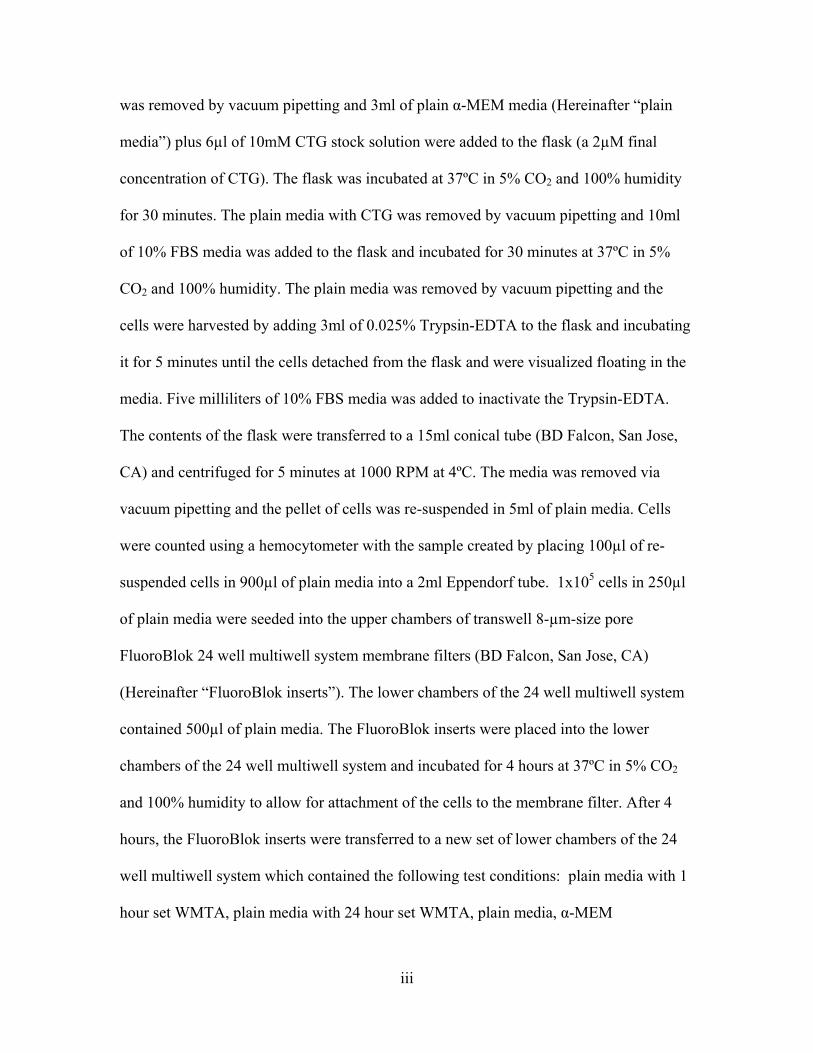
iii
was removed by vacuum pipetting and 3ml of plain α-MEM media (Hereinafter “plain
media”) plus 6µl of 10mM CTG stock solution were added to the flask (a 2µM final
concentration of CTG). The flask was incubated at 37ºC in 5% CO2 and 100% humidity
for 30 minutes. The plain media with CTG was removed by vacuum pipetting and 10ml
of 10% FBS media was added to the flask and incubated for 30 minutes at 37ºC in 5%
CO2 and 100% humidity. The plain media was removed by vacuum pipetting and the
cells were harvested by adding 3ml of 0.025% Trypsin-EDTA to the flask and incubating
it for 5 minutes until the cells detached from the flask and were visualized floating in the
media. Five milliliters of 10% FBS media was added to inactivate the Trypsin-EDTA.
The contents of the flask were transferred to a 15ml conical tube (BD Falcon, San Jose,
CA) and centrifuged for 5 minutes at 1000 RPM at 4ºC. The media was removed via
vacuum pipetting and the pellet of cells was re-suspended in 5ml of plain media. Cells
were counted using a hemocytometer with the sample created by placing 100µl of re-
suspended cells in 900µl of plain media into a 2ml Eppendorf tube. 1x10⁵ cells in 250µl
of plain media were seeded into the upper chambers of transwell 8-µm-size pore
FluoroBlok 24 well multiwell system membrane filters (BD Falcon, San Jose, CA)
(Hereinafter “FluoroBlok inserts”). The lower chambers of the 24 well multiwell system
contained 500µl of plain media. The FluoroBlok inserts were placed into the lower
chambers of the 24 well multiwell system and incubated for 4 hours at 37ºC in 5% CO2
and 100% humidity to allow for attachment of the cells to the membrane filter. After 4
hours, the FluoroBlok inserts were transferred to a new set of lower chambers of the 24
well multiwell system which contained the following test conditions: plain media with 1
hour set WMTA, plain media with 24 hour set WMTA, plain media, α-MEM
iv
supplemented with 2% FBS and 1% penicillin/streptomycin (Hereinafter “2% FBS
media”) with 1 hour set WMTA, 2% FBS media with 24 hour set WMTA, 3.0mmol Ca
media, 0.3mmol Ca media, 0.03mmol Ca media, 2% FBS media, and 10% FBS media.
One pellet of WMTA was used in each well that contained WMTA and 500µl of media
was used in each well. The plate was incubated at 37ºC in 5% CO2 and 100% humidity.
Cells that migrated to the bottom of the FluoroBlok inserts were read by fluorescence at
485/585 nm using a microplate reader (Genius; Tecan, Grödig, Austria) at 30 minutes, 60
minutes, 3, 6, 12, 24, 48, and 72 hours.
WST-1 Proliferation Assay
SCAP cell proliferation was evaluated after exposure to 1h or 24 hr set WMTA in plain
or 2% FBS medium by WST-1 proliferation assay method. The media from a T-75 flask
containing passage 4 SCAP cells at 80% confluence was removed by vacuum pipetting
and the cells were harvested by adding 3ml of 0.025% Trypsin-EDTA to the flask and
incubating it for 5 minutes until the cells detached from the flask and were visualized
floating in the media. Five milliliters of 10% FBS media was added to inactivate the
Trypsin-EDTA. The contents of the flask were transferred to a 15ml conical tube (BD
Falcon, San Jose, CA) and centrifuged for 5 minutes at 1000 RPM at 4ºC. The media was
removed via vacuum pipetting and the pellet of cells was re-suspended in 5ml of plain
media. Cells were counted using a hemocytometer with the sample created by placing
100µl of re-suspended cells in 900µl of plain media into a 2ml Eppendorf tube. 4x10³
cells were seeded into 12 well companion plates (BD Falcon, San Jose, CA) with 1.5ml
of media in the following test conditions: 3 sets of 3 wells containing plain media, 3 sets
v
of 3 wells containing 2% FBS media, 1 set of 3 wells containing 3.0 mmol Ca media, 1
set of 3 wells containing 0.3 mmol Ca media, 1 set of 3 wells containing 0.03 mmol Ca
media, and 1 set of 3 wells containing 10% FBS media. Cell culture transwell inserts, 3-
µm-size pore (BD Falcon, San Jose, CA), were placed into each well. Two WMTA
pellets were placed into the transwell inserts of the test groups as follows: plain media
with 1 hour set WMTA, plain media with 24 hour set WMTA, 2% FBS media with 1
hour set WMTA, and 2% FBS media with 24 hour set WMTA. The plates were
incubated at 37ºC in 5% CO2 and 100% humidity and the media changed every 3 days.
The plates were evaluated at 1, 3, 5, 7, 9, 11 and 14 days via WST-1 Proliferation Assay.
The WST-1 proliferation assay was performed as follows: the transwell inserts
were removed and discarded, the media was removed via vacuum pipetting and 300µl of
new media containing 30µl of WST-1 reagent (Roche, Mannheim, Germany) (1:10
dilution) was added to each well. The plates were incubated at 37ºC in 5% CO2 and 100%
humidity for 1 hour. One-hundred microliters of media plus WST-1 reagent was
transferred from each well in the 12 well plate to a single well in a 96 well plate.
Controls of WST-1 reagent in a 1:10 dilution with plain, 2% FBS, and 10% FBS media
were also placed in wells of the 96 well plate. The absorbance (450mm-685mm) was
determined in a microplate reader (Genius; Tecan, Grödig, Austria).
RT-PCR Analysis
SCAP cell differentiation was evaluated using RT-PCR analysis and gel electrophoresis.
The media from a T-75 flask containing passage 4 SCAP cells at 80% confluence was
removed by vacuum pipetting and the cells were harvested by adding 3ml of 0.025%
vi
Trypsin-EDTA to the flask and incubating it for 5 minutes until the cells detached from
the flask and were visualized floating in the media. Five milliliters of 10% FBS media
was added to inactivate the Trypsin-EDTA. The contents of the flask were transferred to
a 15ml conical tube (BD Falcon, San Jose, CA) and centrifuged for 5 minutes at 1000
RPM at 4ºC. The media was removed via vacuum pipetting and the pellet of cells was re-
suspended in 5ml of plain media. Cells were counted using a hemocytometer with the
sample created by placing 100µl of re-suspended cells in 900µl of plain media into a 2ml
Eppendorf tube. Four-thousand cells were seeded into the wells of 6 well companion
plates (BD Falcon, San Jose, CA) with 3ml of media in the following test conditions: 3
sets of 3 wells containing plain media, 3 sets of 3 wells containing 2% FBS media, 1 set
of 3 wells containing 3.0mmol Ca media, 1 set of 3 wells containing 0.3mmol Ca media,
1 set of 3 wells containing 0.03mmol Ca media, and 1 set of 3 wells containing 10% FBS
media. Three micrometer-size pore transwell cell culture inserts (BD Falcon, San Jose,
CA) were placed into each well. Three WMTA pellets were placed into the transwell
inserts of the test groups as follows: plain media with 1 hour set WMTA, plain media
with 24 hour set WMTA, 2% FBS media with 1 hour set WMTA, and 2% FBS media
with 24 hour set WMTA. The plates were incubated at 37ºC in 5% CO2 and 100%
humidity and the media changed every 3 days. The plates were evaluated at 7, 14 and 21
days via RT-PCR Analysis.
The RNA isolation was performed with the use of an RNeasy Mini Kit (Qiagen,
Valencia, CA) The media was removed from all wells in the 6 well plate by vacuum
pipetting and the cells were harvested by adding 200µl of freshly mixed RLT lysis buffer
(15ml RLT lysis buffer + 150µl 2-merceptoethanol) to each well and vigorously scraping
vii
with a cell scraper (Corning Inc., Corning, NY) for 2 cycles of 2 minutes per well. The
contents of the wells were then agitated by gentle pipetting and transfered to a collection
tube supplied in the kit. All 3 wells for each condition were combined into a single
collection tube (600µl total volume). The collected sample was placed in a QIAshredder
(Qiagen, Valencia, CA) and centrifuged at 13,000 RPM for 2 minutes at 4ºC. The
QIAshredder insert was discarded and 600µl of 70% alcohol was added to the tube. Half
of the sample was placed in a Mini Spin Column from the RNeasy kit and centrifuged at
13,000 RPM for 2 minutes at 4ºC. The remaining sample was passed through the same
Mini Spin Column. The solution that passed into the collection tube was discarded and
700µl of Buffer RW1 was adding to the Mini Spin Column and centrifuged at 13,000
RPM for 15 seconds at 4ºC. The solution that passed into the collection tube was
discarded and 500µl of Buffer RPE was adding to the Mini Spin Column and centrifuged
twice at 13,000 RPM for 15 seconds at 4ºC. The collection tube was discarded. The Mini
Spin Column placed on a new collection tube centrifuged at 13,000 RPM for 2 minutes at
4ºC. The Mini Spin Column was rotated 180° and centrifuged at 13,000 RPM for 1
minute at 4ºC. The Mini Spin Column transferred to a new Eppendorf tube and 35µl of
RNase-Free Water was added to the middle of the Mini Spin Column, which was then
centrifuged at 13,000 RPM for 1 minute at 4ºC. The solution that passed into the
Eppendorf tube was collected by pipette and placed again in the middle of the Mini Spin
Column and centrifuged at 13,000 RPM for 1 minute at 4ºC. The Mini Spin Column was
discarded and the purified RNA sample was contained in the Eppendorf tube. The purity
of the RNA sample was measured on cuvette/spectrophotometer a by placing 1µl of RNA
viii
sample into 100µl of RNase-free water and reading the optical density. Working
solutions were standardized to 100ng for the RT-PCR reactions.
RT-PCR was performed using SuperScript III Platinum kit (Invitrogen Corp.,
Carlsbad, CA). The primer sequences used were as follows: GAPDH (sense 5′
gaccccttcattgacctcaact 3′; antisense 5′ caccaccttcttgatgtcatc 3′; 683-bp amplicon); DSPP
(sense 5′ gaccccttcattgacctcaact 3′, antisense 5′ tgccatttgctgtgatgttt 3′; 181-bp amplicon);
DMP-1 (sense 5′ caggagcacaggaaaaggag 3′, antisense 5′ ctggtggtatcttgggcact 3′; 213-bp
amplicon); and MEPE (sense 5′ gcaaaagcacccatcgtatt 3′, antisense 5′
ctgccctctacaaggctgac 3′; 385-bp amplicon). For each sample, 5µl of 100ng working
solution was placed in a 0.2ml PCR tube with 25µl of 2X Reaction Mix, 2µl sense primer,
2µl anti-sense primer, 1µl Taq enzyme, and 15µl of RNase-free water. The PCR tube
was tightly capped and placed in a Mastercycler gradient machine (Eppendorf North
America, Hauppauge, NY). Polymerase chain reaction (PCR) was performed with 35
cycles of denaturation at 94°C for 45 sec, annealing at 57°C for 45 sec, and extension at
72°C for 60 sec.
The RT-PCR products were evaluated by electrophoresis in 2% agarose gels stained with
ethidiumbromide. The 2% agarose gels were made by combining 2g UltraPure agarose
(Invitrogen Corp., Carlsbad, CA) with 100ml TAE (1X) buffer in a 125ml Erlenmeyer
flask and microwaving for 1-1.5 minutes until the solution was clear, then adding 5µl of
ethidiumbromide to the flask and swirling to mix thoroughly. The gel mixture was then
poured into a 15cm x 10 cm Gel Caster (Bio-Rad, Hercules, CA) with a 20 well comb
and allowed to set for 45 minutes. Well #1 in each gel was loaded with 5µ of loading dye
and 10µl of 100kb Plus DNA Ladder (Life Technologies, Grand Island, NY), 15µl of
ix
sample and 5µl of dye were loaded into the sample wells. The gels were connected to a
Bio-Rad Power Pak 300 (Bio-Rad, Hercules, CA) and run at 80V for 45 minutes. Gel
photographs were taken with a Kodak EDAS 290. A densitometric analysis was
performed using ImageJ software (NIH). This experiment was repeated 3 times in
triplicate.
Flow Cytometric Analysis
SCAP cells from passages 2 and 10 were evaluated by Flow Cytometry to characterize
the cell population of each passage. A buffer solution of 2% FBS in PBS (hereinafter
“buffer”) was made for use in the dilution of the antibodies. The media from a T-75 flask
containing passage 2 and 10 SCAP cells at 80% confluence was removed by vacuum
pipetting and the cells were harvested by adding 3ml of 0.025% Trypsin-EDTA to the
flask and incubating it for 5 minutes until the cells detached from the flask and were
visualized floating in the media. Five milliliters of 10% FBS media was added to
inactivate the Trypsin-EDTA. The contents of the flask were transferred to a 15ml
conical tube (BD Falcon, San Jose, CA) and centrifuged for 5 minutes at 1000 RPM at
4ºC. The media was removed via vacuum pipetting and the pellet of cells was re-
suspended in 5ml of plain media. Cells were counted using a hemocytometer with the
sample created by placing 100µl of re-suspended cells in 900µl of plain media into a 2ml
Eppendorf tube. 5x10⁵ cells were seeded into 5ml polystyrene round-bottom tubes (BD
Falcon, San Jose, CA) and centrifuged for 5 minutes at 1000 RPM at 4ºC. The
supernatant was discarded via gentle vacuum pipetting and the pellet of cells was re-
suspended in 100µl of 5% bovine serum albumin (BSA) and incubated on ice for 30
x
minutes. The samples were then centrifuged for 5 minutes at 1000 RPM at 4ºC and the
supernatant was discarded via gentle vacuum pipetting. The pellet of cells was re-
suspended in 1ml of PBS, centrifuged for 5 minutes at 1000 RPM at 4ºC, the supernatant
was discarded via gentle vacuum pipetting, and this step was repeated with an additional
1ml of PBS (Hereinafter “wash cycle”). A control sample from each passage was then re-
suspended with 100µl of buffer and incubated in the dark on ice until read by flow
cytometry. The supernatant from the remaining tubes was discarded via gentle vacuum
pipetting and the samples divided into 3 groups based on the antibody staining received.
In the CD146 group, the pellet of cells was re-suspended in 100µl of 1:11 (1µl
antibodies/11µl buffer) human CD146-APC antibodies (Milenyi Biotec, Auburn, CA)
and incubated in the dark on ice for 30 minutes. The samples were then centrifuged for 5
minutes at 1000 RPM at 4ºC and the supernatant was discarded via gentle vacuum
pipetting and a wash cycle performed. The supernatant was discarded via gentle vacuum
pipetting and samples from each passage were then re-suspended with 100µl of buffer
and incubated in the dark on ice until read by flow cytometry. Next, in the CD24 group
the pellet of cells was re-suspended in 100µl of 2:10 (2µl antibodies/10µl buffer) PE
mouse anti-human CD24 antibodies (BD Pharmingen, San Jose, CA) and incubated in the
dark on ice for 30 minutes. The samples were then centrifuged for 5 minutes at 1000
RPM at 4ºC and the supernatant was discarded via gentle vacuum pipetting and a wash
cycle performed. The supernatant was discarded via gentle vacuum pipetting and samples
from each passage were then re-suspended with 100µl of buffer and incubated in the dark
on ice until read by flow cytometry. Then, in the STRO-1-FITC group the pellet of cells
was re-suspended in 100µl of 1:25 (1µl antibodies/25µl buffer) mouse anti-STRO-1
xi
primary antibodies (Invitrogen Corp., Carlsbad, CA) and incubated in the dark on ice for
60 minutes. The samples were then centrifuged for 5 minutes at 1000 RPM at 4ºC and the
supernatant was discarded via gentle vacuum pipetting and a wash cycle performed. The
supernatant was discarded via gentle vacuum pipetting and a control sample from each
passage was then re-suspended with 100µl of buffer and incubated in the dark on ice until
read by flow cytometry. The pellet of cells in the remaining tubes were re-suspended in
100µl of 1:100 (1µl antibodies/100µl buffer) FITC rabbit anti-mouse IgG conjugate
antibodies (Invitrogen Corp., Carlsbad, CA) and incubated in the dark on ice for 30
minutes. The samples were then centrifuged for 5 minutes at 1000 RPM at 4ºC and the
supernatant was discarded via gentle vacuum pipetting and a wash cycle performed. The
supernatant was discarded via gentle vacuum pipetting and samples from each passage
were then re-suspended with 100µl of buffer and incubated in the dark on ice until read
by flow cytometry. A control tube of cells stained with only the FITC rabbit anti-mouse
IgG conjugate antibodies for each passage was also made. All samples were re-
suspended with a pipette prior to flow cytometry. The samples were processed at the
University of Michigan Life Science Center Flow Cytometry Core on a BD FACSAria3
Flow Cytometry machine using the BD FACSDiva software and 10,000 events.
Gray MTA Pilot Studies SCAP cell proliferation in the presence of gray MTA (GMTA) (Gray MTA ProRoot
Dentsply Endodontics, Tulsa, OK) was evaluated using the WST-1 proliferation assay
method. The media from a T-75 flask containing passage 4 SCAP cells at 80%
confluence was removed by vacuum pipetting and the cells were harvested by adding 3ml
of 0.025% Trypsin-EDTA to the flask and incubating it for 5 minutes until the cells
xii
detached from the flask and were visualized floating in the media. Five milliliters of 10%
FBS media was added to inactivate the Trypsin-EDTA. The contents of the flask were
transferred to a 15ml conical tube (BD Falcon, San Jose, CA) and centrifuged for 5
minutes at 1000 RPM at 4ºC. The media was removed via vacuum pipetting and the
pellet of cells was re-suspended in 5ml of plain media. Cells were counted using a
hemocytometer with the sample created by placing 100µl of re-suspended cells in 900µl
of plain media into a 2ml Eppendorf tube. 4x10³ cells were seeded into the wells of 12
well companion plates (BD Falcon, San Jose, CA) with 1.5ml of media in the following
test conditions: 7 sets of 3 wells containing 2% FBS media, 1 set of 3 wells containing
plain media, and 1 set of 3 wells containing 10% FBS media. 3-µm-size pore transwell
cell culture inserts (BD Falcon, San Jose, CA) were placed into each well. Twenty-four
hour set GMTA and WMTA pellets were placed into the transwell inserts of 6 sets of the
wells containing 2% FBS media as follows: 3 pellets of GMTA, 6 pellets of GMTA, 9
pellets of GMTA; and 3 pellets of WMTA, 6 pellets of WMTA, 9 pellets of WMTA.
Additionally, 4x10³ cells were seeded into the wells of 12 well companion plates (BD
Falcon, San Jose, CA) with 1.5ml of media in the following test conditions: 7 sets of 3
wells containing 2% FBS media, 1 set of 3 wells containing plain media, and 1 set of 3
wells containing 10% FBS media. Prior to cell seeding, GMTA and WMTA pellets were
freshly mixed and placed wet into the 6 sets of the wells that would contain 2% FBS
media as follows: 3 pellets of GMTA, 6 pellets of GMTA, 9 pellets of GMTA; and 3
pellets of WMTA, 6 pellets of WMTA, 9 pellets of WMTA. The wet GMTA and
WMTA pellets were spread over the bottom surface of the well to provide a uniform
thickness covering the bottom of the well. The plates were then placed in an incubator

xiii
and allowed to set for 24 hours at 37ºC in 5% CO2 and 100% humidity. The plates were
incubated at 37ºC in 5% CO2 and 100% humidity and the media changed every 3 days.
The plates were evaluated 7 days via WST-1 proliferation assay.
The WST-1 proliferation assay was performed as previously described in the
WST-1 Proliferation Assay protocol.