The Effect of Urban Tree Canopy on Residential Energy Use · The Effect of Urban Tree Canopy on...
79
The Effect of Urban Tree Canopy on Residential Energy Use A Worcester Polytechnic Institute Interactive Qualifying Project Advisors: Professor Nancy Burnham, Professor Robert Krueger Sponsor: Executive Office of Energy and Environmental Affairs Project Team Members: Zhichao Liao James Post Eric Petrin
Transcript of The Effect of Urban Tree Canopy on Residential Energy Use · The Effect of Urban Tree Canopy on...

The Effect of Urban Tree Canopy on
Residential Energy Use
A Worcester Polytechnic Institute Interactive Qualifying Project
Advisors: Professor Nancy Burnham, Professor Robert Krueger
Sponsor: Executive Office of Energy and Environmental Affairs
Project Team Members:
Zhichao Liao
James Post
Eric Petrin

i
Abstract
Our project aims to verify that tree canopy can help reduce residential utility levels. The loss of
over 30,000 trees in Worcester due to the Asian Longhorn Beetle became the motivation for determining
tree canopy‟s economic value. Unfortunately, the correlation between the tree canopy and energy usage
is ambiguous. The challenges encountered from this project have aided the team in developing
recommendations for better conditions for future teams to continue research of this kind.

ii
Acknowledgements
The team would like to acknowledge the many people who contributed their
efforts to helping the team construct this project and make it through the challenging
research process: Professor Nancy Burnham and Professor Robert Krueger, for their
invaluable input and assistance throughout the entire Interactive Qualifying Project term;
Professor Verna DeLauer, for all the help and feedback she provided us in preparation for
our research at the Worcester project center; Celia Riechel, our sponsor and EEA
representative, for her valuable input in designing our report, and for providing us the
opportunity to make the project extend beyond the academic boundaries. Lastly, we
would like to thank those residents of the Burncoat and Greendale neighborhoods of
Worcester who chose to participate in this pilot research study.

iii
Contents
List of Tables .............................................................................................................................. v
List of Figures ............................................................................................................................ vi
Authorship ................................................................................................................................ vii
Executive Summary ................................................................................................................... ix
1. Introduction ............................................................................................................................. 1
1.1 Climate change indicators .................................................................................................. 1
1.2 Background of the Asian longhorn beetle ........................................................................... 2
1.3 Project purpose .................................................................................................................. 4
1.4 Project methods ................................................................................................................. 4
2. Background ............................................................................................................................. 6
2.1 Global Warming Solutions Act .......................................................................................... 6
2.2 Statewide energy use and residential energy use................................................................. 6
2. 3 Massachusetts‟ housing problem ....................................................................................... 7
2.4 New energy solution .......................................................................................................... 7
2.5 Tree canopy ....................................................................................................................... 7
2.6 Sponsor and background .................................................................................................... 8
2.7 Significance ....................................................................................................................... 9
3. Research Methods ................................................................................................................. 11
3.1 Research Questions.......................................................................................................... 12
3.1.1 Research question 1 .................................................................................................. 12
3.1.2 Research Question 2 ................................................................................................. 12
3.2 Description and justification for methods ......................................................................... 13
3.3 Interview Questions ......................................................................................................... 14
3.4 AutoCad .......................................................................................................................... 15
3.5 Checklist for completion during resident survey ............................................................... 16
4. Data Collection ..................................................................................................................... 17
4.1 Stimulating local interest ................................................................................................. 17
4.2 Raising project awareness ................................................................................................ 17
4.3 Contacting residents personally........................................................................................ 18
4.4 Appointment Procedure ................................................................................................... 20

iv
4.5 Unexpected difficulties .................................................................................................... 20
4.6 Normalizing data for heating and cooling degree days...................................................... 21
5. Findings ................................................................................................................................ 24
5.1 Heating and cooling comparisons..................................................................................... 24
5.2 Normalized fuel and electrical comparisons ..................................................................... 27
5.2.1 Normalized fuel usage comparison ............................................................................ 27
5.2.2 Electrical usage comparisons .................................................................................... 29
5.3 AutoCad Drawings .......................................................................................................... 31
6. Discussions and Recommendations ....................................................................................... 34
6.1 Acquiring Participants ..................................................................................................... 34
6.2 Direct Contact ................................................................................................................. 35
6.3 Weather complications .................................................................................................... 36
6.4 Varying data levels .......................................................................................................... 36
7. Conclusion ........................................................................................................................ 38
Appendix I: Project Milestone ................................................................................................... 39
Appendix II: Personalized letter ................................................................................................ 41
Appendix III: Interview Checklist ............................................................................................. 42
Appendix IV: AutoCad Drawings for each visited property ....................................................... 45
Appendix V: Summary ofbasic property information ................................................................. 55
Appendix VI: Fuel and electrical usage ..................................................................................... 56
Appendix VI.1 Fuel usage ..................................................................................................... 56
Appendix VI.2 Electrical usage ............................................................................................. 56
Appendix VII: Normalized data ................................................................................................. 57
Appendix VII.1 Normalized fuel data .................................................................................... 57
Appendix VII.2 Normalized electrical data ............................................................................ 58
Appendix VII.3: Heating season electrical usage comparison ................................................. 60
Appendix VIII: Power point presentation................................................................................... 61
Works Cited .............................................................................................................................. 67

v
List of Tables
Table 1:Heating Degree Days ........................................................................................ 22
Table 2:Cooling degree days ......................................................................................... 22
Table 3 Summary data collection ................................................................................... 35

vi
List of Figures
Figure 1: Hillcroft Avenue before trees were removed ..................................................... 3
Figure 2: Same location on Hillcroft Ave. after removal .................................................. 3
Figure 3: Oil usage ........................................................................................................ 25
Figure 4: Gas usage ....................................................................................................... 25
Figure 5:Electrical Usage .............................................................................................. 26
Figure 6: Normalized fuel usage in winter ..................................................................... 28
Figure 7: Electrical usage in winter................................................................................ 29
Figure 8: Normalized electrical usage in the cooling season .......................................... 30
Figure 9: AutoCad Example .......................................................................................... 32

vii
Authorship
James Post
1.1 Climate change indicators
1.2 Background of the Asian longhorn beetle
1.3 Project purpose
1.4 Project methods
2.1 Global Warming Solutions Act
2.2 Statewide energy use and residential energy use
2. 3 Massachusetts‟ housing problem
2.6 Sponsor and background
3.1.2 Research Question 2
3.2 Description and justification for methods
4.1 Stimulating local interest
4.2 Raising project awareness
4.3 Contacting residents personally
4.4 Appointment Procedure
5.1 Heating and cooling comparisons
6.2 Direct Contact
6.3 Weather complications
7. Conclusion
Appendix II: Personalized letter
Zhichao Liao
2.4 New energy solution
2.5 Tree canopy (part 2/2)
2.7 Significance
3.4 AutoCad
4.5 Unexpected difficulties
4.6 Normalizing data for heating and cooling degree days

viii
5.2.1 Normalized fuel usage comparison
5.2.2 Electrical usage comparisons
5.3 AutoCad Drawings
6.1 Acquiring Participants
Appendix I: Project Milestone
Appendix III: Interview Checklist
Appendix IV: AutoCad Drawings for each visited property
Appendix V: Summary of basic property information
Appendix VI: Fuel and electrical usage
Appendix VII: Normalized data
Appendix VIII: Power point presentation
Eric Petrin
2.5 Tree canopy (part 1/2)
3.1.1 Research question 1
3.3 Interview Questions
3.5 Checklist for completion during resident survey
6.4 Varying data levels
ix
Executive Summary
To address the causes and anticipated consequences of global climate change,
Massachusetts passed the Global Warming Solutions Act in late 2008. The legislation
requires that statewide emissions of greenhouse gasses (GHG) be reduced from 1990
levels by 80% by 2050, and 25% by 2020. Of the three major CO2 emitting sectors
identified for emission level reductions, the building sector represents a particularly
major emission source, with heating, ventilation and air conditioning (HVAC)
comprising nearly 70% of total household energy use. In order to substantially reduce
the high level of energy consumption in the residential sector, an alternative energy
reduction strategy will need to be implemented that does not require a tremendous
investment by the state.
Over the past term, the Urban Tree Cover Interactive Qualifying Project (IQP)
team has been working under the guidance of the Executive Office of Energy and
Environmental Affairs to produce measured data that would either support or refute the
belief of the possible economic benefit provided by tree canopy to urban residencies.
Widely believed to reduce heating and cooling costs in buildings, tree cover is seen as a
possible low-cost and low-maintenance strategy to reduce the energy usage in the
residential sector of the state. In order to produce measured data of the impact of tree
canopy, the team set out to measure the changes in energy consumption from residents in
Worcester who had lost trees on their property due to the Asian long-horned beetle.
To measure the impact of tree canopy on energy consumption, the team set out to
acquire willing participants for the study to measure the electricity and fuel levels from
before and after the removal of trees from their respective properties. Due to most of the
trees having been removed in early 2009, utility levels were calculated for 2008 and
2010, to measure the change (if any) in consumption levels. By normalizing each
gathered monthly rate with each year‟s heating and cooling degree days, any variance in
temperature for those years would be accounted. Diagrams of each property were also
constructed to illustrate the number of trees on each property, as well as their location on
the property and estimated canopy size.
Throughout the entire data gathering process, the project team faced many
unanticipated challenges that influenced the overall results of the research. The
extremely low resident response rate during the initial stages of research not only
demonstrated the lack of interest in the potential benefits the project could produce, but
also forced the project team to lower the expected number of willing participants from 30
to 10. Though 10 participants were interviewed, they frequently provided the team with
inconsistent utility rates. Often to make up for missing monthly usage rates, estimates for
fuel or electricity levels would have to be made based upon whatever information each
resident was able to provide upon the appointment.
Due to the challenges faced during the entire data collection process, the project
team shifted the central focus of the research from the results of the research, to the

x
construction of the proper methodological approach. By modifying each data collection
process to account for the unanticipated challenges faced during research, the team
produced a working data collection strategy to aid any and all future research of this type.

1. Introduction
1.1 Climate change indicators
The U.S Environmental Protection Agency states that “Climate change represents
the state of certain environmental conditions in an area and a specified period of time.
Examples of climate change indicators include temperature, precipitation, sea level, and
greenhouse gas concentrations in the atmosphere (EPA, 2010).”
Carbon dioxide is one of the primary greenhouse gas emissions that are stored in
our atmosphere. It is produced, along with other emissions, as a result of the widespread
industry on which our national economy relies. A build-up of these emissions causes
radiation from the sun to become trapped in our atmosphere, known as the “greenhouse
effect”. The resulting entrapment of the suns energy causes the overall increase in
average worldwide temperatures (WWF, 2010).
Trees, green plants and certain species of algae essentially serve as the lungs of
our planet. Through the process of photosynthesis, trees absorb carbon dioxide and expel
breathable oxygen (EPA, 2010). By storing CO2 within their living structure, trees
actively reduce the level of emissions in the atmosphere. This characteristic, which every
plant that undergoes photosynthesis possesses, represents a necessary and important role
in the environment and is vital for all aerobic life on earth.

ii
The benefits provided by trees to the environment and developed communities
stretch beyond the reduction of atmospheric CO2 concentrations. While no statistical
data exists to prove so, it is widely believed that the existence of trees in residential and
urban communities produces a considerable and measureable reduction in levels of
energy consumption.
1.2 Background of the Asian longhorn beetle
On August 7th, 2008, Asian Long-horned Beetles were discovered in Worcester,
MA (MIPOP, 2010). Native primarily to China and Korea, the Asian long-horned beetle
(ALB) is an invasive species of insect that has caused the destruction of trees on a
massive scale. The beetle destroys deciduous hardwood trees, such as maple, elm and
poplar by cutting off the flow of nutrients between the trunk, roots, and stem. Since the
discovery, ALB‟s have caused the destruction of over 30,000 trees in Worcester alone,
leaving once lush neighborhoods completely bare. The neighborhoods of Burncoat and
Greendale were the most severely affected. A quarantine zone of about 94 square miles
has been established around the area, prompting efforts to remove the beetle and control
any further damage that it may cause to the city (MIPOP, 2010).
Below are images demonstrating clear examples of the damage caused as a result
of the ALB. Both shots were taken from the same location on Hillcroft Avenue before
and after the trees were removed by the city to control further infestation.

iii
Figure 1: Hillcroft Avenue before trees were removed
Figure 2: Same location on Hillcroft Ave. after removal

iv
1.3 Project purpose
The purpose of this research project is to investigate the influence of tree canopy
cover in order to obtain empirical data that will support or refute an existing theory.
Evidence from other climates has suggested that tree canopy reduces energy demand. A
study of this type has never been conducted before, and if successful, will provide
valuable information concerning the economic benefits of trees, as well as the proper
methodology for future research of this type.
Much of the research for the project will include conducting interviews with
willing residents who have lost trees on their property as a result of the ALB. During the
interviews the team will be gathering important structural information of the house,
utility figures, and details of the particular trees that were removed. With this collection
of empirical data, the mostly qualitative research that the team will undergo will be
supplemented by practical quantitative research as well. The objective is to analyze the
effected residents‟ energy usage before and after the Asian Longhorn Beetle infestation to
further prove how important the economic benefit provided by trees is to urban
communities.
1.4 Project methods
Continuing upon research from a previous project, the data the team will need to
obtain and analyze will either support or refute the existing theory of tree canopy as an
energy reduction strategy. These claims of course, were made based on research
measuring the perception that residents of the Burncoat and Greendale areas have on the

v
economic value of trees in their community. While these assertions provided a useful
understanding of how residents felt about their energy consumption, they still lacked
solid evidence showing that in fact, tree canopy does have an effect upon consumption
levels. The resulting data will be utilized to formulate a solid claim of the impact of tree
cover on urban residential energy consumption throughout the state and general region.
Worcester of course, is only a subset of the entire urban population, but the information
gathered would provide accurate representations of other residential areas with similar
characteristics

vi
2. Background
2.1 Global Warming Solutions Act
In August of 2010, Massachusetts passed the Global Warming Solutions Act,
making it one of the first states to develop a comprehensive regulatory program to
address the growing climate change issue (Mass, 2008). The program requires the state
to reduce greenhouse gas emissions by 80% from 1990 levels, by 2050, as well as a 25%
reduction by 2020. In Massachusetts, the building sector is one of the three major areas
identified in the Draft Climate Implementation Plan as being crucial for meeting these
mandated emission reduction levels (MassDEP, 2008).
2.2 Statewide energy use and residential energy use
In the United States, fossil fuel burning is the largest source of carbon dioxide
emissions. The consumption of energy in the United States is approximately 89.4% from
the burning of fossil fuels. Among this percentage, 39.1% comes from oil, 25.9% from
natural gases, and 24.4% from coal (Stewart, 2009). Annually, residential energy use is
18% of total energy use statewide, accounting for 16% of greenhouse gases emissions.
Heating, ventilation, and air conditioning systems comprise the largest portion of
residential energy demand; 66% of household energy use goes to heating alone (EEA,
2010). Residential energy consumption is increasing because houses are getting larger
central air conditioning systems are increasingly prevalent, and air conditioning systems
are being run with greater frequency. Residential building electricity consumption for
cooling is one of the few energy uses that are projected to grow in the future, despite
improving technology (EEA, 2010).

vii
2. 3 Massachusetts’ housing problem
One characteristic that many houses in Massachusetts share is their age. Nearly
75% of homes were built before 1980, with 44% having been built before 1940 (EEA,
2010). Generally, this means that the homes have poor or almost no insulation, as well as
older and much less efficient HVAC systems. With these current circumstances, there is
considerable room for increasing the temperature control efficiency of these homes,
which would be a significant step in reducing statewide emissions. Whether or not such
upgrades can be undertaken however, is another consideration. The means by which old
houses can be made efficient is extremely expensive. The costs of upgrading these
houses would require a substantial investment from the state, as well as the owner (EEA,
2010).
2.4 New energy solution
There is a need for a residential energy-reduction strategy that is both low-cost
and low-maintenance. The solution must have the ability to be implemented across
residential neighborhoods that can minimize the obligations of landlords and capitalize
on the capacities of the tenants. Properly planting trees in strategic positions in these
residential areas may be that solution.
2.5 Tree canopy
Tree canopy cover is a very effective way to reduce heating and cooling costs in
many buildings. A study at Florida International University has shown that 50-60% of
energy needed for air conditioning can be eliminated by planting trees in a specific way

viii
around the house (Herald Staff, 1991). Evapotranspiration, which is a combination of
water evaporating into the atmosphere and trees releasing water through respiration
(Lydersen, 2009) is responsible for preventing heat exchange by reducing temperatures in
the building envelope (EEA, 2010). Not only can trees prevent warm air from getting in
during the summer, but also prevent cold air from getting in during the winter (EEA,
2010).
Tree canopy is estimated to provide approximately 15% savings in energy costs
for cooling and heating (EEA, 2010). The mechanisms for savings on cooling costs are:
preventing solar heat absorption through direct shading of windows and walls; and, when
adopted on a widespread basis, lowering ambient air temperatures in the urban areas by
1-3 °C (i.e. reducing the Urban Heat Island effect). Large deciduous trees placed within
15 feet of the Southeast and Southwest walls of a house have been shown to achieve
somewhat optimal energy savings. The primary means by which heating energy is
reduced is by reducing infiltration of cold outdoor air. This is especially relevant to the
high number of older, less insulated homes in Worcester. This is best achieved by
conifer trees planted on the North or Northwest side of the house. All of these techniques
reduce the amount of work required by heating and cooling systems (EEA, 2010).
2.6 Sponsor and background
The sponsor of the research project, the Executive Office of Energy and
Environmental Affairs (EEA) has presented the team with the challenge that, if carried
out successfully, could help neighborhoods across the state reduce energy costs and the

ix
state to meet its mandated GHG emissions reduction goals. The EEA is charged with
preserving the land, air, water, and other natural resources of the Commonwealth,
regulating energy resources and sustainability, among other things. Last year, with the
aid of the EEA, students at WPI worked on a research project entitled “Assessing
Ecosystem Service Values Provided by Urban Trees”, where they assessed the values that
ecosystems provide and local resident‟s knowledge of such. The particular
neighborhoods they focused on were the Greendale and Burncoat areas of Worcester,
both of which were severely damaged by the Asian long-horned beetle.
The extent of the damage caused by the Asian long-horned beetle is still very
difficult to determine, but its effects are made chillingly clear every day. According to
Clint McFarland, manager of the U.S. Department of Agriculture‟s ALB Eradication
Program, about 75% of the trees between the Faulkner Hospital in Boston and Route 70
will have to come down (Crowley, 2010). Residents of the Burncoat and Greendale areas
of Worcester witnessed firsthand the destructive nature of the ALB, having lost almost
every deciduous tree in the area to the unfortunate infestation. The investigation of the
project will focus on these two neighborhoods, because the team believes that the extent
of the ALB damage goes far beyond aesthetical considerations.
2.7 Significance
While the removal of so many trees has taken its emotional and financial toll on
the residents of Worcester and the state of Massachusetts, it does present a unique
scenario that could provide evidence for a new energy reduction strategy in the state.

x
This project will be a natural case study to support or refute the theory that tree canopy
cover benefits energy conservation. This project will not only serve to educate locals‟
alternative energy conservation strategies, but will also produce measured energy savings
data and appropriate research methodology for research initiatives of this kind.

xi
3. Research Methods
The project team‟s objectives will be the collection of relevant data to support the
task of determining the economic value provided tree canopy. As the team carries this
process out, they must keep in mind the ultimate results that this information will help
achieve. Maintaining sufficient tree canopy cover around houses may significantly
decrease heating and cooling expenditures as well as increasing air quality and property
value. In order for the team to determine the impact of the ALB on energy demand, they
need to measure any major differences in levels of energy consumption in the Worcester,
as a subset of other urban populations. If the findings support this existing theory, it
would shed new light on an energy reduction strategy that could potentially help the state
of MA lower GHGs.
There is no question of the damaging effects that the ALB has caused to the
residents of Worcester. For almost two years, residents have been „fighting‟ the insect in
a losing battle that has taken its toll not only on the hearts of the people, but also their
wallets (Telegram, 2010). The type of information that the team will to collect, among
many other measurable land variables, will include electric and fuel consumption levels
from before and after the trees were removed, household temperature settings, and the
specifics on each tree lost to the ALB for individual properties. After the team gathers
sufficient data for analysis, they will be able to present a valid response to the question of
how tree canopy cover affects residential energy use.

xii
3.1 Research Questions
3.1.1 Research question 1
Question: Have energy levels changed as a result of removal of trees due to the
Asian long horned beetle?
In order to prove the legitimacy of tree canopy as an alternative energy conservation
strategy, measured changes in utility costs will need to be gathered from a diverse set of
properties. Naturally, the team will have to visit individual properties at the residents‟
convenience in order to obtain reliably sets of data for analysis
3.1.2 Research Question 2
Question: Can we attribute the change in energy to tree loss/orientation/type?
The most important variable in this question is energy levels of homes in Worcester, and
if they have increased or decreased since the infestation of Asian Long-Horned Beetles.
In order to accurately determine whether or not the Asian Long-Horned Beetle infestation
had a significant effect on a home‟s energy levels, the project team will first have to find
data of the house‟s energy levels at some point before the infestation; and also measure
the energy usage at its present level. However, the team will have to take note of other
variables which may have altered the energy level, such as: age of the house
(construction and last major renovation), when/how many trees have been planted/cut
down (not necessarily due to the ALB), which/how many appliances were used in the
house, if the family took vacations, or if they used their appliances more/less for different
reasons. Naturally, to find out most of this information, the team will have to go to the

xiii
homes of the residents. To find out these variables, the team will either have to ask the
residents of the house or make a personal measurement on their property. A full list of
these variables, as well as the methods of discovering them, is found in section 3.5.
3.2 Description and justification for methods
In order for the project team to be successful in acquiring the information
necessary to support the economic value of trees, they will need to plan out proper
research acquiring methods as well as goals to meet prior to our research.
The first objective would be informing the residents of the Burncoat and
Greendale areas of Worcester of our intentions and the purpose of our research. It is
understandable that due to the nature of the project and the type of information we‟re
gathering, many residents would be hesitant to freely provide private billing information.
The team will need to conduct research respectably and professionally in order to
increase the overall rate of success and efficiency of the data collection process. Early
notification of the residents will be made through a number of flyers which we will
posted in and around the neighborhoods, providing basic introductory information of who
they are, what the project is, and the purpose for our research.
The following is a short list of the initial steps to take in our data gathering process.
Inform residents of the team‟s identity, what the project is, and how it would benefit
them.

xiv
Meet residents in person for formal introduction
Discuss project in detail
Schedule future day and time for data collection on that property
Ensure resident is able to obtain electrical and heating information
After the team makes introductions and inform the residents of the data they‟re
gathering, they will need to set up a schedule for us to follow which would be given to
the residents. This master schedule would inform them of the specific date and time the
team would be visiting their property to take all the necessary measurements for analysis.
This would also give the residents the date by which to have the electrical and other
energy information available for the team to record. Depending on the difficulty of
obtaining past and present energy consumption information, it is assumed that we would
not need to inform the residents of how to acquire this information for the project team.
When the team finally begins the process of visiting properties for data collection, it will
be very important to include as many different types of variables as possible that could
influence the results. Once this data is recorded for the first few houses, and the team
becomes proficient at gathering data, they will split up into two teams in order to visit
more houses in less time, to maximize efficiency.
3.3 Interview Questions
Have you noticed an increase/decrease in your heating/cooling bills since the removal of
trees on your property?

xv
When was your house built, and when was the last major renovation?
When were the trees destroyed by the beetles removed from your property?
What major appliances do you own? How often do you use them?
What is the size of your house lot?
What type of HVAC system do you use? Has it ever had to be repaired?
Are there any other factors which may affect your household energy levels?
Is it okay if the team measures the aspects of your house, and if they look around your
yard and record the type/size/location of your trees? Could you also possibly walk
around your yard with us to point out locations of stumps which may not be obvious?
For our next visit, could you please have your electric and heating bills ready?
3.4 AutoCad
Besides providing 3-D plots, the team will also provide drawings of the properties
around the house by using the computer program AutoCad. In order to provide more
clarified information, drawings will contain some elements, such as street outside of the
house, sidewalk, driveway, walkway between driveway and house, house with
dimensions, trees with numbers (circles with estimated area where branches can spread
out), distances between centers of trees and the house, types of trees, and estimated
height of trees. The AutoCad drawings will provides clear ideas of where the removed
trees were. Having these drawings can help the team to have more accurate
determinations of the significance of tree canopy to the energy change, if there are
changes in energy expenses.

xvi
3.5 Checklist for completion during resident survey
Red = found by resident inquiry Black=found by personal measurement
- age of the house ( construction and last renovation)
- aspect of the house: windows, walls
- size of lot
- type of HVAC system
- frequency of appliance use
- temperature settings
- energy source
- Energy usage by month and fuel type
- type, size, location of trees
- date of tree removal
- other possible explanatory variables, e.g. vacation dates, behavior change, other major
appliance purchases/changes
- Anecdotal evidence: Do people notice change before and after ALB removals?
Upon the conclusion of the Burncoat and Greendale residential interviews and tree study,
it will be time to analyze our data and determine the important considerations in
determining the impact of tree canopy. At this point in our study we have 4 participants
in total, almost half of the expected quota of ten surveys. Data from every property has
varied considerably, so it is important for us to clearly define the most important
variables that are consistent with each location.

xvii
4. Data Collection
4.1 Stimulating local interest
Initially, in order to expedite the overall process of gathering participants for
research the team took several steps to ensure that the residents of the Burncoat and
Greendale neighborhoods were aware of our presence, as well as the overall purpose of
our research in their community. In response to a recommendation from a particular
enthusiastic local, part of the team made an appearance on the Jordan Levy News
Program on FM 94.1. Jordan Levy was originally the mayor of Worcester but now hosts
a radio program where he discusses local and statewide issues in depth. Being familiar
with all the damage caused by the ALB, Mr. Levy allowed us to discuss our project in
depth on the air in order to further inform the public of our objectives. While the
experience in itself stimulated local interest, demonstrated by the phone calls received in
the studio, it did not fulfill its purpose of inciting locals to contact us for participation
4.2 Raising project awareness
To raise local awareness of our presence in the community, the team posted flyers
in and around the Burncoat and Greendale areas. The purpose of which was to introduce
ourselves and inform the residents of our project and intentions. Despite leaving contact
information for any and all interested in the study, only two responses were received and
no appointments were actually scheduled.

xviii
With little feedback received from the posted flyers, a more direct approach was
taken by delivering personalized letters to individual properties explaining in detail the
purpose of the project and requesting participation.
Over 150 personalized letters requesting participation were delivered to
residencies known to have lost trees due to the ALB. Unfortunately, due to an
unperceived general lack of interest in this type of research, the letters only yielded four
responses, two of which actually chose to schedule appointments. At this point in the
project, it became all too clear that obtaining willing participants for research would be
one of the most difficult aspects of the entire study. Due to this unfortunate drawback,
the target number of participants for the study, which was set to thirty residencies, was
lowered to a more realistic goal of ten.
4.3 Contacting residents personally
At this point in time suitable options for garnering willing participants in the
project were dwindling, posing the question of how much interest (or lack of), that those
affected by the ALB possessed. The team began contacting residents by phone, utilizing
the public directory to obtain resident home numbers. By following a flexible script to
increase resident interest in the research being conducted; a considerable increase in
participation was obtained for every house that was dialed. This strategy proved to be
much more efficient, inciting nearly half of every local called into participating.

xix
EEA IQP
Script for residential phone contact (flexible)
Good morning, my name is _________. I am a student at Worcester Polytechnic Institute
working on a project that is assessing the damage caused by the Asian long-horned beetle
in your community.
Our team is working with the Massachusetts Executive Office of Energy to determine the
importance of trees and how they can be utilized to considerably lower energy
consumption in the state. The damage caused by the Asian long-horned beetle presents a
unique opportunity to study the perceived benefits that residential trees provide.
How many trees have you lost on your property as a result of the Asian long-horned
beetle?
Would you be interested in participating in our study? If you were to schedule an
appointment it would not take more than an hour
In developing the phone script, it was important to consider the expected reactions
of each person willing to listen to our proposal. Many residents have developed strong
emotions toward the ALB and the damage it has caused to their community. Placing the
focus of each conversation on the ALB, rather than the benefits of tree canopy, was
crucial for building interest in the research being conducted. Each resident that was
dialed generally had varying levels of enthusiasm in the research, making it important to
format each call based upon their own level of interest.
Despite a higher rate of acceptance by dialed participants, the number still
remained relatively low considering the time frame we would normally make each call.
Most of the calls made were dialed during normal working hours, causing a high number
of voicemails to be reached, which occurred roughly 75% of the time. After the first
week of calls, not a single voicemail left that was left warranted a reply. Taking this
response rate into account, it was decided to skip leaving a voicemail and to simply re-try

xx
at a more suitable time. By the end of the fifth week of the study, over one hundred calls
had been made; making contact with only eighteen residents and scheduling eight
appointments as a result.
4.4 Appointment Procedure
Despite limited success from the proposed methods of gathering participants, the
appointments with those who were willing to contribute to the study generally followed
the same procedure:
1. Team would sit down with the resident and obtain varies household structural
information by a simple question and answer method.
2. Resident would provide whatever past electric and fuel bills (or alternative record) for the
team to document.
3. One member would record the figures of households heating system, measuring its
efficiency by input and output of British Thermal Units (BTUs)
4. Team would determine the number of trees that were removed, and the specific type of
trees that they were.
5. One member would use a pre-measured sketch of the property obtained from real-estate
maps online to note the location of each tree and estimated size of the canopy.
4.5 Unexpected difficulties
With each appointment, unforeseen complications tended to occur that would
influence the data collection process. Most common of these would be the resident‟s lack
of certain utility information, or even knowledge of such. In a case where insufficient

xxi
energy records were available the team would need to make monthly estimates of fuel
consumption or electricity usage based on whichever information residents were able to
provide.
This particular winter produced a considerable amount of snowfall, demonstrated
by consistent weekly blizzards. On a regular basis, poor and unsafe conditions not only
affected standard methods of travel, but also indirectly affected the project team‟s
research. Due to the extreme weather conditions faced during the entire data collection
process, appointment cancellations were fairly common. During a two week period, half
of the scheduled appointments were cancelled, many of which chose not to re-schedule
due to unsafe conditions on their properties.
4.6 Normalizing data for heating and cooling degree days
Due to the fact that two separate yearly usage rates for energy are being
calculated, it is important to account for any possible differences in the yearly
temperature differences. Since no two years share the exact same pattern of temperature
change, each monthly usage rate will need to be normalized to account for the possible
degree differences. Due to most of the energy usage data we have gathered is in the time
period from 2007 to 2010, so the team decided to obtain monthly information about the
heating and cooling degree days in the past 4 years (NCDC, 2007) (NCDC, 2008)
(NCDC, 09-10) (NCDC, 2007) (NCDC, 08-09) (NCDC, 2010).

xxii
Table 1: Heating Degree Days
Jan Feb Mar Apr May Jun Jul Aug Sep Oct Nov Dec Total
2007 1066 1168 935 637 205 46 1 6 74 271 766 1115 6163
2008 1107 994 931 507 246 100 0 20 91 457 736 1019 5997
2009 1379 1003 919 490 246 100 18 5 147 503 569 1091 6200
2010 1193 992 729 427 163 21 0 6 57 404 630 1098 5636
Table 1 shows the heating degree days data of each month in 2007-2010. Note that the
“Total” column represents the total heating degree days in the heating season in the each
year (the highlighted months are calculated into the total).
We originally decided to group months of January through April, November and
December into the heating season. However, as shown in Table 1, there are also some
significant inputs in the May and October; and the fact that winters last longer than
summers in the New England area, so the team decided to group months of January
through May and October through December into the heating season. Therefore, months
of June through September are the group of cooling season. As shown in Table 1, the
highest total heating degree days occurred in 2009, that means it is expected more energy
is used for heating. Meanwhile, the total in 2007 is slightly less than the total in 2009, so
it would have the same expectation on the heating energy usage. The lowest total heating
degree days occurred in 2010, which means that if there are not any changes in the house,
it is expected to use less energy for heating.
Table 2: Cooling degree days
Jan Feb Mar Apr May Jun Jul Aug Sep Oct Nov Dec Total
2007 0 0 0 0 11 72 189 174 49 6 0 0 484
2008 0 0 0 0 0 109 257 122 34 0 0 0 522
2009 0 0 0 0 4 26 111 210 13 0 0 0 360
2010 0 0 0 0 19 114 300 178 65 0 0 0 657
Table 2 shows the cooling degree days data of each month in 2007-2010. Note that the
“Total” column represents the total cooling degree days in the heating season in the each
year (the highlighted months are calculated into the total).

xxiii
The team decided to group months of June through September into the cooling
season because these months provide most of the significant inputs. As shown in Table 2,
the highest total cooling degree days occurred in 2010, which means that it is expected to
use more energy for cooling. The total cooling degree days in the 2007, 2008 and 2009
are much lower than the total in 2010. Therefore, ideally, it is expected to use less energy
for cooling in 2007, 2008 and 2009 if there are not any changes in the house.

xxiv
5. Findings
5.1 Heating and cooling comparisons
During the initial assessment of resident energy consumption, our plan was to
record the monthly fuel consumption in terms of dollar amount as well as fuel type. We
decided to change this approach due to the fact that the information we gathered from our
initial visits could not be accurately compared. Oil prices have changed considerably
over the past several years, making a comparison of costs unreliable unless each resident
possessed their annual fuel bills from the exact same years, (which was not the case). It
eased the process to simply calculate the annual usage in Kilo British Thermal Units.
As presented in our primary research question, our objective is to determine how
utility levels have changed (if at all), as a result of the removal of trees in the Burncoat
and Greendale neighborhoods. Household levels of fuel consumption are calculated
annually, with oil levels measured in gallons and natural gas measured in cubic feet.
Below is a comparative chart indicating the difference in annual consumption. Issues in
obtaining reliable fuel records from particular residents are the reason for only recording
two individual properties.

xxv
Figure 3: Oil usage
Figure 4: Gas usage
The chart above clearly demonstrates contrasting data from what we had
originally hypothesized. Annual levels of natural gas on both properties actually
decreased from previous levels before the tree removal.
0
200
400
600
800
1000
1200
1400
Property 1 Property 2 Property 5 Property 8
Oil
Usa
ge (
gallo
ns)
Property
2008 Usage
2010 Usage
0
200
400
600
800
1000
1200
1400
Property 3 Property 4 Property 6 Property 7 Property 9 Property 10
Gas
Usa
ge (
The
rmas
)
Property
2008 Usage
2010 Usage
xxvi
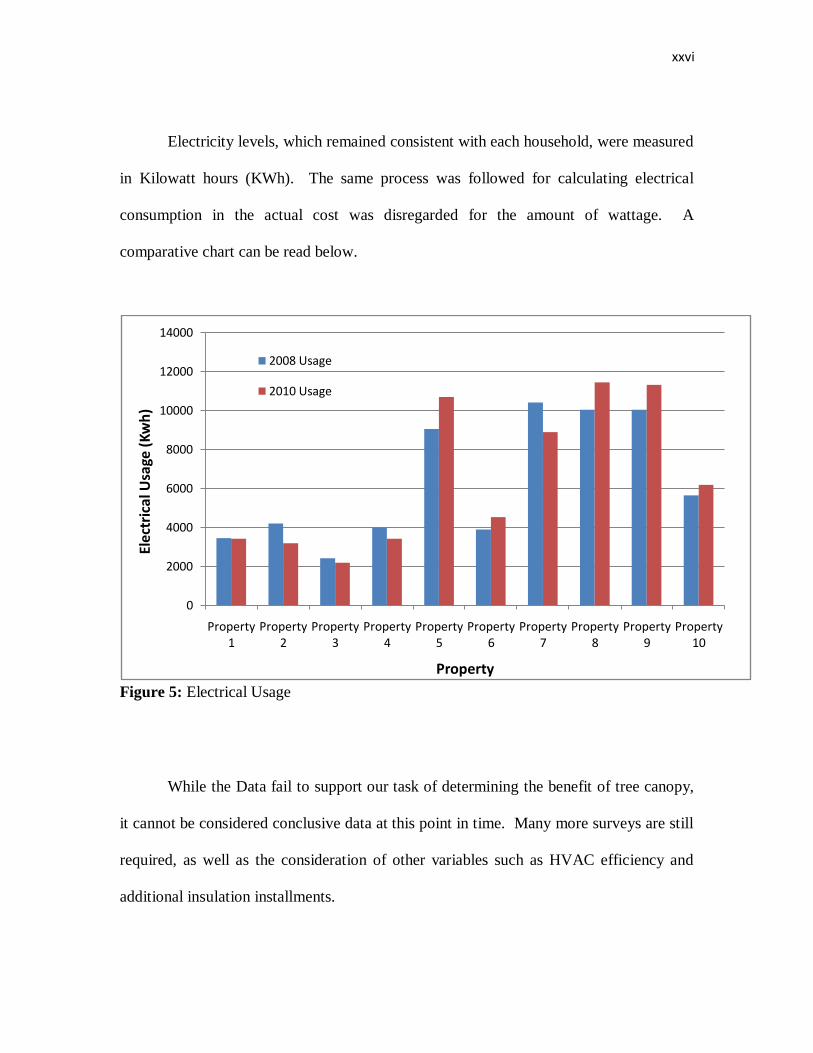
Electricity levels, which remained consistent with each household, were measured
in Kilowatt hours (KWh). The same process was followed for calculating electrical
consumption in the actual cost was disregarded for the amount of wattage. A
comparative chart can be read below.
Figure 5: Electrical Usage
While the Data fail to support our task of determining the benefit of tree canopy,
it cannot be considered conclusive data at this point in time. Many more surveys are still
required, as well as the consideration of other variables such as HVAC efficiency and
additional insulation installments.
0
2000
4000
6000
8000
10000
12000
14000
Property 1
Property 2
Property 3
Property 4
Property 5
Property 6
Property 7
Property 8
Property 9
Property 10
Elec
tric
al U
sage
(Kw
h)
Property
2008 Usage
2010 Usage

xxvii
5.2 Normalized fuel and electrical comparisons
5.2.1 Normalized fuel usage comparison
According to the data of heating and cooling degree days in Section 4.6, the total
heating degree days are different in each year, which means the temperatures are different
in each year. In a colder winter, it is reasonable to have higher fuel usage for heating. It is
hard to determine how much of it is due to the weather and how much of it is due to other
changes around the property. For a more accurate comparison, we normalized the data by
using the total winter fuel usage, which is calculated by data from months of January-
May and October-December and converted to KBTU (Kilo British Thermal Units),
divided by the total heating degree days. What information can a normalized data set
provide to us? Basically, the normalized data set of each property is expected to be at the
same level if there are no changes around the property. During the interviews, we also
asked residents about other changes around the house, such as behavioral changes,
temperature setting changes, insulation changes in the period of 2008 to 2010, HVAC
system changes, etc. None of the residents mentioned there are any changes in these
aspects, so we assumed the only change around the house is the tree removal. Since tree
canopy is believed to provide savings in energy usage, so the graph of the comparison
between the normalized data in 2008 and 2010 is expected to increase.

xxviii
Figure 6: Normalized fuel usage in winter
Data is normalized by using the total fuel usage in months of January-May and October-
December to divide the total heating degree days in those months in 2008 and 2010.
In Figure 6, the blue columns represent the normalized data in each individual
property in 2008 and the purple columns represent the normalized data in each individual
property in 2010. As mentioned before, tree removal is considered to be the only change
around the house, so the changes in the normalized data set would be considered as the
effect of tree canopy removals. In the prospective of the project, it is expected to have
increments in the normalized data set in the year after trees were removed. However, as
shown in Figure 6, the changes in the normalized data set are not consistent, some of
them increase and some of them decreased. There might be some other significant factors
we did not put into our considerations, so the graph is not conclusive to determine the
relationship between trees and energy usage.
0
5
10
15
20
25
30
35
Property 1
Property 2
Property 3
Property 4
Property 5
Property 6
Property 7
Property 8
Property 9
Property 10
KBTU/HDD 2008
KBTU/HDD 2010

xxix
5.2.2 Electrical usage comparisons
As shown in section 4.6, the cooling degree days are different in each year.
However, most of the cooling degree days are from the months from June to September.
So it is reasonable to separate the comparison in the heating season and the cooling
season.
Figure 7: Electrical usage in winter
In Figure 7, the winter season is including the months from January to May and
October to December. Blue columns represent the total electrical usage in each property
in 2008 winter. The red columns represent the total electrical usage in each property in
2010 winter. Due to the Property 1 and Property 10 were only able to provide the annual
electrical usage, so we are not able to obtain the monthly electrical usage to calculate the
total in winter or summer for these two properties. Other total usage of each property is
converted to the unit of Mega British Thermal Units. As shown in Figure 7, some of the
0
5
10
15
20
25
30
35
Property 1
Property 2
Property 3
Property 4
Property 5
Property 6
Property 7
Property 8
Property 9
Property 10
2008 Winter (MBTU)
2010 Winter (MBTU)

xxx
electrical usage went up after trees were removed and some of them went down. The
sequence of changes in the winter electrical usage is not transparent.
Since the cooling degree days are different in each year, a set of normalized data
is needed for a more accurate comparison. As shown in section 4.6, most of the total
cooling degree days come from the months of June to September, so these months are
considered as the cooling season of the year. The total summer usage of each property is
converted to Kilo British Thermal Units. We normalized the data by using the total the
electrical usage in the cooling seasons in 2008 and 2010 to divide the total cooling degree
days in 2008 and 2010.
Figure 8: Normalized electrical usage in the cooling season
Data in Figure 8 is normalized by using the total electrical usage in the cooling season,
which is from June to September, to divide the total cooling degree days in those months.
Due to the fact of some people have air conditioners at home, and some people do
not, we group these residents into two groups, which are within or without air
0
5
10
15
20
25
Property 1
Property 2
Property 3
Property 4
Property 5
Property 6
Property 7
Property 8
Property 9
Property 10
KBTU/CDD 2008
KBTU/CDD 2010
xxxi
conditioners at home. Property 1 and Property 2 do not have air conditioners and the rest
of these properties do have air conditioners. Due to the issue that Property 1 and Property
10 were not able to provide the monthly usage, we cannot put them into comparison. As
tree canopy is believed to provide savings on the electrical usage by providing direct
shades in the summer. The normalized data after trees were removed is expected to
increase. However, surprisingly, almost all of the normalized data decreased after trees
were removed. There might be some other changes around the property besides the tree
removals. The relationship between tree canopy and electrical usage is not determined
yet.
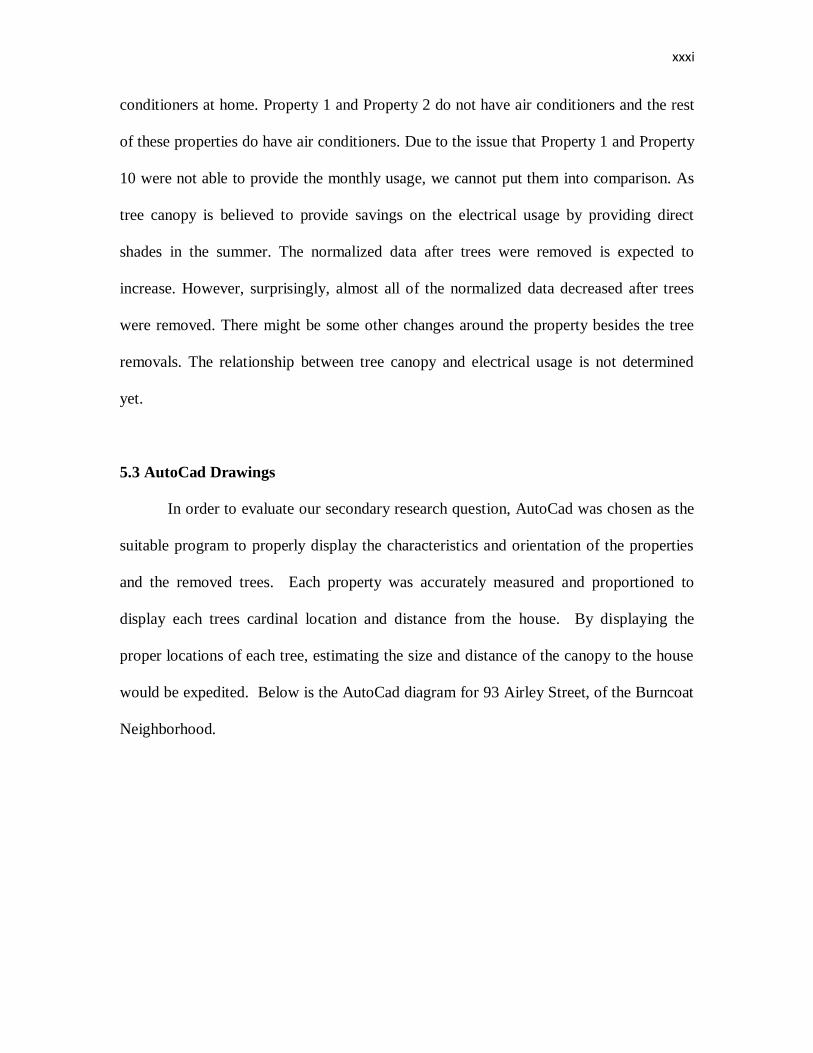
5.3 AutoCad Drawings
In order to evaluate our secondary research question, AutoCad was chosen as the
suitable program to properly display the characteristics and orientation of the properties
and the removed trees. Each property was accurately measured and proportioned to
display each trees cardinal location and distance from the house. By displaying the
proper locations of each tree, estimating the size and distance of the canopy to the house
would be expedited. Below is the AutoCad diagram for 93 Airley Street, of the Burncoat
Neighborhood.

xxxii
Figure 9: AutoCad Example
This particular house only had three trees removed due to the ALB, which is a
relatively low amount compared to others. Each tree location was measured in relation to
the house with the height estimated based upon the residents own recollection. Green
circles, as indicated, represent the estimated canopy size. Due to the age and height of
the tree removed in the backyard, the canopy was estimated to be larger than the house
itself. The electrical graphs above show that this property lowered its Kwh consumption
between the years that the trees were removed. Due to the size of the maple that was
removed, and the fact that we were informed no type of AC unit was ever used, we

xxxiii
assumed that the extra sunlight was the cause for such a minimal increase. Natural
sunlight would eliminate the need for additional unnecessary household lighting that
would keep Kwh levels above normal.
Having obtained AutoCad diagrams from each property visited to date, the visual
significance of canopy in relation to each household can be made without much further
investigation. The only drawback as of late is the unexpected reductions in energy
consumption, which raises several new questions on its own.

xxxiv
6. Discussions and Recommendations
Throughout the research portion of this research project, the team faced many
unforeseen obstacles that hindered overall research and forced us to adjust our approach
for gathering data. Despite these consistent complications, the team was able to set up
appointments with the expected quota of ten participants. While the results of each study
vary considerably and fail to support the theory of measuring the economic benefit
provided by tree canopy, the experiences undergone by the research team during this pilot
study will be put forth to ensure the success of future research endeavors of this kind.
The team has re-assessed the original data gathering process and has determined the most
efficient methods for carrying out this type of research.
6.1 Acquiring Participants
The most unexpected obstacle during the research process was the inability of the
team to find willing residents to participate in the study. Despite the numerous flyers and
personalized letters delivered in and around the neighborhoods, as well promoting the
study on a popular local radio program, scheduling appointments was the most
challenging and difficult portion of the project. A graphical representation of the
response rate can be read below.

xxxv
Table 3 Summary data collection
Flyers Letters Answered
phone calls
Missed
phone calls
Total
interviews Delivered/called 100 150 20 80
Responses 2 4 - -
Scheduled 0 2 8 0 10
As shown in Table 3, a numerical summary of the data collection process is
provided. Roughly one-hundred flyers were distributed around the Burncoat and
Greendale neighborhoods, with only two responses. During the next step, which was
delivering appointment request letters to properties know to have been affected by the
ALB, only two appointments were scheduled as a result. These extremely low response
rates prompted a much more direct method calling each resident personally in order to
present them with our project and request an appointment on the spot.
6.2 Direct Contact
Contacting each resident directly proved much more successful, inciting nearly
half of each respondent to participate. The success of this strategy over the original
methods prompted consideration of what was done differently. The original methods of
seeking locals to participate left the decision in their own hands. Many would not take
the time to make contact with us simply due to the fact that it requires them to go out of
their way to do so. By contacting each household directly, as done with the phone
method, many more appointments could be scheduled simply due to the fact that the
decision would be made right then and there. A strong recommendation that the team

xxxvi
stresses for future studies would be to utilize this strategy over less indirect methods such
as posting flyers or distributing letters.
6.3 Weather complications
During the entire data collection process one of the most unpredictable and
detrimental factor was the weather. Frequent snow storms would not only hinder the
ability to travel to scheduled appointments, but would also prompt appointees to cancel
pre-scheduled visitations out of fear for their safety or our own. For one, there were
many snowstorms throughout the course of the term. The excessive snowfall also
hindered the team‟s ability to accurately measure the locations of specific trees on each
property. With averages of up to 4 feet of snow on each property, the team had to rely
heavily on estimates for determining distances of trees from each household. Holding
research of this type during the fall or spring seasons would be most efficient to prevent
any weather related cancelations or complications.
6.4 Varying data levels
With each property visit, the accumulated data remained inconsistent with the
original hypothesis. In many cases, levels of energy consumption decreased with the loss
of trees, reflecting a result polar opposite to the proposed theory. With such varying
levels in the research, aside from the excessive number of variables for consideration, the
team felt an alternative research method should be followed for future studies to follow.

xxxvii
For consideration by future researchers, the project team recommends that in
order to severely lower variation in data by unforeseen factors, is be to considerable
condense the target population for study. Though the Greendale and Burncoat
neighborhoods generally share the same geographical characteristics, many smaller
factors such as arrangement of properties, location of hills, and differences in elevation
considerably affect the overall results. This would affect the amount of warm air/cold air
which enters their home, and therefore affect their household energy levels, which is the
main data the team had to collect. If the survey was limited to a single street of one of
the neighborhoods, much of the geographical factors would be eliminated, causing any
changes resulting from the loss of trees to be much more conclusive.
The actions and methods undergone during this pilot study have been met with
equal accomplishments and setbacks. Despite the constant road-blocks that caused
research to come to a grinding halt, the actions taken in this study will only serve to
improve the overall approach for future researchers. By improving upon the original
methods, this project team has formulated the most successful and efficient process to
follow in order to ensure the smoothest acquisition of necessary data.

xxxviii
7. Conclusion
The actions and methods undergone during this pilot study have been met with
equal accomplishments and setbacks. Despite the constant road-blocks that caused
research to come to a grinding halt, the actions taken in this study will only serve to
improve the overall approach for future researchers. By improving upon the original
methods, this project team has formulated the most successful and efficient process to
follow in order to ensure the smoothest acquisition of necessary data.
Success can be measured by one‟s personal standard. The theory of whether or
not tree canopy has a measureable benefit on energy consumption is still unclear. Only
by taking every step into consideration and improving upon them can we make a valid
contribution to the statewide effort to lower energy consumption and GHGs. We hope
that the information we gather and the conclusions we make that result from this
experience will serve to help future studies of this nature.

xxxix
Appendix I: Project Milestone

xl

xli
Appendix II: Personalized letter

xlii
Appendix III: Interview Checklist

xliii

xliv

xlv
Appendix IV: AutoCad Drawings for each visited
property

xlvi

xlvii

xlviii

xlix

l

li

lii

liii

liv
lv
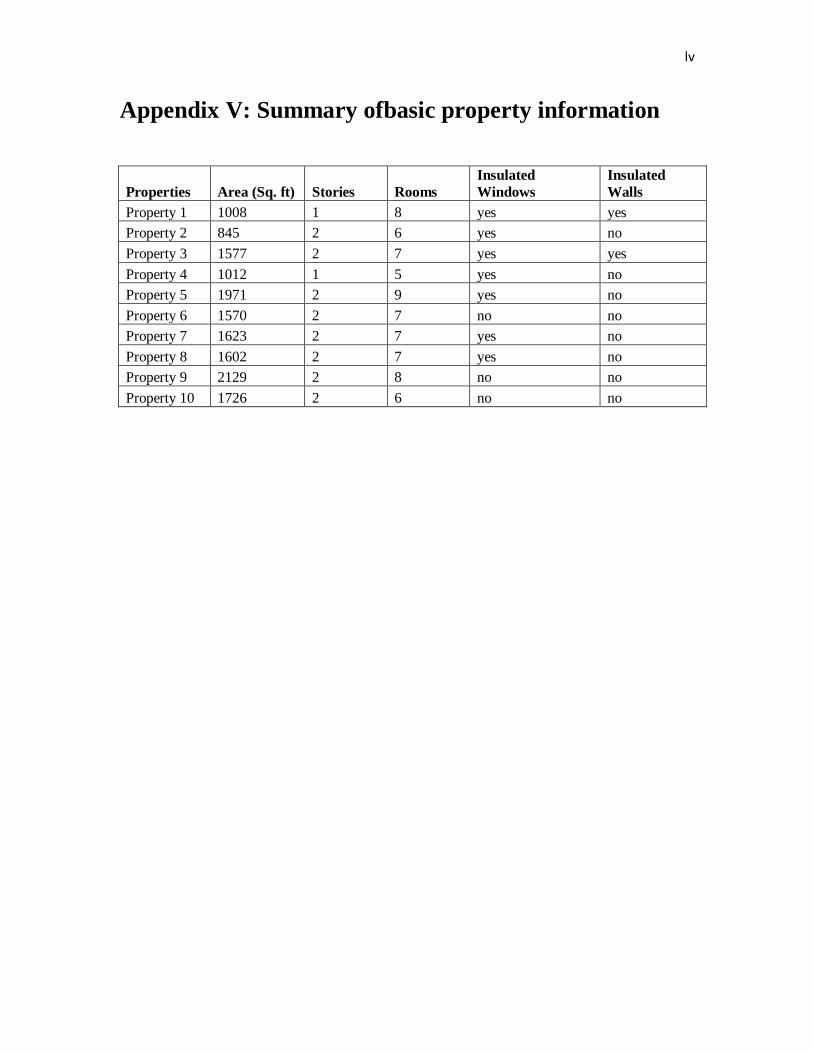
Appendix V: Summary ofbasic property information
Properties Area (Sq. ft) Stories Rooms
Insulated
Windows
Insulated
Walls
Property 1 1008 1 8 yes yes
Property 2 845 2 6 yes no
Property 3 1577 2 7 yes yes
Property 4 1012 1 5 yes no
Property 5 1971 2 9 yes no
Property 6 1570 2 7 no no
Property 7 1623 2 7 yes no
Property 8 1602 2 7 yes no
Property 9 2129 2 8 no no
Property 10 1726 2 6 no no

lvi
Appendix VI: Fuel and electrical usage Appendix VI.1 Fuel usage
Properties Fuel type Average Temperature 2008 Usage 2010 Usage
Property 1 oil 70 756 876
Property 2 oil 67 645 584
Property 5 oil 67 794 1105
Property 8 oil 65 1182 1254
Properties Fuel type Average Temperature 2008 Usage 2010 Usage
Property 3 natural gas 63 603 424
Property 4 natural gas 69 848 792
Property 6 natural gas 65 1180 985
Property 7 natural gas 64 703 680
Property 9 natural gas 68 1196 1015
Property 10 natural gas 65 894 970
Appendix VI.2 Electrical usage
Properties 2008 Usage 2010 Usage AC Units
Property 1 3461 3425 no
Property 2 4206 3186 no
Property 3 2429 2195 yes
Property 4 3993 3419 yes
Property 5 9049 10698 yes
Property 6 3900 4543 yes
Property 7 10410 8899 yes
Property 8 10030 11449 yes
Property 9 10040 11307 yes
Property 10 5649 6185 yes

lvii
Appendix VII: Normalized data Appendix VII.1 Normalized fuel data
Properties
Fuel Consumption
2008
Fuel Consumption
2010 KBTU 2008 KBTU 2010
Property 1 104399820 120971220 104399.82 120971.22
Property 2 89071275 152594975 89071.275 152594.975
Property 3 60300000 42400000 60300 42400
Property 4 84800000 79200000 84800 79200
Property 5 109647430 152594975 109647.43 152594.975
Property 6 118000000 98500000 118000 98500
Property 7 70300000 68000000 70300 68000
Property 8 163228290 173171130 163228.29 173171.13
Property 9 119600000 101500000 119600 101500
Property 10 89400000 97000000 89400 97000
Properties KBTU/HDD 2008 KBTU/HDD 2010 Difference
Property 1 17.40867434 21.46402058 -4.055346245
Property 2 14.85263882 27.07504879 -12.22240997
Property 3 10.05502751 7.523066004 2.531961509
Property 4 14.14040354 14.05251952 0.087884018 Property 5 18.28371352 27.07504879 -8.79133527
Property 6 19.67650492 17.476934 2.199570923 Property 7 11.72252793 12.06529454 -0.342766604
Property 8 27.21832416 30.72589248 -3.507568315 Property 9 19.94330499 18.0092264 1.934078584
Property 10 15.8623137 17.21078779 -1.348474095

lviii
Appendix VII.2 Normalized electrical data
Monthly Electrical Usage In 2008
Properties
Total in Cooling season
(KWH)
In
(KBTU) Total Electrical usage in heating season
Property 1
Property 2 891 3040.359 3315
Property 3 797 2719.603 1402
Property 4 1875 6398.063 2118
Property 5 3014 10284.67 6073
Property 6 1427 4869.352 2472
Property 7 3396 11588.17 7074
Property 8 3410 11635.94 6620
Property 9 3279 11188.93 6761
Property 10
Properties J F M A M J J A S O N D
Property 1
Property 2 683 426 466 403 349 311 250 138 192 111 347 530
Property 3 188 166 169 164 154 176 201 214 206 179 170 212
Property 4 276 280 266 213 321 466 505 545 359 243 279 240
Property 5 806 732 676 665 676 597 862 800 755 687 834 997
Property 6 457 409 327 333 242 322 392 362 351 177 233 294
Property 7 1277 1032 1019 788 661 693 752 1026 925 647 741 909
Property 8 1182 839 801 822 639 650 1179 914 667 717 873 747
Property 9 977 974 752 723 757 867 868 877 667 709 846 1023
Property 10

lix
Monthly Electrical Usage In 2010
Properties J F M A M J J A S O N D
Property 1
Property 2 488 360 329 373 278 159 121 77 93 205 311 392
Property 3 163 158 162 210 159 212 230 220 148 166 170 168
Property 4 158 153 242 245 332 517 490 411 314 261 137 159
Property 5 841 972 810 903 875 735 710 984 916 1009 685 1258
Property 6 370 295 335 377 299 374 513 440 550 327 336 327
Property 7 803 727 798 709 564 648 841 1073 878 639 648 571
Property 8 1245 1114 1077 941 748 704 1159 1098 890 743 813 917
Property 9 1838 1650 1155 801 685 661 950 894 691 691 946 1065
Property 10
Properties
Total in Cooling season
(KWH)
In
(KBTU) Total Electrical usage in heating season
Property 1
Property 2 450 1535.535 2736
Property 3 810 2763.963 1356
Property 4 1732 5910.104 1687
Property 5 3345 11414.14 7353
Property 6 1877 6404.887 2666
Property 7 3440 11738.31 5459
Property 8 3851 13140.77 7598
Property 9 3196 10905.71 8831
Property 10

lx
Normalized Cooling Season Electrical Usage
Properties KBTU/CDD 2008 KBTU/CDD 2010
Property 1
Property 2 5.824443103 2.337191781
Property 3 5.209967625 4.206945205
Property 4 12.25682471 8.995591476
Property 5 19.70243716 17.37312557
Property 6 9.328260728 9.748686606
Property 7 22.19956092 17.86653272
Property 8 22.29107854 20.00116788
Property 9 21.43473506 16.5992554
Property 10 0 0
Appendix VII.3: Heating season electrical usage comparison
Properties 2008 Winter (MBTU) 2010 Winter (MBTU)
Property 1
Property 2 11.3117745 9.3360528
Property 3 4.7840446 4.6270788
Property 4 7.2272514 5.7565501
Property 5 20.7228979 25.0906419
Property 6 8.4352056 9.0971918
Property 7 24.1386102 18.6277457
Property 8 22.589426 25.9266554
Property 9 23.0705603 30.1340213
Property 10 0 0

lxi
Appendix VIII: Power point presentation
1 2
3 4
5 6

lxii
7 8
9 10
11 12

lxiii
13 14
15 16
17 18

lxiv
19 20
21 22
23 24

lxv
25 26
27 28
29 30

lxvi
31 32
33

lxvii
Works Cited
Crowley, J. (2010, October 26). CROWLEY , WEINER APPLAUD USDA FUNDING TO COMBAT
ASIAN LONGHORNED BEETLE IN NEW YORK. States News Service .
EEA. (2010). Background. Mass EEA .
EPA. (2010, June 15). Climate Change Indicators in the United States. Retrieved December 1,
2010, from U.S Environmental Protection Agency:
http://www.epa.gov/climatechange/indicators.html
Herald Staff. (1991, April 21). SHADING AIR CONDITIONER REDUCES COOLING NEEDS CANOPY
OF GREENERY CUTS HEAT INDOORS. The Miami Herald , p. 13.
Lydersen, K. (2009, September 14). Water Measured From the Sky; Satellites Track Land's
Consumption. The Washington Post , p. A09.
Mass. (2008, August 13). Governor Patrick Signs Bills to Reduce Emissions And Boost Green Jobs.
Retrieved November 30, 2010, from
http://www.mass.gov/?pageID=gov3pressrelease&L=1&L0=Home&sid=Agov3&b=pressrelease&
f=080813_green_jobs&csid=Agov3
MassDEP. (2008). Global Warming Solutions Act Implementation. Retrieved November 20, 2010,
from Massachusetts Department of Environmental Protection:
http://www.mass.gov/dep/air/climate/gwsa_docs.htm
MIPOP. (2010). Asian Longhorn Beetles. Retrieved November 19, 2010, from Massachusetts
Introduced Pests Outreach Project: http://www.massnrc.org/pests/alb/
NCDC. (08-09). Cooling degree days.
http://lwf.ncdc.noaa.gov/oa/documentlibrary/hcs/cdd.200801-200912.pdf.
NCDC. (2007). Cooling degree days.
http://lwf.ncdc.noaa.gov/oa/documentlibrary/hcs/cdd.200601-200712.pdf.
NCDC. (2010). Cooling degree days.
http://www.ncdc.noaa.gov/oa/documentlibrary/hcs/cdd.200901-201010.pdf.
NCDC. (09-10). Heating degree days .
http://lwf.ncdc.noaa.gov/oa/documentlibrary/hcs/hdd.200907-201010.pdf.
NCDC. (2007). Heating degree days.
http://lwf.ncdc.noaa.gov/oa/documentlibrary/hcs/hdd.200507-200706.pdf.

lxviii
NCDC. (2008). Heating degree days.
http://lwf.ncdc.noaa.gov/oa/documentlibrary/hcs/hdd.200707-200906.pdf.
Stewart, R. (2009, February 16). The Carbon Dioxide (CO2) Problem. Retrieved December 1,
2010, from Oceanography in the 21st Century - An Online Textbook:
http://oceanworld.tamu.edu/resources/oceanography-book/co2problem.htm
Telegram. (2010). Hillside losses, Boylston joins in beetle bout. Worcester telegram and Gazette
.
WWF. (2010, December 1). What are the Causes. Retrieved December 1, 2010, from World
Wildlife Fund: http://wwf.panda.org/about_our_earth/aboutcc/cause/