The Effect of Trade Agreements and Institutions on Exports ...
33
The Effect of Trade Agreements and Institutions on Exports of Eastern Europe by Inmaculada Martínez-Zarzoso ** , Georg-August University Göttingen and University Jaume I, Castellón Thorvaldur Gylfason * , University of Iceland and CESifo Per Magnus Wijkman, University of Göteborg, Gothenburg Abstract Following popular protests at home and the fall of the government, Ukraine reversed course and joined Georgia and Moldova in signing Association Agreements in June 2014. This paper has two main aims. First, using a gravity model of trade it estimates the effects of deep and shallow free trade agreements for the EaP states with Russia and the EU respectively. Second, by relating the outcomes of the first estimation to the quality of institutions, proxied with the level of democracy and the level of corruption in the selected countries, the paper estimates the effect of changes in the quality of institutions on exports. The main results show that the EaP countries gain significantly from free trade agreements with the EU, but little if anything from free trade agreements with Russia and that improvements in the quality of institutions in EaP countries have played an important role in fostering exports. Keywords: Free trade agreements; Eastern Partnership; European Union; Gravity Model; Panel Data; Democracy; Corruption JEL classification: F14, F41, F53 Acknowledgments This paper was presented at the 16th Annual Swedish Network for European Studies in Economics and Business (SNEE) European Integration Conference in Mölle, Sweden, 20-23 May 2014. The authors thank their discussant, Hubert Fromlet, and also Michael Emerson, Helga Kristjánsdóttir, and Alexander Libman for helpful comments on earlier drafts. The authors acknowledge the support and collaboration of Project ECO2010-15863 funded by the Spanish Ministry of Science and Innovation and of Project “Production Networks and Economic Integration” funded by Fundación Caja Castellón- Bancaja. The authors thank Michael Emerson, Hubert Fromlet, Helga Kristjánsdóttir, Alexander Libman and two referees for helpful reactions to earlier versions of the paper. ** Corresponding Author. Platz der Goettinger Sieben 3, 37073 Goettingen, Germany. Tel: 0049551399770. * The authors can be reached at [email protected], [email protected] and [email protected].
Transcript of The Effect of Trade Agreements and Institutions on Exports ...

The Effect of Trade Agreements and Institutions on Exports of
Eastern Europe
by
Inmaculada Martínez-Zarzoso**, Georg-August University Göttingen
and University Jaume I, Castellón
Thorvaldur Gylfason*, University of Iceland and CESifo
Per Magnus Wijkman, University of Göteborg, Gothenburg
Abstract
Following popular protests at home and the fall of the government, Ukraine reversed course and joined Georgia and Moldova in signing Association Agreements in June 2014. This paper has two main aims. First, using a gravity model of trade it estimates the effects of deep and shallow free trade agreements for the EaP states with Russia and the EU respectively. Second, by relating the outcomes of the first estimation to the quality of institutions, proxied with the level of democracy and the level of corruption in the selected countries, the paper estimates the effect of changes in the quality of institutions on exports. The main results show that the EaP countries gain significantly from free trade agreements with the EU, but little if anything from free trade agreements with Russia and that improvements in the quality of institutions in EaP countries have played an important role in fostering exports.
Keywords: Free trade agreements; Eastern Partnership; European Union; Gravity
Model; Panel Data; Democracy; Corruption
JEL classification: F14, F41, F53
Acknowledgments
This paper was presented at the 16th Annual Swedish Network for European Studies in Economics and
Business (SNEE) European Integration Conference in Mölle, Sweden, 20-23 May 2014. The authors
thank their discussant, Hubert Fromlet, and also Michael Emerson, Helga Kristjánsdóttir, and
Alexander Libman for helpful comments on earlier drafts. The authors acknowledge the support and
collaboration of Project ECO2010-15863 funded by the Spanish Ministry of Science and Innovation
and of Project “Production Networks and Economic Integration” funded by Fundación Caja Castellón-
Bancaja. The authors thank Michael Emerson, Hubert Fromlet, Helga Kristjánsdóttir, Alexander
Libman and two referees for helpful reactions to earlier versions of the paper.
**Corresponding Author. Platz der Goettinger Sieben 3, 37073 Goettingen, Germany. Tel: 0049551399770. * The authors can be reached at [email protected], [email protected] and [email protected].
2
Free Trade Agreements, Institutions and the Exports of Eastern
Partnership Countries
1. Introduction
In July 2013 the European Union (EU) announced that it had completed negotiations,
started early in 2012, on Association Agreements, including deep and comprehensive
free trade agreements (DCFTA), with Armenia, Georgia and Moldova. These
agreements were to be initialed at the Eastern Partnership (EaP) Summit in Vilnius on
28-29 November 2013. The successful negotiation of DCFTAs with these three States
in the short period of 1½ years surprised many observers.1 The DCFTA agreement
with Ukraine, already initialed, was to be signed at the same time, subject to prior
fulfillment by Ukraine of certain conditions concerning inter alia its application of
‘selective justice’.2
What was to follow was even more surprising. In September 2013, Armenia
announced that it would not initial its Association Agreement in Vilnius but instead
join the Eurasian Customs Union (ECU) proposed by Russia. Armenia’s decision
could have been influenced by Russia’s threat otherwise to withdraw its troops from
Azerbaijan, which protected the region of Nagorno Karabahk, largely populated by
Armenians. A few days before the Summit President Yanukovich of Ukraine
announced that he would postpone signing the Association Agreement with the EU
after Russia had offered significant loans.
1 Negotiating the DCFTA had taken Ukraine five years and to start negotiations had taken Georgia almost four years. Armenia was a latecomer and had worse initial conditions than Georgia. The decision to start negotiations in 2012 and their rapid conclusion were surprising. Compared with these countries, Moldova had a head-start through its negotiation of a regional free trade agreement with the Western Balkans (CEFTA 2006) in close cooperation with the EU. 2 This refers most notably to the trial and imprisonment of former Prime Minister Yulia Timoshenko after Viktor Yanukovich assumed the Presidency in January 2010.
3
President Yanukovich’s decision had fateful consequences. Prolonged
demonstrations in Maidan Square in Kiev ended in violence and President
Yanukovich fled the country on 21 February 2014. The next day Parliament elected a
provisional President and installed a new government. Within a week, armed ‘self-
defense groups’ appeared in Crimea and on 21 March, President Putin signed
documents admitting Crimea and Sevastopol into the Russian Federation. Since then,
war has raged in the Donetsk and Luhansk region.
Georgia, Moldova and Ukraine signed the Association Agreements and DCFTAs
with the EU on 27 June 2014. The agreements require ratification by each EU
member state and the European Parliament.
This paper assesses the benefits of various integration regimes on exports. More
specifically, it evaluates and compares the effects of free trade agreements (FTA)
signed by EaP countries with the EU and with Russia and the role played by the
quality of institutions (democracy and corruption) in fostering trade. We focus on the
effects of both deep and shallow FTAs on exports. While recognizing that FTAs may
lead not only to trade creation, but also to trade diversion, we assume that the most
likely result is an improvement in welfare.
The estimation strategy employed follows the most recent literature (Baier and
Bergstrand, 2007; Eicher et al., 2012; Head and Mayer, 2015) suggesting the use of
country-pair fixed effects to control for the endogeneity of the FTA effects and the
use of exporter-and-time and importer-and-time dummy variables to control for the
so-called multilateral resistance factors.
The results suggest that the EaP countries, with Ukraine by far the largest in the
group, gain significantly from free trade agreements with the EU, but gain little if
4
anything from free trade agreements with Russia. The quality of institutions in EaP
countries plays an important role in fostering trade.
The paper is organized as follows. Section 2 presents the main theoretical
framework, describes the data and variables and specifies the econometric models.
Section 3 presents the main results in terms of trade gains from recently signed
DCFTAs and section 4 relates trade flows with improvements in institutional quality.
Section 5 discusses the main trade policy alternatives for EaP countries and proposes
strengthening the EaP framework and involving Russia. Section 6 concludes.
2. The scope of potential trade
To quantify the trade effects of the different FTAs on bilateral exports we use the
gravity model of trade, a theoretical apparatus often used to estimate the effects of
trade agreements. Specifically, we assess how the trade flows of the EaP States will
be affected by:
• Entering into the EU, full membership (EU)
• A DCFTA with:
o EU (EUdeep)
o Russia (RUSdeep)
• A shallow FTA with:
o EU (EUshallow)
o Russia3 (RUSshallow)
o Each of the EaP states (FTA-East)
3 We assume that the announcement of the formation of the Common Economic Space by Russia could be close to a shallow FTA, so that the RUSshallow dummy variable used in the empirical analysis takes the value of one for trade between Russia, Belarus, Kazakhstan and Ukraine starting in 2004. An alternative definition of RUSshallow was used (Eurasian Economic Community) and the results remain the same. See online Appendix for a discussion of the whole set of Post-Soviet integration agreements.
5
We also say something about the intermediate case, which is likely to be the outcome
for the next few years if Georgia, Moldova and perhaps Ukraine as well turn west
while Azerbaijan, Armenia and Belarus turn east.
We first present the data we use (Section 2.1), the empirical models and methods
(2.2), the results of alternative regional integration scenarios (3) and further results
relating trade to the quality of institutions (4).
2.1 Data and variables
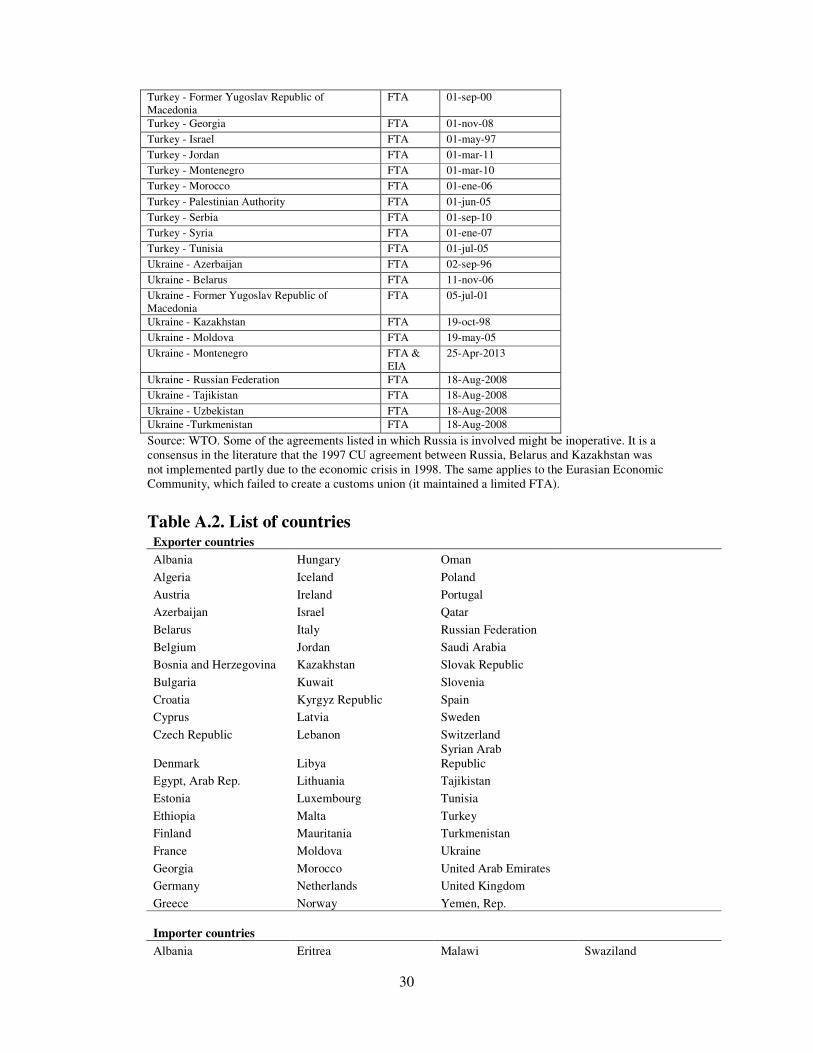
We obtain bilateral exports for 60 exporters and 150 importers 4 from the UN-
COMTRADE database for the period 1995 to 2012 and data on income variables
from the World Bank (World Development Indicators, 2014). We computed distances
between capitals and other gravity dummies (common border, common language,
colonial relationship and having been part of the same country) using data from the
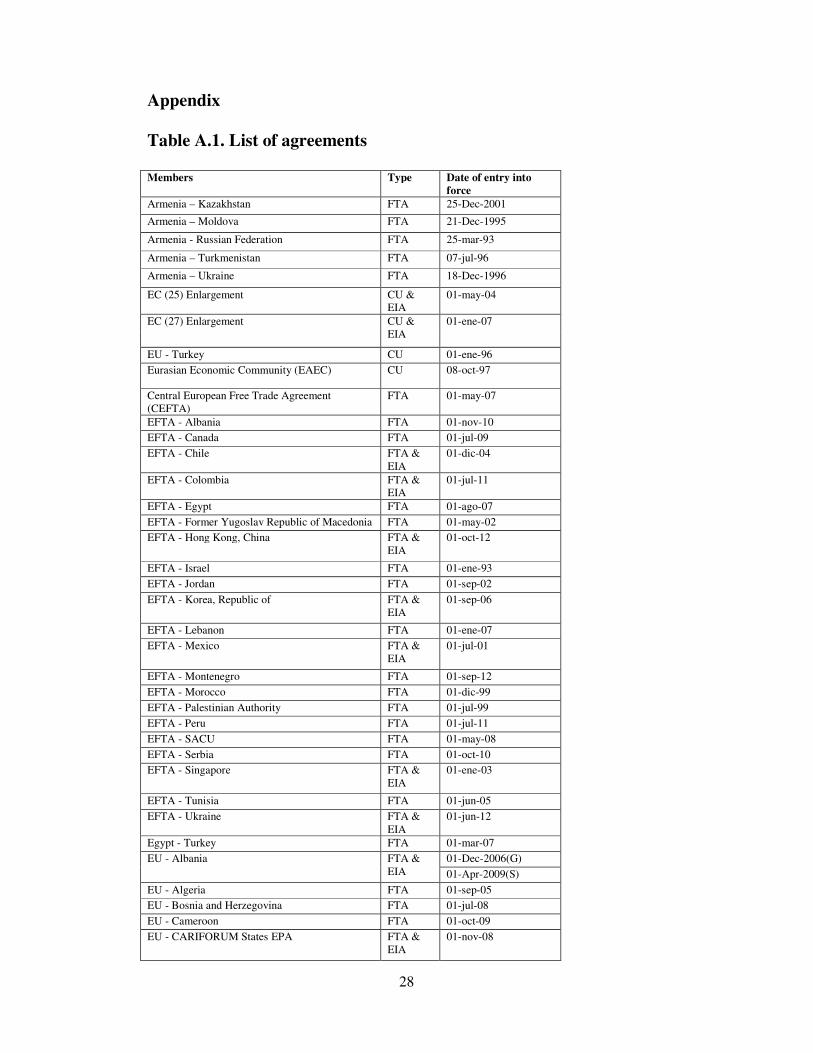
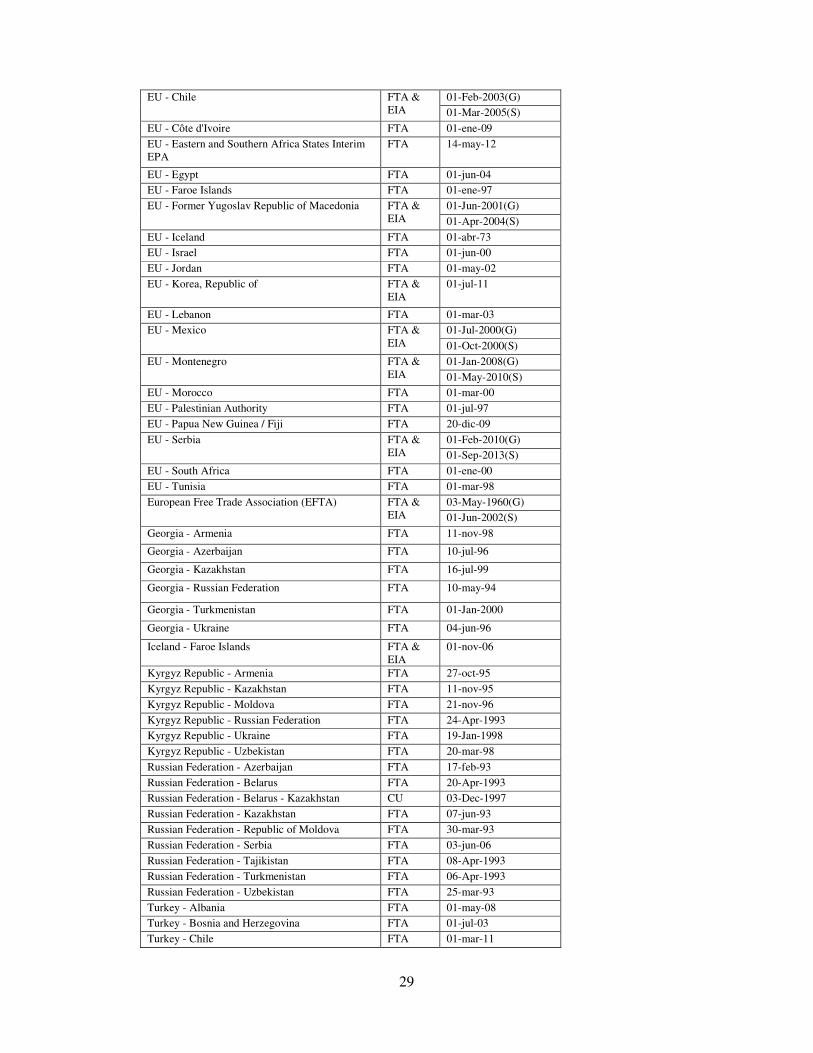
Centre d’Etudes Prospectives et d’Informations Internationales (CEPII). The FTA
variable was constructed based on data from the World Trade Organization and from
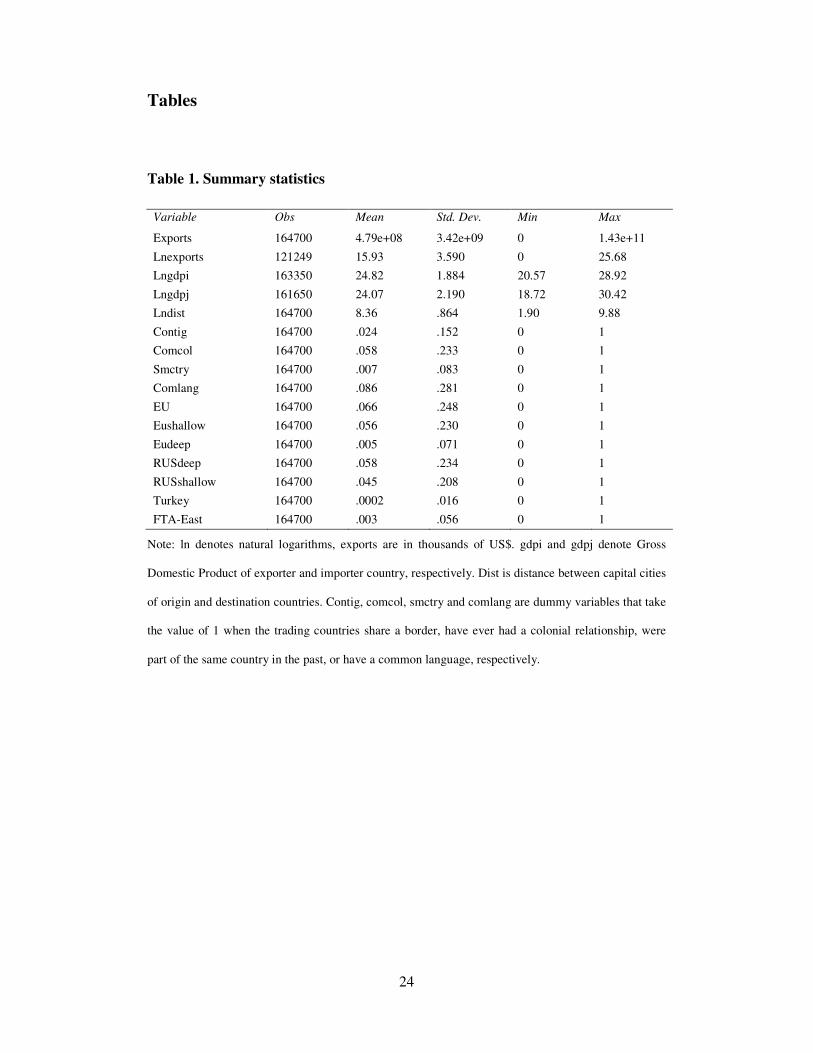
De Sousa (2012) as well from the European Commission (see Table A.1). Table 1
presents the summary statistics of the above variables. The FTA variables considered
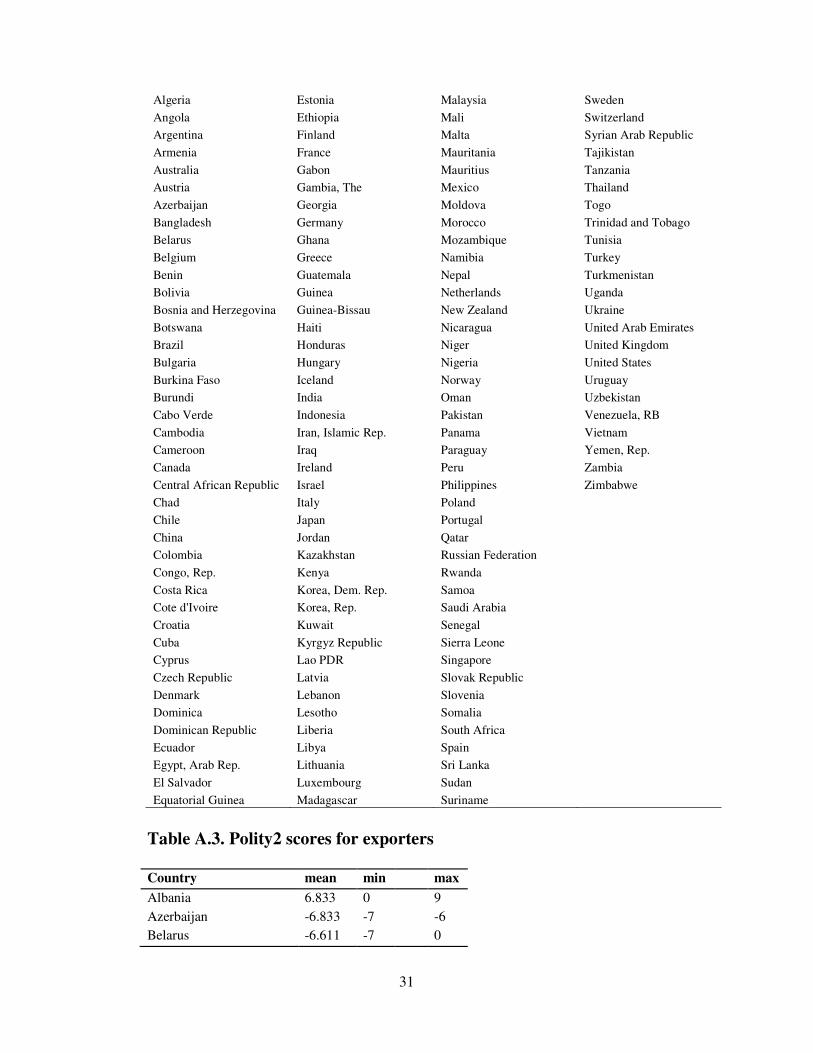
are listed in the lower part of Table 1. In Section 4 we add democracy (i.e., the Polity2
variable from Polity IV project) as well as corruption data from The International
Country Risk Guide (ICRG).5
Table 1. Summary statistics
4 The countries included in the sample are listed in Appendix Table A.2. The exporters considered are EU countries plus all European, North African and Middle East countries that are EU neighbors. 5 ICRG offers an index of corruption, coding corruption in different countries on a scale from zero to six, with high scores indicating low levels of corruption. The ICRG measure has an extensive coverage and uses a single survey methodology for all countries, which permits comparisons across countries and over time. This index is highly correlated with alternative corruption measures, including corruption perceptions scores compiled by Transparency International.
6
2.2 Method of estimation
In the last two decades the main ex-post method used to estimate the effects on trade
of FTAs has been based on the gravity model of trade, a “workhorse” model of
bilateral trade (Feenstra, 2004). This model has evolved into a sophisticated tool to
analyze the broad determinants of bilateral trade flows, among them a number of
policy factors such as FTAs, trade facilitation factors, tariffs, regulations, etc.
As regards the techniques used to estimate the model, the main novelties are
reviewed by Head and Mayer (2015) and Baltagi et al. (2014). Head and Mayer
(2015) review the main trade theories supporting the model and the estimation
challenges involved to be able to identify accurately the effects on trade of specific
economic and political factors. Baltagi et al. (2014) focus instead on presenting the
econometric techniques proposed most recently to estimate these effects consistently
and efficiently. We follow these papers in our choice of model specifications and
estimation techniques.
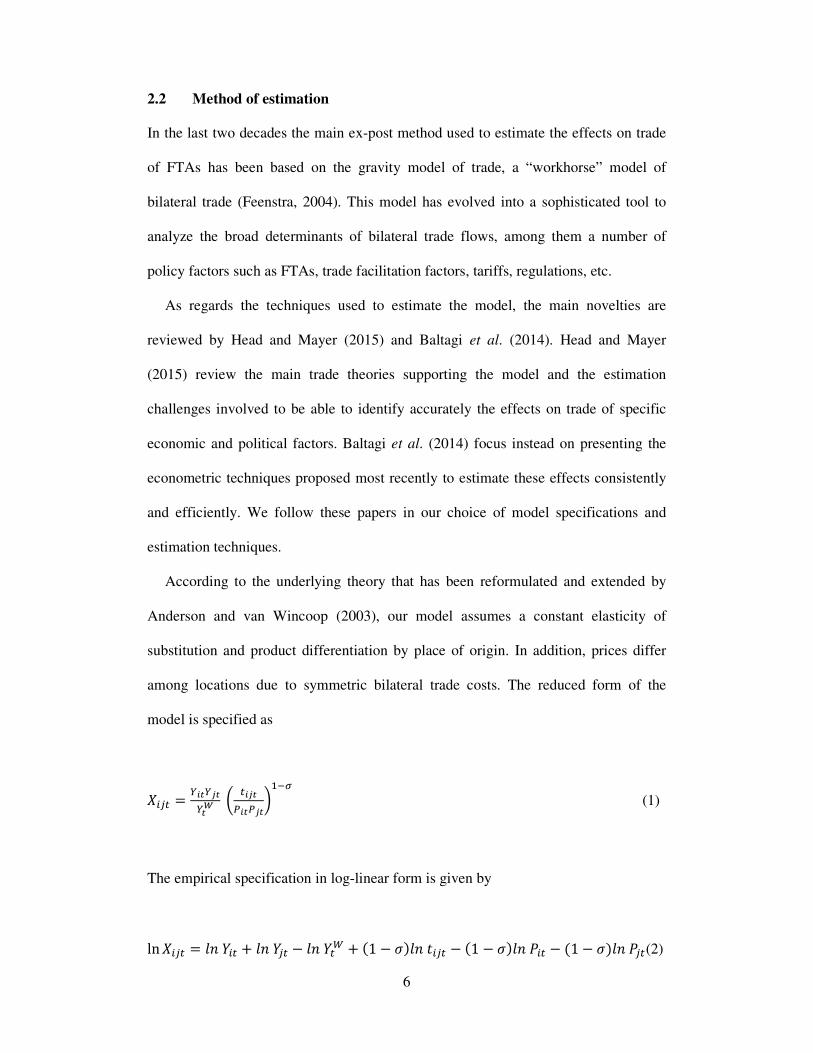
According to the underlying theory that has been reformulated and extended by
Anderson and van Wincoop (2003), our model assumes a constant elasticity of
substitution and product differentiation by place of origin. In addition, prices differ
among locations due to symmetric bilateral trade costs. The reduced form of the
model is specified as
���� = �������
� ��� �� �
����
(1)
The empirical specification in log-linear form is given by
ln ���� = �� ��� + �� ��� − �� ��� + �1 − ���� ���� − �1 − ���� ��� − �1 − ���� ���(2)
7
where Xijt is bilateral exports from country i to country j in year t, and Yit, Yjt and YtW
are the gross domestic products in the exporting country, the importing country and
the world in year t. tijt denotes trade costs between the exporter and the importer in
year t and Pit and Pjt are the so-called multilateral resistance terms6. σ is the elasticity
of substitution between all goods.
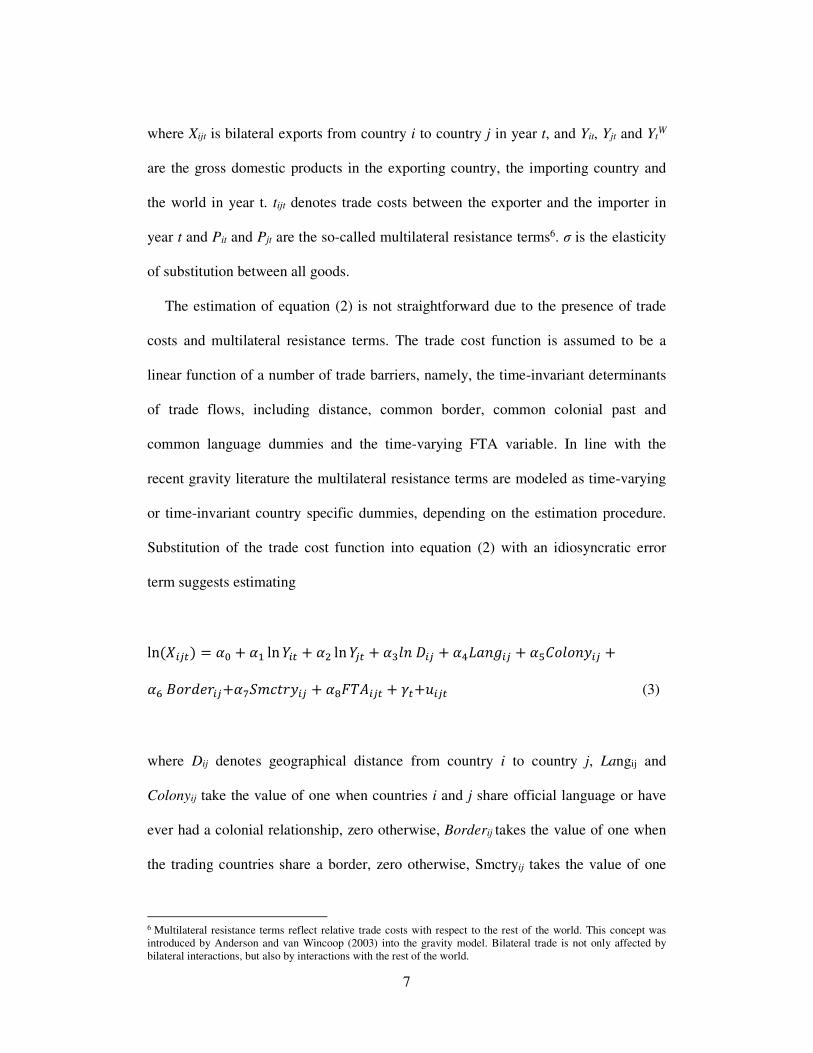
The estimation of equation (2) is not straightforward due to the presence of trade
costs and multilateral resistance terms. The trade cost function is assumed to be a
linear function of a number of trade barriers, namely, the time-invariant determinants
of trade flows, including distance, common border, common colonial past and
common language dummies and the time-varying FTA variable. In line with the
recent gravity literature the multilateral resistance terms are modeled as time-varying
or time-invariant country specific dummies, depending on the estimation procedure.
Substitution of the trade cost function into equation (2) with an idiosyncratic error
term suggests estimating
ln������ = ! + � ln ��� + " ln ��� + #�� $�� + %&'�(�� + )*+�+�,�� + - .+/01/��+ 2345�/,�� + 6789��� + :�+;��� (3)
where Dij denotes geographical distance from country i to country j, Langij and
Colonyij take the value of one when countries i and j share official language or have
ever had a colonial relationship, zero otherwise, Borderij takes the value of one when
the trading countries share a border, zero otherwise, Smctryij takes the value of one
6 Multilateral resistance terms reflect relative trade costs with respect to the rest of the world. This concept was introduced by Anderson and van Wincoop (2003) into the gravity model. Bilateral trade is not only affected by bilateral interactions, but also by interactions with the rest of the world.
8
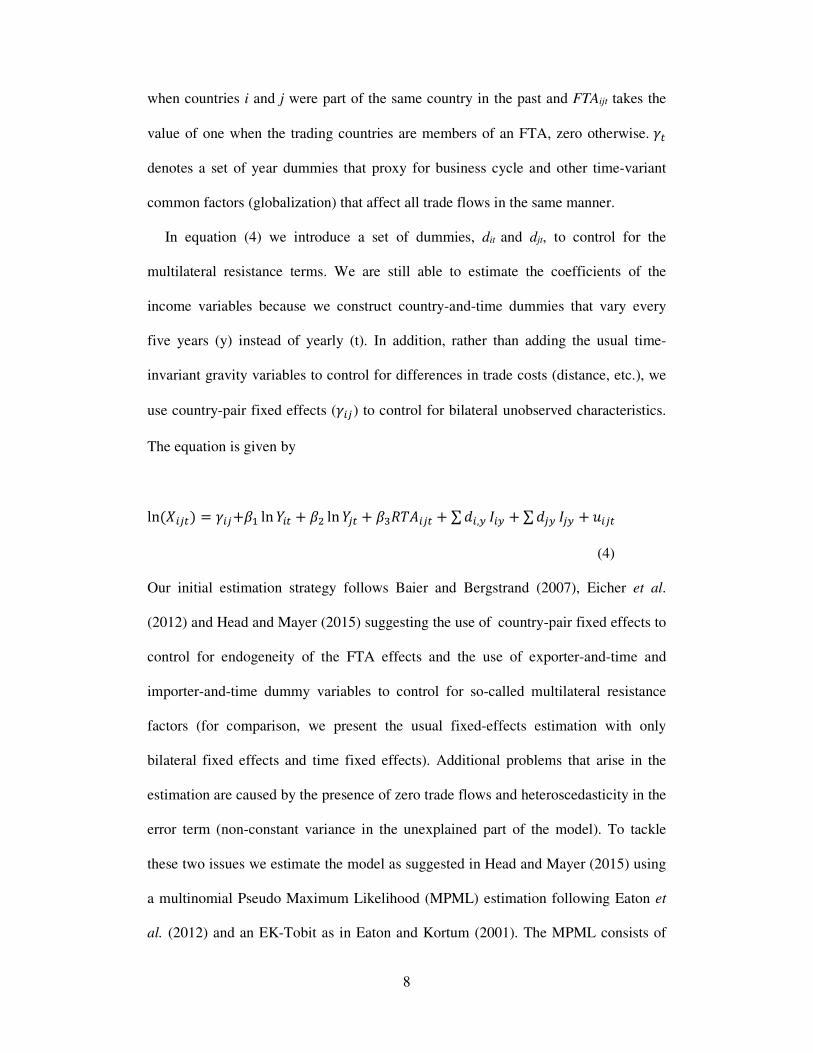
when countries i and j were part of the same country in the past and FTAijt takes the
value of one when the trading countries are members of an FTA, zero otherwise. :�
denotes a set of year dummies that proxy for business cycle and other time-variant
common factors (globalization) that affect all trade flows in the same manner.
In equation (4) we introduce a set of dummies, dit and djt, to control for the
multilateral resistance terms. We are still able to estimate the coefficients of the
income variables because we construct country-and-time dummies that vary every
five years (y) instead of yearly (t). In addition, rather than adding the usual time-
invariant gravity variables to control for differences in trade costs (distance, etc.), we
use country-pair fixed effects (:��) to control for bilateral unobserved characteristics.
The equation is given by
ln������ = :��+<� ln ��� + <" ln ��� + <#=89��� + ∑ 0�,@ A�@ + ∑ 0�@ A�@ + ;���
(4)
Our initial estimation strategy follows Baier and Bergstrand (2007), Eicher et al.
(2012) and Head and Mayer (2015) suggesting the use of country-pair fixed effects to
control for endogeneity of the FTA effects and the use of exporter-and-time and
importer-and-time dummy variables to control for so-called multilateral resistance
factors (for comparison, we present the usual fixed-effects estimation with only
bilateral fixed effects and time fixed effects). Additional problems that arise in the
estimation are caused by the presence of zero trade flows and heteroscedasticity in the
error term (non-constant variance in the unexplained part of the model). To tackle
these two issues we estimate the model as suggested in Head and Mayer (2015) using
a multinomial Pseudo Maximum Likelihood (MPML) estimation following Eaton et
al. (2012) and an EK-Tobit as in Eaton and Kortum (2001). The MPML consists of
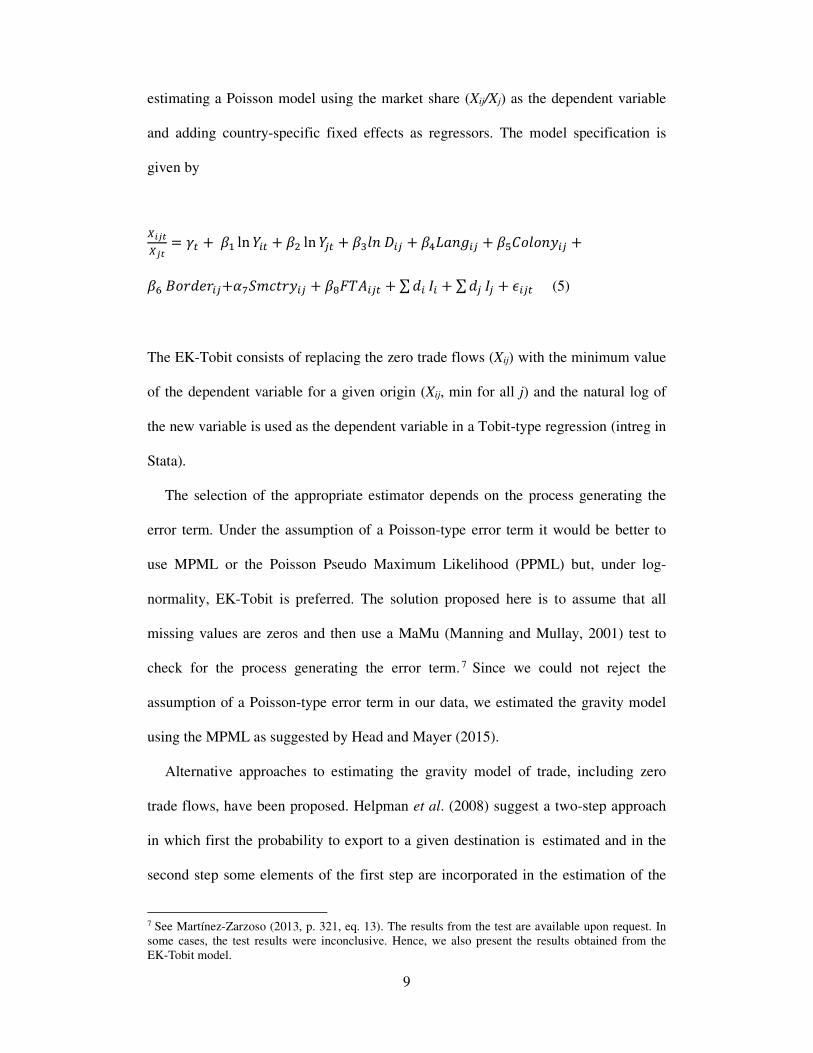
9
estimating a Poisson model using the market share (Xij/Xj) as the dependent variable
and adding country-specific fixed effects as regressors. The model specification is
given by
B��B�
= :� + <� ln ��� + <" ln ��� + <#�� $�� + <%&'�(�� + <)*+�+�,�� +
<- .+/01/��+ 2345�/,�� + <6789��� + ∑ 0� A� + ∑ 0� A� + C��� (5)
The EK-Tobit consists of replacing the zero trade flows (Xij) with the minimum value
of the dependent variable for a given origin (Xij, min for all j) and the natural log of
the new variable is used as the dependent variable in a Tobit-type regression (intreg in
Stata).
The selection of the appropriate estimator depends on the process generating the
error term. Under the assumption of a Poisson-type error term it would be better to
use MPML or the Poisson Pseudo Maximum Likelihood (PPML) but, under log-
normality, EK-Tobit is preferred. The solution proposed here is to assume that all
missing values are zeros and then use a MaMu (Manning and Mullay, 2001) test to
check for the process generating the error term. 7 Since we could not reject the
assumption of a Poisson-type error term in our data, we estimated the gravity model
using the MPML as suggested by Head and Mayer (2015).
Alternative approaches to estimating the gravity model of trade, including zero
trade flows, have been proposed. Helpman et al. (2008) suggest a two-step approach
in which first the probability to export to a given destination is estimated and in the
second step some elements of the first step are incorporated in the estimation of the
7 See Martínez-Zarzoso (2013, p. 321, eq. 13). The results from the test are available upon request. In some cases, the test results were inconclusive. Hence, we also present the results obtained from the EK-Tobit model.
10
positive trade values, namely, a control for sample selection and a control for firm
heterogeneity. Davies and Kristjánsdóttir (2010) use a Heckman two-step approach
(Heckman, 1978), controlling for selection bias in the second step where the
dependent variable is the magnitude of exports given that exports are positive. We
also use these procedures as a robustness check on our results.
3. Main results of various regional integration agreements
The DCFTA recently signed by the EU include not only trade issues, but also an
increasing number of provisions concerning foreign investment, competition policy,
sanitary and phytosanitary standards, technical regulations, intellectual property
rights, rules of origin, etc. The EU’s DCFTAs are significantly more extensive than
those previously applied or currently proposed by Russia. We try to identify the trade
effect of specific agreements by focusing specifically on their scope. For instance, the
EU has signed DCFTAs with several countries since 2000, the effects of which can
already be identified and could be comparable in scope to the DCFTAs negotiated
with Armenia, Georgia, Moldova and also Ukraine.8 But these countries could instead
decide to reverse course, as Armenia did already, and join the ECU, thus remaining
under Russia’s influence. The main aim of this section is to evaluate the trade effects
of agreements with Russia compared with trade agreements with the EU and thereby
to add some economic reasoning to the political debate. To this end, we will
distinguish between FTAs proposed by Russia, including the Common Economic
Space9 (RUSshallow) and ECU (RUSdeep)10, and FTAs or DCFTAs proposed by the
8 The DCFTAs considered are with Albania (2006), Croatia (2002) and Macedonia (2001). 9 The Common Economic Space was announced in 2003 and involved Belarus, Kazakhstan, the Kyrgyz Republic, Russia and Ukraine. The RUSshallow dummy variable will take the value of 1 after 2004 for these countries. 10 We assume that the ECU became operational in 2010, as suggested by a reviewer.
11
EU and estimate their trade effects. Appendix Table A.1 lists the agreements we
considered that were in place during the period under study.11
We estimate equations (4) and (5) for a panel of 60 exporters and 150 importers in
the period 1995 to 2012 (see Appendix Table A.2 for a list of countries).
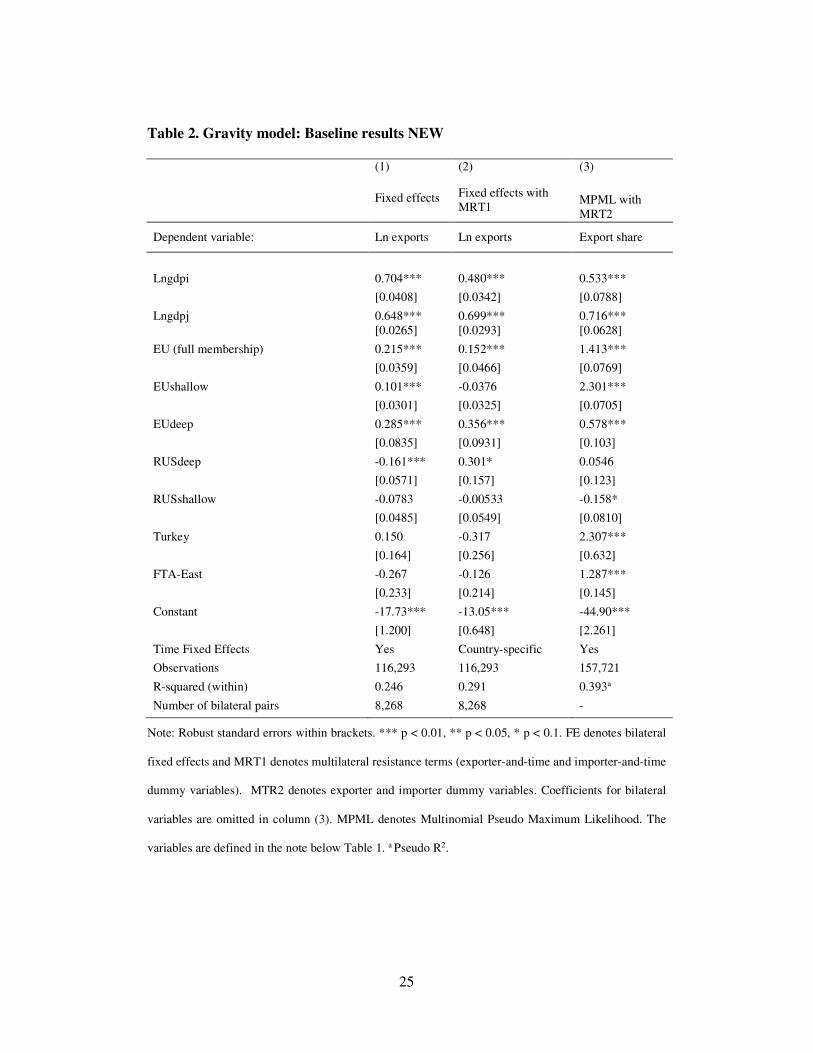
The baseline results are presented in Table 2. The first column presents the result
of estimating a variation of equation (3) with bilateral fixed effects (:��� and time
fixed effects12 �:��� and the second column presents the result of estimating equation
(4) with the multilateral resistance proxies (exporter-and-time and importer-and-time
dummies) and with bilateral fixed effects. Column (3) shows the result of applying
the MPML method with zero trade flows and with export shares as dependent variable
(equation 5).
Table 2. Gravity model: Baseline results
Our results suggest that entering into trade agreements with the EU provides a greater
stimulus to trade than joining the agreements promoted by Russia. Consider first
column (3) where row 3 shows that full accession to the EU (2004 and 2007
enlargements) increased export shares by 311 percent (e1.413 – 1 = 3.11); however, as
stated above, this is not an explicit option for EaP countries.
Consider next the effect of trade agreements with the EU and with Russia. A
DCFTA with the EU (EUdeep, row 5) will increase export shares less than full
membership, or by 78 percent (e0.578 – 1 = 0.86), whereas a DCFTA with Russia
(RUSdeep, row 6) will not result in any significant increase in export shares for the
EaP countries considered. We surmise that this result reflects the fact that FTAs with
11 We consider FTAs as shallow agreements and FTA&EIA or CU&EIA as DCFTAs (Table A.1). 12 The coefficients of the time-invariant bilateral variables (distance, common language, common colony and same country) cannot be directly estimated and are subsumed in the bilateral fixed effects.

12
Russia are less deep and less strictly implemented than comparable FTAs with the
EU.
As regards the shallow FTAs, the results are less stable and vary widely across
specifications making them less robust. By including zero trade in column (3) the
estimate for a shallow FTA with the EU is quite high – export shares will be 9 times
larger – and probably biased upwards, whereas according to column (2) there is no
effect on trade.13 On the other hand, our results suggest that the announcement of
forming a Common Economic Space with Russia (shallow FTA) has not had positive
effects on trade; in fact, the results in column (3) suggest that trade will even be
reduced (RUSshallow). Finally, a shallow FTA among EaP States will result in nearly
a trebling of export shares (e1.287 – 1 = 2.62) by column (3). Again, the effects are
probably exaggerated because we only have data since 1995/1996 for some countries
among which trade has expanded rapidly in recent years as well as due to possible
measurement errors in the trade data in the early years of the sample. Even so, our
results accord with those of Fidrmuc and Fidrmuc (2003) who report evidence of
strong home bias in trade within East and Central Europe (see also Djankov and
Freund, 2002).
Many have observed that agreements with the EU are likely to eliminate a wider
range of trade barriers on a wider range of commodities and services than agreements
with Russia. In addition, they are implemented more effectively than those between
Eurasian countries. Thus, we are not comparing “like with like agreements” but a
typical agreement with Russia with a typical similar agreement with EU. Our results
confirm econometrically the findings of previous case studies that agreements with
13 Missing and zero export flows are excluded from the estimation in column 2, but we are able to control for time-variant multilateral resistance factors (MRT1), whereas we are only able to control for time-invariant multilateral resistance factors (MRT2) in column 3, because the estimation of the model does not converge with MRT1.
13
Russia produce inferior results. 14 The former Soviet Republics have had great
difficulty in creating the institutions necessary to implement rules and procedures
required by well-functioning market economies.
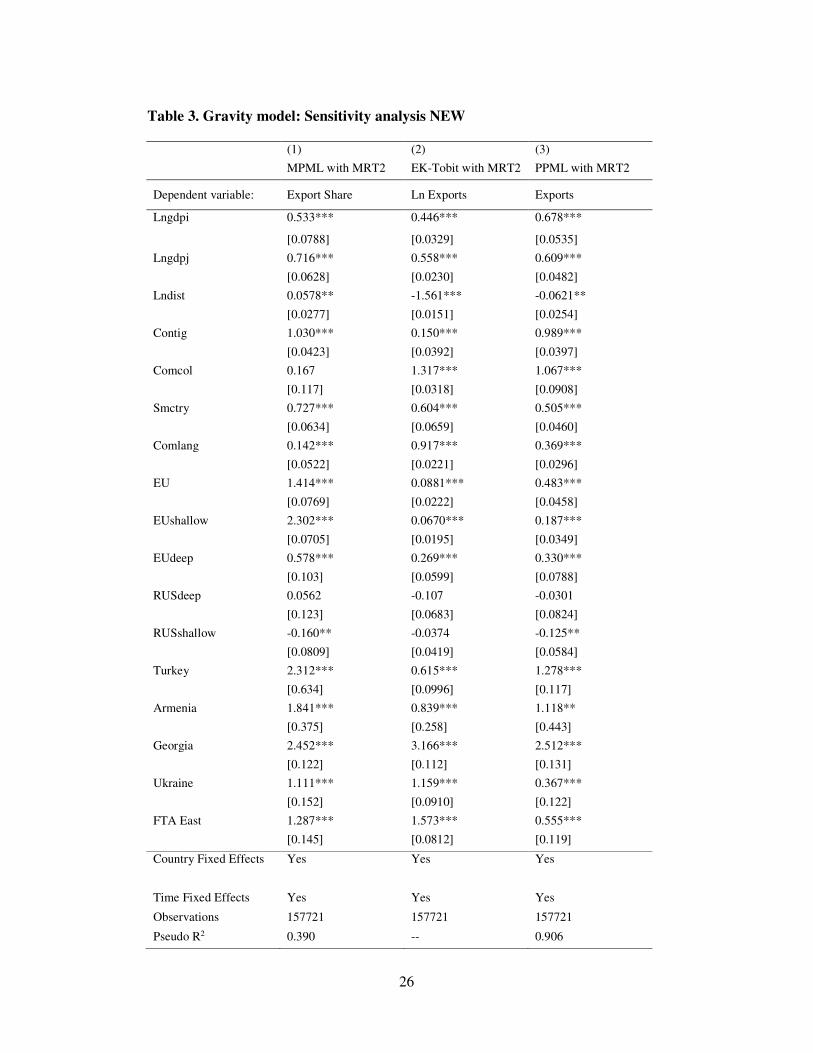
Table 3 presents the results from using alternative estimation techniques to tackle
zero trade. Here we also present estimates for the other bilateral time-invariant
variables, since the fixed effects included in Table 3 are exporter and importer fixed
effects rather than bilateral (country-pair) fixed effects. The first column uses the
same method as in column 3 of Table 2, but shows different effects for specific EaP
countries, namely, Armenia, Georgia and Ukraine. Columns 2 and 3 present estimates
obtained by using alternative estimation techniques that also consider the existence of
zero trade flows in the data, an EK-Tobit model in column 2 and a PPML model in
column 3.
Table 3. Gravity model: Sensitivity analysis
The results in Columns 2 and 3 accord with those reported in Column 1 concerning
the sign and significance of the effects. FTAs with the EU, deep or shallow,15 boost
trade whereas FTAs with Russia do not (they may even reduce trade). The effects
vary slightly, which is not surprising in view of the different underlying assumptions
of the estimated models. Further, FTAs with Turkey as well as Armenia and Georgia
are good for trade, whereas the results for Ukraine are mixed. The largest trade effect
is found for Georgia, suggesting that trade with other EaPs is eleven times larger (six
times for Armenia and three times for Ukraine) after the agreements entered into
force. The gravity dummies (common language, common border, colonial links, same
country) by and large exert significant influence on trade.
14 Kubicek, 2009; Libman, 2007; Olcott, Aslund and Garnett, 1999; Wirminghaus, 2012. 15 The results for EU shallow bilateral agreements shown in columns 2 and 3 of Table 3 suggest that trade increases by 6.2% and 25%, respectively, in keeping with the view that more trade gains should be expected from signing deep agreements rather than shallow ones. This is not the case in the results obtained for the model estimated with export shares.
14
As a first robustness check we estimated the model using the two-step approach of
Helpman et al. (2008). The results, available upon request, suggest the same general
pattern as the alternative approaches. We find no positive effect for FTAs with
Russia16 and positive and significant effects for FTAs with the EU.
As a second robustness check, given the striking variability of the EUshallow
dummy across specifications, we tried to disentangle the more heterogeneous effects
included in EUshallow agreements. To this end, we differentiated between the EU
agreements that are classified as Economic Integration Agreements (EIAs) in
Appendix Table A.1 and those that are only FTAs, with non-EaP countries outside
Europe. Among the former are the agreements with Mexico in 2000, Korea in 2001,
Chile in 2003 and CARIFORUM in 2008. Trade with those countries is not
significantly larger after the agreements. The results appear to be driven by other
agreements. We conclude that due to the high correlation between the dummies
representing shallow bilateral agreements it is hard to identify separate effects using
aggregate trade data. A more fruitful approach would be to use sectoral trade in
combination with tariff data, a task left for further research.
At last, we place our results in the existing literature by comparing them with those
reported by Kohl (2014). Also using the gravity model of trade and panel data
techniques,17 Kohl estimates the effect of 166 single EIAs with data from 1950 to
2010 for 150 countries. His sample of countries differs from ours and covers a longer
period (his ends in 2010, ours in 2012). Nevertheless, we make some tentative
comparisons of the results obtained for agreements in which Russia is (or has been) a
member with our findings. As shown by Kohl (2014, Table 5), none of the estimates
16 The estimated coefficient for RUSshallow is -0.15 (-3.16) and for RUSdeep 0.05 (1.02); robust t-values are within brackets. 17 Kohl (2014) estimates a fixed-effects version of the gravity model with importer-year and exporter-year effects that is similar to our results in column 2 of Table 2 and also a similar model in first differences. However, he does not tackle the zero-trade flows issue.
15
for Russia’s agreements with Armenia, the Kyrgyz Republic and Ukraine is
statistically significant. The same applies to the ECU and the Commonwealth of
Independent States (CIS) estimates; the latter is even negative (-1.55*) and significant
at the ten percent level. In contrast, Kohl finds a number of positive effects on trade
for EU single agreements with some Baltic states (Latvia: 0.74*) and among pairs of
former Soviet Republics (e.g., Georgia-Kazakhstan: 0.88**; Georgia-Turkmenistan:
0.01*).
In sum, the evidence shows that FTAs with Russia produce negligible positive or
even negative effects – because, we surmise again, they stay on paper without being
implemented. A tentative explanation of why trade potential with Russia remains
unexploited is the poor quality of the institutional setting in the trade agreements
proposed by Russia as well as the high levels of corruption perceived in some EaP
countries.
4. Quality of institutions and trade
Our next task is to use the estimates from the preceding section to assess whether the
quality of institutions has affected trade in EaP states. Georgia and Moldova surpass
other EaP States in terms of democracy and have relatively low levels of corruption.
Armenia and Ukraine are borderline cases as concerns the transition to both
democracy and market economy. Mansfield et al. (2002, 2007) suggest that a
democratic society is more prone to liberalize foreign trade than an autocratic one
since trade barriers create rents which benefit a small minority and encourage
emergence of oligarchs that veto tariff reductions.
To evaluate the direct effect of democracy and corruption on EaP exports we
extend to panel data the two-step approach suggested for cross-sectional data by

16
Eaton and Kortum (2002).18 In the first step, we estimate the gravity model with
country-and-year fixed effects and bilateral fixed effects and save the coefficients
obtained for the exporter-and-year dummy variables ( ∑ 0�,� A��). The specification is
similar to equation (4) but with exporter dummies varying yearly instead of every five
years.19
In the second step, we use the estimated exporter-and-time fixed effects as a
dependent variable and regress it on the Polity2 variable representing democracy (see
Section 2.1) and on corruption as reported in the International Country Risk Guide
(Section 2.5, footnote 9). This way, we aim to isolate the variation of trade that is not
explained by bilateral time-invariant unobserved heterogeneity and by trade
integration. Since we would like to interpret our second-step estimates as causal
effects, we estimate the model with methods intended to control for endogeneity.
Table 4. From institutional quality to trade
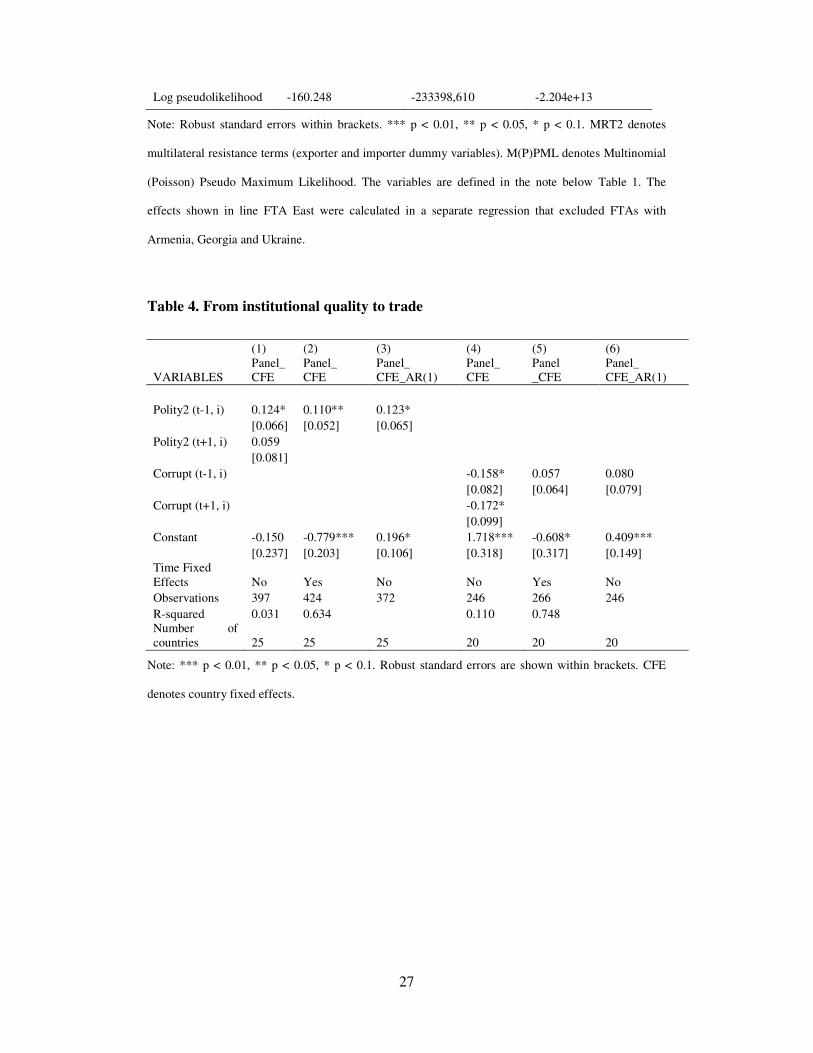
The first column in Table 4 shows estimates obtained from a panel data model with
country fixed effects and where the regressors are the first lag (at time t-1) and the
first lead (at time t+1) of the Polity2 variable. We add the lead to test for endogeneity
as suggested by Baier and Bergstrand (2007). The second and third columns add time
effects and allow for first-order autocorrelation AR(1) in the residuals.20 The results
suggest that a one-point increase in the Polity2 score will increase exports by about
twelve percent (column 3). For example, in Azerbaijan and Belarus, with democracy
scores of minus seven from the late 1990s onward, the potential for increasing trade is
18 This approach is also recommended by Head and Mayer (2015) for cross-sectional estimation. 19 Alternatively, we can take the time-variant part of the residual from the gravity model estimated in Table 2, column 1, and aggregate the exponents of the residuals across exporters for use in a second- step equation as described in the text. The results, available upon request, remain virtually unchanged. 20 As a robustness check we estimated the model using dynamic OLS and dynamic AR(1) models to control for endogeneity and autocorrelation by adding to the list of independent variables in levels their leads and lags in first differences. The results, which reflect long-run effects and are available upon request, remain similar. Positive and significant long-run effects are obtained for Polity2 and positive but not significant effects for corruption.
17
huge if they move toward more democratic institutions. Most of the EaP states could
benefit from additional exports by improving their democracy scores. Mansfield et al.
(2002) show that an effective democracy provides an incentive for politicians to enter
FTAs with other countries. Such agreements provide a ‘surveillance mechanism’ that
assures voters that politicians prevent special interests from enjoying rents provided
by protection.21
We then used our proxy for corruption as a regressor. The results in column (4) of
Table 4 suggest a weak negative correlation between corruption and exports. At first,
the causality between corruption and exports seems to be bidirectional since the lead
(t+1) is also negative and significant, but only at the 10 percent level. However, the
coefficient turns out to be positive and not statistically significant once time dummies
(or an AR(1) term) are added to the model (also the lead term became insignificant).
Indeed, a positive effect of corruption on exports could be expected in the short run if
trade barriers are evaded through bribes (see Dutt and Traca, 2009, and De Jong and
Bogmans, 2011). For the same reason, trade could encourage corruption (reverse
causality is suggested by the coefficient of the lead value). However, equally valid is
the expectation of a negative long-run effect of trade on corruption and vice
versa. Our results cannot disentangle these effects, possibly due to the short time span
for which data are available. Moreover, in our sample of exporters,22 most of which
have trade agreements with the EU, we could expect to see the effects of corruption
vary across sectors as protection is higher for agricultural products than for
21 Mansfield et al. conclude that over the post-war period pairs of democracies are twice as likely to enter a preferential trade agreement as are a democracy and an autocracy and that the latter pair is twice as likely to enter a preferential trade agreement as a pair of autocratic countries. Furthermore, the likelihood of a given country entering into a PTA increases with both the size and the proximity of its partner country. 22 Data on Polity2 are available for only 25 of the countries in our sample and, on corruption, for 20 countries; see Appendix Tables A.3 and A.4.
18
manufactured products. However, estimating the effect of corruption on sectoral trade
is beyond the scope of this paper.
In sum, our econometric results suggest that trade agreements with the EU
stimulate the EaP countries’ trade significantly more than trade agreements promoted
by Russia. Furthermore, DCFTAs between Georgia and the other EaPs, 23 and
similarly for Moldova, will also procure more trade gains than shallow FTAs. We
conclude that a more democratic government will boost trade by reducing trade
barriers and thereby also corruption and rent-seeking.
5. Creating a common neighbourhood and saving the EaP
Our results suggest that the optimal policy for EaP countries is to negotiate DCFTAs
with both major trade partners, but especially with the EU. Russia urges the EaP
countries to join the ECU, but this precludes them from having deep FTAs with the
EU.24 In order to maintain control of its “near abroad”, Russia has initiated violent
conflicts with Ukraine as well as with Georgia.
To resolve these conflicts it is necessary to consider the EaP countries as a
common neighborhood rather than as an exclusive “near abroad” of one or the other
bloc. Each EaP nation has the sovereign right to conduct its own trade policy.
The Eastern Partnership is a key option for the EaP countries. Therefore, the EU
must ensure full implementation of the DCFTAs that it has signed with Georgia,
23 The EaP countries have many common standards, - a legacy of their common Soviet past. This is not what we mean by "DCFTA scenario" among the EaP countries. Instead, we mean an agreement as defined by the EU containing approximation of legislation concerning sanitary and phytosanitary standards, technical regulations, international property rights, rules of origin and customs regulations and procedures as well as liberalisation of certain services. We assume a deep and comprehensive free trade agreement between EaP countries to be equivalent to the DCFTA agreements they have adopted with the EU. 24 True, they could have DCFTAs with the EU but only if the Eurasian Customs Union negotiates one with the EU. This, however, would make DCFTAs with the EU for the EaP countries hostage to developments in Russia and significantly delay and dilute them compared with the DCFTAs they have already negotiated with the EU.
19
Moldova and Ukraine. It must, furthermore, realize the objective shared with Russia
of a “common economic space from Lisbon to Vladivostok”,25 by extending an offer
to negotiate a DCFTA with Russia, conditional upon Russia’s cessation of hostilities
with Ukraine and international supervision of elections in the disputed areas.
Such a proposal may appear unrealistic in the current situation. Russia is far from
possessing the necessary economic and political characteristics required for a
DCFTA. It is not a democracy, it produces few goods and services that other nations
want to buy except unrefined oil, arms, chemicals and ferrous metals, it lacks a free
press and its market economy functions poorly (Gylfason et al., 2014). Moreover,
Russia’s international status after the annexation of Crimea its military support of
separatist forces in Donetsk and Luhansk approaches that of an international pariah.
However, in times of conflict it is essential to prepare for a post-conflict era. The EU
must attempt to convince President Putin that Russia stands to gain more from
viewing its “near abroad” as a common neighborhood rather than as a lost territory to
be regained through military means.
Hindsight provides benefits to which foresight is not privy. After the event, it
seems clear that misjudgments by both sides created a serious international conflict.
We conclude by identifying some reasons for why the EaP went wrong and indicating
what can be done to salvage it.
The EU overestimated the economic and political readiness of the EaP States for
DCFTAs. Campos (2013) stresses the “institutional vacuum” that has characterized
the EaP States since their independence. This paper has shown the importance of
democracy and free press both as instruments for institutional change and for
providing a solid political base for international agreements. The problems that
25 Statement by President of the European Commission Barosso following the EU-Russia Summit, 28 January, 2014.
20
Ukraine encountered prior to initialing and signing its DCFTA reflect its weak initial
conditions as concerns democracy, free press and market economy. Events have
shown that the Commission’s focus on institution-building to qualify for a DCFTA,
criticized by EaP States at the time, was correct.
Russia, too, seriously misjudged the situation. Like others, it failed to foresee that
the EU would conclude DCFTAs so rapidly with Armenia, Georgia and Moldova.
Consequently, it hastily imposed ill-conceived countermeasures. Russia also
underestimated the strong popular support that existed in parts of Ukraine for the
democratic values that the EU represents. Misjudgments by both sides thus created a
serious conflict centered on Ukraine with ramifications for Georgia and Moldova.
6. Conclusion
This paper suggests that the EaP States stand to gain significantly from trade
agreements with the EU, whether deep or shallow, while the customs union proposed
by Russia is likely to provide negligible benefits. It also shows that the EaP States
stand to gain significantly from free trade agreements with each other. While further
research is necessary to ascertain more precisely the size of these benefits, their rough
relative magnitude is supported by other studies (e.g., Kohl, 2014). These benefits
suggest that the EU should ensure that the EaP survives its current difficulties. True,
the EU’s soft power is ineffective as a response to Russia’s hard power. But the EU
cannot leave Ukraine to deal with Russia on its own as best it can. This would soon
put Georgia and Moldova in the same situation as Ukraine is in now. It would also
have serious consequences for the credibility of the EU.
An option available to the EU is to internationalize the conflict, involving the
United Nations and the Organization for Security and Co-operation in Europe (OSCE)
21
to a significantly larger extent than at present. It will need to complement its own soft
power with the hard power of the international organizations to separate the warring
factions, maintain law and order and arrange referenda so that the populations in
disputed regions can express their views concerning national borders in a democratic
manner. The EU can also negotiate a DCFTA with Russia, thereby creating a “single
economic space from Lisbon to Vladivostok” as that country has requested. This
economic space would include as a “common neighborhood” those EaP States willing
and able to participate.
References
Anderson, J. E., and E. van Wincoop (2003), “Gravity with gravitas: A solution to the
border puzzle,” American Economic Review 93(1), 170–192.
Baltagi, B., P. Egger and M. Pfaffermayr (2014), “Panel data gravity models of
international trade,” CESifo Working Paper No. 4616.
Campos, N. (2013), “What drives protests in the Ukraine? This time it is institutions,”
VoxEU.org, 22 December.
Davies, R., and H. Kristjánsdóttir (2010), “Fixed costs, foreign direct investment, and
gravity with zeros,” Review of International Economics 18(1), 47-62.
De Jong, E., and C. Bogmans (2011), “Does corruption discourage international
trade?“ European Journal of Political Economy 27, 385-398.
De Sousa, J. (2012), “The currency union effect on trade is decreasing over time,“
Economics Letters, 117(3), 917-920.
Djankov, S., and C. Freund (2002), “Trade flows in the Former Soviet Union: 1989-
1996,“ Journal of Comparative Economics 30(1), 76-90.
22
Dutt, P., and D. Traca (2010), “Corruption and bilateral trade flows: Extortion or
evasion?” Review of Economics and Statistics 92(4), 843–860.
Eaton, J., and S. Kortum (2001), “Trade in capital goods,” European Economic
Review 45(7), 1195–1235.
Eaton, J., S. Kortum and S. Sotelo (2012), “International trade: Linking micro and
macro,” NBER Working Paper 17864, National Bureau of Economic Research.
Eicher, T. S., Henn, C. and Papageorgiou, C. (2012), “Trade creation and trade
diversion revisited: Accounting for model uncertainty and natural trading partner
effects,“ Journal of Applied Econometrics 27, 296-321.
Feenstra, R. (2004), Advanced International Trade, Princeton University Press,
Princeton, NJ.
Fidrmuc, J., and J. Fidrmuc (2003), “Disintegration and trade,” Review of
International Economics 11(5), 811-829.
Gylfason, T., I. Martínez Zarzoso and P. M. Wijkman (2014), ”Can and Should the
EU’s Eastern Partnership be Saved?” CESIFO Working Paper No. 4869, July.
Head, K., and T. Mayer (2015), “Gravity equations: Workhorse, toolkit, and
cookbook,” in Gopinath, G., E. Helpman and K. Rogoff (eds.): Handbook of
International Economics, Vol. 4, 131-195, Amsterdam, Elsevier-North Holland.
Heckman, J. J., (1979), “Sample selection bias as a specification error,” Econometrica
47, 153–61.
Helpman, E., M. Melitz and Y. Rubinstein (2008), “Estimating trade flows: Trading
partners and trading volumes,” Quarterly Journal of Economics, 123(2), 441-487.
Kohl, T. (2014), “Do we really know that trade agreements increase trade?” Review of
World Economics 150(3), 443-469.
23
Libman, A. (2007), “Regionalisation and regionalism in the post-Soviet space:
Current status and implications for institutional development,“ Europe-Asia
Studies 59(3), 401-430.
Manning, W., and J. Mullahy (2001), “Estimating log models: To transform or not to
transform?” Journal of Health Economics 20(4), 461–494.
Mansfield, E. D., H. V. Milner and J. C. Pevehouse (2007), ‘Vetoing Cooperation:
The Impact of Veto Players on Preferential Trading Arrangements’, British
Journal of Political Science, 37,3, 403–32.
Mansfield, E. D., H. V. Milner and B. P. Rosendorff (2002), “Why democracies
cooperate more: Electoral control and international trade agreements,”
International Organization 56(3), 477-513.
Martínez-Zarzoso, I. (2013), “The log of gravity revisited,” Applied Economics 45(3):
311-327.
Olcott, M. B., A. Aslund and S. Garnett (1999), Getting it wrong: Regional
cooperation and the Commonwealth of Independent States, Carnegie Endowment
for International Peace.
Wirminghaus N. (2012), “Ephemeral regionalism: The proliferation of (failed)
regional integration initiatives in post-Soviet Eurasia,” in Boerzel T., Goltermann
L., Lohaus M. and Striebinger K. (eds): Roads to Regionalism: Genesis, Design,
and Effects of Regional Organisations. Aldershot: Ashgate.
24
Tables
Table 1. Summary statistics
Variable Obs Mean Std. Dev. Min Max
Exports 164700 4.79e+08 3.42e+09 0 1.43e+11
Lnexports 121249 15.93 3.590 0 25.68
Lngdpi 163350 24.82 1.884 20.57 28.92
Lngdpj 161650 24.07 2.190 18.72 30.42
Lndist 164700 8.36 .864 1.90 9.88
Contig 164700 .024 .152 0 1
Comcol 164700 .058 .233 0 1
Smctry 164700 .007 .083 0 1
Comlang 164700 .086 .281 0 1
EU 164700 .066 .248 0 1
Eushallow 164700 .056 .230 0 1
Eudeep 164700 .005 .071 0 1
RUSdeep 164700 .058 .234 0 1
RUSshallow 164700 .045 .208 0 1
Turkey 164700 .0002 .016 0 1
FTA-East 164700 .003 .056 0 1
Note: ln denotes natural logarithms, exports are in thousands of US$. gdpi and gdpj denote Gross
Domestic Product of exporter and importer country, respectively. Dist is distance between capital cities
of origin and destination countries. Contig, comcol, smctry and comlang are dummy variables that take
the value of 1 when the trading countries share a border, have ever had a colonial relationship, were
part of the same country in the past, or have a common language, respectively.
25
Table 2. Gravity model: Baseline results NEW
(1) (2) (3)
Fixed effects Fixed effects with MRT1
MPML with MRT2
Dependent variable: Ln exports Ln exports Export share
Lngdpi 0.704*** 0.480*** 0.533***
[0.0408] [0.0342] [0.0788]
Lngdpj 0.648*** 0.699*** 0.716*** [0.0265] [0.0293] [0.0628]
EU (full membership) 0.215*** 0.152*** 1.413***
[0.0359] [0.0466] [0.0769]
EUshallow 0.101*** -0.0376 2.301***
[0.0301] [0.0325] [0.0705]
EUdeep 0.285*** 0.356*** 0.578***
[0.0835] [0.0931] [0.103]
RUSdeep -0.161*** 0.301* 0.0546
[0.0571] [0.157] [0.123]
RUSshallow -0.0783 -0.00533 -0.158*
[0.0485] [0.0549] [0.0810]
Turkey 0.150 -0.317 2.307***
[0.164] [0.256] [0.632]
FTA-East -0.267 -0.126 1.287***
[0.233] [0.214] [0.145]
Constant -17.73*** -13.05*** -44.90***
[1.200] [0.648] [2.261]
Time Fixed Effects Yes Country-specific Yes
Observations 116,293 116,293 157,721
R-squared (within) 0.246 0.291 0.393a
Number of bilateral pairs 8,268 8,268 -
Note: Robust standard errors within brackets. *** p < 0.01, ** p < 0.05, * p < 0.1. FE denotes bilateral
fixed effects and MRT1 denotes multilateral resistance terms (exporter-and-time and importer-and-time
dummy variables). MTR2 denotes exporter and importer dummy variables. Coefficients for bilateral
variables are omitted in column (3). MPML denotes Multinomial Pseudo Maximum Likelihood. The
variables are defined in the note below Table 1. a Pseudo R2.
26
Table 3. Gravity model: Sensitivity analysis NEW
(1) (2) (3)
MPML with MRT2 EK-Tobit with MRT2 PPML with MRT2
Dependent variable: Export Share Ln Exports Exports
Lngdpi 0.533*** 0.446*** 0.678***
[0.0788] [0.0329] [0.0535]
Lngdpj 0.716*** 0.558*** 0.609***
[0.0628] [0.0230] [0.0482]
Lndist 0.0578** -1.561*** -0.0621**
[0.0277] [0.0151] [0.0254]
Contig 1.030*** 0.150*** 0.989***
[0.0423] [0.0392] [0.0397]
Comcol 0.167 1.317*** 1.067***
[0.117] [0.0318] [0.0908]
Smctry 0.727*** 0.604*** 0.505***
[0.0634] [0.0659] [0.0460]
Comlang 0.142*** 0.917*** 0.369***
[0.0522] [0.0221] [0.0296]
EU 1.414*** 0.0881*** 0.483***
[0.0769] [0.0222] [0.0458]
EUshallow 2.302*** 0.0670*** 0.187***
[0.0705] [0.0195] [0.0349]
EUdeep 0.578*** 0.269*** 0.330***
[0.103] [0.0599] [0.0788]
RUSdeep 0.0562 -0.107 -0.0301
[0.123] [0.0683] [0.0824]
RUSshallow -0.160** -0.0374 -0.125**
[0.0809] [0.0419] [0.0584]
Turkey 2.312*** 0.615*** 1.278***
[0.634] [0.0996] [0.117]
Armenia 1.841*** 0.839*** 1.118**
[0.375] [0.258] [0.443]
Georgia 2.452*** 3.166*** 2.512***
[0.122] [0.112] [0.131]
Ukraine 1.111*** 1.159*** 0.367***
[0.152] [0.0910] [0.122]
FTA East 1.287*** 1.573*** 0.555***
[0.145] [0.0812] [0.119]
Country Fixed Effects Yes
Yes
Yes
Time Fixed Effects Yes Yes Yes
Observations
Pseudo R2
157721
0.390
157721
--
157721
0.906
27
Log pseudolikelihood -160.248 -233398,610 -2.204e+13
Note: Robust standard errors within brackets. *** p < 0.01, ** p < 0.05, * p < 0.1. MRT2 denotes
multilateral resistance terms (exporter and importer dummy variables). M(P)PML denotes Multinomial
(Poisson) Pseudo Maximum Likelihood. The variables are defined in the note below Table 1. The
effects shown in line FTA East were calculated in a separate regression that excluded FTAs with
Armenia, Georgia and Ukraine.
Table 4. From institutional quality to trade
(1) (2) (3) (4) (5) (6)
VARIABLES Panel_ CFE
Panel_ CFE
Panel_ CFE_AR(1)
Panel_ CFE
Panel _CFE
Panel_ CFE_AR(1)
Polity2 (t-1, i) 0.124* 0.110** 0.123*
[0.066] [0.052] [0.065]
Polity2 (t+1, i) 0.059
[0.081]
Corrupt (t-1, i)
-0.158* 0.057 0.080
[0.082] [0.064] [0.079]
Corrupt (t+1, i)
-0.172* [0.099]
Constant -0.150 -0.779*** 0.196* 1.718*** -0.608* 0.409***
[0.237] [0.203] [0.106] [0.318] [0.317] [0.149]
Time Fixed Effects No Yes No No Yes No
Observations 397 424 372 246 266 246
R-squared 0.031 0.634
0.110 0.748 Number of
countries 25 25 25 20 20 20
Note: *** p < 0.01, ** p < 0.05, * p < 0.1. Robust standard errors are shown within brackets. CFE
denotes country fixed effects.
28
Appendix
Table A.1. List of agreements
Members Type Date of entry into
force
Armenia – Kazakhstan FTA 25-Dec-2001
Armenia – Moldova FTA 21-Dec-1995
Armenia - Russian Federation FTA 25-mar-93
Armenia – Turkmenistan FTA 07-jul-96
Armenia – Ukraine FTA 18-Dec-1996
EC (25) Enlargement CU & EIA
01-may-04
EC (27) Enlargement CU & EIA
01-ene-07
EU - Turkey CU 01-ene-96
Eurasian Economic Community (EAEC) CU 08-oct-97
Central European Free Trade Agreement (CEFTA)
FTA 01-may-07
EFTA - Albania FTA 01-nov-10
EFTA - Canada FTA 01-jul-09
EFTA - Chile FTA & EIA
01-dic-04
EFTA - Colombia FTA & EIA
01-jul-11
EFTA - Egypt FTA 01-ago-07
EFTA - Former Yugoslav Republic of Macedonia FTA 01-may-02
EFTA - Hong Kong, China FTA & EIA
01-oct-12
EFTA - Israel FTA 01-ene-93
EFTA - Jordan FTA 01-sep-02
EFTA - Korea, Republic of FTA & EIA
01-sep-06
EFTA - Lebanon FTA 01-ene-07
EFTA - Mexico FTA & EIA
01-jul-01
EFTA - Montenegro FTA 01-sep-12
EFTA - Morocco FTA 01-dic-99
EFTA - Palestinian Authority FTA 01-jul-99
EFTA - Peru FTA 01-jul-11
EFTA - SACU FTA 01-may-08
EFTA - Serbia FTA 01-oct-10
EFTA - Singapore FTA & EIA
01-ene-03
EFTA - Tunisia FTA 01-jun-05
EFTA - Ukraine FTA & EIA
01-jun-12
Egypt - Turkey FTA 01-mar-07
EU - Albania FTA & EIA
01-Dec-2006(G)
01-Apr-2009(S)
EU - Algeria FTA 01-sep-05
EU - Bosnia and Herzegovina FTA 01-jul-08
EU - Cameroon FTA 01-oct-09
EU - CARIFORUM States EPA FTA & EIA
01-nov-08
29
EU - Chile FTA & EIA
01-Feb-2003(G)
01-Mar-2005(S)
EU - Côte d'Ivoire FTA 01-ene-09
EU - Eastern and Southern Africa States Interim EPA
FTA 14-may-12
EU - Egypt FTA 01-jun-04
EU - Faroe Islands FTA 01-ene-97
EU - Former Yugoslav Republic of Macedonia FTA & EIA
01-Jun-2001(G)
01-Apr-2004(S)
EU - Iceland FTA 01-abr-73
EU - Israel FTA 01-jun-00
EU - Jordan FTA 01-may-02
EU - Korea, Republic of FTA & EIA
01-jul-11
EU - Lebanon FTA 01-mar-03
EU - Mexico FTA & EIA
01-Jul-2000(G)
01-Oct-2000(S)
EU - Montenegro FTA & EIA
01-Jan-2008(G)
01-May-2010(S)
EU - Morocco FTA 01-mar-00
EU - Palestinian Authority FTA 01-jul-97
EU - Papua New Guinea / Fiji FTA 20-dic-09
EU - Serbia FTA & EIA
01-Feb-2010(G)
01-Sep-2013(S)
EU - South Africa FTA 01-ene-00
EU - Tunisia FTA 01-mar-98
European Free Trade Association (EFTA) FTA & EIA
03-May-1960(G)
01-Jun-2002(S)
Georgia - Armenia FTA 11-nov-98
Georgia - Azerbaijan FTA 10-jul-96
Georgia - Kazakhstan FTA 16-jul-99
Georgia - Russian Federation FTA 10-may-94
Georgia - Turkmenistan FTA 01-Jan-2000
Georgia - Ukraine FTA 04-jun-96
Iceland - Faroe Islands FTA & EIA
01-nov-06
Kyrgyz Republic - Armenia FTA 27-oct-95
Kyrgyz Republic - Kazakhstan FTA 11-nov-95
Kyrgyz Republic - Moldova FTA 21-nov-96
Kyrgyz Republic - Russian Federation FTA 24-Apr-1993
Kyrgyz Republic - Ukraine FTA 19-Jan-1998
Kyrgyz Republic - Uzbekistan FTA 20-mar-98
Russian Federation - Azerbaijan FTA 17-feb-93
Russian Federation - Belarus FTA 20-Apr-1993
Russian Federation - Belarus - Kazakhstan CU 03-Dec-1997
Russian Federation - Kazakhstan FTA 07-jun-93
Russian Federation - Republic of Moldova FTA 30-mar-93
Russian Federation - Serbia FTA 03-jun-06
Russian Federation - Tajikistan FTA 08-Apr-1993
Russian Federation - Turkmenistan FTA 06-Apr-1993
Russian Federation - Uzbekistan FTA 25-mar-93
Turkey - Albania FTA 01-may-08
Turkey - Bosnia and Herzegovina FTA 01-jul-03
Turkey - Chile FTA 01-mar-11
30
Turkey - Former Yugoslav Republic of Macedonia
FTA 01-sep-00
Turkey - Georgia FTA 01-nov-08
Turkey - Israel FTA 01-may-97
Turkey - Jordan FTA 01-mar-11
Turkey - Montenegro FTA 01-mar-10
Turkey - Morocco FTA 01-ene-06
Turkey - Palestinian Authority FTA 01-jun-05
Turkey - Serbia FTA 01-sep-10
Turkey - Syria FTA 01-ene-07
Turkey - Tunisia FTA 01-jul-05
Ukraine - Azerbaijan FTA 02-sep-96
Ukraine - Belarus FTA 11-nov-06
Ukraine - Former Yugoslav Republic of Macedonia
FTA 05-jul-01
Ukraine - Kazakhstan FTA 19-oct-98
Ukraine - Moldova FTA 19-may-05
Ukraine - Montenegro FTA & EIA
25-Apr-2013
Ukraine - Russian Federation FTA 18-Aug-2008
Ukraine - Tajikistan FTA 18-Aug-2008
Ukraine - Uzbekistan FTA 18-Aug-2008
Ukraine -Turkmenistan FTA 18-Aug-2008
Source: WTO. Some of the agreements listed in which Russia is involved might be inoperative. It is a consensus in the literature that the 1997 CU agreement between Russia, Belarus and Kazakhstan was not implemented partly due to the economic crisis in 1998. The same applies to the Eurasian Economic Community, which failed to create a customs union (it maintained a limited FTA).
Table A.2. List of countries Exporter countries
Albania Hungary Oman
Algeria Iceland Poland
Austria Ireland Portugal
Azerbaijan Israel Qatar
Belarus Italy Russian Federation
Belgium Jordan Saudi Arabia
Bosnia and Herzegovina Kazakhstan Slovak Republic
Bulgaria Kuwait Slovenia
Croatia Kyrgyz Republic Spain
Cyprus Latvia Sweden
Czech Republic Lebanon Switzerland
Denmark Libya Syrian Arab Republic
Egypt, Arab Rep. Lithuania Tajikistan
Estonia Luxembourg Tunisia
Ethiopia Malta Turkey
Finland Mauritania Turkmenistan
France Moldova Ukraine
Georgia Morocco United Arab Emirates
Germany Netherlands United Kingdom
Greece Norway Yemen, Rep.
Importer countries
Albania Eritrea Malawi Swaziland
31
Algeria Estonia Malaysia Sweden
Angola Ethiopia Mali Switzerland
Argentina Finland Malta Syrian Arab Republic
Armenia France Mauritania Tajikistan
Australia Gabon Mauritius Tanzania
Austria Gambia, The Mexico Thailand
Azerbaijan Georgia Moldova Togo
Bangladesh Germany Morocco Trinidad and Tobago
Belarus Ghana Mozambique Tunisia
Belgium Greece Namibia Turkey
Benin Guatemala Nepal Turkmenistan
Bolivia Guinea Netherlands Uganda
Bosnia and Herzegovina Guinea-Bissau New Zealand Ukraine
Botswana Haiti Nicaragua United Arab Emirates
Brazil Honduras Niger United Kingdom
Bulgaria Hungary Nigeria United States
Burkina Faso Iceland Norway Uruguay
Burundi India Oman Uzbekistan
Cabo Verde Indonesia Pakistan Venezuela, RB
Cambodia Iran, Islamic Rep. Panama Vietnam
Cameroon Iraq Paraguay Yemen, Rep.
Canada Ireland Peru Zambia
Central African Republic Israel Philippines Zimbabwe
Chad Italy Poland
Chile Japan Portugal
China Jordan Qatar
Colombia Kazakhstan Russian Federation
Congo, Rep. Kenya Rwanda
Costa Rica Korea, Dem. Rep. Samoa
Cote d'Ivoire Korea, Rep. Saudi Arabia
Croatia Kuwait Senegal
Cuba Kyrgyz Republic Sierra Leone
Cyprus Lao PDR Singapore
Czech Republic Latvia Slovak Republic
Denmark Lebanon Slovenia
Dominica Lesotho Somalia
Dominican Republic Liberia South Africa
Ecuador Libya Spain
Egypt, Arab Rep. Lithuania Sri Lanka
El Salvador Luxembourg Sudan
Equatorial Guinea Madagascar Suriname
Table A.3. Polity2 scores for exporters Country mean min max
Albania 6.833 0 9
Azerbaijan -6.833 -7 -6
Belarus -6.611 -7 0

32
Belgium 9.333 8 10
Cyprus 10 10 10
Egypt, Arab Rep. -4.705 -6 -2
Estonia 8.222 6 9
Finland 10 10 10
Greece 10 10 10
Hungary 10 10 10
Israel 9.777 9 10
Italy 10 10 10
Jordan -2.333 -3 -2
Luxembourg 10 10 10
Norway 10 10 10
Poland 9.6111 9 10
Qatar -10 -10 -10
Russian Federation 4.5 3 6
Saudi Arabia -10 -10 -10
Syrian Arab Republic -7.555 -9 -7
Tunisia -3.562 -4 -3
Turkey 7.333 7 9
Turkmenistan -9 -9 -9
Ukraine 6.5 6 7
Yemen, Rep. -1.722 -2 3
Total 3.075 -10 10
Source: Polity IV project, Center for Systemic Peace website.
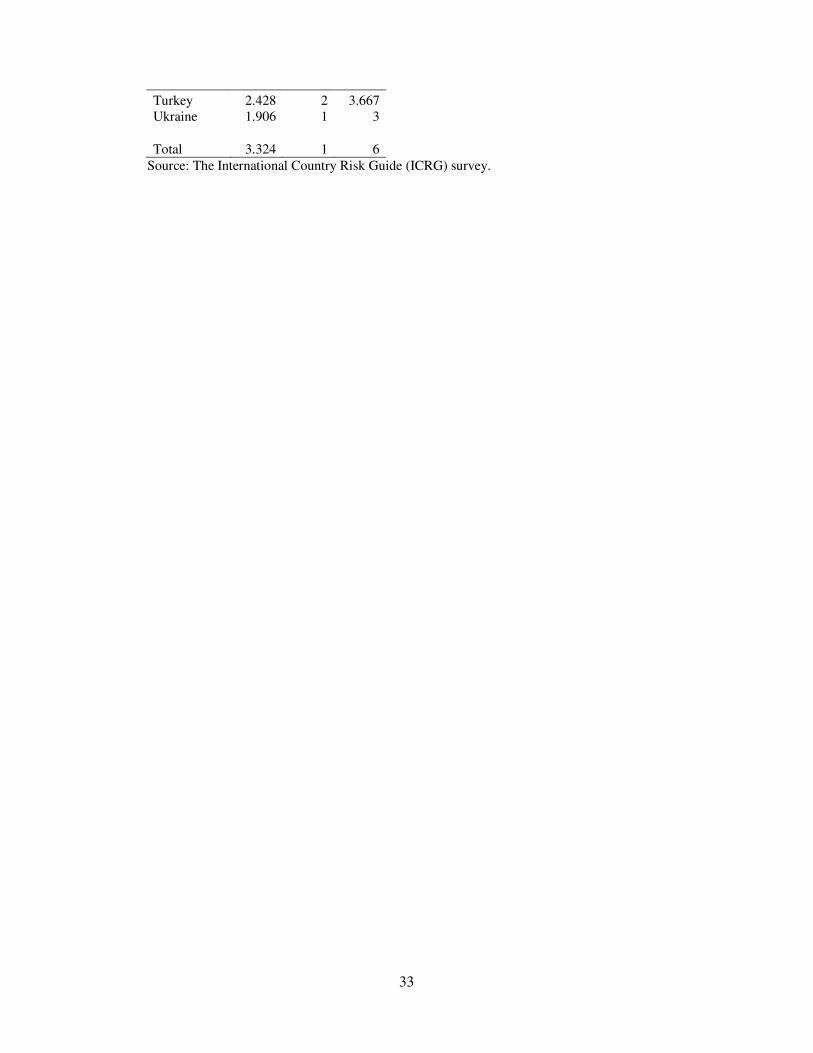
Table A.4. Transparency scores for exporters
Country mean min max
Albania 3.833 3.833 3.833
Azerbaijan 1.788 1.5 2
Belarus 2.514 2 4
Belgium 3.825 3 5
Cyprus 4.256 4 5
Estonia 3.492 3 5
Finland 6.000 6 6
Greece 3.517 2 5
Hungary 3.806 3 5
Israel 3.383 3 5
Italy 2.875 2.458 4
Jordan 3.278 3 4
Luxembourg 5.144 5 6
Norway 5.100 5 6
Poland 3.169 2 5
Qatar 2.167 2 2.5 Saudi Arabia 2.000 2 2
Tunisia 2.461 2 3
33
Turkey 2.428 2 3.667 Ukraine 1.906 1 3
Total 3.324 1 6
Source: The International Country Risk Guide (ICRG) survey.