The effect of temperature variations on the camber of ......ost medium-span bridges in the United...
17
September–October 2015 | PCI Journal 48 M ost medium-span bridges in the United States are constructed with precast, prestressed concrete girders that support a cast-in-place concrete deck. These girders usually have an upward deflection (camber) that results from the combined effects of the ec- centric axial prestressing force and the gravity loads. If the camber is less than expected, the contractor must increase the amount of concrete needed to construct the cast-in- place concrete pad between the top of the girder and the deck. If the camber is greater than expected, the girder may interfere with placement of the deck reinforcement. Differences between expected and actual cambers are even more critical if the bridge owner rejects the girder for be- ing out of compliance with the specifications. The prediction of girder camber at a particular time is difficult because it depends on the concrete properties, curing conditions, prestress losses, and temperature varia- tions within the girder, all of which vary with time. 1,2 One contributor to this difficulty is the effect of variations in the profile of internal temperatures over a day. Such varia- tions induce thermal strains, which, if they vary over the height of the girder, result in camber even in the absence of external loads. Thermal camber typically has the most important conse- quences during construction. At that time, the girders are ■ Field measurements of daily variations in temperature profile and camber for two precast, prestressed concrete girders provided data with which to calibrate models of the effect of temperature variations on camber. ■ Camber history was computed using measured temperature profiles and an assumed coefficient of thermal expansion of 5.5 × 10 -6 /˚F (9.9 × 10 -6 /˚C). ■ Two practical methods were also developed using 164 observations from 24 girders. The effect of temperature variations on the camber of precast, prestressed concrete girders Hang Nguyen, John Stanton, Marc Eberhard, and David Chapman
Transcript of The effect of temperature variations on the camber of ......ost medium-span bridges in the United...

September–October 2015 | PCI Journal48
Most medium-span bridges in the United States are constructed with precast, prestressed concrete girders that support a cast-in-place concrete
deck. These girders usually have an upward deflection (camber) that results from the combined effects of the ec-centric axial prestressing force and the gravity loads. If the camber is less than expected, the contractor must increase the amount of concrete needed to construct the cast-in-place concrete pad between the top of the girder and the deck. If the camber is greater than expected, the girder may interfere with placement of the deck reinforcement. Differences between expected and actual cambers are even more critical if the bridge owner rejects the girder for be-ing out of compliance with the specifications.
The prediction of girder camber at a particular time is difficult because it depends on the concrete properties, curing conditions, prestress losses, and temperature varia-tions within the girder, all of which vary with time.1,2 One contributor to this difficulty is the effect of variations in the profile of internal temperatures over a day. Such varia-tions induce thermal strains, which, if they vary over the height of the girder, result in camber even in the absence of external loads.
Thermal camber typically has the most important conse-quences during construction. At that time, the girders are
■ Field measurements of daily variations in temperature profile and camber for two precast, prestressed concrete girders provided data with which to calibrate models of the effect of temperature variations on camber.
■ Camber history was computed using measured temperature profiles and an assumed coefficient of thermal expansion of 5.5 × 10⁻⁶/˚F (9.9 × 10⁻⁶/˚C).
■ Two practical methods were also developed using 164 observations from 24 girders.
The effect of temperature variations on the camber of precast, prestressed concrete girders
Hang Nguyen, John Stanton, Marc Eberhard, and David Chapman

49PCI Journal | September–October 2015
where
t(Y) = change in temperature at height Y
Y = vertical coordinate, measured upwards from a point located Y0 below the concrete deck surface
Y0 = distance from top surface at which temperature change is zero, value = 1200 mm = 47.25 in.
T = temperature at top surface of deck
= 32 – 0.2ha (˚C) for ha in mm
= 89.6 – 5.08ha (˚F) for ha in in.
ha = asphalt thickness
Figure 1 compares the design positive temperature gradient from Eq. (1) with the one recommended by the AASHTO LRFD specifications for a typical large girder.3 These specifications define a dimension A that controls the depth to which the temperature change penetrates (Fig. 1). The value of A varies with the superstructure depth and materials, and it is 12 in. (300 mm) for concrete superstructures that are at least 16 in. (410 mm) deep. The change in bottom temperature ∆T3 is 0 unless a site specif-ic study has determined another appropriate value, but it is not to exceed 5˚F (3˚C). An increase in bottom temperature reduces the thermal camber. A negative design temperature gradient is obtained by multiplying the positive gradient by a factor of -0.2 and -0.3, respectively, for decks with and without asphalt overlays.
A number of researchers have measured temperature gradients and their effects on camber in bridge girders and decks. For example, Shushkewich acquired large amounts of thermocouple data from an instrumented prestressed concrete box girder bridge, the North Halawa Valley Viaduct in Hawaii.5 The results validated the positive and negative thermal gradients included in the AASHTO LRFD specifications.3
Barr monitored changes in camber of five simply sup-ported I-girders during a day to evaluate the bridge’s response to daily temperature variations.6 He found that the camber varied by 0.63 in. (16 mm) between 9:00 a.m. and 9:00 p.m. in one day. He also found that the calculated tensile stresses at the bottom of the girder were larger for the temperature gradient proposed by Priestley than for any of the gradients recommended by the 1994 AASHTO LRFD specifications.4,7
Hinkle observed that the cambers of three girders with an average length of 128 ft (39.0 m) varied by up to 0.50 in. (13 mm) between 7:45 a.m. and 1:25 p.m. in the same day.8 French and O’Neill monitored variations of camber
statically determinate, so no bending moments exist to restrain the camber, which is therefore at a maximum. If the girders are later connected longitudinally to create a continuous system, any thermally induced camber induces continuity moments, which reduce the magnitude of the thermal camber for a given temperature gradient. The addition of the cast-in-place concrete deck also tends to reduce camber.
This paper investigates the effects on camber of variations of temperature over the height of the girder before a slab is cast. After discussing previous work in this area, the paper describes the experimental program, which included moni-toring of camber and temperatures. The time-dependent, measured internal temperature profiles were used to gener-ate theoretical camber histories, which were compared with the measured values. The paper then develops two new, practical methods that allow the designer to estimate the expected camber in a bridge girder due to diurnal tem-perature variations. Camber variations arise from multiple causes, which are too numerous and complex to evaluate in a single paper. This paper addresses only cambers induced by thermal gradients.
The methods proposed herein may be used for estimating thermal camber for a known temperature environment. Knowledge of the thermal camber is expected to be helpful for making appropriate elevation allowances when setting formwork for the cast-in-place deck slab, for estimating the additional concrete required in the haunch over the girder, and, in extreme cases, for ensuring that girders are not rejected for having camber that lies outside the specified range.
Previous work
For the purpose of design, the American Association of State Highway and Transportation Officials’ AASHTO LRFD Bridge Design Specifications3 provide four tempera-ture gradients corresponding to four solar radiation zones in the United States. The gradient depends on the location of the bridge girder, the superstructure depth, and the mate-rials in the superstructure.
The AASHTO LRFD specifications’ design gradients are similar in principle to those proposed by Priestley.4 He studied seven bridge girder sections under the effects of wind, ambient temperature variations, blacktop (asphalt) thickness, and solar absorptivity. For design, he proposed the following vertical temperature profile at the top of the girder:
(1)

September–October 2015 | PCI Journal50
girders are typically cast at approximately noon on one day and released the next morning. Weekend girders are typical-ly cast on a Friday and released on the following Monday morning. Typically, the concrete for these weekend girders is more mature at release, even though the curing tempera-ture may have been lower, on average, than for a weekday girder. All of the measurements discussed in this paper were taken approximately two months after the prestress-ing force had been applied to the girder concrete, by which time the effects of creep, shrinkage, and relaxation were expected to be constant over the course of any one day.
The internal temperatures of the two girders were measured at a single cross section near midspan at one-minute intervals using fifteen type J thermocouples. The changes in camber at midspan of the two girders were measured continuously with a deflection sensor in the fabricator’s storage yard. Figure 2 shows the locations of the thermocouples. More thermocouples were placed in the top flange than in the web, both because the top flange was expected to experience the largest variation in temperature during the day and because the thin flange tips had the largest surface/volume ratio, which increases
of 11 girders.9 Three of these girders were monitored on two separate days, resulting in a total of 14 girder-obser-vation days. The camber of the monitored girders varied during each day by 0.70 to 0.95 in. (18 to 24 mm) for girders ranging in length from 119 to 132 ft (36.3 to 40.2 m). These field observations are used later in this paper to calibrate the proposed simple methods for estimating thermal camber.
Experimental program
In this study, two large prestressed concrete girders were instrumented to quantify daily temperature variations, de-velop an understanding of the effects of these variations on camber, and calibrate theoretical and more practical models for predicting thermal camber. The results are summarized here. Nguyen gives details.10
Table 1 lists key properties for the monitored girders. Both girders were Washington State WF100G girders with an I-shaped cross section and a depth of 100 in. (2500 mm) (appendix 5.6-A4-10, Washington State Department of Transportation Bridge Design Manual (LRFD).11 Weekday
Figure 1. Design temperature gradient. T = temperature at top surface of deck; ∆T = temperature difference over height of girder; ∆T1 = temperature change at top surface of girder; ∆T2 = temperature change 4 in. below top surface of girder; ∆T3 = temperature change at bottom of girder. 1 in. = 25.4 mm; ˚C = (˚F – 32)/1.8.
4 in.
AASHTO LRFD specifications (2012) (Zone 3)
8 in.
A
T3
T1 = 41°F
T2 = 11°F
Proposed by Priestley (1978)
47.2 in.
8 in.T = 2.7°F
T = 57.6°F
Table 1. Girder properties
Girder Girder mark Cast date Measurement date Depth, in. Length, ft fc' at release, psi fc
' at 28 days, psi
Weekend girder H6B May 18, 2012 July 26, 2012 100 172.7 9215 11,260
Weekday girder H8A May 29, 2012 July 25 and 26, 2012 100 164.0 8250 12,430
Note: f c' = compressive strength of concrete. 1 in. = 25.4 mm; 1 ft = 0.305 m; 1 psi = 6.895 kPa.

51PCI Journal | September–October 2015
day, when sunlight was strongest, was higher at the bottom left sensor than at the bottom right or bottom center sensor locations.
In the late afternoon, the internal temperatures in the top of the girder dropped rapidly as the solar radiation became weaker and the air temperature decreased, whereas the temperatures in the web and bottom portions in the girders cooled more slowly. This difference can be explained by the fact that the bottom region of the girders was affected by heat from the ground and was less exposed to wind. During the day, the ground was heated by the sun. How-ever, the ground changes temperature more slowly than does the air, so the bottom flange continued to warm in the evening due to heat from the ground.
Figure 4 shows the corresponding vertical temperature profiles of the girders at various times. For each elevation that had more than one thermocouple (for example, the flanges), the average temperature is plotted at that eleva-tion. The temperatures varied most over the height of the girder at approximately 4:00 p.m.
Calculation of thermal camber changes from temperature profiles
Thermal camber can be predicted from the measured in-ternal temperature profile using the principles of mechan-ics and an assumed value of the coefficient of thermal expansion. The total strain at any point will consist of
the possibility of transverse (as well as vertical) variations in temperature.
Measured temperature histories
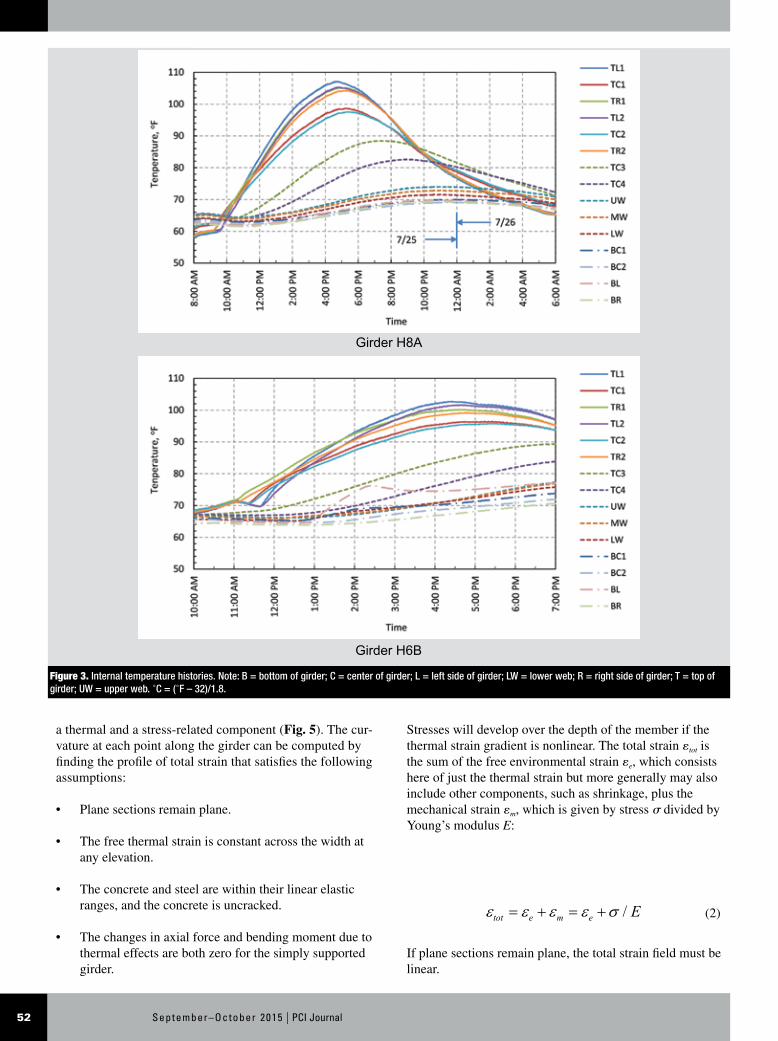
Figure 3 shows the measured internal temperature histo-ries for girder H8A for 22 hours and for girder H6B for 9 hours. A problem with electrical power supply prevented the data logger from monitoring girder H6B for a longer time.
The data follow expected trends. For both girders, the tem-perature profile over the height of girders was nearly uni-form until about 10:00 a.m. During the late morning and afternoon, the temperature in the top of the flange exposed directly to sunlight increased rapidly until it reached a peak at about 4:00 p.m. At this time, the temperature change in the top flange was approximately equal to 40˚F (22˚C). In contrast, the temperatures in the web and bottom flange changed less because these locations were shaded by the top flange and by adjacent girders in the storage yard. This situation is similar to that which a girder would experience during installation, at which time the flange, adjacent gird-ers, and deck formwork would similarly shadow the web and bottom flange.
The left side of the web of girder H6B was also exposed to direct sunlight, which might be similar to the exposure condition for an exterior girder in a bridge. Figure 3 plots that exposure data, in which the temperature during the
Figure 2. Thermocouple locations. Note: B = bottom of girder; C = center of girder; L = left side of girder; LW = lower web; R = right side of girder; T = top of girder; UW = upper web.
10 in. 9 in. 9 in.10 in.
BC1
BC2 BRBL
5 in
.5
in.
4 in
.6
in.
1 ft
10 in
.2
ft 2
in.
1 ft
2 in
.1 ft
5 in
.
LW
MW
UW
TC4TC3
4 at 12.25 in.TL1 TC1 TR1
TL2 TC2 TR2
September–October 2015 | PCI Journal52
a thermal and a stress-related component (Fig. 5). The cur-vature at each point along the girder can be computed by finding the profile of total strain that satisfies the following assumptions:
• Plane sections remain plane.
• The free thermal strain is constant across the width at any elevation.
• The concrete and steel are within their linear elastic ranges, and the concrete is uncracked.
• The changes in axial force and bending moment due to thermal effects are both zero for the simply supported girder.
Stresses will develop over the depth of the member if the thermal strain gradient is nonlinear. The total strain εtot is the sum of the free environmental strain εe, which consists here of just the thermal strain but more generally may also include other components, such as shrinkage, plus the mechanical strain εm, which is given by stress σ divided by Young’s modulus E:
(2)
If plane sections remain plane, the total strain field must be linear.
Figure 3. Internal temperature histories. Note: B = bottom of girder; C = center of girder; L = left side of girder; LW = lower web; R = right side of girder; T = top of girder; UW = upper web. ˚C = (˚F – 32)/1.8.
Girder H8A
Girder H6B

53PCI Journal | September–October 2015
(3)
where
ε0 = total strain at the origin
ϕ = curvature
y = vertical coordinate, measured positive downwards from the origin
For this derivation, strains are assumed to be positive in tension, and a positive curvature causes downward de-flection. The origin may be taken anywhere. Combining Eq. (2) and (3) gives Eq. (4).
(4)
For a statically determinate girder, axial-force equilibrium is determined by Eq. (5).
(5)
If the section contains several materials with different properties, they must be taken into account when the integral is evaluated. The two unknowns are ε0 and ϕ. The integral can be broken into components, and the axial force equilibrium equation can be rearranged to give a linear equation in ε0 and ϕ (Eq. [6]).
(6)
Similarly, moment equilibrium at the section requires Eq. (7).
(7)
Again this equation can be rearranged to give Eq. (8).
Figure 4. Temperature profiles over height of girders. Note: 1 in. = 25.4 mm; ˚C = (˚F – 32)/1.8.
Girder H8A Girder H6B
Figure 5. Strain profile in simply supported girder.
Cross section Free thermal strain Stress-induced strain Total strain
Centroid
y
Centroid
y
Free concrete strain
Free strand strainStress-induced strain Total strain

September–October 2015 | PCI Journal54
(14)
Once ε0 and ϕ are known, the total strain field can be cal-culated from Eq. (3), and the stresses from Eq. (4).
In general, the curvatures at several points along the girder must be computed and then integrated to give the camber. However, if the girder is prismatic and the thermal condi-tions are the same along the length, the thermal curvature will be constant along the length and may be computed at a single location. The midspan deflection is obtained by in-tegrating this curvature twice. If the member is simply sup-ported, the camber at midspan ∆camber is given by Eq. (15).
(15)
where
L = length of the girder
The negative sign in Eq. (15) results from the fact that the calculated deflection is negative, but in practice, camber is taken as positive upwards.
The measured temperature profiles were used to predict camber changes in girders H6B and H8A over the period that they were monitored. For simplicity, the gross (rather than the transformed) section properties were used in the calculations. According to the Federal Highway Adminis-tration, the coefficient of thermal expansion of portland ce-ment concrete ranges from about 4.4 × 10⁻⁶ to 6.6 × 10⁻⁶/˚F (7.9 × 10⁻⁶ to 12.0 × 10⁻⁶/˚C).12 Wight and MacGregor found that the coefficient of thermal expansion for normal-weight concretes made with siliceous aggregates ranges from 5.0 × 10⁻⁶ to 7.0 × 10⁻⁶/˚F (9.0 × 10⁻⁶ to 12.6 × 10⁻⁶/˚C).13 In their calculations, Barr et al. assumed a value of 6.5 × 10⁻⁶/˚F (11.7 × 10⁻⁶/˚C) for this coeffi-cient.14
Figure 6 compares the measured camber histories with the values calculated using Eq. (12) to (15) and the measured thermal profiles. Two calculated curves are shown, cor-responding to coefficients of thermal expansion of 5.5 × 10⁻⁶ ˚F (9.9 × 10⁻⁶/˚C) and 6.5 × 10⁻⁶/˚F (11.7 × 10⁻⁶/˚C). The calculated and measured cambers rise and fall at similar rates and peak at similar times. The calculated curves matched the measured ones most closely when the coefficient of thermal expansion of the concrete was taken as 5.5 × 10⁻⁶/˚F. The small discrepancies can be attributed to the following:
• the assumed value for the coefficient of thermal expansion
(8)
These equations can be combined to give Eq. (9).
(9)
If the origin is taken as the centroid of the section, the term EydA is, by definition, equal to zero and Eq. (10) and
(11) result.
(10)
(11)
where
Atr = area of the transformed section
Itr = moment of inertia of the transformed section
If different materials are involved, the centroid is that of the transformed section. The matrix equations decouple to give Eq. (12) and (13).
(12)
(13)
The integrals on the right side of Eq. (12) and (13) are most conveniently evaluated numerically because in most cases the girder width b(y) cannot be defined with a single equation.
The calculations simplify in two special cases. First, if E is the same throughout the girder cross section, Eq. (12) and (13) can be divided through by E, which then no longer influences the calculated camber. Second, if the environ-mental strain gradient is linear, the right side of Eq. (13) simplifies to -EItrα∆T/h, where α is the coefficient of ther-mal expansion and ∆T is the temperature difference over the height of the girder. Then Eq. (13) reduces to Eq. (14).

55PCI Journal | September–October 2015
For the effective strain profile shown in Fig. 7, the corre-sponding thermal curvature is Eq. (16).
(16)
where
ϕ(t) = curvature as a function of time
εTH,eff(t) = effective free thermal strain α∆Teff at time t
∆Teff = effective temperature difference between top and bottom of girder
The corresponding camber at midspan for a simply sup-ported girder can be computed using Eq. (15).
To calculate the camber at a particular time during the day, ∆Teff (t) is needed. In the temperature history camber
• measurement errors
• variations in E over the cross section
• error introduced by an insufficiently fine mesh of mea-sured temperature data (particularly in the top flange)
Figure 6 shows that thermal cambers can be computed based on measured internal temperatures. In practice, such internal temperature data are rarely available. There-fore, two practical methods were developed to predict the thermal camber histories that require knowledge of the air temperature alone. In the following two sections, these two methods are referred to as the temperature history camber model and the peak temperature camber model.
Temperature history camber model
The temperature history camber model is based on the as-sumption that the temperature difference between the top and bottom of the girders can be related to variations in the ambient temperature. Site-specific data should be used when available. In their absence, the ambient temperature histories from a nearby meteorological station should be used.
Although the measured temperature data showed that the temperature profiles in the girders were highly nonlinear, the nonlinear temperature profiles nonetheless resulted in a linear total strain profile, in accordance with the Ber-noulli hypothesis that plane sections remain plane. In the temperature history camber model, the total strain profile is assumed to be linear and is represented by an effective thermal strain gradient that varies linearly from zero at the bottom of the girder to an effective free thermal strain of εTH,eff at the top (Fig. 7). For simplicity, the thermal differ-ence that leads to εTH,eff is taken to be proportional to the daily variation in ambient temperature. The constant of proportionality between εTH,eff and the ambient temperature is then obtained by calibration against measured camber data.
Figure 6. Comparison between calculated and measured thermal cambers. Note: α = coefficient of thermal expansion. 1 in. = 25.4 mm.
Girder H8A Girder H6B
Figure 7. Effective thermal strain in girders. Note: h = depth of the girder; εTH,eff (t) = effective thermal strain at time t; ϕ = curvature.
h
εTH,eff

September–October 2015 | PCI Journal56
Eq. (19). The root mean square camber error over time was defined using Eq. (20).
(20)
The parameter A0 in Eq. (19) was optimized to minimize the root mean square error assuming a coefficient of thermal expansion α equal to 5.5 × 10⁻⁶/˚F (9.9 × 10⁻⁶/˚C). Figure 8 shows the value of A0 optimized for each girder individually. A value of A0 of 1.31 gave the optimum fit for the girder population, resulting in root mean square camber error over all girders of 0.11 in. (2.8 mm).
Figure 9 compares the measured thermal camber histories with those predicted by the temperature history camber model (A0 equal to 1.31) for the seven Washington girders. The calculated and measured values are represented, respec-tively, by continuous and dashed lines. The occurrence of several dashed lines in a single plot indicates that the cam-bers of several nominally identical girders were measured on the same day, so the calculated cambers are the same.
The temperature history camber model reproduced the camber histories well for girders 1A, 1C, 2A, 2B, 2C. The discrepancy between the peak calculated and measured cambers was never more than about 0.15 in. (3.8 mm). The peak discrepancies were greater for girder H6B (0.30 in. [7.6 mm]). One possible explanation for the larger dis-crepancy for girder H6B is that one side of this girder was exposed to sunlight. Therefore, the girder was heated over its whole height, whereas the other girders were subjected to solar radiation primarily on the top flange. The more uniform temperature gradient of girder H6B should lead to a smaller camber. Another contributing factor is that the Washington girders were wide-flange (WF100G) sections, whereas the five girders from Barr had standard flanges (W74G sections).6 The WF series have larger top flanges that will tend to heat up more slowly in the same ambient temperature change than a girder with a thinner flange.
Figure 10 compares the measured and calculated thermal cambers using the temperature history camber model (A0 equal to 1.31) for the Minnesota and Georgia girders. The cambers predicted by the temperature history camber model were close to the measured values for all of the Minnesota girders. However, the errors were larger for the Georgia girders, for which the environmental conditions (for ex-ample, temperature, humidity, and length of day) may have differed from those in Washington and Minnesota.
Peak temperature camber model
A second, simpler model, called the peak temperature camber model, was developed. This method does not
model, the effective girder temperature difference is ap-proximated (Eq. [17]).
(17)
where
Tamb(t) = ambient temperature at time t
Tmin = minimum ambient temperature for that day
The calibration factor A0 accounts for the differences between the ambient and girder temperatures, the actual concrete temperature profile and the effective linear one, and the actual and assumed values of α.
∆Teff, the effective difference in top and bottom concrete temperatures, is not equal to the difference in air tempera-ture at the two locations because of the girder’s thermal mass. To reflect this effect, Tamb(t) in Eq. (17) was taken as the average of the air temperature at time t and those dur-ing the two preceding hours to give Eq. (18).
(18)
Substituting Eq. (16) and (17) into Eq. (15), leads to a simple equation for estimating the thermal camber change for a simply supported prismatic girder.
(19)
where
Tamb,eff (t) = effective ambient temperature at time t
A0 = calibration factor
The value of A0 was determined by calibrating Eq. (19) to best reproduce 164 observations of 24 girders (on 7 different days) located in three states. They included data from the 2 girders from this study, 5 girders from Barr,6 14 from French and O’Neill,9 and 3 from Hinkle.8 All of those girders had I-shaped cross sections, but they had a variety of depths, lengths, times of casting and times of measurement. Table 2 summarizes their key properties. Table 3 summarizes the thermal camber data and the related meteorological information on the measurement dates.
The measured camber values Mi were compared with the calculated camber values Ci that were obtained using

57PCI Journal | September–October 2015
(21)
where
t0 = reference time for counting the thermal camber during that day
Tmax = maximum air temperature during the 24-hour period
Tmin = minimum air temperature during the 24-hour period
require a detailed daily temperature history. It is based on the assumption that the effective temperature difference between the girder top and bottom girder ∆Teff is related to the daytime high temperature and the nighttime low tem-perature for that 24-hour period.
Proposed model
To estimate the camber at any time during the day, an instantaneous value of ∆Teff(t) is needed (Eq. [14]). In the peak temperature camber model described here, that ef-fective temperature is approximated from the maximum and minimum air temperatures of that day using a cosine interpolation function that is a function of time (Eq. [21]):
Table 2. Girder properties
Girder Girder mark Girder type Location Depth, in. Length, ft Length/depth
1 1A W74MG Washington 74 80 13.0
2 1C W74MG Washington 74 80 13.0
3 2A W74MG Washington 74 137 22.2
4 2B W74MG Washington 74 137 22.2
5 2C W74MG Washington 74 137 22.2
6 H6B WF100G Washington 100 173 20.7
7 H8A WF100G Washington 100 164 19.7
8 MN54, beam 1 MN54 Minnesota 54 122 27.1
9 MN54, beam 2 MN54 Minnesota 54 122 27.1
10 MN54, beam 3 MN54 Minnesota 54 122 27.1
11 MN54, beam 4 MN54 Minnesota 54 122 27.1
12 MN63, beam 1 MN63 Minnesota 63 132 25.1
13 MN63, beam 2 MN63 Minnesota 63 132 25.1
14 MN63, beam 3 MN63 Minnesota 63 132 25.1
15 MN63, beam 4 MN63 Minnesota 63 132 25.1
16 MN45, beam 1 MN45 Minnesota 45 119 31.7
17 MN45, beam 2 MN45 Minnesota 45 119 31.7
18 MN45, beam 3 MN45 Minnesota 45 119 31.7
19 MN45, beam 1* MN45 Minnesota 45 119 31.7
20 MN45, beam 2* MN45 Minnesota 45 119 31.7
21 MN45, beam 3* MN45 Minnesota 45 119 31.7
22 W45, 6 W45 Georgia 79 129 19.6
23 W45, 7 W45 Georgia 79 128 19.5
24 W45, 8 W45 Georgia 79 127 19.3
Note: 1 in. = 25.4 mm; 1 ft = 0.305 m. * MN45 beams 1, 2, and 3 were monitored two days (May 17, 2011, and June 30, 2011).

September–October 2015 | PCI Journal58
The time offset t0 reflects several influences, including the time at which the ambient temperature is at a minimum and the lag between the concrete and air temperatures. Then ∆Teff has the value of zero when t equals t0 (or t0 + 24 hours) and reaches its maximum of A1(Tmax – Tmin) at t equal t0 + 12 hours, where A1 is a calibration factor.
The effective thermal strain is calculated using Eq. (22).
(22)
Table 3. Summary of measured data
Girder Measurement date Meteorological station Tmin, ˚F Tmax, ˚FNumber
of observationsMaximum measured thermal camber, in.
1 June 5, 1997 Covington, Wash. 48 65 7 0.10
2 June 5, 1997 Covington, Wash. 48 65 7 0.14
3 June 5, 1997 Covington, Wash. 48 65 7 0.38
4 June 5, 1997 Covington, Wash. 48 65 7 0.37
5 June 5, 1997 Covington, Wash. 48 65 7 0.42
6 July 26, 2012 Tacoma, Wash. 55 76 18 0.51
7 July 25, 2012 Tacoma, Wash. 54 76 18 0.61
8 September 28, 2010 Elk River, Minn. 50 62 7 0.34
9 September 28, 2010 Elk River, Minn. 50 62 7 0.32
10 September 28, 2010 Elk River, Minn. 50 62 7 0.30
11 September 28, 2010 Elk River, Minn. 50 62 7 0.30
12 May 17, 2011 Elk River, Minn. 44 67 5 0.73
13 May 17, 2011 Elk River, Minn. 44 67 5 0.64
14 May 17, 2011 Elk River, Minn. 44 67 5 0.77
15 May 17, 2011 Elk River, Minn. 44 67 5 0.59
16 May 17, 2011 Elk River, Minn. 44 67 5 1.06
17 May 17, 2011 Elk River, Minn. 44 67 5 0.95
18 May 17, 2011 Elk River, Minn. 44 67 5 0.83
19 June 30, 2011 Elk River, Minn. 73 92 7 1.02
20 June 30, 2011 Elk River, Minn. 73 92 7 0.83
21 June 30, 2011 Elk River, Minn. 73 92 7 0.71
22 August 25, 2003 Savannah Airport, Ga. 74 90 3 0.50
23 August 25, 2003 Savannah Airport, Ga. 74 90 3 0.32
24 August 25, 2003 Savannah Airport, Ga. 74 90 3 0.46
Note: Tmax = maximum temperature during a day; Tmin = minimum temperature during a day. 1 in. = 25.4 mm; ˚C = (˚F – 32)/1.8.
Figure 8. Optimized values of calibration factor A0 of all girders.

59PCI Journal | September–October 2015
Figure 9. Temperature history camber model: comparison of measured and calculated thermal camber changes in Washington State girders. Note: 1 in. = 25.4 mm.
Girder H8A
Girders 1A and 1C
Girder H6B
Girders 2A, 2B, and 2C
Figure 10. Temperature history camber model: comparison of measured and calculated thermal camber changes for Minnesota and Georgia State girders. Note: 1 in. = 25.4 mm.
MN45 girders (measured on May 17, 2011)
MN54 girders
W45 girders, Georgia
MN63 girders
September–October 2015 | PCI Journal60
• Both the temperature history camber model and the peak temperature camber model had root mean square average camber errors over time of about 0.1 in. (2.5 mm) when applied to a range of girders, all with I-shaped cross sections. Such small errors would not significantly affect the installation of girders onsite. Since the peak temperature camber model is simpler than the temperature history camber model (and for these data, slightly more accurate), the peak tempera-ture camber model is recommended for practice for use with I-shaped girders on simple spans. It has not
Combining Eq. (15) and (22) results in Eq. [23], which gives the thermal camber at midspan for a simply sup-ported girder.
(23)
Calibration of peak temperature camber model
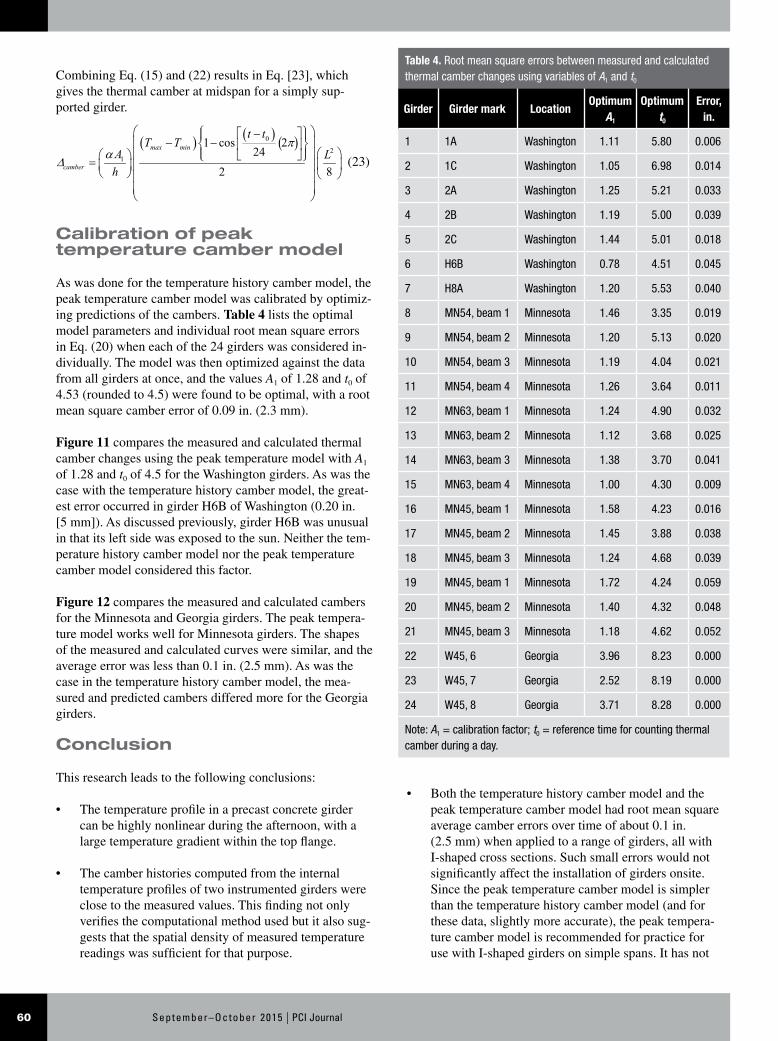
As was done for the temperature history camber model, the peak temperature camber model was calibrated by optimiz-ing predictions of the cambers. Table 4 lists the optimal model parameters and individual root mean square errors in Eq. (20) when each of the 24 girders was considered in-dividually. The model was then optimized against the data from all girders at once, and the values A1 of 1.28 and t0 of 4.53 (rounded to 4.5) were found to be optimal, with a root mean square camber error of 0.09 in. (2.3 mm).
Figure 11 compares the measured and calculated thermal camber changes using the peak temperature model with A1 of 1.28 and t0 of 4.5 for the Washington girders. As was the case with the temperature history camber model, the great-est error occurred in girder H6B of Washington (0.20 in. [5 mm]). As discussed previously, girder H6B was unusual in that its left side was exposed to the sun. Neither the tem-perature history camber model nor the peak temperature camber model considered this factor.
Figure 12 compares the measured and calculated cambers for the Minnesota and Georgia girders. The peak tempera-ture model works well for Minnesota girders. The shapes of the measured and calculated curves were similar, and the average error was less than 0.1 in. (2.5 mm). As was the case in the temperature history camber model, the mea-sured and predicted cambers differed more for the Georgia girders.
Conclusion
This research leads to the following conclusions:
• The temperature profile in a precast concrete girder can be highly nonlinear during the afternoon, with a large temperature gradient within the top flange.
• The camber histories computed from the internal temperature profiles of two instrumented girders were close to the measured values. This finding not only verifies the computational method used but it also sug-gests that the spatial density of measured temperature readings was sufficient for that purpose.
Table 4. Root mean square errors between measured and calculated thermal camber changes using variables of A1 and t0
Girder Girder mark LocationOptimum
A1
Optimum t0
Error, in.
1 1A Washington 1.11 5.80 0.006
2 1C Washington 1.05 6.98 0.014
3 2A Washington 1.25 5.21 0.033
4 2B Washington 1.19 5.00 0.039
5 2C Washington 1.44 5.01 0.018
6 H6B Washington 0.78 4.51 0.045
7 H8A Washington 1.20 5.53 0.040
8 MN54, beam 1 Minnesota 1.46 3.35 0.019
9 MN54, beam 2 Minnesota 1.20 5.13 0.020
10 MN54, beam 3 Minnesota 1.19 4.04 0.021
11 MN54, beam 4 Minnesota 1.26 3.64 0.011
12 MN63, beam 1 Minnesota 1.24 4.90 0.032
13 MN63, beam 2 Minnesota 1.12 3.68 0.025
14 MN63, beam 3 Minnesota 1.38 3.70 0.041
15 MN63, beam 4 Minnesota 1.00 4.30 0.009
16 MN45, beam 1 Minnesota 1.58 4.23 0.016
17 MN45, beam 2 Minnesota 1.45 3.88 0.038
18 MN45, beam 3 Minnesota 1.24 4.68 0.039
19 MN45, beam 1 Minnesota 1.72 4.24 0.059
20 MN45, beam 2 Minnesota 1.40 4.32 0.048
21 MN45, beam 3 Minnesota 1.18 4.62 0.052
22 W45, 6 Georgia 3.96 8.23 0.000
23 W45, 7 Georgia 2.52 8.19 0.000
24 W45, 8 Georgia 3.71 8.28 0.000
Note: A1 = calibration factor; t0 = reference time for counting thermal camber during a day.

61PCI Journal | September–October 2015
Figure 11. Peak temperature camber model: comparison of measured and calculated thermal camber changes for Washington State girders. Note: 1 in. = 25.4 mm.
Girder H8A
Girders 1A and 1C
Girder H6B
Girders 2A, 2B, and 2C
Figure 12. Peak temperature camber model: comparison of measured and calculated thermal camber changes for Minnesota and Georgia State girders. Note: 1 in. = 25.4 mm.
MN45 girders (measured on May 17, 2011)
MN54 girders
W45 girders, Georgia
MN63 girders

September–October 2015 | PCI Journal62
been calibrated with other cross-sectional shapes or other boundary conditions.
• The accuracy of the camber prediction depended on the details of the girder’s exposure to the sun. For example, the methods worked less well for Washing-ton girder H6B, which had one side, as well as its top flange, exposed to sunlight. The models also worked better for the Washington and Minnesota girders than for the girders located in Georgia. It is possible that the differences in accuracy arise from differences in temperature, humidity, or solar radiation conditions. It is also possible that the discrepancies are attributable to the paucity of camber observations for the Georgia girders.
References
1. Tadros, M. K., F. Fawzy, and K. Hanna. 2011. “Pre-cast, Prestressed Girder Camber Variability.” PCI Journal 56 (1): 135–154.
2. Storm, T. K., Rizkalla, S. H. and Zia, P. Z. 2013. “Effects of Production Practices on Camber of Pre-stressed Concrete Bridge Girders.” PCI Journal 58 (1): 96–111.
3. AASHTO (American Association of State Highway and Transportation Officials). 2012. AASHTO LRFD Bridge Design Specifications. 6th ed. Washington, DC: AASHTO.
4. Priestley, M. J. N. 1978. “Design of Concrete Bridge for Temperature Gradients.” ACI Journal 75 (5): 209–217.
5. Shushkewich, K. W. 1998. “Design of Segmental Bridge for Thermal Gradient.” PCI Journal 43 (4): 120–137.
6. Barr, P. J. 2000. “Consistent Crudeness in Prestressed Concrete Girder Design.” PhD diss., University of Washington, Seattle, WA.
7. AASHTO. 1994. AASHTO LRFD Bridge Design Specifications. 1st ed. Washington, DC: AASHTO.
8. Hinkle, S. D. 2006. “Investigation of Time-Dependent Deflection in Long Span, High Strength, Prestressed Concrete Bridge Beams” MSCE thesis, Virginia Poly-technic Institute and State University, Blacksburg, VA.
9. French, C. E., and C. R. O’Neill. 2012. “Validation of Prestressed Concrete I-Beam Deflection and Camber Estimates.” MnDOT (Minnesota Department of Trans-portation) final report 2012-16, MnDOT Research Service, St. Paul, MN.
10. Nguyen, H. 2014. “Improving Predictions for Cam-ber in Precast, Prestressed Concrete Bridge Girders.” MSCE thesis. University of Washington, Seattle, WA.
11. Washington State Department of Transportation. 2015. Bridge Design Manual (LRFD). http://www.wsdot .wa.gov/Publications/Manuals/M23-50.htm.
12. Federal Highway Administration. 2011. “Portland Ce-ment Concrete Pavements Research.” http://www .fhwa.dot.gov/publications/research/infrastructure /pavements/pccp/thermal.cfm.
13. Wight, J. K., and J. G. MacGregor, 2012. “Reinforced Concrete Mechanics and Design.” 6th ed. Upper Saddle River, NJ: Pearson Education Inc.
14. Barr, P. J., Stanton, J. F., and M. O. Eberhard. 2005. “Effects of Temperature Variations on Precast, Pre-stressed Concrete Bridge Girders.” ASCE Journal of Bridge Engineering 10 (2): 186–194.
Notation
A0 = calibration factor
A1 = calibration factor
Atr = area of the transformed section
b(y) = girder width
Ci = computed camber values
E = Young’s modulus
Errorrms = root mean square camber error over time of a girder
fc' = compressive strength of concrete
h = depth of the girder
ha = asphalt thickness
Itr = moment of inertia of the transformed section
L = length of the girder
Mi = measured camber values
t = time
t0 = reference time for counting thermal camber during a day
t(Y) = change in temperature at height Y

63PCI Journal | September–October 2015
T = temperature at top surface of deck
Tamb(t) = ambient temperature at time t
Tamb,eff (t) = effective ambient temperature at time t
Tmax = maximum temperature during a day
Tmin = minimum temperature during a day
y = vertical coordinate, measured positive down-wards from origin
Y = vertical coordinate, measured upwards from a point located Y0 below the concrete deck surface
Y0 = distance from top surface at which temperature change is zero
α = coefficient of thermal expansion
∆camber = camber of girder
∆T = temperature difference over the height of the girder
∆T1 = temperature change at top surface of girder in AASHTO LRFD specifications profile
∆T2 = temperature change 4 in. (100 mm) below top surface of girder in AASHTO LRFD specifications profile
∆T3 = temperature change at bottom of girder in AASHTO LRFD specifications profile
∆Teff = effective temperature difference between top and bottom of girder
∆Teff(t) = instantaneous effective temperature difference between top and bottom of girder
ε0 = total strain at origin
εe = free environmental strain
εm = mechanical strain
εtot = total strain
εTH,eff = effective thermal strain
εTH,eff (t) = effective thermal strain at time t
σ = stress
ϕ = curvature
ϕ(t) = curvature as a function of time

September–October 2015 | PCI Journal64
About the authors
Hang Nguyet Nguyen is a research associate at Nanyang Technological Institute in Singa-pore, where she is enrolled in the PhD program. She received her MSCE from the University of Washington in Seattle, Wash.,
where she conducted research on camber in prestressed concrete girders.
David D. Chapman, PE, is chief engineer for Concrete Technology Corp. in Tacoma, Wash. He is a member of the PCI Committee on Bridges and has more than 14 years of experience in the design and manufacture of prestressed
concrete members.
Marc O. Eberhard, PhD, is a professor at the University of Washington. He received his BSCE degree from the University of California, Berkeley, in 1984, and he received his MSCE and PhD degrees from the University
of Illinois at Urbana-Champaign in 1987 and 1989. Along with his colleagues, he received the PCI Charles Z. Zollman Award in 2013.
John Stanton, PhD, PE, is a professor of civil engineering at the University of Washington. He holds degrees from the University of Cambridge in the United Kingdom, Cornell University in Ithaca, N.Y., and University of
California, Berkeley, and has worked in practice in
England, France, and Canada. His research interests lie in prestressed and precast concrete, and he has concen-trated recently on accelerated bridge construction.
Abstract
It is important to estimate girder camber accurately because differences between expected and actual camber can lead to construction challenges or girder rejection. Field measurements of daily variations in temperature profile and camber for two precast, prestressed concrete girders provided data with which to calibrate models of the effect of temperature variations on camber. Using measured temperature profiles over the height of the girder, the associated camber history was accurately computed, assuming a coefficient of thermal expansion of 5.5 × 10⁻⁶/˚F (9.9 × 10⁻⁶/C). Two practical methods were also developed using 164 observations from 24 girders. To implement the simpler method (peak tempera-ture camber method), the designer needs only to know the girder’s length and depth and to estimate the maxi-mum change in air temperature during the day, which is available from meteorological stations. The errors in the resulting models had root mean square average camber over time of about 0.1 in. (2.5 mm).
Keywords
Bridge, camber, girder, temperature.
Review policy
This paper was reviewed in accordance with the Precast/Prestressed Concrete Institute’s peer-review process.
Reader comments
Please address reader comments to [email protected] or Precast/Prestressed Concrete Institute, c/o PCI Journal, 200 W. Adams St., Suite 2100, Chicago, IL 60606. J