The Effect of Structural Characteristics on Family ...jfstewar/home/West Africa FP.pdf ·...
37
* Corresponding Author The Effect of Structural Characteristics on Family Planning Program Performance in Côte d’Ivoire and Nigeria Dominic J. Mancini * FDA/Center for Food Safety and Applied Nutrition HFS-726, 2D-035 5100 Paint Branch Parkway College Park, MD 20740 (301) 436-1764 (301) 436-2626 fax [email protected] Guy Stecklov Department of Population Studies and Department of Sociology and Anthropology Hebrew University of Jerusalem Mount Scopus Jerusalem, 91905 ISRAEL John F. Stewart Department of Economics, UNC-Chapel Hill CB# 3305, 202 Gardner Hall Chapel Hill, NC 27599-3305
Transcript of The Effect of Structural Characteristics on Family ...jfstewar/home/West Africa FP.pdf ·...

*Corresponding Author
The Effect of Structural Characteristics on Family Planning Program Performance in Côte d’Ivoire and Nigeria
Dominic J. Mancini*
FDA/Center for Food Safety and Applied NutritionHFS-726, 2D-0355100 Paint Branch ParkwayCollege Park, MD 20740(301) 436-1764 (301) 436-2626 [email protected]
Guy StecklovDepartment of Population Studies and Department of Sociology and AnthropologyHebrew University of JerusalemMount ScopusJerusalem, 91905 ISRAEL
John F. StewartDepartment of Economics, UNC-Chapel HillCB# 3305, 202 Gardner Hall Chapel Hill, NC 27599-3305

2
Abstract
This paper uses Côte d’Ivoire and Nigeria survey data on both supply and demand
characteristics to examine how structural and demographic factors influence family planning
provision and cost. The model, which takes into account the endogenous influence of service
provision on average cost, explains provision well but poorly explains what influences service
cost. We show that both size and specialization matter. In both countries, vertical (exclusive
family planning) facilities provide significantly more contraception than integrated medical
establishments. In the Nigeria sample, larger facilities also offer services at lower average cost.
Since vertical facilities tend to be large, they at most incur no higher unit costs than integrated
facilities. These results are consistent across most model specifications, and are robust to
corrections for endogenous facility placement in Nigeria. Model results and cost recovery
information point to the relative efficiency of the International Planned Parenthood Federation,
which operates large, mostly vertically organized facilities.
Keywords
Family Planning, Africa, Program Placement, Cost

3
The 1994 International Conference on Population and Development (ICPD) calls for
dramatic increases in the contraceptive prevalence rates (CPR) in developing countries. In order
to meet this challenge, the ICPD specifies the enormous resource investments this requires and
describes how the financial burden should be shared between developing countries, developed
countries, and international donor organizations. However, the ICPD does not describe the exact
mechanisms through which to improve and expand reproductive health service delivery
programs. In reality, this is because researchers and policy makers have learned relatively few
concrete lessons about how the structural characteristics of family planning facilities affect their
performance, particularly in those regions where fertility remains high.
We define “structure” in this paper to mean the role of characteristics at least partly under
facility or operating authority control. Structure includes whether facilities are in the public or
private sector, and whether they are “vertically” designed – and only provide a single service
such as family planning - or are “integrated” and provide multiple services. Structural
characteristics also include prices, provider training, and other quality-related measures.
Our interest comes as developing country health care services are being overhauled.
These restructuring efforts include the devolution of services from central administrative control,
which often involves the redesign of management and logistics systems. In addition, the ICPD
calls for creating and strengthening linkages between services to increase service utilization. In
fact, integration is itself an important policy target for many reproductive health programs.
Yet the debate continues over the most appropriate form of service provision and the
division between public and private sector authority. Furthermore, programs are also being
pushed to recover costs and become more sustainable. In this paper, Côte d’Ivoire and Nigeria
multi-level survey data are used to examine how structural factors influence output and what

4
factors allow demand to be satisfied at low cost. While many of our results agree with the
collective wisdom in family planning (FP); others, including our finding that vertical facilities
are more efficient than their integrated counterparts despite the potential resource and patient
spillovers in integrated facilities, are both new and surprising.
Previous Literature. Many structural decisions may be historically determined; others
may be affected by market competition and demand. Although relatively little research exists in
this field, several important studies have helped to shed light on the general outlines of the
relationship.
Jensen’s research (1996; 1997) explores the interactions between service quality and
client fertility. Linking individual level and facility level data from Indonesia allows him to
show that women supplied by public clinics are more successful contraceptors and that their
success is due to differences among service providers rather than the clients (Jensen 1996). In
the Philippines, Jensen (1997) also finds important quality differences in services offered across
various supply channels. Mensch et al. (1996) use Peru situation analysis data similar to that
reported in this paper and find a small, significant affect of quality --defined by facility and
provider characteristics-- on contraceptive prevalence. Mroz et al. (1999) use Tanzanian data to
show that subjective quality perceptions affect contraceptive use more than objective measures
of quality or accessibility, such as time and distance to clinics. In a related study, Speizer and
Bollen (2000) link subjective perceptions to objective facility aspects and find that perceived
quality is difficult to measure and not highly correlated with objective facility characteristics.
Examining the link between structural practice and use, a Nigeria study by Feyisetan and
Ainsworth (1996) studies the relationship between contraceptive use and FP services. Several
structural factors did affect contraceptive use: both longer pharmaceutical operating hours and

5
greater method choice increased usage, and provider fees did not constrain demand. Mwabu,
Ainsworth and Nyamete (1993) use Kenyan data to show that higher prices may reduce medical
service demand. Hotchkiss (1998) examines price effects in Cebu, Philippines and shows that
higher prices reduce health care use by poorer households, but otherwise have little effect.
Much of the debate over structure has focused on integrated versus vertical service
delivery (Harvey 1996; Mayhew et al 2000; Lush et al 1999). Although Harvey (1996) points
out the potential danger of integration compromising the effectiveness of FP programs, the
critical debate appears to favor integration – partly due to the potential positive spillovers
between FP and other health services. Mayhew et al (2000) evaluate programs attempting to
integrate FP and other health services in Ghana, Kenya, South Africa, and Zambia, and state that
“Efforts to achieve this integration have been targeted by international policymakers and
programmers as a cost-effective step to improving reproductive health services in many
countries.” However, Lush et al (1999) point out that there is little empirical evidence
supporting integration as an effective public health measure, and conclude from studies in
Ghana, Kenya, and Zambia that targeted, vertically managed services may be more appropriate
in some cases if offering comprehensive primary care services is not possible due to political or
economic constraints. Stewart et al. (1999) find that a single NGO, the International Planned
Parenthood Federation (IPPF), plays a central if not dominant role in FP through vertically
structured programs in the 5 West African nations included in their study. Additional bivariate
analyses offered tentative support that vertical facilities more fully utilize their available
resources and suggest the need for further research on the relative advantages of various forms of
service delivery.
The above studies are important, but in order to understand how structure affects

6
performance, more surveys linking facility and population characteristics are required. Without
information on the full market demand, it is difficult to study what kinds of service structure
matter. Our study was designed to examine structure and is based on data collected on facilities,
including costs, and DHS household data. This allows us to shed light on various dimensions of
structure and performance, including the effect of facility size, operating authority, public versus
private management, integrated versus vertical program structure, prices, and demand.
Family Planning in Côte d’Ivoire and Nigeria. Results from the 1994 Côte d’Ivoire and
1990 Nigeria demographic and health survey (DHS) indicate that only about 4% of reproductive-
aged women use modern contraception. These low levels partly reflect the governments’ attitude
towards FP. In Côte d’Ivoire, the government was unofficially pro-natalist until 1990, and
Nigeria did not adopt a population policy until 1989.
Family Planning arrived in Côte d'Ivoire in 1979 with an NGO called AIBEF
(Association Ivoirienne pour le Bien-Etre Familial, Ivorian Association for Family Well-Being),
which is affiliated with the IPPF. AIBEF became operational in 1986 with a single vertical
facility. Since then, the government of Côte d'Ivoire has been slow to change its pro-natalist
orientation, although some FP activities are offered at a small fraction of all government health
facilities. Those that do offer FP services typically do so within integrated environments and
with the assistance of AIBEF or UNFPA.
Nigerian FP is far more complex. Family planning and other health and educational
responsibilities are distributed between the three governmental levels: federal, state and local.
Within each level are both vertical and integrated facilities. Private organizations also provide
FP. In particular, the IPPF affiliate in Nigeria, PPFN, is an important FP promoter and supplier,

7
although they do not dominate supply as in Côte d’Ivoire. Few facilities in Nigeria are vertical,
but there are enough to separately estimate vertical and operating authority effects (See Table 1).
Survey Design. Both surveys followed similar sampling plans. Each country conducted
a recent DHS survey, and the DHS clusters were used as linking devices for the facility survey
design, and for all population level information included in the analysis. For selected DHS
clusters, facilities in the immediate area of that cluster were included in the sample. The original
sampling plan was to take a census the health facilities in the proximity of a random sample of
DHS clusters. Because the DHS is a population-based random sample, this procedure would
provide a country-representative random sample of "market areas" for health facilities. Logistic
and other practical concerns required some modification of this sampling methodology.
In Nigeria, five states (Anambra, Kebbi, Lagos, Osun, and Plateau) -with 18% of the
national population- were included. Four of the states were selected randomly from USAID
focus states, while the fifth was chosen from the non-focus states. Within each state, a random
DHS cluster was selected, and all facilities listed in the health facility census for the Local
Government Authority (LGA) that contained that cluster were included. Additional DHS
clusters were randomly selected until the survey reached the target number of health facilities in
each state. The “Nigerian” sample can only be considered a representative market area for the 5
states included in this survey.
In Côte d'Ivoire, FP services were only reported to exist in 4 of the 10 regions of the
country; therefore, the survey was limited to these four relatively rich regions (South, North
Central, West Central, and North). A procedure similar to the one described in Nigeria was
followed, with the sub-prefecture being the local level of government employed to define the

8
geographic region around the DHS cluster. Due to the interest in vertical clinics, the DHS
clusters closest to the 7 clinics of AIBEF were automatically selected for inclusion in the sample.
The facility surveys were conducted in Côte d'Ivoire and Nigeria in the late spring and
early summer of 1995. A total of 100 facilities were surveyed in Côte d'Ivoire and 463 in
Nigeria. Only facilities that provided FP services and complete data to construct the necessary
variables are included in our analysis. This reduces the Côte d'Ivoire sample to 31 and the
Nigerian sample to 261 facilities, but we did not find systematic differences between facilities
with complete data and facilities with missing data. See Table 1.
Principal Measures. All demographic variables for the area around each facility were
calculated from the 1994 Côte d’Ivoire and 1990 Nigeria DHS. This section explains our main
dependent variables: output and cost. In addition, we describe our operational structure and
authority variables and also how the market area for each facility is estimated from DHS data.
Also see Appendix.
Output and Cost. Output refers to the ability to convert resources into potential clients or
an underlying amount of "protection" provided by a facility over time. We specify the "output"
or service provision of a facility by Couple Years of Protection (CYP), which is the most
common approach to standardizing contraceptive choices. This method uses weights to
transform client and disbursement statistics into how many years of protection each method
provides a typical couple (Table 2). The weights adjust for duration, effectiveness, age of users,
consistency, misreporting, non-contraceptive use and overlapping coverage (Stover et al 1996).
Cost is simply the labor, contraceptive, and equipment cost per CYP provided, and is
used as a proxy for efficient resource use. The largest component is labor cost, which we
estimated using both clinical and non-clinical FP data obtained from the scenario analysis survey

9
module. We calculated contraceptive and equipment costs by assigning a price to the supply
disbursement survey totals using IPPF price lists. See Appendix for details.
Structure and Authority. At a gross level, differences in structure and authority are
embodied in the actual operating authority (e.g. public, NGO) of the provision system. We
measure these through simple dummy variables in the model. However, we can also measure
certain operational and policy decisions. Clearly, prior decisions that depend on other variables
in the model, for example deciding that all facilities of a certain type will be in urban areas, have
important implications for measuring structure. These include pricing strategies and vertical
versus integrated service provision.
In Côte d'Ivoire, FP services are provided by three distinct organizations. AIBEF
provides FP in vertical clinics, the government provides FP in a small number of integrated
facilities, and a group of government clinics participated in a UNFPA program that provides
equipment, supplies, training, technical assistance, and policy consultancy. Thus in Côte d'Ivoire
the comparison is vertical-NGO vs. integrated-public. In the statistical model, our AIBEF
variable could easily have been named VERTICAL. In Nigeria, some facilities within each
authority are integrated while others are vertical, so separate effects can be identified.
Market Area. Each facility has a catchment population of potential clients. The size and
characteristics of this population are a primary determinant of the facility's output. However,
practical restrictions require us to define the catchment for each facility according to political or
demographic boundaries. These areas proxy for an economist's version of geographic markets;
however, there is no method of determining how much our boundaries correspond to the true
market for each facility. We assume that for less specialized medical services such as FP, our
method of defining markets should be more accurate than for services such as surgery, where

10
people presumably are more willing to travel long distances. If not completely accurate, we still
believe our method captures the majority of the population actually served by each facility. In
Côte d'Ivoire, we used a sub-prefecture. In Nigeria we used a DHS cluster, or the area around a
point that DHS defined for the purposes of their data collection. The population for a
sub-prefecture in Côte d'Ivoire is much larger than the corresponding DHS cluster population in
Nigeria (Table 2), but we were able to associate facilities with a DHS cluster even if they were
not located within that cluster, so the "market" in the two countries are of comparable size. The
ability of a facility to generate CYPs from this market area depends on alternative supply
sources. There is a clear difference in the level of potential competition in Côte d'Ivoire and
Nigeria. In Côte d'Ivoire, only eight of 21 sub-prefectures contained multiple FP facilities. In
contrast, all markets in Nigeria were served by multiple facilities.
MODEL
Given our definitions of output and cost, it should be relatively straightforward to
analyze their determinants in two separately-estimated regression equations. However, the
number of CYPs provided by a facility likely influences operating costs through economies of
scale. This classic endogeneity problem means that simple regressions may produce biased
results, so we turn to a jointly-estimated two-equation system. Equation (1) relates CYP
provision to demographic and structural factors. Equation (2) relates the cost per CYP to
demographic, structural, and the endogenous provision of CYP. Even under this endogeneity
assumption, it may still be possible to simply run OLS regressions on each equation. This
decision depends on (1) whether endogeneity is valid, and (2) whether the decrease in bias from
a simultaneous system is overwhelmed by the increase in the variance of the results stemming
from the estimation method. We present test statistics for each country to address these issues.

11
(3a)
(3b)
(1) CYPij = f(Xj, Structure1ij)
--CYPij the monthly CYPs provided at clinic i in market area j
--Xj a vector of exogenous variables that affect the demand for FP in market area j
--Structure1ij a factor vector that describe the structure of clinic i.
(2) AC[CYPij]= g[CYPij, Structure2ij]
-- AC[CYPij] the average cost per CYP in clinic i.
-- Structure2ij a factor vector that describes the cost in clinic i. The two Structure
vectors will contain many of the same variables.
We assume this specific functional form for the equilibrium output equation (1):
where Pop,j is the population in market j, Pricei is the price charged for pills by facility i, and
RelPricei is the relative price of pills to IUDs at facility i. We explain the pricing variables
below. After taking logs on both sides, the equation becomes
This is a reduced form production function, with prices and external determinants of
demand and technology. Though the data are not sufficiently detailed to estimate a standard
production function, there are theoretical advantages to this specification. A fundamental
assumption underlying standard production functions is that facilities maximize revenue or profit
-- an untenable assumption in this context. In addition, input markets are far from perfectly
efficient: input prices are either fixed (labor), or free (contraceptive supplies and equipment.)

12
(4)
However, we do have good measures of the underlying determinants of service use and a
summary of how the facility is run, both of which affect output in a reduced form setting.
Our logged-interacted form, which is similar to a Cobb-Douglas or Trans-Log functional
form if the log of population is considered a normal input variable, has two advantages. First,
the main output determinants of a non-profit maximizing facility are the characteristics of the
population being served and the supply environment. We assume most effects depend on the
size of the market itself. A relatively more efficient provision strategy or a higher proportion of
educated women should allow for more output, all other things equal, in a larger market. For the
facility authority variables in particular, this interpretation seems to fit the data well.
The second is an elasticity interpretation to the coefficients. Since structural and
demographic variables enter the estimation equation as an interaction with logged market
population, they are interpreted as increments to the population elasticity coefficient $0. This is
actually a less restrictive assumption than imposing a linear relationship. Elasticity is the change
in one variable given an arbitrarily small (usually stated as 1%) change in another variable. The
assumption is that the relationship is linear in a small neighborhood around the actual values of
the dependent variable, not linear along any arbitrary value of the dependent variable, as in a
linear reduced form. The total elasticity of market population on equilibrium CYP output is:
given the values of the demographic and structural variables of each facility.
The structure of the cost function is simple, since we assume that the market area in
which the facility operates only affects cost through the level of CYP provided at the facility.
13
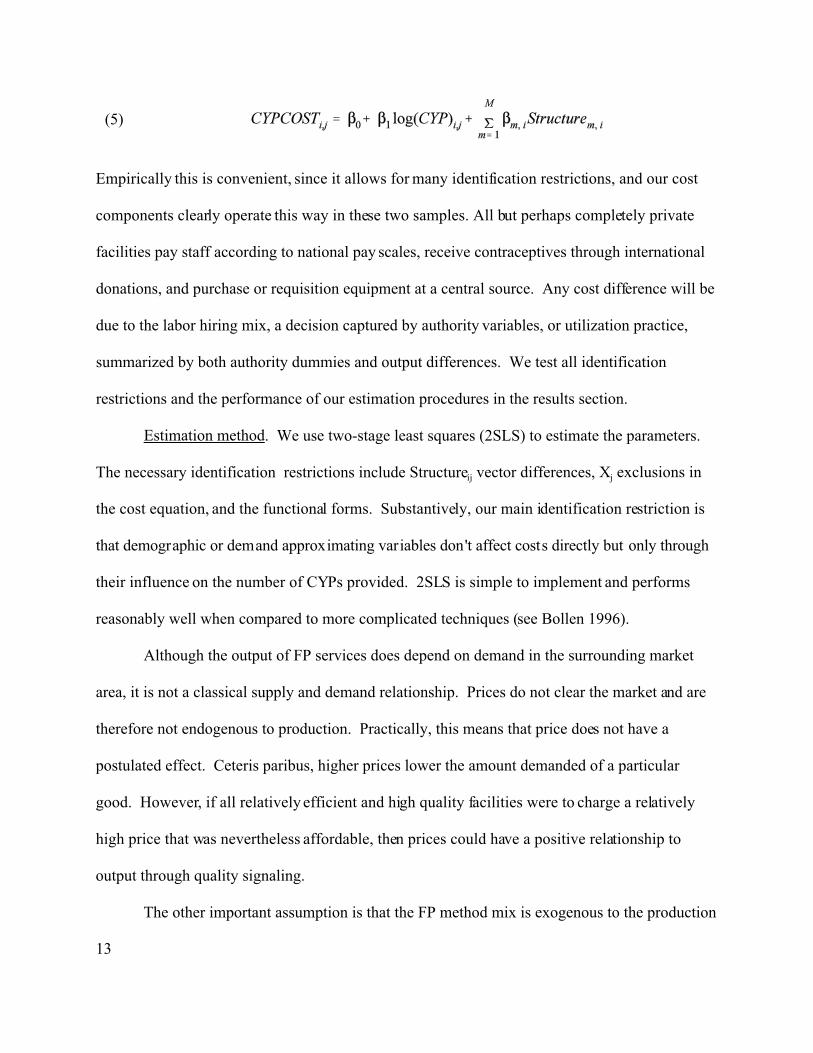
(5)
Empirically this is convenient, since it allows for many identification restrictions, and our cost
components clearly operate this way in these two samples. All but perhaps completely private
facilities pay staff according to national pay scales, receive contraceptives through international
donations, and purchase or requisition equipment at a central source. Any cost difference will be
due to the labor hiring mix, a decision captured by authority variables, or utilization practice,
summarized by both authority dummies and output differences. We test all identification
restrictions and the performance of our estimation procedures in the results section.
Estimation method. We use two-stage least squares (2SLS) to estimate the parameters.
The necessary identification restrictions include Structureij vector differences, Xj exclusions in
the cost equation, and the functional forms. Substantively, our main identification restriction is
that demographic or demand approximating variables don't affect costs directly but only through
their influence on the number of CYPs provided. 2SLS is simple to implement and performs
reasonably well when compared to more complicated techniques (see Bollen 1996).
Although the output of FP services does depend on demand in the surrounding market
area, it is not a classical supply and demand relationship. Prices do not clear the market and are
therefore not endogenous to production. Practically, this means that price does not have a
postulated effect. Ceteris paribus, higher prices lower the amount demanded of a particular
good. However, if all relatively efficient and high quality facilities were to charge a relatively
high price that was nevertheless affordable, then prices could have a positive relationship to
output through quality signaling.
The other important assumption is that the FP method mix is exogenous to the production

14
strategy. We measure the latent protection provided by each method, not the amount of any
particular type of contraception. A decision to promote any particular contraceptive method
should not introduce bias if that strategy is consistent within a facility type, but it will add noise
to the relationship. For example, if all LGA facilities in Nigeria promote high CYP-generating
IUD’s, the efficiency gains would be indistinguishable from the general LGA effect. While IUD
promotion is a definite characteristic of the LGA regime, it will not be reflected in the LGA
dummy variable when we measure IUD promotion directly. In Nigeria, IUD is widely promoted
and we do attempt to measure this promotion through differential price effects. However, if
certain single facilities promote any one contraceptive type and this explains their high CYP
output, this is a classic omitted variable problem and could produce bias. We found no evidence
of this type of method promotion.
Program Placement. The likely most serious problem in our method, as in many program
studies, is that services are not offered at random (see Angeles et al. 1998). Any targeting could
easily bias results (Gertler and Molyneaux 1994; Montgomery and Casterline 1993).
In Côte d'Ivoire, FP service placement seems driven by operating authority.
Non-UNFPA government facilities appear to offer FP with little or no area preference, within the
regions where FP is offered at all. UNFPA facilities decided to sponsor sub-prefectures served
by multiple facilities, and AIBEF appears to place facilities in urban areas with high demand.
No statistical assumptions are violated if urban and multiple-facility indicators are included in
the regressions, but the separate effects of each factor become difficult to distinguish. In
practice, this will cause the pure structural dummy to understate the AIBEF and UNFPA effects.
Unfortunately, there are too few observations to test this parametrically in Côte d'Ivoire, but the
Nigerian data allow us to formulate a test of whether any of the demographic variables are used

15
to place facilities or programs. Alternatively, if operating authorities use unknown criteria to
place FP, such as overt political factors that are not captured in the demographic indicators, the
problem becomes one of classic endogeneity and the results would be biased and inconsistent.
The Nigeria section presents methods to test for this possibility.
Results
We present the complete results for each country separately. The "structure" factors are
included in the analysis in two ways. First, we measure the clinic's ability to attract clients using
only the operating authority dummies. The government or a specific NGO will make decisions
that affect the resources available to the clinic, will set policies and supervision procedures that
affect quality, and will decide whether and what fees to charge. These factors are also examined
individually. We estimate output in three specifications to explore these alternatives, while we
estimate the cost equation with single specification. The results both within and between
specifications are useful in uncovering the true effects of structure and practice.
Côte d'Ivoire -Table 3 Model 1. Only operating authority structure dummies are
included. The facility is given credit for being in a naturally high or low propensity FP area, a
reasonable assumption if facilities could choose their locations. In Table 3, Column 1, AIBEF
facilities provide significantly more CYPs. The UNFPA effect is insignificant, but of the eight
areas served by multiple facilities, four have multiple UNFPA clinics. All else equal, CYP
production at a clinic is smaller if an area is served by multiple clinics, so a variable measuring
clinic competition (1/number of clinics in the sub-prefecture) is included. It is both a
"structural" variable, since the UNFPA organizational decision is a structural one, and a
"market" variable that describes the competitive environment.
The competition variable coefficient is large, has the expected sign (positive) and is

16
statistically significant. Here we illustrate the incremental elasticity effect for one variable, and
for subsequent results we give the relative effect on provision implied by the coefficients. The
pure population contribution to elasticity is 1.2: a 1% increase in market population would lead
to a 1.2% increase in CYP provision. The incremental effect of an extra .2 from the competition
variable increases elasticity to 1.4. At the average facility provision levels of 159 CYPs per
month in Côte d' Ivoire, this implies 3.2 additional CYPs/month -- a substantial effect.
Excluding the competition variable makes the UNFPA coefficient sign change to
negative and significant, so per clinic output is small probably because UNFPA clinics serve a
given area with multiple small facilities. If the regressions are on markets rather than facilities,
markets served by AIBEF and those served by UNFPA have higher CYP provision than markets
served by government facilities not associated with UNFPA.
Model 2. When we include only demographic and economic variables, Côte d'Ivoire data
show a strong positive relationship between sub-prefecture population and provision. Clinic
output is significantly higher if it serves an urban locale. Note also the 45% decrease in pure
population elasticity, which is expected since population in model 1 probably captures other
demographics now included directly. Increasing the number of clinics in the sub-prefecture
significantly reduces the CYP output per clinic. The average price of FP (proxied by the price of
a CYP of pills) has a negative but insignificant effect on CYP output, as does the price of IUD
relative to pills. The coefficient on the price of IUD relative to pills is large (negative price
elasticity at 35% of pure population elasticity) and close to significant. If the analysis is done on
the sub-prefecture rather than facility level, the relative price of IUD becomes significant and is
of similar magnitude.
Model 3. The stability of our results as the remaining variables are introduced indicates
17
that these separate effects are fairly strong and that pure structure is not being subsumed into
demographic effects through an unknown placement strategy. Sub-prefecture population
remains a significant determinant of clinic level CYP provision, and is slightly smaller than the
other two models as expected. Given population and its characteristics, AIBEF clinics generate
significantly higher CYPs through what we consider a pure management effect. The effect is
relatively small, though it still increases population elasticity by about 10% and therefore could
have a large cumulative effect over time.
The three estimations tell a fairly consistent story. At the very grossest level of analysis
(Model 1), increasing the population of the prefecture by one percent should increase output by
1.34% at general government facility, by 1.44% at an AIBEF facility, and by 1.26% at a UNFPA
sponsored facility. Adding demographic controls reduces the incremental elasticity of AIBEF
from 0.21 to 0.15. Since 75% of the AIBEF effect remains in the full model, most of the AIBEF
effect appears managerial. AIBEF decides to place its facilities among urban, educated
populations, charges higher fees, and serves areas where it is the sole supplier of FP services.
Independent of these choices, AIBEF still generates more CYPs from their market area.
Cost. The second stage regressions poorly explain cost variation. In all models, the
AIBEF coefficient is negative, suggesting that given output levels, AIBEF clinics have a lower
cost per CYP. These results are only significant, at the 90% confidence level, in model 2, and
imply that AIBEF provides CYPs at about 25% of the cost of other facilities through a pure
management effect. The effect of predicted output on cost is positive, but never approaches
significance, suggesting little economies of scale. The UNFPA coefficient is negative but never
significant. Figure 1 may explain the poor estimation, where we plot CYP output against cost.
Most small clinics with little CYP generation show extreme variation in average cost. With each

18
clinic counting equally in the regression, the estimations include considerable noise.
Diagnostics. Given the poor explanatory power of the second stage, these statistics also
tell a somewhat weak story. The R-squared values of the first stage are consistently high,
implying a predicted instrument would not contribute much noise. The first row is an
endogeneity test. We ran the second stage with the actual CYPs and the predicted residual from
the first stage. Failure to reject a zero coefficient on the predicted residuals would be evidence
that errors are correlated and the two-stage system is appropriate. The t-test is never significant,
suggesting that OLS may indeed be consistent. Since the instruments are so well predicted, the
coefficients on the actual number of CYPs in the cost equations are little different than the
coefficients on the predicted values from the original specifications, and neither is significant in
any of the models. No other coefficients are affected much in the OLS specification.
Next is an over-identification test of the validity of the exclusion restrictions. We add all
but one of the excluded variables into the second stage (the entire vector would be perfectly
collinear with predicted CYPs) and perform a simple F-test. Rejecting a joint zero vector
implies the model is mis-specified. We never reject the joint zero hypothesis, which indicates
our population interaction and functional form assumptions are statistically valid.
The final row presents the concentration parameter, following Mariano (1982) and
Bollen, Guilkey, and Mroz (1995). The numerator of this parameter is the residual sum of
squares of a regression of the exogenous variable second stage vector on the predicted CYPs
constructed from the first stage vector excluded from the second stage. Like the F-test, this
measures the quality of the exclusion restrictions. The denominator is the estimated variance of
the pure error term from the first stage. The parameter measures the cost in precision of a
two-stage regression versus the bias inherent in using OLS in the second stage. In none of the

19
first-stage specifications does the parameter approach the critical mid-70s level, suggesting
two-stage methods are not necessary (see Guilkey et al 1992). This is due to the high correlation
between the excluded and included vectors, even though a high first-stage R-squared implies a
low residual and a high concentration parameter. This points to the relatively high cost of this
two-stage model, although the OLS second stage results perform no better than their 2SLS
equivalents. We claim no results for Côte d'Ivoire affected by this aspect of functional form.
Nigeria - Table 4 Our functional form performs considerably better in Nigeria. Table 4
compares CYPs provided across facility types. There is little trend in operating authority, except
for PPFN affiliates, which produce far more CYPs than any other facility type. Other authorities
tend to operate facilities that are the same size, or at least provide roughly equivalent numbers of
CYPs. Vertical structures do provide more CYPs per facility on average. The average number
of CYPs produced in Nigeria is 22, or only about 14% of the average level in Côte d'Ivoire.
However, the median facility size is similar. We separate the analysis into the same three
specifications as in Côte d'Ivoire. The larger sample enables us to add more demographic
variables, correct for demand effects, and compensate for any unknown facility placement,
which may depend on demographics.
Model 1 presents the two-stage model with only the authority variable-population
interactions. The vertical dummy has a small, positive, and significant effect on CYP provision.
The PPFN facilities provide a marginally insignificant increase in CYPs, which disappears in
later models. Thus, their huge CYP output is completely captured by the vertical and demand
variables. To the extent that PPFN controls these factors, they do point to something that PPFN
does well. Interacting operating authority with the vertical variables had little to no effect in
either stage of any model. The apparent vertical advantage is similar across operating authority.

20
In the Column 1 cost equation, the predicted CYPs (along with almost everything) is
insignificant, which is expected given the relatively poor measurement in the provision equation.
The urban coefficient is negative and significant. We discuss poor cost estimation below in
more detail.
Column 1 diagnostic statistics. We reject the hypothesis of a zero coefficient on the
residuals, implying endogeneity, and our identification restrictions seem valid according to the
F-test. However, due to extremely high correlation between the excluded and included vectors
in the second stage (R-squared in regression = .99) , the concentration parameter is extremely
low. Although we exclude many variables, our identification restrictions boil down to a single
functional form assumption: population matters in the first stage but not in the second. This
builds in a high correlation and points to the appropriateness of fuller models.
Model 2. Column 2 presents the CYP equation with only demographic variables. This
assumes that either operating authority and organization do not matter or that these differences
can be completely captured in placement decisions which depend on demographics. We also
include the log of the CYP pill price, and the price ratio of a CYP of IUD to pills. IUD is the
method most promoted in Nigeria, and has by far the lowest relative charged price per CYP of
any method offered. In addition to the Côte d'Ivoire demographics, we include infant mortality
and the percent of women that completed primary and secondary education. Many variables are
significant, but they are equally likely to have a perverse sign as an expected sign. The
competition variable has an unexpected, large, and consistent effect. Facilities that are relatively
near other facilities actually provide more CYPs. This is probably capturing clustering and
urbanization not captured in the urban dummy. The CYP pill price coefficient is strongly
negative, but this disappears in the full model. The price ratio coefficient is insignificant. In the

21
cost equation, predicted CYPs are insignificant, and urban is significant and negative.
The column 2 diagnostic results are quite interesting. The endogeneity effect is even
more significant than in the first model, and the F-test still points to specification validity. The
concentration parameter is much higher and strongly supports the two-stage correction . We
went from a single functional form assumption implying identification to having two dissimilar
variable sets explaining the two model stages. This low correlation implies a large concentration
parameter. In this case the only thing we prove is that we correctly estimate almost zero effects
as opposed to incorrectly estimating almost zero effects.
Model 3. Column 3 presents the full model. Once again, neither the pure interactive
dummy variables nor the demographic indicators completely capture the facility "effect." We
consistently find that vertical facilities provide slightly more CYPs - perhaps suggesting much of
the placement choice is already captured. The pricing variables are insignificant when facility
dummies are added, implying that pricing is driven by operating authority rather than the facility
itself. The competition effect is also still present and large. Finally, when we measure both
demographic and authority effects, we see clear evidence of economies of scale in CYP
provision. The coefficient on the predicted CYPs in the cost equation is strongly negative. The
average cost of a CYP is $6.91, so the scale effect implies a 15% drop in operating cost.
However, regardless of specification, we only explain about 5-6% of the variability in cost. This
"non-result" is as hard to explain by chance as a classic significant coefficient, and points to the
diverse Nigeria health sector, with no authority or practice clearly superior in terms of cost.
The first two diagnostic measures in column 3 imply a well-specified and endogenous
model, but the concentration parameter reflects the relatively large cost of two stages. Since we
now claim an economies of scale result dependent on the endogenous specification, we re-run

22
the model using the actual number of CYPs in the cost equation to test our conclusions.
The predictive power increases dramatically (R-sq=.25 vs .06), but that is expected, since
the two-stage precision loss is precisely the cause of the low concentration parameter. The
coefficient on CYP increases from -1.00 to -1.51, a 50% increase, and is still significant
(p-value=.00 vs predicted coefficient p-value=.04). The urban coefficient, which is just
insignificant (p=.14), drops a bit and is still insignificant. The vertical coefficient increases (1.07
vs .78) and is now significant and positive in the OLS specification. This is new evidence that
vertical facilities might have higher cost, but two facts argue against this. First, the coefficient
on vertical in the cost equation is quite unstable and rarely significant; it is actually negative
under the first model specification. Second, the average vertical facility provides double the
CYPs as the average integrated facility. The coefficient on the predicted log of CYPs is the
change in cost resulting from a one unit change (i.e. CYPs increasing by the base of the log, or
by around 2.72) in the variable, so doubling CYP production implies about a .7 unit change in
log CYPs. Therefore, the average unit cost in vertical facilities barely differs from the integrated
case (1.51*(0.7)=1.05 decrease due to doubling of provision - 1.07 increase of being a vertical
facility). These results are still biased: the concentration parameter implies that the precision
loss from using a two-stage model is more of a problem than the bias created by using OLS.
This has implications for the significance of the vertical coefficient, but our economies of scale
results were strong in the two-stage specification and are still strong now.
Models 4 and 5. The final two models attempt to capture any unknown placement
decisions through fixed effects, the only option we have given our data limitations. The many
dummy variables reduce the degrees of freedom and precision, but they perform reasonably well.
We also have a group of demographic indicators calculated at the cluster level, which led to
23
collinearity problems with the cluster level dummies in model 5.
In model 4, four dummies are added to represent Nigerian states. Excluded is Lagos, the
commercial capital, so it is not surprising that every location coefficient is negative. The
coefficients are mostly significant in the provision equation and insignificant in the cost
equation. This implies that to the extent operating authorities placed facilities in these states,
previous results were biased. However, this adjustment did not affect the findings from model 3.
Vertical still has a small significant effect, competition still strangely increases CYP provision,
scale economies still exist, and cost is still poorly measured. The urban effect falls but is still
significant, and the log of the population is now barely significant. It is very interesting to note
pure population elasticity (.56) and the vertical coefficient (0.06) in probably our best-specified
model 4. Vertical (AIBEF before) provision has almost exactly the same 10% effect on
population elasticity as in Côte d'Ivoire. Again, over time this effect is not small. The area
dummies seem to serve as a finer measure of demographics, which allows urban and population
variables to measure their effect more accurately.
In model 5, we include a dummy for all but one of the DHS clusters. Because of the
collinearity problems, seven of the 29 parameters were dropped, casting doubt on the
appropriateness of this strategy. But again, none of the major conclusions change; in fact,
economies of scale are larger. This consistency is perhaps the strongest evidence that we capture
something real, and not a spurious correlation due to endogenous placement or other factors.
Diagnostic Statistics. In models 4 and 5 we fail to reject the hypothesis of joint zero
coefficients for fixed effects in the cost equation. Including a large number of spurious variables
will inflate the correlation between the excluded and included vectors in the cost equation. When
the fixed effects variable are excluded from the cost equation, the diagnostic statistics look

24
strong. They pass the endogeneity and F-tests, and the concentration parameters are comfortably
above the middle 70s threshold. The coefficient on predicted CYPs is -.80 in the modified
model 4 and -1.01 in the modified model 5.
Sustainability. Finally, we apply our results to cost recovery, which is explicitly called
for in the ICPD. We calculate the median percentage of operating costs per CYP covered by
clients in Table 6. In Côte d'Ivoire, the median rates range from 2.5 to 11.8 percent. In the
Nigeria sample, the figures are substantially better; the lowest level is 16.9 percent and the
highest is 190 percent. Not surprisingly, private facilities are more sustainable; they must recover
substantial costs to stay in business. However, the gap between private facilities and others
suggests they may target different clients. In Côte d'Ivoire and Nigeria (excluding private),
facilities affiliated with IPPF appear the most sustainable. AIBEF appear to operate at the
lowest cost and highest volume in Côte d'Ivoire, and PPFN targets large populations in Nigeria.
In Nigeria there is no difference in cost recovery across vertical and integrated facilities.
Discussion and Conclusion
Our analysis is necessarily limited, with small samples in two West African nations
where it is very difficult to extract useful and accurate survey data and to define the true
populations which our facilities serve. But within the framework of these limitations, we have
concrete policy recommendations.
In the Côte d'Ivoire sample, AIBEF facilities appear to be able to produce a CYP at about
$9.00 lower than the mean of $12.90: no meager difference. This result is not quite statistically
significant in all models, but it provides fairly strong support for expanding AIBEF investment.
AIBEF also produces significantly more output. Why exactly is AIBEF more effective? The
answer is apparently more than their ability to bring in clients, since economies of scale appear

25
insignificant. It is possible that part of AIBEF's advantage is due to their vertical design.
In the Nigeria sample, vertical organization is independently shown to increase service
provision. There is no clear operating authority effect, but economies of scale exist, so cost
savings arise from simply being large, regardless of authority type. PPFN facilities are much
more than 2.72 times larger than the next largest type, so a significant $1.00 to $1.50 cost drop
per CYP from $6.90 should be achievable. PPFN facilities do nothing special managerially --
they simply have located in the "right" area and have chosen wisely to be very large, and they
do recover a higher percentage of their costs. Perhaps both scale and vertical effects could be
captured in an "ideal" program by investing in vertically organized clinics with an average size
and cost structure similar to the PPFN approach.
Support for integrating FP with other health services is strong, and the logic for
integration is compelling: linking FP with other valued health services will increase the spillover
demand for FP. Also, sharing across multiple activities may allow facilities to more fully utilize
their resources and avoid costly redundancies. The results of our study provide no support for
either proposition. If the explicit goal of a program is to increase family planning utilization in
the most efficient and cost-effective way possible, then our analysis suggests vertical facilities
achieve this goal. Obviously, these are economic criteria, and advocacy programs have to
consider legal issues, equity, donor and political constraints, and much else before deciding on
where and how to fund family planning services. However, even under constraint, programs
would be well served if the most efficient service delivery approach were recognized even if not
taken, and at least the costs of choosing an alternative should then be clarified for policy makers.

26
Acknowledgments
The authors would like to thank the Evaluation and Measure/Evaluation projects out of
the Carolina Population Center for their generous support, and the two anonymous referees
whose comments significantly improved the paper. We would also like to particularly thank the
field researchers in Côte d’Ivoire and Nigeria, who toiled with humor, ingenuity, and sometimes
bravery to create survey data useful beyond the expectations of anyone used to working with
developing country data. All errors in this paper are our own.

27
Appendix. Variable Construction
CYP measures were constructed using the conversion factors in Table A1 combined with
survey data on monthly contraceptive distribution. For example, if the facility hands out three
cycles of pills per oral contraceptive visit, they provide .2 CYPs per visitor. Multiplying by the
number of new and returning pill clients yields the total number of CYPs provided through pills
for the time period covered by the visits information. We used monthly disbursement statistics.
Cost was based on three components: direct labor, contraceptives, and an estimate of
equipment use. The data was not adequate to construct an estimate of building cost or overhead
expenses, including administration, supplies, utilities etc. Labor and contraceptives almost
certainly are the largest components of direct costs (Evaluation Project 1997).
Labor costs were constructed using the monthly hours and wage rates reported for each
type of staff. For vertical facilities where FP is the only output, labor cost per CYP was obtained
by dividing monthly staff cost by monthly CYP output. In integrated facilities with multiple
outputs, the staff cost was allocated between FP and other activities. The allocation was based
on the proportion of total monthly FP and maternal and child health patients at the facility. This
may overestimate the true cost of FP in integrated facilities, if other reproductive services
require more labor than FP services. This is not true in our samples, according to the scenario
analyses conducted with this survey, since FP often requires a physical exam, clinical
procedures, and method explanation and disbursement.
Contraceptive cost used the contraceptive distribution records obtained from the survey
and contraceptive prices according to donors (USAID and UNFPA). This includes international
shipping, but does not include the logistics of in-country storage and distribution.
Equipment cost was calculated by annualizing the value of the equipment stock at the

28
facility. The survey collected an inventory of typical equipment types, which we valued at
replacement cost using standard equipment price lists obtained from donor agencies. Equipment
was assumed to have a ten-year life, and was converted to a monthly basis by dividing the total
equipment value by 120. More sophisticated depreciation techniques did not materially affect
this cost. The equipment inventory survey collected data for equipment used exclusively for FP
and equipment shared by FP and other activities. All FP equipment was allocated to FP cost,
while the shared equipment was allocated based on the proportion of FP patients.
Other Variables. Population is based on the most recent census for Côte d’Ivoire. For
Nigeria, the DHS population was obtained from Macro International. Infant and child mortality
were directly calculated through the birth history DHS responses in Nigeria. We correct for both
left and right hand censoring of the time period under consideration.
For some variables, the log functional form creates log zero data problems. If pills are
free, we set the pill price at 1 CFA for Côte d’Ivoire. The average pill price was 870 CFAs per
year’s supply. This only occurs in the UNFPA facilities, which also do not charge for IUDs.
For these facilities we set the relative price at 1. The same method was applied to Nigeria where
both contraception options were free. If only IUDs were not available, the relative price of IUDs
to pills was set at 10 in Côte d’Ivoire, an arbitrarily high number. The mean relative price was
1.36 for facilities that offered both methods. The client could still conceivably get the IUD at
another facility, but it may be prohibitively expensive and time consuming. The few
observations that did not offer IUDs but did offer pills dropped out of the Nigeria analysis.
IUDs are the most common and subsidized method in Nigeria, so this was a very small problem.

29
References
Angeles, Gustavo, David K. Guilkey & Thomas A. M roz. (1998). Purposive Program Placement and the
Estimation o f Family Plann ing Progra m Effects in T anzania. Journal of the American Statistical
Association. 93, 884-899.
Bollen, K ennth A. (19 96). An A lternative Tw o Stage Le ast Square s (2SLS) Estimator fo r Latent Va riable
Equation s. Pscych ometrika 61(1)
Bollen, Kenneth A., David K. Guilkey, & Thomas A. M roz. (1995). Binary Outcomes and Endogeno us
Explana tory Variab les: Tests and Solutions with a n Applica tion to the D emand fo r Contrace ptive Use in
Tunisia. Demography 32(10) , 111-31 .
Bulatao, R odolfo A . & Rona ld D. Lee. ( 1983) . Determ inants of F ertility in Deve loping C ountries. V ol 1: Sup ply
and Demand for Children. New Y ork: Acad emic Pre ss.
Easterlin, Ric hard A. & Eileen M . Crimmins. (1 985). The Fe rtility Revolutio n: A Su pply-D eman d Ana lysis.
Chicago: University of Chicag o Press.
Evaluation Project. (1 997). Se minar on F amily Plannin g Structure, C ost and P erformanc e. Abidjan , Côte
d'Ivoire, July 29-30.
Feyisetan, Bamikale J. & Martha Ainsworth. (1996). Contraceptive Use and the Quality, Price and Availability of
Family Plan ning in Niger ia. World Bank Economic Review 10(1), 159-87.
Gertler, Paul J. & John W. Molyneaux. (1994). How Economic Development and Family Planning Programs
Comb ined to Re duce Ind onesian Fe rtility. Demography 31(1), 33-63.
Guilkey, D ., T. Mro z, & L. T aylor. (199 2). Estimatio n and T esting in Simultan eous Eq uations M odels with
Discrete O utcomes U sing Cross S ection Da ta. Unpub lished manu script.
Harvey, P. (1996). Let’s Not Get Carried Away with “Reproductive Health.” Studies in Family Planning 27(5),
283-284.
Hotchkiss , David R . (1998) . The T radeoff B etween Pr ice and Q uality of Service s in Philippine s. Social Science
and Medicine 46(2), 227-42.
Jensen, Eric R. (1996). The Fertility Impact of Alternative Family Planning Distribution Channels in Indonesia.
Demography 33(2), 153-66.
Jensen, Eric R. (1997). Effectiveness and Cost Effectiveness of Family Planning in the Philippines. Unpublished
working paper.
Lush, L. J. Cle land, G. W alt, & S. M ayhew (19 99). Integra ting Repro ductive H ealth: Myth a nd Ideo logy. Bulletin
of the World Health Organization 77(9), 771-777.
Mariano, R. (1982). Analytical Small-Sample Distribution Theory in Econometrics: The Simultaneous Equations
Case. International Economic Review 23, 503-34.
Mayhew, S., L. Lush, J. Cleland, & G. Walt (2000). Implementing the Integration of Component Services for
Reprod uctive Hea lth. Studies in Family Planning 31(2), 151-162.
Mensch, B., M Arends-Kuenning, & A. Jain (1996). The Impact of the Quality of Family Planning Services on
Contrace ptive Use in Peru. Studies in Family Planning 27(2), 59-75.
Montgomery, M.. & J. Casterline (1993). The Diffusion of Fertility Control in Taiwan: Evidence from Pooled
Cross-Sec tion Time -Series M odels. Population Studies 47, 457-479.
Mroz, Thomas A ., Kenneth A. Bollen, Ilene S. Speizer & Dominic J. Mancini. (1999). Quality, Accessibility, and
Contrace ptive Use in Rural Ta nzania. Demography 36(1), 23-40.
Mwabu, Germano, Martha Ainsworth, & Andrew Nyamete. (1993). Quality of Medical Care and Choice of
Medic al Treatm ent in Kenya : an Empir ical Analysis. Journal of Human Resources 28(4), 838-63.
Speizer, I., an d K. Bo llen (2000 ). How W ell do Per ceptions o f Family Plann ing Service Q uality Corresp ond to
Objec tive Mea sures? Ev idence from Tanzan ia. Studies in Family Planning 31(2), 163-176.
Stewart, John F., Guy Stecklov, & Alfred Adewuyi. (1998). Family Planning Program Structure and Performance
in West A frica. International Family Planning Perspectives 25(Supplement), s22-s29.
Stover J., J. Bertrand, S. Smith, N. Rutenberg, & K. Meyer-Ramirez. (1996). Empirically Based Conversion
Factors for Calculating C ouple Y ears of Pro tection. W orking pap er, EVA LUAT ION P roject.
United N ations, (199 4). Population and Development: Programme of Action Adopted at the International
Conference on Population and Development, Cairo 5-13 September 1994, New York: United Nations
Publications.

30
Figure 1: CYP Output and Average Cost in Côte d’Ivoire

31
Table 1: Structural Characteristics of Côte D’Ivoire and Nigeria Health Facilities
Variable Description Mean (standard error)
Côte D’Ivoire (N=31)
AIBEF =1 if facility is run by AIBEF and istherefore vertically organized
0.226 (0.425)
UNFPA =1 if facility is government run withthe assistance of UNFPA
0.355 (0.486)
Nigeria (N=261)
VERTICAL =1 if facility is vertically organized 0.110 ( 0.313)
FEDERAL =1 if Federal government facility 0.034 (0.182)
STATE =1 if State government facility 0.117 (0.323)
LOCAL =1 if Local government facility 0.583 (0.494)
PPFN =1 if Facility run by the PlannedParenthood Federation of Nigeria
0.011 (0.106)
PRIVATE =1 if Facility privately operated 0.250 (0.434)
MISSION =1 if Facility run by a Mission 0.004 (0.062)

32
Table 2: Dependent Variables and Demographic Characteristics of Nigeria and Côte D’Ivoire
Variable Description Côte D’Ivoire(N=31) mean (se)
Nigeria (N=261)mean (se)
TOTAL CYP Total number of CYPs produced per month at
the facility: Dependent variable 1 158.77 (266.85) 22.03 (45.77)
COST PER CYP Total cost per CY P at the facility in Dollars:
Dependent variable 2
12.90 (8.64) 6.91 (12.55)
POP Popula tion of Catch ment area (D HS in
Nigeria and Sub-Pref in Cd’I)
114905 (111331) 5881 (6351)
URBAN =1 if DHS cluster is urban 0.548 (0.506) 0.485 (0.501)
EDUCATION 1 Percent of women in DHS cluster with a
primary ed ucation on ly
0.361 (0.207) 0.266 (0.108)
EDUCATION 2 Percent of women in cluster with a secondary
education
-- 0.368 (0 .228)
MOTHER AGE Average age of repr oductive a ge wome n in
the cluster
27.78 (1.89) 28.33 ( 1.787)
CHILDREN
BORN
Mean number of children ever born per
woman in the cluster
3.648 (1.006) 2.693 ( 0.779)
CHILD
MORTALITY
Mean child (<5yo) mortality rate in DHS
cluster
-- 0.028 (0.026)
REFRIG Percent of households in cluster that have a
refrigerator
0.581 (0.316) 0.253 (0.279)
COMPETITION Inverse of the number of facilities serving
DHS cluster
0.645 (0.319) 0.066 (0.041)
PILL PRICE Price in Dollars of a CYP provided through
pills
1.57 (1.39) 1.95 (3.40)
PILL/IUD
PRICE RA TIO
Ratio of IUD CYP price to pill CYP price 0.169 (0.136)
LAGOS In Nigerian state of Lagos -- 0.284 (0.452)
ANAMBRA In Nigerian state of Anambra -- 0.208 (0.407)
KEBBI In Nigerian state of Kebbi -- 0.053 (0.225)
OSUN In Nigerian state of Osun -- 0.205 (0.404)
PLATEAU In Nigerian state of Plateau -- 0.250 (0.434)

33
Table 3: Regression Results for Côte d’Ivoire.
N=31 Model 1 Model 2 Model 3
First Stage Dependant Variable: Log of Total CYPs. Coefficient (standard error)
R2 .86 0.88 0.90
CONSTANT -12.23 (2.29) -5.990 (3.217) -4.707 (3.172)
ln(POP) 1.230 (0.206) 0.674 (0.311) 0.588 (0.298)
ln(POP*URB AN) -- 0.139 (0.051) 0.136 (0.049)
ln(POP*EDUCATION 1) -- 0.038 (0.109) -0.005 (0.105)
ln(POP*EDUCATION 2) -- -0.008 (0.022) -0.010 (0.021)
ln(POP*COMPETITION) 0.205 (0.066) 0.175 (0.055) 0.146 (0.065)
ln(POP*AIBEF) 0.097 (0.036) -- 0.075 (0.037)
ln(POP*UNFPA) 0.026 (0.047) -- -0.006 (0.076)
ln(POP*PILL PRICE) -- -0.017 (0.075) -0.022 (0.082)
ln(POP*PILL/IUD RATIO) -- -0.224 (0.159) -0.146 (0.212)
Second Stage Dependant Variable: Total Cost per CYP
R2 .13 .13 0.13
CONSTANT 13.001 (5.456) 13.454 (5.344) 12.894 (6.002)
PREDICTED ln(CYP) 0.577 (1.878) 0.491 (2.345) 0.804 (2.794)
URBAN 0.006 (5.397) -0.372 (8.173) -1.067 (8.586)
AIBEF -8.936 (5.409) -8.295 (4.656) -9.110 (5.936)
UNFPA -0.211 (4.195) -0.460 (4.052) -0.324 (4.106)
Diagnostic Statistics
Endogeneity Test. T-staton residuals of firstequation in secondequation.
-0.86 (2.44) -0.61 (2.45) -0.92 ( 2.82)
Over-identify Test. F-staton excluded variablevector in second equation.
F(2,23) = 0.46
Prob > F = .71
F(6,20) = 1.53
Prob > F = .22
F(8,18) = 1.22
Prob > F = .34
Concentration Parameter 30.0 21.1 16.6

34
Table 4: Total CYPs Provided in Nigeria by Operating Authority and Structure
Total N=261 N Total CYPs (se)
Structure
VERTICAL 29 66.9 (111.0)
INTEGRATED 232 16.5 (24.5)
Operating Authority
FEDERAL 9 21.9 (34.5)
STATE 31 30.7 (48.3)
LOCAL 154 15.4 (25.3)
PPFN 3 289.6 (235.1)
PRIVATE 65 21.1 (24.4)
MISSION 1 35

35
Table 5: Regression Results for Nigeria
N=261 Model 1 Model 2 Model 3 Model 4 Model 5
First Stage Dependant Variable: Log of Total CYPs. Coefficient (standard error)
R2 0.44 0.37 0.55 0.59 0.64
CONSTANT 3.095 (0.597) 11.246 (1.693) 7.373 (1.638) 3.134 (1.987) 7.234 (4.402)
ln(POP) 0.063 (0.134) -0.386 (0.277) -0.031 (0.266) 0.559 (0.305) -2.258 (0.187)
ln(POP*URBAN) -- 0.304 (0.057) 0.242 (0.052) 0.144 (0.055) 0.435 (0.187)
ln(POP*EDUCATION 1) -- -0.592 (0.103) -0.435 (0.100) -0.559 (0.141) 0.059 (0.373)
ln(POP*EDUCATION 2) -- -0.017 (0.073) -0.097 (0.065) -0.282 (0.130) -0.443 (0.179)
ln(POP*CHILD MORT) -- 0.270 (0.265) 0.294 (0.233) 0.179 (0.242) 1.956 (1.705)
ln(POP*MOTHER AGE) -- -0.002 (0.009) -0.009 (0.008) -0.002 (0.008) 0.059 (0.044)
ln(POP*REFRIG) -- -0.372 (0.059) -0.232 (0.055) -0.277 (0.056) 0.153 (0.170)
ln(POP*CHILDREN) -- -0.079 (0.022) -0.033 (0.020) -0.030 (0.020) -0.094 (0.084)
ln(POP*COMPETITION) -- -0.957 (0.292) -1.017 (0.276) -1.034 (0.278) -0.312 (0.965)
lp(POP*VERTICAL) 0.083 (0.021) -- 0.077 (0.021) 0.062 (0.020) 0.057 (0.022)
ln(POP*FEDERAL) 0.005 (0.114) -- -0.052 (0.111) -0.048 (0.107) 0.001 (0.106)
ln(POP*STATE) 0.028 (0.108) -- 0.020 (0.107) -0.006 (0.103) 0.038 (0.101)
ln(POP*LOCAL) -0.016 (0.107) -- -0.044 (0.107) -0.095 (0.105) -0.045 (0.103)
ln(POP*PPFN) 0.178 (0.110) -- 0.108 (0.111) 0.057 (0.107) 0.117 (0.106)
ln(POP*PRIVATE) -0.018 (0.107) -- -0.085 (0.102) -0.106 (0.099) -0.063 (0.097)
ln(POP*PILL PRICE) -- -0.266 (0.094) 0.139 (0.120) 0.165 (0.119) 0.153 (0.121)
ln(POP*PILL/IUD RAT) -- -0.025 (0.120) 0.022 (0.121) 0.014 (0.130) 0.054 (0.132)
ANAMBRA -- -- -- -0.877 (0.379) --
KEBBI -- -- -- -2.549 (0.866) --
OSUN -- -- -- -1.144 (0.304) --
PLATEAU -- -- -- -1.227 (0.582) --
Joint F-Test on zero FE [pvalue] -- -- -- 5.82 [0.000] 3.12 [0.000]
Second Stage Dependant Variable: Total Cost per CYP
R2 0.05 0.05 0.06 0.08 0.16
CONSTANT -7.826 (9.929) 1.513 (2.714) 4.286 (3.057) 7.796 (3.531) 13.892 (7.552)
PREDICTED ln(CYP) 2.405 (2.701) -0.270 (0.336) -1.001 (0.490) -1.521 (0.524) -5.420 (2.763)
URBAN -1.228 (0.599) -0.745 (0.433) -0.639 (0.432) -0.145 (1.029) 6.840 (8.055)

36
VERTICAL -1.575 (1.876) 0.075 (0.565) 0.706 (0.652) 0.527 (0.627) 1.849 (1.300)
FEDERAL 3.228 (2.752) 3.585 (2.783) 3.331 (2.744) 2.360 (2.813) 0.915 (2.972)
STATE 0.900 (2.658) 1.584 (2.615) 1.609 (2.589) 0.752 (2.627) 0.657 (2.719)
LOCAL 2.786 (2.592) 2.590 (2.583) 2.197 (2.551) 0.278 (2.680) -2.843 (3.247)
PPFN -2.466 (4.953) 1.726 (2.734) 2.750 (2.749) 2.039 (2.725) 4.136 (3.468)
PRIVATE 1.583 (2.591) 1.444 (2.580) 1.072 (2.555) 0.138 (2.615) -2.708 (3.103)
ANAMBRA -- -- -- -1.663 (1.220) --
KEBBI -- -- -- 0.524 (1.549) --
OSUN -- -- -- -1.521 (0.785) --
PLATEAU -- -- -- 0.230 (1.109) --
Joint F-Test on zero FE [pvalue] -- -- -- 1.54 [0.19] 0.81 [0.73]
Diagnostic Statistics (With Fixed Effects Dropped from Cost Equation in Models 4 and 5)
Endogeneity Test. -4.50 (2.40) -0.73 (0.32) -0.73 (0.48) -1.05 (0.42) -0.85 (0.39)
Over-identify Test. F(6, 250) = 0.53Prob > F = .78
F(10, 242)=1.50Prob > F = .14
F(16,237)=0.99Prob > F = .47
F(20, 233)=0.95Prob > F = .53
F(35,218)=0.84Prob > F = .73
Concentration Parameter 1.5 82.8 52.8 80.1 120.6

37
Table 6: Cost Recovery Ratios (Revenue per CYP divided by Cost per CYP)
Variable Median Weighted by Total CYPs PerFacility
Côte d’Ivoire (N=31)
AIBEF .1181
UNFPA .0249
OTHER .0827
Nigeria (N=261)
VERTICAL .2920
INTEGRATED .3033
FEDERAL .2633
STATE .1989
LOCAL .1691
PPFN .4458
PRIVATE 1.8963
MISSION --
Table A1: CYP Conversion Factor by Method
Method Factor
Oral Pills .0667 per cycle
Condoms (& foaming tables) .00833 per unit
Injection (Depo-Provera) .25 per injection
IUD 3.5 per IUD
Sterilization (both male & female)
11 per procedure
Natural FP 2 per trained Individual