The Road to Agricultural Transformation in Africa - Feed Africa’

THE EFFECT OF ROAD INFRASTRUCTUREON AGRICULTURAL OUTPUT: A CASE
STUDY OF KISORO DISTRICT CENTRAL DIVISION - UGANDA
BY
UMARU NIZEYIMANA
BEAS/441 1 8/143/DU
A RESEARCH REPORT SUBMITTED TO THE COLLEGE OF ECONOMICS AND
MANAGEMENT SCIENCES IN PARTIAL FULFILLMENT oF THE
REQUIREMENTS FOR THE AWARD OF BACHELOR’S DEGREE
iN ECONOMICS AND APPLIED STATISTICS AT
KAMPALA INTERNATIONAL
UNIVERSITY.
JULY, 2017

DECLARATION
I UMARU NIZEYIMANA hereby declare that this report is my original work and has not been
published or submitted to any institution of higher learning.
~~ Date oc~-)~o i~
UMARU NIZEYIMANA

APPROVAL.
I Mrs. Nakibuule Sauda, certify that Umaru Nizeyimana canied out this research under my
supervision and am satisfied as a lecturer of Kampala International University that it is worth
submitting for award of a Bachelor’s degree in Economic and Applied Statistics.
Si~ature.~~... Date ..~

DEDICATION.
This book is dedicated to my father Mr. Ntamugabumwe Ahmed, my mother Mrs.Nakacwa
Sarah, my three beloved adorable sisters Hamidah, Jaridah and Jamirah and my brothers Amuza,
Ramathan for their encouragement, prayers and all the great things they have done to me as I
struggle to achieve my dream and goal. May the Almighty Allah always bless and reward them
abundantly.
III

ACKNOWLEDGEMENT.
My sincere gratitude goes to the Almighty Allah for the gift of life that He gave me throughout
my studies in Kampala International University, Uganda. And his beloved Prophet Mohammad
(S.A.W.)
With great pleasure and joy, I would like to extend my special thanks to my family for their
support, love and everything they have given me.
My sincere gratitude goes to my supervisor for her professional advice and support she rendered
to me throughout this research project.
I am very grateful to Kisoro Municipal Council most especially the Mayor and the town clerk
Mr. Isaiah Tumwesigye for permitting me to conduct research study in Kisoro municipality.
I also would like to appreciate respondents from Central Division for their hospitality and time to
accord me the data required to accomplish this study.
Special thanks go to all lecturers, the principal and head of department of Economics and
Statistics at Kampala International University.
iv

TABLE OF CONTENT
DECLARATION
APPROVAL
DEDICATION
ACKNOWLEDGEMENT iv
TABLE OF CONTENT
LIST OF TABLES
LIST OF ACRONYMS
ABSTRACT
CHAPTER ONE
INTRODUCTION 1
1.0 Introduction 1
1. lBackground of the study 1
1.1.1 Historical perceptual 1
1.1.2 Theoretical perspective 2
1.1.3 Conceptual perspective 2
1.1.4 Contextual perspective 2
1.2 Problem statement 3
1.3 Objectives 3
1.3.1 Major objective 3
1.3.2 Specific objectives 3
1.4 Research questions 3
1.5 Hypothesis 3
1.6 Scope 4
1.6.1 Geographical scope 4
1.6.2 Time scope 4
1.6.3 Content scope 4
1.7 Significance of the study 4
1.8 Conceptual framework 5
CHAPTER TWO 6
LITERATURE REVIEW 6
V
2.0Introduction6
2.1 Conceptual review 6
2.2 Theoretical review 7
2.3 Contextual review 8
2.3. iThe effect of road network on the productivity of agricultural produce 8
2.3.2 The major challenges faced in production of agricultural output in Kisoro district 8
2.4 Related literature 10
CHAPTER THREE 13
RESEARCH METHODOLOGY 13
3.0 Introduction :t~
3.1 Research design 13
3.2 Research population 13
3.3 Sample population 13
3.4 Sampling techniques 13
3.5 Data sources 14
3.5.1 Primary data 14
3.5.2Secondary data 14
3.6 Data collection methods 14
3.6.1 Interview guide 14
3.6.2 Questionnaire 14
3.7 Validity and reliability 14
3.8 Data analysis 15
3.9 Ethical. procedure is3.10 Limitations of the study 15
CHAPTER FOUR 16
PRESENTATION ANALYSIS AND DATA INTERPRETATION 16
4.0 Introduction 16
4.1 Respondents’ information 16
4.2 Description of the independent variable (IV) 18
4.3 Description of dependent variable 20
4.4 Verification ofhypotheses 22
vi

4.5The linear correlation relationship between road infrastructure and agricultural output 22
CHAPTER FIVE 23
DISCUSSION, CONCLUSIONS AND RECOMMENDATION 23
5.0 Introduction 23
5.1 Discussion of the findings 23
5.2 Conclusions 23
5.3 Recommendations 24
REFERENCES 25
APPENDICES 26
APPENDIX I: INTRODUCTORY LETTER 26
APPENDIX II: ACCEPTENCE LETTER 27
APPENDIX III: QUESTIONNAIRE 28
APPENDIX IV: PROPOSED TIMEFRAME 32
APPENDIX V: STUDY BUDGET 33
APPENDIX VI: SKETCH MAP OF THE AREA OF THE STUDY 34

LIST OF TABLES.
Table 1: showing gender of respondents 16
Table 2: showing marital status of the respondents 16
Table 3: showing the age distribution of the respondents 17
Table 4: showing the respondents level of education 17
Table 5: showing status of road(s) 18
Table 6: showing road(s) used by the respondents while transporting their crop produce. ... 18
Table 7: showing the distance from respondents’ plantations to the road 19
Table 8: showing transport costs from the respondents’ plantation to the road 19
Table 9: showing respondents’ plantation distance from the road in kilometers 19
Table 10: showing the type of farming respondents practice 20
Table 11: showing the types of crops grown by the respondents 20
Table 12: showing the kind of labour used by the respondents 21
Table 13: showing how much the respondents’ yield 21
Table 14: showing summary statistics relationship between road infrastructure (IV) and
agricultural output (DV) 22
Table 15: showing the correlation relationship between road infrastructure and agricultural
output 22
VIII

LIST OF ACRONYMS.
GDP Gross Domestic Product.
GOU Government of Uganda.
DRC Democratic Republic Of Congo.
NAADS National Agriculture Advisory Services.
PMA Plan for the Modernization of Agriculture.
CTA The Technical Centre for Agricultural and Rural cooperation.
NARO National Agricultural Research Organization.
OECD Organization for Economic Co-operation and Development.
ix

ABSTRACT
This study was designed to investigate the effect of road infrastructure on agricultural output in
Kisoro district central division. Focus was put on trying to establish the relationship between
road infrastructure and agricultural output. The study employed the use of correlation design to
establish the nature of the relationship. The validity and reliability of research instruments was
established and data was collected from 117 respondents selected from central municipality
using the simple random sampling method. To analyze the data, the Pearson product moment
correlation statistical tool was used with the aim of establishing the relationship between road
infrastructure and agricultural output in Kisoro district, central municipality.
This formed the basis of the detailed analysis and conclusions and recommendations. The
findings revealed the existence of insignificant effect of road infrastructure on agricultural
output. However, there was a weak positive linear correlation between road infrastructure and
agricultural output.
On the basis of the findings, the researcher made the following conclusions; there is
insignificant effect of road infrastructure on agricultural output and there is a positive
relationship between road infrastructure and agricultural output.
x

CHAPTER ONE
INTRODUCTION1.0 Introduction.
This chapter looks at the background of the study, statement of the problem, purpose of the
study, objectives of study, research questions and scope of study, significance of the study and
operational definitions of the terms.
1.lBackground of the study.
11.1 Historical perceptual.
Agriculture dates back thousands of years and its development has been driven and defined by
greatly different climates, cultures and technologies. Agriculture has undergone significant
development since the time of earliest cultivation. The crescent of Western Asia, Egypt and India
were the sites of the earliest planned sowing and harvesting of plants that had previously been
gathered in the wild. Independent development of agriculture occurred in the Northern and
Southern China, Africa’s Sahel, New Guinea, part of India and several regions of America’s.
Agriculture techniques such as irrigation, crop rotation, the application of fertilizers were
developed soon after Neolithic Revolution but made significant strides in the past two hundred’s
years.
Uganda’s favorable soils conditions and climate have contributed to the country’s agricultural
success. Most areas in Uganda have usually received plenty of rainfall. In some years, some
areas of the Southeast and Southwest have averaged more than one hundred millimeters per
month. In the North, there is often a short dry season in Decembei and January. These conditions
have allowed continuous agriculture in the South but only annual cropping in the North and
driest Northeastern corner of the country has supported only pastoralism.
It is particularly clear Kisoro district that the government, organizations and the natives at large
have come up to broaden agriculture. With the assistance of the government especially NAADS
program in the area (Kisoro) rural roads are being constructed, rural electrification being
priotized to solve the problems of agricultural output. The district mainly experiences two rainy
seasons. First, from September to December and another from March to May. It experiences a
1

minimum and maximum temperatures of 100 c and 26°c respectively and a relative humidity of
80%. Therefore, there has been an increment in fish potatoes.
1.1.2 Theoretical perspective.
The study was employed on the locational theory.
1.1.3 Conceptual perspective.
Infrastructure is stock fixed of capital equipment in the country for example roads, railways,
power stations, water supply (Oxford Advanced Learners Dictionary).According to this research,
I defined infrastructure as equipment, services that enables agriculture to be carried out.
Agriculture is the science and the art of cultivating crops and rearing livestock in order to
produce food sustenance or for economic growth. (The World economy Third Edition by
Fredrick P. Stutz)
Agriculture is the practice or science of cultivating the land and rearing of animals (Oxford
Advanced Learners Dictionary).Basing on this research, agriculture refers to the activities like
growing crops for example Irish potatoes, tea, etc.
1.1.4 Contextual perspective.
Kisoro was originally known as Bufumbira, a county of Kigezi District. During the early 1970’s,
Kigezi was divided into the districts of Kabale and Rukungiri.Kisoro was part of Kabale until
May 1991 when it became the 35th district of Uganda.
In 1939, after a wide spread famine in Rwanda a large wave of immigrants arrived in Kisoro area
and by 1949, the area had increased population. Then Kigezi district drafted soil conservation by
laws detailing how farmers should protect their lands from soil erosion/degradation.
In 1953, the British administrators initiated a resettlement program encouraging the residents of
Bufumbira County, now Kisoro district, to move to other parts of the country especially North
Kigezi, Kinkizi area and Bunyoro/Tooro.
More recently, the population growth in Kisoro district has been mostly influenced by periods of
civil unrest in Uganda, Rwanda and DRC. In 1959, when the Hutus in Rwanda over threw the
Tutsi chiefs, the Tutsi fled to Uganda and some settled in the Kisoro area.
2

During Uganda’s political instability in 1971-1986, including the liberation war of 1979-1980,
some Ugandans and Rwandese refugees fled into Rwanda and DRC.
The number of Bafumbira who migrated is not to determine but according to the present district
population s 220,312 compared to 168,681 in 1991.
It is therefore on ground that the researcher has chosen the area of interest due to its accessibility
and its richness in the information relating to the research topic being road infrastructure and
agricultural output.
1.2 Problem statement.
Several research studies have been conducted on road network. However, none of them have
been carried out about road infrastructure on agricultural output. Therefore, they have not
significantly answered the gap between road infrastructure and agricultural output. Hence this
study aims at filling the gap between road infrastructure and agricultural output.
1.3 Objectives.
1.3.1 Major objective.
I. To determine the contribution of the road network on productivity of agricultural
produce.
1.3.2 Specific objectives.
II. To determine challenges facing farmers in Kisoro district.
1.4 Research questions.
I. What is the effect of road infrastructure on agricultural output in Kisoro district?
II. What are the major challenges faced in production of agricultural output in Kisoro
district?
1.5 Hypothesis.
Ho: There is no significant effect of road infrastructure on agricultural output.
Hi: There is a significant effect of road infrastructure on agricultural output.
3

1.6 Scope.
1.6.1 Geographical scope.
This research was carried out in areas where farming was frequently done in Kisoro district for
example in central municipality. Kisoro district is found in Southwestern Uganda. It covers a
total area of 729.2 km2 (:66.2 km2 open land and the rest being open water and swamps).It
boarders the democratic republic of Congo to the west, the republic of Rwanda to the South,
Kabale to the East and Kanungu to the North. The researcher was interested in the area of the
study to its availability of information relevant to the topic as road infrastructure and agricultural
output and also as his home land.
1.6.2 Time scope.
The research was taken for a period of four months to ensure its correctness, efficiency and
effectiveness as stipulated by the university.
1.6.3 Content scope.
The study concentrates on how road infrastructure affects agricultural output, determine the
contribution of the road network on the productivity of agricultural output and to investigate the
effect of market on the performance of agricultural output.
1.7 Significance of the study.
The study was to benefit the academicians or students, local communities and those who intend
to research in this field in future.
The study was used to fill the gaps especially in the increment of agricultural output through
improved road infrastructures.
The study also aimed at providing the basic information on trends of agricultural output in
Kisoro, creating awareness to the government to improve the road infrastructure to boost
agricultural output, finding the basic information on the status of road network on the
development of agricultural output and fmding the factors that are falling the development of
agricultural output.
4

1.8 Conceptual framework.
This section deals mainly with the relationship between the subjects under study.
I.V D.V
Road infrastructure Agricultural output
Tamac roads Food crops
Maram roads Cash crops
Feeder roads ____________________ Quality of output
Road distance Quantity of output
Source: Primary data 2017.
5

CHAPTER TWO
LITERATURE REVIEW2.0 Introduction.
This chapter presents conceptual review, theoretical review, contextual review and related
literature (review of related studies).
2.1 Conceptual review.
Dependent variable, agriculture refers to the science of growing crops and rearing animals. There
is a considerable amount of emphasis being given to the concept of sustainable agriculture .In
Uganda, it is termed as modernization of agriculture. The country has a total land area of
241,038 ~2 81% of which is suitable for agriculture. With a favourable climate, it has some of
the best agricultural land in Africa. The soils and climate over the greater part of the country are
favourable and permit farming throughout the year. Eventually, the country is able to produce a
wide variety of tropical and sub-tropical agricultural output all the year round. Agricultural
production in Uganda is divided into four sub-sectors namely crops, livestock, fisheries and
forestry. The crops category is the largest in terms of area of coverage and contribution GDP
(76% in 1 995).Much of the food crop production however, is for direct consumption at
household level. Only 33% is sold to domestic and export markets. Smallholder farming
estimated at 2.5 to 3.0 million holdings, predominates, accounting for 94% of all crop
production. Basically, Kisoro district majorly grows irish potato. Although potatoes are found in
almost all districts, intensive potato production takes place in only a few of them. Originally
restricted to the South western highlands of Uganda. Other major potato growing districts
include Kabale, Rukungiri, Mbarara, Kasese, Kabarole, Masaka,Mubende,Mbale,Kapchorwa and
Nebbi.This potato crop was introduced in East Africa towards the end of the 19th century and
arrived in Uganda around 1 889.However, there is growing interest in cultivation of potatoes in
other districts but due to inadequate of sufficient quantities of clean seed of improved varieties,
production is still restricted to a few districts (CTA &NARO 2001)
Agriculture refers to as the science or art or the practice of large scale soil cultivation in order to
produce crops (Watson’s Longman Modern English Dictionary 1976).
6

Agriculture is the production of crops, livestock and their products (Humphrey’s American
Peoples Encyclopedia 1965).
Independent variable road infrastructure refers to all the processes where by passengers and
goods are moved from one place to another. Transport aids trade to be carried out that is by
assisting in the movement of goods from one place from where they are produced to where they
are finally consumed. This mean that road network puts the final products in the hands of the
consumer and raw materials in the hands of manufacturers and processers. Transport as such
completes the whole process of production and consumption.
Road infrastructure refers to a line of communication (travelled way) using a stabilized base
other than air strips open to public traffic primarily for the use of road motor vehicles running
on their wheels which include bridges, tunnels, supporting structures, junctions, crossings,
interchanges and toll roads (OECD)
2.2 Theoretical review.
Weber (1909) developed the locational theory emphasizing the role of weight of commodities as
a locational factor. Transport costs depend normally on weight and distance. Sometimes it is
difficult to judge the effectiveness of the location factor in relation to other factors when
different prices for an agricultural commodity prevail in different markets. Distance is vital as
this relates significantly to transport costs and the size of a given market centre. Greater distance,
more transport cost although frequently it is offset by tapering effects that is the reduction in
costs per tonne/km with increasing distance.
Whatever a farmer produces at his farm, he has to sell a certain portion in the market to obtain a
fair remuneration. There is need for an efficient transport system so that goods can be speedily
transported from producer to buyer. Transport therefore, must always be evaluated not only in
terms of capacity but also in terms of cost. Changes in transport costs have resulted in changes in
enterprise locations as the growth of the road transportation affected the location of crop
farming. Transport affects the farmer not only in the outward transport of his produce but also in
the supply of seeds, fertilizer, stores, livestock and other inputs needed for farm. Transport costs
always loom large in agricultural production and reducing these costs extend the area of
production for given markets.
7

2.3 Contextual review.
2.3.lThe effect of road network on the productivity of agricultural produce.
Accessibility to roads.
Roads represent important linkages in the process of bettering agriculture of an area. These
contribute significantly toward mobilization of resources and reduce the gap between the rural
and the urban sectors. Easy access to passable roads facilitate transportation of agricultural
output and other products.
Distance.
Local farmers benefit from roads when the roads reduce the costs of transporting agricultural
products to markets and extends the distance to break even locations. This leads to more
intensive cultivation and increased production of food crops and cash crops. As the cost of
transport falls, the production cost also falls which results into increased production of
agricultural output. Therefore, the price band reduces due to improved transportation services so
the rural and peri — urban areas as well as the people to get double benefits.
Marketability.
The researcher contends that access to markets is influenced by road network in regard to
agricultural productivity. Poor infrastructure and barriers in the market penetration are caused by
limited resource, inadequate information and poor policies among other factors include market
standards, limited product differentiation. However, poor infrastructure primarily limits the
markets that farmers take their produce there by increasing the cost of transportation thus acting
as a barrier to market penetration.
2.3.2 The major challenges faced in production of agricultural output in Kisoro district.
Poor transport network. Road and rail infrastructure is important for ease of flow of goods from
the district side. To date major truck roads have been rehabilitated but some are in poor repair
state while a large proportion of the feeder roads which provide linkages between rural and urban
are still poor condition especially in wet season. And new extensions have not been undertaken
in recent years. Some of the potential farmers are located in remote area for example Busanza,
Murora. This means that transporting and marketing of their yields is rather a problem.
S

Unfavorable climatic conditions such as prolonged thought and the occurrence of unexpected
rainfall. Both extremes damage great quantities of crops grown.
Land shortage. This is due to the area being densely populated coupled by inadequate capital.
Therefore, the cultivated land is highly fragmented with small plots covering the terrace hill
sides.
Poor methods of farming accompanied by low levels of education attained by farmers. Most of
the farmers have inadequate knowledge on how to practice farming. Hence the cultivated plots
are over cropped and exhausted. Land is hardly allowed to rest.
Inadequate market infrastructure. It is true that many rural markets are operational in most rural
areas of the district on weekly basis. Such markets however, do not have the minimum facilities
like roofed structures to guard against rain and other weather conditions. This has led to inability
to store for better markets which puts the sellers at disadvantage.
Low productivity and low output. Inefficient services especially those provided by utilities such
as electricity and water negatively influence agricultural productivity. Power is often intermittent
and electricity has not reached some parts of the district and such areas have to rely on expensive
source of power.
Low levels of technology. This has resulted into inadequate agro-processing facilities for any
agricultural products which are perishable for example fruits, vegetables. Large quantities of
such products are produced in particular periods of the year lead to low prices in those seasons
and very high prices when they are out of the season.
Pests and diseases. Diseases and infections continue to plague the African continent both humans
and crops. Human diseases such as malaria, tuberculosis and HIV/AIDS reduce the man’s hours
available to agriculture. Crop pests like army worm, aphids (aphididea),tortoise beetles, weevils,
rodents(field rats, root rats, squirrels),vermin(monkeys, pigs)and diseases for example foot
rotQ,lenodomus destruens), late blight( phytophthora infestans), pseudimonas bacterial
wilt(ralstonia olanacearum), among others also impede the agricultural crops’ growth hence
leading to low agricultural output.
9

2.4 Related literature.
Agriculture is the mainstay of the African economy where it contributes between 29— 58% GDP,
66 — 100% of export earnings and employs 68 — 92% of the population. It is therefore the main
source of income, employment, food, foreign exchange and it supplies raw materials for the
domestic industries. Agricultural growth is essential for economic growth, poverty eradication in
the continent and very few countries have had rapid growth rates without agricultural growth
preceding or accompanying it.
In Uganda, over 88% of the population live in rnral areas and earn their livelihood from
agriculture. In 1996/97, the sector contributed 47% of the total GDP and over 94% of exports.
The contribution of agriculture to GDP has been expanding each year with an average growth
rate of 6.4% per annum (1988 to 1995). The country continues to depend mainly on the
agricultural sector for its foreign exchange earnings. Uganda has mainly agro-based industries
which depend on the sector for the provision of raw materials. However, a major challenge to the
agricultural sector is to develop and adopt the technologies which can increase the overall on
fanri production and productivity. This increase can only occur through increased utilization of
modern technological inputs for example high yielding seed varieties, fertilizers, mechanization,
water management, improved livestock breeds, etc. Also the GOU has adopted a policy to
modernize agriculture. This is often referred to as PMA. The PMA aims to achieve a
transformation of the currently predominant subsistence farming into a dynamic and profitable
commercial agriculture where farmers produce for the market. This transformation requires
readily available and technologies for the users (CAT 2001).
Infrastructural services of relevance to agriculture. Infrastructural agricultural services comprise
of the whole system of basic services and training establishments provided by government,
public and private agencies. These are the essentials in modern farm operations. The framework
of infrastructural agricultural services consists of rural service centres, marketing facilities,
transport costs, accessibility to roads, price incentives, credit agencies, federations, political
policies and reclamation of wastelands. These are factors which elude the farm operations.
Ultimately, these factors collectively or individually influence agricultural patterns and
productivity. Thus in the underdeveloped and developing countries of the world where farming is
10

not general beyond the subsistence level, provision of efficient infrastructural agricultural
services are always of paramount at all levels (Jasper Singh 2000).
Kisoro report shows that 89% of the households depend mainly depend on subsistence farming
which is higher than that of the whole nation which is at 68%. It shows that 89% depend on
natural resources particularly land. The crops grown are majority food crops for home
consumption (The Uganda population and Housing census, 2002).
In the study conducted by the government of Uganda through anticipated of trade in 2012 to
assess the problems anticipated and gains from agriculture. The problems to agriculture were
manageable as they could be curbed both in the short and in the long run. Environmental factors
like pests and diseases, drought, heavy rains have diverse effects on the output in agriculture. It
is characterized that pests and diseases which attack and destroy crops during growth are of big
diverse effects to the soil.
Food output has grown substantially in the past decade particularly in developing countries
which have shown an average annual increase of over 3%.The growth in food output per head is
slower 1% a year on average in the developing world but still significant. Also the percentage of
paved (with tamac, maram, asphalt or concrete surface)roads gives an idea of what part of the
road network can be used in all weathers and at all times: depending on climatic conditions,
gravel or dirt roads may be impassable at certain times of year with implications for the
movement of export commodities. In other countries the analysis excludes unpaved roads for
limited local use. In countries with a very low percentage, paved roads will be largely confined
to cities particularly Sub-Saharan Africa, Uganda (Robert J, 1990).
Road transport involves the movement of goods and passengers from one destination to another.
It involves the use of vehicles, motor cycles and bicycles. However, south western Uganda,
Kisoro-Kabale is mainly mountainous and this relief presents problems in terms of road
construction and maintenance. At the same time, this region experiences a problem of frequent
landslides and rock creeping. This problem usually becomes very severe during wet season, the
roads become slippery and therefore impassable. Very often Kisoro district is hard to reach with
high transport costs on the part of road passengers. Agriculture in Uganda involves both arable
and livestock farming. Agriculture provides almost total livelihood to the majority of the people.
11

It provides a backbone to the economy of Uganda in terms of exports. Agriculture in Uganda
vary from region to region due to a number of reasons for example influence of climatic
conditions (rainfall and temperature), nature of soil fertility, influence of relief (altitude), levels
of education attained by people, etc. .(Byamugisha Bweebare C, 1994)
In Uganda, the economy is still characterized by low productivity, low competitiveness and weak
infrastructure, lack of access to finance, electricity, support services, market outlets and access.
Meanwhile, the population growth of over 3% per year erodes economic gains and adds more
than 300,000 frustrated job seekers to the economy each year. Agriculture remains the major
contributor to GDP but as diversification and transformation take root its share is GDP is
expected to decline. However, agricultural sector contribution in terms of output, employment
incomes and agro-processing industrialization strategy will remain essential for reducing
poverty. Although agriculture will remain a means to broader developmental ends and
contributes about 40% of GDP, it is neglected in budget allocations and receives less than 5% of
total budget (Kamuntu, 2004).
12

CHAPTER THREERESEARCH METHODOLOGY
2 Introduction.
This chapter explains procedure, methods of investigation to be used by the researcher in
carrying out his study, the research design, research population, sample population, sample
technique and source of data, data collection methods, measurement of variable, data processing,
data analysis, ethical consideration and limitations of the study.
3.1 Research design.
The research design included the outline of what the researcher fornrnlated the hypothesis to the
final analysis of data. The study was conducted mainly using qualitative and quantitative
approach of research. The research employed the self-administered questionnaire as a tool of
data collection and to counter the short comings that would accrue from use of that tool, an
interview was also conducted with some of the respondents. A correlation design of the
qualitative and quantitative approach was used to establish the relationship between the
independent and dependent variables.
.2 Research population.
Population refers to the total elements of the study that the researcher has interest in regards to
the provision of data. From the purpose of this study, the researcher targeted the population that
includes local farmers in Kisoro district.
3.3 Sample population.
The sample consisted of 170 respondents from those who practice farming. However only 152
questionnaires were retrieved from the respondents and 35 of them were improperly filled by the
respondents. Only 117 questionnaires were properly filled and used for data analysis.
3.4 Sampling techniques.
The samples used in the study was selected using purposive sampling which is a function of non
probability sampling. Under purposive sampling technique, the researcher purposely chose those
who are thought to be relevant to the research topic. In this case, the judgement of the researcher
13

was more important than obtaining a probability sample. The sample size was thus selected from
all the different respondents of choice in the study population.
3.5 Data sources.
The researcher gathered information mainly from two sources that was primary and secondary
source.
3.5.1 Primary data.
This was data attained by the researcher from the field. Data collection was through use of
questionnaires and was from respondents’ opinions, ideas through interviewing.
3.5.2Secondary data.
Secondary data was conducted from government ministries at macro levels. Among others
include literature from text books.
3.6 Data collection methods.
3.6.1 Interview guide.
This was used basically on respondents who do not know how to read and write as well as those
who didn’t have time to fill the questionnaires because the researcher would be able to know
what to ask with reference to the topic. The researcher conducted a face to face interaction
between the interviewer and interviewee with sole aim of soliciting the required data. The
researcher used formal interviews to get more information in greater depth, reduce resistance and
also obtain personal information from the respondents.
3.6.2 Questionnaire.
This consisted of a number of questions printed in a definite order. With this method,
questionnaires were sent to the respondents with a request to respond. Both open and closed
questionnaires were administered to respondents and were maintained with the confidentiality.
3.7 Validity and reliability.
Validity and reliability refers to data control. Validity of the instrument refers to the degree to
which it measures what is intended to measure and does so correctly (Kakinda Mbaaga
2000).Reliability of the instrument refers to its degree of consistence.
14

To establish the validity and reliability of the instrument, the researcher discussed the instrument
with the supervisors and colleagues with more knowledge in the field of research.
3.8 Data analysis.
Data analysis refers to the science of examining raw facts with purpose of drawing conclusions
about the underlying information. The data collected was analyzed using quantitative analysis
which involved six major activities that is data preparation, coding, grouping and relating,
predicting and statistical testing.
3.9 Ethical procedure.
The researcher chose the topic and the supervisor at the University approved it. The researcher
also attained an introductory letter from Kampala International University College of Economics
and Management to go for data collection process. The researcher made questionnaires
commensurate to the number of respondents and personally delivered them. The researcher
ensured honesty and confidentiality in data collection including respecting respondents’ rights.
Data was analyzed with aid of using a computer.
3.10 Limitations of the study.
Inadequate funds. The researcher faced a challenge of inadequate funds while procuring the data
collection materials, latest version tools and facilitation during the field study.
Difficulty in accessing the respondents due to their busy schedules. However the researcher used
other skills for example rearranging appointments and making calls.
Unpredictable weather conditions. Following the current situation of the weather conditions,
unpredictable changing weather conditions hindered data collection exercise due to too much
rain and too hot temperatures at times thus affecting research study in the field.
Some respondents deliberately refused to respond to some questions which were crucial in
achieving research objectives hence negatively affecting the data analysis of the research topic.
Inadequate time period allocated for the research study. This meant that extra effort was needed
to accomplish this task in shortest time possible.
15

CHAPTER FOUR.
PRESENTATION ANALYSIS AND DATA INTERPRETATION4.0 Introduction.
The data is presented, interpreted and analyzed regarding to the topic effect of road infrastructure
on agricultural output in Kisoro, Uganda. The focus was on 117 respondents. The interpretation
was based on respondents’ response provided in questionnaires to answer the research questions.
Presentation and interpretation of data was done with aid of quantitative and qualitative methods.
Quantitative methods involved the use of tables, graphs, percentages and personal analysis as
well as interpretation presented in an essay form as shown subsequently.
4.1 Respondents’ information.
This shows the background of the respondents’ according to gender, marital status, age and level
of education as per section A of the questionnaire (appendix 1).
4.1.1 Respondents by gender.
Table 1: showing gender of respondents.
Gender Frequency Percentage
Female 66 56.4
Male 51 43.6
Total 117 100.0
The preceding table conveys that out of 117 respondents, 56.4% were females and 43.6% males.
Therefore females were more cooperative than males.
4.1.2 Respondents by marital status.
Table 2: showing marital status of the respondents.
Marital status Frequency percentage
single 88 75.2
married 20 17.1
Divorcecllseparated 5 4.3
widowed 4 3.4
Total 117 100.0
16

Table 2 illustrates that single and married respondents took the highest participation part in
responding to the questionnaire as 75.2% and 17.1% by marital status respectively.
4.1.3 Respondents by age.
Table 3: showing the age distribution of the respondents.
Age Frequency Percentage
15-20 78 66.7
21-25 7 6.0
26-30 8 6.8
31-35 6 5.1
36—40 8 6.8
41—45 5 4.2
46—50 4 3.4
50 and above 1 0.9
Total 117 100.0
Table 3 indicates that respondents aged between “15-20” formed a higñest percentage with
66.7%in responding to the questionnaires and the least were those aged between “50 and above”
with 0.9% compared to the rest of the respondents’ age groups.
4.1.4 Respondents by level of education.
Table 4: showing the respondents level of education.
Level of education Frequency Percentage
None 5 4.3
primary 6 5.1
0’ level 71 60.7
A’ level 22 18.8
Diploma 6 5.1
Degree 7 6.0
Total 117 100.0
17

Table 4 shows that most respondents have attained 0’ level and A’ level with the percentage of
60.7% and 18.8% respectively compared to the rest respondents especially those who lie in
“none” level of education.
4.2 Description of the independent variable (IV).
This section describes the independent variable (road infrastructure) in section B in the
questionnaire. It includes status of roads in the area, roads used during transportation of
agricultural produce, the distance from plantation to the road, the transport costs from the
plantation to the road and distance in kilometers from the road to the plantation.
Table 5: showing status of road(s).
Road(s) Frequency Percentage
Tamac 60 51.3
Maram 57 48.7
Total 117 100.0
Table 5 shows that most roads in the study area are tamac with 51.3% compared to maram roads
with48.7%.
Table 6: showing road(s) used by the respondents while transporting their crop produce.
Road(s) Frequency Percentage
Tamac 42 35.9
Maram 49 41.9
Feeder 26 22.2
Total 117 100.0
Table 6 clearly illustrates that maram roads are used mostly by the respondents during
transportation of their crop produce with 41.9% compared to tamac roads with 41.9% and feeder
roads with 22.2%.
18
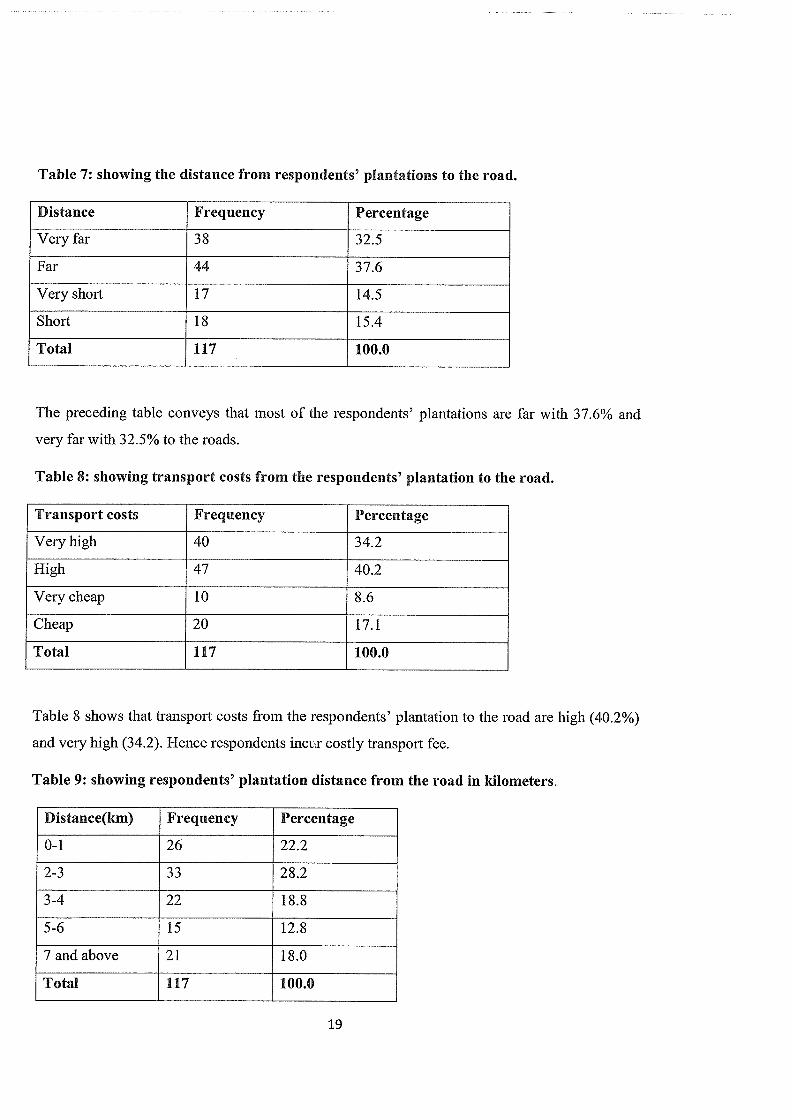
Table 7: showing the distance from respondents’ plantations to the road.
Distance Frequency Percentage
Very far 38 32.5
Far 44 37.6
Very short 17 14.5
Short 18 15.4
Total 117 100.0
The preceding table conveys that most of the respondents’ plantations are far with 37.6% and
very far with 32.5% to the roads.
Table 8: showing transport costs from the respondents’ plantation to the road.
Transport costs Frequency Percentage
Very high 40 34.2
High 47 40.2
Very cheap 10 8.6
Cheap 20 17.1
Total 117 100.0
Table 8 shows that transport costs from the respondents’ plantation to the road are high (40.2%)
and very high (34.2). Hence respondents inci.~r costly transport fee.
Table 9: showing respondents’ plantation distance from the road in kilometers.
Distance(km) Frequency Percentage
0-1 26 22.2
2-3 33 28.2
3-4 22 18.8
5-6 15 12.8
7andabove 21 18.0
Total 117 100.0
19

Table shows estimated distance in kilometers from the road to the respondents’ plantation which
is “2-3” with 28.2% km followed by “0-l”km with 22.2%, “3-4”km with 18.8%, “7 and above”
km with 18.0% and lastly “5-6”kin with 12.8% . Averagely, the plantations are “3”km from the
roads.
4.3 Description of dependent variable.
This Section describes the dependent variable (Agricultural output). In this study, Agricultural
output was conceptualized to frequencies and percentages obtained in types of farming, types of
crops grown, labour used, amount of yields and challenges faced in agriculture.
Table 10: showing the type of farming respondents practice.
Farming type Frequency Percentage
Subsistence farming 97 82.9
Commercial farming 20 17.1
Total 117 100.0
Table 10 shows that 82.9% of the respondents practice subsistence fanning more than
commercial farming with 17.1%. Thus majority do subsistence fanning.
Table 11: showing the types of crops grown by the respondents.
Types of crops Frequency Percentage
Food crops 101 86.3
Cash crops 16 13.7
Total 117 100.0
Table 11 implies that 86.3% of respondents grow food crops whereas the rest percentage grow
cash crops. Therefore most respondents grow food crops.
20

Table 12: showing the kind of labour used by the respondents.
Labour Frequency Percentage
Family labour 76 65.0
Hired labour 39 33.3
Use of machine 2 1.7
Total 117 100.0
Table 12 indicates that family labour use takes the highest percentage of 65.0% followed by
hired labour with 33.3% and machine use with 1.7%. Thence majority of the respondents use
family labour.
Table 13: showing how much the respondents’ yield.
Yield Frequency Percentage
Very high quantity 16 13.7
High quantity 63 53.9
Very low quantity 6 5.1
Low quantity 32 27.4
Total 117 100
Table 13 implies that 53.9% of the respondents produce high quantity, 27.4% produce low
quantity, 13.7% produce very high quantity and 5.1% produce very low quantity. This infers that
most respondents yield high quantity.
21

4.4 Verification of hypotheses
Table 14: showing summary statistics relationship between road infrastructure (IV) and
agricultural output (DV).
DV Coefficient Standard t P >It I 95% confidence Prob > F
Error interval
IV 0.04619 0.06931 0.67 0.506 -0.09109 0.5065
0.18348
Constant 5.7873 0.5401 10.71 0.000 4.7174
6.8572
The regression line is yA= 5.7873 + 0.04619X.
(10.74, 0.67)
Since 0.506 is greater than 0.05 then road infrastructure is not statistically significant. The
constant is statistically significant since it is less than 0.05.However, the F — value of the whole
model is 0.5065 which is greater than 0.05 implying that the model is insignificant thence we
accept the null hypothesis that there is no significant effect of road infrastructure on agricultural
output.
4.5The linear correlation relationship between road infrastructure and agricultural output.
Table 15: showing the correlation relationship between road infrastructure and
agricultural output.
Agricultural output Road infrastructure
Agricultural output 1.0000
Road infrastructure 0.0620 1.0000
Table 15 shows that there is a weak positive correlation relationship between road infrastructure
and agricultural output.
22

CHAPTER FWE
DISCUSSION, CONCLUSIONS AND RECOMMENDATION
5.0 Introduction.
This chapter introspects the conclusion and recommendations of the research study. The
conclusions and recommendations were inferred following the fmdings of the study in the
previous chapter.
5.1 Discussion of the findings.
According to the fmdings of this study, females responded most, single and married respondents
were higher than any other by marital status, farming is done mostly by youths aged between 15
and 20 and also the highest level of education obtained by most respondents is o’ level.
The fmdings revealed that the status of roads incentral municipality are tamac and the most roads
used by the respondents in transportation of their agricultural output are maram. Also the
findings conveyed that the roads are far from plantations with average distance of 3km and high
transport costs are incurred by the respondents.
The findings of this study confirmed the findings of the Kisoro report Uganda population and
Housing census (2002) who concluded that most people do subsistence farming. These findings
of this study indicated that most people grow food crops with the use of family labour producing
high quantity of the yields. The findings also revealed that price fluctuations, limited market,
inadequate capital, pests and diseases, stiff competition, poor transport as major challenges faced
by people during agriculture.
5.2 Conclusions.
The following conclusions were drawn as a result of the research work carried out in the area of
study about the road infrastructure and agricultural output.
The researcher confirmed the hypothesis that there is insignificant effect of road infrastructure on
agricultural output. The researcher also inferred that there is a positive correlation relationship
between road infrastructure and agricultural output. The majority typically still depend on
subsistence farming.
23

5.3 Recommendations.
Basing on the study findings and the conclusions, the researcher derived the following
recommendations.
Roads are the lifeline that is the arteries of economic region. These crucial channels promote
agricultural development and form an integral part of a metropolis and the area that serves it. For
exploitation of the agricultural potential of an area particularly Kisoro district, roads should be
developed on a priority basis for a complete change in the agricultural landscape. Road network
comprising of trunk roads line roads, approach roads and village roads will provide proper access
to markets for all types of farmers.
For the development of inherent agricultural potentials of an area, road accessibility is a desire
need as road transportation plays an important role in marketing cereals, vegetables and fruit
produce. As a matter of fact, this critical distance should vary in accordance with the nature of
transportation and the total distance.
The government should invest highly in agriculture through adoption and introduction of new &
modern technology, creating ready market, putting measures on pests and diseases control,
encouraging people to do commercial farming for both the government and people involved in
agriculture to benefit. The agricultural sector in Uganda for the foreseeable future will remain the
mainstay and engine as well as the stepping stone of growth of the economy.
24

REFERENCES.
NARO, (2000).Agriculture in Uganda. (vol.1).
Population and housing census report (2002), Kisoro District Report.
Robert, Samuelson, J. (1990).The Economist Book of Vital World Statistics.
Jasper, Singh. (2000). Agricultural geography. (2~’ ed.).
NARO, (2000). Agriculture in Uganda. Crops. (vol.2).
Byamugisha, Bweebare, C. (1 994).Geography of Uganda.
Ministry of Agriculture, Animal Industry and Fisheries. Annual report. (1980 — 1996).Entebbe
25

APPENDICES
APPENDIX I: INTRODUCTORY LETTER
Ogaba Rcn 1, K:mstnqa
11111 KAMPATA RO, Box 2003B I<060pa a, 0gm ‘Jo~ I H INT€RNATIONAL Email:~I 51? flC ~Kfl~fl’!rrCr~ ‘W~ bsa~’:hnpj/waw K
I
mar
OFFICE OF THE HEAD OF DEPARTMENTECONOMICS AND STATISTICS
3tx May, 2017
lo The Mayor,K’soro Municipality,P.O. Box 199,kisoro
Dear S’rlMadam,
SUBJECT: PERMISSION TO CONDUCT A RESEARCh STUDY N YOUR ORGANJATION
With refereice to the above subject, this ‘s to certify that MR. UMARU IIIZEYiMANAPEG. NO. BEAS/441 18/143/DU is a bonafce student of Kampala InternationalUniversity pursing a Bachelors Degree of Economics and Applied Statistics.
He is currently conducting a field research entitled ‘tROAD INFRASTRUCTURE ANDAG tICULTURAt. OUTPUT, CASE STUDY OF KISORO DiSTRiCT, CENTRAL DIVISON”.
This area has been identif lea as a vel~iable source of information pertaining to hisrosoarch project. Tho purpose of this letter therefore is to request you to avail himwitn the nertinent information as regards to his stuoy.
Any data sharcd with nini will be used for academic purposes on~y and shall be keptwitn atmost confidentiality.
Any esi an&~to~jderod to him will bc highly approcatod.
bás~ru4i,
~k~P~vi~t :~‘ -,
‘MItLIEFIFZA FRAtIK iNNj~’g~ho~Deparimqri’;’Te~t’Jt777$j949S5’Email~”h’iuherezafgtyahoo.com
rCçiorn~a tfie Jiarp!its
26

APPENDIX II: ACCEPTENCE LETTER.
KISORO MUNICIPAL COUNCILOur Ref: KMCI22OII Office of Town 01cr
P. 0. Box 199,Kisoro —Uganc~s,18” May2017
the Head of Department of Economics and Statistics,Kampala Interrational University,ROJ3ox 20000,Kampala.
RE: PERMISSION 0 CONDUCT A RESEARCH STUDY_IN KISORO.MUNICIPAL COJNCL
Reference is made to your letter dated 08/05/2017 requesting for Mr. UmaruNizayimana to do his research in our Orgsnisstion
This is to inform you that the Council has no objection, we shall accord him allthe support.
Faithfully,
Isaiah TumwesigyeFor: Town ClerkKisoro MunicioaLQouncil.
Cc: His Worship the Mayor Kisoro Municipal Council.
27

APPENDIX III: QUESTIONNAIRE
RESPONDENT’S QUESTIONNAIRE
I am Umaru Nizeyimana a student of Kampala International University pursuing a Bachelor’s
Degree in Economic and Applied Statistics and conducting a research on “road infrastructure and
agricultural output”. The study aims at determining the effect of road infrastructure on
agricultural output in Kisoro district particularly in Central division.
As a process of data collection for this research, am requesting you to provide me with some
information. This can easily be done by filling the following questionnaire. Please answer the
questions as honest as possible. The information you give will be treated with maximum
confidentiality and solely for the purpose of this study. Thank you.
SECTION A: DEMOGRAPHIC CHARACTERISTICS.
1. Gender
1) Female
2) Male
2. Marital status
1) Single 3) Divorced I Separated
2) Married 4) widowed
3. Age
1) 15—20 2) 26—30 1—40
4)21-25 [ ~ 5)31—35 ~) 41-45
7) 46—50 8) 50 andabove I28

4. Level of education
1) None [] 3) O’level ~Jipioma []2) Primary 4) A’ level ~le~ee
SECTION B: QUESTIONNAIRE ABOUT ROAD INFRASTRUCTURE
Please tick in the space provided appropriately below. Please do not leave any item unanswered.
A. What is the status of the road(s) in your area?
1. Tamac
2. Maram
B. Which road(s) do you use while transporting your crop produce?
1. Tamac
2. Maram
3. Feeder I
C. What is the distance from your plantation to the road?
1. Veryfar ~
2. Far
3. Very short J_________
4. Short
29

D. What are transport costs from your plantation to the road?
1. Veryhigh~]
2. High
3. Very cheap ~
4.Cheap I 1
E. How far is your plantation from the road?
1) 0— 1 km I________ 3) 3 —4 km km and above []2) 2 — 3 km [~] 4)5- 6 km
SECTION C: QUESTIONNAIRE ABOUT AGRICULTURAL OUTPUT.
A. Which type of farming do you practice?
1. Subsistence fanning []2. Commercial fanning []
B. Types of crops you grow.
1. Food crops ______
2. Cash crops L I
C. Which kind of labour do use?
1. Family labour
2. Hired labour
30

3. Use of machines
D. How much do you yield on your plantation?
1. Very high quantity []2. High quantity []3. Very low quantity
4. Low quantity
E. What are the major challenges you face in agriculture?
1.
2.
3
4
Thank you for your cooperation.
31

APPENDIX IV: PROPOSED TIMEFRAME..
DATA. ACTIVITY.
lstMarch — 30th April,2017 Chapter one, two and three.
1st - 5th May, 2017 References and appendices.
9th 26th May, 2017 Data collection.
28th — 30th May, 2017 Data analysis.
3 1st - 1st June, 2017 Chapter five
2’~ June,20 17 Research report submission to the supervisor for approval
5th June,20 17 Research report submission to the department.
32

APPENDIX V: STUDY BUDGET
This conveys the expenditure the researcher incurred during the research study.
S/NO ACTIVITY AMOUNT
1. Printing of proposal report 10000
2. Printing of questionnaires 34000
3. Data collection 30000
4. Transport 70000
5. Facilitation 70000
6. Installation of latest data statistical packages 50000
7. Airtime 10000
8. Printing of dissertation 50000
9. Cover pages 24000
9. Miscellaneous expenses 30000
Total 354,000
33

APPENDIX VI: SKETCH MAP OF THE AREA OF THE STUDY.
msoi~o s.m~c~r MAP
10 K~orne~ers
11 - 0
0
5 09
Water Bodtes
0 5~EE~EE --~~
34