
Conditions Leading to Quench Cracking Other Than Severity of Quench

THE EFFECT OF QUENCH RATE AND INITIAL GRAIN STRUCTURE ON THE
MECHANICAL BEHAVIOUR OF AN Al-Mg-Si-Mn ALUMINUM ALLOY
by
Neda Sarmady
B.A.Sc, The University of British Columbia, 2015
A THESIS SUBMITTED IN PARTIAL FULFILLMENT OF
THE REQUIREMENTS FOR THE DEGREE OF
MASTER OF APPLIED SCIENCE
in
The Faculty of Graduate and Postdoctoral Studies
(Materials Engineering)
THE UNIVERSITY OF BRITISH COLUMBIA
(Vancouver)
May 2018
© Neda Sarmady, 2018

ii
The following individuals certify that they have read, and recommend to the Faculty of Graduate
and Postdoctoral Studies for acceptance, a thesis/dissertation entitled:
The effect of quench rate and initial grain structure on the mechanical behaviour of an Al-Mg-
Si-Mn aluminum alloy
submitted by Neda Sarmady in partial fulfillment of the requirements for
the degree of Master of Applied Science
in Materials Engineering
Examining Committee:
Dr. Warren J. Poole, Materials Engineering
Supervisor
Dr. Chad W. Sinclair, Materials Engineering
Supervisory Committee Member
Dr. Rebecca Schaller, Materials Engineering
Supervisory Committee Member

iii
ABSTRACT
The mechanical behaviour of AA6082 is a function of the extrusion conditions and in particular,
the quench rate after extrusion. Controlling the quench rate after extrusion can affect the
microstructure evolution to produce desirable mechanical properties for application in structural
components for the automotive industry, and is therefore a key parameter of interest. In this study,
a near industry alloy similar to automotive grade AA6082 containing 0.5 wt.% Mn and 0.15 wt.%
Cr was direct chill (DC) cast, homogenized for 2 hours at 550 °C, and extruded at a temperature
of 500 °C with a ram speed of 8 mm/s to form 3 mm x 42 mm strips. The microstructure in the as-
extruded strip was unrecrystallized due to the Smith-Zener drag from the Mn/Cr dispersoids.
Furthermore, when the as-extruded strip was cold rolled prior to heating, recrystallization occurred
concurrently with the solution treatment. This allowed for 3 initial microstructures to be produced,
i.e. unrecrystallized, and recrystallized with a grain size of 9 and 40 µm.
The aim of the study was to measure the quench sensitivity for the 3 different initial grain structures
after solution treatment at 560 °C for a sufficient time to dissolve the Mg-Si precipitates, followed
by cooling at rates between 4 and 2000 °C/s. Controlled cooling experiments within this
temperature range were conducted using the Gleeble 3500 thermomechanical simulator. The
relationship between quench rate and precipitation of Mg-Si phases on heterogeneous nucleation
sites were analyzed qualitatively by FEGSEM, as well as their effect on mechanical properties
such as yield stress, ultimate tensile stress and fracture properties which were characterized by
tensile tests. It was found that the yield stress decreased as the quench rate decreased, and that the
unrecrystallized material had a much larger quench sensitivity with respect to the recrystallized
initial microstructures, speculated to arise from its high density of heterogeneous nucleation sites.

iv
LAY SUMMARY
As the automotive industry strives to reduce fuel consumption and emissions, there is a continuous
effort to produce lighter vehicles. AA6082 series aluminum alloys are of particular interest for
application in the automotive industry due to their light weight, mechanical properties and
reasonable cost. In this study, near industry alloy similar to automotive grade AA6082 containing
manganese and chromium additives were direct chill cast and extruded with an initial
unrecrystallized microstructure. Microstructure evolution is known to be a function of extrusion
conditions, mainly the quench rate after extrusion. This systematic experimental study therefore
examined the effect of quench rate on precipitation of Mg-Si phases on heterogeneous nucleation
sites for different initial microstructures, and the influence on mechanical properties (strength and
ductility) for quench rates between 4-2000 °C/s. It was found that the quench sensitivity was
attributed to precipitation of Mg-Si phases on the highly elongated grain boundaries.

v
PREFACE
The experimental design, data collection, and analysis was conducted by Neda Sarmady at the
Department of Materials Engineering at The University of British Columbia, with the guidance of
supervisor, Dr. Warren J. Poole. The material used throughout this project had been direct chill
cast, extruded and homogenized by Rio Tinto Aluminium and provided to us by Dr. Nick Parson.
Furthermore, the EBSD work has been conducted in collaboration with Dr. Zhijun Zhang and
Mojtaba Mansouri from the Microstructure Group at the Department of Materials Engineering at
the University of British Columbia.
Some of the experimental results and discussion have been included in a paper on “The Influence
of Quench Rate on the Mechanical Behaviour of AA6082,” written by N. Sarmady, W. J. Poole,
N.C. Parson, and Mei Li in January 2018; accepted for publication in the ICAA16 (International
Conference on Aluminum Alloys).

vi
TABLE OF CONTENTS
ABSTRACT .............................................................................................................................. ii
LAY SUMMARY ...................................................................................................................... iv
PREFACE ................................................................................................................................... v
TABLE OF CONTENTS ........................................................................................................... vi
LIST OF TABLES ..................................................................................................................... ix
LIST OF FIGURES .................................................................................................................... x
LIST OF SYMBOLS ................................................................................................................ xv
LIST OF ABBREVIATIONS................................................................................................... xvi
ACKNOWLEDGEMENTS..................................................................................................... xvii
1 INTRODUCTION.................................................................................................................... 1
2 LITERATURE REVIEW ......................................................................................................... 4
2.1 Overview of 6xxx Aluminum Alloys .................................................................................4
2.2 Chemical Composition ......................................................................................................5
2.3 Fundamentals ....................................................................................................................7
2.3.1 Precipitation Theory ...................................................................................................7
2.3.2 Observations on Precipitation on Defects .................................................................. 10
2.3.3 Precipitation Sequence .............................................................................................. 12
2.3.4 Precipitation Strengthening ....................................................................................... 13
2.3.5 Fracture .................................................................................................................... 15
2.4 Microstructural Evolution ................................................................................................ 17
2.4.1 As-Cast Initial Microstructure ................................................................................... 18
2.4.2 Homogenization ....................................................................................................... 19

vii
2.4.3 Reheat and Extrusion ................................................................................................ 22
Quench Sensitivity ............................................................................................................ 23
2.4.4 Age Hardening.......................................................................................................... 25
3 SCOPE AND OBJECTIVES .................................................................................................. 26
3.1 Project Scope ................................................................................................................... 26
3.2 Objectives ....................................................................................................................... 26
4 EXPERIMENTAL METHODOLOGY .................................................................................. 28
4.1 Initial Material ................................................................................................................. 28
4.2 Thermomechanical Processing......................................................................................... 28
4.2.1 Cold Rolling and Annealing ...................................................................................... 28
4.2.2. Solution Treatment .................................................................................................. 29
4.2.3. Gleeble Testing ........................................................................................................ 30
4.2.4. Artificial Aging ....................................................................................................... 32
4.3 Characterization .............................................................................................................. 32
4.3.1 Optical Microscopy .................................................................................................. 32
4.3.2 Scanning Electron Microscopy (SEM) ...................................................................... 33
4.3.3 Electron Backscatter Diffraction (EBSD) .................................................................. 34
4.3.4 Electrical Resistivity Measurements .......................................................................... 35
4.3.5 Hardness Testing Measurements ............................................................................... 36
4.3.6 Tensile Testing ......................................................................................................... 36
5 RESULTS AND DISCUSSION ............................................................................................. 38
5.1 Initial Material ................................................................................................................. 38
5.2 Effect of Holding Time at 560 °C .................................................................................... 42

viii
5.2.1 Optical Microscopy .................................................................................................. 42
5.2.2 Hardness and Resistivity Measurements ................................................................... 44
5.3 Effect of Grain Structure on Quench Sensitivity .............................................................. 50
5.3.1 Different Initial Grain Structures ............................................................................... 50
5.3.2 Characterization of the Thermal Treatments .............................................................. 52
5.3.3 Observations on Precipitates during Quench ............................................................. 55
5.3.4 Tensile Tests ............................................................................................................. 58
5.3.5 Summary of Mechanical Properties........................................................................... 62
5.3.6. Fracture surfaces ...................................................................................................... 74
6 SUMMARY AND FUTURE WORK ..................................................................................... 77
REFERENCES ......................................................................................................................... 80

ix
LIST OF TABLES
Table 2-1 – Effects of increasing common elements on aluminum alloy properties [4] ................6
Table 2-2 Summary of frequently used 6000 series aluminum alloys containing constituent
particles .................................................................................................................................... 19
Table 2-3 Summary of frequently used 6000 series aluminum alloys containing dispersoids ..... 21
Table 2-4 - Composition of alloys studied (wt%) [8] ................................................................. 24
Table 4-1 – Chemical composition of as-received alloy (wt %) ................................................. 28
Table 4-2 – Helium gas pressure to use for desired quench rates................................................ 31
Table 5-1 Volume fraction (%) of texture component for various holding times at 560 °C......... 47
Table 5-2 Average sub-grain size diameter for various holding times at 560 °C......................... 49

x
LIST OF FIGURES
Figure 2-1 - Graph of Mg and Si content for various 6000 series Al alloys [1] .............................5
Figure 2-2 – Heterogeneous nucleation and the need to consider a shape factor [9] .....................8
Figure 2-3 – TTP plot to schematically show the effect of heterogeneous nucleation sites (from
dispersoids) and the effect of the reduced amount of solute [12] ..................................................9
Figure 2-4 – Electron micrograph of nucleation sites in an Al-Zn-Mg-Cu: a) nucleation at
dislocation (x70,000) b) grain boundary precipitation resulting in a precipitate free zone (PFZ)
(x59,200) [9] ............................................................................................................................. 10
Figure 2-5 –Precipitate free zone around the grain boundary [2] ................................................ 11
Figure 2-6 - Dependence of PFZ width with respect to vacancy concentration and quench rate
[9] ............................................................................................................................................. 12
Figure 2-7 - Typical aging curve (at 200 °C) for 6000 series Al alloy [1]................................... 15
Figure 2-8 – Growth of voids which leads to transgranular (left) and intergranular fracture (right)
under tensile stresses [18] .......................................................................................................... 16
Figure 2-9 – Schematic representation of the deformation process [5] ....................................... 16
Figure 2-10 - Temperature/time history graph during extrusion process1 [1] ............................. 17
Figure 2-11 SEM images of a given AA6005 alloy: a) as-cast sample containing plate like β-
AlFeSi phase and b) sample after homogenization at 590 °C for 32 h containing spheroidized α-
Al(FeMn)Si phase [31].............................................................................................................. 20
Figure 2-12 AA6082 alloy: homogenization at 550 °C for 2 hours, extruded at 500 °C with a
ratio of 70:1, at 8mm/s - containing: a) 0 wt% Mn b) 0.25 wt% Mn c) 0.5 wt% Mn .................. 23
Figure 2-13 – Hardness vs. Quench Rate [8].............................................................................. 25

xi
Figure 4-1 – a) Gleeble testing sample geometry and b) subsequent tensile testing sample
geometry ................................................................................................................................... 30
Figure 4-2 – Gleeble testing set up ............................................................................................ 31
Figure 4-3 – Sample sectioning: defining the ED x ND plane .................................................... 34
Figure 4-4 – Shear tensile fracture mode with projected area perpendicular to load ................... 37
Figure 4-5 – As-cast: a) anodized microstructure observed under polarized light with an optical
microscope b) FEGSEM micrograph of constituent particles (results from PhD thesis of Liu
[50]) .......................................................................................................................................... 38
Figure 4-6 – FEGSEM micrographs of: a) constituent particles as homogenized at 550 ºC for 2 h
b) dispersoids as homogenized at 550 ºC for 2 h taken from reference [50] ............................... 39
Figure 4-7 – As-extruded initial microstructure showing elongated sub-grains along the extrusion
direction a) anodized micrograph by optical microscopy b) EBSD map near the center of the
extrudate ................................................................................................................................... 40
Figure 4-8 – Higher magnification EBSD Maps: a) IPF Map outlining HAGB and LAGB b) IQ
Map .......................................................................................................................................... 41
Figure 4-9 – Optical microscope images (100x magnification) of as extruded sample after
various amounts of time at solution treatment temperature of 560 °C: a) 1 minute b) 10 minutes
c) 100 minutes ........................................................................................................................... 43
Figure 4-10 – Optical microscope images (100x magnification) of as extruded sample after 24
hours at the solution treatment temperature of 560 °C: a) near sample surface b) through
thickness ................................................................................................................................... 43

xii
Figure 4-11 – Measurements after time spent at 560 °C in the salt bath for 3 different conditions
(immediately after heat treatment, after 24 hours and after 1 week) for average measured values
of: a) hardness values and b) resistivity measurements .............................................................. 44
Figure 4-12 – EBSD IPF maps (left) and pole figures (right) of the as-extruded samples (taken
from the center of the strip) after various holding times at 560 °C: a) as-extruded (0 minutes) b) 1
minute c) 2 minutes d) 5 minutes e) 10 minutes ......................................................................... 46
Figure 4-13 – Volume fraction of texture components ............................................................... 47
Figure 4-14 – EBSD equivalent sub-grain size distribution by number fraction versus diameter of
grains for the as extruded sample after various amounts of time at solution treatment temperature
of 560 °C: a) as-extruded (0 minutes) b) 1 minute c) 2 minutes d) 5 minutes e) 10 minutes ....... 48
Figure 4-15 – The misorientation profile showing the misorientation angles between the current
point and the original point in the direction normal to the extrusion direction ............................ 50
Figure 4-16 – Summary of EBSD results for different grain sizes after cold rolling: a)
unrecrystallized, 560 °C 5 minutes b) recrystallized 9 µm, 560 °C 5 minutes + 80 % cold roll c)
recrystallized 40 µm, 560 °C 5 minutes + 30 % cold roll ........................................................... 51
Figure 4-17 – Summary of pole figures for different grain sizes after cold rolling: a)
unrecrystallized, 560 °C 5 minutes b) recrystallized 9 µm, 560 °C 5 minutes + 80 % cold roll c)
recrystallized 40 µm, 560 °C 5 minutes + 30 % cold roll ........................................................... 52
Figure 4-18 – Homogenization in salt bath followed by water quench or air cool for different
microstructures.......................................................................................................................... 52
Figure 4-19 – Temperature profile from gleeble testing with after solution treatment and helium
gas quench ................................................................................................................................ 53

xiii
Figure 4-20 – a) temperature profile from Gleeble testing during holding b) controlled cooling
rates achieved between 400 ºC and 300 ºC ................................................................................ 54
Figure 4-21 – a) mole fraction of Mg2Si particles at different temperatures, obtained by Thermo-
Calc b) higher magnification plot near the solvus temperature ................................................... 54
Figure 4-22 –FEG-SEM images for a) water quench and b) air cooled sample (no artificial aging,
T4) ............................................................................................................................................ 56
Figure 4-23 – T6 FEG-SEM images for various cooling rates: a) water quench b) 80 C/s c) 10
C/s d) air cooled ........................................................................................................................ 57
Figure 4-24 – Failure Modes and fracture surfaces for T6 and T4 tempers of different initial grain
structures. *Note that 80 C/s broke off where thermocouple was attached and the point was
removed in the data analysis. ..................................................................................................... 58
Figure 4-25 – T4 Tensile testing results (engineering stress-strain curves on the left and true
stress-true strain curves on the right): a) unrecrystallized b) recrystallized – 9 µm c)
recrystallized – 40 µm ............................................................................................................... 60
Figure 4-26 – T6 Tensile testing results: a) unrecrystallized b) recrystallized – 9 µm c)
recrystallized – 40 µm ............................................................................................................... 61
Figure 4-27 – T4 Results: a) measured yield stress and b) change in yield stress from water
quench condition ....................................................................................................................... 63
Figure 4-28 – T4 Results: a) measured ultimate tensile stress and b) change in ultimate tensile
stress from water quench condition ........................................................................................... 65
Figure 4-29 – T6 Results: a) measured yield stress and b) change in yield stress from water
quench condition ....................................................................................................................... 67

xiv
Figure 4-30 – T6 Results: a) measured ultimate tensile stress and b) change in ultimate tensile
stress from water quench condition ........................................................................................... 68
Figure 4-31 – T4 Results: a) true fracture stress and b) true fracture strain ................................ 70
Figure 4-32 – T6 Results: a) true fracture stress and b) true fracture strain................................. 71
Figure 4-33 – T4 Results: a) true fracture stress vs. yield stress and b) true fracture stress vs. true
fracture strain ............................................................................................................................ 73
Figure 4-34 – T6 Results: a) true fracture stress vs. yield stress and b) true fracture stress vs. true
fracture strain ............................................................................................................................ 74
Figure 4-35 – T4 Fracture surfaces for various cooling rates: a) air cooled b) 10 C/s c) 25 C/s d)
80 C/s e) water quench (inset is the measure of the true fracture strain) ..................................... 75
Figure 4-36 – T6 Fracture surfaces for various cooling rates: a) air cooled b) 10 C/s c) 25 C/s d)
80 C/s e) water quench (inset is the measure of the true fracture strain) ..................................... 76

xv
LIST OF SYMBOLS
Symbol Definition
b Temperature dependent Burger’s vector (m)
D Diffusion coefficient (m2s-1)
F Force (N)
f Volume fraction
𝑓(𝜃) Shape factor
G Shear modulus (GPa)
∆G Driving force for nucleation
k Boltzmann constant (Pa·m3K-1)
L Average spacing between precipitates and
dislocations (m)
M Taylor factor
N Precipitate Density
R Universal gas constant (Jmol-1K-1)
r Average particle radius (m)
T Temperature (K)
V Volume of precipitate (m3)
Angle between heterogeneous nuclei and defect
ppt Stress caused by precipitates (MPa)
𝜀 Strain
τ Shear stress (MPa)
ρ Electrical resistivity (nΩm)
γ Electrical conductivity (MS/m)

xvi
LIST OF ABBREVIATIONS
Abbreviation Definition
BCC Body Centered Cubic
CI Confidence Index
DC Direct Chill
ED Extrusion Direction
EBSD Energy Dispersive X-ray spectroscopy
FCC Face Center Cubic
FEGSEM Field Emission Gun Scanning Electron
Microscope
HAGB High Angle Grain Boundary
LAGB Low Angle Grain Boundary
ND Normal Direction
SE Secondary Electron
SC Simple Cubic
SDAS Secondary Dendrite Arm Spacing
SSS Supersaturated Solid Solution

xvii
ACKNOWLEDGEMENTS
This work would not have been possible without the support and encouragement of mentors,
colleagues, family and friends. First and foremost, I would like to thank my supervisor Dr. Warren
J. Poole (Department Head of Materials Engineering at the University of British Columbia) for his
guidance, continued support, and for setting an excellent example as a researcher, mentor and role
model.
I would also like to thank Dr. Nick Parson (Rio Tinto Aluminium Research Liaison), Dr. Marry
Wells (University of Waterloo Research Collaborator), and Dr. Mei Li (Ford Motor Company
Research Chair) for their support and encouragement throughout this project.
Thanks also to Ford Motor Company, Rio Tinto Aluminium, The University of British Columbia,
and NSERC Canada for this opportunity and for their contributions.
Next, I would like to thank the PhD and post-doctoral fellows of the Microstructure Group at the
University of British Columbia for all of their support, advice and contribution at our weekly
meeting. Special thanks to Zhijun Zhang, Mojtaba Mansouri, Jingqi Chen, Chenglu Liu and Ali
Khajezade for sharing their knowledge and for their guidance in performing EBSD work.
Thanks also to the friendly faculty and staff of the Department of Materials Engineering, including
the many amazing, inspiring professors, the machine shop and office staff.
To my Mom, Dad, grandparents and family, thank you for your encouragement, love and support.

xviii
DEDICATION
To my mom and dad.

1 INTRODUCTION
Aluminum alloys are used across a wide range of applications, mainly due to their light weight,
mechanical properties, and reasonable cost. This is especially true in the automotive industry
where there is a continuous effort to produce lighter vehicles to reduce fuel consumption/emissions
and to enable alternative propulsion systems such as electric vehicles. For example, industry
partner Ford Motor Company achieved ≈700 pounds in weight savings in the 2015 Ford F150
compared to the 2014 version of the vehicle, due to the extensive use of aluminum in the structure
and skin panels of the truck. The structure has a mix of aluminum sheet, extrusions and cast alloys.
One area of current research/interest is the performance of aluminum extrusions in applications
such as crush tubes, side rails and other structural parts. These components experience a
combination of bending, stretching and folding both during plastic forming of the part and
potentially in service, e.g. crash of a vehicle. There is a need to have detailed information on the
influence of processing on final material properties such as the yield stress and the fracture
properties.
The focus of this study has been on an extruded near industry alloy similar to automotive grade
6082 series aluminum alloys which are widely used in vehicles such as the F150. These alloys
usually contain magnesium and silicon which are strengthened through the formation of Mg-Si
precipitates i.e. β” (smallest, rod-shaped precipitate and largest contributor to mechanical
properties), β’and β Mg2Si (larger in size, cube shaped, and does not contribute to mechanical
properties). The alloys also contain manganese and chromium additions which form precipitates
(20-100 nm in radius), known as dispersoids, and can be used to control recrystallization after
extrusion. These alloys are processed by direct chill (DC) casting, homogenization, extrusion and
aging, as discussed in the following sections.

2
Direct chill casting is used to produce extrusion billets. This is done either by vertical direct chill
(VDC) casting, or horizontal direct chill (HDC) casting. VDC allows for production of billets that
are larger in diameter (>100 mm) and require a more uniform microstructure. HDC casting on the
other hand is typically used in small scale operations to produce billets with diameters of <100
mm [1]. During casting, the molten aluminium is poured into a mould and solidification begins as
it comes into contact with the cooled mould wall. The cast is further cooled by a curtain of water
until it is completely solidified.
The as-cast billets have a segregated microstructure and a number of non-equilibrium phases. As
such, the billets undergo a homogenization heat treatment. The homogenization process involves
heating the billets to temperatures of ≈550-580 °C, holding for several hours, followed by
relatively slow cooling to room temperature [1].
Fine precipitates (20-100 nm in radius) known as dispersoids are formed during the hold and then
during the cooling, there is precipitation of a uniform distribution of β' and β'' Mg2Si precipitates
that can easily be dissolved during extrusion. The homogenization process is designed to modify
the as-cast structure and allow for a high quality surface finish and desirable mechanical properties
during the subsequent thermomechanical processes.
After homogenization, the direct extrusion process is commonly used for 6000 series alloys. This
process involves pushing a billet through a stationary die, at temperatures of ≈450-500°C and at
ram speeds of 3-10 mm/s [1]. The extrusion process changes i) the shape of the material, ii)
modifies the grain structure and iii) dissolves Mg-Si precipitates into a solid solution.

3
These aluminum alloys are typically heat-treatable and gain a significant fraction of their strength
through precipitate hardening [2]. Typically, the solution treatment is combined with the extrusion
process and as such, the cooling process after extrusion is of critical importance.
The current project is part of a larger research program with Ford Motor Company and Rio Tinto
Aluminium to develop a through process model for predictions on the effort of various processing
parameters on the fixed mechanical response of the alloy. For this study, the key parameter of
interest is the effect of the cooling rate on Mg-Si phases on heterogeneous nucleation sites (grain
boundaries, dispersoids and dislocations) and their influence on formability and ductility.
To examine the effect of cooling rate after extrusion on the mechanical properties of the extruded
near industry alloy similar to automotive grade AA6082, the quench sensitivity will be studied for
different initial grain structures (an unrecrystallized alloy and recrystallized alloys with two
different grain sizes) for cooling rates of 4-2000 °C/s. The material of interest was an AA6082
alloy which had been DC cast and extruded at a temperature of 500 °C with a ram speed of 8 mm/s
to form 3 mm x 42 mm strips. As the cooling conditions after extrusion were not well
characterized, the alloy was solution treated and then the cooling rate was controlled to conduct a
systematic study. The alloy was then either left to naturally age for 7 days or was artificially aged
at 180 °C for 4 hours to form the peak aged condition. The relationship between the quench rate
and precipitation of Mg-Si phases on heterogeneous nucleation sites were studied qualitatively
using FEG-SEM images. Their mechanical properties (strength and ductility) were measured by
tensile testing and a preliminary study on the fracture surfaces was conducted.

4
2 LITERATURE REVIEW
This section will provide a general overview of the 6xxx aluminum alloys, discuss their chemical
composition, and provide a review of the relevant fundamental of precipitates and precipitation
strengthening. Further, the microstructural evolution of these alloy during the processing stages
will be discussed since the control of microstructure and precipitation during cooling is important
as it will affect mechanical properties of the final parts, both in terms of the strength and the
ductility [3-5].
2.1 Overview of 6xxx Aluminum Alloys
There has been a large amount of research on extruded Al-Mg-Si 6000 series aluminum alloys, as
they offer a good combination of strength, corrosion resistance, and formability at a reasonable
cost. These alloys have additions of magnesium and silicon and fall in the class of heat treatable
alloys. They offer not only desirable final mechanical properties such as strength and ductility, but
also provide a reasonable processing window which allows production of sheet and extrusions at
high production rates. They obtain their strength through thermal processing (sometimes in
combination with mechanical deformation). The alloys are generally able to obtain maximum
strength from the precipitation of nanometer sized particles which form from the decomposition
of a supersaturated solid solution. The formation of a supersaturated solid solution is typically
produced from a solution treatment followed by a quench.

5
2.2 Chemical Composition
The main alloy additions in 6xxx alloys are magnesium and silicon. They play a prominent role in
the mechanical properties of the alloy since they combine to form the various metastable
precipitates/phases which are the main source of precipitation hardening. The amount of Mg and
Si additions determines their potential peak strength, generally in the range of 250-350 MPa. Mg
is usually within the range of 0.20 to 1.20 wt.% and the Si is between 0.20 and 1.25 wt.% as shown
in Figure 2-1 for a variety of common 6xxx alloys [1]. The line on the left in Figure 2-1 signifies
a balanced composition for Mg2Si, as it was thought in early literature to be the composition of the
particle which give the alloy its peak strength. In recent literature however, it is has been shown
that the main strengthening phase is Mg5Si6 [6], and therefore a second line (dotted, blue) has been
drawn.
Figure 2-1 - Graph of Mg and Si content for various 6000 series Al alloys [adapted from 1]
Other alloying elements can be added to further enhance the mechanical properties of the alloy.
Typical alloying elements in the 6000 series alloys besides Mg and Si include manganese (Mn),
chromium (Cr), and iron (Fe). Table 2-1 summarizes their effects on the extrudability, quench
sensitivity, strength, hardness, ductility and toughness.

6
Table 2-1 – Effects of increasing common elements on aluminum alloy properties [1]
ELEMENTS Extrudability Quench Sensitivity Strength/ Hardness Ductility/ Toughness
Mg (Mg2Si) Decrease Increase Increase Decrease
Excess Si Slight Decrease Slight Increase Increase Decrease
Mn Slight Decrease Slight Increase No/Little Effect Increase
Cr Decrease Slight Increase No/Little Effect Increase
Fe Slight Decrease No Effect No Effect Slight decrease
Based on Table 2-1, the Mg2Si precipitates allow the 6000 series alloys to achieve increased
strength and hardness, with decreased ductility and extrudability. It is important to note that Mg-
Si precipitates are also responsible for the increase in quench sensitivity which ultimately affects
the material’s mechanical properties, making quenching one of the most critical steps in the heat
treatment process which will be discussed in detail in later sections. The table also shows that
when Si levels are above what is required for Mg2Si precipitates, known as excess Si, the strength
and ductility of the alloy remain the same as they did with balanced Mg and Si, but it is not as
sensitive to quenching and the extrudability is only slightly decreased, which can be preferable in
some applications noting, however, that Si can precipitate on the grain boundaries and cause
embrittlement [2, 7].
Aluminum alloys containing chromium (Cr) also have negligible effects on the strength of the
alloy but are currently in demand in the automotive industry, much like manganese (Mn), as they
are added to prevent recrystallization and grain growth during and after extrusion of high strength
aluminum alloys. Another benefit is that fracture toughness can be improved with the additions of
Cr or Mn as it helps to prevent the nucleation of Si at the grain boundaries (which makes the
material more brittle) [8].

7
2.3 Fundamentals
2.3.1 Precipitation Theory
When a solid solution is cooled to temperatures below the solvus temperature, there is a driving
force for nucleation and precipitation (∆𝐺 ). When nucleation occurs without any preferential
nucleation sites, it is known as homogeneous nucleation, and has a driving force that can be
described by the following relationship [9]:
∆𝐺ℎ𝑜𝑚 = −𝑉(∆𝐺𝑣 − ∆𝐺𝑠) + 𝐴𝛾 2-1
Where V is the volume of the nucleating phase created, ∆𝐺𝑣 is the volumetric change in the free
energy, ∆𝐺𝑠 is the misfit strain energy per unit volume of the nucleating phase, and A is the area
of the interface between the matrix and the second phase with an interfacial free energy per unit
area (𝛾).
The free energy change associated with homogeneous nucleation of a particle with radius (r) is
such that at a critical radius (𝑟∗) there will be a maximum of excess free energy. When r < 𝑟∗ the
particles are unstable and are known as clusters, and when r > 𝑟∗ they are known as nuclei.
𝑟∗ =2𝛾
(∆𝐺𝑣−∆𝐺𝑠) 2-2
Therefore, the maximum free energy required for homogenous nucleation is known as the
activation energy barrier (∆𝐺ℎ𝑜𝑚∗ ):
∆𝐺ℎ𝑜𝑚∗ =
16𝜋𝛾3
3(∆𝐺𝑣−∆𝐺𝑠)2 2-3
In practice, the precipitation of the second phases is assisted by defects such as grain boundaries,
dislocations and other pre-existing second phases. This is known as heterogeneous nucleation and

8
is the most common form of nucleation in commercial aluminum alloys, and can be described by
the following relationship [9]:
∆𝐺ℎ𝑒𝑡 = −𝑉(∆𝐺𝑣 − ∆𝐺𝑠) + 𝐴𝛾 − ∆𝐺𝑑 2-4
Where Gd is the free energy that is released when nucleation results in the destruction of a “defect.”
Further, the maximum free energy required for heterogeneous nucleation is similar to the one for
homogeneous nucleation, besides being affected by a shape factor 𝑓(𝜃) (since it is now in contact
with a defect or the mould and can no longer be assumed to be a perfect sphere). This relationship
is shown in Figure 2-2 and described by Equations 2-5 and 2-6 [9].
Figure 2-2 – Heterogeneous nucleation and the need to consider a shape factor [9]
∆𝐺ℎ𝑒𝑡∗ =
16𝜋𝛾3𝑓(𝜃)
3(∆𝐺𝑣−∆𝐺𝑠)2 2-5
𝑓(𝜃) =1
2(2 + 𝑐𝑜𝑠𝜃)(1 − 𝑐𝑜𝑠𝜃)2 2-6
When nucleation is considered simultaneously with growth, the nucleation rate would be
considered with respect to the precipitate density and the evolution of mean radius over time (as a
combination of the growth of existing precipitates and the newly emerging precipitates nucleating
with a radius 𝑟∗) [10]:
𝑑𝑁
𝑑𝑡|
𝑛𝑢𝑐𝑙𝑒𝑎𝑡𝑖𝑜𝑛= 𝑁0𝑍𝛽∗𝑒𝑥𝑝 (
∆𝐺∗
𝑘𝑇) 𝑒𝑥𝑝 (−
𝜏
𝑡) 2-7

9
Where N is the precipitate density, 𝑁0 is the number of atoms per unit volume, Z is the Zeldovich’s
factor (≈1/20), 𝛽∗ ∝ 𝑟∗2 and 𝜏 = 1/2𝛽∗𝑍 [10].
In commercial 6xxx series alloys, “defects” which can become heterogeneous nucleation sites
include excess vacancies, dislocations/constituent particles, and grain boundaries [11]. For
example, the Mn and Cr containing dispersoids in 6xxx series alloys can provide a significant
number of nucleation sites [11]. Figure 2-3 summarizes this effect schematically in a temperature,
time, transformation plot in which the C shaped curve represents the critical amount of time
required at each temperature to achieve a transformation. The C shaped nature of the plot is typical
for precipitation controlled by diffusion. Here, nucleation rates are low at high temperatures due
to low driving force, and small at lower temperatures due to a reduced diffusivity. In 6xxx series
aluminium alloys an increase in nucleation sites (such as more dispersoids or grain boundaries),
shifts the curve towards shorter amounts of time required for the same processes. Furthermore,
reducing the solute content (i.e. lowering the driving force Gv) would shift the curve towards lower
required temperatures and longer times.
Figure 2-3 – TTP plot to schematically show the effect of heterogeneous nucleation sites (from dispersoids) and the effect
of the reduced amount of solute [8]

10
2.3.2 Observations on Precipitation on Defects
There is often a competition for precipitation between heterogeneous nucleation sites (such as
dislocations and grain boundaries) and bulk precipitation. The implication of this competition is
that solute lost to heterogeneous nucleation sites is not available for bulk precipitation and thus,
the volume fraction of the strengthening phase is reduced resulting in a lower contribution to the
alloy strength (see Section 2.3.3). Figure 2-4 shows micrographs illustrating examples of
heterogeneous nucleation on a) dislocations and b) along the grain boundaries in an Al-Mg-Zn-Cu
alloy.
a) b)
Figure 2-4 – Electron micrograph of nucleation sites in an Al-Zn-Mg-Cu: a) nucleation at dislocation (x70,000) b) grain
boundary precipitation resulting in a precipitate free zone (PFZ) (x59,200) [9]
The Role of Excess Vacancies
The equilibrium concentration of vacancies increases exponentially with temperature. Therefore,
at the solution treatment temperature the equilibrium vacancy concentration will be high, and when
this is followed by a rapid quench there will not be enough time for the equilibrium concentration
to be reached. As a result, an excess vacancy concentration remains and becomes “quenched-in”
[9]. With time, these excess vacancies are able to act as nucleation sites as they tend to form
vacancy clusters or coalesce into dislocation loops. Quenched-in vacancies also tend to speed up
the formation of GP zones at the low aging temperatures and therefore speed up the process of

11
nucleation and encourage growth due to the increased rate at which atoms can diffuse at the aging
temperatures.
Grain Boundaries
Besides dislocations, grain boundaries can also be another sink for excess vacancies. In many
systems, a precipitate free zone (PFZ) has been observed adjacent to grain boundaries [2]. There
are two mechanisms for the formation of precipitate free zones. In the first mechanism, the solute
is transported to the grain boundary with the assistance of the excess vacancies, and then
precipitates on the grain boundary, see Figure 2-4b.
In the second mechanism, presented in Figure 2-5, the grain boundary acts as a sink for vacancies
and as such, the region around the grain boundary quickly achieves the equilibrium vacancy
content at the lower temperature. The absence of a high vacancy concentration in the region around
the grain boundary impedes nucleation [9].
Figure 2-5 –Precipitate free zone around the grain boundary [9]
In addition, Figure 2-6 [9] shows the distribution of vacancies near a grain boundary for a slow
and fast quench. It shows that a critical concentration of vacancies (𝑋𝑣𝑐) is needed for nucleation
of precipitates and therefore the width of the PFZ is related to the quench rate [9].

12
Figure 2-6 - Dependence of PFZ width with respect to vacancy concentration and quench rate [9]
2.3.3 Precipitation Sequence
6xxx alloys are strengthened through precipitation of several metastable phases, produced during
the quench, or by aging, so their composition and therefore their precipitation hardening response
is dependent on the thermal history. The precipitation sequence for Al-Mg-Si alloys is generally
accepted to be [36]:
SSS → solute clusters → GP zones → β'' → β' → β
Where SSS is the supersaturated solid solution that forms after solution treatment, the solute
clusters form during natural aging and involve Mg and Si and the GP zones (Guinier-Preston
zones) form during aging and are made of a coherent matrix and have an unknown crystal structure
with spherical morphology (≈1–3 nm in size) [10]. Further, β is the equilibrium binary phase,
where β'' is the needle shaped precipitate which forms after artificial aging at ≈180 °C and provides
the peak strength. After peak aging the precipitates can grow into the rod shaped β' state and later
the β state which does not contribute to the alloys mechanical properties, and can even be
detrimental due to its large size [2].

13
In early literature it has been suggested that the β'' precipitate was the Mg2Si phase, but recent
studies have shown that the needle-shaped β'' precipitates have a composition of Mg5Si6, with a
monoclinic structure [6]. More detail on the metastable precipitates will be provided in section 2.4
Microstructural Evolution.
2.3.4 Precipitation Strengthening
Precipitation strengthening can be described using dislocation theory since the strength of an age-
hardened alloy is controlled by the interaction of mobile dislocations with precipitates, clusters
and solute atoms. Mobile dislocations in age-hardened alloys interact with obstacles on the glide
plane by a variety of mechanisms including elastic misfit, coherency stresses, modulus difference,
interface creation and anti-phase boundary energy (within the precipitate) [2, 13]. It is usually
difficult to attribute strengthening to a single mechanism. However, an aluminum alloy with a
higher number density of precipitates, or “obstacles” to the dislocations in motion would result in
an increased resistance of the alloy to deformation, and therefore a higher yield stress.
6xxx alloys are primarily strengthened through the precipitation of metastable phases, produced
during natural or artificial aging (at 180 °C). The degree of strengthening, i.e. the contribution to
the yield stress from precipitation hardening (𝜎𝑝𝑝𝑡), is highly dependent on the aging process which
controls the nature of the precipitates such as their size (average radius, r), volume fraction (f), the
interaction force (F) between a precipitate and the dislocation and the average distance (L) between
the precipitates from the center of one to the center of another [14-16]. The precipitation
strengthening is proportional to the interaction force, F and inversely proportional to the precipitate
spacing (L), i.e.:
𝜎𝑝𝑝𝑡 =𝑀𝐹
𝑏𝐿 2-9

14
Where M is the Taylor factor (3.06 for FCC metals), and b is the Burgers vector (0.286 nm) [17].
For needle-shaped β’’ precipitates aligned with the 001 direction the average spacing between
precipitates and dislocations (L) is given by:
𝐿 = (2𝜋
𝑓)
1
2𝑟 2-10
Furthermore, to estimate the strength of precipitates as obstacles to the dislocation motion, it is
often assumed that for shearable precipitates, the strength of the precipitates is directly
proportional to the average radius of the precipitate:
𝐹 = 𝑘𝐺𝑏𝑟 2-11
Where k is a constant, and G is the shear modulus of the aluminum at room temperature (26.9
GPa). Esmaeili et. al. showed that this is applicable for Al-Mg-Si alloys up to the peak strength.
By substituting Equations 2-10 and 2-11 into Equation 2-9, the following relationship for the
precipitate is found:
𝜎𝑝𝑝𝑡 = 𝐶𝑀𝑓1
2 2-12
Where C is constant. The implication of Equation 2-12 is that anything that reduces the volume
fraction of precipitates, such as precipitation of coarse particles on, for example, the grain
boundaries, will lower the final strength. Finally, Figure 2-7 [1] shows a typical aging curve for a
6xxx series alloy, aged at a temperature of 200 °C for up to 10 hours. It can be observed that the
maximum ultimate tensile strength reached at ≈250-300 MPa, after 4 hours of artificial aging when
it is in its β" phase, known as the “peak age” or T6 temper. Beyond 4 hours, precipitates tend to
grow into their β’ and β state (which are probably non-shearable) and the stress decreases. This is
known as over-aging.

15
Figure 2-7 - Typical aging curve (at 200 °C) for 6000 series Al alloy [1]
2.3.5 Fracture
6xxx series aluminum alloys fracture after considerable plasticity. The fracture mode can be
transgranular failure (fracture throughout the grains), or intergranular (fracture that goes along the
grain boundaries. Transgranular and intergranular fracture involve the nucleation, growth and
coalescence of voids as shown in Figure 2-8 [18]. Vasudevan and Doherty discussed the
competition between transgranular and inter granular fracture emphasizing the complexity of
deformation in cases where a PFZ was present (see Figure 2-9) [5]. In general, it has been observed
that intergranular failure leads to lower levels of ductility. Further, it has been confirmed in early
literature, such as the study on the tensile fracture of Al-Zn-Mg alloy aluminum alloys by Embury
and Nes [19] that coarse particles that are located along grain boundaries had a detrimental effect
on the unrecrystallized commercial aluminum alloys, and that higher aging temperatures and/or
longer aging times resulted in larger GB precipitates, causing lower tensile fracture stresses.
Solid Solution (S.S)
S.S + Fine β’’ +
nucleation sites
Peak Aged β’’
β’’ + β’
(Overaged)

16
Figure 2-8 – Growth of voids which leads to transgranular (left) and intergranular fracture (right) under
tensile stresses [18]
Figure 2-9 – Schematic representation of the deformation process [5]
In another study of fracture mechanisms in AA7075 by Kirman [20], the microstructures after
fracture were observed and lower toughness values were found to correlate with fracture surfaces
which contained more “dimples” ie. a more ductile fracture when the material was overaged (ie.
the GB precipitates had more time to age and grow larger), as compared to the underaged
conditions. It was found by TEM micrographs that the size and the spacing of the dimples on the
fracture surface were similar to those of the precipitates along the grain boundaries prior to
fracture. The key finding of this study was consistent with that of Embury and Nes, i.e. an increase
in the size of GB precipitates correlated directly with reduced toughness values.

17
Vasudevan and Doherty conducted an extensive review on microstructural studies of grain
boundary fracture in precipitation hardened aluminum alloys. They suggest that GB fracture was
largely due to the formation of microvoids at locations where large GB precipitates were present,
giving ductile failures with dimples observed on the intercrystalline fracture [5].
2.4 Microstructural Evolution
As previously mentioned, the alloying elements Mg and Si play a significant role in 6000 series
aluminum. This is because they combine to form Mg-Si precipitates which have characteristics
(such as size, volume fraction and shape) that can be controlled through the heat treatment.
Figure 2-10 presents a schematic diagram that shows the temperature/time history graph where the
state of Mg and Si are summarized for the various steps during the extrusion process of the alloys
[1]. The key microstructural features and their evolution through the process will be summarized
in the following section.
Figure 2-10 - Temperature/time history graph during extrusion process1 [1]
β” -

18
2.4.1 As-Cast Initial Microstructure
The majority of as-cast extruded billets are produced by direct chill (DC) casting and have
equiaxed grains with a dendritic structure. In industry, it is known that cooling rates between 1 –
5 ºC/s can lead to non-equilibrium cooling, resulting in both macro and micro segregation. The
formation of constituent particles ( ≈1 µm in diameter) in the interdendritic region, i.e. the last
volume to solidify [8, 21]. Microsegregation of Mg, Si, Mn occurs within the dendrites [8, 21].
The dendrites are supersaturated in Mn and there are two main types of constituent particles (α and
β) that tend to form during cooling and solidification. The nature of the constituent particles are
dependent on the cooling rates and alloy composition [22].
Constituent Particles:
α-Al(MnFe)Si
The α-Al(MnFe)Si could contain Mn or Fe and has a complex chemistry. Cooper et al. [23, 24]
originally determined the crystal structure of this phase to be a simple cubic structure [24]. It was
also found that when Fe replaced Mn, this phase changed to a body centered cubic (BCC) structure
[23]. Generally in as-cast samples, it is found to be in the form of Al19Fe4MnSi2 particles [25] but
the stoichiometry has also been estimated to be α-Al12(FeMn)3Si [26, 27].
β-AlFeSi
The β-AlFeSi has a monoclinic crystal structure, a stoichiometry of Al5FeSi, and a plate shaped
morphology [25, 28]. Although there are other types of Fe bearing constituent particles such as π-
Al8FeMg3Si6 [25, 29, 30] , this study will focus on the α-Al(MnFe)Si and β-AlFeSi to represent
the families of the cubic and monoclinic constituent particles. Table 2-2 presents a summary of
typical constituent phases found in 6000 aluminum alloys.

19
Table 2-2 Summary of frequently used 6000 series aluminum alloys containing constituent particles
Typical Alloys (wt.%) Particle Phase Crystal Structure Source
0.40Mg-0.56Si-0.20Fe
0.39Mg-0.53Si-0.28Fe
β-Al5FeSi
Al19Fe4MnSi2
Monoclinic
BCC
[25]
0.7Mg-0.83Si-0.18Mn-0.27Fe β-Al5FeSi
Al12(FeMn)3Si
Monoclinic
Cubic
[31, 32]
0.46Mg-0.63Si-0.13Mn-0.21Fe β-Al5FeSi
Al12(FeMn)3Si
Monoclinic
Cubic
[33]
2.4.2 Homogenization
In practice, homogenization treatments are conducted after casting and prior to extrusion to reduce
the amount of microsegragation and improve extrudability [34]. 6000 series aluminum alloys
generally require homogenization times of several hours at temperature of 550-590 °C to remove
Mg and Si segregation [34-36]. Alloys that contain Mn and Cr however require longer
homogenization times because of their low diffusivity in the aluminum matrix [36]. The degree of
segregation after solidification depends on the partition coefficient and the solidification
conditions, i.e. growth velocity and thermal gradient. Typically, as-cast specimens with larger
initial grain sizes and larger inter dendrite arm spacing will have longer characteristic diffusion
lengths and it will take them longer to be able to reduce segregation. For example, Liu has shown
that it takes only ≈10 minutes at 560 °C to remove the segregation profiles for Mg and Si in a 6082
based alloy [37].
Transformation of β to α
The plate shaped β-AlFeSi phase particles have been reported to transform into α-Al(FeMn)Si
phases during homogenization in AA6xxx alloys which contain Mn [35, 38]. Concurrent with the

20
phase transformation, there is a change in morphology to a more spherical shape [28]. The
transformation to the α-Al(FeMn)Si phase is believed to improve surface finish and formability
[38]. For extruded products, the addition of the alloying elements Mn and Cr have been found to
modify the type of constituent particles that tend to form during solidification [38] and accelerate
the β to α transformation during homogenization.
The transformation can be qualitatively observed in Figure 2-11 which presents typical SEM
images of β-AlFeSi and α-Al(FeMn)Si phase constituent particles. Figure 2-11a shows the as-cast
sample with plate like β-AlFeSi phases and Figure 2-11b illustrates the microstructure after
homogenization at 590 °C for 32 hours, where the more spheroidized α-Al(FeMn)Si phases are
observed [31]. The kinetics of the β-AlFeSi to α-Al(FeMn)Si transformation is dependent both on
the chemistry and the homogenization [31, 39].
a) b)
Figure 2-11 SEM images of a given AA6005 alloy: a) as-cast sample containing plate like β-AlFeSi phase and b) sample
after homogenization at 590 °C for 32 h containing spheroidized α-Al(FeMn)Si phase [31]
Precipitation of Dispersoids
For alloys containing Mn and Cr, the primary aluminum dendrites are supersaturated in Mn and
Cr after solidification. The low solubility of Mn and Cr leads to precipitation of the α phase during
homogenization. These particles are typically 20-100 nm in radius and are known as dispersoids

21
[8, 12, 40, 41]. A study by Lodgaard and Ryum [42] suggested that the precipitation sequence in
Al-Mg-Si alloys containing Mn, or Mn + Cr, involves the nucleation of α-Al(MnFe)Si dispersoids
on a transition phase of Mg2Si, referred to as the “u-phase”. It was shown that the dispersoids form
on dissolving metastable Mg-Si transition phase in the temperature range of 350 °C to 450 °C
during the heating ramp of homogenization [42-44]. As the temperature continues to increase the
Mg-Si phase dissolves, leaving only the dispersoids.
The sequence of dispersoid precipitation is clearly complex such that heating to the
homogenisation temperature must occur at low rates (< 3 °C/min) to achieve a homogeneous
distribution of dispersoids [43]. Further, the composition, crystal structure and number density of
dispersoids are dependent on the alloy composition. Common dispersoids observed in frequently
used 6000 series aluminum alloys are summarized in Table 2-3..
Table 2-3 Summary of frequently used 6000 series aluminum alloys containing dispersoids
Typical Alloys (wt. %) Particle Phase Crystal Structure Source
0.6Mg-0.94Si-0.22Fe-0.54Mn
0.6Mg-0.92Si-0.22Fe-0.55Mn-0.14Cr
α-Al(MnFe)Si
α-Al(MnCrFe)Si
BCC/SC, a=1.26 nm
BCC/SC, a=1.26 nm
[42]
0.6Mg-0.92Si-0.22Fe-0.14Cr
0.6Mg-0.91Si-0.19Fe-0.32Cr
α-Al(CrFe)Si
α'-AlCrSi for Cr >0.3 wt%
BCC/SC, a=1.26 nm
FCC, a=1.09 nm
[43]
0.5Mg-0.65Si-0.12Fe-0.2Mn α-Al12(MnFe)3Si
α-Al15(MnFe)3Si2 for Mn/Fe >1.6 at%
BCC, a=1.09 nm
SC, a=1.26 nm
[45]

22
2.4.3 Reheat and Extrusion
After homogenization, Mg-Si precipitates are ideally in the form of fine uniform precipitates that
can be dissolved during the reheat prior to or during the extrusion process. During extrusion, the
temperature, strain rate and extrusion ratio are key parameters which control the deformed state
and stored energy. Further, the Mn containing dispersoids are important to control as they tend to
slow down or suppress recrystallization. This is known as the Zener-Smith Effect, and can be
attributed to the Zener pinning pressure caused by drag of the particles on the grain boundaries
i.e.:
𝑃𝑧 =3𝐹𝑣𝛾
2𝑟 2-13
Where FV is the volume fraction of particles, r is the mean radius and γ is the interfacial energy
between the grain boundary and the particle [46]. As an example of the effect of dispersoids, Figure
2-12 illustrates optical microscopy images observed under polarized light of alloys which had
previously been homogenization by Rio Tinto Aluminium at 550 °C for 2 hours, and extruded at
500 °C with a ratio of 70:1, at a rate of 8mm/s. These alloys contained various amounts of Mn
between 0 and 0.5 wt%. The Mn free sample in Figure 2-12a shows equiaxed grains, while the
alloy with 0.25 wt% Mn shows recrystallized surface grains and partially recrystallized grains in
the interior. Finally the alloy with 0.5 wt% Mn shows a thin layer of recrystallized grains on the
surface and an unrecrystallized core.

23
a) b) c)
Figure 2-12 AA6082 alloy: homogenization at 550 °C for 2 hours, extruded at 500 °C with a ratio of 70:1, at 8mm/s -
containing: a) 0 wt% Mn b) 0.25 wt% Mn c) 0.5 wt% Mn
Further, Eivani et al. [47, 48] observed that low temperature homogenization could supress
recrystallization more, as it would produce finer dispersoids with a high number density. Cr
dispersoids are also used to control grain structure and to prevent recrystallization in extruded Al-
Mg-Si alloy [34].
Quench Sensitivity
The objective of quenching is to preserve the solid solution formed at the solution treatment
temperature, by rapidly cooling to a lower temperature. Typical quench rates in industry are
between < 5 °C/s and 100 °C/s. Water quenches with rates of > 1000 °C/s have also been used for
research purposes but are not economically viable for industrial use.
Quench sensitivity, the loss of properties due to reduced quench rates after extrusion, is a particular
problem in these high strength alloys. The solute atoms that precipitate during quenching on
heterogeneous nucleation sites such as grain boundaries, dispersoids, or other particles are
considered as lost for practical purposes, i.e. these course precipitates do not contribute to
strengthening the alloy.

24
Generally, the optimal combination of strength and toughness is obtained from rapid quench rates.
These fast quenching rates also result in better resistance to corrosion and to stress-corrosion
cracking [8]. However, rapid quench rates come at high production costs and may cause warpage
or distortion of extrusions in complex profiles. The maximum attainable quench rate decreases as
the thickness of the product increases. Therefore, the study of predicting how quenching conditions
influence properties is of relevance to industrial process.
A good example of a recent study on quench sensitivity in 6xxx alloys was done by Strobel and
coworkers [8]. In this study, a matrix of common alloys (see Table 2-4) were homogenized at 570
ºC for 2 hours and a modified Jominy-type end quench test was conducted [8].
Table 2-4 - Composition of alloys studied (wt%) [8]
Mn and Cr were added to improve fracture toughness and to impede grain growth during
recrystallization. When combined with iron, these elements formed dispersoid phases during
homogenization.
Figure 2-13 shows results for the hardness (Rc) as a function of cooling rate for the different alloys.
It can be observed that the quench sensitivity is relatively low for AA6060 (containing low Mn
and Cr) and much higher for the higher strength alloys which contain Mn and Cr. This is because
at slower quench rates, the dispersoid phases are able to act as nucleation sites for coarse, non-
hardening Mg-Si precipitates. The reduction in the amount Mg and Si remaining for precipitation
reduces the alloy’s response to age hardening treatments, resulting in lower achievable strength
(see Equation 2-12) [8].

25
Figure 2-13 – Hardness vs. Quench Rate [12]
2.4.4 Age Hardening
Many aluminum alloys exhibit property changes at room temperature after quenching, in particular
in 6xxx series aluminum alloys. This aging or hardening process at room temperature is known as
natural aging, and typically starts immediately after quenching. Natural aging in 6xxx alloys results
in a 2-3x increase in yield stress after several weeks at room temperature [49]. The process
continues albeit at a decreasing rate.
6000 series aluminum alloys can also be artificially aged (e.g. at 180 °C), and this process only
takes several hours to reach peak strength. As mentioned in section 2.3.3 Precipitation
Strengthening, the peak strength is achieved by formation of β'' metastable precipitates.
In summary, the literature shows that there is a complex interaction between the microstructure
and the processing conditions. However, there is a lack of quantitative knowledge that limits the
final mechanical behaviour (both strength and fracture) to the process conditions, in particular the
cooling rate after extrusion.

26
3 SCOPE AND OBJECTIVES
The control of precipitation during cooling after extrusion is important as it affects the final
strength and ductility of the alloy. A key parameter of interest here is to understand the effect of
cooling rate after the solution treatment. In industry, a compromise must be achieved between high
quench rate which is favorable for mechanical properties and a low quench rate which reduces
distortion of the product and has lower costs.
3.1 Project Scope
The scope of this study is on the quench sensitivity of a near industry alloy similar to automotive
grade AA6082 extrusions produced by our industry partner Rio Tinto Aluminium. Three different
initial microstructures were examined; an unrecrystallized alloy and two recrystallized alloys with
different grain sizes. The alloys were all solution treated at 560 °C for a sufficient time to dissolve
the Mg-Si precipitates and then cooling rates between 4 °C/s and 2000 °C/s were imposed on the
samples. After cooling, the samples were either naturally aged (holding at room temperature) for
1 week or artificially aged at 180 °C for 4 hours. The strength and ductility was characterized by
tensile tests while precipitation on heterogeneous nucleation sites and the fracture surfaces were
examined by scanning electron microscopy.
3.2 Objectives
The main objectives of this investigation are:
• To develop process routes such that three different initial microstructures can be produced,
i.e. one unrecrystallized and two recrystallized microstructures with different initial grain
sizes

27
• To characterize the initial microstructures and determine the effect of the holding time at
560 °C on the dissolution of Mg-Si phases and the evolution of the grain structures
• To develop experimental techniques to control the cooling rate after the solution treatment
with the objective to obtain cooling rates between 4 °C/s and 2000 °C/s
• To qualitatively observe the precipitation of Mg-Si phases during cooling using field
emission gun scanning electron microscopy (FEGSEM)
• To characterize the yield stress, ultimate tensile strength and fracture behaviour as a
function of the initial microstructure and cooling conditions

28
4 EXPERIMENTAL METHODOLOGY
This chapter describes the initial material provided for the study and discusses the experimental
techniques used to examine the effect of initial grain structure and the cooling rate after solution
treatment on the mechanical properties of the alloy.
4.1 Initial Material
The initial material was provided by Rio Tinto Aluminium in Jonquiere, Quebec. Aluminum billets
were direct chill (DC) cast with a diameter of ≈100 mm. The chemical composition of the alloy
(AA6082) is given in Table 4-1, as measured by optical emission spectroscopy (OES). The
homogenization heat treatment consisted of heating the billet to 500 °C at a rate of 250 °C/hr,
heating from 500 °C to 550 °C at 50 °C /hr, and holding at 550 °C for 2 hours, followed by a water
quench with the objective of producing a high volume fraction of dispersoids. These homogenized
billets were then extruded on a laboratory scale extrusion press with an initial billet temperature
of 500 °C and a ram speed of 8 mm/s to produce a strip with a dimension of 42 mm by 3 mm.
Table 4-1 – Chemical composition of as-received alloy (wt %)
Alloy Mg Si Mn Cr Fe
0.5Mn 0.14Cr 0.69 1.03 0.50 0.14 0.21
4.2 Thermomechanical Processing
4.2.1 Cold Rolling and Annealing
To modify the initial microstructure, some samples were cold rolled with the use of a laboratory
rolling mill. The aim was to achieve small recrystallized grain sizes of approximately 10 µm, as
well as larger recrystallized grain sizes of around 40 µm. After some experimental trial and error,
it was found that that if the samples were solution treated for 5 minutes at 560 ºC in the salt bath

29
and cold rolled by 30 % or 80 %, a small and larger recrystallized grain size would be obtained
after the subsequent solution treatment. The amount of cold rolling was determined using the
following equation:
% 𝐶𝑅
100=
𝑡𝑖−𝑡𝑓
𝑡𝑖 4-1
Where % CR is the desired percentage to cold roll to, 𝑡𝑖 is the initial thickness of the sample and
𝑡𝑓 is the final sample thickness that must be obtained through cold rolling in ≈10-15 steps to ensure
a uniform thickness.
4.2.2. Solution Treatment
To study the effect of cooling rate on precipitation and therefore on mechanical properties, the
alloy first had to be solution treated at a temperature of 560 °C to re-dissolve the Mg-Si precipitates
into solid solution. The laboratory salt bath was used to determine the appropriate holding time at
this temperature, then used to heat treat the sample followed by a water or air quench to examine
the effect of cooling rate.
Determining Holding Time
To determine the effect of holding time at the solution treatment temperature of 560 °C, small 10
mm x 10 mm samples were sectioned from the center of the extruded strip, and placed in the
laboratory salt bath for 1, 2, 5, 10, and 30 minutes. A box furnace was used for samples which
were left at 560 °C for longer times of 100 minutes and 24 hours. These samples were then water
quenched and examined by optical microscopy, electrical conductivity/resistivity, hardness
measurements, and EBSD as discussed in the following sections.

30
Water Quench and Air Quench
Once the holding time was selected, samples were solution treated and either a) water quenched
by immediately being placed in a 1 L beaker of water at room temperature to obtain a high cooling
rate of ≈2000 °C/s, or b) air cooled by being left at room temperature for ≈1-2 minutes to achieve
a lower cooling rate of ≈4-8 °C/s depending on the thickness of the sample.
4.2.3. Gleeble Testing
The Gleeble 3500 was used for the heat treatment process to obtain controlled cooling rates: 10,
25, and 80 °C/s. The samples were rectangular 12 mm x 82 mm strips cut parallel to the extrusion
direction (Figure 4-1a). These samples were small enough to fit inside the Gleeble without
experiencing any compressive forces during heating, and large enough to be able to machine them
into the 66 mm long tensile testing samples with the sample geometry shown in Figure 4-1b.
a)
b)
Figure 4-1 – a) Gleeble testing sample geometry and b) subsequent tensile testing sample geometry

31
The sample was held at each end by stainless steel grips as shown in Figure 4-2. To conduct this
test, a K-type thermocouple was spot welded to the centre of the sample as a control thermocouple.
To measure the uniformity of the temperature, additional thermocouples were spot welded ±8 mm
from the centre.
Prior to heating, the chamber was pumped down to a vacuum of approximately 3.5x10⁻¹ Torr. The
tank was then back filled with Argon to a pressure of 10 kPa. The heating rate was programmed
to be 5 °C/s until it reached a temperature of 530 ᵒC, and then slower heating rate of 0.5 ᵒC/s to
560 °C to minimize failure of the spot weld for the thermocouples attached to the aluminum
sample. The quench itself was conducted with helium gas flowing at the various pressures to
achieve the different quench rates, as shown in Table 4-2 below.
Table 4-2 – Helium gas pressure to use for desired quench rates
Quench Rate 10 ºC/s 25 ºC/s 80 ºC/s
He Gas Pressure 2 Psi 6 Psi 40 Psi
Note that these were the starting pressures and that the helium input was manually adjusted during
the quench to ensure steady power input from the Gleeble.
Figure 4-2 – Gleeble testing set up
Center
SS grip 8mm away

32
Furthermore, after undergoing quenching in the Gleeble and reaching room temperature, samples
were stored in liquid nitrogen to avoid aging while being transferred from one location to another
or while waiting to be made into tensile testing samples.
4.2.4. Artificial Aging
After the solution heat treatment and quenching, the alloys were either a) artificially aged at 180
ºC in the laboratory oil bath for 4 hours to produce the peak strength (T6), or b) left in the laboratory
at ambient temperature to age naturally for 7 days (T4).
4.3 Characterization
4.3.1 Optical Microscopy
Optical microscopy was done to characterize the microstructure of the samples in the as-received
condition and after the different solution treatment temperatures. The samples for metallographic
observation were cold mounted using ColdCure Resin and Hardener (Volume ratio 2:1) and cured
at room temperature overnight. These samples were then ground using water as a lubricant as
follows: 400 grit paper for a duration of 2 minutes, 800 grit for 5 minutes, and 1200 grit paper until
all visible scratches were removed from the surface. They were then polished using a 6 µm and 1
µm Texmet cloth along with diamond suspension and a microid diamond compound extender as
lubricant, for 15 minutes each, or until scratches visible under the optical microscope had been
removed. For the final polishing, a 0.05µm Chemotexile® cloth was used along with colloidal
silica for a duration of ≈10 minutes until the surface was smooth and reflective.
To anodize the samples, a mixture of 3% Flouroboric acid (48% HBF4 conc.) diluted in distilled
water, known as Barker’s Reagent, was used at room temperature. The set-up consisted of pure
aluminum as the cathode, and the sample itself as the anode. The cathode and anode were then

33
connected to a BK Precision 0-60V, 0-2A DC Power Supply. After placing the sample in the
solution and turning the power supply on, the voltage was set to 30 V DC and the sample was held
there for 110 seconds. The samples were observed under a Nikon Epiphot 300 Optical Microscope
under polarized light. Micrographs of the anodized samples were taken at magnifications of 50x,
200x and 500x using the Clemex Vision PE 6.0 image analysis software.
4.3.2 Scanning Electron Microscopy (SEM)
A Zeiss FEG-SEM was used to collect images of the samples under higher magnification after
heat treatment, for both metallographic observations as well as observation of the fracture surfaces
after tensile testing.
Metallography
To observe the effect of cooling rate on Mg-Si precipitation, samples were sectioned for
metallographic observations from the center of the extrusion in 10 mm x 10 mm sections. They
were polished using 600 grit paper for 2 minutes, 800 grit for 5 minutes, and 1200 grit paper until
all visible scratches were removed from the surface. They were then polished using a 1 µm Texmet
cloth along with diamond suspension and a microid diamond compound extender as lubricant, for
15 minutes or until scratches visible under the optical microscope had been removed. Finally, 0.05
µm Chemotexile® cloth was used along with Colloidal Silica for a duration of ≈10 minutes until
the surface was smooth and reflective.
Polished surfaces were then etched using an etchant containing 150 mL Nitric acid diluted with
350 mL methanol. The etchant was placed in a metal beaker which was connected to a power
supply with a voltage of 9 V, and placed in a larger beaker containing liquid nitrogen. The etchant
solution temperature was monitored until it reached a steady temperature of -20 ᵒC. The sample
was also connected to the power supply and held in the solution for ≈30 seconds.

34
The samples were characterized on the Zeiss FEG-SEM under secondary electron (SE) mode. The
Mn/Cr containing constituent particles and dispersoids were analyzed at a magnification of 10,000
x and the effects of the cooling rate on precipitation of Mg-Si phases were qualitatively examined.
Fracture Surfaces
Fracture surfaces from the tensile tests were also observed using the Zeiss FEG-SEM under SE
mode at various magnifications between 200x and 1000x to see the difference between
ductile/brittle and trans-granular/inter-granular fractures.
4.3.3 Electron Backscatter Diffraction (EBSD)
EBSD was done to characterize the microstructure of the material from the center section of the
Extrusion Direction (ED) and Normal Direction (ND) face of the extrudate as shown in Figure
4-3. Samples were prepared similar to the ones for SEM/metallography, and the Zeiss Σigma FEG-
SEM was used for EBSD.
Figure 4-3 – Sample sectioning: defining the ED x ND plane
Data was collected using the EDAX TSL Orientation Imaging Microscopy (OIMTM) Data
Collection software and processed with EDAX/TSL OIM Analysis (6th edition) software. An
acceleration voltage of 20 kV was used with an aperture size of 60 μm, and a working distance of
≈ 13 mm. The diffraction pattern was captured by the OIM Data collection software with a bin
size of 8 x 8 and capture speed of ≈ 50 fps. To identify the diffraction pattern, only the FCC phase
matrix was indexed and a step size of 200-1500 nm was used for the various cases with a hexagonal
grid.

35
The raw data was analysed using a function in OIM Analysis software and processed by using the
Grain Dilation function to standardize the data and filter out noise as well as a Confidence Index
(CI) Standardization. The CI function is a measure of the confidence of the determined crystal
orientation from the diffraction pattern, and pixels with a CI less than 0.1 were filtered out.
4.3.4 Electrical Resistivity Measurements
Electrical conductivity measurements were taken using a Sigmatest 2.069® (by Foerster
Instrument Inc.) with a probe diameter of 8 mm and a frequency of 60 kHz. The Sigmatest® was
calibrated prior to each measurement using two standards and one air point, allowing the
temperature to stabilize at room temperature before conducting any readings. Prior to the
measurement, each sample was left on a copper block first for one minute. The use of a copper
block was implemented due to its high thermal conductivity and ensure that the sample was at
ambient temperature. The output data was in the form of electrical conductivity (MS/m) which
was converted to electrical resistivity using equation below, where ρ is the electrical resistivity in
nΩm where 𝛾𝐶 is the electrical conductivity measured.
𝝆 =𝟏𝟎𝟑
𝜸𝑪 4-2
The measurements were conducted on samples after solution treatment at 560 ᵒC for the various
selected solution treatment times. These measurements were taken immediately after solution
treatment, after 24 hours, and again after 1 week to see the effect of natural aging.

36
4.3.5 Hardness Testing Measurements
Hardness testing was conducted on the ED x ND plane of the extrudate (as defined by Figure 4-3)
using the Micromet3 micro-hardness machine. A Vickers indenter, a dwell time of 10 seconds and
a load of 200 g were used. The samples were first polished for ≈1 minute using 2400 grit paper to
provide a smoother surface for easier measurement of the indent diameter and the instrument was
calibrated prior to each set of measurements.
4.3.6 Tensile Testing
To quantify how the quench rate affects the mechanical properties, a series of tensile tests were
conducted after the different heat treatments, for the T4 and T6 tempers, with 3 samples per testing
condition. Prior to tensile testing, the surface layer of ≈ 30 µm where large grains were observed
was removed by etching with a 100 g NaOH/L distilled water solution. This surface removal was
done by leaving the sample in the solution at a temperature of 50-60 °C, for 20-50 minutes,
depending on the thickness of the course grain layer. As an example, the as extruded samples were
left for 50 minutes, whereas the 30 % cold rolled samples needed only 20 minutes due to their
coarse grain layer being thinner.
The tensile tests were done with an Instron screw driven machine using the sample geometry
shown in Figure 4-1. A load cell with a capacity of 5 kN and an extensometer with a gauge length
(𝐿) of 12.5 mm were used to collect the load and position of the extensometer. The data from the
extensometer was used to calculate the change in length (𝐿 − 𝐿0) and then the strain (𝜀):
𝜀 =𝐿−𝐿0
𝐿 4-3
From this, the true stress and strain were calculated using equations 4-4 and 4-5.

37
𝝈𝑻 =𝑭
𝑨𝟎(𝟏 + 𝜺) 4-4
𝜀𝑇 = 𝑙𝑛(𝐿/𝐿0) 4-5
In addition, the true fracture stress (𝜎𝑇𝑓) and true fracture strain (𝜀𝑇𝑓
) were calculated using
equations 4-6 and 4-7 based on the final projected fracture area, perpendicular to the load, shown
in Figure 4-4.
𝜎𝑇𝑓= (𝐹𝑓𝑟𝑎𝑐𝑡𝑢𝑟𝑒/𝐴𝑝𝑟𝑜𝑗𝑒𝑐𝑡𝑒𝑑 ) 4-6
𝜀𝑇𝑓= 𝑙𝑛(𝐴𝑝𝑟𝑜𝑗𝑒𝑐𝑡𝑒𝑑 /𝐴𝑖𝑛𝑖𝑡𝑖𝑎𝑙) 4-7
The projected fracture area was calculated using equation 4-8 and is displayed schematically in
Figure 4-4. The area and fracture angle measurements were taken using the ImageJ Software as it
allowed for minimum and maximum possible fracture area measurements as seen on the SEM, as
well as the minimum and maximum measurements of fracture angles (θ).
𝐴𝑝𝑟𝑜𝑗𝑒𝑐𝑡𝑒𝑑 = 𝐴𝑚𝑒𝑎𝑠𝑢𝑟𝑒𝑑 × 𝑐𝑜𝑠 (𝜃) 4-8
Figure 4-4 – Shear tensile fracture mode with projected area perpendicular to load
Projected
Area
𝜃
Load

38
5 RESULTS AND DISCUSSION
This chapter summarizes the results from the experimental work described in the previous chapter.
The results include observations on the initial microstructure, experimental results on the effect of
holding time at the solution treatment temperature of 560 °C, and measurements on the quench
sensitivity for cooling rates of ≈4-2000 °C/s. This includes tensile test results, fractography, and
characterization of precipitation of Mg2Si within the grains or along the grain boundaries.
5.1 Initial Material
Figure 5-1and Figure 5-2 summarize the initial microstructure after casting and homogenization,
respectively1. Figure 5-1a shows an optical microscope image of the as-cast microstructure, under
polarized light, after anodizing [50]. Equiaxed grains with grain size of ≈120 µm were observed
with dendrites within the grains (secondary dendrite arm spacing of ≈20 µm). Figure 5-1b shows
a FEGSEM image of the constituent particles in the as-cast sample, where the long thin particles
are sections of plate shaped β − Al5FeSi particles and the dark phases are Mg2Si.
a) b)
Figure 5-1 – As-cast: a) anodized microstructure observed under polarized light with an optical microscope b) FEGSEM
micrograph of constituent particles (results from PhD thesis of Liu [50])
1 These results are taken from the work of Chenglu Liu, a fellow student also working on this larger project.

39
Figure 5-2 shows FEGSEM backscatter electron images of the alloy after homogenization for 2
hours at 550 °C. It can be observed that spheriodization of the β constituent particles occurred
during homogenization and Liu showed that this corresponded to the β − α − Al(FeMn)Si phase
transformation [50]. Figure 5-2b shows a higher magnification image where the α − AlFeMnSi
dispersoids that precipitated within the primary Al grains during homogenization can be observed.
a) b)
Figure 5-2 – FEGSEM micrographs of: a) constituent particles as homogenized at 550 ºC for 2 h b) dispersoids as
homogenized at 550 ºC for 2 h taken from reference [50]
Liu characterized the constituent particles and dispersoids for the same homogenization treatment
used in this work. He found that the equivalent radius of the constituent particles was 419 nm with
an average aspect ratio of 3.2 and a volume fraction of 0.88 %. For the dispersoids, he found an
equivalent radius of 37 nm and a volume fraction of 1.32 % [50].
Figure 5-3 shows an anodized micrograph under polarized light and an EBSD map for the material
after extrusion. Figure 5-3a shows that the microstructure consists of highly elongated grains
parallel to the extrusion direction, with a thin surface layer of recrystallized grains, approximately
≈30 µm in thickness. The EBSD IPF map in Figure 5-3b presents the as-extruded microstructure
at the center of the extruded strip at a higher magnification.
10 µm
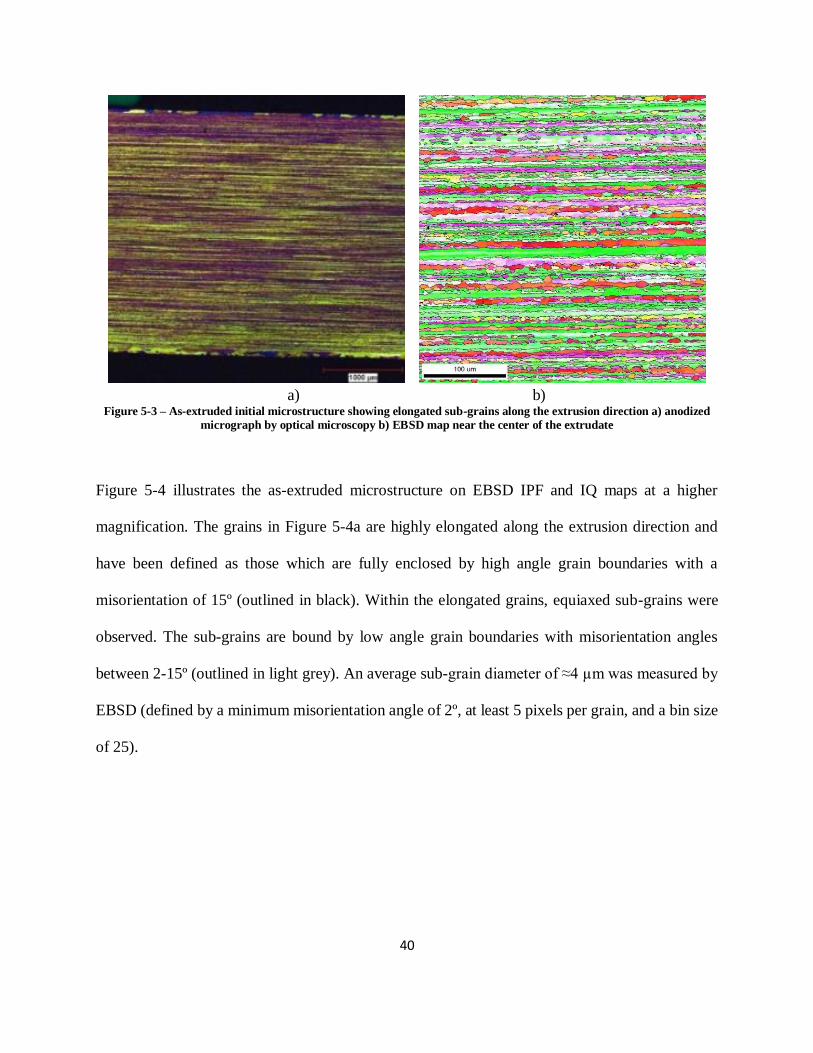
40
a) b)
Figure 5-3 – As-extruded initial microstructure showing elongated sub-grains along the extrusion direction a) anodized
micrograph by optical microscopy b) EBSD map near the center of the extrudate
Figure 5-4 illustrates the as-extruded microstructure on EBSD IPF and IQ maps at a higher
magnification. The grains in Figure 5-4a are highly elongated along the extrusion direction and
have been defined as those which are fully enclosed by high angle grain boundaries with a
misorientation of 15º (outlined in black). Within the elongated grains, equiaxed sub-grains were
observed. The sub-grains are bound by low angle grain boundaries with misorientation angles
between 2-15º (outlined in light grey). An average sub-grain diameter of ≈4 µm was measured by
EBSD (defined by a minimum misorientation angle of 2º, at least 5 pixels per grain, and a bin size
of 25).

41
a)
b)
Figure 5-4 – Higher magnification EBSD Maps: a) IPF Map outlining HAGB and LAGB b) IQ Map
ND
ED

42
5.2 Effect of Holding Time at 560 °C
The holding time at a solution treatment temperature of 560 °C was examined experimentally
through optical microscopy, hardness and resistivity measurements, and EBSD. The objective of
these experiments was to determine the best conditions to fully dissolve Mg-Si precipitates while
minimizing the change in the deformed state.
5.2.1 Optical Microscopy
Figure 5-5 shows optical microscope images of samples anodized with Barker’s Reagent for
various times at the solution treatment temperature of 560 °C: a) 1 minute, b) 10 minutes, and c)
100 minutes. Although there was no visible grain growth up to 10 minutes at the solution treatment
temperature, it was observed that there was some grain growth, both on the surface and within the
sample (see arrow) after a holding time of 100 minutes. On the other hand, Figure 5-6 shows that
after 24 hours at 560 °C, it appears that the structure has fully recrystallized through the thickness
of the sample to very large, highly elongated grains.
50 µm

43
a) b)
c)
Figure 5-5 – Optical microscope images (100x magnification) of as extruded sample after various amounts of time at
solution treatment temperature of 560 °C: a) 1 minute b) 10 minutes c) 100 minutes
a) b)
Figure 5-6 – Optical microscope images (100x magnification) of as extruded sample after 24 hours at the solution
treatment temperature of 560 °C: a) near sample surface b) through thickness
50 µm
Grain growth
after 100 mins
50 µm
Recrystallized Grain
Recrystallized Grain
Recrystallized Grain

44
5.2.2 Hardness and Resistivity Measurements
Figure 5-7a and 5-7b illustrate the evolution of resistivity and hardness measurements for various
times at 560 °C, respectively. The error in the resistivity measurements has previously been
determined to be ±0.3 nΩm, and the error bars in the hardness measurements come from the
standard deviation from 10 different trials of measurements. Measurements were also taken on the
same samples after 1 day at room temperature, and then again after 1 week to see the effects of
natural aging.
a) b)
Figure 5-7 – Measurements after time spent at 560 °C in the salt bath for 3 different conditions (immediately after heat
treatment, after 24 hours and after 1 week) for average measured values of: a) hardness values and b) resistivity
measurements
The drop in resistivity and hardness after 1 minute at 560 °C is most likely related to the dissolution
of Mg2Si and dissolution of fine Mg-Si precipitates that had formed previously in the alloy. After
the initial drop, the changes in resistivity and hardness were minimal. As such, it will be assumed
that times of 2 to 10 minutes at 560 °C is enough to dissolve the majority of the Mg-Si precipitates.
35
38
40
43
45
0 50 100
Res
isti
vity
(nΩ
m)
Minutes in Salt Bath at 560 ᵒC
Immediately after Salt Bath
After 24 hours
After 1 week30
50
70
90
110
0 50 100
Har
dn
ess
(HV
)
Minutes in Salt Bath at 560 ᵒC
Immediately after Salt Bath
After 24 hours
After 1 week

45
5.2.3 Initial Electron Backscatter Diffraction (EBSD)
Figure 5-8 summarize the EBSD IPF maps and 001, 111 and 110 pole figures, respectively,
to show the effect of the hold time at 560 °C on the grain size and texture. It can be observed that
there is very little change in the EBSD IPF Maps and the maximum texture components (7.7-8.4x
random) between the as-extruded state (Figure 5-8a) and the samples held for between 1 to 10
minutes.
a)
b)
ND
ED
0 min
1 min

46
c)
d)
e)
Figure 5-8 – EBSD IPF maps (left) and pole figures (right) of the as-extruded samples (taken from the center of the strip)
after various holding times at 560 °C: a) as-extruded (0 minutes) b) 1 minute c) 2 minutes d) 5 minutes e) 10 minutes
ND
ED
2 min
5 min
10 min

47
Table 5-1 quantifies the volume fraction of the texture components for S, Copper, Goss, Brass,
and Cube for the various holding times at 560 °C, as well as the sum to show that these components
make up the majority of the texture. Figure 5-9 plots the various texture components as a function
of time at 560 °C showing that there is minimal difference in the texture components for the
different holding times.
Table 5-1 Volume fraction (%) of texture component for various holding times at 560 °C
Time (min) 0 1 2 5 10
S 36 40 41 39 44
Copper 11 8 7 8 5
Goss 1 0 0 1 0
Brass 23 20 24 21 21
Cube 7 11 7 9 10
Sum 78 80 79 77 81
Figure 5-9 – Volume fraction of texture components
Figure 5-10 presents the distribution of sub-grain diameter for the as extruded sample after solution
treatment temperature of 560 °C, showing minimal difference in the average sub-grain sizes
(reported in Table 5-2) for the different holding times, although the results for 10 minutes show
some evidence of sub-grain coarsening. The sub-grain diameters were defined by a minimum
misorientation angle of 2º, a minimum of 5 pixels for a grain, and a binning size of 25.
0
5
10
15
20
25
30
35
40
45
50
0 2 4 6 8 10
Vo
lum
e Fr
acti
on
of
Text
ure
C
om
po
nen
t (%
)
Solution Treatment Time (min)S Brass Copper Cube Goss

48
a) b)
c) d)
e)
Figure 5-10 – EBSD equivalent sub-grain size distribution by number fraction versus diameter of grains for the as
extruded sample after various amounts of time at solution treatment temperature of 560 °C: a) as-extruded (0 minutes) b)
1 minute c) 2 minutes d) 5 minutes e) 10 minutes
Sub-grain Diameter [µm] Sub-grain Diameter [µm]
Sub-grain Diameter [µm] Sub-grain Diameter [µm]
Sub-grain Diameter [µm]
Num
ber
Fra
ctio
n
Num
ber
Fra
ctio
n
Num
ber
Fra
ctio
n
Num
ber
Fra
ctio
n
Num
ber
Fra
ctio
n

49
Table 5-2 Average sub-grain size diameter for various holding times at 560 °C
Time at 560 °C (min) 0 1 2 5 10
Sub-grain Diameter (µm) 3.9 4.1 4.0 4.3 4.8
Standard Deviation (µm) 3.0 3.3 3.1 3.4 5.0
Based on the results from hardness, electrical resistivity and microstructural characterization, 5
minutes at 560 °C was chosen as a good compromise between dissolving the maximum amount of
Mg-Si precipitates and minimizing the changes to the as-deformed microstructure in terms of sub-
grain size and texture components compared to the as-extruded condition.
Figure 5-11 shows a line scan for the misorientation profile for the high angle grain boundaries
(HAGBs) for the selected homogenization time of 5 minutes at 560 °C based on the IPF map in
Figure 5-8d. The misorientation angle was defined as the angle between the each point and the
original point. When the misorientation angle was larger than 15°, a HAGB was defined and the
grain thickness was measured. The thickness of the elongated grains was defined by the average
distance between the adjacent HAGBs in the direction normal to the extrusion direction.
Based on this approach, different grains are represented by the blue arrows in Figure 5-11, and for
better statistics, 50 misorientation profiles with a length of 900 μm normal to the extrusion
direction were included to estimate the average grain thickness at the center of the extrudate. The
estimated average grain thickness was measured to be 4.4 μm in 2D. To calculate the 3-D grain
thickness in equivalent diameter, the 2-D planar grain thickness determined via the EBSD map
was multiplied by a correction factor of 1.28 [51], with the assumption that all the grains have the
cylindrical shapes in 3-D. The estimated grain thickness in 3D compares favorably with the simple
geometric analysis of grain thickness based on the initial billet diameter of ≈100 mm, final strip

50
thickness of 3 mm and the initial grain size of 120 µm, since a geometric estimate for
3𝐷 𝑔𝑟𝑎𝑖𝑛 𝑡ℎ𝑖𝑐𝑘𝑛𝑒𝑠𝑠 =3 𝑚𝑚
100 𝑚𝑚× 120μm = 3.6 μm.
Figure 5-11 – The misorientation profile showing the misorientation angles between the current point and the original
point in the direction normal to the extrusion direction
5.3 Effect of Grain Structure on Quench Sensitivity
The results in this section include Gleeble and tensile test results, as well as observations on
precipitation of Mg2Si on grain boundaries and the within the grains, which were used to assess
the quench sensitivity of the given alloy for the various initial grain structures.
5.3.1 Different Initial Grain Structures
Figure 5-12 and Figure 5-13 illustrate the EBSD maps and 001, 111 and 110 pole figures for the
different starting grain structures used in the quench sensitivity experiments, respectively (i.e. after
5 minutes at 560 °C). The “unrecrystallized” sample (Figure 5-12a and Figure 5-13b) has highly
elongated grains with sub-grains and exhibits a crystallographic texture typical of plane strain
deformation. The sub-grain size of the alloy after solution treatment was determined by EBSD
analysis to be ≈4 µm (See Figure 5-10d). On the other hand, static recrystallization occurred during
the 5 minute hold time at 560 °C for the samples which were cold rolled by 30 % and 80 %, prior
to the solution treatment (see Figure 5-12b and Figure 5-12c, respectively).
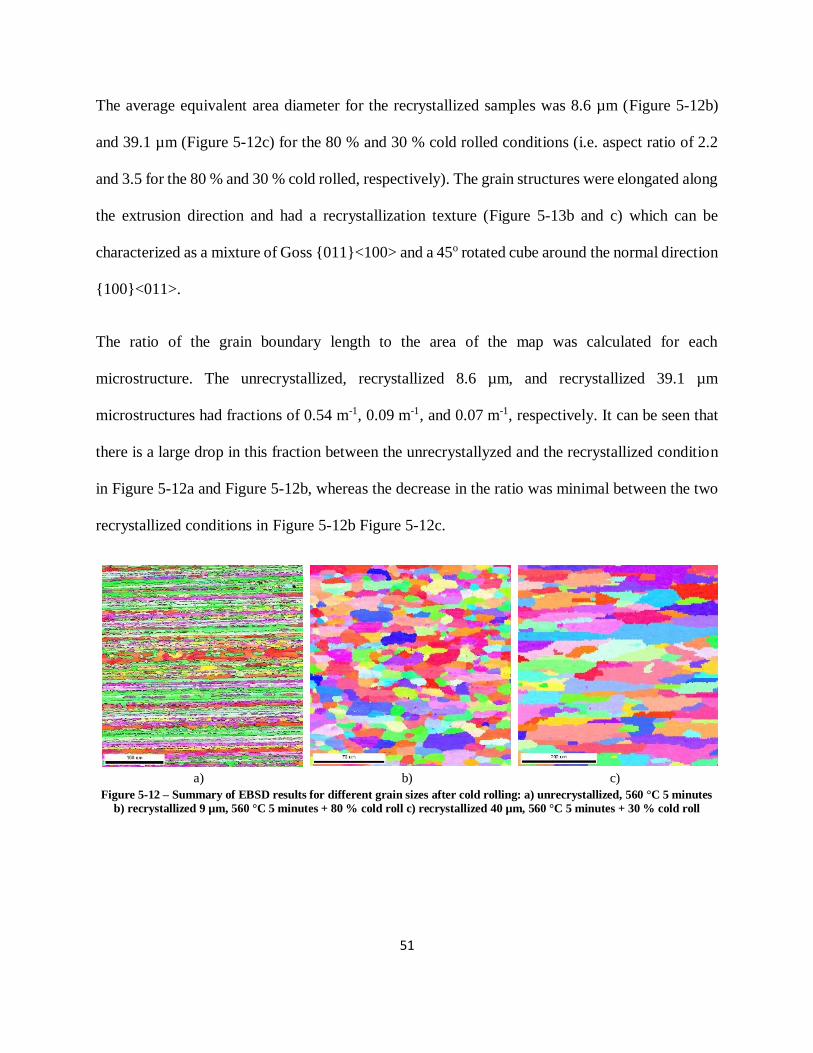
51
The average equivalent area diameter for the recrystallized samples was 8.6 µm (Figure 5-12b)
and 39.1 µm (Figure 5-12c) for the 80 % and 30 % cold rolled conditions (i.e. aspect ratio of 2.2
and 3.5 for the 80 % and 30 % cold rolled, respectively). The grain structures were elongated along
the extrusion direction and had a recrystallization texture (Figure 5-13b and c) which can be
characterized as a mixture of Goss 011<100> and a 45o rotated cube around the normal direction
100<011>.
The ratio of the grain boundary length to the area of the map was calculated for each
microstructure. The unrecrystallized, recrystallized 8.6 µm, and recrystallized 39.1 µm
microstructures had fractions of 0.54 m-1, 0.09 m-1, and 0.07 m-1, respectively. It can be seen that
there is a large drop in this fraction between the unrecrystallyzed and the recrystallized condition
in Figure 5-12a and Figure 5-12b, whereas the decrease in the ratio was minimal between the two
recrystallized conditions in Figure 5-12b Figure 5-12c.
a) b) c)
Figure 5-12 – Summary of EBSD results for different grain sizes after cold rolling: a) unrecrystallized, 560 °C 5 minutes
b) recrystallized 9 µm, 560 °C 5 minutes + 80 % cold roll c) recrystallized 40 µm, 560 °C 5 minutes + 30 % cold roll

52
a) b) c)
Figure 5-13 – Summary of pole figures for different grain sizes after cold rolling: a) unrecrystallized, 560 °C 5 minutes b)
recrystallized 9 µm, 560 °C 5 minutes + 80 % cold roll c) recrystallized 40 µm, 560 °C 5 minutes + 30 % cold roll
5.3.2 Characterization of the Thermal Treatments
Figure 5-14 shows the cooling curves for the water and air quenched samples, after the
homogenization heat treatment in the salt bath. The water quench resulted in a cooling rate of
≈2000 °C/s and the cooling rates from the air quench varied for the samples with different
thicknesses. Cooling rates were measured between the temperature range of interest, i.e. 400-
300 °C. The unrecrystallized sample (with a sample thickness of ≈2.7 mm) had a cooling rate of
4.2 °C/s, whereas the sample which had been cold rolled by 80 % (thickness of 0.55 mm) and
resulted in a cooling rate of 8.1 °C/s. The sample which had been cold rolled by 30 % (thickness
of 1.9 mm) had a cooling rate of 5.8 °C/s.
Figure 5-14 – Homogenization in salt bath followed by water quench or air cool for different microstructures
ED
ED
ED ED
ED
ED ED
ED
ED

53
In addition to water quench and air quench, Gleeble tests were done with a helium gas quench to
obtain intermediate cooling rates of interest: 10, 25, and 80 ºC/s. Figure 5-15 illustrates the
temperature-time data collected from the control thermocouple at the centre of the sample.
Figure 5-15 – Temperature profile from gleeble testing with after solution treatment and helium gas quench
Figure 5-16a presents the results on the temperature profile within the sample during the 5 minute
holding at 560 ºC. The data shown is for the control thermocouple and the thermocouples ±8 mm
away from the center for each sample. The results show that the maximum difference in
temperature for the unrecrystallized, and recrystallized 40 µm and 9 µm samples during the 5
minute holding time was approximately 5, 10 and 25 ºC respectively. The differences in
temperature gradients were due to sample geometry (mainly the difference in thickness due to cold
rolling) causing a change in resistivity in the sample. Furthermore, Figure 5-16b shows a magnified
view of the cooling rates during the quench to show that they remain constant until at
approximately 150 ºC for each of the controlled cooling rates. The average cooling rate was
calculated between 400 ºC and 300 ºC to be 10.1, 24.7, and 79.5 ºC/s, i.e. very close to the
programmed cooling rate.

54
a) b)
Figure 5-16 – a) temperature profile from Gleeble testing during holding b) controlled cooling rates achieved between 400
ºC and 300 ºC
In order to examine the effect of the temperature gradient on the dissolution of Mg2Si, Figure 5-17
presents a graph of the mole fraction of Mg2Si particles as a function of temperature, calculated
with Thermo-Calc with the TTAl6 database. The results show that even for the worst case of a 25
ºC difference (i.e. a temperature of 535 ºC), ≈92 % of Mg2Si would be dissolved which is
considered acceptable for these experiments.
a) b)
Figure 5-17 – a) mole fraction of Mg2Si particles at different temperatures, obtained by Thermo-Calc b) higher
magnification plot near the solvus temperature

55
5.3.3 Observations on Precipitates during Quench
Figure 5-18 shows the microstructure FEGSEM images (secondary electron) for the different
initial grain structures after the solution treatment and water or air quench. The images for the
water quench condition in Figure 5-18a show some dispersoids (≈40 nm in radius, consistent with
the size measured by Liu), indicated by the orange arrow in the unrecrystallized condition.
Constituent particles slightly beneath the surface layer of the sample also showed up as the ≈1 µm
grey areas with lower contrast (yellow arrows). The brighter white particles (presented by the blue
arrows) could be colloidal silica particles which have remained on the sample surface from the
polishing stage.
For the air cooled condition shown in Figure 5-18b, the images show bright elongated particles,
which based on the literature [52] are Mg2Si precipitates. Possible nucleation sites for Mg2Si
precipitation during cooling include high angle grain boundaries, sub-grains, dispersoids and
constituent particles. Although it is difficult to see the nucleation sites for Mg2Si precipitates at
this magnification, it can be assumed that a mix of nucleation sites can be activated. A detailed
study on this is the subject for future work. Here, the main result is the evidence for relatively
coarse Mg2Si precipitates observed for the air cooled sample compared to the water quench.

56
Unrecrystallized Recrystallized – 9 µm Recrystallized – 40 µm
a)
b)
Figure 5-18 –FEG-SEM images for a) water quench and b) air cooled sample (no artificial aging, T4)
Figure 5-19 shows the results for samples after artificial aging for a range of cooling rates. Since
the T4 micrographs for the extreme cooling rates for the recrystallized samples with different grain
sizes were similar, the intermediate cooling rates are only shown in Figure 5-19 for the
unrecrystallized sample and the recrystallized sample with initial grain size 40 µm after artificial
aging (i.e. T6). In this case, it can be observed that even for the case of the water quenched,
unrecrystallized grain structure Figure 5-19a, some fine Mg-Si precipitates can be observed (i.e.
compared to Figure 5-18a where no precipitates are observed). It is presumed that these Mg2Si
precipitates form during artificial aging. Further, this contrasts with the water quenched,
recrystallized sample in Figure 5-19b where only constituent and dispersoid particles can be
observed. This suggests that the presence of sub-grains in the unrecrystallized sample plays an
important role for nucleation and growth of precipitates during artificial aging.
Turning to the effect of cooling rate, it can be observed that as cooling rate decreases, Mg2Si
precipitation is more extensive. It is also clear that in the unrecrystallized condition, precipitation
is qualitatively more extensive. This would be consistent with the higher density of potential
4.2 ºC/s 8.1 ºC/s 5.8 ºC/s

57
nucleation sites and the enhanced growth due to pipe diffusion along dislocations in the
unrecrystallized case.
Unrecrystallized Recrystallized – 40 µm
a)
b)
c)
d)
Figure 5-19 – T6 FEG-SEM images for various cooling rates: a) water quench b) 80 C/s c) 10 C/s d) air cooled

58
5.3.4 Tensile Tests
Figure 5-20 shows the failure modes after tensile testing for the unrecrystallized and recrystallized
samples for the T4 and T6 tempers. Figure 5-21 shows representative images for quench rates of
10 and 80 ºC/s. The final fracture areas were measured from these images using the ImageJ
software and used to calculate the true fracture strain and stress as outlined in Section 4
Methodology.
Unrecrystallized Recrystallized – 40 µm Recrystallized – 9 µm
T4
T6
Figure 5-20 – Failure Modes and fracture surfaces for T6 and T4 tempers of different initial grain structures. *Note that
80 C/s broke off where thermocouple was attached and the point was removed in the data analysis.
10 ºC/s 80 ºC/s 10 ºC/s 80 ºC/s 10 ºC/s 80 ºC/s
10 ºC/s 80 ºC/s 10 ºC/s 80 ºC/s 10 ºC/s 80 ºC/s*

59
Figure 5-21 and Figure 5-22 show the engineering stress – strain curves, and the true stress – strain
curves, for the different initial microstructures and cooling rates for the T4 and T6 conditions,
respectively. Figure 5-21 shows that the sample with the unrecrystallized grain structure had the
highest dependence on cooling rate compared to the recrystallized sample.
For example, the yield stress for the unrecrystallized sample in the T4 condition drops from ≈190
MPa to ≈100 MPa as the cooling rate decreases from 2000 ºC/s to 4 ºC/s while the yield stress only
drops from ≈120 MPa to ≈110 MPa for the recrystallized sample with a grain size of 40 µm. On
the other hand, the true fracture strain measurements show a range of 0.4-0.5 for the
unrecrystallized samples while the recrystallized sample with a 40 µm grain size shows fracture
strains at 0.6-0.8.
Further, Figure 5-22 shows an even stronger effect of cooling rate on the yield stress in the
unrecrystallized T6 condition. The yield stress here drops from ≈ 375 MPa to 125 MPa for the
water quenched/air cooled samples. In the case of the recrystallized sample with a grain size of ≈
9 µm or ≈ 40 µm (Figure 5-22 b and c), the quench sensitivity was reduced with a drop in yield
stress from ≈ 350 MPa to 290 MPa.

60
a)
b)
c)
Figure 5-21 – T4 Tensile testing results (engineering stress-strain curves on the left and true stress-true strain curves on
the right): a) unrecrystallized b) recrystallized – 9 µm c) recrystallized – 40 µm

61
a)
b)
c)
Figure 5-22 – T6 Tensile testing results: a) unrecrystallized b) recrystallized – 9 µm c) recrystallized – 40 µm

62
5.3.5 Summary of Mechanical Properties
Based on the tensile results from the previous section, the yield stresses and ultimate tensile
stresses were plotted with respect to the cooling rates and are shown in Figure 5-23 to Figure 5-26.
It was found that mechanical properties such as yield stress, ultimate tensile stress and fracture
stress were lower at lower cooling rates, mainly in the air-cooled condition for the un-recrystallized
alloy. Based on the SEM micrographs in Figure 5-18 and Figure 5-19, this would be consistent
with Mg2Si precipitates having more time to grow along the grain boundaries, sub-grains and
dispersoids during the slower quench rate of the air cooled condition. As these coarse precipitates
do not contribute effectively to precipitation (either cluster hardening in the case of T4 or β”
precipitates in the T6), the yield stress and ultimate tensile stress decrease as the cooling rate is
decreased.
The change in mechanical properties, or quench sensitivity, can be seen clearly when the difference
in yield stress and ultimate tensile stress at each cooling rate with respect to the maximum water
quenched one is plotted as shown in Figure 5-23a to Figure 5-26a for the T4 and T6 tempers.

63
a)
b)
Figure 5-23 – T4 Results: a) measured yield stress and b) change in yield stress from water quench condition

64
In the case of the T4 temper, it can be seen that for the unrecrystallized case, the yield stress (Figure
5-23) and ultimate tensile stress (Figure 5-24) decreased by 85 MPa and 108 MPa, respectively,
for a cooling rate of 4 ºC/s with respect to the water quench. At a cooling rate of 10 ºC/s, the
difference drops from ≈40 MPa and then further decreases to ≈16 MPa for a cooling rate of 25
ºC/s. For the case of the recrystallized microstructure with a grain size of 9 µm, the drop in yield
stress at a cooling rate of 80 ºC/s is 3 MPa, i.e. only slightly less than the unrecrystallized case (6
MPa). Finally, for the case of a recrystallized microstructure with grain size of 40 µm only a
minimal drop of yield stress (12 MPa) at a cooling rate of 10 ºC/s was observed.
In the case of the T4 temper, the decrease of strengthening is likely related to the loss of
solute/vacancies due to precipitation during cooling. The loss of solute/vacancies then reduces the
capacity of the material to increase its strength during natural aging due to cluster formation. With
this in mind, one can rationalize these results based on the microstructure of the different cases.
For the unrecrystallized sample, there is a higher density of nucleation sites for precipitation (and
sinks for vacancies) during cooling i.e. sub-grains, high angle grain boundaries and dispersoids.
Therefore, the decrease in yield stress and tensile stress is the largest for this microstructure. In
contrast, the recrystallized sample shows a lower quench sensitivity due to the absence of sub-
grains and a lower density of high angle grain boundaries. Finally, the recrystallized sample with
the grain size of 40 µm shows lower quench sensitivity compared to the sample with a grain size
of 9 µm. This would be consistent with the lower amount of grain boundary area in the sample
with the larger grain size.

65
a)
b)
Figure 5-24 – T4 Results: a) measured ultimate tensile stress and b) change in ultimate tensile stress from water quench
condition

66
Figure 5-25 and Figure 5-26 show that the T6 temper resulted in similar trends to the T4 temper,
with the initial yield stress and ultimate tensile stress for the air cooled unrecrystallized condition
at around ≈ 100 MPa and ≈ 200 MPa, respectively. The stresses at higher cooling rates with the
T6 temper however were generally higher by ≈ 100 MPa, resulting in a higher quench sensitivity.
Furthermore, all three microstructures types here exhibit a yield stress decrease with decreasing
cooling rate after the solution treatment. In particular, the drop in the T6 yield stress relative to the
water quenched value is largest for the unrecrystallized case, i.e. ≈250 MPa for the air cooled
condition compared to only ≈75 MPa for the recrystallized samples. It is speculated that the quench
sensitivity of the unrecrystallized material is much higher due to i) the high number of
heterogeneous nucleation sites for Mg-Si phases to precipitate on during cooling, i.e. the large area
of high angle grain boundaries arising from the deformed grains and the sub-grains within the
elongated grains and ii) the high dislocation density which can accelerate growth via short circuit
diffusion along the dislocation cores (both during the quench and during artificial aging).
In the case of the recrystallized samples, the dependence of the yield stress on cooling rate
presumably comes from the precipitation on dispersoids and grain boundaries as has been
previously reported [3, 4, 40]. Strobel has proposed that dispersoids will dominate quench
sensitivity and that precipitation at grain boundaries is a secondary effect [53]. This would be
consistent with the weak effect of the different grain sizes on the cooling rate dependence of the
yield stress. Finally, the FEGSEM images shown in Figure 5-19 also shows that the precipitation
of Mg-Si phases is qualitatively more extensive in the unrecrystallized case. This would be
consistent with the larger loss of yield stress in the unrecrystallized condition compared to the
recrystallized conditions.

67
a)
b)
Figure 5-25 – T6 Results: a) measured yield stress and b) change in yield stress from water quench condition

68
a)
b)
Figure 5-26 – T6 Results: a) measured ultimate tensile stress and b) change in ultimate tensile stress from water quench
condition

69
Figure 5-27 and Figure 5-28 summarizes the effect of cooling rate on the true fracture stress and
true fracture strain. Both T4 and T6 tempers show similar trends for true fracture stress, it can be
observed that the true fracture stress is only weakly dependent on cooling rate for the recrystallized
alloys, although the true fracture stress for the 9 µm in Figure 5-28 is slightly higher (485-550
MPa) compared to that of the 40 µm sample (435-510 MPa). The results for the T6 unrecrystallized
microstructure show the strongest dependence on cooling rate, with the true fracture stress
dropping from ≈600 MPa in the water quenched sample to ≈250 MPa in the air cooled case.
This would be consistent with the simple model of Evensen and co-workers [54] who proposed
that the stress on the grain boundary would depend on grain size similar to the Hall-Petch effect.
It would also suggest that the intrinsic strength of the grain boundary is only weakly dependent on
cooling rate. Turning to the true fracture strain, Figure 5-28b shows that the recrystallized samples
exhibit larger true strain to fracture compared to the unrecrystallized sample with the finer grain
size sample having larger true strain to failures values than the larger grain size samples. The
explanation for the details of the differences in fracture strains for both tempers requires further
investigation.

70
a)
b)
Figure 5-27 – T4 Results: a) true fracture stress and b) true fracture strain

71
a)
b)
Figure 5-28 – T6 Results: a) true fracture stress and b) true fracture strain

72
In addition, Figure 5-29 and Figure 5-30 summarize the relationships between the true fracture
strain, yield stress and true fracture stress for each of the initial microstructures at the various
cooling rates, for the T4 and T6 case, respectively. Figure 5-29a illustrates the relationship between
the true fracture strain and the yield stress. It is observed in Figure 5-29a that the strain for the
unrecrystallyzed case remains consistent (≈ 0.40) across the various cooling rates, while the yield
stress ranges from 100-190 MPa between the air cooled and water quenched conditions. This
difference in yield stress decreases as the samples become recrystallized. For example, the
recrystallized sample with an initial grain size of 40 µm experienced a lower effect of cooling rate
with fracture strains of ≈0.65 and yield stress values of ≈ 115 MPa.
Figure 5-30a shows that in the T6 case, there is a higher effect of cooling rate on the true fracture
strain and yield stress relationship, across all initial microstructures. It is observed that as fracture
strain decreases (with increasing cooling rate) the yield stress decreases almost linearly, from 119-
365 MPa for the unrecrystallyzed condition, and ≈ 260-330 MPa for the recrystallized cases.
Further, Figure 5-29b and Figure 5-30b show that the relationship between the true fracture stresses
and true fracture strains are such that with the exception of the unrecrystallyzed (T6) air cooled
sample with a high fracture strain and low yield stress, the rest of the points grouped together with
small differences in true fracture stress across different cooling rates, with a maximum of ≈ 200
MPa difference between the two extreme cooling conditions.

73
a)
b)
Figure 5-29 – T4 Results: a) true fracture stress vs. yield stress and b) true fracture stress vs. true fracture strain

74
a)
b)
Figure 5-30 – T6 Results: a) true fracture stress vs. yield stress and b) true fracture stress vs. true fracture strain
5.3.6. Fracture surfaces
Figure 5-31 (T4) and Figure 5-32 (T6) show representative images of the fracture surfaces (with
their corresponding fracture strains in the top left corner of each image) for each initial

75
microstructure and cooling rate, demonstrating the difference in ductility. Areas with more dimples
represent classic ductile fracture surfaces.
Unrecrystallized Recrystallized – 9 µm Recrystallized – 40 µm
a)
b)
c)
d)
e)
Figure 5-31 – T4 Fracture surfaces for various cooling rates: a) air cooled b) 10 C/s c) 25 C/s d) 80 C/s e) water quench
(inset is the measure of the true fracture strain)
0.43
0.43
0.36
0.35
0.45
0.80
0.59
0.49
0.51
0.69
0.61
0.57
0.70
0.76
0.61

76
Unrecrystallized Recrystallized – 9 µm Recrystallized – 40 µm
a)
b)
c)
d)
e)
Figure 5-32 – T6 Fracture surfaces for various cooling rates: a) air cooled b) 10 C/s c) 25 C/s d) 80 C/s e) water quench
Dimples can be seen on all of the fracture surfaces which indicates ductile failure, with some
images containing more dimples than others. However, it is difficult to quantify the amount of
ductility or generalize and draw a definitive conclusion from just these images. An accurate
explanation for the details of these differences would require further investigation.
0.74
0.49
0.47
0.47
0.56
0.74
0.69
0.63
-
0.50
0.64
0.63
0.56
0.54
0.56

77
6 SUMMARY AND FUTURE WORK
The aim of this study was to investigate the quench sensitivity of a near industry extrusion alloy
(AA6082) with different initial microstructures after solution treatment at 560 °C and for cooling
rates between 4 °C/s and 2000 °C/s. The key findings of the study are:
1) The initial as-extruded microstructure was characterized by optical microscopy and EBSD.
Highly elongated grains were found parallel to the extrusion direction, with a thin surface
layer of recrystallized grains, approximately ≈30 µm in thickness. Within the elongated
grains, sub-grains (enclosed by a mixture of high angle and low angle boundaries) of ≈4
µm in diameter were measured.
2) An experimental study on the effect of holding time at the solution treatment temperature
of 560 °C was conducted. The results determined that a solution treatment time of 5
minutes resulted in a good compromise between dissolving the maximum amount of Mg-
Si precipitates and minimizing the changes to the as-deformed microstructure in terms of
sub-grain size and texture components compared to the as-extruded condition.
3) A process route was developed such that two different initial recrystallized microstructures
were produced i.e. the initial material was cold rolled to 30 % and 80 %, and a recrystallized
grain size of 39.1 µm and 8.6 µm was observed after the solution treatment.
4) A methodology was developed using the Gleeble 3500 thermomechanical simulator to
conduct solution treatment and controlled cooling tests with a wide range of cooling rates.
The samples from these simulations were suitable for conducting tensile tests to evaluate
mechanical properties such as the yield stress, ultimate tensile stress, true fracture stress
and true fracture strain. In the current work, the influence of post solution treatment cooling
rate for different initial microstructures was examined with tensile tests on unrecrystallized

78
and recrystallized microstructures (in the naturally aged T4 and artificially aged T6
tempers).
5) It was found that in the case of the unrecrystallized microstructure with a T4 temper, the
yield stress decreased by ≈85 MPa and true fracture stress decreased by ≈120 MPa as the
cooling rate was decreased from 2000 ºC/s to 4 ºC/s. In contrast, the recrystallized
microstructures showed a much smaller dependence of the yield stress (< 40 MPa).
6) The dependence of yield stress on cooling rate was larger in the case of the T6 temper. It
was found that in the T6 aging condition, the unrecrystallized microstructure had a decrease
in yield stress of ≈250 MPa and true fracture stress decreased by ≈350 MPa as the cooling
rate was decreased from 2000 ºC/s to 4 ºC/s. The recrystallized microstructures showed a
much smaller dependence of the yield stress (< 75 MPa) compared to the unrecrystallyzed
one, (however still larger than under the T4 condition). Furthermore the true fracture stress
was found to be almost independent of cooling rate, albeit the true fracture stress was
approximately 50 MPa lower for the 40 µm versus the 9 µm grain size materials.
7) It is proposed that the larger quench sensitivity of the unrecrystallized samples with respect
to the recrystallized samples in both the T4 and the T6 temper is related to the higher
density of heterogeneous nucleation sites, (e.g. elongated high angle grain boundaries, sub-
grains, and the dislocation network) in the unrecrystallized material which aid the
nucleation and growth of Mg-Si phases during the quench (and during artificial aging).
8) Finally, the effect of cooling rate on the mechanical properties was rationalized in terms of
the precipitation of Mg-Si phases during cooling and qualitative FEGSEM observations
were in agreement with the results.

79
Future work would include:
• Detailed TEM/FEGSEM studies to quantify precipitation of the Mg-Si phase on the
grain boundaries and the nature of the PFZ.
• Higher magnification FEGSEM images on the dispersoids and constituent particles to
further characterize the Mg-Si phase that has precipitated on them.
• Re-doing the Gleeble test/ tensile test on the recrystallized sample with 9 µm grain size,
which was solution treated in the Gleeble and cooled at 80 °C/s, followed by artificial
aging (T6), to explain the brittle nature of the fracture (as it fracture near where the
thermocouple was attached).
• An explanation for the details of the differences in fracture strains for both T4 and T6
tempers, especially in Figure 5-27b (T4) which shows that the recrystallized samples
exhibited larger true strain to fracture compared to the sample (where the finer grain
size sample have larger true strain to failures values than the larger grain size samples).
• Further investigation to explain the nature of the fracture surfaces as it was difficult to
quantify or generalize based on the FEGSEM images.

80
REFERENCES
1. Basic Metallurgy: 6000 Series Extrusion Alloys. 2016. http://www.vosbltd.com/site/wp-
content/uploads/2015/10/extrusion-basic-metallurgy.pdf
2. Polmear, I.J., Light Alloys - Metallurgy of the Light Metals. 1989, Melbourne: Hodder &
Stoughton.
3. Milkereit, B. and S. M.J., Quench sensitivity of Al–Mg–Si alloys: A model for linear
cooling and strengthening. Mater. Design, 2015. 76: p. 117-129.
4. Dowling, J.M. and J.W. Martin, The influence of Mn additions on the deformation
behaviour of an Al-Mg-Si alloy. Acta metall., 1976. 24: p. 1147-1153.
5. Vasudevan, A.K. and R.D. Doherty, Grain boundary ductile fracture in precipitation
hardened aluminum alloys. Acta metall., 1987. 35: p. 1193-1219.
6. Andersen, S.J., et al., The crystal structure of the β” phase in Al-Mg-Si alloys. Acta Mater.,
1998. 46: p. 3283-3298.
7. Jaafar, A., et al., Effects of Composition on the Mechanical Properties and Microstructural
Development of Dilute 6000 Series Alloys. Journal of Applied Sciences Vol. 12, 2012: p.
775-780.
8. Strobel et. al., K., Relating Quench Sensitivity to Microstructure in 6000 Series Aluminium
Alloys. Materials Transactions Vol. 52, No. 5, 2011: p. 914-919.
9. Porter, D.A. and K.E. Easterling, Phase transformation in Metal Alloys. 1992, London:
Chapman and Hall.
10. Deschamps, A. and Y. Brechet, Influence of predeformation and ageing of an Al-Zn-Mg
alloy. II. Modeling of precipitation kinetics and yield stress. Acta mater., 1998. 47(1): p.
293-305.

81
11. Porter, D.A., K.E. Easterling, and M.Y. Sherif, Phase transformations in metals and alloys.
2009, Boca Raton: CRC Press.
12. Strobel, K., et al., Relating Quench Sensitivity to Microstructure in 6000 Series Aluminium
Alloys. Mater. Trans., 2011. 52: p. 914-919.
13. Gupta et. al., A.K., Precipitation hardening in Al–Mg–Si alloys with and without excess Si.
Materials Science and Engineering Volume 316, 2001: p. 11-17.
14. Wang, X., et al., Precipitation Strengthening of the Aluminum Alloy AA6111. Metall.
Mater. Trans. A., 2003. 34A: p. 2913-2924.
15. Esmaeili, S., D.J. Lloyd, and W.J. Poole, Modeling of precipitation hardening for the
naturally aged Al-Mg-Si-Cu alloy AA6111. Acta mater., 2003. 51: p. 3467-3481.
16. Esmaeili, S., D.J. Lloyd, and W.J. Poole, A yield strength model for the Al-Mg-Si-Cu alloy
AA6111. Acta mater., 2003. 51: p. 2243-2257.
17. Frost, H.J. and M.F. Ashby, Deformation-Mechanism Maps. 1982, Oxford, UK: Pergamon
Press. 6-8.
18. Ashby, M.F., C. Gandhi, and M.R. Taplin, Fracture Mechanism Maps and Their
Construction for FCC Metals and Alloys. Acta Metallurgica Vol 27, 1979: p. 699-729.
19. Embury, J.D. and E. Nes, Metallkunde Vol 65, 1974: p. 45.
20. Kirman, I., Metall. Trans. Vol. 2, 1971: p. 1761.
21. Parson, N. and H.L. Yiu, The effect of heat on the microstructure and properties of 6000
series alloy extrusion ingots, in Light Metals 1989, P.G. Campbell, Editor. 1989, The
Minerals, Metals and Materials Society. p. 713-724.
22. Hsu, C., et al., Non-equilibrium reactions in 6xxx series Al alloys. Mater. Sci. Eng. , 2001:
p. 119-125.

82
23. Cooper, M., The crystal structure of the ternary alloy α(AlFeSi). Acta Crystall., 1967. 23:
p. 1106-1107.
24. Cooper, M. and K. Robinson, The crystal structure of the ternary alloy α (AlMnSi). Acta
Crystall., 1966. 20: p. 614-617.
25. Sweet, L., et al., The effect of iron content on the iron-containing intermetallic phases in a
cast 6060 aluminum alloy. Metall. Mater. Trans. A, 2011. 42A: p. 1737-1749.
26. Li, Y.J. and L. Arnberg, Quantitative study on the precipitation behavior of dispersoids in
DC-cast AA3003 alloy during heating and homogenization. Acta mater., 2003. 51: p. 3412-
3428.
27. Han, Y., et al., Precipitation behavior of dispersoids in Al-Mg-Si-Cu-Mn-Cr alloy during
homogenization annealing, in 13th International Conference on Aluminum Alloys, H.
Weilland, A.D. Rollett, and W.D. Cassada, Editors. 2012: Pittsburg, Pa, USA. p. 1817-
1824.
28. Cayron, C. and P.A. Buffat, Transmission electron microscopy study of the b" phase (Al-
Mg-Si) and QC phase (Al-Cu-Mg-Si): Ordering mechanism and crystallographic
structure. Acta mater., 2000. 48: p. 2639-2653.
29. Hu, R., et al., Dispersoid Formation and Recrystallization Behavior in an Al-Mg-Si-Mn
Alloy. Journal of Materials Science & Technology, 2010. 26(3): p. 237-243.
30. Vivas, M., P. Lours, and C. Levaillant, Determination of precipitate strength in aluminum
alloy 6056-T6 from transmission electron microscopy in situ straining data. Phil. Mag. A,
1997. 76(5): p. 921-931.

83
31. Kuijpers, N.C.W., et al., Assessment of different techniques for quantification of α-Al
(FeMn) Si and β-AlFeSi intermetallics in AA 6xxx alloys. Mater. Charact. 49 2002: p. 409–
420.
32. Kuijpers, N.C.W., et al., Quantification of the evolution of the 3D intermetallic structure
in a 6005A aluminium alloy during a homogenisation treatment. Mater. Charact. 48, 2002:
p. 379–392.
33. Birol, Y., Homogenization of AW 6005A Alloy for Improved Extrudability. Metall. Mater.
Trans. A Phys. Metall. Mater. Sci. 44 2013: p. 504–511.
34. Hatch, J.E., Aluminum: Properties and Physical Metallurgy. 1984, Metals Park, OH, USA:
American Society for Metals, p. 29.
35. Kuijpers, N.C.W., et al., The dependence of the b-AlFeSi to a-Al(FeMn)Si transformation
kinetics in the Al-Mg-Si alloys on the alloying elements. Mat. Sci. Eng. A, 2005. A394: p.
9-19.
36. Du, Y., et al., Diffusion coefficients of some solutes in fcc and liquid Al: critical evaluation
and correlation. Mat. Sci. Eng., 2003. A363: p. 140-151.
37. Liu, C., Microstructure evolution during homogenization and its effect on the high
temperature deformation behaviour in AA6082 based alloys in PhD Thesis, Department of
Materials Engineering. 2017, The University of British Columbia: Vancouver, BC.
38. Zajac, S., et al., Microstructure control and extrudabilty of Al-Mg-Si alloys microalloyed
with manganese. Mater. Sci. Tech., 1994. 10: p. 323-333.
39. Kral, M.V., A crystallographic identification of intermetallic phases in Al-Si alloys.
Materials Letters 59, 2005: p. 2271-2276.

84
40. Strobel, K., et al., Relating quench senstivity to microstructure in 6000 series aluminium
alloys. Mater. Trans., 2011. 52: p. 914-919
41. Strobel, K., et al., Effects of quench rate and natural ageing on the age hardening
behaviour of aluminium alloy AA6060. Mat. Char., 2016. 111: p. 43-52.
42. Lodgaard, L. and N. Ryum, Precipitation of dispersoids containing Mn and/or Cr in Al-
Mg-Si alloys. Mat. Sci. Eng. A, 2000. 283(1-2): p. 144-152.
43. Lodgaard, L. and N. Ryum, Precipitation of chromium containing dispersoids in Al-Mg-Si
alloys. Materials Science and Technology, 2000. 16(6): p. 599-604.
44. Hirasawa, H., Precipitation process of Al-Mn and Al-Cr supersaturated solid solution inthe
presence of age hardening phases. Scripta metall., 1975. 9: p. 955-958.
45. Yoo, J.E., et al., A study on composition and crystal structure of dispersoids in AlMgSi
alloys. 1999: p. 2679-2683.
46. Humphreys, F.J. and M. Matherly, Recrystallization and related annealing phenomena.
Second ed. 2004, Oxford, UK: Pergamon.
47. Eivani, A.R., et al., Effect of the Size Distribution of Nanoscale Dispersed Particles on the
Zener Drag Pressure. Metallurgical and Materials Transactions a-Physical Metallurgy and
Materials Science, 2011. 42A(4): p. 1109-1116.
48. Eivani, A.R., et al., Correlation between electrical resistivity, particle dissolution,
precipitation of dispersoids, and recrystallization behavior of AA7020 aluminum alloy.
Metall. Mater. Trans. A Phys. Metall. Mater. Sci. 40, 2009: p. 2435–2446.
49. Marceau, R.K.W., et al., Analysis of strengthening in AA6111 during the early stages of
aging: Atom probe tomography and yield stress modelling. Acta mater., 2013.

85
50. Liu, C., Microstructure evolution during homogenization and its effect on the high
temperature deformation behaviour in AA6082 based alloys in PhD. Thesis, Department
of Materials Engineering. 2017, The University of British Columbia: Vancouver, BC.
51. Giumelli, A., M. Militzer, and E. Hawbolt, Analysis of the Austenite Grain Size Distributio.
1511 International Vol. 39 No. 3, 1999: p. 271-280.
52. Milkereit, B., et al., Continuous cooling precipitation diagrams of Al-Mg-Si alloys.
Materials Science and Engineering A 550, 2012: p. 87-96.
53. Strobel, K., Quench Sensitivity in 6xxx Series Aluminium Alloys, Ph.D Thesis. 2013,
Monash University.
54. Evensen, J.D., N. Ryum, and J.D. Embury, The intergranular fracture of Al-Mg-Si alloys.
Mat. Sci. Eng., 1975. 18: p. 221-229.