Welcome to Progressive GaitWays... - Progressive GaitWays, LLC

The Effect of Progressive Heat
Acclimation on Games Players
Performing Intermittent-Sprint
Exercise in the Heat
Mark Hayes
A Doctoral thesis submitted in partial
fulfilment of the requirements of the
University of Brighton for the degree of
Doctor of Philosophy
2014

ii
To the people that challenge me to be better
“Energy and persistence conquer all things”
-Benjamin Franklin-

iii
ABSTRACT
Intermittent-sprint performance is reduced in hot environments and the impairment
occurs without significant difference in metabolic responses to exercise. Reductions in
cerebral blood flow and voluntary activation occur with hyperthermia and neuromuscular
impairment has been posited to explain decreased performance in the heat. Heat
acclimation is used to minimise heat mediated performance impairment, yet traditional
protocols may limit adaptation. The purpose of this thesis was to examine the efficacy of
a novel progressive heat acclimation model for games players performing intermittent-
sprint exercise in the heat and to examine if this method can ameliorate neuromuscular
fatigue following exercise of this type.
In study one the reliability of the cycling intermittent-sprint protocol (CISP), a 40 minute
test of intermittent sprinting was determined. Eleven male team-sport athletes
completed two trials of the CISP in temperate conditions and reliability of the protocol
was determined from typical error of measurement (TEM), Intraclass correlation (ICC) and
least product regression analysis. TEM and ICC for peak power output (PPO, 2.9%, 0.96),
mean power output (MPO, 4.2%, 0.96) and least product regression analysis
demonstrated the CISP was a reliable protocol for assessment of prolonged intermittent-
sprint exercise.
Study two examined the effect of hot humid (HH) and hot dry environments (HD),
matched for heat stress using wet bulb globe temperature (WBGT), on intermittent-sprint
performance to ascertain whether the composition of thermal factors constituting the
heat stress is important when developing a heat acclimation protocol. Eleven male team-
sport athletes completed three CISPs (HH, HD and temperate (TEMP)). In HH and HD
three participants failed to complete the full protocol but all completed the CISP in TEMP.
Peak power output was reduced in all conditions (P < 0.05) but was not different between
trials (sprints 1 – 14 (n = 11); HH, 1073 ± 150 W; HD, 1104 ± 127 W; TEMP, 1074 ± 134 W;

iv
sprints 15 – 20 (n = 8); HH, 954 ± 114 W; HD, 997 ± 115 W; TEMP, 993 ± 94 W; P > 0.05).
Further, physiological strain was not significantly different in HH compared to HD but HH
was greater than TEMP (P < 0.05). Findings indicated the importance of heat acclimation
for games players but suggest the composition of thermal factors contributing to the heat
stress is not a primary concern when developing a heat acclimation protocol.
Study three compared the effect of a novel, progressive heat acclimation protocol (PA) to
a traditional protocol (TA), on heat adaptation and intermittent-sprint exercise in the
heat. Before and after twelve days of acclimation or training twenty four participants (PA,
n = 9; TA, n = 6; Training (TG), n = 9) completed the CISP in 33°C, 50% rh. TA reduced
resting and peak exercise heart rate (-11 b.min-1, -17 b.min-1) and exercise rectal
temperature (Tre) (-0.5°C) and increased sweat rate (0.41 L.hr-1, all P values < 0.05). In
contrast, while PA reduced resting heart rate (-12 b.min-1, P < 0.05), the elevated heat
stress in PA increased peak Tre and sweat rate (+0.4°C, +0.31 L.hr-1, P < 0.05) and
maintained mean and peak heart rate during acclimation (P > 0.05). During intermittent-
sprint exercise post acclimation mean heart rate and Tre were reduced (TA, -19 b.min-1, -
0.3°C; PA, -16 b.min-1, -0.5°C, P < 0.05). In addition, sk was reduced by both acclimation
regimes (TA, -0.95°C; PA, -0.7°C, P < 0.05) but not TG (P > 0.05). Both acclimation regimes
also reduced RPE and Tsen during CISP 2 (P < 0.05) but TG had no effect (P > 0.05). Finally,
PPO was reduced by 19, 6 and 8% in TA, TG and PA prior to acclimation and negatively
correlated with Tre for TA and PA (r > 0.90, P < 0.001). Post acclimation, TA increased PPO
and ameliorated the negative correlation between PPO and Tre. PA or TG had no such
effect. Based on the ability to evoke classic acclimation responses compared to TA, PA
was judged an effective method for conferring the heat acclimated phenotype but
optimisation is required to improve acclimation response and intermittent-sprint
performance.
Study four examined neuromuscular fatigue following intermittent sprinting in the heat
and the ability of PA to ameliorate fatigue of this type. This study was the first to quantify
neuromuscular fatigue following intermittent sprinting in the heat using transcranial

v
magnetic stimulation (TMS) and both central and peripheral fatigue were observed when
seventeen team-sport athletes completed the CISP in 33°C, 50% rh before twelve days of
PA or training (TG) (MVC, -19.8%; cortical voluntary activation, -6.3%; potentiated twitch,
-21.5%; all P values < 0.05). PA decreased resting heart rate and Tre (-10 b.min-1, -0.3°C, P
< 0.05) prior to intermittent sprinting in the heat and reduced exercise heart rate (-17
b.min-1, P < 0.05) but performance was unchanged (1058 ± 148 vs 1060 ± 120 W, P > 0.05,
CISP 1 vs 2 respectively). Prior to acclimation, forty minutes of intermittent sprinting
induced neuromuscular fatigue (MVC, -20.3%, potentiated twitch, -24.7%, P < 0.05) and
twelve days of PA did not reduce this (MVC, -16.6%, potentiated twitch, -17.6%, P < 0.05).
Findings indicate that during forty minutes of intermittent-sprint exercise in the heat,
neuromuscular fatigue may be primarily peripheral in origin and PA or TG does not reduce
the extent of fatigue despite a reduced physiological strain.
Key words
Intermittent-sprint exercise, reliability, progressive heat acclimation, transcranial
magnetic stimulation, neuromuscular fatigue.

vi
TABLE OF CONTENTS
DEDICATION ii ABSTRACT iii TABLE OF CONTENTS vi LIST OF FIGURES xii LIST OF TABLES xv LIST OF EQUATIONS xvi LIST OF ABBREVIATIONS xvii ACKNOWLEDGEMENTS xix DECLARATION xxi
PAGE No. CHAPTER I. INTRODUCTION 1
CHAPTER II. REVIEW OF LITERATURE 7 2.1. Introduction 7 2.2. Intermittent-sprint exercise 8 2.2.1. Time-motion analysis of field-based team-sports 8 2.2.1.1. Time in low and high intensity activity 11 2.2.1.2. Sprint duration, distance and recovery 12 2.2.1.3. Total match distance and motion changes 13 2.2.1.4. Progression of time-motion analysis variables during a
Match 14 2.2.1.5. Summary 15 2.2.2. Energetics of intermittent-sprint exercise 16 2.2.2.1. Metabolic pathways for ATP production 16 2.2.2.2. Phosphocreatine, ADP and AMP 17 2.2.2.3. Anaerobic glycolysis 18 2.2.2.4. Aerobic respiration 20 2.2.2.5. Energy production in intermittent-sprint exercise 21 2.2.3. Reliability assessment in intermittent-sprint exercise 22 2.3. Thermoregulation and heat stress 26 2.3.1. Overview 26 2.3.1.1. Mechanical efficiency and heat production 27 2.3.1.2. Mechanisms of heat exchange 29 2.3.1.3. Temperature regulation 30 2.3.1.4. Thermoregulation during exercise in the heat 33 2.3.2. Climatic heat stress and indices for assessment 37 2.3.3. Intermittent-sprint exercise in a hot environment 41 2.3.4. Summary 47 2.4. Fatigue 48 2.4.1. Overview 48 2.4.2. Central fatigue 49 2.4.2.1. Mechanisms of spinal fatigue 49

vii
2.4.2.2. Mechanisms of supraspinal fatigue 51 2.4.2.3. The central neurotransmitters serotonin, dopamine and
noradrenaline 52 2.4.3. Peripheral fatigue 54 2.4.4. Measurement of fatigue 58 2.4.4.1. Maximal voluntary contractions 58 2.4.4.2 Evoked mechanical responses 59 2.4.4.3 Peripheral voluntary activation 59 2.4.4.4 Cortical voluntary activation 60 2.4.4.5 Evoked EMG responses 61 2.4.4.6. Voluntary EMG responses 62 2.4.4.7. Perception of effort 62 2.4.5. Mechanisms of exercise induced neuromuscular fatigue in
temperate environments 63 2.4.5.1. Endurance type exercise 63 2.4.5.2 Intermittent-sprint type exercise 65 2.4.6 Mechanisms of exercise induced fatigue in hot
Environments 69 2.4.6.1. Endurance type exercise 70 2.4.6.2. Intermittent-sprint type exercise 71 2.4.7. Summary 73 2.5. Heat acclimation 75 2.5.1 Heat acclimation methods and protocols 75 2.5.1.1. Self-regulated protocols 76 2.5.1.2 Constant work rate protocols 76 2.5.1.3 Isothermal strain / controlled hyperthermia 77 2.5.2. Adaptations to heat acclimation 77 2.5.2.1. Molecular and cellular responses to heat acclimation 78 2.5.2.2. Thermoregulatory adjustments to heat acclimation 82 2.5.2.3. Endocrine and metabolic adjustments to heat acclimation 85 2.5.2.4. Cardiovascular adjustments to heat acclimation 87 2.5.2.5 Perceptual adjustments to heat acclimation 88 2.5.3. Overview of studies using traditional, medium to short-
term traditional and isothermal strain acclimation 89 2.5.3.1. Efficacy of traditional heat acclimation protocols 92 2.5.3.2. Efficacy of medium to short-term traditional heat
acclimation protocols 93 2.5.3.3. Efficacy of isothermal strain heat acclimation protocols 94 2.5.4. Alternate heat acclimation protocols 95 2.5.4.1. Daily versus alternate day heat acclimation 97 2.5.4.2 Low and high intensity acclimation 97 2.5.4.3 Isotype acclimation 98 2.5.4.4. Intermittent exercise type acclimation 98 2.5.4.5. Dehydration heat acclimation 99 2.5.5. Heat acclimation and intermittent-sprint exercise 99 2.5.6. Issues associated with current heat acclimation methods 102 2.5.7. A progressive model of heat acclimation 104

viii
2.6. Literature review summary 106 2.7. Studies, aims and hypotheses 106 CHAPTER III. GENERAL METHODS 109 3.1. Introduction 109 3.2. Health and Safety 109 3.3. Participants 110 3.4. Pre-trial Diet and Exercise Standardisation 110 3.5. Measurement of Performance in Intermittent-Sprint
Cycling 111 3.5.1. Cycle ergometer and SRM calibration 111 3.6. Preliminary Visit and CISP Practice 113 3.7. The Cycling Intermittent-Sprint Protocol (CISP) 115 3.8. Experimental Procedures 117 3.9. Environmental Conditions 117 3.10. Physiological Measurements 119 3.10.1. Heart rate 119 3.10.2. Metabolic heat production 119 3.10.3. Physiological strain index 120 3.10.4. Thermoregulatory measurements 121 3.10.5. Weight loss and sweat rate 123 3.10.6. Perception of effort and thermal sensation 123 3.11. Collection, treatment and analysis of blood samples 124 3.12. Blood Assays 126 3.12.1. Aldosterone 126 3.12.2. Cortisol 128 3.13. Statistical Analyses 129
CHAPTER IV. RELIABILITY OF THE CYCLING INTERMITTENT-SPRINT
PROTOCOL 131 4.1. Abstract 131 4.2. Introduction 131 4.3. Methods 133 4.3.1. Participants 133 4.3.2. Experimental design 134 4.3.3. Statistical analysis 135 4.4. Results 136 4.5. Discussion 140 4.5.1. Conclusion 144
CHAPTER V. THE INFLUENCE OF HOT HUMID AND HOT DRY
ENVIRONMENTS ON INTERMITTENT-SPRINT EXERCISE PERFORMANCE 145
5.1. Abstract 145 5.2. Introduction 145 5.3. Methods 147 5.3.1. Participants 147

ix
5.3.2. Experimental design 148 5.3.3 Preliminary visit 149 5.3.4 . Main trials 149 5.3.5. Physiological measures 150 5.3.6. Statistical Analysis 150 5.4. Results 151 5.4.1. Ambient conditions 151 5.4.2. Preliminary measures and warm up 151 5.4.3. Number of sprints completed 152 5.4.4. Main experimental conditions 152 5.4.4.1. Performance variables 152 5.4.4.2. Physiological variables 153 5.4.4.3. Perceptual measures 158 5.5. Discussion 159 5.5.1. Conclusion 162 CHAPTER VI. PHYSIOLOGICAL AND PERCEPTUAL RESPONSES TO
PROGRESSIVE COMPARED TO TRADITIONAL HEAT ACCLIMATION AND THE EFFECT ON INTERMITTENT- SPRINT EXERCISE IN A HOT ENVIRONMENT 163
6.1. Abstract 163 6.2. Introduction 164 6.3. Methods 168 6.3.1. Participants 168 6.3.2. Environments 168 6.3.3. Experimental design 169 6.3.3.1. Preliminary visit 170 6.3.3.1.1. Cycling intermittent-sprint protocol 171 6.3.3.2. Acclimation 172 6.3.4. Statistical analysis 172 6.4. Results 173 6.4.1. Physiological and perceptual responses to twelve days of
heat acclimation or training 173 6.4.1.1. Body mass and hydration 173 6.4.1.2. Rectal temperature 173 6.4.1.3. Heart rate 174 6.4.1.4. Aldosterone and cortisol 176 6.4.1.5. Sweat rate and sweat sodium, potassium and chloride 177 6.4.1.6. Plasma volume, haemoglobin and haematocrit 179 6.4.1.7. RPE. Tsen and PSI 180 6.4.2. Performance, physiological and perceptual responses to
intermittent-sprint exercise in 33°C, 50% rh pre-post twelve days of PA, TA or TG. 181
6.4.2.1. Participants 181 6.4.2.2. PPO and work done 181 6.4.2.3. Heart rate 186 6.4.2.4. Tre sk, body and body heat content 187
x
6.4.2.5 lood lactate 2 and metabolic heat production 189 6.4.2.6. Sweat rate and sweat sodium, potassium and chloride
during intermittent-sprint exercise 189 6.4.2.7. RPE, Tsen and PSI 190 6.4.2.8. Correlational analysis 192 6.5. Discussion 192 6.5.1. Physiological and perceptual responses during acclimation
and training. 193 6.5.2. Physiological and perceptual responses during Intermittent-
sprint exercise in 33°C 50% rh. 197 6.5.3. Performance responses during Intermittent-sprint exercise
in 33°C 50% rh 198 6.5.4. Limitations 201 6.5.5. Conclusion 202
CHAPTER VII. PROGRESSIVE HEAT ACCLIMATION AND FATIGUE FOLLOWING
INTERMITTENT-SPRINT EXERCISE IN THE HEAT 203 7.1. Abstract 203 7.2. Introduction 204 7.3. Methods 209 7.3.1. Participants 209 7.3.2. Experimental design 209 7.3.2.1. Visit 1: familiarisation 210 7.3.2.2. Visit 2: preliminary testing and CISP practice 215 7.3.2.3. Visit 3 and 16: CISP and neuromuscular function (NMF)
testing 215 7.3.2.4. Visit 4 – 15: Progressive acclimation or training 217 7.3.3. Data analyses 218 7.3.4. Statistical analysis 221 7.4. Results 222 7.4.1. Part A: PPO, WD and neuromuscular fatigue responses
to intermittent-sprint exercise in 33°C, 50% rh (pooled data for all seventeen participants) 222
7.4.1.1. PPO and work done 222 7.4.1.2 Neuromuscular fatigue 224 7.4.2. Part B: Physiological and perceptual responses to twelve
days of PA and TG. 226 7.4.2.1. body mass and hydration 226 7.4.2.2. Heart rate 227 7.4.2.3. Rectal temperature 228 7.4.2.4. RPE and Tsen 228 7.4.2.5. Sweat Rate 230 7.4.2.6. Haemoglobin, haematocrit and Plasma volume 230 7.4.3. Part C: Performance, physiological and perceptual
responses to intermittent-sprint exercise in 33°C, 50% rh pre-post twelve days of PA or TG. 231
7.4.3.1. Participants 231

xi
7.4.3.2. PPO and Work Done 231 7.4.3.3. Heart rate 232 7.4.3.4. Tre and sk 234 7.4.3.5. Sweat rate, PSI, BHC and heat production 235 7.4.3.6. lood lactate and 2 235 7.4.3.7. RPE and Tsen 235 7.4.4 Part D: Neuromuscular responses to intermittent-sprint
Exercise in the heat. 236 7.4.4.1. Muscular function 236 7.4.4.2. EMG activity 237 7.4.4.3. Cortical drive 237 7.5. Discussion 240 7.5.1. Performance and neuromuscular function during
intermittent-sprint exercise in the heat. 240 7.5.2. Responses to progressive heat acclimation and training. 245 7.5.3. Neuromuscular responses to intermittent-sprint exercise
in the heat (analysis by group). 247 7.5.4. Limitations 251 7.5.5. Conclusion 253 CHAPTER VIII. GENERAL DISCUSSION 254 8.1 Principle Findings 254 8.2 Mechanistic Overview 256 8.2.1. Progressive acclimation and thermoregulatory markers
of acclimation 257 8.2.2. Progressive acclimation and cardiovascular markers of
acclimation 260 8.2.3. Progressive acclimation and endocrine markers of
Acclimation 261 8.2.4. Progressive acclimation and temporal patterning of
acclimation responses 262 8.2.5 Progressive acclimation and perceptual responses 264 8.2.6. Progressive acclimation, intermittent-sprint performance
and neuromuscular fatigue 266 8.3 Future Perspective and Directions for Future Research 269 8.3.1 Future perspectives 269 8.3.2 Directions for future research 272 8.4 Practical Application of Findings 275 8.5 Conclusion 277 CHAPTER IX. REFERENCES 279 APPENDIX 1 General medical questionnaire and informed consent
form 314 APPENDIX 2 TMS specific participant health questionnaire 315

xii
LIST OF FIGURES
Figure 2.1. Pathways for resynthesis of ATP including the phosphagen system (1), glycolysis (2) and aerobic respiration (3) (Baker et al., 2010).
16
Figure 2.2. The glycolytic pathway (Baker et al., 2010). 19 Figure 2.3. The aerobic pathway demonstrating the conversion of
carbohydrate to pyruvate (1), the Krebs cycle (2) and electron transport (3) (Baker et al., 2010).
20
Figure 2.4. The thermoregulatory control system (Sawka et al., 2011) 27 Figure 2.5. Percentage change in sprint performance from control.
PPO = peak power output; MPO = mean power output; TDR = total distance run; TRT = total run time; ST = sprint time; .* = Significant difference from control.
45
Figure 2.6. Central and peripheral factors contributing to voluntary force production (Gandevia, 2001)
49
Figure 2.7. The central governor model of exercise regulation (Noakes, 2012).
66
Figure 2.8. Schematic representation of the inhibitory feedback model (Amann, 2011).
66
Figure 2.9. Voluntary activation induced by passive hyperthermia (A, Thomas et al., 2006 ; B, Morrison et al., 2004).
70
Figure 2.10. Adaptations to traditional heat acclimation (Armstrong and Maresh, 1991).
78
Figure 2.11. A conceptual model of heat acclimation (Horowitz et al., 2002).
79
Figure 3.1. Modified Monark ergomedic 874 E cycle ergometer with SRM power cranks.
112
Figure 3.2. Modified Monark ergomedic 620 E cycle ergometer with SRM power cranks.
113
Figure 3.3. Schematic of standardised CISP warm-up. 114 Figure 3.4. Schematic representation of the CISP, measurements and
measurement timepoints. 116
Figure 3.5. Environmental chamber at the School of Sport and Service Management human performance laboratories.
119
Figure 3.6. The Physiological strain index (PSI) (Moran et al., 1998). 121 Figure 4.1. Schematic of experimental design with measurements. 134 Figure 4.2. Scatterplot of peak power output (W) in trial 1 and trial 2.
Solid line: Least products regression line E(trial 2) = 158.2 + 1.15(trial 1). Dotted line: 45° line of identity.
139
Figure 4.3. Scatterplot of mean power output (W) in trial 1 and trial 2. Solid line: Least products regression line E(trial 2) = 295 + 1.26(trial 1). Dotted line: 45° line of identity.
140
Figure 5.1 Schematic of experimental design with measurements. 148 Figure 5.2 Mean (±S.D.) Peak Power Output during the CISP in HH,
(hot humid) HD (hot dry) and TEMP (temperate) (sprints 1-14 N = 11; sprints 15-20 N = 8) *Significant difference

xiii
from sprint 4 in HH (P < 0.05). †Significant difference from sprint 5 in HD (P < 0.05). ‡Significantly different from sprint 3 in TEMP (P < 0.05).
153
Figure 5.3. Mean (±S.D.) rectal temperature and weighted skin temperature during the CISP in HH (hot humid), HD (hot dry) and TEMP (temperate). *Significant difference between HH and TEMP (P < 0.05). †Significant difference between HD and TEMP (P < 0.05). ‡Significant difference between all conditions (sprints 1 - 14 and 15-20 P < 0.05).
156
Figure 5.4. Mean (±S.D.) heart rate during the CISP in HH (hot humid), HD (hot dry) and TEMP (temperate) (sprints 1-14 N = 11; sprints 15-20 N = 8) *Significant difference between HH and TEMP (P < 0.05).†Significant difference between HD and TEMP (P < 0.05).
157
Figure 6.1. Schematic of experimental design with measurements. 169 Figure 6.2. Mean (±S.D.) Plasma aldosterone (pg.ml-1) pre and post
exercise on day 1, 6 and 12 in TA, PA and TG. 176
Figure 6.3. Mean (±S.D.) Plasma cortisol (ng.ml-1) pre and post exercise on day 1, 6 and 12 in TA, PA and TG.
177
Figure 6.4. Mean (±S.D.) sweat rate (L.hr-1) in TA, PA and G.*Significant difference from day 1. †Significant difference from A day 6. ††Significant difference from TA and PA day 12 (P<0.05).
178
Figure 6.5. Mean (±S.D.) PPO during CISP 1 and 2 in TA, PA and TG.*Significant difference from CISP 1 (P < 0.05).
183
Figure 6.6. Mean (±S.D.) Work Done during CISP 1 and 2 in TA PA and TG.*Significant difference from CISP 1 (P < 0.05).
184
Figure 6.7. Mean (±S.D.) heart rate (b.min-1) in CISP 1 and 2 following TA, PA and TG.*Significant difference from CISP 1 (P < 0.05).
187
Figure 6.8. Mean (±S.D.) Tre (°C) in CISP 1 and 2 following TA, PA and TG.*Significant difference from CISP 1 (P < 0.05).
188
Figure 7.1. Schematic of experimental design with measurements. 210 Figure 7.2. Digitimer constant current stimulator. 212 Figure 7.3. Magstim 200 and 110 mm double cone coil. 213 Figure 7.4.
Set up for transcranial magnetic stimulation over the motor cortex and femoral nerve stimulation.
213
Figure 7.5. Relationship between MEP area from the vastus lateralis and contraction strength during TMS over the motor cortex. Largest MEP area was recorded during a 50% contraction and at this contraction strength mean MEP area was 60% of maximum M wave.
214
Figure 7.6. Neuromuscular fatigue assessment protocol. 215 Figure 7.7. Data from a single participant demonstrating a
potentiated twitch (Qtw,pot). 218
Figure 7.8 Data from a single participant demonstrating a superimposed twitch (SIT). Data represent the portion of

xiv
MVC in Figure 7.7. marked by dashed lines. 219 Figure 7.9. Representative data from a single participant as an
example of the estimation of resting twitch using linear regression and the y intercept.
220
Figure 7.10. Representative data from a single participant demonstrating cortical silent period.
220
Figure 7.11. PPO (W) and work done (J) during CISP 1 in 33°C, 50% rh. *Significant difference from sprint one (P < 0.05).
223
Figure 7.12. PPO (W) and work done (J) correlated with Tre (°C). 224 Figure 7.13. Maximal voluntary contraction force (N) pre-post CISP 1.
*Significant difference between pre and post CISP 1. 225
Figure 7.14. Cortical (CVA) and peripheral voluntary activation (PVA) (%) pre-post CISP 1. *Significant difference between pre and post CISP 1 (P < 0.05).
225
Figure 7.15. Mean (±S.D.) PPO (W) and Work Done (J) in CISP 1 and CISP 2.
232
Figure 8.1. Classification of the nine heat acclimation criteria that can be used to determine the efficacy of a heat acclimation protocol (decreased heart rate and core temperature in rest and exercise, increased sweat rate and plasma volume, reduced skin temperature, decreased perception of effort / thermal sensation and improved physical performance). Tre rest, Tre e e ecta tem erat re in re t or e erci e sk = skin temperature; PV = plasma volume; HR = heart rate; Swth = sweating threshold; Swrate = sweat rate; SGF = sweat gland function; RPE = rating of perceived exertion; Tsen = thermal sensation; PPO = peak power output; WD = work done.
257
Figure 8.2. Percent change in sprint performance from control for existing studies examining the effect of heat on sprint performance with data for study two of this thesis included for comparison. PPO = peak power output; MPO = mean power output; WD = work done TDR = total distance run; TRT = total run time; ST = sprint time; * = significant difference from control.
267
Figure 8.3. Theoretical continuum of heat acclimation with existing studies and data from current thesis plotted. Existing studies taken from tables in section 2.5.3. & 2.5.4. Progressive heat acclimation represents pooled data from study three and four of this thesis. Position on continuum reflects the number of heat acclimation criteria achieved against the nine identified in section 2.5.
270
Figure 8.4. Classification of heat acclimation (Taylor, 2000). New emerging methods or variation on existing methods shown in red.
271

xv
LIST OF TABLES
Table 2.1. Time-motion analysis data for field-hockey, rugby union and football (mean values).
9
Table 2.2. Experimental design and statistical methods for reliability assessment of intermittent-sprint tests.
24
Table 2.3. Traditional heat acclimation in humans. 89 Table 2.4. Medium to short-term traditional heat acclimation in
humans. 90
Table 2.5. Isothermal strain / controlled hyperthermia heat acclimation in humans.
91
Table 2.6. Alternate heat acclimation in humans. 95 Table 4.1. Peak power output (W) and mean power output (W) for
sprints 1 – 5 in practice trial 1 and trial 2. 137
Table 4.2. Peak power output (W), mean power output (W), work done (J) typical errors of measurement and intra-class correlations for 20 sprints, trial 1 and trial 2.
137
Table 4.3. Peak power output (W), mean power output (W), work done (J), typical errors of measurement and intra class correlations for each phase (Phase 1 = sprints blocks 1-5, Phase 2 = 6-10, Phase 3 = 11-15 and Phase 4 = 16-20), trial 1 and trial 2.
138
Table 5.1 Rectal temperature (Tre, °C) and mean skin temperature (Tsk, °C) pre and post warm up.
151
Table 5.2 Peak power output (W) and work done (J) during the CISP in HH, HD and TEMP.
152
Table 5.3 Peak and mean physiological and perceptual measures during the CISP in HH, HD and TEMP.
155
Table 6.1. Physiological responses to twelve days of TA, PA and TG. 175 Table 6.2. Sweat sodium, potassium and chloride during TA, PA and
TG. 179
Table 6.3. PSI, RPE and Tsen during twelve days of TA, PA and TG. 181 Table 6.4. PPO (W) and Work Done (J) during CISP 1 and 2 in TA PA
and TG. 182
Table 6.5. Physiological responses during CISP 1 and 2 in TA, PA and TG.
185
Table 6.6. Sweat sodium, potassium and chloride during CISP1 and 2 in TA, PA and TG.
190
Table 6.7. RPE, PSI and Tsen during CISP 1 and 2 in TA, PA and TG. 191 Table 7.1. Neuromuscular variables pre-post CISP 1. 226 Table 7.2. Body mass and hydration during PA and TG on day 1, 6
and 12. 227
Table 7.3. Physiological and perceptual responses at rest and exercise in PA and TG on day 1, 6 and 12.
229
Table 7.4. Physiological and perceptual measures during intermittent-sprint exercise before and after PA or TG.
233
Table 7.5. Neuromuscular function pre-post CISP 1 & 2 in PA & TG. 239

xvi
LIST OF EQUATIONS Equation 2.1. sk 28 Equation 2.2. Tbody 28 Equation 2.3. Body heat content (Qc) 28 Equation 2.4. The heat balance equation 29 Equation 2.5. Wet bulb globe temperature (outdoor) 38 Equation 2.6. Wet bulb globe temperature (indoor) 39 Equation 2.7. The discomfort index 39 Equation 2.8. The modified discomfort index 39 Equation 2.9 The physiological strain index 40 Equation 2.10. The environmental stress index 40 Equation 3.1. Calculation of power output 115 Equation 3.2. Wet Bulb Globe Temperature (Indoor) 118 Equation 3.3. Metabolic heat production 120 Equation 3.4. Physiological strain index 120 Equation 3.5. ean in tem erat re sk) 122 Equation 3.6. Body temperature (Tbody) 122 Equation 3.7. Body heat content (BHC) 122 Equation 3.8. Respiratory water loss 123 Equation 3.9. Calculation of plasma volume 125 Equation 3.10. Calculation of plasma volume change 126 Equation 7.1. Calculation of voluntary activation 218 Equation 7.2. Calculation of cortical voluntary activation 219

xvii
LIST OF ABBREVIATIONS
ADP Adenosine diphosphate AMP Adenosine monophosphate ANOVA Analysis of variance ATP Adenosine triphosphate b.min-1 Beats per minute BGT Black globe temperature BHC Body heat content BM Body Mass [Bla] Blood lactate concentration Ca2+ Calcium CISP Cycling intermittent-sprint protocol CK Creatine kinase Cl- Chloride CNS Central nervous system CO2 Carbon dioxide CSP Cortical silent period CV Coefficient of variation CVA Cortical voluntary activation DBT Dry bulb temperature EMG Electromyography ERT Estimated resting twitch FAD Flavin adenine dinucleotide GPS Global positioning system H reflex Hoffmann’ ref e HD Hot dry HH Hot humid Hmax/Mmax Ratio of maximum H wave to maximum M wave HR Heart rate ICC Intraclass correlation IMP Inosine monophosphate K+ Potassium Kg Kilograms km.hr-1 Kilometers per hour l.min-1 Litres per minute LIST Loughborough intermittent shuttle test LOA Limits of agreement M Wave Compound muscle action potential M Metabolic heat production MEP Motor evoked potential Mg2+ Magnesium mmHg Millimeter of mercury MPO Mean power output MRFD Maximum rate of force development MRR Maximum rate fo relaxation ms Milliseconds

xviii
mV Millivolts MVC Maximum voluntary contraction Na Sodium NAD+ Nicotinamide adenine dinucleotide NMF Neuromuscular fatigue protocol O2 Oxygen PA Progressive acclimation PCr phosphocreatine Pi Inorganic phosphate [Pi] Inorganic phosphate concentration PPO Peak power output PSI Physiological strain index Q tw,pot Potentiated twitch Qc Heat content of the human r.min-1 Revolutions per minute RER Respiratory exchange ratio rh Relative humidity RMS Root mean squared RPE Rating of perceived exertion RT0.5 Half relaxation time SIT Superimposed twitch TA Traditional acclimation body Mean body temperature Tcore Core temperature TEM Typical error of measurement TEMP Temperate TG Training group TMS Transcranial magnetic stimulation Tre Rectal temperature Tsen Thermal sensation sk Mean skin temperature Uosm Urine osmolality Usg Urine specific gravity 2 Oxygen uptake 2max Maximum oxygen uptake 2peak Peak oxygen uptake W Watts WBGT Wet bulb globe temperature WD Work done

xix
ACKNOWLEDGEMENTS
Firstly, to my family: Sue, for the six years this work has been in development you have
been a source of constant support. You have provided me with the encouragement to
finally see it through and patiently endured many evenings alone as I sat at a computer in
the lab or the front room. I look forward to our evenings together b t fir t it’ my t rn to
help you. Mam and dad you worked very hard to give me the opportunity to study abroad
and were selfless in letting me go. Thank you for everything that you have done and your
constant support. Finally, to Pat, Sandra, Holly and Niall, thank you for the motivation and
perspective that kept me going when it all seemed a bit grim.
To my supervisors: Neil, your enthusiasm for environmental physiology inspired me to
study in this field as an undergraduate all those years ago. Since then you have
demonstrated what it is to be an excellent supervisor but also a great friend. Your
constant support and encouragement has been essential to the completion of this thesis
but also my personal and professional development. I constantly strive to emulate the
standards you set and hope that one day I can begin to repay you for all that you have
done. Emma, your positive attitude, knowledge and teaching has been essential,
particularly in the latter stages of this thesis. Your expertise helped shape the final
chapters of this work and your patience allowed me to develop my understanding and
learn essential skills. Finally, Paul, you were an integral part of the genesis of this thesis
and I thank you for your contributions in the initial stages of the work.
To the technicians: Ann Attfield, Tom Howes, Ron Shepherd, David Thomas, Alan
A chorn, Patric Smith and Peter Broo . A re earch t dent co dn’t a for a better
support team. Your friendly, approachable personalities, excellent technical support and
willingness to help at any moment have been invaluable throughout the many equipment
issues and troubled testing sessions.

xx
To all of the participants who volunteered for testing. You willingly gave your time and
endured many hours of challenging exercise in the heat coupled with invasive
measurements. Without your commitment this thesis would not have been possible.
To my fellow postgraduate students Dan Wilkinson, Patrick Cangley, Drew Smith, Jess
Mee, Ben Duncan, Oli Gibson, Rosie Twomey, James Wrightson, Carl James, Karl
Stevenson and Ash Willmott. Our many interesting conversations challenged and
developed my understanding but, most importantly, helped bring perspective to my
work.
To Sussex Downs College and the University of Brighton for allowing me the opportunity
to combine my PhD with full-time work and providing me with excellent facilities and the
funding to complete my thesis.

xxi
DECLARATION
I declare that the research contained in this thesis, unless otherwise formally indicated
within the text, is the original work of the author. The thesis has not been previously
submitted to this or any other university for a degree, and does not incorporate any
material already submitted for a degree.
Signed
Dated 12th March 2014
The following published articles have been due to the work contained within this thesis:
Chapter IV
Hayes, M., Smith, D., Castle, P.C., Watt, P.W., Ross, E.Z., & Maxwell, N.S. 2013) “Peak
power output provides the most reliable measure of performance in prolonged
intermittent- rint cyc ing”, Journal of Sports Sciences, 31 (5), 565-572.
Chapter V
Hayes, M., Castle, P.C., Ross, E.Z., & Maxwell, N.S. 2013) “ he inf ence of hot h mid and
hot dry environments on intermittent-sprint exercise performance” International Journal
of Sports Physiology and Performance”. Available:
<http://journals.humankinetics.com/ijspp-in-press/ijspp-in-press/the-influence-of-hot-
humid-and-hot-dry-environments-on-intermittent-sprint-exercise-performance>
[Accessed 20 January 2014].

1
CHAPTER I. INTRODUCTION
Endothermy is suggested to have evolved from increased atmospheric oxygen content
coupled with a need to survive repeated cooling from climate fluctuations (Portner,
2004). Consequently, in contrast to ectotherms that rely on the external environment for
temperature control, endotherms have the capacity to maintain body temperature by
generation of heat through metabolism. As endothermic homeotherms, humans maintain
body temperature at rest over the course of their lifecycle at 37 ± 1.0°C (Cheung, 2010)
and it is suggested this temperature reflects an evolutionary adaptation to maximise
performance capacity (Portner, 2004). Such homeostatic control is achieved through
autonomic and behavioural mechanisms that promote thermoregulation through afferent
thermal sensing, central regulation and efferent responses (Nagashima, 2006; Kurz,
2008).
An inherent advantage of endothermy is the uncoupling of physical performance from
exogenous temperature which permits, for example, predatory activity independent of
normal environmental conditions (Lieberman et al., 2009). A consequence of such activity
is the conversion of metabolic energy to mechanical energy in an inefficient process that
results in 30 - 70% of the energy liberated appearing as thermal energy that will increase
body temperature and therefore, must be dissipated (Gleeson, 1998; Gonzalez-Alonso,
2012). In contrast to fur covered mammals that rely on panting to liberate metabolic
heat, humans have evolved to an essentially glabrous state with a highly developed
sudomotor system that maximises heat loss during physical activity, even in a hot
environment (Jessen, 2001; Lieberman et al., 2009). Such thermoregulatory evolution has
conferred humans with distinct advantages from a survival perspective. Firstly, the ability
to succeed when competing for food in hot conditions with other hair covered mammals
that are forced to slow running speed to maintain body temperature due to inferior heat
loss mechanisms (Jessen et al., 2001; Piantadosi et al., 2003; Lieberman et al., 2009).
Secondly, the ability to outrun and exhaust prey who, due to the coupling of respiration
with locomotion that is incompatible with panting during galloping, are forced to change

2
behaviour, decrease running speed and eventually stop (Jessen, 2001; Lieberman et al.,
2009).
Compared to other mammals humans display superior body temperature control during
exercise in the heat, but are not immune to the debilitating effects of heat stress
particularly when environmental conditions are severe and motivation is high, for
example, during competition. During exercise body temperature increases at a rate
proportional to the exercise intensity and percent of maximal aerobic capacity ( 2max)
and this is consistent within a wide range of environmental conditions, termed the
“ re cri tive zone” Nie en, 1996). D ring e erci e, eva oration of sweat produced by
the 1.6 - 4.0 million eccrine glands (Shibasaki et al., 2006) is the primary mechanism for
maintenance of body temperature, with each litre of sweat evaporated liberating 2.4 MJ
or 680 W.hr-1 of thermal energy (Gleeson, 1998; Kenney, 1998). During high intensity
exercise, heat production can be 800 - 1500 W (Verdaguer-Codina et al, 1993; Gleeson,
1998; Brotherhood, 2008) and when combined with high heat stress, the evaporative
requirement of the exercising athlete to maintain body temperature can exceed the
evaporative potential of the environment. Under such conditions, thermal energy is
stored, body temperature rises and hyperthermia ensues contributing to fatigue and
compromised exercise performance (Morris et al., 1998, 2000; Drust et al., 2005).
Heat acclimation, described as the physiological adaptations to heat brought about by
repeated exposure to a controlled laboratory environment (Armstrong and Maresh,
1991), has been used as a strategy to alleviate the deleterious effect of heat in
occupational and sporting settings for over seventy years. From the initial pioneering
research of Robinson et al., (1943) and Bean and Eichna (1943, 1945) that characterised
the pattern of response to dry and humid heat, to the work of Lind and Bass (1963) that
identified the ‘o tima ’ e o re time for deve o ment of heat acc imation, o r
understanding of physiological adaptation to heat acclimation and how this may be
manipulated to optimise responses has developed considerably. More research, however,
is required to elucidate fully the interplay of key protocol variables and genotypic markers

3
and how manipulation of the former ultimately affects acquisition of the heat acclimated
phenotype. Typically, based on current evidence, acquisition of the heat-acclimated
phenotype is considered to require 10 - 14 days of exercise under heat stress conditions,
when e erci e i erformed for 60 – 100 min te at 0 2max (Armstrong and
Maresh, 1991; Maughan and Shirreffs, 2004). However, 66 - 75% of adaptation has been
shown to occur within 4 - 6 days and nearly complete acclimation has been demonstrated
within 7 - 10 days (Pandolf, 1998). Many classic responses to heat acclimation including
improved cardiovascular stability, decreased resting and exercise core temperature and
heart rate, increased sweat rate and plasma volume display a biphasic response pattern.
Current research, however, suggests this may be protocol dependent and an artefact of
decreased strain inherent in traditional constant work-rate heat acclimation methods
(Patterson et al., 2004). Isothermal strain heat acclimation circumvents this limitation by
necessitating exercise at a target core temperature to maintain physiological strain
(Taylor, 2000). Traditional and isothermal strain protocols constitute the primary means
by which heat acclimation has been induced. However, they necessitate exposure to high
heat stress from the outset, evoke a decaying physiological strain (traditional) and require
a high work rate (isothermal) and may, therefore, be untenable for certain individuals, for
example, those who are less heat tolerant. Progressive heat acclimation, where exercise
at a constant work-rate is performed under a gradually increasing heat stress may
circumvent many of these limitations and emerging evidence (Daanen et al., 2011; Burk
et al., 2012; Costa et al., 2014), in addition to comparative evidence from intermittent-
hypoxic training, provides support for progressive models of acclimation (Hamlin and
Hellemans, 2007).
Heat acclimation is used frequently to confer adaptation to the heat in athletes involved
in endurance and submaximal exercise. However, globalisation has increased the
incidence of major team-sport competition in hot humid and hot dry environments. As
such, many field-based team-sport athletes frequently compete in conditions of high heat
stress and will do so again in the 2014 World Cup, 2016 Olympic Games, 2018
Commonwealth Games and 2022 World Cup. Further, due to broadcasting pressure on
tournament organisers these athletes may be required to compete at periods when

4
higher heat and humidity persist, for example the schedule of England versus Italy at the
2014 Football World Cup (Vickery, 2013). In controlled laboratory and field-based
research, such environments have been shown to exacerbate fatigue and compromise
intermittent-sprint exercise performance, especially when the duration and work:rest
patterns of the protocols simulate those of field-based team-sports (Morris et al., 1998,
2000, 2005; Sunderland and Nevill, 2005). Further, intermittent-sprint exercise is known
to produce greater thermal strain than continuous exercise of the same average work
intensity (Nevill et al., 1995). Therefore, with the exception of a few recent studies
(Sunderland et al., 2008; Petersen et al., 2010; Brade et al., 2013) it is surprising that
more research has not examined heat acclimation to alleviate fatigue and performance
decrements using an intermittent-sprint model of exercise. Those studies that have
examined heat acclimation for intermittent-sprint exercise (Sunderland et al., 2008;
Petersen et al., 2010; Brade et al., 2013) have used a short-term intermittent-exercise
acclimation protocol that is suggested to provide incomplete heat acclimation responses
(Pandolf, 1998) and may question the efficacy of intermittent heat acclimation models. As
such, further work is required to determine how acclimation protocols may be
manipulated to provide optimal benefit for intermittent-sprint exercise in the heat.
With regard to neuromuscular fatigue during intermittent-sprint exercise, the research is
equivocal. Peripheral fatigue is considered the primary fatigue mechanism during exercise
of this type, and there has been mixed evidence as to whether central fatigue exists
during intermittent-sprinting (Racinais et al., 2007; Perrey et al., 2010b). Current research
in this area has not however, (i) used protocols to simulate field-based team-sports, (ii)
used a hot environment and (iii) used a method that allows the existence of central
fatigue to be localised. Further, no work has examined whether heat acclimation can
alleviate neuromuscular fatigue in an intermittent-sprint exercise model in the heat.
Considering the aforementioned, the primary aim of this thesis was to assess the efficacy
of a novel progressive heat acclimation protocol using an intermittent-sprint model of
exercise that simulated field-based team-sports. A secondary aim was to examine fatigue

5
during intermittent-sprint exercise in the heat and the efficacy of heat acclimation as an
intervention to alleviate this fatigue.
This thesis is presented in the following chapters;
Chapter II provides a review of the literature starting by examining the movement and
general energetic demands of field-based intermittent-sprint exercise, followed by
consideration of the reliability of protocols used to assess intermittent-sprint exercise
and indices of heat stress. The review also examines the effect of heat stress on
intermittent-sprint exercise performance, the mechanisms of central and peripheral
fatigue that may contribute to exercise of this type and how neuromuscular fatigue is
measured. Finally, this chapter culminates with a review of heat acclimation methods
and adaptations.
Chapter III provides the common methods that were used throughout all
experimental chapters.
Chapter IV presents the first study that examined the reliability of the cycling
intermittent-sprint protocol (CISP). This protocol is designed to simulate the work:rest
patterns of field-based team-sports over a duration equivalent to one half of a match
and can be used to assess the effect of an intervention, for example, heat acclimation,
on physiological, perceptual and performance responses during exercise of this type
under conditions of heat stress.
Chapter V uses the CISP to identify the effect of differing combinations of
environmental factors (hot, humid and hot, dry) matched for heat stress on
intermittent-sprint exercise to determine whether the composition of the

6
environment is important when determining the design of a heat acclimation
protocol.
Chapter VI presents a study that investigated the efficacy of a progressive heat
acclimation protocol that used stepwise increases in heat stress to elevate
physiological strain. The ability of this method to evoke classic heat acclimation
responses was compared to a traditional, constant work-rate protocol. In addition,
this study examined the effect of the progressive heat acclimation protocol compared
to the traditional protocol on intermittent-sprint exercise under conditions of heat
stress.
Chapter VII examined neuromuscular fatigue before and after intermittent-sprint
exercise under heat stress using transcranial magnetic stimulation (TMS) and the
interpolated twitch technique. Further, the study investigated whether the
progressive heat acclimation protocol in chapter VI alleviated neuromuscular fatigue
that was experienced during intermittent-sprint exercise.
Chapter VIII comparatively discusses the findings from the experimental studies with
particular examination of the efficacy of progressive heat acclimation as a method to
evoke classic heat acclimation responses, but also its effect on intermittent-sprint
exercise and neuromuscular fatigue during exercise of this type. This chapter
examines models of heat acclimation from an efficacy perspective and considers heat
acclimation responses that may contribute to an optimal heat acclimation protocol.

7
CHAPTER II. LITERATURE REVIEW
2.1. Introduction
This literature review will provide a synopsis of the research examining intermittent-
sprint exercise and the performance and physiological responses to heat stress. In
addition, it will examine possible causes of fatigue during intermittent-sprint exercise and
the potential for heat acclimation to alleviate the deleterious effects of heat stress.
Specifically, the review will begin in section 2.2. by examining the movement demands
and energetic requirements of common field-based team-sports and consider the
reliability of protocols designed to assess performance and physiological responses during
exercise of this type. In section 2.3., the process of thermoregulation and how exercise
alters thermoregulation will be considered. From there the review will provide a historical
overview of the quantification of heat stress in sport and exercise research and move to
consider the impact of heat stress on physiological and performance responses during
intermittent-sprint exercise in the heat.
Considering the deleterious effect of heat stress on exercise performance, section 2.4.,
will begin by examining neuromuscular fatigue and specifically central and peripheral
fatigue in intermittent-sprint exercise in the heat. Finally, in section 2.5., the review will
consider the development of heat acclimation methods and protocols. Adaptations to
heat acclimation at a cellular and systemic level are then considered before focussing on
the effect of heat acclimation upon the physiological and performance responses to
intermittent-sprint exercise in the heat.

8
2.2. Intermittent-Sprint Exercise
2.2.1. Time-motion analysis of field-based team-sports
Many team sports are characterized by periods of intermittent high-intensity activity that
require athletes to exercise maximally for short periods, interspersed with longer spells of
recovery and lower intensity activity (Williams, 1990). Time-motion analysis research
permits quantification of such activity in field-based sports and has developed from initial
qualitative analysis to notational and video analysis to use of Global Positioning Systems
(GPS) to characterize the movement patterns in the game. The following section will
provide insight into time-motion analysis research for the field-based team-sports of
hockey, rugby union and football. Accepting that positional differences exist, mean data
derived from existing studies (Table 2.1.) in the field will be used to provide an overall
insight to the general demands of intermittent field-based team-sports.

9
Table 2.1. Time-motion analysis data for field-hockey, rugby union and football (mean values).
Study Sport Participants (n=)
Position % time in HIA
% time in LMIA
Sprint Duration (s)
Sprint distance (m)
Sprint frequency
Recovery between sprints (s)
Total distance run (m)
CIA (s) (total number)
Lothian and Farrally, (1994)
field-hockey
TF (12) All 22 78 3.1 - 75 56 - -
Boddington et al., (2002)
field-hockey
EF - 2.6 97.4 - - - - 3901(63 min GT)
-
Spencer et al., (2004)
field-hockey
EM (14) All 5.6 94.4 1.8 - 30 140 - 5.4 (780)
MacLeod et al., (2007)
field-hockey
EF (12) All 7.9 92.1 2.9 - 24 (48.5 ± 12.7 min
GT)
120 - 3.0 (960)
Gabbett, (2010)
field-hockey
EF (14) All 2.7 97.3 - 11 - 20 91 - 6600 -
Macutkiewicz &Sunderland, (2011)
field-hockey
EF (25) All 6.4 93.6 2.5 14 ± 3 17 - 5541 (48 ± 4 min GT)
-
Docherty et al., (1988)
Rugby Union
TM (13) All - - 2.1 - 21 156 - -
Duthie et al., (2005)
Rugby Union
EM (47) All 8.5 91.5 2.6 - 19 307 - 7.5 (711)
Deutsch et al., (2007)
Rugby Union
EM (25) All 8.3 91.7 2.6 12 - 28 15 80 - 110 - -
Roberts et al., (2008)
Rugby Union
EM (29) All 7.7 92.3 1.2 8 20 - 6006 -
Cunniffe et al., (2009)
Rugby Union
EM (2) All 11 89 - 15 - 20 27 - 6953 -
Coughlan et al., (2011)
Rugby Union
EM (2) All 7.6 92.4 - - 9 - 6714 -
Cahill et al., (2013)
Rugby Union
EM (120) All 0.7 98.8 - - - - 6198 -

10
Study Sport Participants (n=)
Position % time in HIA
% time in LMIA
Sprint Duration (s)
Sprint distance (m)
Sprint frequency
Recovery time between sprints (s)
Total distance run (m)
CIA (s) (total number)
Bangsbo et al., 1991
Football EM (14) All - - 2.0 - 19 284 10800 7
Reilly and Thomas, (1976)
Football EM (40) All - - - 15.7 62 90 - 6.4
Withers et al., (1982)
Football EM (20) All - - 3.7 22.4 30 180 - -
Yamanaka et al., (1988)
Football EM (10) TM (39)
All - - 3.37 - 39 139 - 6.6
Barros et al., (1999)
Football EM (25) All - - - 13 55 98 - -
Rienzi et al., 2000
Football EM (17) All 5 95 - - - - 8638 -
Mohr et al., (2003)
Football EM (42) All 9 91 2.0 - 33 - 10595 -
Krustrup et al., (2005)
Football EF (14) All 6 94 - 6 26 - 10300 4 (1459)
Bloomfield et al., (2007)
Football EM (55) All 4.8 95.2 - - - - - -
Bradley et al., 2009
Football EM (370) All 9.0 91 1.2 14 18 72 10714 -
Di Salvo et al., 2010
Football EM (717) All - - - 8 27 - - -
Rey et al., (2010)
Football EM (42) All 8 92 - 21.4 13 131 11053 -
Andrzejewski et al., (2013)
Football EM (147) All - - 90% < 5 10-20(48%) > 20 (45%)
12 - - -
HIA = high intensity activity; LMIA = low to moderate intensity activity; CIA = changes in activity; EM = elite males; EF = elite females; TM = trained males; GT = game time; - = data not available. All = data for all playing positions examined aggregated.

11
2.2.1.1. Time in low and high intensity activity
Early research in elite female field-hockey posited that 78% of match time involved low to
moderate intensity activities (LMIA) such as standing, walking and jogging and 22% high
intensity activity (HIA) (Lothian and Farrally, 1994, Table 2.1.). Recent work refutes this,
suggesting greater than 90% of match time in elite field-hockey involves LMIA with the
disparity attributed to differences in classification system and rule change (Boddington et
al., 2002; Spencer et al., 2004; MacLeod et al., 2007, Table 2.1.). At elite female club level,
97.4% of game time is attributed to low intensity activity (Boddington et al., 2002),
however, at international level figures for LMIA of 94 and 92% have been reported for
males and females respectively (Spencer et al., 2004; MacLeod et al., 2007, Table 2.1.),
but are based on analysis of a single match. When multiple matches are examined GPS
data for elite club and international females indicates 97.3% and 93.6% of a match
respectively, involves LMIA with differences in classification methods accounting for
reported differences (Gabbet, 2010; Macutkiewicz and Sunderland, 2011).
Similar to field-hockey, in elite club rugby percentage of time in LMIA and HIA is reported
as 91.5 and 92.3% and 8.4 and 7.7% respectively, when analysed across matches (Duthie
et al., 2005; Deutsch et al., 2007; Roberts et al., 2008, Table 2.1.). More recently, GPS
tracking of ninety-eight English Premiership players across forty-four matches has
indicated the percentage of time in LMIA and HIA as 98.8 and 0.7% respectively; the
greater emphasis on LMIA possibly being explained by the differing classification system
used for GPS time-motion analysis (Cahill et al., 2013, Table 2.1.). In comparison to field-
hockey, fewer data exist at international level, but one recent study using GPS reported
92.4 and 7.6% of match time involved LMIA and HIA respectively (Coughlan et al., 2011,
Table 2.1.). While this study reflects elite club data, generalisability is limited by a small
sample size (Table 2.1.).
The distribution of playing time across LMIA and HIA in elite football is similar at
international and club level and reflects patterns observed in both field-hockey and rugby

12
union. At club level approximately 91 - 95% of time is dedicated to LMIA and 9 - 5% to HIA
during a match (Mohr et al., 2003; Bloomfield et al., 2007; Bradley et al., 2009) At
international level, although based on only one study 95 and 5% of time are dedicated to
LMIA and HIA respectively (Rienzi et al., 2000). Although few studies exist on elite females
players similar distribution of time is reported for LMIA and HIA at 94 and 6% respectively
(Krustrup et al., 2005, Table 2.1.).
2.2.1.2. Sprint duration, distance and recovery
The contribution of HIA to the total activity profile in field-based sports is small. Yet, it has
been demonstrated such activity precedes significant moments in game play and
therefore, may be considered critical to the outcome of a match (Reilly, 1997; Spencer et
al., 2004). Consequently, a number of studies have investigated the contribution of HIA
such as sprinting and this activity type has received increasing attention in recent
research. In field-hockey, sprinting is reported to comprise ~ 1.9 ± 0.8% of HIA, equating
to 24 ± 7 sprints per game of 2.57 ± 0.57 s over 14 ± 4 m (Lothian and Farrally, 1994;
Spencer et al., 2004; MacLeod et al., 2007; Gabbett, 2010; Macutkiewicz and Sunderland,
2011), but distances up to 20 m are suggested commonplace (Gabbett, 2010). Further,
mean maximal data for elite males indicates maximal sprints of 4.1 ± 2.1 s and distances
of 30 - 40 m (Spencer et al., 2004). Fifty percent of recovery times between sprints are
reported to be > 60 s with mean values of 2 minutes observed (Spencer et al., 2004;
MacLeod et al., 2007).
Similar to field-hockey, mean data for all playing positions in elite rugby union indicates ~
0.8% HIA is sprinting based (Duthie et al., 2005; Deutsch et al., 2007; Cunniffe et al.,
2009). The number of sprints completed during a rugby union match is suggested to
range from 19 - 26 with a mean sprint time of 1.9 s and distance of ~ 16 m (Docherty et
al., 1988; Duthie et al., 2005; Deutsch et al., 2007; Roberts et al., 2008; Cunniffe et al.,
2009, Table 2.1.). Mean recovery between sprints is reported as 232 s (Docherty et al.,

13
1988; Duthie et al., 2005). With respect to total distance run at sprinting speed, recent in-
game GPS data suggests ~ 346 m is covered during activity of this type (Cahill et al., 2013).
In football, elite players complete between 11 - 55 sprints, with the range probably
reflecting the activity classification used (Bangsbo et al., 1991; Barros et al., 1999; Mohr
et al., 2003; Andrzejewski et al., 2013, Table 2.1.). In contrast to field-hockey and rugby
nion, ’Donogh e and Par er 2002) gge t the mean rint d ration a ~ 3. and
recent work using GPS indicates 90% of sprints in elite football are < 5 s (Andrzejewski et
al., 2013). Mean individual sprint distance has been reported as ~ 13 - 23 m and players
regularly cover a total sprint distance of ~ 160 - 300 m (Bangsbo et al., 1991; Rienzi et al.,
2002; Di Salvo et al., 2009, 2010; Andrzejewski et al., 2013). Recovery periods are noted
to range from 32.3 ± 7.9 s to 27.7 ± 4.5 s, but other research suggests recovery between
sprints in elite football is likely to range from 72 - 284 s (Bangsbo et al., 1991; Barros et
a ., 1999 ’Donogh e and Par er, 2002 Brad ey et a ., 2009, ab e 2.1.).
2.2.1.3. Total match distance and motion changes
Total distance covered in field-hockey by elite females has been reported as ~ 6500 m,
but no indication of match duration was provided (Gabbett, 2010). Macutkiewicz et al.,
(2011) however, suggest in 48 ± 4 minutes of match time elite females cover 5541 ±
1141m. During a match players are reported to complete 780 motion changes in a 71
minute game and a change in activity every 5.5 s (Spencer et al., 2004), but more recent
work incorporating lunging as HIA reported 960 ± 272 motion changes in an average
game time of 48.5 ± 12.7 minutes in females equating to an activity change every 3 s
(MacLeod et al., 2007).
Similar to field-hockey, elite male rugby union players are reported to cover total
distances of ~ 6430 ± 558 m during a match (Roberts et al., 2008; Cunniffe et al., 2009;
Coughlan et al., 2011; Cahill et al., 2013). Work-to-rest ratios are reported as ranging from

14
1:5.8 to 1:14.6 depending on how the activity is classified (Deutsch et al., 2007; Cunniffe
et al., 2009). With respect to changing patterns of play, 678 - 742 changes in activity have
been reported during an 80 minute match representing a change in activity every 3 - 4 s
(Duthie et al., 2005; Cunniffe et al., 2009).
Total distance travelled during an elite football match is ~ 10350 ± 874 m, with a range of
8 - 14 km (Reilly, Rienzi et al., 2000; Mohr et al., 2003; Reilly, 2003; Krustrup et al., 2005;
Bangsbo et al., 2006; Bloomfield et al., 2007; Bradley et al., 2009; Rey et al., 2010, Table
2.1.). With respect to activity changes, elite players are reported to complete 750 - 1500
discrete movements during a ninety minute match, with a change in activity every 4 - 6 s
(Reilly, 2003; Bangsbo et al., 2006; Bloomfield et al., 2007).
2.2.1.4. Progression of time-motion analysis variables during a match
In field-hockey, as a half progresses players walk and stand more and jog less, especially
in the second half of a match (Spencer et al., 2004). In addition, the number of sprints
completed in the second half is reduced compared to the first half and there is more time
spent walking and less cruising post-sprint in the second half (MacLeod et al., 2007).
In elite rugby union much work has focused on positional differences as opposed to
change in performance variables over time. Early work suggested that movement
patterns were similar between halves and fatigue did not elicit a marked decrease in
overall activity level (Duthie et al., 2005). Roberts et al., (2008) in part confirm this finding
with no significant difference in high intensity activity between halve of a match, but did
observe fewer bouts of high intensity running after the final five scrums compared to the
first five. In addition, total distance covered was lower at 50 - 60 minutes and 70 - 80
minutes compared to the first 10 minutes (Roberts et al., 2008).

15
In football, Bradley et al., (2009) reported that, in FA Premier League players although
average recovery time between very high intensity bouts was 72 ± 28 s, recovery time
was 28% longer in the last 15 minutes compared to the first 15 minutes of a match. In
addition, ~ 20% less high intensity running was completed in the last compared to the
first 15 minutes of a game (Bradley et al., 2009). Similarly, Di Salvo et al., (2009) observed
that total high intensity running and total sprint distance significantly decline in the
second half of a match with the greatest decrements observed in wide midfielders and
attackers.
2.2.1.5. Summary
Time-motion analysis of field-hockey, rugby union and football has developed significantly
in the last forty years. From qualitative and notational analysis, performance is now
assessed through video player tracking systems, but also the use of GPS in-game. This has
resulted in significant data generation for a myriad of variables, but, as seen, comparison
of findings is sometimes complicated by use of different classification systems or addition
of different variables to an existing system. However, from the research presented the
intermittent nature of team sports such as hockey, football and rugby union is clear with
players completing between 5 and 14 km during a match incorporating up to 1500
movement changes during the game with a change every 4 - 6 s. Similarly, players in
these sports are suggested to complete between ten and sixty sprints per game over an
average distance of 10 and 20 m with recoveries up to 400 s covering a total sprint
distance of up to 600 m. These data, combined with the observed deterioration in many
indicators of HIA during a match, clearly indicate that intermittent high-intensity activity
as observed in field-based team sports poses a significant physiological challenge for the
exercising athlete.

16
2.2.2. Energetics of intermittent-sprint exercise
2.2.2.1. Metabolic pathways for ATP production
Intra muscular concentrations of ATP in humans have been estimated at ~ 5 - 6 mmol.kg-1
wet muscle or 20 - 25 mmol.kg-1 dry muscle (Glaister, 2005; Mougios, 2006; Baker et al.,
2010). During brief, intense exercise an ATP turnover rate of ~ 10 - 15 mmol.kg-1.s-1 has
been observed (Gaitanos et al., 1993; Bogdanis et al., 1996). Therefore, in brief maximal
exercise, intramuscular stores of ATP can sustain exercise for ~ 1 - 3 s (Glaister, 2005;
Mougios, 2006; Baker et al., 2010). Resting concentrations of ATP in skeletal muscle are
optimal for maintaining cellular homeostasis and these levels are rigorously defended to
avoid cellular catastrophe. As such, during brief maximal exercise, despite a 1000 fold
increase in ATP demand, muscle ATP decreases only 1 - 2 mmol.kg-1 wet weight or 4 - 8
mmol.kg-1 dry weight, but a mismatch between ATP hydrolysis and supply persists
(Glaister, 2005; Baker et al., 2010). Consequently, satisfying the energetic demands of
brief maximal exercise requires the activation and integration of three energy-producing
pathways (Figure 2.1.).
Figure 2.1. Pathways for resynthesis of ATP including the phosphagen system (1),
glycolysis (2) and aerobic respiration (3) (Baker et al., 2010).

17
2.2.2.2. Phosphocreatine, ADP and AMP
The primary mechanism for ATP resynthesis during intense exercise is degradation of
phosphocreatine (PCr) by creatine kinase (CK) and subsequent phosphorylation of ADP
(reaction 1).
(Reaction 1; Glaister, 2005)
As this process involves a single reaction to phophorylate ADP to ATP coupled with the
high activity of CK and proximity of PCr to myosin heads, it represents the fastest pathway
for ATP resynthesis and permits rates of ATP resynthesis of up to 2.6 mmol.kg-1.s-1 to be
achieved within 1 - 2 s (Mougios, 2006). With resting intramuscular PCr concentrations of
19 - 21 mmol.kg-1 wet muscle or 75 - 85 mmol.kg-1 dry muscle and maximal turnover rates
between 7 - 9 mmol.kg-1.s-1, PCr provides for approximately 5 - 7 s of energy provision in
intense exercise (Gaitanos et al., 1993; Parolin et al., 1999; Glaister, 2005; Spencer et al.,
2005; Mougios, 2006). Effective resynthesis maintains intracellular ATP concentration at ~
73% of resting immediately post 30 s of sprint exercise and at ~ 68% of baseline after ten
6 s sprints (Gaitanos et al., 1993; Bogdanis et al., 1996). Conversely, PCr concentrations
are reduced to ~ 16% of pre-exercise concentrations after such exercise (Gaitanos et al.,
1993; Bogdanis et al., 1996).
During intense exercise when ATP hydrolysis exceeds resynthesis intracellular ADP
concentration is increased. In such circumstances additional resynthesis of ATP can occur
through the adenylate kinase reaction (reaction 2).
(Reaction 2; Glaister, 2005)

18
Adenylate kinase catalyses the addition of a terminal phosphate of one ADP molecule to a
second, promoting ATP resynthesis at rates up to 0.9 mmol.kg-1.s-1 (Mougios et al., 2006).
As a consequence of adenylate kinase mediated ATP resynthesis, intracellular
concentration of AMP is increased (Glaister, 2005; Mougios et al., 2006; Baker et al.,
2010). Presence of increased intracellular AMP activates two important glycolytic
enzymes, phosphorylase and phosphofructokinase increasing the glycogenolytic and
glycolytic activity respectively, promoting increased rates of ATP resynthesis (Baker et al.,
2010). In addition, exercise-induced metabolic acidosis and reduced ATP concentration
activates adenylate deaminase that catalyses the conversion of AMP to IMP and
eventually NH4. Although conversion of AMP to IMP does not directly contribute to ATP
resynthesis elimination of AMP promotes enhanced resynthesis of ATP (Mougios, 2006;
Baker et al., 2010). If intramuscular PCr declines below 60% of resting concentration
further degradation of IMP may occur (Karatzaferi et al., 2001). Under these conditions, a
portion of the IMP produced in intense exercise may be degraded to inosine and
hypoxanthine (Stathis et al., 1999). In such circumstances, these compounds may be
resynthesised to IMP via the purine salvage pathway or move to the plasma (Stathis et al.,
1999). Loss of such compounds reduces the purine nucleotide pool making the
resynthesis of ATP in recovery a protracted process (Mougios, 2006).
2.2.2.3. Anaerobic glycolysis
Anaerobic glycolysis is activated within 2 - 3 seconds of exercise, being initiated due to
increase in Pi and activation of the gylcolytic enzyme phosphorylase, by altered AMP:ATP
ratio, increased cytosolic Ca2+ concentration and from the increase of epinephrine
(Mougios, 2006; Baker et al., 2010, Figure 2.2.).

19
Figure 2.2. The glycolytic pathway (Baker et al., 2010).
Anaerobic glycolytic production of ATP is initiated by either the phosphorylation of
glycogen to glucose-1-phosphate and subsequent conversion to glucose-6-phosphate by
phosphoglucomutase, or, the phosphorylation of glucose to glucose-6-phosphate by
hexokinase (Mougios, 2006; Baker et al., 2010, Figure 2.2., phase 1). Subsequently,
phosphoglucose isomerase catalyses glucose-6-phosphate conversion to fructose-6-
phosphate and increased phosphofructokinase activity, due to low ATP and PCr
concentrations coupled with increased AMP concentration, results in Fructose-1-6-
bisphosphate production (Mougios, 2006; Baker et al., 2010). From this compound a
further seven reactions are required to achieve ATP production and the end product
pyruvate (Figure 2.2., phase 2). As a consequence the maximal glycolytic ATP turnover
rate is ~ 5 – 9 mmol.kg-1.s-1 which is achieved after 10 - 15 s of exercise (Glaister, 2005;
Spencer et al., 2005; Baker et al., 2010). During anaerobic glycolysis the conversion of
pyruvate to lactate reduces end product inhibition of glycolysis and ensures regeneration

20
of cytosolic NAD+ as the hydrogen accepted by NAD+ during stage six (Figure 2.2., Phase 2)
is donated to pyruvate via lactate dehydrogenase (Astrand et al., 2003; Baker et al.,
2010).
2.2.2.4. Aerobic respiration
Evidence suggests that in repeated sprint exercise there is an increasing contribution of
aerobic metabolism to ATP regeneration with up to 49% of energy being provided
aerobically during 30 s repeated efforts (Gaitanos et al., 1993; Bogdanis et al., 1996).
Figure 2.3. The aerobic pathway demonstrating the conversion of carbohydrate to
pyruvate (1), the Krebs cycle (2) and electron transport (3) (Baker et al., 2010).
The conversion of carbohydrate to pyruvate signifies the initial step in aerobic
metabolism (Figure 2.3., part 1) Subsequently, Pyruvate and the electrons and protons of
glycolysis mediated NAD+-NADH reduction enter the mitochondria where pyruvate reacts
with coenzyme A in the mitochondrial matrix to produce Acetyl coenzyme A (Mougios,
2006; Baker et al., 2010). Acetyl coenzyme A enters the Krebs cycle (Figure 2.3., part 2) in

21
the mitochondria where a series of nine reactions produce oxaloacetate. In addition,
three NAD+ are converted to NADH, one FAD is converted to FADH2 and one ATP is
produced (Mougios, 2006). The compounds NADH and FADH are then oxidized by
transferring their electrons to oxygen in the electron transport chain (Figure 2.3., part 3)
to produce large amounts of energy (Mougious, 2006). This energy is then used in
oxidative phosphorylation to synthesise large quantities of ATP (Mougios, 2006).
2.2.2.5. Energy production in intermittent-sprint exercise
When ten 6 s sprints are completed with 30 s recovery glycolysis and PCr contribute 44
and 56% respectively, to ATP production in the initial sprint. By the final sprint, however,
glycolytic contribution to ATP requirement is decreased to 16% with an 80% contribution
from PCr (Gaitanos et al., 1993). Overall, in the latter stages of intermittent sprinting, ATP
production rate from anaerobic sources is reduced to a greater extent than power output
and lactate concentration remains unchanged suggesting that ATP resynthesis in the final
stages of this activity is mainly derived from PCr degradation and aerobic metabolism
(Gaitanos et al., 1993). It is clear therefore, that during intermittent-sprint exercise, the
contribution of energy producing pathways to ATP provision is altered as the activity
progresses. However, it is important to note that much of the research examining
energetics in intermittent-sprint exercise has used sprinting frequencies, durations and
recoveries that do not replicate those observed in team sports. Spencer et al., (2005)
propose that in a 3 s sprint 55% of energy required will come from PCr degradation, 32%
from anaerobic glycolysis, 10% from stored ATP and 3% from aerobic metabolism.
However, with the varying sprint demands of team-sports it is likely that this profile will
alter with the sprint duration, number of sprints and the recovery period allowed.
When sprint distances similar to those in field-based team-sports are interspersed with 30
s recoveries post-sprint blood lactate values are higher after 30 and 40 m sprints
compared to 15 m (Balsom et al., 1992a). Similarly, for 30 and 40 m sprints final times are
significantly slower and plasma hypoxanthine, uric acid and oxygen uptake are

22
significantly elevated compared to the 15 m sprints (Balsom et al., 1992). Further, when
repeated 5 s sprints are completed with 25, 50 and 100 s of passive or active recovery,
peak power and muscle oxygenation is lower and percentage decrease in peak power
higher in the 25 and 50 s recoveries during active compared to passive recovery (Ohya et
al., 2013). Similar findings were reported by Dupont et al., (2004) using a different
intermittent protocol and together these studies indicate that active recovery may
interfere with PCr resynthesis and reoxygenation of myoglobin during intermittent
sprinting. Taken together, these data serve to illustrate the importance of recovery
duration and while it is suggested that short active recoveries up to sixty seconds can
impede intermittent sprinting it is also important to note that during intermittent-sprint
work using sprints similar to those observed in team-sports, performance can be
sustained with recovery durations of 100 s and above even when fifteen sprints are
completed.
Some of the decrease in performance in intermittent sprint exercise can be attributed to
the decrease in the absolute contribution of PCr to the total ATP production during
successive sprints. In addition, the reduction in glycogenolytic and glycolytic activity may
contribute to the decrement in performance during exercise of this type (Glaister, 2005;
Billaut and Bishop, 2009).
2.2.3. Reliability assessment in intermittent-sprint exercise
As previously identified (section 2.2.) the contribution of sprinting to the overall activity
profile in field-based team-sports is small (1 - 1.5%; Mohr et al., 2003; Duthie et al., 2005;
Cunniffe et al., 2009), but this activity frequently precedes significant moments in play
and may be critical to the outcome of a match (Reilly, 1997; Spencer et al., 2004).
Consequently, a number of performance-based protocols have been devised to examine
the physiological and metabolic demands of activity in field-based sports. Many of these
assess repeated sprinting ability, e.g. the Loughborough Intermittent Shuttle Test (LIST),
but recent tests also incorporate sport specific movements e.g. lunging, tackling,

23
scrummaging, rucking and mauling (Nicholas et al., 2000; Roberts et al., 2010; Singh et al.,
2010; MacLeod and Sunderland, 2012). Knowledge and understanding of the reliability or
repeatability1 of such tests is essential to accurate interpretation of interventional change
and the ability to distinguish worthwhile change from variation inherent in the test.
Therefore, the reliability of these tests will be considered in this section.
As detailed in table 2.2., a number of statistical techniques have been used either
singularly or in combination to determine reliability in intermittent sprint exercise,
including typical error of measurement (TEM), coefficient of variation expressed as a
percentage (CV,%), limits of agreement (LOA) and intra-class correlation coefficient (ICC).
While LOA provide evidence of absolute reliability, it is different to TEM and CV as it
assumes a population of individual test-retest differences (Atkinson and Nevill, 1998).
Hopkins (2000a), however, suggests that LOA are restricted as they are biased by sample
size, cannot be used in single trials and 95% limits are too stringent within an athletic
population. Considering the aforementioned, TEM and ICC are being used more
frequently to report reliability of measures. TEM is the average deviation from the mean
and i the tandard deviation in each artici ant’ mea rement between te t after any
shifts in the mean have been taken into account (Hopkins, 2000a). Although a low TEM is
associated with reliable measures, there is limited evidence in the literature as to how
this statistic should be interpreted (Atkinson and Nevill, 2001). However, guidelines for
expected TEM for a range of physical tests are reported in the literature and a TEM score
of less than 5% is recommended for physical tests (Tanner and Gore, 2013). ICC is
designed to analyse repeated measures data on the same variable and is sensitive to
changes in both the order and magnitude of the repeated values (Hopkins, 2000a). An ICC
of a minimum of 0.80 is considered acceptable for physical measures (Lemmink et al.,
2004).
1 Repeatability relates to the variation in repeat measurements on the same subject under identical conditions.
Reliability relates the magnitude of the measurement error in observed measurements to the inherent
variability in the ‘error-free’ or underlying level of the quantity between subjects (Bartlett and Frost, 2008).
For the purposes of this thesis these terms will be used synonymously.
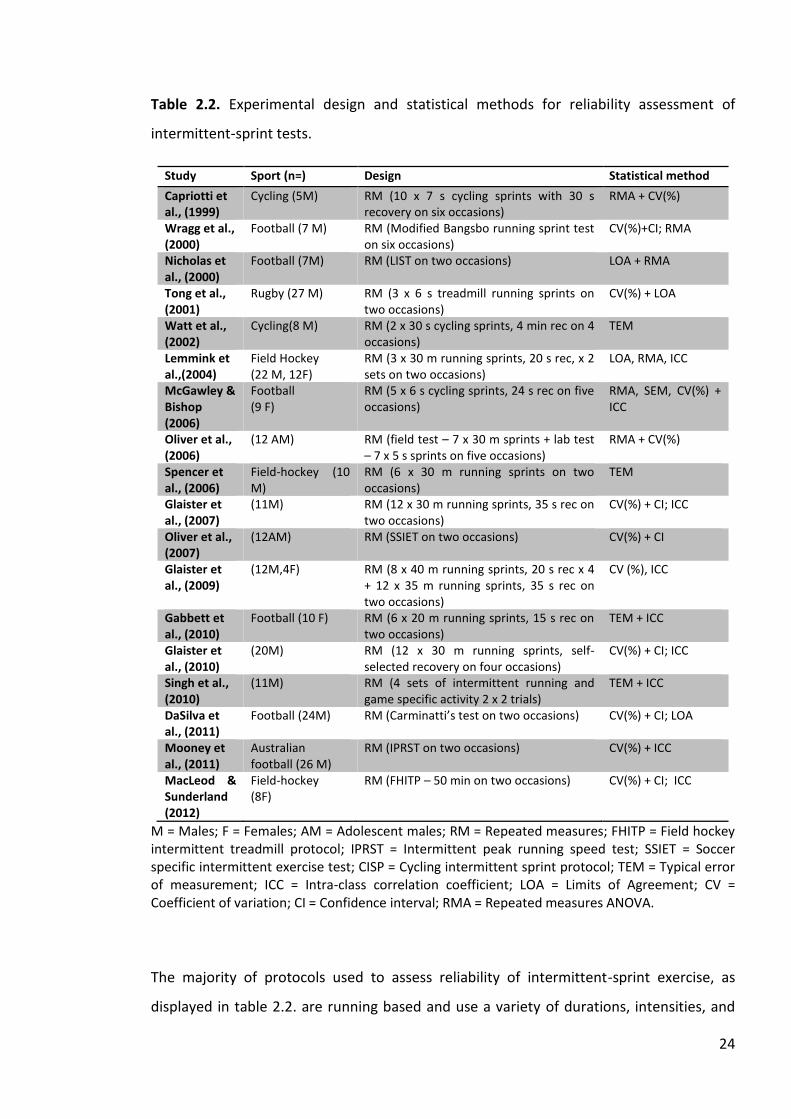
24
Table 2.2. Experimental design and statistical methods for reliability assessment of
intermittent-sprint tests.
Study Sport (n=) Design Statistical method
Capriotti et al., (1999)
Cycling (5M) RM (10 x 7 s cycling sprints with 30 s recovery on six occasions)
RMA + CV(%)
Wragg et al., (2000)
Football (7 M) RM (Modified Bangsbo running sprint test on six occasions)
CV(%)+CI; RMA
Nicholas et al., (2000)
Football (7M) RM (LIST on two occasions) LOA + RMA
Tong et al., (2001)
Rugby (27 M) RM (3 x 6 s treadmill running sprints on two occasions)
CV(%) + LOA
Watt et al., (2002)
Cycling(8 M) RM (2 x 30 s cycling sprints, 4 min rec on 4 occasions)
TEM
Lemmink et al.,(2004)
Field Hockey (22 M, 12F)
RM (3 x 30 m running sprints, 20 s rec, x 2 sets on two occasions)
LOA, RMA, ICC
McGawley & Bishop (2006)
Football (9 F)
RM (5 x 6 s cycling sprints, 24 s rec on five occasions)
RMA, SEM, CV(%) + ICC
Oliver et al., (2006)
(12 AM) RM (field test – 7 x 30 m sprints + lab test – 7 x 5 s sprints on five occasions)
RMA + CV(%)
Spencer et al., (2006)
Field-hockey (10 M)
RM (6 x 30 m running sprints on two occasions)
TEM
Glaister et al., (2007)
(11M) RM (12 x 30 m running sprints, 35 s rec on two occasions)
CV(%) + CI; ICC
Oliver et al., (2007)
(12AM) RM (SSIET on two occasions) CV(%) + CI
Glaister et al., (2009)
(12M,4F) RM (8 x 40 m running sprints, 20 s rec x 4 + 12 x 35 m running sprints, 35 s rec on two occasions)
CV (%), ICC
Gabbett et al., (2010)
Football (10 F) RM (6 x 20 m running sprints, 15 s rec on two occasions)
TEM + ICC
Glaister et al., (2010)
(20M) RM (12 x 30 m running sprints, self-selected recovery on four occasions)
CV(%) + CI; ICC
Singh et al., (2010)
(11M) RM (4 sets of intermittent running and game specific activity 2 x 2 trials)
TEM + ICC
DaSilva et al., (2011)
Football (24M) Carminatti’ te t on two occa ion ) CV(%) + CI; LOA
Mooney et al., (2011)
Australian football (26 M)
RM (IPRST on two occasions) CV(%) + ICC
MacLeod & Sunderland (2012)
Field-hockey (8F)
RM (FHITP – 50 min on two occasions) CV(%) + CI; ICC
M = Males; F = Females; AM = Adolescent males; RM = Repeated measures; FHITP = Field hockey intermittent treadmill protocol; IPRST = Intermittent peak running speed test; SSIET = Soccer specific intermittent exercise test; CISP = Cycling intermittent sprint protocol; TEM = Typical error of measurement; ICC = Intra-class correlation coefficient; LOA = Limits of Agreement; CV = Coefficient of variation; CI = Confidence interval; RMA = Repeated measures ANOVA.
The majority of protocols used to assess reliability of intermittent-sprint exercise, as
displayed in table 2.2. are running based and use a variety of durations, intensities, and

25
work-rest ratios. From these data (Table 2.2.), it appears that in running-based protocols,
athletes are generally required to complete between 5 and 45 sprints over distance of 20
- 40 m, interspersed with 15 - 100 s of active and / or passive recovery (Nicholas et al.,
2000; Wragg et al., 2000; Oliver et al, 2007) . Based on the criteria identified in the above
paragraph, such protocols have demonstrated repeatability, logical and construct validity
and are specific to the demands of the game. However, ecological validity aside, field-
based tests of intermittent-sprint exercise are not necessarily conducive to sophisticated
measurement of complex physiological and metabolic variables necessary to develop
understanding of the demands of high intensity activity (McGawley and Bishop, 2006).
Brief and prolonged cycling-based protocols have also been used to assess reliability in
intermittent-sprint exercise (Capriotti et al., 1999; McGawley and Bishop, 2006) and have
been proposed to be valid measures of sprint activity in games play (Bishop et al., 2001).
However, many cycling-based protocols, typically comprise only 5 - 10, 6 s sprints and due
to the truncated nature of the design, do not replicate intermittent-sprint activity across
durations consistent with aforementioned team sports.
As identified earlier, field-based team-sport athletes may complete up to ~ 1500
movement changes in a game with alterations in activity occurring every 4 – 6 s. Many of
the movements are game-specific, including such activities as jumping, lunging, heading,
scrummaging, rucking, tackling and mauling. As such, a number of protocols have
emerged incorporating specific elements of game play. (Roberts et al., 2010; Singh et al.,
2010; MacLeod et al., 2012). While these protocols enhance ecological validity,
demonstrate reliability and generally improve our understanding of the true demand of
match play in field-based team-sports, the effect of simulated actions on subsequent
performance is questionable (Singh et al., 2010) and the reliability of treadmill running is
generally lower than in other modes (Tong, et al., 2001; Oliver et al., 2007).
The cycling intermittent-sprint protocol (CISP) comprises twenty, two minutes blocks of
exercise with each block incorporating 10 s of passive rest, a rint again t . of
body ma and 10 of active recovery at 3 2peak. With a duration of forty minutes

26
the protocol permits examination of the effect of differing environmental factors and
interventions, for example, heat stress and pre-cooling on intermittent-sprint
performance over a time period similar to one half of a field-based team-sport using
sprint frequencies, sprint durations and recovery times that are reflective of those
observed in such sports. Previously, the CISP has been used to examine the effect of pre-
cooling and heat acclimation on intermittent-sprint performance under heat stress (Castle
et al., 2006, 2011) and has demonstrated significant improvements in PPO of 4 and 2%,
respectively, with these interventions. The reliability of the CISP has, however, not
previously been determined and therefore, it is unknown whether such findings reflect a
real effect of either intervention or simply the inherent error of the test.
2.3. Thermoregulation and Heat Stress
2.3.1. Overview
Humans are homeothermic and maintain body temperature within a narrow range
independent of external environmental change (Cheung et al., 2000; Bicego et al., 2007).
In 1965 the set point model was developed to explain such thermoregulatory
homeostasis proposing that perturbations in internal temperature, the error signal, when
compared to an organism specific set point would evoke a compensatory response if a
threshold was exceeded (Hammel, 1965 in Cabanac, 2006). This model suggested that the
set point was not fixed, but adjustable and could be altered in response to differing
thermoregulatory effectors including circadian and menstrual cues (Boulant, 2006). As
such, in humans, internal body temperature in the rested state is generally maintained at
37 ± 1°C over the lifecycle (Cheung, 2010). Such thermoregulatory homeostasis is
achieved through negative feedback incorporating afferent, integrative and efferent
processes (Bicego et al., 2007). Perturbations from a desired set point elicit autonomic
defence mechanisms that are stressor-dependent and serve to maintain core
temperature at or approximate to the set point (Figure 2.4.). Primary warm defences
include active cutaneous vasodilation and sweating that are triggered at approximately

27
the same core temperature (Sessler, 2008). Cutaneous vasoconstriction represents the
first autonomic response to cold stress followed by shivering, with a threshold for
activation approximately 1°C lower that occurs when primary mechanisms are insufficient
to maintain core temperature (Sessler, 2008). It has been suggested the thresholds for
inducing warm and cold responses differ by approximately 0.2°C, referred to as the inter-
threshold range (Kurz, 2008). Temperature changes that fall within the inter-threshold
range do not evoke a thermoregulatory defence response, however, perturbations
beyond 0.2°C evoke an autonomic response (Kurz, 2008) Consequently, in humans, core
temperature can generally be maintained within 0.2°C of the desired set point (Kurz,
2008).
Figure 2.4.The thermoregulatory control system (Sawka et al., 2011)
2.3.1.1. Mechanical efficiency and heat production
The efficiency of the human body is approximately 25% and consequently, greater than
70% of metabolic energy liberated to perform work is converted to heat (Verdaguer-
Codina et al., 1993; Cheung, 2010). Therefore, in endurance events such as the marathon
where high relative exercise intensity combines with high aerobic capacities, heat
production can reach approximately 1500 W (Verdaguer-Codina et al, 1993). In

28
intermittent sports such as tennis and football where a larger mass is combined with
more moderate aerobic capacities, estimated heat production can be 800 – 1300 W
(Brotherhood, 2008). The heat content of the human body (BHC) is derived from mean
in tem erat re sk and rectal temperature (Tre) (equation 2.1 and 2.2) and calculated as
depicted in equation 2.3. where m is the mass of the body, 3.47 is the specific heat
capacity of body tissues (kJ.kg-1.°C-1) and body tem erat re body) is the weighted mean
of Tre and sk and 0.4 is a constant to account for the underestimation of core
temperature change, as depicted in equation 2.2. Hypothetically, in a male team-sport
athlete resting body heat content (assuming mass = 72 kg, Tre = 37.5°C and sk = 33°C) can
be calculated as 9244 J and at the end of exercise in hot humid conditions (33°C, 50% rh,
assuming Tre 39.1 C and sk = 36.4°C) may rise to 9734 J.
sk
Tsk = 0.3 (Tchest+Tarm) + 0.2 (Tthigh+Tcalf)
(Ramanathan, 1964)
Eq body
body = 0.8(Tre) + 0.2 (Tsk) + 0.4
(Jay and Kenney, 2007)
Equation 2.3. Body heat content (BHC)
BHC body x m x 3.47
(Jay and Kenney, 2007)
The overall effect of metabolic heat production on body heat content and body
temperature can be ascertained from the heat balance equation;

29
Equation 2.4. The heat balance equation
S = M - W ± Cres - Eres ± R ± C ± K - Esk
where S is heat storage in the body, M is metabolic heat production, W is external work
performed, Cres is respiratory convective heat exchange, Eres is respiratory evaporative
heat loss and R, C, K and E represent radiative, convective and conductive heat exchange
and evaporative heat loss, respectively (Aoyagi et al, 1997; Cheung et al., 2000).
2.3.1.2. Mechanisms of heat exchange
When thermoregulatory homeostasis is challenged heat loss or gain occur primarily via
dry (conduction, convection, radiation) and wet (evaporation) heat exchange. During rest
and exercise the relative contributions of these mechanisms to heat exchange varies.
Radiative heat exchange involves the transfer of heat in the form of electromagnetic
waves between the environment and the body. Effective functioning of this process is
dependent upon a thermal gradient between the body and surrounding environment. At
rest, radiation accounts for approximately 60% of total heat loss to the surroundings,
however this is reduced to 5% during exercise. Skin temperature normally achieves
balance at 34 – 37°C (Armstrong, 2000). When environmental temperature exceeds skin
temperature, the thermal gradient between the body and the environment is reversed
and radiation may represent a source of net heat gain.
Conductive heat exchange requires direct physical contact between objects. Heat
exchange in this process is achieved by molecular agitation as molecules of greater heat
collide with those that are cooler ensuring a net transfer of heat to the cooler body. As
such, in the human body conduction provides a mechanism for heat exchange by transfer
of heat from deep body tissues of greater temperature to cooler peripheral tissues.
Convection also requires direct surface contact, but in this process the medium is usually
air or water. In convection, heat transfer is by mass motion of air or water as the

30
molecules in contact with the body are heated, expand, become less dense and move
away causing a convective current that transports heat away. In addition convective heat
loss in the body can be achieved by varying cutaneous blood flow that can at rest reach
flow levels of 7.5 l.min-1 (Sessler, 2008). At rest, conduction and convection contribute
approximately 20% to heat loss, but this is reduced to 15% during exercise (Wendt et al.,
2007).
Evaporation represents the primary defence mechanism to maintain thermoregulatory
homeostasis during exercise. Each gram of sweat liberates approximately 0.6 kcal of heat
while each litre of sweat evaporated, removes 2.4 MJ or 680 W.hr-1 of heat energy
(Gleeson, 1998; Kenney, 1998; Kurz, 2008; Cheung 2010). Consequently, under
appropriate environmental conditions a sweat rate of 1.3 – 2.0 L.hr-1 is required to
maintain heat balance and thermoregulatory homeostasis in the aforementioned
intermittent sports (Brotherhood, 2008). The primary factor determining the
effectiveness of evaporative heat loss is the moisture content in the air, commonly
expressed as relative humidity; the ratio of ambient vapour pressure to the saturated
water vapour pressure (Kenney, 1998). Although evaporation can account for up to 80%
of heat loss during exercise, a high ambient relative humidity increases sweat drippage,
decreases vapourisation of sweat and reduces the effectiveness of the evaporative
process.
2.3.1.3. Temperature regulation
As previously described, thermoregulatory homeostasis is maintained through a
mechanism of negative feedback involving afferent, integrative and efferent processes.
Although thermoreceptors are present in the hypothalamus, cortex, spinal cord, deep
abdominal and thoracic tissue (Insler and Sessler, 2006), Boulant (2000), proposes a
hierarchy of structures with the hypothalamus, brainstem and spinal cord exerting control
over thermoregulation. Lesion studies with animals demonstrate, however, that the
brainstem and spinal cord provide only crude control of thermoregulation and that the

31
hypothalamus, including specifically the preoptic and anterior nuclei, is required for
precise control and coordination of afferent and efferent signals (Hammel et al., 1960;
Boulant, 2000; Cooper, 2002; Nagashima, 2006).
Forming the floor of the third ventricle, the hypothalamus is considered the primary
regulator of thermoregulation (Kumar and Clark, 2012). It is bathed in cerebrospinal fluid,
is thermally sensitive and therefore, can also be judged a central thermoreceptor
(Benzinger, 1969). The preoptic area, a region at the junction of the telencephalon and
diencephalon is considered the thermointegrative and thermosensitive site of the central
nervous system (Bicego et al., 2007). This region contains a predominance of warm
sensitive neurons enabling sensitivity to hypothalamic temperature to an accuracy of
0.01°C. It is proposed the thermosensitivity of such neurons is due in part to ion channels
located in the cell body that are activated by thermal stimuli (Insler and Sessler, 2006;
Nakamura, 2011). Increased signaling of warm sensitive neurons due to temperature
change causes these ionic channels to open permitting charged ions to create an
electrical potential that subsequently evokes a thermoregulatory response that is
temperature dependent, for example, vasomotion (Nagashima, 2006; Nakamura, 2011).
The preoptic area of the hypothalamus also responds to afferent information from
receptors in other body parts facilitated by perpendicular orientation of dendrites in
warm sensitive neurons to the third ventricle (Bicego et al., 2007). Peripheral afferent
thermal inputs are derived from cutaneous thermal receptors located up to 2.5 mm
below the skin surface that exist as free nerve endings (Insler and Sessler 2006). Signals
from warm and cold sensitive receptors are transmitted by unmyelinated C fibres and
transverse A-delta fibres respectively (Kurz, 2008). Compared to warm receptors that are
sensitive to temperatures of greater than 30°C, cutaneous cold receptors are sensitive to
temperatures in the range of -5 to 43°C and number about ten times as many as warm
receptors (Insler and Sessler, 2006). Thus a dominance of information from cold receptors
highlights that peripheral thermosensitivity is more concerned with cold temperatures

32
allowing for immediate autonomic reflexes, for example cutaneous vasoconstriction and
shivering, when skin cooling occurs (Insler and Sessler, 2006; Bicego et al., 2007).
Afferent signaling of thermoregulatory status may be derived from both core and
peripheral cutaneous receptors. Nadel et al., (1971) and Frank et al., (1999), however,
demonstrated that, with respect to autonomic defence mechanisms such as vasomotion,
changes in core temperature exert a greater regulatory influence. In contrast, peripheral
input from skin temperature influences thermal comfort more, providing earlier initiation
of behavioural responses (Frank et al., 1999). As such, perception of low skin
temperature, possibly via transient receptor potential M8 (TRPM8), or low core
temperature by neurons in the preoptic anterior hypothalamus provides afferent
feedforward signaling that initiates effector output (Nakamura, 2011). Consequently,
when low skin or core temperature is perceived, cutaneous vasoconstriction, the first
autonomic response to cold, is invoked to minimise heat loss by reducing skin blood flow.
Cutaneous vasoconstriction is sympathetically mediated and reduced skin temperatures
augment this response by inhibition of the nitric oxide system, vasoconstrictor
postsynaptic up-reg ation of α 2c rece tor and co d en itive afferent Char o dian,
2010; Johnson and Kellogg, 2010). In addition to cutaneous vasoconstriction, involuntary
skeletal muscle tremor, that can increase metabolic heat production by 200%, is invoked
in response to decreased skin or core temperature but the threshold is approximately 1°C
lower than for cutaneous vasoconstriction (Bicego et al., 2007; Kurz, 2008). Heightened
activity of temperature sensitive neurons in the preoptic area in response to decreased
core temperature also evoke further heat generating mechanisms that are regulated by
the posterior hypothalamus (Piantadosi, 2003). These include upregulation of thyroxine
production due to hypothalamic neuropeptides that promote thyroid stimulating
hormone release from the pituitary gland, and, sympathetically mediated release of
cortisol (Piantadosi, 2003).
Perturbations in thermoregulatory homeostasis that evoke an increase in heat storage
e.g. physical activity or high ambient temperature elicit autonomic and behavioural

33
responses designed to maintain core temperature at a desired set point (Jessen, 2001;
Piantadosi, 2003). Such responses include the major autonomic effector responses of
vasodilation and sweating that are activated at approximately the same time (Sessler,
2008). Although based on a muroid model, recently, Nakamura and Morrison (2010)
demonstrated that cutaneous vasodilation may be mediated by neurons in the dorsal
lateral parabrachial nucleus that glutaminergically transmit signals to the pre-optic
anterior hypothalamus with subsequent efferent output via sympathetic cholinergic
nerves. Mechanistically, cutaneous vasodilation is considered a response to actions of a
number of factors including, nitric oxide, intestinal peptide, prostaglandins, and
substance P (Charkoudian, 2010).
In addition to vasodilation, when core temperature increases above a desired set point
efferent output from the preoptic hypothalamus is relayed by sympathetic cholinergic
fibres that innervate the ducts and coils of the 1.6 – 4.0 million eccrine sweat glands in
the human body (Shibasaki et al., 2006). Acetylcholine released from these cholinergic
fibres binds to muscarine receptors, increases Ca2+ concentration in the gland and the
permeability to K+ and Cl- and an isotonic precursor fluid is released from the secretory
cells (Shibasaki et al., 2006).
2.3.1.4. Thermoregulation during exercise in the heat
During exercise muscular work promotes heat generation. Consequently, body
temperature increases and the extent of increase is in direct proportion to the e erci e
inten ity and ercentage of 2max required (Nielsen, 1996). Theoretical estimates of heat
production suggest core temperature could increase 1°C every 5 – 6 minutes in exercise,
producing critical core temperatures within 10 – 15 min (Kenney and Johnson, 1992;
Verdaguer-Codina et al., 1993). As such, effective functioning of thermoregulation is
essential to maintain homeostasis and prevent a deleterious effect on performance or the
occurrence of a heat related illness.

34
During exercise in a hot environment regulation of elevated body temperature is through
activation of the autonomic heat loss mechanisms of vasodilation and increased
sudomotor activity that are regulated predominantly by changes in core temperature
(Franks et al., 1999; Sessler, 2008). In the heat the cardiovascular system is challenged by
both thermoregulatory and metabolic demands dependent upon the duration, type and
intensity of exercise and the environment (Gonzalez-Alonso, 2012). Thermoregulatory
requirements necessitate an elevated skin blood flow yet active muscle oxygenation must
be maintained. In maximal exercise under high heat stress maximal cutaneous blood flow
may reach 7 - 8 L.min-1 or 300 - 400 ml.min-1.100g of skin and muscle blood flow 2.5 - 4
L.kg-1.min-1 (Kenney and Johnson, 1992; Gonzalez-Alonso et al., 2008; Charkoudian, 2010;
Johnson and Kellogg, 2010;). Combined, these would exceed cardiac pumping capacity
and consequently, effective regulation is required during exercise in the heat (Gonzalez-
Alonso et al., 2008; Crandall and Gonzalez-Alonso, 2010).
Skin circulation is modulated by a variety of thermoregulatory and non thermoregulatory
reflexes, including central and peripheral temperature, blood pressure control, muscle
mechanoreceptor and metaboreceptor stimulation (Gonzalez-Alonso et al., 2008). At the
onset of exercise in the heat there is an initial cutaneous vasoconstriction (Kenney and
Johnson, 1992; Gonzalez-Alonso et al., 2008). Subsequently, increases in body
temperature and activation of cutaneous vasodilation increase skin blood flow (Gonzalez-
Alonso et al., 2000). This additional demand is met by a 1 - 2 L.min-1 increase in cardiac
output, mediated by an increased heart rate and decreased perfusion of splanchnic and
renal tissue (Rowell et al., 1966; Gonzalez-Alonso et al., 2000). The extent of cutaneous
vasodilation in exercise and therefore skin blood flow is modulated by an elevated
temperature threshold for vasodilation compared to rest and a limit to skin blood flow at
a core temperature of ~ 38°C (Gonzalez-Alonso et al., 2008).
During exercise in the heat elevated plasma noradrenaline levels suggest increased
sympathetic vasoconstrictor activity in active muscle vasculature to promote effective
thermoregulation. However, augmented levels of vasodilator substances offset this effect

35
and consequently, vascular conductance in active skeletal muscle is maintained. (Crandall
and Gonzalez-Alonso, 2010). As such, in the early stages of low-to-moderate intensity
exercise in the heat muscle blood flow is maintained and metabolic requirements of
exercise are fulfilled. Similarly, mean arterial pressure is preserved. Therefore, as
perfusion of cutaneous vasculature is moderated, requirements for thermoregulation are
not achieved and core temperature is increased (Gonzalez-Alonso, 2012).
Increased core temperature during exercise elicits an enhanced sudomotor response
including an initial increase in number of active eccrine glands and an increase in output
(Kondo et al., 2001). When exercise is extended beyond eight minutes further increases in
sudomotor function are achieved by additional increases in gland output (Kondo et al.,
2001). Evaporation of one litre of sweat may liberate 2.4 MJ or 680 W.hr-1 of heat energy
(Gleeson, 1998; Kenney, 1998; Kurz, 2008; Cheung 2010). Although this process
contributes to 80% of heat loss in exercise, under high heat stress and in particular high
humidity, limited evaporative potential may exist and sweat gland output may be reduced
due to hidromeiosis. Under such conditions sustained sudomotor activity may contribute
to exercise-heat dehydration and elevated heat strain (Equation 2.4.).
When moderate-to-high intensity exercise in the heat is prolonged, elevated
cardiovascular strain is observed even in euhydrated participants with ad libitum water
intake. Rowell et al., (1966), reported a 150 – 200 ml reduction in central blood volume,
19 – 23 ml reduction in stroke volume, 21 – 29 b.min-1 increase in heart rate and a 1.1 –
1.2 L reduction in cardiac output during walking at 3.5 m.hr-1 on 12.5 and 15% gradients in
43.3°C compared to 25.6°C. With sweat loss in excess of 3 L.hr-1 reported in the heat and
maximal gastric emptying rates of only 600 – 800 ml.hr-1 prolonged exercise in the heat
without water intake will induce profound dehydration and this also significantly elevates
cardiovascular strain with increases in heart rate and decreases in stroke volume and
cardiac output directly related to the magnitude of dehydration (Montain and Coyle,
1992; Gonzalez-Alonso et a ., 2000). erci e to e ha tion at 61 2 2max in 35°C, 40 -
50% rh with dehydration during exercise (3.9 ± 0.3% body weight on cessation of

36
exercise) resulted in a 3.3 ± 0.6 l.min-1 decrease in cardiac output, 2.0 ± 0.6 l.min-1
decrease in leg blood flow, 29% decrease in skin blood flow, 28 b.min-1 increase in heart
rate, a 40 ml reduction in stroke volume and significant reductions in systolic and diastolic
blood pressure at the end of exercise in comparison to a euhydrated control (Gonzalez-
Alonso et al., 1998).
Further, Gonzalez-Alonso et al., (2000) demonstrated a 6.4 ± 1.3 % decrease in stroke
volume per percent of dehydration, 11 - 14 b.min-1 higher heart rate and decreased mean
arterial blood pressure when participants performed 30 minutes of cyc ing at 2 2max
in hot (35°C) or cold (8°C) conditions when euhydrated or dehydrated by 1.5, 3.0 and
4.2% of body weight. Similarly, blood volume was depressed 200 - 300ml in the heat and
cardiac output was reduced at the higher levels of dehydration compared to euhydration
(Gonzalez-Alonso et al., 2000). Under such circumstances thermoregulatory and
metabolic responses are changed. Reduced blood volume and pressure reduces
ventricular filling pressure and diastolic filling time is decreased due to tachycardia
(Gonzalez-Alonso et al., 2000). Consequently, stroke volume and cardiac output are
reduced and skin blood flow declines leading to impaired thermoregulation, elevated core
temperature and decreased exercise performance (Gonzalez-Alonso et al., 2000; Crandall
and Gonzalez Alonso, 2010).
Much work has been completed on the effects of heat stress on thermoregulation during
low to moderate intensity exercise, prolonged exercise, and high intensity exercise to
exhaustion with and without dehydration. Less is known about the thermoregulatory
dynamics associated with high intensity, intermittent-sprint exercise in the heat and the
additional effect of dehydration. Although no information exists with respect to cardiac
output, stroke volume and skin b ood f ow, evidence of e evated heart rate and red ced
who e-body 2 during intermittent-sprint exercise in the heat compared to control
conditions in euhydrated and hypohydrated states would indirectly suggest elevated
cardiovascular strain and reduced active muscle perfusion (Maxwell et al., 1996; Morris et
al., 1998; Drust et al., 2005; Sunderland et al., 2005; Maxwell et al., 2009). With respect to

37
metabolic demand during intermittent-sprint exercise, Racinais et al., (2007) have
demonstrated a progressive muscle deoxgenation using near infra-red spectroscopy when
10 x 6 s sprints with 30 s recovery were performed in temperate conditions, suggesting a
mismatch between supply and demand that contributed to elevated muscle anaerobiosis
(Racinais et al., 2007). Whether this response is exacerbated in hot conditions in
intermittent sprinting is unknown.
2.3.2. Climatic heat stress and Indices for assessment
Climatic heat stress2 ha been defined a a “combination of environmenta condition
that stre the body’ thermoreg atory y tem” B ir , 19 ). Condition determining
the level of climatic heat stress include; ambient temperature, air humidity, air
movement and radiant heat (Verdaguer-Codina et al., 1993).
It is approximately 250 years since researchers recognized that the thermal stress of an
environment was dependent upon other factors in addition to temperature and
approximately 230 years since the first documented experiments in this field (Ellis, 1758;
Blagden, 1775). Since then, numerous investigators have attempted to quantify the
thermal stress of the environment using developed measures of heat stress or physiologic
strain and there is evidence of over forty documented indices in the literature3 (Epstein et
al., 2006). As early as 1905 Haldane proposed the wet-bulb temperature as the most
appropriate measure to express heat stress (MacPherson, 1962). In an effort to quantify
the additive effect of radiant heat to thermal stress the globe thermometer temperature
was introduced in 1930 (Vernon, 1930). Dysfunction in specific environmental conditions
leading to incorrect representation of physiologic strain demonstrated practical
limitations that resulted in the abandonment of this index as a measure of thermal stress
2 Heat tre : A combination of environmenta condition that tre the body’ thermoregulatory system.
Heat / physiologic strain: The physiological mechanisms used by the body to permit better tolerance of climatic heat stress. 3 A heat stress index is a single value that integrates the effect of the basic parameters in any human
thermal environment such that its value will vary with the thermal strain experienced by the individual (Parsons, 2003).

38
soon after its inception. In 1947 the predicted four hour sweat rate (P4SR), an index
based on physiological strain, was developed and considered a significant improvement
on the nine previous indices presented between 1905 and 1947. In addition to key
environmental factors of ambient temperature, surrounding air temperature, humidity
and air movement, P4SR considered the rate of energy expenditure and the clothing
worn, but was limited to indoor use only (MacPherson, 1962).
In 1957 Wet Bulb Globe Temperature (WBGT) was presented as a measure of heat stress
(Yaglou and Minard, 1957). An International Standard (ISO 7243) and widely used for the
determination of heat stress in military, occupational and sporting environments, WBGT
combines the effect of humidity, wind, environmental temperature in the shade, sun and
surface radiation to calculate the heat stress index (Verdaguer-Codina et al., 1993).
Developed from research concerned with preventing the occurrence of heat injury in
military recruits in Parris Island, WBGT was originally intended for use in an outdoor
environment (Budd, 2008). Outdoor WBGT heat stress index was derived from wet bulb
temperature (WBT), black globe temperature (BGT) and dry bulb temperature (DBT) and
calculated as shown in equation 2.5;
Equation 2.5. Wet bulb globe temperature (outdoor)
WBGT = 0.7xWBT + 0.2xBGT + 0.1xDBT
(Verdaguer-Codina et al., 1993).
WBGT was later modified to permit determination of heat stress indoors on the
assumption that in an indoor environment globe temperature approximates ambient
temperature. In this context heat stress was calculated as shown in equation 2.6 ;

39
Equation 2.6. Wet bulb globe temperature (indoor)
WBGT = 0.7xWBT + 0.3xDBT
(Verdaguer-Codina et al, 1993; Epstein et al., 2006).
Limitations of WBGT as an index of heat stress include inadequate reflection of the
additional strain experienced when evaporation is limited and the omission of globe
temperature when determining heat stress for an indoor environment (Budd, 2008).
In addition to WBGT, the discomfort index (DI) has been used as an index of heat stress
for over forty years. Originally proposed by Thom (1959) and later modified by Sohar et
al., (1963) heat stress is simply calculated from two variables (Equation 2.7.), wet bulb
and dry bulb as;
Equation 2.7. The discomfort index
DI = 0.5xWBT + 0.5xDBT
(Epstein et al., 2006).
Adopted by the Israeli Defense Forces, DI was adapted in 1999 to its current state, the
modified discomfort index (MDI) to reflect improved statistical analyses. MDI is calculated
as shown in equation 2.8. and has been shown to be highly correlated to WBGT (Moran et
al., 1999), but does not consider key environmental factor such as solar radiation.
Equation 2.8. The modified discomfort index
0.75xWBT + 0.3xDBT
(Moran et al., 1999)

40
The WBGT, despite adoption by the US military, World Health Organisation and the
American College of Sports medicine is difficult to measure in the field due to issues with
measuring globe temperature. Recent technological developments have, however, led to
the production of heat stress metres that can accurately quantify WBGT in outdoor and
indoor surroundings, for example, the HT30 WBGT meter (EXTECH, New Hampshire).
Nevertheless, previous research has demonstrated WBGT does not reflect physiologic
strain (Ramnathan et al., 1973). In 1998 the physiological strain index (PSI) was
introduced to permit quantification of the strain imposed by hot environments using
measurements of core temperature and heart rate. PSI has been shown to accurately
reflect both strain in different climatic conditions during heat stress (Moran et al., 1998a)
and hydration (Moran et al., 1998b), is derived from resting core temperature (Tc0), core
temperature at a given timepoint (Tct), resting heart rate (fc0) and heart rate at a given
timepoint (fc0) and is calculated as;
Equation 2.9. The physiological strain index
5(Tct – Tc0)(39.5 – Tc0)-1 + 5 (fct – fc0)(180 – fc0)-1
(Moran et al., 1998a)
Continued development of environmental monitoring technology that permits easier and
faster measurement in field situations resulted in the development of the environmental
stress index (ESI) as an alternative to WBGT in 2001 (Moran et al., 2001). ESI employs
ambient temperature (Ta), solar radiation (SR) and relative humidity (rh) to determine
heat stress as;
Equation 2.10. The environmental stress index
0.63Ta – 0.03rh + 0.002SR + 0.0054(Tax rh) – 0.073(0.1+SR)-1
(Moran et al., 2001)

41
Research has demonstrated high correlation with the WBGT and therefore, ESI is
proposed as a practical alternative to WBGT in field situations where determination of
globe temperature is difficult (Moran et al., 2001).
Studies examining intermittent-sprint exercise, heat stress and the effect of different
compositions of environmental factors on physiological and performance responses
during intermittent-sprint exercise should match environments for overall heat stress
using, for example, WBGT. However, a significant portion of the literature in this field
merely reports ambient temperature with or without relative humidity, and makes no
reference to any index of heat stress. Research has demonstrated composite
environmental indices provide better indicators of environmental influence than
individual factors alone (Zhang et al., 1992) and as such, studies comparing differing
compositions of environmental factors should use an appropriate index to measure and
match heat stress e.g. WBGT, the accepted international standard for the quantification
of heat stress (Nevill et al., 1995; Morris et al., 1998; Morris et al., 2000; Parsons, 2006).
Where this is not done, comparison between studies is made difficult and many
discrepancies in findings may simply be explained by differences in WBGT employed by
investigators. In addition, where investigators have considered heat stress in terms of
WBGT and the impact of differing compositions of thermal factors on physiological
responses, evidence can only be drawn from sub-maximal exercise and conditions have
not always been equally matched for heat stress (Fox et al., 1967, Griefahn, 1997;
Maughan et al., 2012). Further work is required to elucidate the impact of differing
compositions of thermal factors on high-intensity intermittent-sprint exercise in the heat
when environments are matched for heat stress.
2.3.3. Intermittent-sprint exercise in a hot environment
Intermittent-sprint exercise presents a significant physiological challenge to the games
player and with international competition increasingly conducted in hot environments,
performance in such activity is further challenged. There is greater thermal strain during

42
intermittent-sprint exercise in the heat compared with continuous exercise of the same
average work intensity (Nevill et al., 1995). Demand for cardiac output is increased due to
the elevated skin blood flow needed to maintain thermoregulatory homeostasis and the
elevated metabolic requirements of exercise (Maxwell et al., 1996). Reduced perfusion of
muscle and the concomitant reduction in oxygen supply to the tissue increase the
reliance on anaerobic metabolism. Of the limited research on this matter no effect, a
beneficial effect and a deleterious effect of heat on performance and physiological
responses to intermittent-sprinting have all been reported (Falk et al., 1998; Backx et al.,
2000; Linnane et al., 2004). This section will begin by considering research that has used
two or more sprints of up to 30 s duration and move to a focus on work that has
concerned itself with intermittent-sprint exercise observed in field-based team-sports
characterized by hort d ration rint ≤ 10 ) with moderate-to-long recovery periods
(60 – 300 s), allowing near complete recovery (Girard et al., 2011). A composite bar chart
illustrating the extent of performance improvement or impairment for the studies cited in
this section is provided in figure 2.5.
When three, 30 s sprints were completed pre and post sixty min recovery in hot humid,
hot dry and temperate conditions, no effect on performance or metabolic responses was
observed (Backx et al., 2000). In contrast, using passive water immersion for 16 ± 3.2
minutes at 43°C, 30 s sprint performance was improved compared to a no immersion trial
but subsequent sprint performance after 4 min recovery was unchanged (Linnane et al.,
2004, Figure 2.5.). A temperature mediated increase in cross bridge cycling and pedal
cadence was suggested to explain the initial ergogenic effect (Linnane et al., 2004) and
lack of this response in the work of Backx et al., (2000) owing to the recovery method
used may explain the discrepancy in studies.
With respect to multiple sprints, when five 15 s efforts with 30 s recovery were repeated
after sixty minutes of rest in hot compared to temperate conditions performance was
improved, but no difference in metabolic variables was reported (Falk et al., 1998, Figure
2.5). In contrast, when 20 s sprints with 100 s recovery were completed to exhaustion on

43
a treadmill at 10.5% incline and 1.2 km.hr-1 increments in speed, cumulative sprint time
was significantly lower in hot compared to control conditions possibly due to a
dehydration induced increase in intramuscular H+ concentration (Maxwell et al., 1996,
Figure 2.5.). Sweat rate, heart rate and rectal temperature were significantly higher post
sprints in the hot trials, but plasma ammonia and lactate were not different between
trials (Maxwell et al., 1996).The exhaustive nature of the protocol and the subsequent
dehydration may explain the discrepancy between the work of Maxwell and colleagues
(1996) and Falk et al., (1998).
Further evidence of the detrimental effect of heat on multiple sprint performance was
also reported by Drust et al., (2005, Figure 2.5.). When repeated sprint bouts were
interspersed with 40 minutes of intermittent exercise in 40 and 20°C mean blood glucose
and noradrenaline and all measures of physiological strain were higher in 40°C while
glycogen utilisation tended to be greater (P = 0.06; Drust et al., 2005). Further, during
repeated sprints in the heat mean power output was lower, plasma NH3 was higher,
plasma K+ and muscle H+ were lower, but muscle glycogen, CP, ATP and IMP were
unchanged (Mohr et al., 2006). Decrements in performance were not explained by
metabolic factors, but a trend toward a reduction in isometric handgrip force in hot
compared to the control trial indicated a possible reduction in voluntary drive mediated
by hyperthermia and / or elevated plasma NH3. While this work was one of the first to
postulate a neuromuscular mediated fatigue during intermittent-sprint exercise, it is
important to note however, that the use of isometric handgrip provides insight to the
general state of CNS function, but does not provide evidence of the voluntary drive to
cycling specific locomotor muscles.
When multiple sprint work is completed in the heat to exhaustion or in a repeated-sprint
ability style (6 s sprints < 30 s recovery) following 40 minutes of activity, a detrimental
effect of heat on performance is observed. In contrast, Almudehki et al., (2012) recently
reported no effect on performance when eight, 6 s sprints were interspersed with 5
minutes recovery (Almudehki et al., 2012). Peak power output and neuromuscular

44
efficiency were not different in 40 compared to 24°C despite higher cardiovascular and
perceptual strain in the hot trial (Almudehki et al., 2012) suggesting that the extent of
recovery between multiple sprints and the metabolic consequences may have been a
primary factor in reduced performance in the heat. Nevertheless, it is known when short
sprints are interspersed with 2 minutes recovery performance is not reduced (Balsom et
al., 1992). As such, while the work of Almudehki et al., (2012) serves to isolate and
elucidate the effect of heat on intermittent-sprinting without confounding metabolic
influences, the lack of difference in performance may be explained by the recovery period
used. Further, the protocol did not induce marked hyperthermia in the hot trial (37.7 ±
0.4°C). Given that field-based team-sport athletes routinely complete twenty to sixty
sprints per game with mean recovery of ~ 147 s, and core temperatures of 39.6 ± 0.1°C
have been reported at the end of the first half of a match in 43°C, the ecological validity
of this study is questionable (Spencer et al., 2005; Mohr et al., 2012). Therefore, a focus
on research that uses protocols reflective of the durations and work-rest patterns of
team-sports is warranted.
Research employing intermittent-sprint protocols that are exhaustive or simulate activity
patterns of team-sports have demonstrated decreased performance in the heat (Morris
et al., 1998, 2000; Sunderland et al., 2005; Castle et al., 2011; Figure 2.5.) In cycle-based
exercise, when twenty, two minute blocks each comprising a rint, 10 recovery at
3 2max and 10 s were completed in ~ 33°C peak power output was reduced (Figure
2.5.) and physiological strain was higher in the heat (Castle et al., 2011). Lack of a
temperate condition in this study does, however, limit the ability to draw conclusions
about the effect of heat separate from the effect of intermittent-sprint exercise.

45
Figure 2.5. Percentage change in sprint performance from control. PPO = peak power
output; MPO = mean power output; TDR = total distance run; TRT = total run time; ST =
sprint time; * = Significant difference from control.
In running-based protocols, use of the Loughborough intermittent shuttle test (LIST) to
replicate the activity pattern of field-based team-sports has demonstrated a deleterious
effect of heat on intermittent-sprint exercise in a number of studies using male and
female athletes. Generally, when completed in hot compared to temperate conditions,
total distance run by male and female athletes during the LIST is reduced (Morris et al.,
1998; 2000; 2005) or tends to decline (Sunderland and Nevill, 2005). Further, although
one study found no difference (Morris et al., 1998) 15 m sprint times during the LIST were
reduced in hot compared to temperate conditions (Morris et al., 2000; 2005; Sunderland
and Nevill, 2005). In the heat, physiological strain and RPE during the LIST were higher
compared to temperate conditions (Morris et al., 2000; 2005; Sunderland and Nevill,

46
2005), but metabolic markers including blood lactate and plasma ammonia were not
different (Morris et al., 1998; 2000; Sunderland and Nevill, 2005). A trend toward greater
muscle glycogen usage in the heat and greater muscle glycogen remaining in the muscle
at exhaustion in the hot trial has, however, been reported in one study coupled with
greater blood lactate, glucose, serum cortisol and catecholamines (Morris et al., 2005) in
contrast to previous work (Maxwell et al., 1996; Drust et al., 2005). In addition
completion of the LIST in hot conditions can induce a significant decrement in hockey skill
performance (Sunderland and Nevill, 2005). Finally, in studies using the LIST to examine
the effect of heat on intermittent-sprint exercise a strong negative correlation has been
reported (r > 0.9) for rate of rise in rectal temperature and distance run. Taken together
with the consistent lack of difference in metabolic markers between trials, it has been
suggested that hyperthermia mediated decrements in CNS function may explain the
reduction in performance observed in these studies.
More recently, evidence from field-based studies has served to elucidate the impact of
heat on intermittent activity. When twenty professional football players completed a full
football match in ~ 31°C high intensity running was reduced by ~ 57 % in the final
compared to the first 15 minute interval and repeated sprints over 30 m were reduced by
2.6% (Mohr et al., 2010). No difference in mean blood lactate or heart rate was observed
between halves, but muscle temperature was 0.8 ± 0.2°C lower in the second half of the
match. Lack of a control group in this study limits the ability to draw conclusions about
whether the observed findings were mediated by the environment or the activity. In a
further study, Mohr et al., (2012) addressed this issue by examining football performance
in elite players during football match play at ~ 43°C compared to ~ 21°C. Total game
distance and high intensity running declined by 7% and 26% respectively, compared to
control. Peak sprint speed during the match was 4% higher in the hot trial, but post match
sprint performance was not different (Mohr et al., 2012). Muscle glycogen tended to
decline (488 ± 25 mmol.kg-1 vs. 300 mmol.kg-1 baseline and post-exercise dry weight
respectively), but was not different between trials (Nybo et al., 2013). Similar to previous
studies no difference was observed in average heart rate, plasma lactate and body weight
loss (Mohr et al., 2012). In this study CNS function was assessed from voluntary activation

47
using the interpolated twitch technique and post exercise the reduction was similar in
both trials (~ 1.5%) indicating that during match play central drive is not affected to a
greater extent by heat. Application of findings is, however, limited by use of the
interpolated twitch technique (see section 2.4.4.3.) and the self-paced nature of the
match that contributed to reduced work during the hot trial possibly impacting the extent
of fatigue observed.
2.3.4. Summary
When intermittent-sprint exercise similar to that observed in field-based team-sports is
completed using cycling or running-based protocols in hot compared to temperature
condition, the overwhelming evidence indicates that performance is decreased. Further,
physiological strain is increased possibly reflecting compensation for a reduced cardiac
output and decreased skin blood flow, but evidence of such physiological sequelae is
lacking for intermittent-sprint sports. Although increased physiological strain may limit
muscle blood flow and increase reliance on anaerobic metabolism, generally, no
differences in metabolic variables are observed during intermittent-sprint exercise in the
heat compared to control. This suggests intermittent-sprint exercise taxes the glycolytic
system maximally and heat does not have an additive effect, indicating the cause of
reduced performance in exercise of this type is not metabolic.
A number of earlier studies have demonstrated a reduced performance during
intermittent-sprint exercise in the heat in the presence of marked endogenous
hyperthermia and a strong negative relationship has strengthened the suggestion that
hyperthermia mediated effects on CNS function contribute to the decrements in
performance. Recent work has, however, provided evidence that the decrements in
voluntary activation post exercise are not different in hot or temperate conditions but
application of findings is possibly limited by methodological issues. Considering this, there
is a need for further work examining the genesis of performance decrements during

48
intermittent-sprint exercise in the heat where work:rest ratios replicate those of field-
based team-sports.
2.4. Fatigue
2.4.1. Overview
Fatigue is a universal phenomenon commonly observed during exercise. In this context,
fatigue manifests as increased sense of effort and reduced force output soon after the
onset of activity, but before task termination (Enoka and Duchateau, 2008) and can be
observed as decreased power output during the exercise (Nybo and Nielsen, 2001a&c;
Tucker et al., 2004). The genesis of fatigue is multifactorial but displays task dependency
indicating that rather than an omnipresent mechanism fatigue may be induced by a
variety of mechanisms (Enoka and Stuart, 1992). For the purposes of this review fatigue
will be examined from a neuromuscular perspective.
Neuromuscular fatigue has been described as any exercise-induced reduction in the
ability of a muscle or group of muscles to generate force or power whether or not the
task can be sustained (Gandevia, 2001; Taylor et al., 2006; Ross et al., 2007; Taylor and
Gandevia, 2008; Sidhu et al., 2009a; Millet et al., 2011). If muscle is viewed from the
perspective of a motor in a system then its effective functioning will depend on its
intrin ic ro ertie and tate in addition to how the m c e i ‘driven’ and how feedbac
affects it operation (Gandevia, 2001). As such, neuromuscular fatigue can be considered
to consist of both peripheral and central aspects (Figure 2.6.).

49
Figure 2.6. Central and peripheral factors contributing to voluntary force production
(Gandevia, 2001).
2.4.2. Central fatigue
Central fatigue is a progressive exercise induced reduction in voluntary activation or
neural drive to the muscle and is considered to comprise both spinal and supraspinal
components (Gandevia, 2001; Taylor et al., 2006). Supraspinal fatigue has been described
as an exercise-induced decline in force, caused due to suboptimal output from the motor
cortex (Gandevia, 2001; Taylor et al., 2006).
2.4.2.1. Mechanisms of spinal fatigue
During sustained submaximal isometric contraction at 30% MVC the discharge rate of
human muscle spindles (group Ia afferents) has been shown to decline up to 50%
(Macefield et al., 1991). Such reduced firing rate may contribute to spinal mediated
fatig e thro gh di faci itation of α motone ron Gandevia, 2001 Boya and G eve ,
2011). More recently, however, McNeil et al., (2011) demonstrated that reduced spindle

50
discharge was not a contributor to reduced motoneurone excitability observed in fatigue
and suggested motoneurone intrinsic property changes contributed to a reduced
responsiveness to excitatory input. It is important to note however, that the data
provided is for sustained isometric exercise and little is known of how fatigue can alter
spindle discharge during dynamic activity.
Golgi tendon organs may also exert a role in spinal fatigue as discharge of these group Ib
afferents has been suggested to decrease with the reductions in muscle force observed
during maximal contractions (Taylor and Gandevia., 2008). In addition, such afferents are
suggested to exert an inhibitory effect on motoneurone activity (Boyas and Guevel, 2011).
Group III and IV afferents innervate free nerve endings throughout muscle and are
responsive to alterations in the mechanical, biochemical and thermal state of the tissue
(Gandevia, 2001). During exercise, alterations in the state of muscle augments the
discharge rate of these afferents providing inhibitory input to the CNS limiting central
motor drive and performance (Amann et al., 2013). The inhibitory action of such afferents
on motor drive has been confirmed in high-intensity exercise by reducing sensory
feedback using pharmacological blockade or augmenting inhibitory feedback (Amann and
Dempsey, 2008; Amann, 2011), but there is still much debate about their role in fatigue
(Taylor and Gandevia., 2008; Perrey et al., 2010a).
Renshaw cells provide autogenic inhibition to motoneurons and receive excitatory input
from high threshold motoneurons in addition to descending and peripheral inputs
(Gandevia, 1998, 2001). Evidence on the role of Renshaw cells in fatigue during sustained
voluntary contractions is contradictory with reduced inhibition evident in sustained
submaximal voluntary contractions using H-reflex methods, but increased inhibition
observed with maximal efforts (Gandevia, 1998, 2001). Intrinsic properties of the
motoneurone have also been identified as possible mediators of spinal fatigue.
Motoneurones alter their firing rate when stimulated with intracellular or extracellular
current and the pattern of discharge varies over time (Gandevia, 2001). Motoneurone

51
gain decreases over time depressing discharge rate and potentially contributing to fatigue
(Gandevia, 1998, 2001).
2.4.2.2. Mechanisms of supraspinal fatigue
Mechanisms of supraspinal fatigue can be divided into those that result in a decrease in
motor cortical output, or those that do not alter the extent of cortical output but reduce
the effectiveness of descending drive (Taylor et al., 2006). This can result from decreases
in excitatory input, increases in inhibitory input or changes in intrinsic motoneuron
properties (Taylor et al., 2006; Taylor and Gandevia, 2008).
Short latency motor evoked potentials (MEPs), and cortical silent periods are excitatory
and inhibitory responses respectively, recorded in EMG when TMS is applied over the
motor cortex during an MVC. Examination of MEP characteristics e.g. amplitude and silent
period duration provides evidence of both the excitatory and inhibitory responses of the
corticospinal tract to exercise and has been examined primarily during sustained and
repetitive maximal and submaximal voluntary efforts following sustained locomotor
activity (Loscher et al., 2002; Sogaard et al., 2006; Ross et al., 2007; Smith et al., 2007;
Sidhu et al, 2012a&b). MEP amplitudes have been shown to be increased with sustained
MVC suggesting increased motor cortical excitability and drive to motoneurons (Sidhu et
al., 2009a). Similarly, silent period duration is shown to increase with sustained MVC
(Sidhu et al., 2009a). As the latter part of the silent period is thought to correspond to
inhibition of voluntary descending drive by action of the intracortical inhibitory neurons
any observation of an increased silent period duration may reflect increased intracortical
inhibitory action contributing to supraspinal fatigue (Taylor et al., 1996, 2008).
Sidhu and colleagues (2012a) propose that observed differences in opposing corticospinal
excitability responses between studies can be explained by task specificity and demand.
Therefore, observations of unchanged corticospinal excitability and increased intracortical

52
inhibition with sustained locomotor exercise compared to brief MVCs may simply reflect
greater physiological demand with sustained work. This demand may prolong group III
and IV muscle afferent activity, as discussed, and provide increased feedback to the CNS
at a level upstream of the motor cortical outputs to impair voluntary descending drive
once again providing support for the inhibitory feedback hypothesis (Taylor et al., 2006;
Sidhu et al., 2009a, 2012a).
In addition to afferent feedback, other factors that may induce supraspinal fatigue,
include alterations in brain neurotransmitters, increased cerebral ammonia concentration
and altered GABA levels.
2.4.2.3. The Central neurotransmitters serotonin, dopamine and noradrenaline
Neurohumoral factors and their accumulation or depletion have been implicated in
fatigue during prolonged exercise in both temperate and hot environments. Originally,
Romanowski and Grabiec (1974) cited the monoamine neurotransmitter serotonin (5-
Hydroxytryptamine, 5-HT) as a mediator of central fatigue (Roelands and Meeusen,
2010). Newsholme and colleagues (1987) later proposed the original central fatigue
hypothesis to elucidate the role of increased cerebral serotonin concentration on
neurotransmission and fatigue during prolonged exercise. 5-HT regulates an array of
physiological functions and states including mood, anxiety and alertness (Kroeze et al.,
2002). As 5-HT cannot cross the blood brain barrier cerebral seretonergic neurons
synthesise the compound from the amino acid tryptophan (TRP) and consequently, TRP
transport across the blood-brain barrier functions as a rate limiting step (Newsholme and
Blomstrand, 2006). During prolonged exercise altered substrate utilisation elevates
plasma FFA concentration promoting uncoupling of TRP from albumin and elevation of
free TRP concentrations. Concomitantly, exercise-induced BCAA oxidation may decrease
humoral BCAA concentrations altering the free TRP:BCAA ratio (Davis, 1995; Meeusen et
al., 2006). As TRP transport across the blood brain barrier is via the same carrier utilised
by the BCAA, cerebral TRP increases and elevates 5-HT production possibly resulting in

53
increased lethargy, loss of motivation and central drive during prolonged exercise and
ultimately fatigue. However, while a theoretical basis for a role of 5-HT in fatigue exists,
evidence from human studies is equivocal. Pharmacological intervention to augment 5-HT
ha hown no effect on time to e ha tion or time tria erformance in 30 C Strachan
et al., 2004, 2005; Roelands et al., 2009), but does produce increased core and skin
temperatures (Strachan et al., 2005; Roelands et al., 2009), possibly due to the
hyperthermic effects of 5-HT on the pre-optic hypothalamus (Soares et al., 2007).
Dopamine and noradrenaline share a common biosynthesis pathway and control a
number of biological functions / states including locomotor activity, cognition, emotion,
arousal, motivation, endocrine regulation, mood and reward systems (Missale et al.,
1998; Roelands and Meeusen, 2010). Depletion of these neurotransmitters has been
implicated in fatigue during exercise (Davis, 1997; Watson et al., 2005) and research has
indicated that dopamine manipulation has the potential to improve performance during
exercise in the heat by maintenance of motivation and arousal and overriding of
inhibitory signals from the CNS that would otherwise result in a hyperthermia mediated
reduction in power output. (Watson et al., 2005; Roelands et al., 2008a, 2008b, 2013).
Existing research demonstrates that 5-HT concentration is increased and dopamine
concentration decreased at the point of fatigue in exercise due to FFA mediated increases
in free TRP coupled with increased BCAA oxidation altering the competitive transport of
TRP and tyrosine, precursors to serotonin and dopamine, across the blood brain barrier
(Cansev and Wurtman, 2007; Meeusen and Watson, 2007). Considered the revised
central fatigue hypothesis (Davis, 1997; Meeusen and Watson, 2007), research examining
the effect of an altered ratio of serotonin to dopamine on fatigue is equivocal with no
effect on time to exhaustion in the heat when serotonin concentration is increased
(Hobson et al., 2013), but an improvement in time to exhaustion when dopaminergic
activity is enhanced (Tumilty et al., 2011).

54
A consequence of BCAA metabolism during exercise is glutamate production that may
form glutamine or alanine, but also ammonia (Wilkinson et al., 2010). Ammonia readily
crosses the blood brain barrier and increased production during exercise may result in
high cerebral concentrations (Nybo et al., 2005). Elimination of excess ammonia requires
the synthesis of glutamine from glutamate and ammonia and thus a high concentration of
ammonia in prolonged exercise may affect both glutamate and glutamine and
consequently, CNS function (Nybo et al., 2005; Wilkinson et al., 2010).
2.4.3. Peripheral fatigue
Peri hera fatig e i genera y de cribed a being “ rod ced by change at or di ta to the
ne rom c ar j nction” re ting in m c e fatig e, “any e erci e-induced reduction in
the abi ity of a m c e to generate force or ower” Gandevia, 2001, . 1 33). c e
fatigue is considered to consist of both peripheral and central components, but this
section will focus on the peripheral contributions to muscle fatigue.
The genesis of peripheral fatigue during exercise can be multi-factorial. From a
neuromuscular perspective exercise can elicit peripheral fatigue by impairing action
potential transmission along the sarcolemma, altering excitation-contraction coupling and
actin-myosin interactions (Martin et al., 2010). In addition, metabolic factors, reactive
oxygen species and mechanical aspects of muscle function have been implicated in
peripheral fatigue (Allen et al., 2008; Place et al., 2009).
Action potential propagation across the sarcolemma generally proceeds at ∽ 2 - 6 m.s-1 in
humans to ensure effective muscle contraction (Allen et al., 2008). Disrupted
propagation, consistent with reduced excitability, can arise due to alteration in ionic
balance, primarily accumulation of intracellular Na+ and loss of muscle K+ to the
extracellular environment (Martin et al., 2010). Such perturbations would manifest as
altered M wave characteristics, and if reduced sarcolemmal excitability consistent with a

55
decrease in action potential propagation is symptomatic of exercise induced peripheral
fatigue, should present as a depression in M wave amplitude (Martin et al., 2010). M
wave amplitude has, however, been shown to decrease, increase and not change in
response to exhaustive endurance, repeated sprint and maximal concentric/isometric
knee extensor exercise despite a reduction in force characteristics in associated MVCs and
twitch responses (Martin et al., 2010; Perrey et al., 2010b; Decorte et al., 2012; Froyd et
al., 2013; Girard et al., 2013a&b). It is suggested the methodology employed may affect
the extent of fatigue observed. Allen et al., (2008) propose that membrane excitability is
preserved in exercise through a number of mechanisms that ultimately limit the effect of
K+. Such factors include variation in motor unit recruitment and firing rate, sarcolemmal
action potential changes, Na+-K+ pumping, Cl- channels, alterations in leak conductances
and Ca2+ release feedback (Allen et al., 2008). As such, the observation that M wave
characteristics can be unchanged in exercise but MVC and twitch forces depressed,
suggests that the genesis of peripheral fatigue lies elsewhere within the muscle fibre and
membrane excitability is not a contributory factor (Allen et al., 2008; Place et al., 2009).
More recently however, Sidhu et al., (2012a) demonstrated that sarcolemmal excitability
may be reduced when M wave amplitude is assessed during submaximal dynamic
exercise. Reductions in M wave amplitude were reported when measurements were
made every 3 minutes during 30 minutes of high intensity cycling at 75% maximum
workload (Sidhu et al., 2012a). Such evidence suggests that sustained isometric MVCs
may have limited applicability when trying to model fatigue during activities involving
dynamic contractions such as observed in exercise.
Excitation-contraction coupling has been identified as a potential contributor to
peripheral fatigue during exercise (Place et al., 2009; Martin et al., 2010). Factors that
may exacerbate fatigue by this mechanism could include decreased Ca2+ release from the
sarcoplasmic reticulum contributing to reduced activation of cross bridges, decreased
myofibrillar Ca2+ sensitivity and a reduction in the force produced by each cross bridge
(Place et al., 2009). Such perturbations may occur from alterations in the metabolic milieu
within the muscle fibre, the presence of reactive oxygen species or mechanical factors.

56
During exercise, concentrations of metabolites including lactate, H+ and inorganic
phosphate (Pi) increase within the muscle. Experimental evidence demonstrates lactate
does not contribute to peripheral fatigue (Allen et al., 2008). Similarly, it has been
demonstrated that the effect of increased [H+] and reduced pH on peripheral fatigue is
limited (Allen et al., 2008; Westerblad et al., 2010; Boyas and Guevel, 2011). Low pH does
not noticeably inhibit voltage sensor activation of Ca2+ release, nor does it impact
membrane excitability (Allen et al., 2008; Westerblad et al., 2010; Boyas and Guevel,
2011). Although low pH reduces the contractile apparatus sensitivity to Ca2+, evidence
demonstrates that the effect on contractile apparatus and Ca2+ release is limited and
contradictory as low pH may have an enhancing effect on force development through its
effect on the Ca2+ pump (Allen et al., 2008). Similarly, it has been demonstrated that the
low pH observed at exhaustion in exercise does not impair glycolytic and glycogenolytic
activity (Greenhalf et al., 1993; Bangsbo et al., 1996; Westerblad et al., 2002; Allen et al.,
2008). Both in vitro and in vivo studies have, however, demonstrated that low pH may
slow relaxation rate in skeletal muscle due to a reduced rate of cross-bridge cycling and
may contribute to impaired performance in dynamic exercise through this mechanism
(Bruton et al., 1998; Allen et al., 2008; Place et al., 2010).
At the onset of exercise degradation of phosphocreatine (PCr) by creatine kinase serves
to maintain ATP concentration in skeletal muscle. As a result, the concentration of
creatine and Pi is increased. Increases in [Pi] may contribute to muscle fatigue through a
number of mechanisms. Firstly, increased [Pi] is known to reduce the number of force
generating cross bridges with subsequent decreases in force production (Allen et al.,
2008; Westerblad et al., 2010; Boyas and Guevel, 2011). Secondly, elevated [Pi] reduces
myofibrillar Ca2+ sensitivity through the interaction between myosin cross-bridge
attachment and actin activation (Allen et al., 2008; Westerblad et al., 2010; Boyas and
Guevel, 2011). Finally, by entering the sarcoplasmic recticulum during fatigue, increased
[Pi] may precipitate a reduction in release of free Ca2+ (Allen et al., 2008; Westerblad et
al., 2010; Boyas and Guevel, 2011).

57
During intense fatigue [ATP] may decrease from 7 to 1.2 mM, but in vitro studies with
skinned intact fibres demonstrate no reduction in force production unless [ATP]
decreases to < 20 μM (Westerblad et al., 2002; Allen et al., 2008). In similar circumstances
[Mg2+] can increase from 1 - 2 mM and although not affecting force production, this can
reduce Ca2+ sensitivity and release by the sarcoplasmic reticulum (Allen et al., 2008;
Westerblad et al., 2010; Boyas and Guevel, 2011). Similarly, decreased [ATP] can slow the
rate of Ca2+ pumping and re-uptake by the sarcoplasmic reticulum resulting in elevated
resting [Ca2+] conditions readily observed at fatigue (Westerblad et al., 2002; Allen et al.,
2008). In addition, the sarcoplasmic reticulum Ca2+ release channel is strongly stimulated
by ATP and inhibited by Mg2+ (Westerblad et al., 2002; Allen et al., 2008; Boyas and
Guevel, 2011). As such, when [ATP] decreases and [Mg2+] increases in exercise Ca2+
release is inhibited, reducing the rate of ATP usage by reducing cross-bridge cycling and
Ca2+ uptake by the sarcoplasmic reticulum (Westerblad et al., 2002; Allen et al., 2008;
Boyas and Guevel, 2011). Such a sequence of events can ultimately lead to increased
muscle fatigue. Finally, skeletal muscle glycogen content has been implicated in muscle
fatigue. In isolated murine muscle cell models a reduced pre-fatigue glycogen
concentration has been demonstrated to result in a faster decrease of tetanic [Ca2+] and
force suppression during fatigue and exercise mediated glycogen depletion may induce
muscle fatigue by depression of sarcoplasmic recticulum Ca2+ release (Allen et al., 2008).
Reactive oxygen species (ROS) are produced in skeletal muscle e.g. in mitochondria,
sarcoplasmic recticulum, transverse tubules and plasma membrane at rest and in
response to exercise with the primary free radicals produced in cells being superoxide
and nitric oxide. While low concentrations of ROS serve a number of important functions
such as regulation of cell signalling pathways and control of gene expression in cells, in
large quantities they can induce cellular damage (Power and Jackson, 2008; Westerblad
et al., 2010). Low levels of ROS are necessary for normal force production in skeletal
muscle (Power and Jackson, 2008). With large concentrations, as observed in exercise,
force production in maximal and submaximal contractions is depressed (Power and
Jackson, 2008). It has been suggested that such alterations in force production are
mediated by a number of factors including reduced myofibrillar Ca2+ sensitivity, altered

58
myofilament structure and function and altered cross-bridge kinetics (Power and Jackson,
2008).
From a mechanical perspective, a reduced rate of relaxation is a normal response to
muscle fatigue and may impair performance in tasks requiring dynamic muscle
contraction (Allen et al., 2008). Evidence from animal and human studies has
demonstrated that the increased [H+], [Pi] and [ADP] are likely mediators that cause the
reduction in relaxation rate contributing to muscle fatigue (Allen et al., 2008). Alternately,
Todd et al., (2005) suggest that, with hyperthermia, relaxation rate of muscle is
significantly increased requiring faster motor unit firing rates to produce fusion of force.
Therefore an inability of descending voluntary drive to compensate for altered
augmented muscle relaxation rate may contribute to central fatigue (Todd et al., 2005).
2.4.4. Measurement of Fatigue
2.4.4.1. Maximal voluntary contractions
Although research has begun to examine fatigue during sustained locomotor exercise
(Sidhu et al., 2012a), the majority of existing research on central and peripheral fatigue
during exercise has used maximal voluntary contractions (MVC) with peripheral motor
nerve stimulation pre-post exercise to elucidate neuromuscular fatigue mechanisms. Brief
MVCs have been frequently used to examine force production pre-post locomotor
exercise, but more recently, sustained MVCs have been incorporated to provide further
insight to the mechanisms mediating neuromuscular fatigue. In both modes, a
progressive decline in voluntary force production is observed in the presence of
neuromuscular fatigue (Bigland-Ritchie et al., 1983; Nybo and Nielsen, 2001a&c; Ross et
al., 2007; Periard et al., 2011a&b; Girard et al., 2013a&b).

59
2.4.4.2. Evoked mechanical responses
The interpolated twitch technique is routinely used to assess central and peripheral
contributions to muscular fatigue using direct supramaximal electrical stimulation of the
motor nerve during and immediately following a maximal voluntary contraction (MVC)
(Merton, 1954). When compared to a baseline resting potentiated twitch, supramaximal
stimulation of a motor nerve in a resting muscle post MVC allows examination of evoked
twitch parameters including twitch force, maximal rate of force development (MRFD),
maximal rate of relaxation (MRR) and relaxation half time (RT0.5) and insight to peripheral
fatigue. Compared to a baseline potentiated twitch, twitch force is generally reduced post
MVC demonstrating evidence of peripheral fatigue (Ross et al., 2007; Perrey et al.,
2010b). Reductions in MRFD indicate decreased muscle shortening velocity and
specifically, a reduced rate of cross-bridge formation. MRR and (RT0.5) provide insight to
muscle relaxation velocity with any decrease in these parameters indicating impairment
in rate of weak to strong cross bridge binding and rate of cross bridge uncoupling,
respectively (Jones, 2010).
2.4.4.3. Peripheral voluntary activation
Application of a supramaximal stimulus to a motor nerve during an MVC evokes a
superimposed twitch, (SIT), an indication that voluntary drive to the muscle is not
maximal (Taylor et al., 2006; Gandevia, 2001). Any increase in the size of the
superimposed twitch indicates a reduction in voluntary drive suggesting reduced
recruitment or firing frequency of motor units and therefore provides evidence of central
fatigue. Although used for many years to assess muscular fatigue, the interpolated twitch
does not permit identification of the site of central fatigue beyond proximal to the
neuromuscular junction (Goodall et al., 2012a; Ross et al., 2012). Further, the
interpolated twitch technique can provide an estimate of drive to muscles but is
proposed not to provide an indication of descending drive to motor neurons or take into
account the non-linear input-output relationship of the motor neuron pool (Herbert and
Gandevia, 1999). In addition, increased isometric force, indicative of central fatigue, has
been observed in intact single fibres when such an occurrence should not be possible

60
(Place et al., 2008). Therefore, it is proposed that an alternate mechanism, increased Ca2+
concentration, contributes to the increased forced production during isometric
contraction as opposed to increased central fatigue. Therefore, it is suggested the
interpolated twitch technique over-estimates voluntary activation and central fatigue
(Place et al., 2010).
2.4.4.4. Cortical voluntary activation
More recently, transcranial magnetic stimulation (TMS) applied to the motor cortex has
been used to examine central fatigue and has the advantage that it permits the site of
failure of voluntary drive to be localized (Sidhu et al., 2009b; Goodall et al., 2012a; Ross et
al; 2012). When TMS is applied to the motor cortex during an MVC, observation of a
superimposed twitch provides evidence that motor cortical output is submaximal and
insufficient to drive the motoneurons optimally (Taylor et al., 2006). Again, any exercise
mediated increases in the SIT induced by TMS over the motor cortex indicates decreased
cortical voluntary activation, central fatigue and therefore, more specifically, the
presence of supraspinal fatigue (Sidhu et al., 2009b; Goodall et al., 2012a; Ross et al.,
2012). TMS has been used to assess central contributions to fatigue in a number of
studies and, when used in conjunction with the interpolated twitch technique permits
assessment of central and peripheral fatigue (Ross et al., 2007; Goodall et al., 2010;
Goodall et al., 2012a; Ross et al., 2012). As corticospinal excitability increases during
voluntary contraction and cortical stimulation at rest activates fewer motor neurons, it is
necessary to estimate the resting twitch amplitude when using TMS from linear
regression of the torque responses to TMS of the motor cortex during contractions (SIT)
at 100, 75 and 50% MVC (Goodall et al., 2009, Ross et al., 2012). The y intercept of the
regression line is then taken as the estimated resting twitch. Further, use of TMS
stimulates locomotor muscle additional to the target muscle. Consequently, the target
muscle should be stronger than the antagonist for valid assessment. To-date, TMS has
been used to assess fatigue in a number of studies and is reliable for the assessment of
supraspinal fatigue in the tibialis anterior, elbow flexors and knee extensors (Todd et al.,
2003; Cacchio et al., 2009; Goodall et al., 2009; Sidhu et al., 2009b).

61
2.4.4.5. Evoked EMG responses
In addition to evoked mechanical responses from supramaximal stimulation of a motor
nerve surface electromyography (EMG) provides insight to the electrical activity of the
muscle of interest in the form of a compound muscle action potential (M-Wave). M wave
characteristics including amplitude and area provide insight to sarcolemmal excitability
and propagation of the action potential across the sarcolemmal membrane. Any
reduction in M-Wave characteristics indicates impaired sarcolemmal excitability and
conversely, when no alterations occur in M wave the site of peripheral fatigue is
considered elsewhere within the muscle, for example, impaired excitation-contraction
coupling or actin myosin interaction (Martin et al., 2010). In research concerned with
repeated-sprint exercise, M wave amplitude has been reported to increase (Racinais et
al., 2007), decrease (Perrey et al., 2010b) or not change (Girard et al., 2013a).
Discrepancies in findings may be explained by the moderate reliability of M wave
responses (Place et al., 2007), mode of exercise and type of muscle contraction involved
whereby exercise with primarily concentric work (for example, cycling) may not impair
membrane excitability but exercise with a distinct stretch shortening cycle (for example,
running) might (Perrey et al., 2010b).
Direct stimulation of the motor cortex at rest or during voluntary contraction using TMS
elicits a motor evoked potential (MEP) in surface EMG that permits examination of
corticospinal excitability (Goodall et al., 2012b). MEP latency provides a measure of the
velocity of neural impulse propagation from motor cortex to muscle and MEP area, when
compared to the evoked EMG response from motor nerve stimulation, provides insight to
the extent of motor unit pool recruited (Goodall et al., 2012b). When TMS is delivered
during a maximal voluntary contraction a period of EMG silence follows the MEP, referred
to as the cortical silent period (Goodall et al., 2012b). Inhibitory spinal mechanisms are
thought to contribute to the initial portion of the cortical silent period (< 100 ms),
whereas increased cortical inhibition is considered to represent the latter stages of the
silent period (Inghilleri et al., 1993; Taylor and Gandevia, 2001).

62
2.4.4.6. Voluntary EMG responses
Voluntary EMG activity provides further insight to the manifestation of fatigue during
locomotor exercise as EMG activity provides not only an indication of motor unit
recruitment, but also motor unit firing frequency. During maximal voluntary efforts
voluntary muscle activity can be assessed from EMG amplitude determined using the
root-mean-squared (RMS) value with decreased voluntary force corresponding to
decreased RMS value (EMG amplitude) as fatigue develops. Further EMG amplitudes can
be normalised to the M wave so that accurate assessment of peripheral and central
contributions to fatigue can be made. Previously, voluntary EMG responses have been
used to indicate the existence of central and / or peripheral fatigue during cycling and
running-based intermittent-sprint exercise with a decrease (Racinais et al., 2007;
Rampinini et al., 2011) and no change (Perrey et al., 2010b) reported. Although a
reduction in RMS EMG may be interpreted as decreased voluntary drive in the
aforementioned studies, EMG activity should be interpreted with caution, as amplitude
cancellation and reduced sensitivity to small modification in muscle activation compared
to interpolated twitch may compromise findings (Kalmar and Cafarelli, 1999; Farina et al.,
2004).
2.4.4.7. Perception of effort
During exercise, fatigue manifests as increased sense of effort and reduced force output
soon after the onset of activity, but before task termination (Enoka and Duchateau,
2008). The genesis of effort perception is the subject of debate. Perception of effort has
been correlated with physiological markers during exercise (Edwards et al., 1972).
Further, group III and IV afferents, abundant in skeletal muscle and sensitive to
physiologic, metabolic and mechanical stress, project to the sensory cortex (Craig, 2002).
Consequently, it has been suggested that sense of effort is derived from peripheral
afferent stimuli (Marcora, 2009). However, there is strong evidence to suggest perception
of effort is strongly influenced, if not totally dependent, upon centrally generated
corticofugal motor commands that give rise to corollary discharges (Enoka and Stuart,
1992). That is, perception of effort is centrally generated by neural signals from the motor

63
to sensory cortex (Marcora, 2009) that during exercise would reduce central drive
contributing to fatigue and ultimately reduced performance (Enoka and Stuart, 1992).
2.4.5. Mechanisms of exercise induced neuromuscular fatigue in temperate
environments
The extent of central and peripheral fatigue during exercise is affected by the intensity
and duration of the activity, the speed of contraction and the extent to which the activity
is continuously sustained (Enoka and Stuart, 1992). This section will examine peripheral
and central mechanisms contributing to fatigue in intermittent-sprint exercise. As
literature pertaining to the study of this concept in this mode of exercise is sparse, where
relevant, evidence will be drawn from endurance and repeated-sprint exercise to
elucidate possible mechanisms.
2.4.5.1. Endurance type exercise
Millet et al., (2003) examined central and peripheral fatigue in the knee extensors after a
30 km running race. Isometric force and EMG responses of the knee extensors were
assessed using maximal percutaneous electrical stimulation and superimposed twitches
(Millet et al., 2003). MVC and voluntary activation of the knee extensor and M wave
amplitude were reduced following exercise indicating reduced central drive and altered
sarcolemmal excitability. No failure of excitation contraction coupling was observed.
Similarly, Ross et al., (2007) reported decreased central voluntary activation in ankle
dorsiflexors and tibialis anterior after a treadmill marathon using TMS. Further,
potentiated twitch and MEP amplitude (but not M wave) were significantly reduced
immediately post exercise indicating suboptimal output from the motor cortex and
disruption to the contractile apparatus without impairment of sarcolemmal excitability
(Ross et al., 2007). Large significant decrements in peripheral voluntary activation and
voluntary force has also been reported In longer distance races (24 hour treadmill run)
with concomitant reductions in M wave amplitude but no evidence of failure of excitation
contraction coupling. (Martin et al., 2010)

64
In the first study to use TMS to assess voluntary activation of the knee extensors after
prolonged cycling exercise, Sidhu et al., (2009a) demonstrated decreased MVC force,
significant decrement in cortical voluntary activation and resting twitch amplitude after
exercise. Knee extensor fatigue post exercise was attributed to central and peripheral
factors with 60% of the initial reduction in force owing to failure of the motor cortex to
drive optimally the knee extensors, possibly mediated by afferent feedback (Sidhu et al.,
2009a). With MVC and single, paired potentiated and interpolated magnetic stimulations
of the femoral nerve Decorte et al., (2012) demonstrated that mechanical responses to
magnetic stimulation were decreased mostly in the first half of cycling while voluntary
activation decreases were reported towards the end of exercise only. It was concluded
that peripheral fatigue develops early in constant load cycle exercise owing to afferent
sensing, which is compensated by additional motor drive and central fatigue is associated
with task failure (Decorte et al., 2012).
Taken together, the evidence demonstrates that central fatigue is primarily responsible
for the decrement in force immediately following prolonged running and cycling exercise.
Where TMS has been used, evidence suggests altered motor cortical output contributes
to this decrement and is supported by evidence from cycling based protocols (Sidhu et al.,
2009b). Consistent with the inhibitory feedback hypothesis (Amann, 2011; Amann et al.,
2011, 2013) afferent signaling from group III and IV afferents sensitive to homeostatic
disruption in cytokines, extracellular K+ and other metabolites of fatigue have been
implicated in the reduction in central drive in this type of exercise (Millet et al., 2003,
Sidhu et al., 2009b). Running duration appears to contribute to the extent of central
fatigue (Martin et al., 2010), but the extent of elevation gain and loss may also alter the
fatigue profile as significant peripheral fatigue through failure of excitation-contraction
coupling has been observed in a mountain ultramarathon (Millet et al., 2011).

65
2.4.5.2. Intermittent-sprint type exercise
Central and peripheral fatigue following 10 x 6 s repeated cycle sprints with 30 s recovery
has been examined in a temperate environment (Racinais et al., 2007). Isometric force
and responses to supramaximal stimulation immediately before and after exercise were
examined during brief MVCs, in addition to EMG recording during exercise (Racinais et al.,
2007). Completion of exercise produced a significant decrement in voluntary force.
Potentiated twitch was reduced 9% and while indicating the presence of peripheral
fatigue this decrement was not significant. Further, M wave amplitude increased post
exercise (+13.7%) indicating no disruption to sarcolemmal excitability or action potential
transmission. Voluntary activation was, however, significantly reduced (-3%) post exercise
as was the EMG:M wave ratio and PPO across sprints (Racinais et al., 2007). In addition, a
progressive peripheral muscle deoxygenation was observed and it was concluded failure
of neural drive mediated by group III and IV afferents in response to peripheral muscle
deoxygenation was responsible for the reduced performance (Racinais et al., 2007). Such
an observation would be consistent with the central governor model of fatigue that
suggests during exercise, regulation of effort (motor unit recruitment) to ensure task
completion is achieved by continuous afferent sensing that could include group III and IV
afferents (Figure 2.7., Noakes, 2012). Further, the conclusion of this study is consistent
with the tenet of the inhibitory feedback model of fatigue (Amann, 2011; Amann et al.,
2013, Figure 2.8.), that suggests motor drive is modulated by feedback from group III and
IV peripheral afferents. Amann (2011), however, also suggests the existence of an
individual critical threshold or sensory tolerance limit of peripheral locomotor fatigue that
determines the extent of peripheral fatigue that is tolerated and the extent of inhibitory
feedback to the CNS. Whether this threshold is achieved with the work:rest activity
pattern of intermittent-sprint sports is currently unknown. Similarly, in the current study
(Racinais et al., 2007) decrements in voluntary activation were observed with completion
of only ten 6 s sprints and it is unknown how, in field-based team-sports, where up to
sixty sprints can be completed in a match, the extent or pattern of fatigue is altered or
how the extent of recovery affects these parameters.

66
Figure 2.7. The central governor model of exercise regulation (Noakes, 2012).
Figure 2.8. Schematic representation of the inhibitory feedback model (Amann, 2011).

67
Using an identical protocol to Racinais et al., (2007), Mendez-Villanueva, (2008)
demonstrated with EMG monitoring during exercise a reduction in EMG RMS activity
(14.6%) across 6 s sprints. As a concomitant reduction in peak power output of 24.6%
occurred, the authors inferred from the EMG data that impaired repeated-sprint ability
was associated with progressive inhibition of motor unit recruitment and / or motor unit
firing rate. Further, when ten 6 s sprints were interspersed with 30 s recovery and
followed six minutes later by five 6 s sprints again with 30 s recovery, EMG amplitude
(recorded during exercise) decreased significantly across the first ten sprints and
remained depressed in the final five sprints (Mendez-Villanueva et al., 2012). It was
concluded that afferent sensing related to control of PCr metabolism may have
contributed to suboptimal motor unit activity, as inferred from decreased EMG
amplitude, that resulted in an inability to maintain power output during repeated sprint
exercise. While such findings would again appear to align with the concepts of a central
governor and inhibitory feedback hypotheses, it is important to note that no direct
measure of central activation was performed in either of the aforementioned studies
(Mendez-Villanueva et al., 2008, 2012) and there are limitations associated with inferring
activation from EMG activity as previously described (2.4.4.6). As such, the ability to
elucidate mechanisms of fatigue in repeated sprinting is constrained.
In running based intermittent type exercise, completion of 12 x 40 m sprints with 30 s
recovery produced evidence of central and peripheral fatigue when MVCs, interpolated
twitch, high and low frequency stimulations and EMG data was assessed pre-post
exercise in temperate conditions (Perrey et al., 2010b). In contrast to Racinais et al.,
(2007) M wave amplitude, but not duration, was depressed suggesting impaired action
potential synaptic transmission and sarcolemmal excitability with repeated running
sprints. In addition, responses to low frequency stimulations suggested the presence of
low frequency fatigue indicating potential failure of excitation-contraction coupling in
intermittent type exercise which may indicate an effect of the eccentric muscle activity
inherent in running but not cycling exercise modes (Perrey et al., 2010b). A depressed
voluntary activation (-3%) immediately post exercise implied impaired central neural
drive, but EMG RMS normalised to M wave was not altered (Perrey et al., 2010b). At a

68
spinal level the Hmax/Mmax ratio, demonstrating reflex excitability of the motoneuron
pool was unchanged. The authors concluded that fatigue in repeated running sprints was
primarily due to peripheral factors, including sarcolemmal excitability and excitation-
contraction coupling (Perrey et al., 2010b).
In a more ecologically valid study, Rampinini et al., (2011) examined neuromuscular
fatigue in twenty male professional footballers pre-post a simulated football match.
Before and immediately following a ninety minute match players completed brief MVCs
with interpolated twitch, high and low frequency stimulations and EMG data recorded
(Rampinini et al., 2011). Immediately post exercise, sprint performance and MVC were
significantly depressed. M wave characteristics were unchanged, however, the ratio of
RMS: M wave amplitude was significantly reduced. As voluntary activation and EMG
activity were also significantly reduced it was suggested the decreased MVC post exercise
could partly be attributed to central fatigue. Similar to Perrey et al., (2010b) low
frequency fatigue was also observed indicating a peripheral effect on performance,
specifically, alterations in excitation-contraction coupling (Rampinini et al., 2011).
The only study to-date to examine neuromuscular fatigue in intermittent sprint exercise
using TMS was conducted by Girard et al., (2013a). TMS and femoral nerve stimulation
was performed during brief (5 s) and sustained (30 s) MVCs pre and post 10 x 6 s sprints
with 30 s recovery on a cycle ergometer followed six minutes later by five, 6 s sprints with
30 s recovery in twelve male participants (Girard et al., 2013a) in a temperate
environment. In brief MVCs MEP amplitudes, cortical voluntary activation and cortical
silent period were not different pre-post exercise (Girard et al., 2013a). In sustained
contractions cortical voluntary activation was reduced pre and post exercise but exercise
mediated a greater reduction. M wave amplitude was decreased pre-post exercise in
sustained MVC but was unchanged in rest and brief MVCs (Girard et al., 2013a). Post
exercise, the potentiated twitch was reduced while also showing decreased contraction
and relaxation rates (Girard et al., 2013a). It was concluded that the responsiveness of
corticospinal neurons was not impaired by repeated cycle sprints and peripheral factors

69
were primarily involved in the exercise-mediated impairment in neuromuscular function
(Girard et al., 2013a).
2.4.6. Mechanisms of Exercise Induced Fatigue in Hot Environments
Previously, impairments in voluntary activation, assessed using the interpolated twitch
technique, have been reported in brief MVCs with passive hyperthermia to induce a core
temperature of ∽ 39.5°C (Morrison et al., 2004; Thomas et al., 2006, Figure 2.9.).
Similarly, with modest hyperthermia of ∽ 38.5°C a reduction in voluntary activation using
TMS in sustained 2 minute MVCs has been reported (Todd et al., 2005). The impairment
in voluntary activation with hyperthermia has been correlated with cerebral blood flow at
rest and after exercise in the heat (Nybo and Nielsen, 2001b; Ross et al., 2012). In
hypoxia, decreased cerebral blood flow exacerbates the decline in cerebral oxygenation
and contributes to a two-fold greater decrease in cortical voluntary activation after
exercise despite near identical levels of muscle fatigue (Goodall et al., 2012a). As such,
given the decreased cerebral blood flow observed at rest and in exercise in heat stress
and the subsequent potential decrease in cerebral oxygenation, the physiological
conditions exist for a greater central fatigue during exercise in the heat and decreased
central neural drive in hyperthermia. Consequently, the impact of hyperthermia on
fatigue has been investigated in a number of studies.

70
Figure 2.9. Voluntary activation induced by passive hyperthermia (A, Thomas et al., 2006;
B, Morrison et al., 2004).
2.4.6.1. Endurance type exercise
The impact of hyperthermia on central and peripheral fatigue in endurance type exercise
has been the subject of investigation in a number of studies (Nybo and Nielsen, 2001a;
Periard et al., 2011a&b). Nybo and Nielsen (2001a) reported that 40°C heat stress
induced significant decrements in voluntary activation following exercise to e ha tion at
60 2max in 40°C. Consistent with the concept of a critical limiting temperature (Nielsen
et al., 1993; Gonzalez-Alonso et al., 1999) the authors attributed the decrement in central
drive to the exercise-induced core (oesophageal) temperature of 40.0 ± 0.1°C (Nybo and
Nielsen, 2001a). In contrast, Periard et al., (2011a) demonstrated evidence of central and
peripheral fatigue in sustained MVCs with percutaneous tetanic stimulation following 40
km cycle time trials in both hot and temperate conditions. The decline in voluntary
activation was calculated to represent ~ 20% of the decrease in mean force in both trials
and it was concluded that impairment of force production in 40 km cycle time trial
exercise was localised (no change in hand grip MVC), mediated primarily by peripheral
fatigue with no additional effect of heat stress (Periard et al., 2011a). No EMG or evoked

71
twitch data were reported in this study and the possible mechanism of peripheral fatigue
could not be elucidated. Similar findings were, however, reported by Periard et al (2011b)
and it was speculated that excess cardiovascular strain associated with cycle exercise in
the heat contributed to the observed fatigue. Such a suggestion is supported by Ely et al.,
(2009), who posit that excessive cardiovascular and thermal strain better explain fatigue
in the heat than a limiting core temperature and have demonstrated that, in studies
supporting the concept of a limiting core temperature, exhaustion has always coincided
with excessive cardiovascular strain that likely compromises performance due to the
competitive metabolic and thermoregulatory demands on cardiac output (Ely et al., 2009;
Cheuvront et al., 2010). Further, during exercise in the heat it has been shown that
performance can be maintained when cardiovascular strain is low (Ely et al., 2009, 2010;
Cheuvront et al., 2010).
Finally, Racinais and Girard, (2012) examined fatigue in incremental cycling exercise
preceded by submaximal cycling in hot (40°C) and control (24°C) conditions using TMS
and percutaneous stimulations. Termination of exercise in the heat occurred at a lower
peripheral fatigue and despite reductions in MVC and M wave that would suggest
impaired membrane excitability and action potential transmission in the plantar flexors
compared to knee extensors in the heat, most of the effects of heat exposure and
exercise induced fatigue were independent of each other (Racinais and Girard, 2012).
Although EMG activity was lower in the heat at exhaustion, MEP amplitudes normalised
to M wave were maintained and the authors concluded that neuromuscular fatigue was
unlikely to explain earlier exercise cessation in the heat (Racinais and Girard, 2012).
Interestingly, core temperature at exhaustion in the heat was only 38.9°C and it is
tempting to speculate whether this attenuated responses.
2.4.6.2. Intermittent-sprint type exercise
Duffield et al., (2009) examined the effect of heat stress on repeated cycling sprints in
seven male and six female team-sports athletes. In either 22°C or 33°C (40% rh)

72
participants completed a 30 minute exercise protocol comprising a 20 s maximal sprint
every 5 minutes separated by submaximal cycling at 100 watts with MVCs and evoked
twitches performed before and immediately following exercise. No differences in peak
power output were reported between conditions. MVC and evoked twitch was
significantly reduced immediately post exercise in both trials, but was not significantly
different between hot and control conditions (Duffield et al., 2009).
Similarly, Almudehki et al., (2012) reported no significant difference in peak power output
when ten males performed 35 minutes of cycle exercise comprising 8 x 6 s sprints
interspersed with 1 minute of passive recovery followed by 4 minutes of constant load
pedalling in 40°C, 40% rh or 24°C, 20% rh. Although physiological and perceptual
measures were higher in the hot trial, EMG RMS and neuromuscular efficiency
(power:RMS ratio) were not different between trials (Almudehki et al., 2012). It was
concluded that heat stress does not impact performance or neuromuscular factors during
intermittent-sprint cycling although observed lack of change may have been due to the
low core temperatures evoked by the protocol (∽ 37.7°C). Similarly, when recreationally
active males performed 10 x 6 s sprints followed six minutes later by 5 x 6 s maximal
sprints with 30 s recovery in 24°C or 35°C, no difference was observed between
conditions in strength, rate of force development, and voluntary activation, although
power output was increased in the hot trial (Girard et al., 2013b). It is important to note,
however, that in the work of Duffield et al., (2009) and Almudehki et al., (2012) the
protocols used do not replicate the work:rest ratios of field-based team-sports. As such,
relatively long recovery periods were employed, limiting the extent of hyperthermia
induced. Similarly, in the work of Girard et al., (2012b) the mean core temperature in
exercise was only 38°C in the heat and 37.7°C in the temperate trial. As such, the data is
unlikely reflective of core temperatures that would be expected in a field-based setting
over durations reflective of field-based team sports and therefore, the observations from
such studies are of limited application.

73
Nybo et al., (2013) in an ecologically valid design, examined neuromuscular function in
seventeen semi-professional football players completing a football match in 43°C and
21°C. MVCs and interpolated twitch of the plantar flexors were performed pre-post
exercise in both conditions. Exercise impaired force generation and voluntary activation
in both conditions, but there was no difference between trials (Nybo et al., 2013). It was
concluded that heat stress does not provide an additional load that exacerbates central
and peripheral fatigue (Nybo et al., 2013). In the current study, core temperature was
reported as 39.6°C in the hot match and muscle temperature was reported between
39.9°C - 41.1°C. As such, the extent of hyperthermia was marked and sufficient to
mediate fatigue and may have accounted for the small, but significant change in
voluntary activation in both conditions (average - 1.5%). It is important to note that in this
study total game distance declined by 7% and high intensity running by 26% in the hot
compared to temperate trial. As such, given the self-regulated nature of the match it is
tempting to suggest that afferent sensing may have contributed to a down regulation of
motor unit activity to ensure task completion (Amann, 2011; Noakes, 2012; Amann et al.,
2013) and may have contributed to findings. Similarly, it is unknown whether such a value
is reflective of a true change or merely variation inherent in the measurement method.
2.4.7. Summary
Fatigue may be defined as “a red ction in the ma ima force-generating capacity of a
m c e” Gandevia, 1992) and i freq ent y referred to a eri hera or centra in origin.
When undertaken in a hot compared to temperate environment, exercise performance
across a spectrum of disciplines is reduced. The genesis of fatigue remains unclear, but is
accepted to have both central and peripheral components the extent of which is
dependent on a number of variables, including duration and intensity of exercise,
endogenous and exogenous heat load, cardiovascular function, neuro-humoural factors
and brain function. A large body of literature exists on the genesis of fatigue in endurance
type activity and a number of hypotheses are proposed to explain its occurrence. In
intermittent sprint type exercise however, a distinct lack of literature limits our
understanding of central and peripheral fatigue. Further, existing fatigue hypotheses have
74
not been applied to explain fatigue in intermittent-sprint exercise. For example, Amann,
(2011) and Amann et al., (2013) propose existence of an individual critical threshold or
sensory tolerance limit of peripheral locomotor fatigue that determines the extent of
peripheral fatigue that is tolerated and the extent of inhibitory feedback to the CNS.
Whether the intermittent nature of field-based team sport and the inherent work:rest
ratios allow such a threshold to be exceeded is unknown. Further, whether heat stress
would increase the likelihood that this threshold would be surpassed in intermittent
activity is also unknown. More recent work has started to provide insight but again, this
has tended to rely on interpolated twitch techniques which limit conclusions on central
fatigue. Only one study to-date has examined fatigue in intermittent-sprint exercise using
TMS and while this serves to provide excellent insight it was conducted in a temperate
environment using a protocol that did not replicate the duration or work:rest ratio of
field-based team-sports. As such, evidence is still lacking on how hyperthermia modulates
central and peripheral fatigue during intermittent-sprint exercise that replicates field-
based team sports, particularly under conditions of heat stress. Current work suggests
that fatigue during intermittent-sprint exercise, rather than being mediated by neural
drive, is predominantly mediated by peripheral factors, including PCr supply and oxygen
content and metabolites e.g. H+ and Pi (Bishop, 2012). However, much of the work
providing this evidence is limited in ecological validity and further research is required.

75
2.5. Heat Acclimation
Heat acclimation / acclimatisation4 is frequently used to minimise the effect of excessive
heat stress on physiological strain and performance during competition in a hot
environment. Different approaches are used to evoke heat acclimation, but the
effectiveness of a protocol is generally judged by its ability to confer classic physiological
responses. While studies differ in their interpretation of these (for example, Wyndham et
al., 1976; Barnett and Maughan, 1993; Buono et al., 2009; Amorim et al., 2011) and
therefore, the effectiveness of their protocol, classic markers of heat acclimation include
decreased heart rate and core temperature in rest and exercise, increased sweat rate and
increased plasma volume. This section of the review will commence with an overview of
methods of heat acclimation and will examine adaptation to heat acclimation. It will then
consider the efficacy of existing heat acclimation protocols against classic criteria for a
heat acclimated phenotype but, will also consider additional criteria of reduced skin
temperature, decreased perception of effort / thermal sensation or comfort and
improved physical performance that are reported in the literature (for example, Pandolf
et al., 1977; Horowitz and Kodesh, 2010). Finally, this section will examine possible
alternative methods for heat acclimation. Data for this section has been derived from
literature searches of databases (Web of Science, PubMed and Sport Discus) and existing
reviews on heat acclimation. Studies presented in tables 2.3. - 2.6. are limited to humans
with a minimum of four participants and evidence on at least three markers of heat
acclimation.
2.5.1. Heat acclimation methods and protocols
Many strategies have been used to elicit and maximise adaptive responses to heat stress.
Protocols for heat acclimation have included passive methods, or more frequently, a
combination of long or short duration, intermittent or continuous, moderate or high
4 Heat acclimation refers to the physiological adaptations to heat brought about by exposure to a controlled laboratory environment,
while heat acclimatization refers to the same adaptations brought about by exposure to a naturally hot climate. Both methods result in
similar physiological adaptations (Armstrong and Maresh, 1991) and therefore, the term heat acclimation will be used to encompass responses. Where a study has specifically used heat acclimatisation this will be identified.

76
intensity exercise for a fixed duration, or for a target core temperature. Despite the
myriad of protocols, regimes can be classified as one of three types; self-regulated
exercise, constant work rate or isothermal strain (Taylor, 2000; Garrett et al., 2011).
2.5.1.1. Self-regulated protocols
In self-regulated acclimation protocols, exercise intensity is participant-regulated based
on fitness (Taylor, 2000; Garrett et al., 2011). Consequently, potential for premature
cessation of exercise due to hyperthermia is minimised. Self-regulated protocols are,
however, of limited effectiveness from a research perspective as the intensity of exercise
and hence endogenous heat production can vary between participants during a session
(Taylor, 2000; Garrett et al., 2011). As such, this type of protocol may be more suitable in
a practical setting (Taylor et al., 2000; Garrett et al., 2011) than for understanding the
true mechanisms that underpin adaptation to repeated heat exposures.
2.5.1.2. Constant work rate protocols
Constant work rate protocols that require participants to exercise at a fixed intensity over
a specific number of days represent the traditional model of heat acclimation and are the
most frequently used (Taylor, 2000; Garrett et al., 2011). A large body of research has
been generated providing evidence as to the effectiveness of traditional acclimation in
eliciting adaptations to the heat and to optimize response it is recommended exercise for
60 - 100 minutes per day is completed in conditions that simulate the expected
environment, at intensities of greater than 40% 2max for 10 - 14 days (Mitchell et al.,
1976; Sawka et al., 1985; Armstrong and Maresh, 1991; Maughan and Shirreffs, 2004).
For the r o e of thi review, rotoco invo ving 60 minutes er day at 0 2max
for 10 - 14+ days will hereafter be referred to as traditional (Table 2.3.). Where protocols
have used similar intensities, but reduced number of days they will be considered
medium to short-term traditional heat acclimation (Table 2.4.).

77
2.5.1.3. Isothermal strain / controlled hyperthermia protocols
Isothermal strain / controlled hyperthermia / thermal clamp protocols were developed in
the 1960s by Fox and colleagues on behalf of the Medial Research Council (Turk and
Thomas, 1975). Isothermal strain models of heat acclimation are based on the premise
that attainment and maintenance of an elevated core temperature above the sweating
threshold is central to effective heat acclimation (Taylor et al., 1997; Taylor, 2000). As
such, this method of heat acclimation may offer more complete adaptation to the heat by
elevating all participants to a pre-determined ‘critica ’ core tem erat re ∽ 38.5°C) and
maintaining it by modifying workload throughout the session (Taylor, 2000; Garrett et al.,
2011). Such a model of heat acclimation has the potential to maximise adaptive
responses (Table 2.5.), because as the athlete adapts across the protocol greater work is
required to achieve the required core temperature, thus maximising heat strain for the
duration of the protocol. Research on isothermal protocols is limited however, and
although Garrett et al., (2012) demonstrate the efficacy of short term isothermal
acclimation for highly trained athletes, little is known about the effect of the required
increase workload on the training load of athletes prior to competition and, for example
the subsequent immune response. Further from an individual perspective it is unknown
how individuals of differing fitness or age cope with the extent of work required to
achieve / sustain a core temperature of 38.5°C.
2.5.2. Adaptation to heat acclimation
Heat acclimation protocols typically result in a number of adaptations within the human
body that serve to reduce physiological strain, increase the ability to exercise in a hot
environment and lessen the chance of heat illness (Armstrong and Maresh, 1991, Figure
2.10.). Research has demonstrated that the rate of adaptation varies for different
physiological markers of heat acclimation typically in a biphasic pattern (Wyndham et al.,
1976; Horowitz and Kodesh, 2010, Figure 2.10.). Further, while it is proposed that
adaptations are more or less complete within 7 - 14 days, it is suggested 66 - 75% of
physiological adjustments are seen in 4 - 6 days (Pandolf, 1998; Maughan and Shirreffs,

78
2004) and physical fitness may contribute to inter-individual variation in response time
(Pandolf et al., 1977). The extent of adaptation may be altered by the environment in
which the heat acclimation takes place. Hot humid environments are suggested to
promote a greater eccrine gland adaptation (Armstrong and Maresh, 1991). Hot dry
environments have been suggested to confer enhanced responses including earlier onset
of sweating and lower skin temperature that promotes enhanced circulatory stability due
to a decreased requirement for skin blood flow (Shvartz et al., 1973). Griefahn (1997)
argues, however, when environments are matched for heat stress there is no difference
in acclimation response.
Figure 2.10. Adaptations to traditional heat acclimation (Armstrong and Maresh, 1991).
2.5.2.1. Molecular and cellular responses to heat acclimation
To achieve the heat acclimated phenotype, re-programming of gene expression must
occur. Consistent with the observed biphasic systemic adaptations to heat acclimation
(Figure 2.10.), evidence at a molecular level, albeit in muroid models, also supports a
biphasic altered gene expression in response to chronic sub-lethal heat exposure
(Horowitz et al., 2004). As such, it has been proposed the molecular response to heat
acclimation constitutes a defence strategy comprising two stages, an immediate transient
stage with a focus to maintain DNA integrity and a sustained stage where signalling
networks aligned to cytoprotection are enhanced (Horowitz et al., 2004). Therefore,

79
Horowitz et al., (1998, 2002, 2004, 2010) view heat acclimation as a two component
model comprising short and long term components, whereby the primary function of the
process is to widen the dynamic thermoregulatory range by reductions in body
temperatures and temperature thresholds and an elevation of the upper temperature
that can be experienced before heat injury (Figure 2.11.).
Figure 2.11. A conceptual model of heat acclimation (Horowitz et al., 2002).
Horowitz et al., (1998, 2002, 2004, 2010) propose that the initial stage of heat acclimation
is mediated by the enhanced activity of the autonomic nervous system (1) promoting
over-activation of heat defence mechanisms (2) to compensate for insufficiently adapted
systemic responses. The molecular basis for this is observed in the upregulation of genes
linked with DNA maintenance and repair, but also the upregulation of gene coding for
voltage gate ion channels, ion pumps, hormones, transmitter receptors and cellular
messengers (3) (Horowitz and Kodesh, 2010). Further, as heat acclimation progresses it is

80
suggested upregulation of signalling networks and gene transcription for cytoprotective
mechanisms is enhanced as systemic adaptation is achieved (Horowitz and Kodesh, 2010).
In addition, with long term acclimation there is downregulation of genes associated with
energy metabolism, food intake and cellular disturbance and a return to preacclimation
levels of genes encoding for enhanced nervous system activity (4) (Horowitz and Kodesh,
2010).
As described, the ability to acquire the heat acclimated phenotype through heat exposure
is a chronic adaptation requiring gene reprogramming (Horowitz and Kodesh, 2010).
Although not studied in respect to heat acclimation, the ACE gene, given the importance
of this gene in the renin-angiotensin pathway and fluid regulation, may also be important
in heat acclimation and tolerance. Heled et al., (2004) examined the ACE gene and
polymorphisms in fifty eight participants during a two hour heat test and demonstrated
that thermoregulatory capacity was consistently better in those with the I+ allele
compared to DD suggesting that this allele may confer better heat tolerance.
The ability of humans to tolerate heat stress is multifactorial. However, a common, acute
and transient reaction to heat stress is the heat shock response. The heat shock response
is a cellular adaptation that confers thermotolerance in the cell, the ability to survive a
potentially lethal heat stress due to cellular adaptation caused by prior exposure to a
single severe, non-lethal heat exposure (Moseley, 1997). Thermotolerance is mediated by
heat shock proteins.
Heat shock proteins (HSPs) are a highly conserved group of proteins classified according
to their molecular weight (in kiloDaltons, for example, HSP70) and function into five
groups (Moseley, 1997; Schmitt et al., 2007). HSPs operate at both an intracellular and
extracellular level completing a range of functions in mammalian cells, including
cytoprotection, apoptosis mediation, neuroprotection and molecular chaperoning of
antigenic peptides (Moseley, 1997; Horowitz et al., 2002; Schmitt et al., 2007; Horowitz

81
and Kodesh, 2010). Essentially, HSPs function as molecular chaperones assisting with
protein folding and refolding after denaturation and therefore, function to conserve
protein homeostasis (Kresfelder et al., 2006; Schmitt et al., 2007). Cell HSP concentration
is augmented in response to insult such as hyperthermic, oxidative or exercise stress and
upregulation occurs within minutes at a cellular level, but full thermotolerance is
expressed ~ 24 hours post exposure with activity maintained for a number of days
(Horowitz, 1998; Maloyan et al., 1999; Horowitz and Kodesh, 2010; Magalhaes et al.,
2010; Taylor et al., 2011).
Originally, thermotolerance, an acute cellular response to heat stress was considered
separate to heat acclimation, a systemic adaptation conferred by chronic exposure to
sub-lethal heat stress resulting in the acclimated phenotype (Kueenen et al., 2011).
However, evidence that HSPs were augmented by exposure to physiologically relevant
temperatures and attenuated a heat-induced permeability of the epithelial monolayer
conferring protection against endotoxaemia and cytokine production suggested that HSP
and particularly HSP70 could play a role in conferring heat acclimation mediated
tolerance in a multicellular system (Moseley, 1997). Consequently, the role of HSP70 and
its inducible form HSP72, considered the most responsive to heat stress, in acclimation
has received much attention and contrasting findings have been reported. In a muroid
model Maloyan et al., (1999) demonstrated that heat acclimation resulted in a larger
resting concentration of HSP72 and an accelerated transcription of the HSP72 gene
making the HSP system better able to respond to heat stress. HSP production was
attenuated in the early days of acclimation however, ruling out a protective effect of HSP
in heat acclimation (Maloyan et al., 1999). Kresfelder et al., (2006) reported depressed
basal levels of extracellular HSP70 and increased ability to induce HSP70 in combination
with a specific HSP70 genotype only in individuals who were able to acclimate. Similarly,
Marshall et al., (2006) reported reduced resting extracellular HSP72 in the first two days
of an acclimation programme and speculated this may be necessary for improved cellular
stress tolerance. Yamada et al., (2007) demonstrated sustained elevation of intracellular
HSP72 from day six to ten of a heat acclimation protocol and concluded such a response
may have contributed to improved heat tolerance and reduced risk of heat injury.

82
Similarly, McClung et al., (2008) demonstrated augmented intracellular HSP72 and
inducibility of HSP72 after 10 days of heat acclimation. In 2010, Magalhaes et al.,
demonstrated that isothermal acclimation induces increased basal levels of intracellular
HSP and during subsequent exercise in the heat acclimation inhibits the exercise-induced
increase in intracellular and extracellular HSP72. With respect to research focussed on
intermittent-sprint exercise, Castle et al., (2011) demonstrated that 10 days of traditional
acclimation increased resting plasma HSP concentration and improved performance
during 40 minutes of intermittent sprinting. Although the aforementioned provides
evidence for a role of HSP70/72 in heat acclimation it is important to note that the heat
shock response may be invoked by a number of stressors including, for example exercise
and glycogen depletion. Therefore, as control groups were not used in the
aforementioned studies it is difficult to disentangle the individual effects of different
stressors in an exercise-heat acclimation protocol. That said, compelling evidence for a
common mechanism for thermotolerance and acclimation and therefore a role of HSPs in
acclimation is provided by Kuennen et al., (2011). Eight males completed a 7 day
isothermal exercise-heat acclimation with either placebo or quercetin, a heat shock
response inhibitor and were assessed for markers of thermotolerance including
gastrointestinal (GI) permeability and leukocyte HSP70 content (Kueenen et al., 2011). On
completion of acclimation GI permeability remained elevated, HSP70 was not increased
and body temperature was not reduced in comparison to the placebo group. It was
concluded that use of a heat shock inhibitor prevents both cellular (thermotolerance) and
systemic (acclimation) adaptations but the authors also acknowledged the antixodant
effect of quercetin that may mean any observed lack of change was due to an antioxidant
mediated reduction in cellular stress with heat insult (Kuennen et al., 2011).
2.5.2.2. Thermoregulatory adjustments to heat acclimation
A primary thermoregulatory adaptation observed in the heat acclimated phenotype is a
decreased resting and exercise core temperature (Armstrong and Maresh, 1991). This
adaptation is frequently observed with both traditional and isothermal heat acclimation
protocols. Yet, where intermittent exercise is used to induce adaptation the response is

83
less clear with no change in exercise core temperature (Sunderland et al., 2003), a
reduction in exercise but not resting core temperature (Sunderland et al., 2008; Brade et
al., 2013) and no change in either (Petersen et al., 2010). In the instance of the cited
literature such discrepancy may reflect the short term nature of the protocols used.
Generally, the magnitude of the reduction in resting rectal temperature with heat
acclimation is suggested to be in the region of 0.3°C - 0.5°C and it is proposed that this
reduction accounts for between 37 - 50% of the observed reduction in end exercise rectal
temperature (Buono et al., 1998; Kampmann et al., 2008). Evidence suggests a lowering
of the hypothalamic thermoregulatory set point and a reduction in heat storage via
improved heat loss mechanisms, in conjunction with cardiovascular adjustments, is
responsible for this response (Garden et al., 1966; Buono et al., 1998, Armstrong 1998).
More recently, research has suggested levels of prostaglandin E2, cyclooxygenase and
orexin, key thermoregulatory molecules that mediate hyperpyrexia, are attenuated after
heat acclimation and therefore, it is suggested they play a role in mediating the decreased
resting core temperature (Shin et al., 2013). Kampmann et al., (2008) also demonstrated
that training in a neutral environment reduced resting core temperature and therefore,
speculate that during acclimation in moderate heat stress the intensity of exercise is an
important mediator of the reduced core temperature.
Evidence suggests that skin blood flow is increased following heat acclimation at a given
internal temperature (Fox et al., 1963; Roberts et al., 1977), but maximal skin blood flow
is not altered (Lorenzo and Minson, 2010). Originally, it was suggested that this
adaptation was due to a reduction in the threshold for cutaneous vasodilation mediated
by a central mechanism (Nadel et al., 1976; Yamazaki and Hamasaki, 2003). More recent
research has, however, demonstrated a peripheral control mechanism may also
contribute (Lorenzo and Minson, 2010). Lorenzo and Minson (2010) demonstrated this
peripheral aspect through an increased cutaneous vascular conductance and skin blood
flow to a local stimulus by microdialysis with acetylcholine. It was suggested that heat
acclimation may increase cutaneous vascular conductance by increased muscarine
receptor number, decreased sensitivity to cholinesterase activity or alterations in the

84
pathway of vasodilation in smooth muscle or endothelial cells (Lorenzo and Minson,
2010).
A reduction in skin temperature during both endurance and intermittent-sprint exercise
in hot and temperate conditions has been reported after traditional, isothermal and
intermittent-exercise acclimation (Shvartz et al., 1973; Fein et al., 1975; Nielsen et al.,
1993; Regan et al., 1996; Nielsen et al., 1997; Buono et al., 2009; Lorenzo et al., 2010;
Brade et al., 2013). Depressed skin temperature may augment the core:skin temperature
gradient increasing heat dissipation that contributes to a lower core temperature and a
reduced skin blood flow in exercise post acclimation (Regan et al., 1996; Lorenzo et al.,
2010). It is proposed a reduction in the hypothalamic setpoint for sweating onset coupled
with an increased sweat rate and increased evaporation contribute to the lower skin
temperature post acclimation (Shvartz et al., 1973; Lorenzo and Minson, 2010).
Heat acclimation induces an increase in whole body sweat rate and this has been shown
during exercise in hot and temperate environments in traditional and isothermal
protocols (Nadel et al., 1974; Nielsen et al., 1993; Patterson et al., 2004; Machado-
Moreira et al., 2005; Buono et al., 2009). With intermittent exercise acclimation protocols
sweat rate is increased (Brade et al., 2013), but is also reported to not change
(Sunderland et al., 2008) possibly owing to the training state of participants. Adaptation
to sweat rate arises through lowering of the zero point of the central nervous system for
sweating, i.e., a central neutrally mediated adaptation (Nadel et al., 1974). In addition,
enhanced thermosensitivity, i.e., a peripheral adaptation, contributes including eccrine
gland hypertrophy, increased cholinergic sensitivity of the gland and increased peri-
glandular concentrations of acetylcholine (Buono et al., 2009). Further, heat acclimation
augments capacity of all sweat glands towards maximal flow rates (Patterson et al., 2004).
Originally, it was suggested enhanced sudomotor function was a slow response occurring
in the latter days of heat acclimation and requiring up to fourteen days to achieve
complete adaptation (Armstrong and Maresh, 1991). More recent research, however, has
demonstrated sudomotor adaptation from approximately day 3 - 6 of heat acclimation,

85
but more complete adaptation e.g. improved sensitivity requiring up to fourteen days
(Patterson et al., 2004; Buono et al., 2009). Further, recent research contends that early
observations of slow sudomotor adaptation may merely reflect the type of protocol used
and demonstrate that sudomotor function can be enhanced within six days using an
isothermal model of heat acclimation (Patterson et al., 2004).
In addition to an increased whole body sweat rate, altered sweat composition through
the retention of Na+ and Cl- is reported with heat acclimation (Kirby et al., 1986; Buono et
al., 2007; Chinevere et al., 2008). It is suggested enhanced retention of Na+ is mediated
through the action of plasma renin and aldosterone (Kirby et al., 1986; Chinevere et al.,
2008). In response to fluid loss and a decrease in systemic blood pressure, renin is
produced in the juxtaglomerular cells of the kidneys. This enzyme catalyses the
conversion of angiotensin formed in the liver to angiotensin I (Gard, 1998). During blood
transit through the alveolar capillaries angiotensin I is converted to angiotensin II by
angiotensin converting enzyme. Together with its metabolite angiotensin III, angiotensin
II acts on receptor cells in the zona glomerulosa to induce the synthesis of aldosterone
(Gard, 1998). Aldosterone acts on target cells in the distal tubule of the kidneys and sweat
glands to increase their reabsorption of Na+. By stimulating return of Na+ to the blood,
aldosterone prevents depletion of Na+ from the body. The Na+ reabsorption leads to
reabsorption of Cl- and HCO3- and retention of water, thus contributing towards improved
cardiovascular stability and reduced thermal strain.
2.5.2.3. Endocrine and metabolic adjustments to heat acclimation
The effect of heat acclimation on the fluid regulatory hormone aldosterone has also been
examined. Research concerning hormonal responses to acclimation / acclimatization has
produced conflicting results. Bonner et al., (1976) reported no significant difference in
aldosterone level after thirteen days passive heat acclimation using the hot bath
techniq e 1˚C H2 in 0˚C chamber). Arm trong et a ., 1989) a o demon trated no
reduction in aldosterone level from days one to ten of an inten e acc imation rotoco

86
68 2max, 1.2 0. ˚C, 39.0 1. rh). Simi ar y, France coni et a ., 1983) gge ted
acc imation to heat 10 d. treadmi 28-3 2max , 2 x 50 min bouts alternate days @
3 ˚C 9 rh and 9˚C 20 rh) does not consistently affect responses of plasma
aldosterone, particularly when subjects were euhydrated. Garrett et al., (2009, 2012)
supports this as short-term heat acclimation in moderately trained males did not increase
aldosterone over day 1 - 5 but in highly trained athletes resting aldosterone was
increased when short-term heat acclimation was accompanied by dehydration. Other
research has observed an initial increase in aldosterone levels in the early days of a heat
acclimation protocol followed by attenuated levels in the latter stages (Kirby et al., 1986,
Francesconi et al., 1993). It is thought this response may be due to the plasma volume
expansion accompanying acclimation (Francesconi et al., 1983). A primary function of
aldosterone in the initial stages of a heat acclimation programme is to reduce the loss of
Na+ due to elevated sweat rates. Reabsorption of Na+ leads to reabsorption of Cl- and
HCO3- and retention of water, thus contributing towards improved cardiovascular stability
and reduced thermal strain. In combination with antidiuretic hormone, aldosterone is
important in the control of plasma volume expansion and thus the biphasic pattern of
aldosterone expression may be due to the plasma volume expansion accompanying
acclimation (Francesconi et al., 1983; Garret et al., 2011). Evidence to support this is
demonstrated by research using spironolactone to inhibit aldosterone that observed a
restricted plasma volume expansion in participants from which is was concluded 40% of
plasma volume expansion could be explained by aldosterone (Luetkemeier et al., 1994).
Other endocrinological responses to heat acclimation include altered cortisol
concentration. With exposure to heat stress during the initial days of a heat acclimation
programme, concentrations of plasma cortisol are increased (Armstrong, 1998). Cortisol is
suggested to reflect the degree of physiological strain experienced and heat tolerance
during heat stress or during a particular heat acclimation protocol. As an acclimation
protocol progresses and greater cardiovascular and thermoregulatory stability is
achieved, concentrations of cortisol are attenuated (Pepper, 1985; Armstrong et al.,
1989). In contrast, Garrett et al., (2009) and Sunderland et al., (2008) have reported no
change in cortisol in response to short-term heat acclimation.

87
Metabolic adaptations to heat acclimation include altered fuel utilisation, with research
demonstrating decreased muscle glycogenolysis and lactate formation post acclimation
(Kirwan et al., 1987). The mechanism responsible for this alteration in substrate utilisation
is the subject of debate, with redistribution of blood flow, increased hepatic
glycogenolysis, increased plasma volume, altered fibre type recruitment and decreased
cathecholamine concentration possibly owing to hypervolaemia identified as possible
factors (Sawka et al., 1983a; Febbraio, et al., 1994; Young et al., 1985).
2.5.2.4. Cardiovascular adjustments to heat acclimation
Other physiological adaptations to heat acclimation include plasma volume expansion of
which 40% can be attributed to the thermal stimulus and 60% to exercise related factors
(Convertino et al., 1980). A plethora of investigations using both traditional and
isothermal acclimation have demonstrated an initial plasma volume expansion in
response to heat acclimation (Senay et al., 1976; Kirby et al., 1986; Armstrong et al., 1989;
Nielsen et al., 1993; Aoyagi et al., 1995; Nielsen, 1998; Garrett et al., 2012). Further, while
plasma volume response to intermittent exercise acclimation protocols has not been
examined, one study has reported an expansion in plasma volume using normal football
training and natural acclimatization (Racinais et al., 2012). Generally, plasma volume
expansion is attenuated in the latter stages of an acclimation protocol, but it is argued
this response may merely reflect the protocol employed as the reduction in strain over
time of constant-rate protocols may produce this response pattern (Patterson et al.,
2004). Further, when isothermal acclimation is used plasma volume expansion can remain
for up to twenty two days (Patterson et al., 2004). A protein influx to vascular
compartments increasing colloid osmotic pressure and subsequent fluid influx may be
responsible for plasma volume expansion (Nielsen et al., 1993, 1997), but an electrolyte
retention mechanism has also been proposed (Wendt et al., 2007).
Accompanying an increased plasma volume with heat acclimation is a decrease in resting
and exercise heart rate observed in response to traditional, isothermal and intermittent

88
exercise type heat acclimation. Such reductions are thought to be mediated primarily
through the vagal pathway without a change in autonomic control (Yamazaki and
Hamasaki, 2003). In addition, it has been proposed there is autonomic nervous system
habituation with resultant redirection of cardiac output to the skin capillary beds and
active muscle (Armstrong and Maresh, 1991). More recently, it has been suggested that a
rapid and significantly reduced norepinephrine concentration during exercise in the heat
that may indicate reduced sympathetic nervous system activity may mediate the
reduction in heart rate observed in heat acclimation (Hodge et al., 2013). Taken together,
the aforementioned acclimation induced changes serve to reduce the cardiovascular
strain.
2.5.2.5. Perceptual adjustments to heat acclimation
Perception of effort and thermal sensation are improved in response to traditional,
isothermal, and non-traditional methods of heat acclimation and this is observed in
endurance-based and intermittent-sprint exercise (Pandolf, 1977; Regan et al., 1996;
Molloy et al., 2004; Sunderland et al., 2008; Castle et al., 2011; Burk et al., 2012). The
mechanisms responsible are not well understood but thermal sensation is correlated with
skin temperature and therefore, acclimation induced reduction in this variable may
contribute to reduced thermal sensation (Kamon et al., 1974). RPE has previously been
correlated to physiological variables such as heart rate, ventilation and blood lactate and
therefore, reductions in physiological strain with heat acclimation may mediate the
reduction in this measure (Edwards et al., 1972; Armstrong and Maresh, 1991). Recent
work, however, indicates afferent feedback from the heart and lungs does not contribute
significantly to the perception of effort during exercise (Marcora, 2009). As such,
alterations in central factors with heat acclimation e.g. neural pathways and dopamine
may be involved (Marcora et al., 2009).

89
2.5.3. Overview of studies using traditional, medium to short-term traditional and
isothermal strain acclimation
Table 2.3. Traditional heat acclimation in humans.
Heat acclimation criteria (see footer for detail)
Reference Participants Protocol 1 2 3 4 5 6 7 8 9
Robinson et al., (1943)*
5M 10-23 d, 1-1.5 hr, treadmill 3.5 mph, 4 – 5.6% grade. 40°C, 23% rh.
- - - -
Lind & Bass (1963)* 16M 9 d, 50 – 200 min.d-1
, treadmill 3.5 mph 0% grade.
- - - - - -
Garden et al., (1966)
B
38M 10 d, (1, 1.6 or 2 hr.d-1) 36.6°C db,
32.2°C wb. X
X
X
X
- -
- - -
- - -
Nadel et al., (1974) 6M 10 d, 1 hr.d-1 0 2max, 45°C DH
or 36°C HH. - - - - -
Mitchell et al., Senay et al., Wyndham et al., (1976)
D
4M 10 d, 4 hr.d-1 0 – 0 2max, 45°C
db, 32°C wb. - - - -
Senay & Kok, (1977) 5M 8 d, 4 hr.d-1
, stool stepping = 35W 33°C db, 32°C wb
- - X - - - -
Avellini et al., (1980)
4M, 4F 10 d, 2 hr.d-1
. 36°C db, 32°C wb.
X X X - -
Shapiro et al., (1981)
8M 10 d, 120 min.d-1
, treadmill @ 1.34 m.s
-1, 40°C, 30% rh. (summer and
Winter)
- - -
Horstman & Christensen, (1982)
6M, 4F 11 d, 2 hr.d-1 0 , 2max, 45°C db,
23°C wb. - - - - -
Sawka et al., (1983b)
6M, 6F 10 d, 100 min.d-1
, , 49°C, 20% rh & 35°C, 79% rh alternated.
- - X X - - -
Sawka et al., (1985) 13M 9 d, 2 hr.d-1
, 49°C, 20% rh treadmill @1.52 m.s
-1, 2-6% grade
- - - - - -
Kirby et al., (1986) 10M 10 d, 2 hr.d-1, 2max, 40°C db,
45% rh. - - - - -
Griefahn et al., (1997)
6M, 2F 15 d, 100 min.d-1
, Warm humid, hot dry or radiant heat (WBGT = 33.4 – 33.6°C)
- - - - X -
Cheung & McLellan (1998)
C
15M (MT + HT)
10 d, 1 hr.d-1
, 40°C, 30% rh - -
--
X
- -
- -
XX
Shido et al., (1999) 10M, 2F 10 d, 4 hr.d-1
, resting in 46°C, 20% rh. X - - X - - - - Yamada et al., (2007)
10M, 2F 10 d, 100 min.d-1, 6 2max, 42.5°C,
27.9% rh - - - -
Chinevere et al., (2008)
8M 10 d, 100 min.d-1
, 45°C, 20% rh. - - - X - -
Kampmann et al., (2008)
8M, 2F 15 d, 2 hr.d-1
, dry, humid and radiant heat (WBGT = 33.5°C)
- - - - - - -
Epstein et al., (2010)
12M 12 d, 120 min.d-1
, 40°C. 40% rh. - - - - - -
Lorenzo et al., (2010a&b)
10M, 2F 10 d, 90 min, 0 2max, 40°C, 30% rh.
- - X
Amorim et al., 7M, 2F 10 d, 100 min.d-1 6 2peak, - - -

90
(2011) 42°C, 30% rh, Castle et al., (2011) 8M 10 d, 1 hr.d
-1, 50% VO2peak. - - -
1=resting HR decreased; 2 = resting Tcore decreased; 3 = exercise HR decreased; 4 = exercise Tcore decreased; 5 = Tsk decreased; 6 = increased Sweat rate; 7 = increased Plasma volume; 8 = improved thermal comfort/sensation/RPE; 9 = improved exercise performance or duration; = criteria achieved; X = criteria not achieved; - = not reported or measured; M = males; F = females; MT = moderately trained; HT = highly trained; AC = acclimation group; CT = control; TR = training Tre = rectal temperature; Tau = aural temperature; Tac = aural canal temperature; WB = wet bulb; DB = dry bulb; WBGT = wet bulb globe temperature; A = results based on effect size only. B = First line of data for 1 hr AC group, second line for 1.6 hr AC group. Third line for 3 hr group; C = First line of data for moderately trained group, second line for highly trained group. D = composite of three papers on same study;* = no statistical analysis performed.
Table 2.4. Medium to short-term traditional heat acclimation in humans.
Heat acclimation criteria (see footer for detail)
Reference Participants Protocol 1 2 3 4 5 6 7 8 9 Shvartz et al., (1973)
17M (HW; HD, TR)
6 d. 60-90 min.d-1, stepping in 37°C, 20% rh or 50°C, 20% rh.
- - -
Finberg et al., (1977)
8M (acc n = 4)
7 d, 90 min.d-1 @ 50°C, HR 150-170 b.min-1 at end of session.
- - - - - -
Pandolf et al., (1977)
24M 9 d, 110 min.d-1, 49°C, 20% rh - - X - -
Frye & Kamon, (1981)
4M,4F 8-9 d, 2 hr.d-1 48°C db, 25°C wb. - - X - - -
King et al., (1985)
10M 8 d, 90 min.d-1, 55% VO2max, 39.7°C, 31% rh.
- - - - -
Young et al., (1985)
13M 9 d, 2 hr.d-1 0 – 0 2max, 49°C, 20% rh.
- - - - - -
Kirwan et al., (1987)
8M 8 d, 90 min.d-1, 0 2max, 39.6°C, 29.2% rh.
- - - - - -
Aoyagi et al., (1995)
9M 6 d, 60 min.d-1, 40°C, 30% rh - - - -
Febbraio et al., (1994)
13M 7 d, 90 min.d-1, 0 2max, 40°C, 20% rh. Cycle ergometer.
- - - - - - -
Buono et al., (1998)
9M 7 d, 2 hr,d-1 35°C, 75% rh. - - - - - - -
Yamazaki and Hamasaki, (2003)
8M, 2F 6 d, 80 min.d-1 20 min) 0 2max, 36°C, 50% rh.
- - - - - -
Machado Moreira et al., (2005)
6M 9 d, 1 hr.d-1, 50% VO2max, 40°C, 32% rh. - - x
Kresfelder et al., (2006)
5 M, 17F 4 d, 1 hr.d-1, stepping @ 35 – 70 W, 28°C WBGT
- - - - - - - -
Buono et al., (2009)
13M 8 days, 2 hr.d-1, 100 min - - - - - -
Fujii et al., 21M; AC(10) 6 d, 80 min.d-1, 0 2peak, 37°C. X - - -

91
(2012) Hodge et al., (2013)
5M, 3F 8d, 90min.d-1, 0 2max, 35°C, 40% rh. - - - - - - -
1=resting HR decreased; 2 = resting Tcore decreased; 3 = exercise HR decreased; 4 = exercise Tcore decreased; 5 = Tsk decreased; 6 = increased Sweat rate; 7 = increased Plasma volume; 8 = improved thermal comfort/sensation/RPE; 9 = improved exercise performance or duration; = criteria achieved; X = criteria not achieved; - = not reported or measured; M = males; F = females; MT = moderately trained; HT = highly trained; AC = acclimation group; CT = control; TR = training Tre = rectal temperature; Tau = aural temperature; Tac = aural canal temperature; WB = wet bulb; DB = dry bulb; WBGT = wet bulb globe temperature; A = results based on effect size only. B = First line of data for continuous group, second line for intermittent group. C = First line of data for low intensity long duration group, second line for high intensity short duration group.
Table 2.5. Isothermal strain / controlled hyperthermia heat acclimation in humans.
Heat acclimation criteria (see footer for detail)
Reference Participants Protocol 1 2 3 4 5 6 7 8 9
Fox et al., (1963)
9M 12-24 d, 3h.d-1
passive hot H20 bath so Tcore ≈ 37.3 - 38.5°C
- X - - X -
Fox et al., (1967)
12M 12 d, 2 hr.d-1
, passive Tau to 38.2°C - - - -
Henane & Valatx (1973)
9M 9 d, 180 min.d-1
, 55°C DB, 40°C WB + 35°C DB, 40°C WB so Tau ≈ 38.1 C for 60 min.
- - - - - -
Turk and Worsley, (1974)
51M 5 d, 2 hr.d-1
, bench stepping in 40 – 50°C WBGT to elevate Tbody to ≈ 38.8 C then exercise and rest in 36°C WBGT to maintain target Tbody.
- - - - - - -
Bonner et al., (1976)
5 M 13 d, 1 hr.d-1
, H2O bath @ 41°C in a chamber at 40°C db 28°C wb so Tcore ≈ 38. C.
- - -
Convertino et al., (1980)
8M 8 d, 2 hr.d-1
, passive acclimation @ 42°C 93% rh to achieve Tre ≈ 38.5°C
- - - -
Harrison et al., (1981)
6M 11 d, 70 min.d-1
, 30 min H2O bath + 40 min cycle ergometer at 40°C db 20% wb soTau at 38.3 ± 0.3°C
X - -
Havenith and Middendorp, (1986)
4M 7 d, 2 h.dr-1
, 40°C, 20% rh, work + rest so Tcore ≈ 38.3°C
X - - -
Regan et al., (1996)
14M 10 d, 1 hr.d-1
, in 38.2°C, 39.7% rh. Vary workload so Tau ≈ 38°C
- - - -
Cotter et al., (1997)
8M 6 d, 70 min.d-1
in 39.5°C, 59.2% rh so Tac ≈ 1.4°C > rest.
- - - - - - -
Patterson et al., (2004)
11M 16 d in 3 wks, 90 min.d-1
in 40°C 60% rh. 30 min + 60 min so Toes ≈ 38.5°C
- -
Weller et al., (2007)
16M 10 d, 110 min.d-1
, 46°C, 17.9% rh 60 min + 40 min so Tre ≈ 38.5°C
- - -
Garrett et al., (2009)
10M MT 5 d, 90 min.d-1
, 40°C, 60% rh to elevate and maintain Tre ≈ 38.5°C
- X - - X -
Magalhaes 9M 11 d, 1 hr.d-1
, 30 min + then 30 min so Tre ≈ - -

92
et al., (2010)
1°C above rest
Heat acclimation criteria (see footer for detail)
Reference Participants Protocol 1 2 3 4 5 6 7 8 9
Kuennen et al., (2011)
8M 7 d, 100 min.d-1
, 46°C 20% rh so Tre 39°C - - - - -
1=resting HR decreased; 2 = resting Tcore decreased; 3 = exercise HR decreased; 4 = resting Tcore decreased; 5 = Tsk decreased; 6 = increased sweat rate; 7 = increased Plasma Volume 8 = improved thermal comfort/sensation/RPE; 9 = improved exercise performance or duration; = criteria achieved; X = criteria not achieved; - = not reported or measured; M = males; F = females; MT = moderately trained; HT = highly trained; Tre = rectal temperature; Tau = aural temperature; Tac = aural canal temperature; WB = wet bulb; DB = dry bulb; WBGT = wet bulb globe temperature.
2.5.3.1. Efficacy of traditional heat acclimation protocols
Since the initial work of Robinson et al., (1943) documented the adaptive responses to 60
- 90 minutes of treadmill walking over 10 - 23 days in dry heat and Lind and Bass (1963)
identified what was interpreted as ‘com ete acc imatisation’ owing to atea in heart
rate and rectal temperature after 9 - 10 days of treadmill walking for 100 min.d-1 in ∽
49°C, traditional heat acclimation methods have been used in many investigations. Of the
studies cited in this category, traditional protocols, when judged against the
aforementioned criteria (section 2.5.) demonstrate the ability to consistently evoke
reductions in exercise heart rate and core temperature (Table 2.3.). Further, mean sweat
rate is improved by traditional acclimation, but the effect on thermal comfort /
perception of effort is less clear as many studies do not readily report this criterion in
their findings, although previous work suggests a decrease in this variable (Armstrong and
Maresh, 1991). In addition, although performance improvement, for example through
increased time to exhaustion or increased power output, is potentially a key aim of
acclimation, few traditional acclimation studies have included this as a criterion measure,
preferring instead to focus on physiological responses to fixed heat stress tests that have
limited application to the performance setting. Where true measures of performance are
included (Lorenzo et al., 2010) a positive effect is observed. Few studies have examined
the benefit of traditional acclimation to intermittent-sprint performance, but Castle et al.,
(2011) reported an improvement in peak power output with a ten day protocol in males

93
(Table 2.3.). For the criteria considered where evidence in table 2.3. suggests traditional
acclimation did not induce a change, for example, Senay and Kok, (1976) or Cheung and
McLellan, (1998), the exercise mode and intensity may explain findings. As such,
considering the evidence in table 2.3. traditional protocols appear effective at eliciting
classic acclimation responses but may not achieve maximal adaptation as the heat strain
declines in subsequent exposures (Taylor, 2000).
2.5.3.2. Efficacy of medium to short-term traditional heat acclimation protocols
he req irement to com ete 10 day of e erci e-heat stress to induce acclimation may
be untenable in occupational and athletic settings. Consequently, the efficacy of medium
to short-term traditional heat acclimation (MSTHA) has received much consideration
(Table 2.4.). With respect to the research cited, studies in this category have used
exercise modes including cycling, treadmill walking and bench stepping for four
(Kresfelder et al., 2006) to nine days (7 ± 1.5 d) (for example, Pandolf et al., 1977) for 1-2
hours (1.6 ± 0.32 hrs) at 25 - 2max 6 8 ). hi e evidence demon trate S HA
con i tent y evo e ada tation in e erci e heart rate, core tem erat re, sk and
sudomotor function (Table 2.4.) and is therefore, an effective method of heat acclimation,
lack of examination of key criteria in some studies (e.g. Kresfelder et al., 2006) does limit
the ability to draw firm conclusions as to the efficacy of very short, traditional heat
acclimation protocols. Few studies have considered performance as a key criterion with
such protocols, but King et al., (1985) demonstrated maintenance of total work during a
45 s sprint following a six hour heat stress test but a decrease in this variable in an un-
acclimated group. Conversely, Machado-Moreira et al., (2005) found no difference in
maximal power output or total exercise time during graded exercise after heat
acclimation. No studies have examined the effect of MSTHA on intermittent-sprint
exercise performance and therefore, no conclusion can be drawn on this aspect.

94
2.5.3.3. Efficacy of isothermal strain heat acclimation protocols
Comparatively few studies have used isothermal strain to elicit heat acclimation (Table
2.5.). Fox and colleagues (1964, 1967) first applied this model in army volunteers to
examine the effect of repeated local heating and hot wet / hot dry exposure on local
sweat response using a long-duration protocol. Participants completed twelve to fifteen,
two hour acclimation sessions. Core temperature was elevated by exposure to a hot,
moist air stream or hot room and thin vapour barrier suits were used to maintain core
temperature at 37.9°C (Fox et al., 1964) or 38.3°C (Fox et al., 1967). Classic heat
acclimation responses were observed. Of the studies cited in table 2.5, a further six used
long duration protocols (Bonner et al., 1976; Harrison et al., 1981; Regan et al., 1986;
Patterson et al., 2004; Weller et al., 2007; Magalhaes et al., 2010) and the majority
evoked physiological adaptations consistent with the criteria for a heat acclimation
protocol to be deemed effective. With Magalhaes (2010), the comparatively shorter
session duration combined with allocation of half of the session to elevating core may
have contributed to the lack of change in key markers during exercise.
Prolonged isothermal strain protocols ( 10 d) demon trate effectivene for heat
acc imation. edi m to hort d ration rotoco ≤ 8 d) rovide f rther in ight into the
efficacy of this method and demonstrate similar positive responses. Of the studies cited in
table 2.5., seven used isotherma train rotoco ≤ 8 d and demon trated ome or a of
the classic heat acclimation criteria judging them effective methods to induced
adaptation to the heat. The work of Garrett et al., (2012), also demonstrates this method
is effective for inducing physiological adaptation in highly trained athletes. Further,
isothermal strain protocols can improve performance in moderate and highly trained
individuals in both time to exhaustion and time trial modes (Garrett et al., 2009, 2012,
2014).
The isothermal strain model of heat acclimation has potential advantages over other
regimes, yet comparatively few research investigations have employed this method.

95
Although isothermal strain serves to maintain heat stress across the protocol and
therefore, potentially maximises adaptations owing to the requirement to complete more
work to achieve a pre-determined core temperature, the extent of performance benefit
beyond more traditional methods is unclear. The work of Garrett et al., (2009, 2012,
2014) provides insight that for moderately trained males and highly trained endurance
athletes short-term isothermal strain may be beneficial for performance, but more work
is required to compare the validity of isothermal strain against other models of heat
acclimation to demonstrate a criterion standard for heat acclimation. In addition, the
appropriateness of isothermal strain for other athletes, for example, games players is
unknown as no research has examined whether this method may promote over-reaching
in an athlete at a point in the training cycle when a taper is normal.
2.5.4. Alternate heat acclimation methods
Although the body of literature is increasing there is a dearth of information on the
efficacy of alternate heat acclimation protocols. Existing work focuses primarily on the
impact of altered exercise intensity and duration on heat acclimation, or the effect of
continuous versus intermittent protocols on acclimation (Fein et al., 1975; Houmard et
al., 1990; Aoyagi et al., 1995; Gill et al., 2001; Sunderland et al., 2003 ’ Brien et a .,
2004; Sunderland et al., 2008; Petersen et al., 2010, Table 2.6.). Such investigations have
produced conflicting results. In addition, research in this field has used isotype protocols
that require exercise at a fixed percentage of heart rate across the protocol as adaptation
is achieved (Nielsen et al., 1993, 1997; Burk et al., 2012) and intermittent-sprint exercise
to elicit a heat acclimated phenotype (Sunderland et al., 2008; Petersen et al., 2010;
Brade et al., 2013).
Table 2.6. Alternate heat acclimation in humans.
Heat acclimation criteria (see footer for detail)
Reference Participants Protocol 1 2 3 4 5 6 7 8 9 Fein et al., (1975)
12F (2 groups) HA every 3rd
d for 10 sessions. 100 min.d
-1, 46.5°C db, 24.5°C wb. OR
- - - -

96
10 d consecutive heat acclimation Heat acclimation criteria
(see footer for detail) Reference Participants Protocol 1 2 3 4 5 6 7 8 9 Nadel et al., (1976)
5M 10 d, 60 min.d-1 0 2max, 36°C, 35
Torr. - - - - - -
Armstrong et al., (1989)
13M 8 d, 100 min.d-1, e f- aced d2-d )
68 2max, 41°C, 39% rh. - - - - - -
Houmard et al., (1990)
9M Exp 1: 7 d 1 hr.d-1, 0 2max
Exp 2: 7 d 30-35 min.d-1, 2max
- X X - - X
Barnett & Maughan (1993)
5M 1 d.wk-1
x 4 wks 60 min.d-1,
2max. Day 1 = 22°C 67% rh, day 2-4 = 34.6°C, 60% rh
- - X X X X - - X
Nielsen et al., (1993)
8M 9 – 12 d to e ha tion, 60 2max, 40°C, 10% rh.
- - -
Nielsen et al., (1997)
12M 8 – 13 d to e ha tion, 2max, 35°C, 87% rh
- - -
Gill et al., (2001)
B
14M (consecutive gp = 7, intermittent gp = 7)
10 d 30 min.d-1 con ec tive or over 3
wee , 0 2peak in 38°C, 70% rh. - -
- -
X
X
X
- -
X
- -
Sunderland et al., (2003)
8F 4 sessions in 10 d, 30 min.d-1
, LIST (2 sets), 30°C
- - X X - - -
X
O’Br e e l , (2004)
C
7M 10 d 60 min.d-1 at 0 2max, OR
D1 10 a above 8 d 8 2max for 15 min.d
-1
- -
- -
X
X
- -
X
- -
- -
- -
Sunderland et al., (2008)
17F (3 gps; AC(6); TR(6) CT(6))
4 sessions in 10 d, 30 min.session-1
, LIST (2 sets but 3 sets in d3&4), 30°C, 24% rh
- X
- X -
Molloy et al., (2004)
17M 14 d, 30 min.d-1, 0 2max, 35°C,
35% rh - -
- X
-
Brazaitis and Skurvydas (2010)
7M, 6F 7d over 2 weeks, 45 min.d-1
, passive heating, half-body in H2O bath @ 44°C.
X
-
- - X
Petersen et al., (2010)
A
12M (AC(6); CG (6)
4 d 30 – 45 min.d-1
, 30°C, 61% rh Intermittent activity.
- -
X X - -
-
Daanen et al., (2011)
15M 9 d @ 26°C WBGT + 3 d @ 32°C WBGT, 2 hr.d
-1. 2max for 60 min
+ incremental test.
-
X -
Burk et al., (2012)
21M 10 d, 110 min.d-1 2peak for d
and 60 2peak for 5 d, 42°C, 18% rh.
Garrett et al., (2012)
8M HT 5 d, 90 min.d-1, 40°C, 60% rh so re ≈ 38. C
X X
-
X
Brade et al., (2013)
A
10M 5 d, 3 min @ 80% PPO + 1 min rest x 8 (d1 = 32 min, d4 = 48
- - X
- X
Racinais et al., (2012)
19M 6 d heat acclimatisation in 38 – 43°C, 12-30% rh.
- - X X X
X X X
Shin et al., (2013)
9M 10 d (alternate), over 3 weeks 30 min.session
-1. Half-body immersion,
H2O bath @ 42°C.
- - - -
- - -
Costa et al., (2014)
6M Treadmill, 2 hr @ 60% 2max, 3 d @ 30°C, 3 d at 35°C.
X X
- -
-
Garrett et al., (2014)
9 M 5 d , 90 min.d-1, in 39.5°C, 60% rh to maintain Trec @ 38.5°C
X X
X
1=resting HR decreased; 2 = resting Tcore decreased; 3 = exercise HR decreased; 4 = exercise Tcore decreased; 5 = Tsk decreased; 6 = increased Sweat rate; 7 = increased Plasma volume; 8 =

97
improved thermal comfort/sensation / RPE;9 = improved exercise performance or duration; = criteria achieved; X = criteria not achieved; - = not reported or measured; M = males; F = females; MT = moderately trained; HT = highly trained; AC = acclimation group; CT = control; TR = training Tre = rectal temperature; Tau = aural temperature; Tac = aural canal temperature; WB = wet bulb; DB = dry bulb; WBGT = wet bulb globe temperature; A = results based on effect size only. B = First line of data for continuous group, second line for intermittent group. C = First line of data for low intensity long duration group, second line for high intensity short duration group.
2.5.4.1. Daily versus alternate day heat acclimation
Fein et al., (1975) acclimated twelve women using either a daily or intermittent (every
third day) exposure pattern in 32.2°C (Table 2.6.) and no significant differences between
groups in key markers of acclimation were reported at the end of the protocols. Both
protocols induced classic acclimation responses and it was concluded the pattern of
exposure had no discernable effect on the rate of heat acclimation (Fein et al., 1975).
Similar positive benefits of alternate day heat acclimation were reported by Shin et al.,
(2013). In contrast, Gill et al., (2001) demonstrated minimal heat adaptation with
intermittent heat exposure in fourteen competitive rowers when ten sessions were
completed over three weeks and it was proposed daily heat exposure is the most
effective acclimation strategy (Gill et al., 2001). Such discordance may be explained by
session duration in the work of Gill et al., (2001) as 30 minutes may represent insufficient
time to elevate and maintain core temperature. Alternately, use of competitive rowers
may have contributed to such findings as high levels of aerobic fitness confer many
adaptations similar to heat acclimation (Pandolf, 1977), thus reducing the potential for
further pronounced adaptation with heat acclimation.
2.5.4.2. Low and high intensity acclimation
In trained males, running at approximate y 2max for 30 - 35 min.d-1 for seven days
evoked reductions in exercise heart rate and Tre consistent with the heat acclimated
phenotype and not different from those observed with a more traditional protocol
(Houmard et al., 1990). In contrast, cyc ing at 0 2max for 60 minutes on day 1 and 10
and at 8 2max for 15 minutes on days 2 - 9 failed to evoke classic heat adaptation and
it was suggested a traditional protocol should be used in preference to a high intensity

98
heat acclimation protocol during exercise in the heat as it resulted in improved
thermoreg ation ’Brien et a ., 200 ). S ch di cre ancy between finding may be
explained by training state and fitness level of participants as this variable is not reported
by ’Brien et a ., (2004), and as reported level of physical fitness can influence heat
acclimation rate (Pandolf, 1977). Further the study design may have been a confounding
variable as the participants completed both conditions separated only by four weeks
’Brien et a ., 2004). Previous studies have testified as to the longevity of adaptations in
key markers of heat acclimation after eighteen days (Pandolf et al., 1977) and a degree of
heat acclimation may have resided in the participants at the beginning of the modified
protocol trial. More recent work, however, refutes this point (Garrett et al., 2009). In
addition, it could be postulated that 15 minutes represents insufficient stimulus
regardless of exercise intensity. Pandolf et al., (1988) in Taylor et al., (1997) supports this
notion as it is suggested volume of training appears to be more critical than intensity.
Taylor et al., (1997) also suggest the greater the Tcore elevation the greater the heat
adaptation. Thus, it could be postulated the 15 minutes acclimation period for the high
intensity acclimation protocol in this study presented insufficient time for a suitable rise
in Tcore , or an insufficient time period at an elevated Tcore.
2.5.4.3. Isotype acclimation
Classic isothermal strain protocols use fixed core temperature to elicit heat acclimation
responses. Nielsen et al., (1993, 1997) used a similar forcing function to maintain strain
but achieved this through isocardiac strain (heart rate 120-130 b.min-1) during exercise to
exhaustion. Using this approach many of the classic physiological responses to heat
acclimation are achieved and in addition, time to exhaustion is markedly improved
(Nielsen et al., 1993, 1997) demonstrating the efficacy of this method.
2.5.4.4. Intermittent exercise type acclimation
Recent intermittent-exercise type acclimation protocols use repeated patterns of high
and low intensity efforts that simulate work:rest ratios of field-based team-sports or

99
repeated short efforts interspersed with short recoveries (Sunderland et al., 2003, 2008;
Petersen et al., 2010; Brade et al., 2013). As such, protocols are designed to improve
specificity of heat acclimation for field-based team-sport athletes with a view to
improving performance in this type of activity. Their efficacy will be considered in section
2.5.5.
2.5.4.5. Dehydration heat acclimation
Aldosterone and antidiuretic hormone act to conserve fluid and are important mediators
of plasma volume expansion (Garrett et al., 2011). Aldosterone secretion from the zona
glomerulosa is controlled primarily by the renin angiotensin system that is activated in
response to decreased blood volume and systemic pressure, but also plasma [K+] and
[Na+] (Gard, 1998). Similarly, antidiuretic hormone is secreted from the posterior pituitary
in response to increased plasma osmolarity and [Na+] (Gard, 1998). Exercise heat stress
induced hypohydation mediates an enhanced upregulation of these fluid regulatory
hormones that may promote enhanced cardiovascular stability in response to heat
acclimation (Kenefick et al., 2007; Garrett et al., 2011). Previously, Garrett et al., (2014)
tested this hypothesis using short term isothermal strain heat acclimation with ten
moderately trained males. In a cross over design using a five week washout with
euhydration and dehydration, short-term isothermal heat acclimation induced improved
cardiovascular and performance responses that were generally enhanced by dehydration
(Garrett et al., 2014). Further, although lacking a control group, Garrett et al., (2012) also
demonstrated meaningful physiological and performance gains in highly-trained athletes
with short-term dehydration acclimation. Such evidence supports the suggestion that
dehydration heat acclimation may be an appropriate model to enhance heat adaptation.
2.5.5. Heat acclimation and intermittent-sprint exercise
The effect of heat acclimation on intermittent-sprint exercise performance has received
limited attention. The studies considering this issue have employed different protocols
with varying results (Table 2.6.). Recent evidence suggests that heat acclimation can

100
improve intermittent sprinting in the heat from both a physiological and performance
perspective (Castle et al., 2011). When eight moderately trained males completed ten
days of heat acclimation, 60 min.d-1 at 0 2peak in 33°C, 50% rh significant reductions
were observed in resting rectal temperature, heart rate, RPE and thermal sensation by
day three (Castle et al., 2011). Plasma volume was also significantly increased by day five
of acclimation. With respect to intermittent-sprint cycling performance over 40 minutes
in 33°C, 50% rh, peak power output was significantly increased by ~ 2% (Castle et al.,
2011).
The work of Castle et al., (2011) demonstrates a beneficial effect of heat acclimation for
intermittent sprint exercise completed in the heat. However, the protocol used was
constant work rate and required ten days. While this may demonstrate performance
improvement for moderately trained participants the duration and lack of specificity, as
previously suggested, may make this method unsuitable for athletes that are well-trained.
Circumventing this limitation, Sunderland et al., (2003, 2008) have demonstrated a
beneficial effect with shorter duration, intermittent type heat acclimation protocols
designed (a) to reflect the intermittent nature of team-sports, thereby improving
specificity and (b) to improve performance in match play. Sunderland et al., (2003)
examined the impact of four, short heat acclimation sessions of 30 minutes completed
within ten days on field hockey skill performance in eight well-trained, unacclimatized
female hockey players. Participants completed two sets of the Loughborough intermittent
shuttle test (LIST) in 30°C and although few classic adaptatory responses were observed,
thermal comfort and hockey skill performance were improved (Sunderland et al., 2003).
Similarly, Sunderland et al., (2008) examined the effect of four heat acclimation sessions
of 30 - 45 minutes at 30°C, 24% rh on the ability of seventeen, well trained Contro gro
2max; 49.1 ml.kg.min-1 raining gro 2max; 49.3 ml.kg.min-1 Acc imation gro
2max 49.7 ml.kg.min-1) female games players to perform high intensity intermittent
running in the heat using the LIST. In comparison to the control and moderate training
groups the high intensity heat acclimation group exhibited a 33% improvement in
distance run in the LIST post acclimation (Sunderland et al., 2008). Post acclimation a
lower rectal temperature and rate of rise in rectal temperature were observed, but no
change in sweat response was observed, possibly due to the training status of the group.

101
In addition an improved thermal comfort was reported indicating the efficacy of this
method in inducing heat acclimation (Sunderland et al., 2008). From a performance
perspective, 15 m sprint time was unaffected but distance run was significantly increased
(Sunderland et al., 2008). With a lower rectal temperature, improved thermal comfort
and improved performance it was concluded four 30 - 45 minute sessions of intermittent
exercise induced heat acclimation in female games players and provided performance
benefits during intermittent exercise in the heat.
Similarly, in cricketers, the use of a 4 day intermittent sprint cycling protocol produced
partial heat acclimation. Petersen et al., (2010) randomly assigned twelve male cricketers
to acclimation and control groups (n = 6) and participants completed four consecutive
days of sprint-based acclimation in 30°C, 60% rh (Table 2.6.). On completion of the
protocol performance in a cricket specific running test was not altered, but this test was
conducted in a temperate environment (Petersen et al., 2010). Effect sizes for key
acclimation markers suggested partial acclimation had been achieved (Petersen et al.,
2010). Brade et al., (2013) used a five day protocol involving repeated 3 minute efforts at
80% maximum power with 1 minute recovery to examine the effect of acclimation (and
pre-cooling) on repeated-sprint performance in the heat in ten males. Participants
completed 32 minutes of activity in session one building to 48 minutes in the last session.
No significant differences were observed in key markers of acclimation, but effect size
suggested a meaningful effect (Brade et al., 2013). Similarly, intermittent-sprint
performance in the heat was not different pre and post acclimation.
The work of Petersen et al., (2010) and Brade et al., (2013), previously cited, suggest that,
although some psychophysiological benefit may be gained from short-term acclimation
when intermittent sprint exercise is conducted in the heat, performance is not improved.
The work of Sunderland, (2003, 2008) partly counters this by demonstrating
improvements in hockey skill performance and distance run after four acclimation
sessions of the LIST in the heat, but it is important to note that 15 m sprint time and
decline in sprint time was not improved. Consistent with Nevill et al., (1995) who

102
identified greater thermal strain during intermittent compared with continuous exercise,
Sunderland et al., (2008) demonstrated rectal temperatures of 39.3°C within 30 minutes
of intermittent exercise in the heat. As such, intermittent acclimation protocols would
appear an appropriate stimulus to evoke threshold core temperatures necessary to elicit
heat adaptation, but with short duration protocols in particular, the adaptation appears
incomplete. From the evidence provided with regard to physiological responses to heat
acclimation in the works of Petersen et al., (2010) and Brade et al., (2013) it is unlikely
that complete adaptation was achieved and thus the efficacy of short duration
intermittent exercise type acclimation protocols in evoking the heat acclimated
phenotype is not yet clear.
2.5.6. Issues associated with current heat acclimation methods
The desire to understand and improve heat tolerance in occupational and endurance
based sporting contexts has contributed to a large body of heat acclimation literature
with over five hundred research studies published on humans since the first studies of
Robinson et al., (1943). Consequently, much of the research has explored heat
acclimation from this perspective and unsurprisingly, posits use of moderate intensity,
relatively long duration, prolonged protocols as the most effective method of heat
acclimation (Armstrong and Maresh, 1991; Maughan and Shirreffs, 2004). Such methods
may, however, prove sub-optimal or compromise performance in other sports for a
number of reasons.
Firstly, since the initial seminal work of Lind and Bass (1963) acquisition of complete heat
acclimation has been based on attainment of a plateau in key markers of heat acclimation
including heart rate and core temperature. This belief has persisted through the research
on heat acclimation (Pandolf, 1977; Young et al., 1985; Buono et al., 1998), yet may
essentially be incorrect. The general adaptation syndrome (Selye, 1946) demonstrates
that in response to stress the body eventually responds through supercompensation to a
new elevated level. Further, the model indicates that lack of additional stimulus results in

103
a plateau or decay of adaptations. As such, observation of a plateau in constant work rate
protocols after initial adaptation may reflect the lack of additional strain across the
protocol and not achievement of optimal or maximal heat acclimation responses and
recent work supports this notion (Nielsen, 1993; Patterson et al., 2004). Therefore,
traditional heat acclimation protocols may not maximise heat acclimation responses.
Secondly, Nevill et al., (1995), identified the potential for greater thermal strain on the
body during intermittent exercise in comparison to continuous of the same average work
intensity. Therefore, use of traditional protocols with athletes involved in high intensity
intermittent-sprint activity, as displayed in some team sports may provide a sub-optimal
stimulus and consequently, sub-maximal acclimatory responses. Isothermal models
maintain strain, but the necessity to increase work rate to achieve and maintain a critical
core temperature may evoke over-reaching in the athlete when tapering and a reduction
in training load is desired. In addition, whether isothermal models confer extra benefits
compared to traditional heat acclimation methods is unclear and the efficacy of this
method for games players is unclear. With respect to specificity, the emergence of
intermittent exercise type acclimation protocol addresses this issue for games players.
While there is evidence of some beneficial effect of such methods most are short-term
and further work must be done to elucidate their benefit to team-sport. Further due to
the work-rest ratios incorporated in intermittent heat acclimation, the stimulus may be
insufficient to evoke maximal adaptation and the physiological stress placed on the
athlete by having to repeat this exercise may be untenable prior to competition requiring
greater recovery periods between sessions.
Fina y, conventiona heat acc imation ractice e entia y invo ve the a ication of ‘one
ize fit a ’ ro onged, moderate intensity heat acclimation protocols regardless of the
individual. A review of the literature, however, suggests that such an approach may
compromise the ability to achieve maximal heat adaptation as there is much evidence of
participants failing to complete prescribed sessions in the initial days of a heat
acclimation programme as a consequence of the abrupt exposure to high heat stress

104
(Garden, 1966, Wyndham et al., 1976; Horstman et al., 1982, Febbraio, 1994,). Such an
approach clearly limits heat stress exposure and therefore, as mentioned, may evoke sub-
maximal adaptation as maintaining a critical core temperature for extended periods is
considered key to effective heat acclimation (Taylor et al., 1997). It is known that the
ability to adapt to the heat differs between individuals due to genotypic and phenotypic
traits (Heled et al., 2004; Kresfelder et al., 2006). As such, in specific athletic groups, it
could be proposed, non-traditional heat acclimation protocols may be more effective and
warranted to optimise individual responses and exercise performance.
2.5.7. A progressive model of heat acclimation
As evidenced throughout this review, a myriad of acclimation protocols have been used
to investigate human adaptation to heat stress. While the protocols differ in intensity,
duration and scheduling, a common denominator is the targeting of heat strain. Existing
protocols essentially use a heat strain model of acclimation whereby a desired strain is
evoked by application of exercise intensities that will elicit sufficient endogenous heat
load to provoke adaptation. In the case of isothermal strain protocols, desired strain is
clearly defined as a specific threshold temperature. For traditional protocols the strain is
less well defined. As identified throughout this literature review, a number of potential
issues arise with acclimation protocols that are strain-orientated. This includes inability to
complete prescribed sessions due to high levels of exercise-heat stress in the initial stages
of acclimation and reductions in strain across the protocol as adaptations occur. To
counter such limitations, it is proposed that a stress orientated model, whereby external
variables, for example, temperature or humidity or exercise, are manipulated in a
progressive manner across the protocol, may prove as, if not more effective than existing
strain-orientated approaches. Three recent studies demonstrate support for this concept.
Daanen et al., (2011) manipulated heat stress when acclimating fifteen participants by
exposure to 26°C WBGT for nine days followed by 32°C WBGT for three days. Classic
acclimation responses were reported in the initial nine days of acclimation and a further
reduction in resting rectal temperature was reported after the additional three days in
the elevated temperature suggesting an additional beneficial effect (Daanen et al., 2011).

105
Exercise measures of heart rate and rectal temperature were not, however, altered by
the additional three days but it was suggested a longer period of exposure to the elevated
heat stress may prove beneficial (Daanen et al., 2011). Burk et al., (2012) also adopted a
stress-orientated model by manip ating e erci e inten ity from to 60 2peak
during a ten day acclimation protocol. Although classic acclimatory responses were
observed, the research was not concerned with optimising heat acclimation. Therefore,
no reference was made to the design of the protocol and no control group was involved
making it difficult to draw conclusions about the efficacy of the method used. Finally,
Costa et al., (2014) demonstrated an additional benefit with heat acclimation that
adopted a stress orientated approach. hen i ma e tra end rance ath ete com eted
three two ho r treadmi r n at 60 2max in an environmental chamber at 30°C
followed by three at 35°C additional improvements in thermal comfort and physiological
strain were reported (Costa et al., 2014).
Comparative evidence from intermittent hypoxic exposure also provides support for
potential benefit of a progressive heat acclimation strategy. Hamlin and Hellemans,
(2007) exposed twenty-two multi-sport endurance athletes to 90 minutes of intermittent
normobaric hypoxic exposure at rest versus 90 minutes of placebo exposure at rest for 15
days over a 3-week period. Oxygen in the hypoxic gas decreased from 13% in week one to
10% by week three. Results showed 3-km run time decreased by 1.7% 2 days after, and by
2.3% 17 days after the last hypoxic episode in the training relative to the placebo group.
In addition, relative to the placebo group, the training group increased reticulocyte count
2 days (23.5%) and 12 days post-exposure.
Considering the above, a progressive heat stress orientated model of heat acclimation
that sequentially manipulates environmental stress across the duration of a protocol to
maintain the stimulus for adaptation may be beneficial for team-sports where a high level
of thermal strain is reported.

106
2.6. Literature Review Summary
When intermittent-sprint exercise that replicates the work-rest ratios and activity
patterns of field-based team-sports is conducted in a hot environment, physiological and
performance responses are negatively affected. The origin of the fatigue contributing to
the reduction in performance in exercise of this type is not well understood. While
peripheral and central factors have been proposed further investigation is warranted.
Heat acclimation is known to reduce the deleterious effect of heat stress on intermittent
e erci e. However, traditiona ‘one ize fit a ’ rotoco are imited in their a ication to
exercise of this type. Traditional protocols that use a fixed exercise intensity may not
optimize responses as strain is reduced across the programme. Isothermal strain models
that target a critical core temperature may provide too great an additional training load
prior to competition and may not be appropriate for less heat tolerant individuals. Few
studies have investigated specific heat acclimation protocols for intermittent exercise,
especially that modify the external heat stress. Further research is needed to develop a
suitable acclimation protocol for games players performing high-intensity, intermittent-
sprint exercise in the heat.
2.7. Studies, Aims and Hypotheses
2.7.1. Chapter 4 Study 1
Title: Peak power output provides the most reliable measure of performance in
prolonged intermittent-sprint cycling.
Aim: To determine the reliability of an intermittent-sprint cycling protocol and to
determine the efficacy of one practice session on main trials.

107
Hypotheses:
Primary: The Cycling Intermittent-Sprint Protocol (CISP) would be a reliable measure of
intermittent-sprint exercise performance.
Secondary: One practice trial would be sufficient to minimize learning effects on peak and
mean power output.
2.7.2. Chapter 5 Study 2
Title: The influence of hot humid and hot dry environments on intermittent-sprint
exercise performance.
Aim: To determine the effect of a hot humid compared to a hot dry environment,
matched for heat stress, on intermittent-sprint exercise performance.
Hypotheses:
Primary: A hot-humid environment would produce greater physiological strain compared
to a hot dry environment.
Secondary: Intermittent-sprint exercise performance would be reduced in a hot humid
compared to a hot dry environment.
2.7.3. Chapter 6 Study 3
Title: Physiological and perceptual responses to progressive heat acclimation compared
to traditional and effect on intermittent-sprint exercise in a hot environment.
Aim: To ascertain the effect of a progressive heat acclimation protocol versus a traditional
protocol on high intensity, intermittent-sprint exercise in the heat in games players.

108
Hypotheses:
Primary: There would be no difference in the physiological responses to heat acclimation
between progressive and traditional acclimation.
Secondary: Progressive acclimation would ameliorate the reduction in intermittent-sprint
performance in the heat to the same extent as traditional acclimation.
2.7.4. Chapter 7 Study 4
Title: The effect of progressive heat acclimation on fatigue following intermittent-sprint
exercise in the heat.
Aim: To examine the effect of progressive heat acclimation on neuromuscular function
and intermittent-sprint exercise in the heat using transcranial magnetic stimulation (TMS)
and femoral nerve stimulation (FNS).
Hypothesis: Progressive heat acclimation would reduce central and peripheral fatigue
pre-post intermittent-sprint exercise in the heat compared to control as a result of
reduced physiological strain.

109
CHAPTER III. GENERAL METHODS
3.1. Introduction
The materials and methods of the studies presented in this thesis are described in detail
in the following twelve sections. If additional materials or methods were used, they are
described in detail within the relevant experimental chapter.
3.2. Health and Safety
All investigations reported in this thesis were approved by the University of Brighton
Research Ethics and Governance Committee and conducted in accordance with the
guidance outlined in the Declaration of Helsinki (2008). Written informed consent was
obtained from all participants prior to the start of the study after explanation of the
demands, risks and benefits of the study and the right to withdraw at any time. Biological
materials and waste were handled and disposed of with regard to relevant guidelines and
all experimentation was carried out in line with University of Brighton standard operating
procedures and risk assessments for their laboratories.
Criteria for termination of testing during investigations included; participant request,
attainment of the Ethics and Governance Committee approved maximum permissible
core temperature of 39.7°C and evidence of signs of heat illness including syncope,
exhaustion, disorientation, nausea and vomiting.
On completion of testing and post-test measures, participants were monitored and
provided fluids. Participants were permitted to leave the environmental physiology
laboratory when core temperature had returned to within 0.5°C of the baseline measure
obtained prior to testing.

110
3.3. Participants
Participants who volunteered to participate in the studies presented, comprised
physically active male and female games players between the ages of 18 -30 years. Prior
to all testing the purpose, demands, risks and benefits of each study were explained to
the participants. Participants were informed of their right to withdraw from the study at
any time. Written informed consent and medical history were obtained from each
participant prior to testing. Any participant displaying a medical condition that
contraindicated participation in maximal intermittent-sprint exercise was excluded from
the investigation. Where participants were required to be matched for investigation
(study 3 & 4), a short questionnaire pertaining to physiological measures, sporting
background, training status and experience of the Cycling Intermittent-Sprint Protocol
(CISP) was completed and anthropometric measures obtained to determine body surface
area using the equations of Dubois and Dubois (1916).
3.4. Pre-trial Diet and Exercise Standardisation
In all studies, participants were required to refrain from strenuous activity and abstain
from any form of caffeine or alcohol in the 24 hours preceding testing. Furthermore,
participants were required to write down everything eaten the day (24 hours) before
their first main trial so that diet could be replicated before subsequent main trials. During
study three and four, participants were provided with dietary logs to record in detail
dietary intake to limit the effect of altered calorific or fluid intake on the acclimation
process and intermittent-sprint exercise in the heat.
To limit the effect of hypohydration, participants in all studies were required to drink
water frequently in the 24 hours before main trials. Prior to arriving at the laboratory for
main trials participants were also instructed to consume their last meal three hours
previous and to drink 0.5 litres of water 1 - 1.5 hours before testing. On arrival to the
aboratory artici ant’ hydration tat wa a e ed rior to main tria ing rine
specific gravity and urine osmolality (section 3.8.). On completion of main trials in study

111
two, three and four participants were instructed to drink 150% of body mass lost from
exercise-heat induced dehydration (Maughan & Leiper, 1995) over a 2 hour period, drink
0.5 litres of water half an hour before going to bed and consume 0.5 litres of water in the
morning.
To limit the influence of circadian rhythms on sprint performance and body temperature
(Winget et al., 1985; Hill et al., 1992), all trials were completed at the same time of day ±
2 hours for each participant. For all main trials testing was completed in shorts, t-shirt and
running shoes.
3.5. Measurement of Performance in Intermittent-Sprint Cycling
3.5.1. Cycle ergometer and SRM calibration
For the studies presented in this thesis assessment of intermittent-sprint performance
was completed using one of two modified cycle ergometers (Monark Ergomedic 620,
Monark Ergomedic 874E, Varberg, Sweden) fitted with SRM powermeters (620 = SRM:
Scientific model, Julick, Germany; 874E = SRM: FSA Gossamer Standard, Julick Germany).
Power output during each trial was recorded continuously by the SRM powermeter at a
rate of 50 Hz and stored to a powercontrol (SRM Powercontrol V, VI or VII). All recorded
data was analysed using SRM software (SRM version 6.42.06). Peak power output (PPO,
W) was determined from the highest recorded power output during each sprint. Mean
power output (MPO, W) was the highest 3 s power output from the 5 s sprint to counter
frictional and other factors experienced when starting sprints from a stationary position
(Winter and Fowler, 2009). External work done (J) for each sprint was calculated as mean
power output multiplied by duration (3 s) (Castle et al., 2011).

112
Cycle ergometers and SRM systems were calibrated prior to all main trials. For the
Monark Ergomedic 620 with Scientific SRM system, calibration required the participant to
reverse pedal to activate the signal to the powercontrol. Once achieved, the cranks were
placed in a horizontal position and no force was applied through the pedals. The zero
offset for the system was then determined by pressing the mode and set buttons on the
powercontrol. When the zero offset value stabilised the new zero offset was selected by
pressing set on the powercontrol. With the Monark Ergomedic 874E and FSA Gossamer
standard SRM system forward pressure was required on the pedals to activate the
powercontrol. Setting of the new zero offset was then achieved as described for the
Monark Ergomedic 620.
Figure 3.1. Modified Monark ergomedic 874 E cycle ergometer with SRM power cranks.

113
Figure 3.2. Modified Monark Ergomedic 620E cycle ergometer with SRM power cranks.
3.6. Preliminary Visit and CISP Practice
Prior to main trials, each participant completed a preliminary visit to accustom
themselves with the equipment and procedures involved. During this visit anthropometric
data including height, body mass and percentage body fat were determined. Height was
recorded to within 0.1 cm in the Frankfurt plane using a Detecto beam scale (Detecto,
USA) and body mass was measured to within 0.1 kg using a standard laboratory scales
(SECA, UK). Percent body fat was determined from four sites (Tricep, Bicep, Suprailium,
Subscapular) using skinfold calipers (Harpenden Instruments, West Sussex, UK) as
described by Durnin and Womersley (1974) and the equations of Siri (1961).
n com etion of ba e ine mea re , actate thre ho d and ea aerobic ca acity 2peak
were determined from cycle ergometer exercise using a standard graded exercise
laboratory test. This test required participants to cycle on a modified cycle ergometer at
80 revolutions per minute (r.min-1) until volitional exhaustion, using an incremental
exercise procedure comprising 3 minute stages. The test began at a pre-determined

114
workload of 95 W and this was increased 25 W every three minutes until lactate
threshold had been achieved, determined as the first intensity at which there was a
sustained increase in blood lactate concentration above rest (Bourdon, 2000). From this
point, workload was increased by 25 W every minute until exhaustion. Whole blood
fingerti am e were ta en in the a t 30 of each 3 min te tage for actate ana y i ≈
25 µL; YSI 2300 Plus, Yellow Springs Instruments, Ohio USA). Gas analysis was undertaken
using open circuit spirometry for ∽ 45 d ring each three min te tage and every min te
thereafter d ring e erci e to determine o ygen con m tion. y ica error of
mea rement ) wa 2.1 9 C : 1.6 - 6.3) for 2 when eight samples were
obtained on two consecutive days from one partici ant d ring teady tate e erci e 60
). ithin day variation for 2 was 2.2%. Heart rate (Polar FS1, Kempele, Finland) and
RPE (Borg Scale) were recorded in the last 10 s of each stage throughout the test. Expired
air was analysed for volume, oxygen, carbon dio ide and tem erat re ing a Servome
entra 100 ga ana y er Crowboro gh, C , 2 1. C 2 = 1.9%) calibrated
with a two point calibration against nitrogen and a gas mixture of known O2 and CO2
concentration (BOC, UK) prior to each test.
Following a 25 ± 5 minute recovery period, CISP familiarisation was undertaken by all
participants. This included completion of the standardised CISP warm up and one quarter
of the CISP protocol (10 minutes). The warm up involved five minutes of exercise at 80
r.min-1 against a resistance of 1.2 kg (95 W) followed by two 30 s rest periods interspersed
with two, 30 s bouts of higher intensity cycling at 100 r.min-1 (120 W, Figure 3.3.).
Figure 3.3. Schematic of standardised CISP warm-up.

115
On completion of the CISP warm up participants completed one quarter of the CISP
protocol equating to five, two minute blocks of exercise as described.
3.7. The Cycling Intermittent-Sprint Protocol (CISP)
The cycling intermittent-sprint protocol required completion of twenty, 2 minute blocks
of activity. Each block comprised 10 s passive rest, 5 s sprinting against a resistance of
7.5% of body mass and 105 s of recovery cycling (80 r.min-1) at 3 of 2peak Ca t e et
a ., 2006). Power o t t for recovery wa determined from inear regre ion of ower
o t t again t 2 derived from the actate thre ho d 2peak test conducted in the
preliminary visit. The resistance required to elicit the ca c ated ower o t t d ring 10
of active recovery at 3 2peak was determined from the following equation:
Equation 3.1 Calculation of power output
Power Output (W) = mass x 9.81 x 6.02 x r.s-1
(Williams and James, 2001)
Where m is the mass on the weight pan required to elicit a given power output; 9.81 is
the acceleration due to gravity; 6.02 is the horizontal distance covered by the flywheel for
each revolution of the pedals and r.s-1 is revolutions per second (Williams and James,
2001).

116
Figure 3.4. Schematic representation of the CISP, measurements and measurement timepoints.
Power output during each trial was recorded continuously by the SRM powermeter at a
rate of 50 Hz and stored to a powercontrol (SRM Powercontrol V, VI or VII). All recorded
data was analysed using SRM software (SRM version 6.42.06). PPO was determined from
the highest recorded power output during each sprint. MPO was the highest 3 s power
output from the 5 s sprint to counter frictional and other factors experienced when
starting sprints from a stationary position (Winter and Fowler, 2009). External work done
(J) for each sprint was calculated as mean power output multiplied by duration (3 s)
(Castle et al., 2011).
During all preliminary testing, familiarisation and all CISPs, participants completed
exercise on one of two modified cycle ergometers. Ergometer one was a Monark 620
Ergomedic, Sweden, fitted with SRM power cranks (SRM; scientific model, Julick,
Germany). Ergometer two was a Monark Ergomedic 874E fitted with SRM power cranks
(SRM; FSA Gossamer standard, Julick, Germany). During testing participants were
allocated a specific ergometer which was then used by the participant for all trials to
eliminate any possible differences in power output due to seat position, ergometer angles

117
and SRM crank position. Data was downloaded to a personal computer and analysed
using SRM software (version 6.42.06). Thermoregulatory, perceptual and heart rate
measures were recorded at 1 minute into each two minute block of active recovery. Every
fourth two minute block of the CISP (sprints 4, 8, 12, 16 and 20) arterialised whole blood
samples from a hyperemised finger were collected and gas sampled for ~ 45 s during the
active recovery.
3.8. Experimental Procedures
On arrival to the laboratory prior to all main trials, participants provided a urine sample
for assessment of hydration status by urine specific gravity (Usg) and urine osmolality
(Uosm , Armstrong et al., 1994a) using a hand refractometer (Uricon NE, Atago Co. LTD,
Tokyo, Japan) and hand held pocket osmometer (Vitech Scientific Ltd, Japan),
respectively. If participants were not well hydrated, evidenced by a Usg of 1.013 or osm
of 2 m m. g-1 (Armstrong et al., 1994a) participants were instructed to consume
extra fluid. Prior to the commencement of testing, participants were then required to
provide a second sample to determine if a well hydrated state was achieved, Usg < 1.013,
Uosm < 442mOsm.kg-1 (Armstrong et al., 1994a). Nude body mass was then determined
(GFK150, AEAdam, UK).
A fingerti b ood am e wa then obtained for re ting b ood actate ≈ 2 µL YS 2300
Plus, Yellow Springs Instruments, Ohio USA). No fluid intake was permitted in any trial
and post exercise body mass was measured to determine fluid rehydration quantity.
3.9. Environmental Conditions
In the study presented in chapter four of this thesis and in all other control trials testing
was conducted under normal ambient conditions (17 - 23°C) in the human performance
laboratories of the School of Sport and Service Management. For the study presented in
chapter five, an environmental chamber (TISS, UK; range -20°C to +50°C, 20 - 95% ± 1%

118
relative humidity (rh)) in the laboratories (Figure 3.5.) was used to control temperature at
either 33°C, 50% rh or 40°C, 33% rh to replicate hot humid and hot dry conditions. In
chapters six and seven all intermittent-sprint exercise was performed in 33°C, 50% rh.
Web bulb globe temperature (WBGT), the accepted international standard (ISO 7243) for
the quantification of heat stress (Parsons, 2006) was used to determine heat stress in the
studies presented in this thesis. Originally introduced by Yaglou and Minard (1957), WBGT
combines the effect of humidity, wind, environmental temperature in the shade, sun and
surface radiation to calculate the heat stress index when in an outdoor environment.
WBGT was later modified to permit determination of heat stress indoors on the
assumption that in an indoor environment globe temperature approximates ambient
temperature. In this context heat stress for the studies presented was calculated from
equation 3.2;
Equation 3.2. Wet bulb globe temperature (indoor)
Indoor heat stress = (0.7 x Wet bulb temperature) + (0.3 x dry bulb temperature)
(Verdaguer-Codina et al., 1993; Epstein et al., 2006)
Where wet bulb temperature quantifies the effect of relative humidity and dry bulb
temperature gives the environmental temperature in the shade.

119
Figure 3.5. Environmental chamber at the School of Sport and Service Management
human performance laboratories.
3.10. Physiological Measurements
3.10.1. Heart rate
During all trials, resting heart rate was recorded after 15 minutes rest. During the CISP
heart rate was recorded at 1 minute into each two minute block of the CISP during the
active recovery phase using short distance telemetry (Polar FS1 Kempele, Finland).
3.10.2. Metabolic heat production
Metabolic heat production ( ) during intermittent-sprint exercise was calculated using
equation 3.3:

120
Equation 3.3. Metabolic heat production
(Jay and Kenny, 2007)
here 2 is the volume of oxygen (L.min-1) and RER is the respiratory exchange ratio
(Jay and Kenny, 2007).
3.10.3. Physiological strain index
Physiological strain index during heat acclimation, training and intermittent-sprint
exercise was calculated using equation 3.4. and quantified as shown in figure 3.6.
Equation 3.4. Physiological strain index
PSI = 5(Tre t – Tre 0)*(39.5 – Tre 0)-1 + 5 (HR t – HR 0)*(180 – HR 0)-1
(Moran et al., 1998a)
Where Tre t and Tre 0 is the rectal temperature at any time point and at rest, respectively
and HRt and HR0 is the heart rate at any time point and at rest.
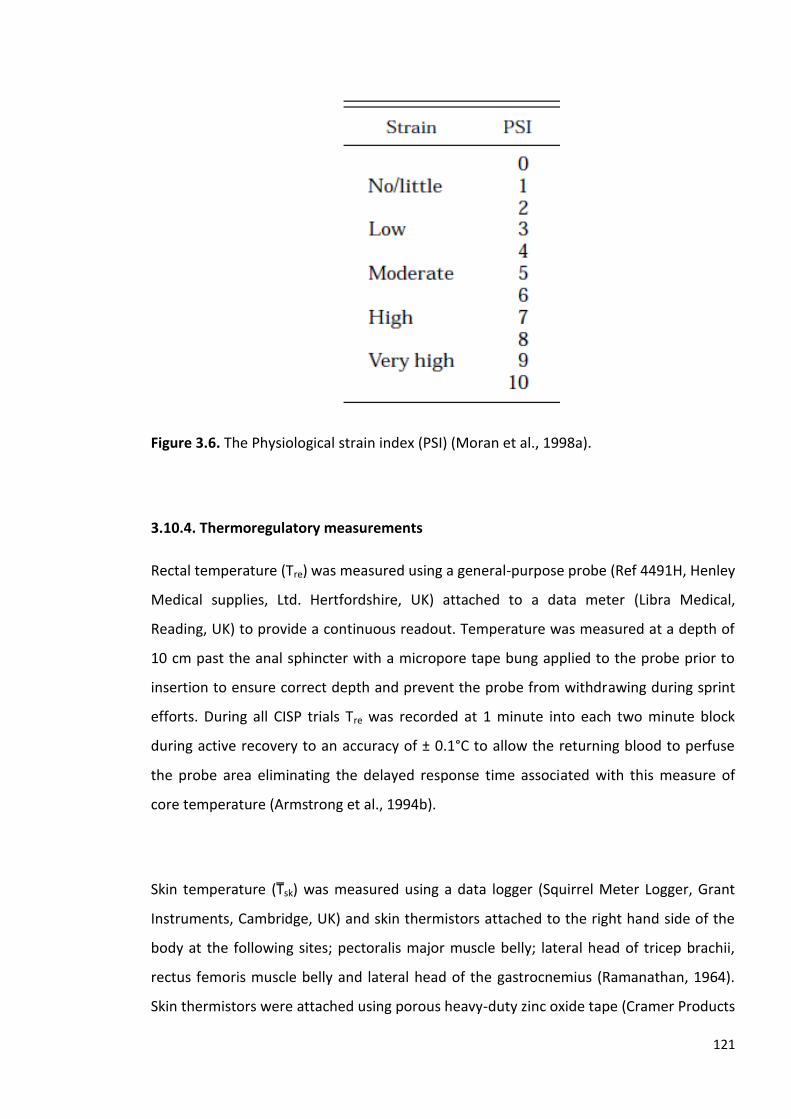
121
Figure 3.6. The Physiological strain index (PSI) (Moran et al., 1998a).
3.10.4. Thermoregulatory measurements
Rectal temperature (Tre) was measured using a general-purpose probe (Ref 4491H, Henley
Medical supplies, Ltd. Hertfordshire, UK) attached to a data meter (Libra Medical,
Reading, UK) to provide a continuous readout. Temperature was measured at a depth of
10 cm past the anal sphincter with a micropore tape bung applied to the probe prior to
insertion to ensure correct depth and prevent the probe from withdrawing during sprint
efforts. During all CISP trials Tre was recorded at 1 minute into each two minute block
during active recovery to an accuracy of ± 0.1°C to allow the returning blood to perfuse
the probe area eliminating the delayed response time associated with this measure of
core temperature (Armstrong et al., 1994b).
S in tem erat re sk) was measured using a data logger (Squirrel Meter Logger, Grant
Instruments, Cambridge, UK) and skin thermistors attached to the right hand side of the
body at the following sites; pectoralis major muscle belly; lateral head of tricep brachii,
rectus femoris muscle belly and lateral head of the gastrocnemius (Ramanathan, 1964).
Skin thermistors were attached using porous heavy-duty zinc oxide tape (Cramer Products

122
Inc., Kansas, USA) on the skin sites. Resting thermoregulatory measures were obtained
after a 15 minute stabilisation period. Mean skin temperature sk) was calculated from
equation 3.5. where Tchest, Tarm, Tthigh and Tcalf represent the temperature at the specific
measurement site.
e e er re sk)
sk = 0.3 (Tchest+Tarm) + 0.2 (Tthigh+Tcalf)
(Ramanathan, 1964)
The temperature of the body was determined from equation 3.6. where body is the
weighted mean of Tre and sk and 0.4 is a constant to account for the underestimation of
core temperature change.
B e er re body)
Tbody = 0.8(Tre) 0.2 sk) + 0.4
(Jay and Kenney, 2007)
Body heat content ) wa derived from eq ation 3. . where body) is body temperature,
m is the mass of the body (kg) and 3.47 is the specific heat capacity of body tissues (kJ.kg-
1.°C-1)
Equation 3.7. Body heat content (BHC)
BHC = Tbody x Massbody x 3.47 kJ.kg-1.°C-1
(Jay and Kenney, 2007)

123
3.10.5. Weight loss and sweat rate
Weight loss to estimate non-urine fluid loss and hydration volumes was determined from
nude body mass measured pre and post exercise to 0.01 kg (GFK150, AEAdam, UK). Sweat
rate was determined in litres.hr-1 from pre-post mass change. Respiratory water loss
during the CISP in the conditions presented in this thesis was calculated using the
equation;
Equation 3.8. Respiratory water loss
me 0.019 2 (44-Pa)
(Maughan et al., 2007)
Where me is evaporative water loss from the respiratory tract in g.min-1, 2 is the oxygen
uptake in the CISP in L.min-1 and Pa is the ambient water vapour pressure in mmHg.
Respiratory water loss for the environmental conditions presented in this thesis (20°C
50%rh, 33°C 80%rh, 40°C 20%rh) was estimated at ∽ 0.4 ml.min-1 - 1.3 ml.min-1.
Consequently, during the 47 minutes of the CISP (7 min warm up + 40 minutes main
protocol) the estimated respiratory water loss was 18.8 ml - 61 ml and therefore, was not
considered significant.
3.10.6. Perception of effort and thermal sensation
At one minute into each two minute block of all CISP trials and every five minutes in
acclimation and training sessions participants were required to provide a rating of effort,
and thermal sensation. Perception of effort (RPE) was determined using the Borg scale
(Borg, 1970) with RPE ranging from 6 (very, very light) to 20 (very, very hard). Thermal
sensation (Tsen) was measured using the thermal sensation scale (Toner et al., 1986) that
rated responses in increments of 0.5 from 0.0 (unbearably cold) through 4.0
(comfortable) to 8.0 (unbearably hot).

124
3.11. Collection, Treatment and Analysis of Blood Samples
Blood lactate was determined from arterialised fingertip capillary samples obtained at
pre-determined times. During sampling the fingertip (index or middle finger) was cleaned
with an alcohol wipe, dried with a tissue and punctured using a Softclix Pro lancet (Roche
Diagnostics, Lewes, UK). To prevent sample contamination or erythrolysis the first drop of
blood was wiped away with a tissue and the sample obtained from free flowing blood.
Blood (∽ 25 µL) was collected into lithium heparin coated microvette tubes (CB300 µL,
Sarstedt, Germany) and analysed for lactate using an automated analyser (YSI 2300 Plus,
Yellow Springs Instruments, Ohio USA). The YSI 2300 Plus contains a membrane
comprising a lactate specific enzyme layer. As lactate enters the enzyme layer it is
oxidised producing hydrogen peroxide according to the reaction:
The hydrogen peroxide then passes to a platinum electrode where it is oxidised and the
extent of the resulting current is proportional to the concentration of lactate (YSI, Ohio
USA). TEM for lactate determined from eight samples of 5 mM standard on two
consecutive days was 0.9% (95% CI: 0.6 - 2.4) and within day variation was 2.2%.
On day 1, 6 and 12 of acclimation and training a 20 ml venous blood sample for analysis of
aldosterone and cortisol was obtained pre and post exercise by venipuncture of an
antecubital vein. Pre exercise sampling was preceded by a 20 minute stabilization period
and all sampling was obtained with participants in a seated position to minimise the
effect of posture related hemodynamic change on blood hormone concentrations (Segar
and Moore, 1968; Rowell, 1993). Post exercise sampling was conducted within 5 minutes
of exercise cessation for all participants to minimize the effect of time on blood hormone
concentrations and all samples were obtained between 7.30 and 9.30am to standardize
for hormonal periodicity (Hurwitz et al., 2004). Blood was drawn using a 21 gauge (Sigma
Aldrich Co. St Louis, Mo. USA) needle and 20 ml syringe (BD Plastipak, BD, Drogheda,
Ireland) and transferred to 5 ml EDTA tubes (Sarstedt, Germany). Samples (3 x 5 ml) were

125
immediately centrifuged at 2000 rpm for 10 minutes at 4°C and the plasma pipetted to 2
ml Eppendorf Microcentrifuge Safe-Lock Tubes (Sigma Aldrich Co. St Louis MO, USA)
before being frozen at - 86°C for later analysis.
Blood for determination of haemoglobin (Hb) was collected in duplicate hemocue
microcuvettes (Angelholm, Sweden) and analysed in a hb photometer (HemoCue,
Sheffield) calibrated before each test session using a control cuvette (128 g.L-1). TEM for
eight samples on two consecutive days for the same participant was 3.5% (95% CI: 2.3 -
9.2) and within day variation was 3%. Hb was determined from hemolysis of erythrocytes
by sodiumdeoxycholate and the conversion of hb to methhb by sodiumnitrite with
absorbance measured at two wavelengths to compensate for turbidity.
Blood for determination of Haemocrit (Hct) was collected in triplicate into lithium heparin
coated glass capillary tubes and centrifuged (Hawksley haematospin 1300, Hawksley,
Lancing, Sussex, UK) at 1300 rpm for 2 minutes. Hct was measured using a micro
haematocrit reader (Hawksley, Lancing, Sussex, UK). TEM for Hct from eight samples
collected on two consecutive days from the same participant was 2.3% (95% CI: 1.3 - 5.1)
and within day variation was 1.8%. Initial plasma volume in study three and four was
calculated from body mass using the equation of Sawka et al., (1992).
Equation 3.9. Calculation of plasma volume
PV = 0.042 x lean body mass (kg) + 0.576
(Sawka et al., 1992)
Plasma volume on day six and twelve was then calculated by correcting the initial value
for the change in plasma volume according to the method of Dill and Costill (1974) where
PVA was the plasma volume after and PVB the plasma volume before.

126
Equation 3.10. Calculation of plasma volume change
ΔP 100 P A – PVB)/PVB
(Dill & Costill, 1974)
3.12. Blood Assays
3.12.1. Aldosterone
3.12.1.1. Principle of the test
The principle of the aldosterone assay was based on competitive binding. Competition
occured between an unlabelled antigen (present in calibrators, control and patient
samples) and an enzyme-labelled antigen (conjugate) for a limited number of antibody
binding sites on the microwell plate. The washing and decanting procedures removed
unbound materials. After the washing step, the enzyme substrate was added. The
enzymatic reaction was terminated by addition of the stopping solution. The absorbance
was measured on a microtitre plate reader.
The intensity of the colour formed was inversely proportional to the concentration of
aldosterone in the sample. A set of calibrators was used to plot a standard curve from
which the amount of aldosterone in patient samples and controls was determined.
3.12.1.2. Performance characteristics
The sensitivity of the assay was 10 pg.ml-1. Recovery rate for samples with a
concentration of 96.3 - 412 pg.ml-1 was 92.1 - 123.7%. Within assay variability (CV%) for
samples ranging from 18.79 - 507.22 pg.ml-1 was reported as 4.1 - 10.4% and between
assay variability (CV%) for samples of concentration 18.36 - 505.77 pg.ml-1 was 9.4 - 9.7%.

127
3.12.1.3. Reagents
Rabbit Anti Aldosterone Polyclonal Antibody Coated Microwell Plate (96 wells)
Aldosterone Horse Radish Peroxidase (HRP) conjugate (300l/vial)
Aldosterone calibrators (Concentration range 0 pg.ml-1 - 1000 pg.ml-1)
Control (0.6ml/vial of aldosterone in a human serum based buffer)
Wash buffer concentrate (50 ml)
Assay Buffer (Protein based 15ml)
TMB Substrate (tetramethylbenzidine and hydrogen peroxide 16ml)
Stop Solution (6ml 1 M sulphuric acid)
3.12.1.4. Procedure
1. Working solutions of the aldosterone HRP conjugate and buffer were prepared.
2. Reagents were removed from the fridge and samples from the - 85°C freezer and
allowed to reach room temperature before use.
3. 0 μ of each tandard, contro and a ma am e wa i etted into ate we in
d icate and 100 μ of the conj gate wor ing o tion wa added to each we .
4. The plate was incubated on a plate shaker at 200 r.min-1 for 1 hour at room
temperature and we were then wa hed 3 time with 300 μ of di ted wa h b ffer
per well and the plate tapped firmly against absorbent paper to ensure that it was
dry.
5. 1 0 μ of B b trate wa i etted into each we at timed interva and inc bated
on a plate shaker for 15 - 20 minutes at room temperature.
6. 0 μ of to o tion wa i etted into each we at the ame timed interva and the
plate was read on a microwell plate reader within 20 minutes after addition of the
stopping solution.

128
3.12.2. Cortisol
3.12.2.1. Principle of the test
The cortisol assay used was an ELISA based on the principle of competitive binding. Wells
on the test plate were coated with a monoclonal antibody specific to an antigenic site on
the cortisol molecule. Cortisol in a plasma sample competed with a cortisol horseradish
peroxidase conjugate for binding to the antibody. The amount of bound peroxidase
conjugate was inversely proportional to the cortisol concentration in the plasma sample
and the intensity of colour, after addition of a substrate solution, was proportional to the
sample cortisol concentration.
3.12.2.2. Performance characteristics
The range of the assay was from 0 - 800 ng.ml-1 and sensitivity 2.5 ng.ml-1. Recovery rate
for samples with a concentration of 200 - 400 ng.ml-1 was 86 - 111%. Within assay
variability (CV%) for samples ranging from 43 - 404 ng.ml-1 was reported as 5.6 - 8.1% and
between assay variability (CV%) for samples of concentration 55 - 361 ng.ml-1 was 6.5 -
7.7%.
3.12.2.3. Reagents
96 well plate coated with monoclonal antibody
Standard (7 x 1 ml vials concentration range 0 - 800 ng.ml-1)
Enzyme conjugate (25 ml)
Substrate solution (14 ml - TMB)
Stop Solution (14 ml 0.5 M sulphuric acid)
Wash solution (30 ml)

129
3.12.2.4. Procedure
1. Reagents were removed from the fridge and allowed to reach room temperature.
2. Plasma samples were removed from the -85°C freezer, allowed to thaw and inverted
several times prior to testing.
3. 20 l of standard, control and sample and 200 l enzyme conjugate was added to
each microtitre well.
4. Solution in wells was mixed thoroughly for 10 seconds, incubated at room
temperature for 60 minutes and then shaken out and the wells rinsed three times
with diluted wash solution (400 l per well).
5. Residual droplets remaining after the washing procedure were removed by striking on
the microtitre well plate onto absorbent paper.
6. 100 l of substrate solution was added to each well that was then incubated for 15
minutes at room temperature.
7. 100 l of stop solution was added to each well and optical density was determined at
450 10 nm within 10 minutes of adding the stop solution.
3.13. Statistical Analyses
Descriptive and inferential statistics were determined using the Statistical Package for the
Social Sciences (SPSS version 18.0 and 20.0). Data were checked for normality and
sphericity and where sphericity was violated the Huynh-Feldt correction was applied. For
correlated data two-way repeated measures ANOVA (condition*time) with Bonferroni
correction was applied with only pairwise comparisons made. Uncorrelated data from
main experimental trials was also analysed using either three way mixed ANOVA
(regime*day*time) with repeated measures on two factors (day*time) or two-way mixed
ANOVA (regime*day) with repeated measures on one factor (day). For analysis of
erce t a mea re acro time in C SP tria a Friedman’ AN A wa erformed with
significance identified using a Wilcoxon matched pairs test. Pearson product moment
correlation was performed to establish correlation coefficients (r). Effect sizes were
estimated using partial Eta squared (ηp2) where 0.2 re re ented a ‘ ma ’ effect ize, 0. a
‘medi m’ effect ize and 0.8 a ‘ arge’ effect ize Na agawa C thi , 200 ). Power

130
analyses were performed using commercially available G*Power software (version 3.0.10)
(Faul et al., 2007). Data presented in study chapters is expressed as mean ± standard
deviation and significance was accepted at P < 0.05. Additional statistical procedures
required are explained in the appropriate study chapter.

131
CHAPTER IV. RELIABILITY OF THE CYCLING INTERMITTENT-SPRINT PROTOCOL
4.1. Abstract
The aims of this study were to determine the reliability of an intermittent-sprint cycling
protocol and to determine the efficacy of one practice session on main trials. Eleven men,
moderately trained team-sport athletes, completed three visits to the laboratory
involving a graded-exercise test and practice session and two trials of a Cycling
Intermittent Sprint Protocol separated by three days. Data for practice and main trials
were analysed using typical error of measurement, intra-class correlation and least
products regression to determine reliability. Typical error of measurement (expressed as
a coefficient of variation) and intra-class correlation for peak power output from all
twenty sprints for trial 1 and trial 2 was 2.9 ± 12.8% (95% confidence interval: 2.0 – 5.0%)
and 0.96 (95% confidence interval: 0.85 – 0.99), respectively. Typical errors of
measurement and intra-class correlation for mean power output for all twenty sprints for
trials 1 and 2 was 4.2 ± 11.9% (95% confidence interval: 2.9 – 7.4%) and 0.90 (95%
confidence interval: 0.66 – 0.97), respectively. Results suggest peak power output
provides a more reliable measure than mean power output. Findings indicate the Cycling
Intermittent Sprint Protocol provides a reliable tool for assessing intermittent sprint
performance in a test-retest research paradigm.
4.2. Introduction
Team-sports such as rugby union, hockey and football are characterised by periods of
intermittent high-intensity activity, interspersed with longer spells of recovery and lower
intensity activity (Williams, 1990). In such sports, athletes typically complete twenty to
sixty sprints over 0 - 20 m per match with mean sprint durations of less than 3 s and mean
recovery times between sprints of 2 minutes (Spencer et al., 2004, 2005; Roberts et al.,

132
2008; Di Salvo et al., 2009). The contribution of sprinting to the total activity profile in
field-based sports is therefore small. Nevertheless, sprinting frequently precedes decisive
moments in play and as such, can be considered critical to the outcome of a match (Reilly,
1997; Spencer et al., 2004). Consequently, several performance-based protocols have
been devised to examine the physiological and metabolic demands of sprinting in field-
based sports, including the Bangsbo Sprint Test (Bangsbo, 1994), the Loughborough
Intermittent Shuttle Test (Nicholas et al., 2000) and the Soccer Specific Test of Prolonged
Repeated Sprint Ability (Oliver et al., 2007).
The majority of these protocols are running-based and use durations, intensities, and
work-rest ratios developed from time-motion analyses of team-sports. Typically, in
running-based protocols, athletes are required to complete 6 – 21 sprints of 20 – 40 m
interspersed with 15 – 100 s of recovery (Nicholas et al., 2000; Oliver et al., 2007;
Gabbett, 2010). Such protocols have good reliability, construct validity and specificity.
However, they are not conducive to sensitive measurement of complex physiological and
metabolic variables necessary to develop understanding of the demands of high-intensity
activity (McGawley & Bishop, 2006). Cycling- based protocols that focus on assessment of
repeated-sprint ability (Spencer et al., 2005; McGawley & Bishop, 2006; Mendez-
Villanueva et al., 2008), have been shown as a valid measure of sprint performance in
match play (Bishop et al., 2001). Yet, such protocols typically comprise 5 - 10, 6 s sprints
interspersed with 24 - 30 s of recovery (Bishop et al., 2001; McGawley & Bishop, 2006;
Mendez-Villanueva et al., 2008) and therefore, do not replicate intermittent-sprint
activity over durations that occur in many team-sports.
Accurate assessment of reliability should consider systematic factors such as a learning
effect attributable to a lack of practice (Phillips et al., 2004). In multiple sprint-cycling
based activity, learning effects occur (Capriotti et al., 1999; McGawley & Bishop, 2006). In
contrast to existing literature that identifies the need for two practice sessions when
repeated-sprint exercise is performed on a cycle ergometer (Capriotti et al., 1999;
McGawley & Bishop, 2006), learning effects are minimised during the Cycling Intermittent

133
Sprint Protocol (CISP) by completion of one practice session comprising a quarter of the
protocol prior to the first main trial (Castle, et al., 2011). The CISP examines the
physiological responses to intermittent-sprint exercise. However, whether a single
practice is sufficient to negate learning is currently unknown.
The CISP has been used to examine effects of pre-cooling and heat acclimation on
intermittent-sprint performance and has demonstrated 2 - 4% improvements in peak
power output compared with control (P < 0.05) (Castle, et al., 2006, 2011). However, the
reliability of the protocol has not been extensively determined (Castle, 2011). Running-
based tests designed to assess prolonged repeated-sprint ability have reported typical
errors of measurement for peak power output of up to 7.9% (95% confidence interval: 5.8
- 14.4) (Oliver et al., 2007). In addition, cycle ergometer based protocols have reported
random errors in repeated trials of 2 - 4% (Paton & Hopkins, 2001). As such, it is difficult
to determine if changes reported in previous studies using the CISP represent worthwhile
interventional change or variation inherent in the test. Therefore, the primary purpose of
this study was to determine the reliability of the Cycling Intermittent-Sprint Protocol
using a group of moderately trained team-sport athletes. A secondary purpose was to
assess the usefulness of a five sprint practice session on the main protocol.
4.3. Methods
4.3.1. Participants
Eleven men, moderately trained team-sport athletes (mean ± S.D.: age 23 ± 2.4 years,
stature 178.5 ± 5.9 cm, body ma 82.3 8. g, m of info d , 36. 11.2 mm, ea
o ygen con m tion 2peak), 42.6 ± 4.8 ml.kg-1.min-1) who competed in team-sports
three to five times per week gave written informed consent to participate. The study was
approved by the University Research Ethics and Governance Committee and conducted in
accordance with the Declaration of Helsinki (2008). Before testing participants completed

134
a medical questionnaire and were requested to follow standard pre-trial preparation
guidelines for diet, exercise and hydration (section 3.4.).
4.3.2. Experimental design
Figure 4.1. Schematic of experimental design with measurements.
Each participant was required to visit the laboratory on three separate occasions
including a preliminary session and two main trials. All main trials were completed at the
same time of day to minimize the influence of circadian variation (Winget et al., 1985; Hill
et al., 1992). During the preliminary visit anthropometric data including height, body mass
and percentage body fat were determined (section 3.6.) and participants completed an
incremental lactate-threshold-to- 2peak test on a modified cycle ergometer (Monark 620
Ergomedic, Varberg, Sweden) fitted with power cranks (SRM: Scientific model, Julick,
Germany) (section 3.5. & 3.6.). Finally, participants completed a CISP familiarisation.
During the incremental test, blood was obtained in the final 30 s of each stage and
analysed with an automated analyser for lactate and glucose concentration (section 3.6.
& 3.11.) (YSI 2300 Plus, Yellow Springs Instruments, Ohio, USA) calibrated prior to each
session using the manufacturers 5 mM standard (YSI 2427; coefficient of variation (CV) =
2.2%). When lactate threshold was achieved (section 3.6.) no further blood samples were
taken and intensity was increased by 25 W every minute until volitional exhaustion.

135
Oxygen uptake was recorded using open-circuit spirometry and expired air was collected
for approximately 45 s during the final minute of each stage (Section 3.6.). Heart rate was
determined in the final 10 s of each stage (section 3.6.). After 25 ± 5 minutes recovery a
CISP practice was completed that required participation in the standardised CISP warm-
up and five 2 minute blocks of the protocol (section 3.6.).
On the second and third visits participants completed the CISP (section 3.7.) (Castle et al.,
2006), hereafter referred to as trial 1 and trial 2. Following the standardised warm-up,
participants performed the protocol on a modified cycle ergometer (Monark 620
Ergomedic, Varberg, Sweden) fitted with power cranks (SRM, Scientific model, Julick,
Germany) with data during exercise recorded at 50 Hz and analysed for peak power
output (PPO), mean power output (MPO) and work done using SRM software (version
6.42.06; section 3.7.). To determine the effectiveness of one practice session before main
trials to counteract learning effects data from the five practice sprints were analysed
against the first five sprints of trial one and two.
4.3.3. Statistical analysis
Data were assessed for normality and sphericity and adjusted where necessary using the
Huynh-Feldt method. PPO and MPO were compared using a fully within-groups factorial
ANOVA (condition*time). Data were assessed for heteroscedasticity using plots of log
transformed data and reliability measures. Typical errors of measurement, calculated
from the standard deviation of the mean difference for each pair of trials using the
formula typical error of measurement = SD(diff)/√2 Ho in , 2000a) and e re ed a a
mean coefficient of variation, and intra-class correlation were calculated from log
transformation. Intra-class correlations were determined using a reliability spreadsheet
(available at newstats.org/xrely.xls) as used by Laursen et al., (2007). 95% confidence
limits were determined for typical errors of measurement and intra-class correlations
using the methods described by Hopkins (2000b, 2007). Ordinary least products
regression, where both outcome measures were compared with an assumption of error

136
in each, was used to determine fixed and proportional bias in peak power and mean
power output between trials (Ludbrook, 1997). Using this method, estimates of the
interce t a’) and o e b’) of the ea t rod ct regre ion ine a’ b’ ) were
calculated and compared to 95% confidence intervals (determined from bootstrapping)
for a’ and b’ to a e bia . Fi ed bias was deemed present when the 95% confidence
interva for a’ did not an zero. Pro ortiona bia wa deemed re ent when the 9
confidence interva for b’ did not inc de one. S rint were a o gro ed into fo r ha e ,
each phase being the mean of five sprints, to improve visual and analytical clarification.
All data was analysed using SPSS (version 18.0) and reported as mean ± standard
deviation. Statistical significance was accepted at the level of P < 0.05. Effect sizes were
calculated as described in section 3.13.
4.4. Results
There were no differences between trials 1 and 2 for PPO across all 20 sprints (p = 0.396,
ηp2 = 0.073). Similarly, there were no differences in PPO between trial 1 and trial 2 when
grouping the sprints into four phases (p = 0.406, ηp2 = 0.070). MPO across all 20 sprints did
not differ between trials 1 and 2 (p = 0.820, ηp2 = 0.005). Grouping the sprints into four
phases also showed no difference between trials 1 and 2 (P = 0.820, ηp2 = 0.005). PPO and
MPO for the practice period were not different from the first five sprints of trials 1 or 2
(Table 4.1., P > 0.05, ηp2 = 0.058). Typical errors of measurement and intra-class
correlations for practice versus trial 1 were 2.6 ± 9.6% (1.8 - 4.7%) and 0.94 and for
practice versus trial 2, 2.5 ± 7.2% (1.7 - 4.7%) and 0.95 respectively. PPO demonstrated
less variability than MPO throughout the protocol (mean of sprints 1 - 20), despite both
showing strong correlations (Table 4.2.).

137
Table 4.1. Peak power output (W) and mean power output (W) for sprints 1 - 5 in
practice, trial 1 and trial 2.
Peak power output (W) Mean power output (W)
Sprint Practice Trial 1 Trial 2 Practice Trial 1 Trial 2 1 1199 ± 88 1192 ± 75 1216 ±
104 1145 ± 88 1133 ± 73 1148 ± 77
2 1201± 105 1172 ± 101
1193 ± 110
1129 ± 103
1102 ± 105
1122 ± 93
3 1199 ± 115
1192 ± 107
1196 ± 130
1139 ± 117
1124 ± 99 1126 ± 115 4 1184 ±
130 1190 ± 119
1190 ± 120
1133 ± 134
1121 ± 113 1117 ± 108 5 1180 ±
133 1176 ± 110
1177 ±107 1105 ± 154
1117 ± 108 1106 ± 93
Mean (±
S.D.)
1193± 114 1184 ±
102
1194 ±
114
1130 ±
119
1119 ± 100 1124 ± 97
Data are mean ± S.D., n = 11.
Table 4.2. Peak power output (W), mean power output (W), work done (J) typical errors
of measurement and intra-class correlations for 20 sprints, trial 1 and trial 2.
Peak power output (W) Mean power output (W) Work done (J)
Trial 1 1174 132 1104 129 3312 387 Trial 2 1187 145 1100 112 3300 336 Difference -13 13 4 17 12 51 TEM (CV 95%) 2.9 ± 12.8 (2.0-5.0) 4.2 ± 11.9 (2.9-7.4) 4.2 ± 11.9(3.1-7)
ICC (r value) 0.96 (0.85-0.99) 0.90 (0.66-0.97) 0.90 (0.66-0.97)
Data are mean ± S.D., n = 11. TEM: typical error of the measure. CV: coefficient of variation, at a 95% confidence interval (CI). ICC: intra-class correlation.
For grouped sprints (mean of five sprints), PPO in phases 1 and 4 had smaller typical
errors of measurement (3.4 ± 10.9% and 3.3 ± 14.1%, respectively) than phases 2 and 3
(3.5 ± 12.8% and 3.9 ± 14.1%, respectively), (Table 4.3.). This also occurred for MPO.
However, typical errors of measurement were greater for MPO compared to peak power
output in phases two, three and four (Table 4.3.). Intra-class correlation for PPO in
grouped sprints between trials 1 and 2 remained above r = 0.92 throughout each phase,
however this was not the case for MPO in phase 2 and phase 3 (r = 0.85).

138
Table 4.3. Peak power output (W), mean power output (W), work done (J), typical errors
of measurement and intra-class correlations for each phase (Phase 1 = sprints blocks 1-5,
Phase 2 = 6-10, Phase 3 = 11-15 and Phase 4 = 16-20), trial 1 and trial 2.
Peak power output (W)
Phase 1 Phase 2 Phase 3 Phase 4 Trial 1 1203 111 1178 129 1160 153 1152 140 Trial 2 1221 138 1189 148 1166 147 1170 157 TEM
(CV 95%)
3.4 ± 10.9(2.3-6.0) 3.5 ± 12.8 (2.4-6.2) 3.9 ± 14.1(2.7-6.9) 3.3 ± 14.1 (2.3-5.8) ICC
(r value)
0.92 (0.73-0.98) 0.94 (0.78-0.98) 0.94 (0.78-0.98) 0.95 (0.84-0.99) Mean power output (W)
Trial 1 1134 105 1104 133 1093 151 1086 135 Trial 2 1138 99 1101 115 1081 119 1080 124 TEM
(CV 95%)
3.0 ± 9.0 (2.1-5.4) 5.1 ± 12.3 (3.6-9.2) 5.7 ± 13.7(3.9-10.2) 4.3 ± 13.1(3.0-7.6) ICC
(r value)
0.92 (0.73-0.98) 0.85 (0.54-0.96) 0.85 (0.53-0.96) 0.91 (0.7-0.97) Work done (J)
Trial 1 3402 315 3312 399 3279 453 3258 405 Phase 1 Phase 2 Phase 3 Phase 4 Trial 2 3416 297 3303 345 3243 357 3240 372 TEM (CV
95%)
2.9 ± 9.7 (2.2-4.7) 5.1 ± 12.3 (3.8-8.3) 5.8 ± 13.8 (4.3-9.4) 4.2 ± 13.1 (3.1-6.8) ICC
(r value)
0.92 (0.79-0.97) 0.85 (0.61-0.95) 0.84 (0.59-0.94) 0.91 (0.76-0.97) Data are mean ± S.D., n = 11.TEM: typical error of the measure. CV: coefficient of variation, at a 95% confidence interval (CI). ICC: intra-class correlation.
PPO and MPO were normally distributed for trial 1 and 2. Although PPO tended to be
higher in tria 2 than tria 1 Fig re .2.) no fi ed bia wa ob erved a’ -158.2 W; 95%
confidence interval (CI) = -449.6 - 133.2 W). Similarly, no proportional bias was observed
between tria 1 and 2 for PP b’ 1.1 9 C 0.90 - 1.39). MPO demonstrated fixed
bia between tria one and tria two Fig re .3.) a’ -295.0 W; 95% CI = -534.9 - -55.12
) and ro ortiona bia of ~ 20 b’ 1.26 9 C 1.0 - 1.48).

139
Figure 4.2. Scatterplot of peak power output (W) in trial 1 and trial 2. Solid line: Least
products regression line E(trial 2) = -158.2 + 1.15(trial 1). Dotted line: 45° line of identity.

140
Figure 4.3. Scatterplot of mean power output (W) in trial 1 and trial 2. Solid line: Least
products regression line E(trial 2) = -295 + 1.26(trial 1). Dotted line: 45° line of identity.
4.5. Discussion
The purpose of this study was to determine the reliability of the Cycling Intermittent-
Sprint Protocol. The main finding of this study was that the protocol provided a reliable
measure of high-intensity intermittent-exercise in team-sport athletes. Further, one
practice session is sufficient to minimise learning effects on PPO and MPO.
The reliability of the protocol was assessed from two trials separated by three days. The
typical error of measurement scores across all 20 sprints for PPO and MPO for the two
trials suggested a low level of within participant variability. The same conclusions can be

141
drawn for PPO when sprints were grouped into four phases. For MPO, the variation
between each typical error of measurement for each phase suggested greater within
participant variability in the middle two phases.
No other studies to date have examined the reliability of the CISP. Compared with
protocols that have examined reliability of repeated-sprint activity on non-motorised
treadmills, the typical errors of measurement (expressed as a coefficient of variation)
reported in this study are lower. Oliver et al., (2007) reported a typical error of 7.9% (95%
confidence interval: 5.8 - 14.4%) for peak power and 5.9% (4.3 - 10.2%) for mean power
in the soccer specific intermittent-sprint test when performed with youth soccer players.
Such discrepancy between typical errors for peak and mean power in our study and that
of Oliver et al., (2007) may be explained by the mode of assessment of repeated sprint
ability as the reliability of power output from non-motorised treadmill running is poor
(Tong et al., 2001; Oliver et al., 2007). In addition, when compared to the random error
reported in repeated trials for cycle ergometers (Paton & Hopkins, 2001) the values
reported for mean and peak power in this study compare favourably. Therefore, when
assessing worthwhile interventional change using peak and mean power output, cycle
ergometer-based exercise may enable more accurate assessment of performance.
However, researchers must also consider that, for team-sport athletes whose primary
mean of locomotion is running, cycle exercise may be unfamiliar and lack specificity
contributing to greater variability and reduced sensitivity when monitoring interventional
change. Thus, careful consideration must also be given to the mode of exercise used.
A commonly used cycling test to assess repeated-sprint ability in team-sport athletes is
the 5 x 6 s maximal sprint test (Bishop et al., 2004; McGawley & Bishop, 2006). McGawley
& Bishop (2006) reported typical error scores for peak power output in the first sprint
between trial 1 and 2 of 25 W (95% confidence interval: 17 - 48 W). In the current study
typical error in the first sprint between trial 1 and 2 was approximately 48 W (33 - 84 W).
Expressed as a percentage of maximal peak power output, typical error of measurement
i imi ar in both t die cGaw ey rint 1: ≈ 2.8 , re ent t dy rint 1: 2. ),

142
suggesting the CISP compares favourably. Similarly, intra-class correlations reported in
our study compare favourably with those in other studies of intermittent-sprint exercise
involving treadmill running and overland sprinting (Lemmink et al., 2004; Laursen et al.,
2007; Gabbett, 2010).
Differences between trial 1 and 2 such as fixed and proportional bias are revealed with
ordinary least product regression analysis. This analysis of peak power for trial 1 vs. 2
revealed no significant fixed or proportional bias. However, for mean power output least
products regression revealed a significant fixed bias of -295 W and a proportional bias of
~ 20 b’ 1.26). hi di cre ancy may be e ained by the higher PP ob erved in tria 2
contributing to greater variation in MPO compared to trial 1 and suggests that PPO is a
more reliable measure of performance.
The present study showed greater within-participant variability for average mean power
output in grouped sprints in phases 2 and 3. Laursen et al., (2007) suggest greater
variability in time to exhaustion tests was related to participant boredom or lack of
motivation. A tho gh not a time to e ha tion te t, the C SP’ d ration and freq ent need
for participants to perform maximal efforts make it conceivable that such variables
contributed to the greater variability found in phase 2 and 3 for mean power output,
despite consistent verbal encouragement throughout. The fixed-paced portion of the
protocol does not allow self-selection of exercise intensity as participants are required to
maintain a pre-determined recovery intensity. However, during the 5 s sprint, although
instructed to be all out, participants may have self-paced. Consequently, participants may
be adopting a pacing strategy to allow completion of the protocol thus reflecting greater
variability in average mean power output in the middle portion of the protocol,
particularly as research shows the occurrence of pacing in anticipation of the number of
sprints within a trial (Billaut et al., 2011).

143
A practice or learning effect is defined as any systematic change in the performance
scores during the performance of a novel exercise task distinct from any experimental
intervention (Watt et al., 2002). In a meta-analysis of thirty tests of maximal-intensity
exercise, Hopkins et al., (2001) identified a practice effect between first and second
experimental trials and recommended at least one practice trial should precede formal
testing. Presently, the CISP involves one practice of five sprints prior to main trials. An
important finding of the current study was that no difference (P > 0.05, ηp2 < 0.058)
existed between practice and the first five sprints in either trials 1 or 2 as evidenced in
previous work (Castle, 2006). Although the large standard deviation values may have
prevented detection of any difference, previous investigations that have used the CISP
have reported similar standard deviation values and identified significant differences
between trials (Castle et al., 2006; Castle et al., 2011). Similarly, when percentage change
is considered, PPO declined by 0.69% in trial 1 (95% confidence interval - 2.05 - 0.65%)
and increased by 0.83% in trial 2 (- 0.35 - 2.1%). There was a decline of 0.96% (- 2.57 -
0.64%) for MPO in trial one and an increase of 0.36% (- 1.09 - 1.81%) in trial two. Taken
together, this lack of a substantial change between trials indicates minimal practice effect
between familiarisation and subsequent trials (Hopkins et al., 2001). Therefore, it is
plausible to suggest that one practice trial consisting of five sprints is sufficient to obtain a
reliable measure of intermittent-sprint exercise performance.
In contrast, Capriotti et al., (1999) reported two practice sessions identical to the tests
were required for satisfactory reliability when participants unaccustomed to multiple
sprint exercise performed 10 x 7 s sprints with 30 s recovery. Similarly, McGawley &
Bishop, (2006) reported one practice trial was sufficient to obtain a reliable measure of
repeated sprint ability with trained female team-sport athletes, but recommended two as
reproducibility of measures improved with a second practice session. As such, it is
possible that completion of three full trials of the current protocol may have improved
reliability for trial two versus trial three. In addition, if a complete twenty sprint practice
trial of the CISP was completed in a rested state further insight into the efficacy of one
practice trial would have been gained. However, extending the habituation process for
the current protocol is not recommended due to the prolonged, repetitive nature of the

144
exercise and the possible negative effect on participant motivation if too many sessions
are required (Hopkins, 2000a). In addition, in the current investigation, analysis of PPO
and MPO for sprints 1 - 5 in the practice vs. trial 1 compared to practice vs. trial 2
revealed no differences in typical errors of measurement, intra-class correlations and 95%
confidence limits. This indicates no improvement in reproducibility of measures when
f rther tria were inc ded. Con eq ent y, for trained game ayer ’ who are
accustomed to intermittent-sprint exercise, one practice session comprising five sprints
provides reliable measures of PPO and MPO in the CISP.
4.5.1. Conclusion
This study was the first to examine the reliability of the CISP, a test previously used to
reproduce activity patterns in match play. The protocol is unique for cycling based tests of
intermittent-sprint exercise because of its duration. Consequently, it permits the
examination of the effect of differing interventions and training on performance and
metabolism in intermittent-sprint exercise over durations typical of one half of a team
match while also permitting investigation of physiological responses across similar time
frames. Results demonstrate the protocol is a reliable measure of intermittent-sprint
exercise, but typical errors of measurement, intra-class correlations and ordinary least
products regression indicate PPO is the more reliable measure of performance.

145
CHAPTER V. THE INFLUENCE OF HOT HUMID AND HOT DRY ENVIRONMENTS ON
INTERMITTENT-SPRINT EXERCISE PERFORMANCE
5.1. Abstract
This study examined the effect of a hot humid (HH) compared to a hot dry (HD)
environment, matched for heat stress, on intermittent sprint performance. In comparison
to HD, HH environments compromise evaporative heat loss and decrease exercise
tolerance (Maughan et al., 2012). It was hypothesized HH would produce greater
physiological strain and reduce intermittent sprint exercise performance compared to HD.
Eleven male team sports players completed the cycling intermittent sprint protocol (CISP)
in three conditions, temperate (TEMP; 21.2 ± 1.3˚C, 8.6 8. re ative h midity rh)),
HH 33. 0. ˚C, 8.2 2.3 rh) and HD 0.2 0.2˚C, 33.1 .9 rh), with both heat
conditions matched for heat stress. All participants completed the CISP in TEMP but three
failed to completed the full protocol of twenty sprints in HH and HD. Peak power output
(PPO) declined in all conditions (P < 0.05), but was not different between any condition
(sprints 1 – 14 (n = 11); HH, 1073 ± 150 W; HD, 1104 ± 127 W; TEMP, 1074 ± 134 W;
sprints 15 – 20 (n = 8); HH, 954 ± 114 W; HD, 997 ± 115 W; TEMP, 993 ± 94 W; P > 0.05).
Physiological strain (PSI) was not significantly different in HH compared to HD but HH was
higher than TEMP (P < 0.05). Data demonstrates intermittent sprint exercise performance
of 40 minutes duration is impaired, but not different in hot humid and hot dry
environments matched for heat stress despite evidence of a trend towards greater
physiological strain in a hot humid environment.
5.2 Introduction
Globalization has increased the incidence of major team-sport competition in hot humid
and hot dry environments. Therefore, international team-sport athletes frequently

146
compete in environments of high heat stress. Under such conditions, performance in
intermittent sprinting, representative of activity patterns in team-sports, is impaired
compared to temperate conditions (Drust et al., 2005; Sunderland et al., 2005). This
impairment occurs without significant difference in metabolic responses to exercise
between conditions and may be explained by peripheral and/or central mechanisms
(Nybo and Nielsen, 2001a; Racinais et al., 2007).
While it is known performance in intermittent sprinting is impaired in hot compared to
temperate conditions, few studies have examined the effect of differing compositions of
heat and humidity, contributing to the same total heat stress, on performance of this
type. No difference in performance was observed when two sets of 3 x 30 s Wingates
with 60 minutes passive rest were repeated in temperate (22°C, 30% rh), hot humid
(30°C, 85% rh) and hot dry (40°C, 40% rh) environments, although this may be explained
by the exercise and recovery duration used (Backx et al., 2000). Although related to
prolonged exercise, recently a progressive impairment in exercise capacity in the heat ha
been re orted with increa ed re ative h midity a ghan et a ., 2012). hen fo r
cyc ing tria were erformed at 0 2max in 30.2 ± 0.2°C and either 24, 40, 60 or 80%
rh, exercise time was significantly reduced at 60 and 80% rh compared to 24% (Maughan
et al., 2012). However, conditions in this study were not matched for heat stress and so it
is unknown if clamping relative humidity while increasing dry bulb temperature to
replicate heat stress, would produce similar findings.
Typically, dry and evaporative heat exchange mechanisms combine to maintain thermal
equilibrium in the resting human (Cheung, 2010). However, during exercise in the heat,
dry heat exchange is limited by high ambient and skin temperatures and a reduced
thermal gradient for heat transfer. Consequently, 80% of heat loss is achieved through
evaporation with approximately 2.4 MJ of heat energy liberated per litre of sweat
vaporized (Cheung, 2010). However, the effectiveness of evaporation is primarily
determined by relative humidity. High relative humidity increases sweat drippage,
decreases sweat vaporization and reduces heat loss through evaporation. Therefore,

147
compared to a hot dry environment where the evaporative potential of the environment
exceeds the evaporative requirement of the athlete, exercise in a hot humid environment
of similar overall heat stress could contribute to greater hyperthermia and physiological
strain and concomitantly, greater reductions in performance.
To permit accurate interpretation of the influence of differing combinations of heat and
humidity on intermittent-sprint exercise, research should use trials matched for heat
stress. This requirement is seldom achieved. However, as intermittent-sprint activity is
routinely performed as part of team-sport competitions in equatorial or Middle Eastern
regions the influence of differing combinations of environmental factors needs to be
ascertained. Research has demonstrated composite environmental indices provide better
indicators of environmental influence than individual factors alone (Zhang et al., 1992).
Wet bulb globe temperature (WBGT) is one such index that can be used to measure and
match heat stress. WBGT is criticised for a lack of ability to predict physiological strain
when evaporation is limited (Budd, 2008), however, as an index of heat stress it is the
accepted international standard and has been adopted by the US military, World Health
Organisation and the American College of Sports medicine (Epstein and Moran, 2006).
Therefore, the purpose of this study was to determine the effect of differing heat and
humidity, hot humid (HH) and hot dry (HD), of the same total heat stress (determined
using WBGT) on intermittent-sprint exercise. It was hypothesized HH would result in
greater physiological strain and reduce intermittent-sprint performance compared to HD.
5.3. Methods
5.3.1. Participants
Eleven male games players (mean ± SD: Age 22.4 ± 2.7 years, height 180.4 ± 5.3 cm,
body ma 8. 11.2 g, ercent body fat 1 . 2.8 , 2peak 48.4 ± 6.8 ml.kg-1.min-1)
participated in the study. The study was approved by the University Research Ethics and

148
Governance Committee and conducted in accordance with the Declaration of Helsinki
(2008). Before testing, participants completed a medical questionnaire and followed
standard pre-trial preparation guidelines for exercise, hydration and diet (section 3.4.).
5.3.2. Experimental design
Figure 5.1. Schematic of experimental design with measurements.
Participants completed one preliminary and three randomised main trials over a two
week period. Trials were completed between September and May and scheduled for the
same time of day (Winget et al., 1985; Hill et al., 1992). During preliminary testing
baseline data were obtained (section 3.6.), participants completed a lactate-threshold-to-
2peak test and practiced the CISP (Castle et al., 2006) in ambient conditions. For the
remaining visits participants completed the CISP in one of three conditions with hot trials
matched for heat tre [HH: 33. 0. ˚C, 8.2 2.3 rh HD: 0.2 0.2˚C, 33.1 ± 4.9%
rh tem erate P), 21.2 1.3˚C, 8.6 8. rh). Artificia wind wa not ed in tria

149
due to the possibility of disproportionally altering evaporative capacity in the hot humid
trial and preventing accurate assessment of the strain associated with this environment
(Budd, 2008). For hot trials, exercise was terminated if participants felt unable to
continue, or they reached the institutional ethics committee approved core temperature
for termination of exercise in the heat (39.7°C).
5.3.3. Preliminary visit
Body mass and height were determined using a beam scale (Detecto, USA) and percent
body fat was determined from four sites using calipers (Harpenden, UK) (section 3.6.).
Hydration was assessed (section 3.8) and participants completed a actate-thre ho d-to-
2peak test on a cycle ergometer (Monark 620, Sweden) fitted with power cranks (SRM,
Julick, Germany) (section 3.5 & 3.6.). Blood for lactate concentration (YSI 2300, USA) was
drawn in the last 30 s of each stage (section 3.6.). When lactate threshold was achieved
(Bourdon, 2000), intensity was increased 25 W every minute until exhaustion.
Expired air was collected using open-circuit spirometry for 45 s in the final minute of each
stage (section 3.6.). Oxygen uptake was determined using a Servomex Xentra 4100
analyser (Servomex, England) (section 3.6.). Heart rate ((HR) Polar FS1, Finland) and RPE
(Borg, 1970) were recorded in the last 10 s of each stage (section 3.6). After 25 ± 5
minutes recovery a CISP practice was completed (section 3.6.).
5.3.4. Main trials
Partici ant’ hydration tat and n de body ma were determined ection 3.8.). After
five minutes of rest in ambient conditions, heart rate (Polar FS1, Finland) and lactate
concentration (YSI, USA) were determined (section 3.10.1. & 3.11.). Resting core
temperature (Tre) was determined by disposable rectal thermometer (Henley, UK)
ection 3.10. .) and in tem erat re sk), using thermistors attached with porous zinc
oxide tape to four sites on the right side of the body (section 3.10.4.) (Ramanathan, 1964)

150
connected to a data logger (Grant, UK). Participants then completed the CISP (section
3.7.) in one of three conditions. The CISP included the standard warm-up followed
immediately by twenty, 2 minute blocks as described (section 3.7.). Power output was
recorded by SRM cranks at a rate of 50 Hz and PPO and work done were determined
using SRM software (section 3.7.).
5.3.5. Physiological measures
Tre, sk, Thermal sensation (Tsen), RPE and HR were recorded immediately pre and post
warm-up with the participant seated in the chamber. During the CISP these variables
were measured at 1 minute into each 2 minute period (section 3.10.1., 3.10.4., 3.10.6.,
Figure. 3.4.). Blood and gas samples were taken 1 minute into each fourth 2 minute
period (Figure. 3.4.). No fluid was permitted during trials and non-urine fluid loss was
assessed to 0.01 kg from pre and post-test nude body mass (section 3.10.5). Physiological
strain index (PSI) was calculated using the equation of Moran et al., (1998) (section
3.10.3.). Total body temperature, body heat content and metabolic energy expenditure
were calculated using standard equations (section 3.10.2, & 3.10.4.).
5.3.6. Statistical analysis
Data were checked for sphericity and adjusted using the Huynh-Feldt correction.
Significance was determined using two-way repeated measures ANOVAs
(condition*sprint) with Bonferroni adjustment. Where participants failed to complete the
CISP ANOVAs were completed with n = 11 and n = 8 participants for sprints 1-14 and 15-
20, respectively. Differences between conditions for WBGT and pre-exercise measures
were assessed using a one-way repeated measures ANOVA. To determine the effect of
fitness on erformance, data were a o a e ed with artici ant gro ed a trained
2peak 0 m . g-1.min-1) and moderate y trained 2peak ≤ 3 m . g-1.min-1) using a
two-way mi ed AN A. Perce t a mea re were a e ed ing Friedman’ AN A
with Wilcoxon signed ranks test. Effect sizes were estimated using partial Eta squared

151
(ηp2) (section 3.13.). All data were analysed using SPSS (18.0) and reported as means ±
S.D. Significance was accepted at P < 0.05.
5.4. Results
5.4.1. Ambient conditions
Mean BG wa higher in hot tria HH, 30.9 0.69˚C HD, 30.3 0.81˚C P, 16.61
1. ˚C main effect, P < 0.001), but not different between HH and HD (P > 0.05).
5.4.2. Preliminary measures and warm up
There was no difference in pre-exercise body mass (kg), Usg, or resting Tre between
conditions (main effect, P = 0.425, 0.579 and 0.073 respectively). Tre did not change with
warm- main effect, P 0.2 0, ab e .1.). sk was elevated by warm-up in hot
conditions (main effect, P < 0.001) and post warm-up was different between conditions (P
< 0.05, Table 5.1.).
Table 5.1. Rectal temperature (Tre, °C) and mean skin temperature (Tsk, °C) pre and post
warm-up.
Tre (°C) Tsk (°C)
Condition Pre w/up Post w/up Pre w/up Post w/up HH 37.5 ± 0.2 37.5 ± 0.3 30.6 ± 0.6 3 .8 1. *‡
HD 37.5 ± 0.2 37.5 ± 0.2 30.8 ± 0.6 36.6 0.6*‡
TEMP 37.4 ± 0.1 37.4 ± 0.2 30.4 ± 1.4 30. 2.3‡
Data are mean ± S.D. HH = hot humid; HD = hot dry; TEMP = temperate. * Significantly higher than pre warm-up within condition (P < 0.01). ‡ Significantly different between conditions post warm-up (P < 0.01).

152
5.4.3. Number of sprints completed
All participants completed the CISP in TEMP. In the hot trials, eleven participants
completed fourteen sprints, but only eight completed the full protocol of twenty sprints.
One participant was stopped in both trials due to Tre reaching 39.7°C. The remaining two
participants stopped after sprint fourteen due to exhaustion.
5.4.4. Main experimental conditions
5.4.4.1. Performance variables
PPO was not different between conditions in sprints 1-14 (F(2,20) = 1.132, P = 0.342, ηp2 =
0.102, Table 5.2, Figure 5.2.) or 15-20 (F(2,14) = 0.902, P = 0.114, ηp2 = 0.102, Table 5.2,
Figure. 5.2.). For training state there was also no effect of group on PPO in sprints 1-14
(F(1,26) = 1.002, P = 0.326, ηp2 = 0.037) or 15-20 (F(1,10) = 4.928, P = 0.051, ηp
2 = 0.330). Over
time, PPO in HH declined 8% from sprint 16 compared to sprint 4 (all P values < 0.05). In
HD an 8% reduction in PPO occurred from sprint 15 compared to sprint 5 (all P values <
0.05) and in TEMP a 6% decline in PPO was observed from sprint 17 compared to sprint 3
(all P values < 0.05).
Table 5.2. Peak power output (W) and work done (J) during the CISP in HH, HD and TEMP.
Sprints 1-14 (n=11) Sprints 15-20 (n=8)
Peak Power Output (W) HH 1073±150 954±114
HD 1104±127 997±115
TEMP 1074±134 993±94
Work Done (J)
HH 3073 ± 491 2694 ± 405
HD 3163 ± 427 2822 ± 376
TEMP 3102 ± 422 2865 ± 299
Data are for the mean (± S.D.) of all sprints for sprints 1 - 14 and 15 - 20. HH = hot humid; HD = hot dry; TEMP = temperate.

153
Figure 5.2. Mean (± S.D.) Peak Power Output during the CISP in HH, (hot humid) HD (hot
dry) and TEMP (temperate) (sprints 1-14 n = 11; sprints 15-20 n = 8). *Significant
difference from sprint 4 in HH (P < 0.05). †Significant difference from sprint 5 in HD (P <
0.05). ‡Significantly different from sprint 3 in TEMP (P < 0.05).
Work done was not different between conditions in sprints 1-14 (F(2,20) = 1.026, P = 0.377,
ηp2 = 0.093, Table 5.2.) or 15-20 (F(2,14) = 1.478, P = 0.262, ηp
2 = 0.174, Table 5.2.). Over
time, HH reduced work done by 10% from sprint 17 compared to sprint 2 (all P values <
0.05). In HD an 8% reduction occurred from sprint 15 compared to sprint 5 and in TEMP, a
6% reduction was evident from sprint 17 compared to sprint 3 (all P values < 0.05).
5.4.4.2. Physiological variables
Mean Tre in sprints 1-14 was not different between conditions (F(2,20) = 2.550, P = 0.103,
ηp2 = 0.203, Table 5.3.) and there was no effect of training state (F(1,26) = 0.003, P = 0.957,
ηp2 = 0.000). Mean Tre differed over time (F(13,130) = 156.569, P < 0.001, ηp
2 = 0.940) and
there was a significant interaction (F(26,260) = 3.881, P < 0.001, ηp2 = 0.280, Figure 5.3.).
Post hoc analysis revealed Tre was different only between HH and TEMP from sprint 13 (all

154
P values < 0.05). In sprints 15-20 there was an effect of environment (F(2,14) = 11.503, P =
0.001, ηp2 = 0.622), time (F(5,35) = 75.958, P < 0.001, ηp
2 = 0.916) and a significant
interaction (F(10,70) = 6.781, P < 0.001, ηp2 = 0.492). Follow up analysis revealed no
difference in Tre between hot trials but a higher mean Tre was evident in HH compared to
TEMP from sprint 15 (all P values < 0.05, Figure 5.3.) and in HD compared to TEMP from
sprint 17 (all P values < 0.05, Figure 5.3.). Tre did not differ in sprints 15-20 based on
training state (F(1,10) = 2.085, P = 0.179, ηp2 = 0.172).

155
Table 5.3 Peak and mean physiological and perceptual measures during the CISP in HH, HD and TEMP.
Sprints 1 - 14 HH
HD
TEMP
Sprints 15 - 20 HH
HD
TEMP
Tre Peak (°C) - - - 39.1 ± 0.5† 38.9 ± 0.5† 38.5 ± 0.2
Tre mean (°C) 38.1 ± 0.5 37.9 ± 0.5 37.9 ± 0.3 38.9 ± 0.4† 38.7 ± 0.4 38.4 ± 0.2
sk mean (°C) 36.04 ± 0.7‡ 37.1 ± 0.8‡ 31.3 ± 1.9‡ 36.4 ± 0.6‡ 37.3 ± 0.9‡ 31.9 ± 1.8‡
HRmean (b.min-1) 162 ± 19† 158 ± 16† 147 ± 19 176 ± 12† 171 ± 11† 154 ± 15
[Bla]mean (mM) 4.0 ± 1.6 4.2 ± 1.8 4.2 ± 1.8 3.8 ± 1.6 4.3 ± 1.8 4.3 ± 1.9
VO2mean (L.min-1) 2.3 ± 0.2 2.2 ± 0.3 2.2 ± 0.2 2.2 ± 0.2 2.2 ± 0.3 2.3 ± 0.3
BHC (kJ) 10495 ± 1463† 10536 ± 1474† 10203 ± 1449 102 9 † 102 6 9 † 9913 ± 979
PSI Peak - - - 9 ± 1† 8 ± 2 7 ± 1
PSI mean 6 ± 2† 5 ± 2 5 ± 1 8 ± 1† 7 ± 2 6 ± 1
RPE Peak - - - 18 ± 2† 17 ± 2 15 ± 2
RPE mean 14 ± 3† 13 ± 3 12 ± 2 18 ± 2† 16 ± 2 15 ± 1
TSen Peak - - - 7 ± 1† 7 ± 1† 6 ± 1
TSen mean 6 ± 1† 6 ± 1† 5 ± 1 7 ± 1† 7 ± 1† 6 ± 1
Data are mean ± S.D. (sprint 1 – 14 N = 11; sprints 15 – 20 N = 8). HH = hot humid; HD = hot dry; TEMP = temperate; RPE = rating of perceived exertion; TSen herma en ation PS Phy io ogica train inde 2 = Oxygen consumption. Peak values are those recorded in the final 2 minute block of the CISP. †Significant difference from TEMP (P < 0.05). ‡ Significant difference between a condition .

156
Figure 5.3. Mean (± S.D.) rectal temperature and weighted skin temperature during the
CISP in HH (hot humid), HD (hot dry) and TEMP (temperate). *Significant difference
between HH and TEMP (P < 0.05). †Significant difference between HD and TEMP (P <
0.05). ‡Significant difference between all conditions (sprints 1-14 and 15-20, P < 0.05).
sk was different between conditions in sprints 1-14 (F(2,20) = 133.995, P < 0.001, ηp2=
0.931, Table 5.3). There was a main effect of time (F(13,130) = 20.888, P < 0.001, ηp2= 0.676)
and a significant interaction (F(26,260) = 4.455, P < 0.001, ηp2= 0.308, Fig re .3.). Fo ow
ana y i revea ed sk was different between conditions from sprint one (all P va e
0.0 , Fig re .3.). sk in sprint 15-20 was different between conditions (F(2,14) = 74.714, P <
0.001, ηp2= 0.914, Table 5.3.) and there was a main effect of time (F(5,35) = 7.187, P <
0.001, ηp2= 0.507, Fig re .3.). Fo ow ana y i revea ed sk was different between
conditions from sprint 15 (all P values < 0.05, Figure 5.3.).
HR in sprints 1-14 was different between conditions (F(2,20) = 20.395, P < 0.001, ηp2= 0.671,
Table 5.3). There was a main effect of time (F(13,130) = 64.250, P < 0.001, ηp2= 0.865) and a

157
significant interaction (F(26,260) = 2.585, P < 0.001, ηp2= 0.205, Figure. 5.4.). Follow up
analysis revealed HR was not different between hot trials, but HH was different to TEMP
from sprint 4 (all P values < 0.05) and HD from sprint 9 (all P values < 0.05). In sprints 15-
20 there was a main effect of environment (F(2,14) = 25.768, P < 0.001, ηp2 = 0.786), time
(F(5,35) = 7.149, P < 0.001, ηp2 = 0.505) and interaction (F(10,70) = 1.985, P < 0.05, ηp
2 =
0.181). Follow up analysis revealed HR was similar in HH and HD (all P values < 0.05), but
higher than TEMP (all P values < 0.01). Over time HR was greater in HH from sprint 4 (all P
values < 0.05) and in both HD and TEMP from sprint 5 (all P values < 0.05).
Figure 5.4. Mean (± S.D.) heart rate during the CISP in HH (hot humid), HD (hot dry) and
TEMP (temperate) (sprints 1-14 n = 11; sprints 15-20 n = 8) *Significant difference
between HH and TEMP (P < 0.05).†Significant difference between HD and TEMP (P < 0.05).
PSI in sprints 1-14 displayed a significant main effect of environment (F(2,20) = 6.594, P =
0.006, ηp2 = 0.397, Table 5.3.), time (F(13,130) = 119.771, P < 0.001, ηp
2 = 0.923) and
interaction (F(26,260) = 4.429, P < 0.001, ηp2 = 0.307). Follow up analysis revealed PSI was
higher in HH compared to TEMP from sprint 7 (all P values > 0.05) but was not different

158
between hot trials or HD and TEMP (all P values < 0.05). PSI in sprints 15-20 was different
between conditions (F(2,14) = 8.997, P = 0.003, ηp2 = 0.562, Table 5.3.), time (F(5,35) =
45.031, P < 0.001, ηp2 = 0.865) and interaction (F(10,70) = 3.239, P = 0.002, ηp
2 = 0.316).
Follow up analysis revealed PSI was different only between HH and TEMP (all P values <
0.05).
BHC in sprints 1-14 was different between conditions (F(2,20) = 89.276, P < 0.001, ηp2=
0.899) and there was a significant main effect of time and (F(13,130) = 136.439, P < 0.001,
ηp2= 0.932) interaction (F(26,260) = 1.809, P = 0.011, ηp
2= 0.153). Follow up analysis revealed
that BHC was different between hot trials in the first three sprints only (all P values <
0.05) but both were greater than TEMP from sprint one (all P values < 0.01). In sprints 15-
20 there was a significant main effect of environment (F(2,14) = 89.390, P < 0.001, ηp2=
0.927), time (F(5,35) = 72.108, P < 0.001, ηp2= 0.912) and interaction (F(10,70) = 2.590, P <
0.05, ηp2= 0.223) on BHC. Follow up analysis revealed that BHC was not different between
hot trials, but both were different to TEMP (all P values < 0.001).
There was no difference between conditions in blood lactate (F(2,20) = 0.348, P = 0.710, ηp2
= 0.034; Table 5.3.) or oxygen uptake (F(2,20) = 0.448 P = 0.645, ηp2 = 0.043, Table 5.3.)
during the CISP. A similar decrease in nude body mass was observed in HH and HD pre
and post CISP (1.2 ± 0.3 kg and 1.0 ± 0.2 kg, P > 0.05) and this was greater than TEMP (0.6
± 0.1 kg, P < 0.01).
5.4.4.3. Perceptual measures
In sprints 1-14 there was a significant main effect of environment (F(2,20) = 11.075, P =
0.001, ηp2= 0.526, Table 5.3.) and time (F(13,130) = 57.832, P < 0.001, ηp
2= 0.853) on RPE and
a significant interaction (F(26,260) = 8.180, P < 0.001, ηp2= 0.450). Follow up analysis
revealed RPE was different only between HH and TEMP from sprints 5-14 (all P values <
0.05). In sprints 15-20 there was a significant main effect of environment (F(2,14) = 17.250,

159
P < 0.001, ηp2= 0.711), time (F(5,35) = 17.347, P < 0.001, ηp
2= 0.712) and interaction (F(10,70)
= 2.949, P < 0.05, ηp2= 0.296) on RPE. Follow up analysis revealed RPE was different
between HH and TEMP only (all P values < 0.05). Peak RPE was higher in HH compared to
HD and TEMP only (P < 0.05). Mean and peak Tsen were not different between hot trials (P
> 0.05), but both hot conditions were greater than TEMP (P < 0.05, Table 5.3.).
5.5. Discussion
The main finding of this study was that intermittent-sprint performance and physiological
strain were not different in hot humid and hot dry environments matched for heat stress.
While variability in power output could have prevented detection of performance
differences between environments, previous research examining the effect of HH and HD
environments matched for heat stress on repeated-sprint performance has demonstrated
similar findings using similar participants and a smaller sample size (Backx et al., 2000). As
such, it may be suggested that when intermittent sprinting using exercise-rest ratios
representative of team-sports is completed for 40 minutes in a hot environment, the
composition of thermal factors comprising the overall heat stress does not differentially
impact performance.
Previous research has identified aerobic fitness as an important determinant of
thermoregulatory capacity in the heat (Mora-Rodriguez, 2012). Trained individuals display
improved heat dissipation and tolerance due to reduced thresholds for vasodilation and
sweating (Mora-Rodriguez, 2012). It is conceivable therefore, that variability in
artici ant ’ aerobic fitne may have contrib ted to the ac of difference between
conditions. However, when data were analysed based on aerobic fitness no difference
was observed in PPO or PSI between groups.

160
PPO and work done in the current study was not significantly different between hot and
control trials. The extent of hyperthermia induced may explain this. Research has
identified reduced voluntary activation and impaired performance in the heat due to
increased Tre and demonstrated the extent of reduction in voluntary activation is
dependent on the increase in Tre (Nybo and Nielsen, 2001a; Morrison et al., 2004).
Consequently, when exercise in a hot trial has induced a marked hyperthermia (> 39.1°C)
compared to control, a significant difference has been observed in performance between
conditions (Drust et al., 2005; Sunderland et al., 2005). Conversely, when exercise has
been performed in the heat without marked differences in hyperthermia between
conditions, performance has not been different between trials (Almudehki et al., 2012).
Therefore, in the current investigation lack of difference in PPO between conditions may
be due to the extent of hyperthermia induced during hot and temperate trials (HH, 38.3 ±
0.5°C; HD, 38.2 ± 0.5°C, TEMP, 38.1 ± 0.3°C).
Performance between trials in the current study was not different. However, while all
eleven participants completed the CISP in TEMP, three failed to complete the full protocol
of twenty sprints in hot trials. Two of these participants had the greatest body mass (kg),
body surface area (m2) and percent body fat of the sample and the greatest rate of
increase in body heat content during all CISPs (14.8 kJ.min-1 vs. 9.1 kJ.min-1). It has been
suggested larger athletes select lower exercise intensities in self-paced running in the
heat to ensure optimal heat storage and prevent dangerous hyperthermia (Marino et al.,
2004). As the CISP is not self-paced it may be the fixed intensity in recovery elicited the
greater rates of heat storage in the heavier participants, greater physiological strain and
consequently, premature cessation of exercise. The final participant unable to complete
exercise in hot trials had the second largest absolute 2peak (4.19 L.min-1) and the highest
metabolic heat production of the whole sample (493 W.m2 vs. 384 W.m2). Greater heat
rod ction e i t in end rance trained ath ete d ring fi ed inten ity e erci e d e to
e erci ing at a higher ab o te 2 compared to ntrained ora- odrig ez, 2012).
According y, for thi artici ant it may be that e erci e at 3 2peak evoked greater
metabolic heat production that, in the hot trials, negated the improved heat dissipation

161
mechanisms and produced greater physiological strain, necessitating early cessation of
exercise.
Over time PPO declined 6 - 8% in all conditions. The typical error for PPO in the CISP has
been reported as 2.9% and as such, the reductions observed in this study represent a
meaningful change requiring examination (chapter four). Recently, it has been proposed
that impaired performance in the heat may be due to cardiovascular strain rather than
ne rom c ar factor Che vront et a ., 2010). n hot environment sk i e evated and
the gradient for dry heat tran fer i red ced Gonza ez-A on o, 2012). So, it i arg ed that
when sk is high the function of a rising Tre is to maintain a favourable gradient and reduce
skin blood flow requirements for heat loss (Cheuvront et al., 2010). However, during
exercise in the heat increases in Tre and sk cause a reflex increase in skin blood flow that
is proportional to the reduction in Tre-Tsk gradient and may decrease venous return and
cardiac output (Cheuvront et al., 2010; Gonzalez-Alonso, 2012). As vascular conductance
is maintained in active tissue in maximal exercise any reduction in cardiac output may
generate a perfusion issue and an increase in the relative exercise intensity that may
reduce performance in the heat Che vront et a ., 2010). n the c rrent inve tigation, sk
was significantly higher in HD compared to HH and both were significantly higher than
TEMP. Additionally, the Tre-Tsk gradient was reduced in hot compared to control (2.2°C in
HH, 1°C in HD and 6.5°C in TEMP). It is conceivable this resulted in increased in b ood
f ow, a red ced cardiac o t t and increa ed re ative e erci e inten ity contrib ting to
the red ction in erformance. hi e thi i orted by the higher heart rate ob erved
in hot tria com ared to P, the ac of difference in 2 or lactate does not lend
support to the suggestion of a cardiovascular strain mediated reduction in performance
independent of a high Tre. Alternately, it has been demonstrated that passive
hyperthermia significantly reduces voluntary root mean square electromyography
amplitude of active muscle at all increments in Tre > 0.5°C above baseline and that force
production is impaired after Tre is increased > 1°C (Ross et al., 2012). Although not
measured in the current investigation, in view of the increases in Tre during the CISP (HH +
1.6°C; HD, + 1.4°C; TEMP, + 1.1°C) and a lack of difference in metabolism, it is possible
reductions in performance resulted from impaired central and voluntary drive due in part

162
to reductions in middle cerebral artery blood flow and impaired cerebral heat dissipation
(Nybo and Nielsen, 2001a; Racinais et al., 2007).
5.5.1. Conclusion
The current study is the first to examine the effect of hot humid and hot dry
environments, matched for heat stress, on intermittent-sprint exercise similar to that
observed in team-sports. Data indicate intermittent-sprint performance is impaired, but
not different in hot humid compared to hot dry conditions when heat stress is similar. The
current work illustrates the need for heat acclimation for games players when competing
in hot environments. However, evidence suggests that while the overall heat load in
acclimation should match expected competition conditions the composition of thermal
factors constituting the heat stress is not a primary concern for intermittent-sprint
athletes. The work is limited to forty minutes, approximating one half of a field-based
team-sport. Further research is necessary to determine the effect of hot humid and hot
dry environment , matched for heat tre , on the ‘ econd ha f’ of a team-game.

163
CHAPTER VI. PHYSIOLOGICAL AND PERCEPTUAL RESPONSES TO PROGRESSIVE
COMPARED TO TRADITIONAL HEAT ACCLIMATION AND THE EFFECT ON INTERMITTENT-
SPRINT EXERCISE IN A HOT ENVIRONMENT
6.1. Abstract
The main aim of this study was to compare physiological and perceptual adaptation to
heat acclimation from a progressive model of acclimation that targets external heat stress
to maintain physiological strain to those achieved using a traditional model. A secondary
aim was to investigate the effect of progressive heat acclimation on physiological,
perceptual and performance responses during forty minutes of intermittent-sprint
exercise in 33°C 50% rh. Twenty four University games players matched for 2peak,
peak power and body surface area were divided into three groups; progressive heat
acclimation [PA, 4 d 30°C 50% relative humidity (rh), 4 d 33°C 53% RH and 4 d 35°C 60%
rh], traditional heat acclimation (TA, 12 d 33°C 56% rh), and training (TG 12 d 19°C 36%
rh). Pre and post acclimation, participants completed a 40 minute cycling intermittent
sprint protocol (CISP) in 33°C 50% rh, comprising twenty, 5 s sprints. Resting heart rate
over day one to twelve was reduced by both acclimation regimes (P < 0.05) but not TG (P
> 0.05) and resting Tre displayed a tendency to decline (P > 0.05). Mean exercise heart
rate across day one to twelve tended to decline (P > 0.05) but peak heart rate was
significantly reduced by TA and TG (P < 0.05). Further, mean and peak exercise Tre were
reduced by TA and TG by day twelve (P < 0.05). Consistent with elevated heat stress and
physiological strain during PA, mean and peak exercise heart rate was unchanged across
day one to twelve and mean exercise Tre was significantly higher on day twelve compared
to six. Sweat rate was increased by day six in TA (P < 0.05), day twelve in PA (P < 0.05) but
not TG (P > 0.05). Resting heart rate and Tre were not significantly different prior to CISP 2
but tended to decline in PA and TA. During CISP 2 mean heart rate and Tre were reduced
by both acclimation regimes (P < 0.05) and peak Tre wa ignificant y red ced by a
regime P 0.0 ). n addition, d ring C SP 2 sk and body were reduced by both
acclimation regimes (P < 0.05) but not TG (P > 0.05). Both acclimation regimes also

164
reduced RPE and Tsen during CISP 2 (P < 0.05) but TG had no effect (P > 0.05). Finally, PPO
was reduced by 19, 6 and 8% in TA, TG and PA during CISP 1 and was strongly negatively
correlated with exercise Tre for both acclimation regimes (r > 0.90, P < 0.001). TA
increased PPO in CISP 2 and ameliorated the strong negative correlation between this
measure and Tre but no such response was observed for PA and TG. Based on the ability
to evoke classic acclimation responses compared to TA, PA was judged an effective
method for conferring the heat acclimated phenotype. However, while evidence suggests
the current design maintained physiological strain during the acclimation regime, the
degree of strain was possibly insufficient to elicit a maximal acclimation response.
6.2. Introduction
Hyperthermia impairs intermittent-sprint performance under conditions of heat stress
(Maxwell et al.,1996; Morris et al., 2000; Drust et al., 2005). Heat acclimation is
frequently used to combat this decline and regimes can be grouped into three types;
constant work rate, self-regulated exercise and isothermal strain (Taylor, 2000). Constant
work rate protocols, whereby participants are required to exercise at a fixed rate over a
specific number of days, represent the traditional model of heat acclimation and are the
most frequently used (Taylor, 2000). However, with constant work rates the heat strain in
subsequent exposures progressively declines across the protocol and therefore, the
potential of this method to elicit maximal heat adaptation is questionable (Taylor, 2000).
Similarly, with constant work rate protocols there is increased potential for participant
drop-out as exposure to high levels of heat stress occurs early, promoting rapid elevations
in core temperature, premature cessation of acclimation sessions and potential
incomplete adaptation to the heat (Garden et al., 1966; Wyndham et al., 1976; Horstman
et al., 1982; Febbraio et al., 1994).
Self-regulated heat acclimation protocols counter participant drop-out and permit
complete participation in initial sessions through self-selection of work rates, but

165
application of this type of protocol in a research environment is limited due to the
variable exercise intensities used (Taylor, 2000). Similarly, isothermal strain regimes
evoke heat acclimation by elevating all participants to a pre-determined ‘critica ’ core
temperature (Taylor, 2000; Garrett et al., 2012) and maintaining it by modifying work-
load throughout the session. Based on the premise that attainment and maintenance of
an elevated core temperature above the sweating threshold is central to effective heat
acclimation, this model may offer more complete adaptation to the heat (Taylor et al.,
2000) compared to other models. Currently, however, there is limited evidence
comparing isothermal with traditional methods of heat acclimation and therefore, it is
difficult to verify whether isothermal heat acclimation is a superior method or confers
additional benefit beyond more traditional methods. In addition, inter-individual
differences in the work required to elicit a target core temperature and maintain it due
to, for example, heat tolerance or training status, may evoke different physiological
responses in, for example, immune function and promote over-reaching. Further,
although increasing (Garrett et al., 2012), there is limited empirical evidence directly
investigating the performance benefits of isothermal heat acclimation against other
methods.
Heat acclimation adaptation exhibits a biphasic response pattern. Two-thirds to 75% of
physiological adaptation is achieved within 4 - 6 days, while complete sudomotor function
alteration necessitates up to fourteen days (Armstrong and Maresh, 1991; Pandolf, 1998).
Consequently, despite possible limitations with constant work rate protocols, the majority
of earlier literature on heat acclimation proposed exercise at a fixed intensity for a set
duration in a controlled environment (e.g. 60 - 90 mins.d-1 for 10 - 1 day at 0
2max), as the most effective means of eliciting complete adaptation to the heat (Nadel
et al., 1974; Horstman 1982; King 1985; Armstrong and Dziados, 1986).
Evidence suggests the time course of adaptation and decay for some physiological
markers of heat acclimation may reflect a protocol-dependent limit as opposed to a true
maximal physiological response. With constant work rate protocols where physiological

166
strain is reduced across time, a decline in plasma volume towards baseline by the end of
the protocol is observed. However, maintenance of expansion for up to 22 days has also
been reported when an isothermal strain protocol (Patterson et al., 2004) that provides a
progressive stimulus has been used, highlighting the need for further research using
alternate heat acclimation methods.
There is limited research on the efficacy of alternate heat acclimation protocols on
exercise performance in the heat. Earlier work focused primarily on the impact of altered
exercise intensity and duration, or the effect of continuous versus intermittent protocols
on acclimation responses (Fein, 1975; Houmard et al., 1990; Aoyagi et al., 1995; Gill et al.,
2001 ’ Brien et a ., 200 ). S ch inve tigation rod ced conf icting re t and rimarily
examined benefits to continuous exercise. More recently, research has identified a
beneficial effect from short-term heat acclimation protocols for intermittent exercise
(Sunderland 2008; Peterson et al., 2010; Brade et al., 2013), however, variation in the
extent of adaptation was observed. Considering greater thermal strain has been
identified in intermittent compared to continuous exercise (Nevill et al. 1995), there is a
need for further research into optimising heat acclimation for intermittent-sprint exercise
using non-traditional protocols designed to maximise adaptation and minimise
participant drop-out. It is inviting to speculate that progressive heat acclimation, where
thermal load is increased over the duration of the heat acclimation protocol by alteration
of environmental conditions, may provide a progressive, more complete thermal stimulus
that can optimise exercise performance in the heat.
Progressive heat acclimation, where environmental conditions are altered throughout the
acclimation period has received little attention in the literature. Daanen et al., (2011)
used a 2-stage heat acclimation protocol of constant work and incremental exercise for 9
days at 35°C 29% rh followed by 3 days at 41°C and 33% rh, but reported no beneficial
effect of the increase in thermal load on physiological markers of heat acclimation
possibly owing to the protocol design whereby a nine day constant work-rate method
preceded a brief three day progression to a higher heat stress. In this context, the two

167
step progression coupled with the brevity of exposure to higher heat stress may have
been insufficient to elicit adaptation. In contrast, Costa et al., (2014) recently
demonstrated a beneficial effect of progressive heat acclimation in ultra endurance
athletes. When three 2 hour treadmill r nning e ion at 60 2max were completed in
30°C followed by three in 35°C, additional significant improvements in Tre, HR and thermal
comfort were reported with exposure at 35°C (Costa et al., 2014). Further, comparative
evidence from intermittent hypoxic acclimation also suggests a positive effect of
progressive heat acclimation. Hamlin and Hellemans, (2007) exposed twenty-two multi-
sport endurance athletes to 90 minutes of intermittent normobaric hypoxic exposure at
rest versus 90 minutes of placebo exposure at rest for 15 days over a 3-week period.
Fraction of inspired oxygen in the hypoxic gas decreased from 13% in week one to 10% by
week three. Results showed 3-km run time decreased by 1.7% two days after, and by
2.3% seventeen days after the last hypoxic episode in the training relative to the placebo
group. In addition, relative to the placebo group, the training group increased reticulocyte
count two days (23.5%) and twelve days post-exposure. Considering the reported positive
effect of progressive hypoxic acclimation coupled with the potential practical
applications, a progressive model of heat acclimation could offer an alternative and
indeed, more thermally-balanced model to existing models of heat acclimation.
The objectives of this study were to examine physiological and perceptual adaptation to
heat acclimation using a progressive protocol compared to a traditional model and to
investigate the effect of progressive heat acclimation on physiological, perceptual and
performance responses during forty minutes of intermittent-sprint exercise in 33°C 50%
rh. This is the first study to use a progressive heat acclimation model whereby
physiological and thermal strain was elevated throughout the protocol by stepwise
increases in heat stress on two occasions during acclimation. It was hypothesised a
progressive heat acclimation model with stepwise increases in heat stress would,
compared to a traditional model, evoke similar adaptations to the heat and prove a valid
alternative heat acclimation protocol. In addition, it was hypothesised that progressive
heat acclimation would improve perceptual and physiological responses during

168
intermittent sprinting in the heat and ameliorate heat induced decrements in
performance.
6.3. Methods
6.3.1. Participants
wenty fo r niver ity t dent twenty two ma e, two fema e) who were game ayer
and artici ated in ort three to five time er wee vo nteered for the t dy.
Partici ant were random y a igned to one of three gro , matched for 2peak, body
surface area (BSA), and experience of the CISP, [(Traditional Acclimation - TA, n = 6, 20.5 ±
0.3 years, 177.3 ± 2.4 cm, 74.9 ± 4.2 kg, BSA = 1.91 ± 0.05 m2, 42.2 ± 2.4 ml.kg-1.min-1)
(Progressive Acclimation - PA, n = 9, 20.5 ± 1.5 years, 179.1 ± 2.7 cm, 71.1 ± 3.8 kg, BSA =
1.89 ±0.06 m2, 46.9 ± 2.7 ml.kg-1.min-1) (Training Group - TG, n = 9, 21.6 ± 1.5 years, 175.2
± 5.6 cm, 73.8 ± 5.9 kg, BSA = 1.89 ± 0.10 m2, 47.7 ± 3.3 ml.kg-1.min-1)]. All participants
were informed as to the demands, risks and benefits and gave written informed consent
to participate in the study that was approved by the University Research Ethics and
Governance committee and conducted in accordance with the Declaration of Helsinki
(2008).
6.3.2. Environments
Three differing environments were compared in this study with the TA and PA groups
matched for overall heat stress. For TA the 12 day acclimation programme was completed
at 33.0 ± 0.4°C and 56.0 ± % rh. In PA, environmental conditions were elevated on two
occasions to increase heat stress. On day 1 - 4 of PA participants exercised at 29.1 ± 3.4°C
and 54.3 ± 6.7% rh. On day 5 - 8 environmental conditions were set at 33.1 ± 0.5°C and
52.9 ± 3.8% rh and on day 9 - 12 at 34.6 ± 4.2°C and 60.5 ± 2.8% rh. For TG all sessions
were at 19.0 ± 1.6°C and 36.4 ± 1.4% rh.

169
6.3.3. Experimental design
Each participant was required to visit the laboratory on fifteen separate occasions
(Figure. 6.1.). This included one preliminary trial, a pre and post CISP in 33 ± 0.2°C, 50 ±
3% rh and on day 2 - 7 and 9 - 14 inclusive, 12 days of training or acclimation (60 minutes
at 50% O2peak) depending on the group they had been assigned to. All trials for each
artici ant were com eted in ≤ 21 day . A te ting wa com eted between ctober
and December to minimize the potential for natural heat acclimatization and all main
trials were completed at the same time of day to minimize the influence of circadian
variation (Winget et al., 1985; Hill et al., 1992).

170
Figure 6.1. Schematic of experimental design with measurements.
6.3.3.1. Preliminary visit
Prior to main trials, each participant completed a preliminary visit including
anthropometric assessment, a peak oxygen consumption test and a CISP practice. Height
was recorded to within 0.1 cm in the Frankfurt plane using a beam scale, body mass was
measured to within 0.1 kg using a standard laboratory scales (SECA, UK) and body surface
area was calculated using the method of Dubois and Dubois (1916). Percentage body fat
was determined from four sites (Tricep, Bicep, Suprailium, Subscapular) using skinfold
calipers (Harpenden Instruments, West Sussex, UK) as described by Durnin and
Womersley (1974) and the equations of Siri (1961) (section 3.6.).
Lactate threshold and peak oxygen consumption was determined for each participant
using a graded exercise test on one of two modified cycle ergometers (Monark 620
Ergomedic, Sweden, with SRM power cranks (SRM; scientific model, Julick, Germany);
Monark Ergomedic 874E with SRM power cranks (SRM; FSA Gossamer standard, Julick,
Germany)) (section 3.5.1. & 3.6.). 25 ± 5 minutes after cessation of the graded exercise
test all participants completed a CISP practice (section 3.6.).

171
6.3.3.1.1. Cycling Intermittent-Sprint Protocol
Pre and o t acc imation or training 1 day) a artici ant com eted the C SP ection
3.7.), on one of the modified Monark cycle ergometers (section 3.5.1.), at the same time
of day in an environmental chamber at 33.0 ± 0.2°C, 50.0 ± 3% rh. Peak power output
(PPO), mean power output (MPO) and work done were recorded and determined as
described in section 3.5.1.
Prior to main trials all participants were requested to follow standard pre-trial
preparation guidelines for diet, exercise and hydration (section 3.4.). On arrival at the
laboratory nude body mass and hydration status were assessed (section 3.8.). Participants
were prepared for measurement of rectal temperature (Tre) and in tem erat re sk)
and resting values recorded (section 3.10.4). A resting blood sample was obtained from a
hyperemized finger for lactate concentration (section 3.11.) and resting heart rate was
determined (section 3.10.1). On completion of resting measures and immediately prior to
entering the environmental chamber, a Tegaderm sweat patch (HFL Sport Science
Limited, Fordham, Cambridgeshire, UK) was applied between the shoulder blades of each
participant for the analysis of Na, K, and Cl- concentrations in sweat over the duration of
the CISP.
On entering the chamber participants completed the CISP warm-up and the CISP (section
3.6 and 3.7). Thermoregulatory, perceptual and heart rate measures were recorded every
two minutes (section 3.7., 3.10.) during the CISP. Every fourth two minute block of the
CISP, arterialised whole blood samples were collected from a hyperemised finger and
expired air sampled (section 3.6., 3.11.). On completion of the CISP, or if participants felt
unable to continue, or reached a critical core temperature, they were removed from the
chamber and monitored until suitably recovered (section 3.2.). Post CISP, prior to
administering fluid in recovery weight loss was determined (3.10.5.) and the Tegaderm
sweat patch removed and placed in a 10 ml syringe (Becton, Dickson & company, San
Augustin del Guadalix, Spain) The sample was then transferred to a 2 ml micro tube

172
(Sarstedt, Germany) and immediately frozen at -18°C for analysis (HFL Sport Science Ltd.,
Fordham, Cambridgeshire). Defrosted samples were analysed in a Beckman chemistry
analyser (AU640, Beckman coulter INC, Japan) via an ion selective electrode. The ion
selective electrode measured the potential of a specific ion in solution against a stable
reference electrode of constant potential. The potential difference between the
electrodes depended upon the activity of the ion in solution and was directly related to
concentration of that ion (HFL Sport Science Ltd., Fordham, Cambridgeshire).
6.3.3.2. Acclimation
All participants completed 12 days of HA or training, 60 min.d-1 at 0 O2peak, in the
appropriate environmental conditions depending on the group they had been assigned
to. Prior to main trials all participants were requested to follow standard pre-trial
preparation guidelines for diet, exercise and hydration (section 3.4.) and all heat
acclimation sessions were conducted at the same time of day for each participant.
n arriva to the aboratory, artici ant ’ ba e ine mea re were obtained a n de body
mass, hydration status, resting rectal temperature and heart rate were measured in every
session after 15 minutes rest (section 3.8. & 3.10.). During all acclimation and training
sessions rectal temperature, heart rate, thermal sensation and RPE were recorded in the
final 20 s of every fifth minute. On day 1, 6 and 12 of acclimation and training, a 20 ml
venous blood sample was obtained pre and post exercise for analysis of aldosterone,
cortisol, haemoglobin and haematocrit (section 3.11., 3.12.1 & 3.12.2).
6.3.4. Statistical analysis
Data were checked for normality and sphericity and adjusted where necessary using the
Huynh-Fe dt method. n addition, if Levene’ te t indicated the a m tion of homogenity
of variance was violated data were log transformed. Physiological responses to twelve
days PA, TA or TG and intermittent-sprint exercise were assessed using a three way mixed
173
ANOVA (regime*day*time) with repeated measures on two factors (day*time). Peak
physiological responses during acclimation and intermittent-sprinting were assessed
using a two-way mixed ANOVA (regime*day) with repeated measures on one factor (day).
Non parametric perceptual measures were assessed using a Kruskal Wallis test with
Wilcoxon signed rank test. All data were analysed using SPSS (version 20.0) and are
reported as mean ± standard deviation. Statistical significance was accepted as P < 0.05.
Effect sizes were calculated as described in section 3.13.
6.4. Results
6.4.1. Physiological and perceptual responses to twelve days of heat acclimation or
training
6.4.1.1. Body mass and hydration
Pre-exercise body mass and hydration status were not different between days in any
group (P > 0.05), indicating participants were in a similar physiological state prior to
exercise on day one, six and twelve. Venous blood for hormone analysis and sweat
samples was collected from six participants in each group only due to material
constraints.
6.4.1.2 Rectal temperature
Resting Tre decreased over time (main effect: F(2,42) 10.995, P < 0.001, ηp2 = 0.343) but,
despite reductions of 0.3, 0.2 and 0.3°C in TA, PA and TG, respectively, no significant
interaction (main effect regime*day: F(4,42) 2.115, P = 0.096, ηp2 = 0.168, Table 6.1.)
resulted. Exercise Tre was reduced across days (main effect day: F(2,42) 9.127, P = 0.001, ηp2
= 0.303) and there was a significant interaction (main effect regime*day: F(4,42) 3.502, P =
0.018, ηp2 = 0.250). Exercise Tre in TA and TG was reduced 0.45 and 0.33°C on day twelve
compared to one (all P values < 0.05), but exercise Tre in PA was not different (P > 0.05),

174
consistent with the elevated heat stress of the progressive protocol. During exercise Tre
increased in all conditions (main effect: F(11,231) 185.957, P < 0.001, ηp2 = 0.899), was
significantly higher in PA and TA compared to TG on day twelve from 40 minutes onwards
and significantly higher in TA compared to TG on day one from 50 minutes onwards (main
effect day*time*regime: F(44,462) 3.598, P = 0.003, ηp2 = 0.255). Peak exercise Tre was
reduced by TA (0.53°C) and TG (0.4°C) on day twelve (Table 6.1.). In PA, consistent with
elevated heat stress, peak Tre on day twelve was 0.3°C higher compared to day six (main
effect regime*day: F(4,42) 5.255 P = 0.002, ηp2 = 0.334; Post Hoc, all P values < 0.05, Table
6.1.).
6.4.1.3 Heart rate
Resting heart rate on day one, six and twelve was reduced (main effect: F(2,42) 4.994, P <
0.001, ηp2 = 0.428) and there was a significant interaction (main effect regime*day: F(4,42)
2.681, P = 0.045, ηp2 = 0.211). Resting heart rate (b.min-1) in TA decreased 11 b.min-1 by
day six (P < 0.05) and no further reductions were observed by day twelve (Table 6.1.).
Similarly, resting heart rate in PA was reduced 13 b.min-1 by day six (76 ± 9 vs. 63 ± 6, P <
0.05) and did not decline any further by day twelve (Table 6.1.). In TG resting heart rate
was not different over days one to twelve (P > 0.05). Exercise heart rate was reduced in
TA, PA and TG by 15 b.min-1, 6 b.min-1 and 14 b.min-1 respectively from day one to twelve,
but was not different across days within regimes (main effect regime*day: F(4,42) 1.655, P
= 0.180, ηp2 = 0.142). Peak exercise heart rate was reduced across days (main effect day:
F(2,42) 17.044, P < 0.001, ηp2 = 0.460) and there was a significant interaction (main effect
regime*day: F(4,42) 3.006 P = 0.029, ηp2 = 0.231). TA reduced peak heart rate 12 and 18
b.min-1 by day six and twelve, respectively (all P values < 0.05). In PA peak heart rate was
not different across days, consistent with the elevated heat stress (all P values > 0.05) and
in TG a significant reduction of 18 b.min-1 in peak heart rate occurred by day twelve (all P
values < 0.05). On day one peak heart rate was significantly higher in TA compared to TG
and on day twelve, both TA and PA produced higher end exercise heart rates (all P values
< 0.05, Table 6.1.).

175
Table 6.1. Physiological responses to twelve days of TA, PA and TG.
Day 1 Day 6 Day 12
Resting HR (b.min-1) TA 76 ± 8 65 ± 7* 65 ± 6*
PA 76 ± 9 63 ± 6* 64 ± 5*
TG 71 ± 28 74 ± 25 69 ± 17
Exercise HR (b.min-1)
TA 163 ± 14 155 ± 13 148 ± 12
PA 162 ± 19 156 ± 15 156 ± 14
TG 147 ± 19 145 ± 19 133 ± 11
Peak HR (b.min-1)
TA 179 ± 7 167 ± 8* 162 ± 9*#
PA 173 ± 18 167 ± 12 170 ± 11+
TG 156 ± 18# 149 ± 16 138 10*†
Resting Tre (°C)
TA 37.2 ± 0.4 36.9 ± 0.4 36.9 ± 0.3
PA 37.2 ± 0.3 37.0 ± 0.6 37.0 ± 0.4
TG 37.2 ± 0.4 37.1 ± 0.3 36.9 ± 0.4
Exercise Tre (°C)
TA 38.2 ± 0.7 37.9 ± 0.7 37.8 ± 0.7*
PA 37.9 ± 0.5 37.8 ± 0.4 37.9 ± 0.5
TG 37.9 ± 0.5 37.8 ± 0.5 37.6 ± 0.4*+
Peak Tre (°C)
TA 39.0 ± 0.7 38.6 ± 0.7 38.5 ± 0.6*
PA 38.4 ± 0.6 38.3 ± 0.3 38.7 ± 0.3†
TG 38.3 ± 0.3 38.2 ± 0.3 3 .9 0.2*†
Sweat rate (L.hr-1)
TA 0.91 ± 0.15 1.21 ± 0.29* 1.32 ± 0.28*
PA 0.95 ± 0.37 1.00 ± 0.35 1.31 0. 9*†+
TG 0.62 ± 0.26 0.71 ± 0.63# 0.63 ± 0.21#
Haemoglobin (g.dl-1)
TA 16.6 ± 1.6 14.6 ± 0.9 16.0 ± 1.7
PA 14.9 ± 0.8 14.3 ± 10 14.7 ± 1.6
TG 16.1 ± 1.9 15.1 ± 1.1 15.5 ± 1.7
Haematocrit
TA 0.48 ± 0.03 0.43 ± 0.03* 0.43 ± 0.03*
PA 0.45 ± 0.02‡ 0.44 ± 0.02 0.44 ± 0.3
TG 0.47 ± 0.03 0.45 ± 0.02 0.44 ± 0.03*
PV change (%) Day1-6 Day 6-12 Day 1-12
TA 13.4 ± 10.9 -5.23 ± 8.7 8.9 ± 14.0
PA 9.2 ± 5.7 1.6 ± 5.9 10.9 ± 8.4
TG 7.5 ± 14.4 -2.2 ± 16.3 7.6 ± 8.8
Data are mean (± S.D.) *Significant difference from day 1.†Significant difference from day 6. +
Significant difference between TG and PA (all P values < 0.05). #Significant difference between TA
and TG. ‡Significant difference between PA and TA.

176
6.4.1.4. Aldosterone and cortisol
Plasma aldosterone changes were not significantly different within or across days and
were not different between regimes (main effect day*time*regime: F(4,28) 2.279, P =
0.086, ηp2 = 0.246, Figure 6.2.). Similarly, cortisol concentration was not different within
or across days and was not different between regimes (main effect day*time*regime:
F(4,28) 2.524, P = 0.063, ηp2 = 0.265, Figure 6.3.).
Figure 6.2. Mean (± S.D.) Plasma aldosterone (pg.ml-1) pre and post exercise on day 1, 6
and 12 in TA, PA and TG.

177
Figure 6.3. Mean (± S.D.) Plasma cortisol (ng.ml-1) pre and post exercise on day 1, 6 and
12 in TA, PA and TG.
6.4.1.5. Sweat rate and sweat sodium, potassium and chloride
Sweat rate was significantly different across days (main effect day: F(2,42) 7.962, P = 0.001,
ηp2 = 0.275) and a significant interaction occurred (main effect regime*day: F(4,42) 3.004, P
= 0.029, ηp2 = 0.222). Sweat rate was significantly higher during TA compared to TG on day
six and twelve and higher in PA compared to TG on day twelve (all P values < 0.05, Table
6.1.). No significant difference was observed in sweat rate between PA and TA (all P
values > 0.05, Figure 6.4.). Within groups, sweat rate in TA was significantly higher from
day six and in PA from day twelve compared to day one (all P values < 0.05, Table 6.1.,
Figure 6.4.). No changes were observed in sweat rate in TG across days (all P values >
0.05, Figure 6.4.). There was no effect of day (main effect day: F(2,30) 2.149, P = 0.134, ηp2 =

178
0.125, Table 6.2.) or interaction (main effect day*regime: F(4,30) 1.324, P = 0.284, ηp2 =
0.150, Table 6.2.) on sweat sodium during acclimation. Similarly, potassium concentration
did not vary with the day (main effect day: F(2,30) 2.362, P = 0.112, ηp2 = 0.136, Table 6.2.)
and there was no interaction (main effect day*regime: F(4,30) 0.604, P = 0.663, ηp2 = 0.075,
Table 6.2.). Finally, chloride concentration was not different over days (main effect day:
F(2,30) 0.135, P = 0.875, ηp2 = 0.009, Table 6.2) and there was no significant interaction
(main effect day*regime: F(4,30) 0.448, P = 0.773, ηp2 = 0.056, Table 6.2.).
Figure 6.4. Mean (± S.D.) sweat rate (L.hr-1) in TA, PA and TG.*Significant difference from day 1. †Significant difference from A day 6. #Significant difference between TA and TG.
+ Significant difference between TG and PA (P < 0.05).

179
Table 6.2. Sweat sodium, potassium and chloride during TA, PA and TG.
Day 1 Day 6 Day 12
Sodium (mmol.L-1) TA 90.9 ± 43.9 80.1 ± 34 76.9 ± 31
PA 91.8 ± 36.7 81.3 ± 5.8 76.3 ± 20
TG 85.4 ± 20.3 93.2 ± 18.6 78.2 ± 17.7
Potassium (mmol.L-1)
TA 7.1 ± 2.4 6.9 ± 1.4 5.78 ± 1.4
PA 7.3 ± 2.8 5.9 ± 1.4 6.2 ± 1.1
TG 6.2 ± 1.9 6.3 ± 2 5.4 ± 1.2
Chloride (mmol.L-1)
TA 86.7 ± 50 86.8 ± 30.1 95.2 ± 44
PA 85.4 ± 35.7 74.1 ± 23.4 70.7 ± 19.2
TG 78.2 ± 17.6 85.2 ± 17.1 79.6 ± 27.1
Data are mean (± S.D.).
6.4.1.6. Plasma volume haemoglobin and haematocrit
Haemoglobin was not different between or within groups over time (main effect
day*regime: F(2,40) 0.781, P = 0.544, ηp2 = 0.072, Table 6.1.). Haematocrit varied across
days and was significantly different between and within regimes (main effect day*regime:
F(4,40) 4.902, P = 0.003, ηp2 = 0.329, Table 6.1.). Haematocrit was different between TA and
PA on day 1 (P < 0.05) and was significantly reduced during TA by day six and during TG by
day twelve (All P values < 0.05). Large inter-individual variation was observed in plasma
volume change in all groups. Plasma volume tended to be increased 13.5 ± 10.9 and 9.2 ±
5.7% in TA and PA respectively from day one to six. From day six to twelve plasma volume
tended to decrease in TA (-5.2 ± 8.7%) and increase in PA (1.6 ± 5.9%). TG tended to
increase PV over day one to six (7.5 ± 14.2%), but plasma volume was reduced from day
six to twelve (- 2.24 ± 16.3). Due to the large inter-individual differences there were no
significant changes within or between groups (main effect day*regime: F(2,40) 0.515, P =
0.725, ηp2 = 0.049, Table 6.1.).

180
6.4.1.7. RPE, Tsen and PSI
There was a main effect of day on RPE (main effect day: F(2,42) 17.355, P < 0.001, ηp2 =
0.452), but no significant interaction (main effect regime*day: F(4,42) 1.387, P = 0.255, ηp2
= 0.117). RPE increased during exercise (main effect time: F(11,231) 88.728, P < 0.001, ηp2 =
0.809) and there was a significant interaction (main effect regime*time: F(22,231) 3.875, P =
0.013, ηp2 = 0.270). The change in RPE over time on day one, six and twelve was not
dependent on the regime (main effect day*time*regime: F(44,462) 1.069, P = 0.358, ηp2 =
0.092). There was a significant main effect of day (main effect day: F(2,42) 18.467, P <
0.001, ηp2 = 0.468) on peak RPE, but no significant interaction (main effect regime*day:
F(4,42) 1.547, P = 0.206, ηp2 = 0.128).
Thermal sensation was significantly different over time within and between groups (main
effect; Chi squared = 1.082, P < 0.001, ES = 0.477). Tsen was significantly lower in TG and
TA by day six and twelve respectively and was significantly higher in PA by day six
compared to day one, but was also significantly elevated on day twelve compared to six
(all P values < 0.05, Table 6.3.). Between groups, Tsen was higher in both acclimation
regimes compared to TG on all days, but was only different between acclimation regimes
on day twelve when Tsen in PA was significantly higher (all P values < 0.05, Table 6.3.).
Peak Tsen was different over time and between groups (main effect; Chi squared = 35.169,
P < 0.001, ES = 0.495). Peak Tsen was significantly lower in TA on day twelve and in PA was
significantly higher on day six and twelve compared to day one (all P values < 0.05, Table
6.3.). Peak Tsen was not different in TG across days (all P values > 0.05, Table 6.3.).
Between conditions peak Tsen was significantly higher in PA compared to TG on day six
and twelve and significantly higher in PA compared to TA on day twelve only (all P values
< 0.05). No differences were observed between TG and TA across days (all P values >
0.05). PSI was different across days (main effect day: F(2,42) 5.388, P = 0.008, ηp2 = 0.204),
but there was no significant interaction (main effect regime*day: F(4,42) 1.954 P = 0.119,
ηp2 = 0.157) and there was no difference within or between groups in peak PSI.

181
Table 6.3. PSI, RPE and Tsen during twelve days of TA, PA and TG.
Day 1 Day 6 Day 12 Day 1 Day 6 Day 12
PSImean PSI peak TA 6 ± 1 6 ± 1 5 ± 1 7 ± 1 7 ± 2 7 ± 1
PA 6 ± 1 5 ± 1 6 ± 1 8 ± 2 8 ± 1 8 ± 1
TG 5 ± 1 5 ± 1 4 ± 1 7 ± 1 6 ± 1 5 ± 1
RPEmean RPEpeak
TA 15 ± 3 13 ± 3 12 ± 2 18 ± 2 15 ± 3 14 ± 2
PA 14 ± 3 13 ± 3 12 ± 2 17 ± 2 15 ± 2 15 ± 2
TG 14 ± 2 14 ± 3 12 ± 2 15 ± 2 14 ± 2 14 ± 2
Tsenmean Tsenpeak
TA 6.7 ± 1.0 6.1 ± 1 .8 0.6*† 7.5 ± 0.4 6.8 ± 0.9* 6.3 ± 0.6*‡ PA 5.8 ± 0.6 6.2 ± 0.7*‡ 6.6 0.6*†‡ 6.3 ± 0.4 6.8 ± 0.6*+ 7.2 0. *†
TG 5.5 ± 1.14# 5.2 ± 0.7*# 5.3 ± 0.6*# 6.0 ± 1.3 5.6 ± 0.7 5.6 ± 0.5*
Data are mean (± S.D.). * Significant difference from day 1. †Significant difference from day 6. +
Significant difference between PA and TG. #Significant difference between TA and TG. ‡Significant difference between PA and TA (all P values < 0.05).
6.4.2. Performance, physiological and perceptual responses to intermittent-sprint
exercise in 33°C, 50% rh pre-post twelve days of PA, TA or TG.
6.4.2.1. Participants
Pre-exercise body mass and hydration status were not different between CISP 1 and 2 in
any group (all main effect P values > 0.05) indicating participants were in a similar
physiological state prior to intermittent-sprint exercise in the heat. One participant failed
to complete CISP one due to volitional exhaustion after fifteen sprints (30 minutes) and
was removed from the environmental chamber.
6.4.2.2. PPO and work done
There was a main effect of day on PPO (F(1,20) 9.016, P = 0.007, ηp2 = 0.311) and there was
a significant interaction (main effect regime*day: F(2,20) 4.052, P = 0.033, ηp2 = 0.288, Table
6.4.). PPO was significantly higher in TA in CISP 2 compared to CISP 1 (P = 0.002, Table
6.4.), but was not different in PA or TG (all P values > 0.05). There was a main effect of
time on PPO (F(19,380) 8.418, P < 0.001, ηp2 = 0.296) and there was a significant interaction
of day and regime (main effect regime*day: F(38,380) 3.828, P < 0.001, ηp2 = 0.277). PPO was

182
significantly higher in CISP 2 compared to CISP 1 after TA from sprint eight to twenty (all P
values < 0.05, Figure 6.5.). There was no significant difference in PPO in PA and TG (all P
values > 0.05, Figure 6.5.).
Table 6.4. PPO (W) and Work Done (J) during CISP 1 and 2 in TA, PA and TG.
CISP 1 (Pre intervention) CISP 2 (Post intervention)
PPO (W) TA 931 ± 207 1062 ± 133*
PA 963 ± 187 990 ± 143
TG 967 ± 255 971 ± 268
Work Done (J)
TA 2567 ± 623 2973 ± 421
PA 2687 ± 581 2780 ± 431
TG 2705 ± 709 2725 ± 763
Data are mean (± S.D.). *Significant difference from CISP 1 (P < 0.05)

183
Figure 6.5. Mean (± S.D.) PPO during CISP 1 and 2 in TA, PA and TG.*Significant difference
from CISP 1 (P < 0.05).
Work done was different from CISP 1 to 2 (main effect day: F(1,20) 9.525, P = 0.006, ηp2 =
0.323) and there was a significant interaction (main effect regime*day: F(2,20) 3.148, P =
0.041, ηp2 = 0.273, Table 6.4.). Mean work done was significantly higher in CISP 2
compared to CISP 1 in TA only (P = 0.002, Table 6.4.). There was an effect of time on work
done during the CISP (F(19,380) 9.506, P < 0.001, ηp2 = 0.322) and there was a significant
interaction of day and regime (main effect regime*day*time: F(38,380) 3.810, P < 0.001, ηp2
= 0.276). Work done in TA was significantly higher in CISP 2 compared to CISP 1 from
sprint ten onwards (all P values < 0.05, Figure 6.6.). No significant difference was
observed in work done during the CISPs in PA or TG (all P values > 0.05, Figure 6.6.).

184
Figure 6.6. Mean (± S.D.) Work Done during CISP 1 and 2 in TA, PA and TG.*Significant
difference from CISP 1 (P < 0.05).

185
Table 6.5. Physiological responses during CISP 1 and 2 in TA, PA and TG.
CISP 1 (Pre intervention) CISP 2 (Post intervention) Change
Resting HR (b.min-1) TA 79 ± 11 70 ± 9 -9 PA 73 ± 14 62 ± 9 -11 TG 77 ± 23 72 ± 19 -5 Exercise HR (b.min-1) TA 174 ± 23 155 ± 20* -19 PA 169 ± 18 153 ± 19* -16 TG 163 ± 23 158 ± 19 -5 Peak HR (b.min-1) TA 185 ± 24 162 ± 19 23 PA 181 ± 15 164 ± 15 17 TG 172 ± 21 166 ± 14 6 Resting Tre (°C) TA 37.7 ± 0.3 37.4 ± 0.3 -0.3 PA 37.6 ± 0.3 37.2 ± 0.2 -0.4 TG 37.5 ± 0.4 37.5 ± 0.3 0.0 Exercise Tre (°C) TA 38.4 ± 0.6 38.1 ± 0.6* -0.3 PA 38.3 ± 0.6 37.8 ± 0.5* -0.5 TG 38.1 ± 0.5 37.9 ± 0.4 -0.2 Peak Tre (°C) TA 39.2 ± 0.6 38.7 ± 0.6* 0.4 PA 38.9 ± 0.5 38.2 ± 0.3* -0.7 TG 38.6 ± 0.3 37.4 ± 0.3* -0.2 sk (°C) TA 35.73 ± 1.19 34.78 ± 0.93* -0.95 PA 35.33 ± 0.62 34.63 ± 0.74* -0.70 TG 35.61 ± 1.04 35.86 ± 0.75+ +0.25 BHC (J) TA 9855 ± 1232 9829 ± 1274 26 PA 9699 ± 1202 9607 ± 1102 -92 TG 9839 ± 1763 9822 ± 1776 -17 Peak BHC (J) TA 9790 ± 1393 9644 ± 1292* -146 PA 10458 ± 1088 10376 ± 1038* -82 TG 10265 ± 2061 10153 ± 2091 -112 Sweat rate (l.hr-1) TA 1.38 ± 0.49 1.65 ± 0.46 +0.27 PA 1.37 ± 0.64 1.49 ± 0.57 +0.12 TG 1.13 ± 0.41 1.23 ± 0.39 +0.10 Blood [lactate] (mM) TA 6.2 ± 2.5 5.2 ± 1.9 -1.0 PA 4.9 ± 1.3 3.4 ± 1.0 -1.5 TG 3.9 ± 1.1 3.4 ± 1.1 -0.5 O2 (l.min-1) TA 2.41 ± 0.54 2.16 ± 0.44 -0.25 PA 2.30 ± 0.45 2.07 ± 0.45 -0.23 TG 2.11 ± 0.45 1.90 ± 0.40 -0.21 Heat production (W.m2-1) TA 440 ± 97 392 ± 85 -48 PA 398 ± 71 356 ± 74 -42 TG 383 ± 60 350 ± 55 -33 Data are mean (± S.D.) *Significant difference from day 1.†Significant difference from day 6. +
Significant difference between TG and PA (all P values < 0.05). #Significant difference between TA and TG. ‡Significant difference between PA and TA.

186
6.4.2.3. Heart rate
Resting heart rate decreased over time (main effect: F(1,21) 30.000, P < 0.001, ηp2 = 0.588)
but, despite reductions of 9, 11 and 5 b.min-1 in TA, PA and TG respectively no significant
interaction (main effect regime*time: F(2,21) 1.415, P = 0.265, ηp2 = 0.119, Table 6.5.)
resulted. Exercise heart rate during intermittent sprinting was reduced from CISP 1 to
CISP 2 (main effect day: F(1,20) 38.045, P < 0.001, ηp2 = 0.664, Table 6.5.) and there was a
significant interaction (main effect regime*day: F(2,20) 4.119, P = 0.031, ηp2 = 0.282). PA
and TA reduced mean exercise heart rate (all P values < 0.001, Table 6.5.), but there was
no effect of TG (all P values > 0.05). Exercise heart rate increased during intermittent-
sprinting (main effect time: F(19,38) 70.106, P < 0.001, ηp2 = 0.770) and there was a
significant interaction (main effect regime*day*time: F(38,380) 1.572, P = 0.019, ηp2 =
0.130). TA reduced exercise heart rate from sprint two onwards in CISP 2 compared to
CISP 1 (all P values < 0.05, Figure 6.7.). Similarly, PA reduced exercise heart rate across all
sprints in CISP 2 compared to CISP 1 (all P values < 0.05, Figure 6.7.). After TG exercise
heart rate was reduced only in the first two sprints in CISP 2 compared to CISP 1. Peak
exercise heart rate was reduced over time (main effect: F(1,21) 34.158, P < 0.001, ηp2 =
0.619). While peak heart rate was lower in CISP 2 by 23, 17 and 6 b.min-1 after TA PA and
TG, respectively, there was no significant interaction (main effect regime*time: F(2,21)
3.269, P = 0.058, ηp2 = 0.237).

187
Figure 6.7. Mean (± S.D.) heart rate (b.min-1) in CISP 1 and 2 following TA, PA and TG.
*Significant difference from CISP 1 (P < 0.05).
6.4.2.4 Tre, sk, body and body heat content
Resting Tre was reduced over time from CISP 1 to CISP 2 (main effect: F(1,21) 4.466, P =
0.047, ηp2 = 0.175) but, despite decreases of 0.3 and 0.4°C in TA and PA respectively, no
significant interaction (main effect regime*time: F(2,21) 2.840, P = 0.081, ηp2 = 0.213, Table
6.5.) resulted. Exercise Tre during CISP 2 was reduced compared to CISP 1 (main effect
time: F(1,20) 40.691, P < 0.001, ηp2 = 0.670) and there was a significant interaction (main
effect regime*day: F(2,20) 4.314, P = 0.028, ηp2 = 0.301). Mean exercise Tre during CISP 2
was reduced 0.3 and 0.5°C by TA and PA, respectively (all P values < 0.05, Table 6.5.), but
there was no reduction after TG (P < 0.05). Tre increased during intermittent sprinting in
the heat during CISP 1 and 2 (main effect time: F(19,380) 325.286, P < 0.001, ηp2 = 0.942) and
there was a significant interaction effect (main effect regime*day*time: F(38,380) 1.657, P =
0.010, ηp2 = 0.142, Figure 6.8.). Both TA and PA reduced Tre from sprint one to twenty

188
during CISP 2 compared to CISP 1 (all P values < 0.05, Figure 6.8.) but there was no
significant effect of TG (all P values > 0.05). Peak exercise Tre was also reduced from CISP
1 to 2 (main effect time: F(1,21) 39.553, P < 0.001, ηp2 = 0.653) and there was a significant
interaction (main effect regime*time: F(2,21) 3.493, P = 0.049, ηp2 = 0.250). Peak Tre during
intermittent sprinting was significantly reduced by all interventions (all P values < 0.05,
Table 6.5.).
Figure 6.8. Mean (± S.D.) Tre (°C) in CISP 1 and 2 following TA, PA and TG.*Significant
difference from CISP 1 (P < 0.05).
sk was reduced during CISP 2 compared to CISP 1 (main effect day: F(1,20) 9.106, P = 0.007,
ηp2 = 0.313) and there was a significant interaction (main effect regime*day: F(2,20) 3.913,
P = 0.037, ηp2 0.281, ab e 6. .). Both A and PA red ced sk in CISP 2 compared to CISP
1 (all P values < 0.05), but there wa no effect of G P 0.0 ). Pea body was reduced
over time (main effect day: F(1,20) 34.894, P < 0.001, ηp2 = 0.636) and there was a
significant interaction (main effect regime*day: F(2,20) 4.938, P = 0.018, ηp2 0.331). A

189
and PA red ced ea body (all P values < 0.05), but there was no effect of training (P >
0.05). Body heat content was reduced across days (main effect day: F(1,20) 9.106, P =
0.007, ηp2 = 0.313), but there was no significant interaction (main effect regime*day: F(2,20)
2.486, P = 0.109, ηp2 = 0.199, Table 6.5.). While body heat content was increased during
exercise (main effect time: F(19,38) 15.738, P < 0.001, ηp2 = 0.440), there was no effect of
day or regime (main effect regime*day*time: F(38,380) 0.960, P = 0.540, ηp2 = 0.088). Peak
body heat content was however, reduced by both TA and PA in CISP 2 compared to CISP 1
(main effect regime*day: F(2,20) 4.657, P = 0.022, ηp2 = 0.318, post hoc all P values < 0.05,
Table 6.5.), but there was no effect of TG (P > 0.05).
6.4.2.5. Blo l e, O2 and metabolic heat production
Blood lactate was reduced in CISP 2 compared to CISP 1 (main effect day: F(1,20) 16.974, P
= 0.001, ηp2 = 0.485), but there was no significant interaction (main effect regime*day:
F(2,20) 2.379, P = 0.121, ηp2 0.209, ab e 6. .). Simi ar y, 2 was reduced in CISP 2
compared to CISP 1 (main effect day: F(1,20) 8.115, P = 0.010, ηp2 = 0.289), but there was no
significant interaction (main effect regime*day: F(2,20) 0.347, P = 0.711, ηp2 = 0.034, Table
6.5.). Metabolic heat production was reduced by ∽ 10% in CISP 2 compared to CISP 1
(main effect day: F(1,21) 7.338, P = 0.013, ηp2 = 0.259), but there was no significant
interaction (main effect regime*day: F(2,21) 0.192, P = 0.827, ηp2 = 0.018).
6.4.2.6. Sweat rate and sweat sodium, potassium and chloride during intermittent-
sprint exercise
Sweat rate was increased in CISP 2 compared to CISP 1 (main effect day: F(1,20) 8.486, P =
0.008, ηp2 = 0.288), but there was no significant interaction (main effect regime*day: F(2,21)
0.882, P = 0.429, ηp2 = 0.078, Table 6.5.). Sweat sodium, potassium and chloride were
reduced between CISP 1 and 2 (main effect day: all P values < 0.05), but there was no
significant interaction (main effect regime*day: all P values > 0.05, Table 6.6.)

190
Table 6.6. Sweat sodium, potassium and chloride during CISP 1 and 2 in TA, PA and TG.
CISP 1 (Pre intervention) CISP 2 (Post intervention)
Sodium (mmol.L-1) TA 90.9 ± 43.9 76.5 ± 28.7 PA 92.4 ± 31.2 81.8 ± 20.8 TG 105.7 ± 30.1 96.2 ± 19.2 Potassium (mmol.L-1) TA 7.1 ± 2.4 4.8 ± 0.9 PA 6.1 ± 1.9 5.3 ± 1.4 TG 6.0 ± 1.1 5.2 ± 0.72 Chloride (mmol.L-1) TA 86.7 ± 50.1 69.5 ± 26.8 PA 82.7 ± 28.2 73.3 ± 19.8 TG 96.1 ± 27.3 87.9 ± 19.3
Data are mean (± S.D.)
6.4.2.7. RPE, Tsen and PSI
RPE was reduced in CISP 2 compared to CISP 1 (main effect day: F(1,20) 26.324, P < 0.001,
ηp2 = 0.568) and there was a significant interaction (main effect regime*day: F(2,20) 4.046,
P = 0.033, ηp2 = 0.288). Both TA and PA reduced mean RPE during exercise in CISP 2
compared to CISP 1 (all P values < 0.05, Table 6.7.), but there was no effect of TG (P >
0.05). RPE increased during exercise (main effect time: F(2,20) 90.698, P < 0.001, ηp2 =
0.819), but there was no significant interaction of day or regime (main effect
regime*day*time: F(2,20) 4.046, P = 0.033, ηp2 = 0.288). Peak RPE was not different
between groups (main effect regime*day: F(8,80) 0.852, P = 0.560, ηp2 = 0.079).

191
Table 6.7. RPE, PSI and Tsen during CISP 1 and 2 in TA, PA and TG.
CISP 1 (Pre intervention) CISP 2 (Post intervention) Change
Exercise RPE
TA 16 ± 3 14 ± 3* -2 PA 15 ± 3 11 ± 2* -4 TG 14 ± 3 13 ± 2 -1 Peak RPE TA 18 ± 3 15 ± 3 -3 PA 17 ± 2 13 ± 2 -4 TG 16 ± 3 15 ± 2 -1 Exercise PSI TA 5.9 ± 2.1 5.3 ± 1.4 -0.6 PA 6.4 ± 2.0 5.1 ± 1.6 -1.3 TG 5.9 ± 2.1 5.3 ± 1.4 -0.6 Peak PSI TA 7.8 ± 1.7 6.7 ± 0.9 -1.1 PA 8.7 ± 1.8 6.7 ± 1.3 -2 TG 7.8 ± 1.7 6.7 ± 0.9 -1.1 Exercise Tsen TA 6.3 ± 1.4 5.5 ± 0.9* -0.8 PA 6.2 ± 0.6 5.5 ± 0.6* -0.7 TG 6.0 ± 0.7 6.1 ± 0.5+# +0.1 Peak Tsen TA 7.2 ± 0.9 6.1 ±1.1 -1.1 PA 6.7 ± 0.4 5.9 ± 0.6* -0.6 TG 6.4 ± 0.7 6.1 ± 0.5 -0.3 Data are mean (± S.D.). *Significant difference from day 1.†Significant difference from day 6. +
Significant difference between TG and PA (all P values < 0.05). #Significant difference between TA
and TG. ‡Significant difference between PA and TA.
Tsen was reduced during CISP 2 compared to CISP 1 (main effect: Chi squared 39.075, P <
0.001, ES = 0.186). Between groups, Tsen during CISP 2 was lower after TA and PA
compared to TG (all P values < 0.0167, Table 6.7.). Within groups, TA produced lower Tsen
in sprint four, twelve and twenty in CISP 2 (main effect; P < 0.001; Post Hoc, all P values <
0.0167) and PA resulted in a lower Tsen in CISP 2 (main effect: P < 0.001) from sprint
twelve to twenty (all P values < 0.0167). TG did not lower Tsen during intermittent
sprinting in the heat (all P values > 0.05). Peak Tsen was reduced after PA only (P = 0.010).
There was a main effect of day on PSI (F(1,20) 22.760, P < 0.001, ηp2 = 0.532), but no
significant interaction (main effect regime*day: F(2,20) 1.408, P = 0.268, ηp2 = 0.123, Table
6.7.). PSI increased during CISP 1 and CISP 2 (main effect time: F(19,38) 309.496, P < 0.001,
ηp2 = 0.939) and there was a significant interaction of day and regime (main effect

192
regime*day*time: F(38,380) 1.632, P = 0.012, ηp2 = 0.140). In TA PSI was reduced in CISP 2
compared to CISP 1 from sprint two onwards (all P values < 0.05) and in PA PSI was
reduced from sprint four to twenty. After TG, PSI was only reduced in sprints nineteen
and twenty during CISP 2. Peak PSI was not different between or within groups (main
effect: P > 0.05).
6.4.2.8. Correlation analysis
During CISP 1 a strong negative correlation was observed for PPO and Tre (r = - 0.938, P <
0.001) in TA, but this correlation was reduced in CISP 2 (r = - 0.314, P = 0.178). In PA, a
strong negative correlation was also observed in CISP 1 (r = - 0.900, P < 0.001), but this
was not altered by progressive acclimation (CISP 2; r = - 0.928, P < 0.001). In TG a
moderate negative correlation was observed between PPO and Tre during CISP 1 (r = -
0.598, P = 0.005) and this relationship remained after twelve days of training (r = - 0.928,
P < 0.001).
6.5. Discussion
The objectives of this study were to examine physiological and perceptual adaptation to
heat acclimation using a progressive compared to a traditional heat acclimation protocol
and to investigate the subsequent effect of progressive heat acclimation on
physiological, perceptual and performance responses during forty minutes of
intermittent-sprint exercise in the heat. This is the first study to use a progressive heat
acclimation model whereby physiological and thermal strain was elevated throughout
the protocol by stepwise increases in heat stress on two occasions during acclimation. It
was hypothesised a progressive heat acclimation model with stepwise increases in heat
stress would, compared to a traditional model, evoke similar adaptations to the heat
and prove a valid alternative heat acclimation protocol. In addition, it was hypothesised
that progressive heat acclimation would improve perceptual and physiological responses

193
during intermittent sprinting in the heat and ameliorate heat induced decrements in
performance.
The efficacy of progressive heat acclimation can be judged against its ability to evoke
classic heat-induced, adaptive responses consistent with the heat acclimated phenotype,
including decreased heart rate and core temperature during rest and exercise, increased
sweat rate and increased plasma volume. Similar to isothermal models, the principle of
progressive acclimation is to maintain physiological strain for the duration of acclimation
to maximise adaptive responses. With the progressive model, such effect is, however,
achieved by manipulation of heat stress with planned increases at specific points during
acclimation to elevate physiological strain.
6.5.1. Physiological and perceptual responses during acclimation and training
Peak heart rate during exercise was reduced in TA and TG and, although not significant,
mean heart rate tended to decline (-15 and -14 b.min-1 in TA and TG, respectively). In
contrast, as expected with elevations in heat stress and consequently, physiological
strain, peak heart during PA was unchanged and any tendency for decline in mean heart
rate was small (-6 b.min-1). At rest, heart rate was unchanged in TG, but significant
bradycardia was evident by day six and persisted to day twelve in both acclimation
regimes. Consistent with previous research, (Convertino et al., 1980; Patterson et al.,
2004; Magalhaes et al., 2010; Garrett et al., 2011) these data suggest enhanced
cardiovascular stability in response to exercise / an exercise-heat acclimation regime that
may be explained by altered autonomic activity, hypervolaemia, or a centrally mediated
effect.
Expansion of plasma volume is a frequently reported, rapidly occurring response to heat
acclimation (Nielsen et al., 1993; Lorenzo et al., 2010; Garrett et al., 2012) of which 40%
can be attributed to the thermal stimulus and 60% to exercise (Convertino et al., 1980). In

194
the current study, accepting that large inter-individual variation and variability in plasma
volume change exists, (Weinstein et al, 1998; Racinais et al., 2012), and may have
contributed to a non-significant expansion, a trend toward increased plasma volume was
observed in TA, PA and TG (530 ± 444, 330 ± 229 and 324 ± 528 ml respectively). This was
accompanied by a significant haemodilution (∽ 12%, 4% and 6% in TA, PA and TG,
respectively, Table 6.1.) and overall may have contributed to the aforementioned heart
rate response. Elevated colloid-osmotic pressure in response to protein influx to the
vascular compartment may explain plasma volume expansion, but lack of change in
plasma protein content has been observed with acclimation (Nielsen et al., 1993, Garrett
et al., 2009). Further, enhanced plasma volume may be mediated by increased retention
of Na+ and water in the distal tubules in response to increased expression of aldosterone
in acclimation (Nielsen et al., 1993; Garrett et al., 2012, 2014), but this is not supported
by previous (Garrett et al., 2009), or the current work as, despite a trend toward
increased aldosterone and sweat Na+, there was no significant change within or across
days.
Similar to other work (Senay et al., 1976; Kirby et al., 1986; Armstrong et al., 1989;
Nielsen et al., 1993; Aoyagi et al., 1995; Nielsen, 1998; Garrett et al., 2012), the trend
towards increased plasma volume in the current study was essentially complete in all
groups by day six, yet reductions in heart rate persisted until day twelve. This illustrates
two important points; firstly, consistent with previous research, this suggests
hypervolemia may not independently mediate decreased heart rate and may indicate a
possible central effect whereby increased ventricular contractility contributes to
improved cardiac efficiency during the acclimation process (Horowitz, 2002; Garrett et al.,
2009). Secondly, Nielsen et al., (1993) and Patterson et al., (2004) demonstrated
sustained expansion of plasma volume for twelve to twenty two days using an isocardiac /
isothermal model of acclimation to maintain strain for the duration of the intervention.
Therefore, given a similar aim to the progressive model used in this study of maximising
the hypervolemic response the trend toward no change in plasma volume from day six to
twelve, while consistent with the biphasic nature of heat acclimation, may highlight a

195
deficiency in the progressive heat acclimation model design. Specifically, it may signify
that the initial starting WBGT (24.4°C) was too low and therefore two increases in heat
stress (WBGT 27.7 and 32.0°C) were insufficient to provoke sustained expansion.
The final increase in heat stress in PA significantly elevated peak exercise heart rate on
day twelve compared to day six (Table 6.1.). Earlier work in this thesis (chapter 5)
demonstrated that the combination of heat and humidity contributing to the overall heat
stress (when matched between conditions) does not differentially impact exercise
performance over 40 minutes, but trends toward increased physiological strain with
greater humidity, as identified by Smolander et al., (1987). The significant elevation in
heart rate on day twelve compared to day six may therefore, reflect the increased
humidity in the final phase of PA. That stress was enhanced in the current study by the
progressive nature of the acclimation protocol is partly supported by perceptual
responses during acclimation, as Tsen was significantly higher on day six and twelve
compared to day one in PA and was significantly higher on day twelve in PA compared to
TA and TG (Table 6.3.). By comparison TSen was reduced by day 12 in TA and TG.
Twelve days of TA and TG reduced mean and peak Tre during exercise, but in PA,
consistent with the maintenance of physiological strain, peak Tre was significantly higher
on day twelve compared to six and mean Tre during exercise was unchanged. Lower mean
and peak Tre during exercise may indicate decreased production or dissipation of heat,
but approximately one third of the average lowering of final Tre may be attributed to
lowering of resting Tre (Kampmann et al., 2008). Previous research has identified the
magnitude of decrease in resting Tre to be 0.3 – 0.5°C with heat acclimation (Wyndham et
al., 1954; Patterson et al., 2004; Castle et al., 2011). In the current study, although Tre
declined, the change (0.3, 0.2 and 0.3°C in TA, PA and TG respectively) was not significant.
While consistent with earlier research (Garrett et al., 2009), this was unexpected as
acclimation-induced reductions in thermoregulatory and vasodilatory setpoints, reduced
heat storage and improved cardiovascular adjustments (Garden et al., 1966; Buono et al.,
1998, Armstrong, 1998) coupled with attenuation of hyperpyrexic mediators (Shin et al.,

196
2013) should have contributed to a decreased resting Tre. However, the extent of
decrease in resting Tre is primarily due to the physical work performed (Kampmann et al.,
2008), therefore, lack of change in the current study may reflect the intensity of exercise
during acclimation and training. In contrast, previous work using identical exercise
intensities and environmental conditions for acclimation (Castle et al., 2011) has reported
significant change in resting Tre and therefore, it may be that inter-individual differences
and large standard deviations prevented detection of a difference. Alternately, it has
been demonstrated that heat acclimation at a fixed time of day evokes significant
changes in acclimatory markers only during the time period in which the heat acclimation
was completed (Shido et al., 1999). As such, given that measurements on day one, six and
twelve were completed between 7.30 and 9.30 am to ensure consistent hormonal
responses, but some acclimation sessions were completed at a different time due to
logistical constraints, a time of day effect may have contributed to findings.
Sweat rate during exercise was significantly elevated during TA and PA, but was
unchanged during TG in a temperate environment (Table 6.1., Figure 6.4.). Consistent
with previous research (Patterson et al., 2004; Machado-Moreira et al., 2005; Buono et
al., 2009), improved sweat rate with acclimation may be due to lowering of the zero point
of the central nervous system for sweating, i.e. a central adaptation (Nadel et al., 1974).
Peripheral adaptation may, however, also augment sweat rate through eccrine gland
hypertrophy, increased cholinergic sensitivity of the gland, increased peri-glandular
concentrations of acetylcholine and improved capacity (Patterson et al., 2004; Buono et
al., 2009). Alternatively, rather than an adaptive response in PA, increased sweat rate on
day twelve may simply reflect the increased heat stress and strain inherent in a protocol
of this type contributing to an increased volume of sweat on day six and twelve.

197
6.5.2. Physiological and perceptual responses during Intermittent-sprint exercise in 33°C
50% rh
Mean exercise heart rate was significantly reduced in CISP 2 compared to CISP 1 in
response to both acclimation regimes and, peak heart rate, although not significantly
different, showed a trend toward a decline (-17 and -23 b.min-1 in PA and TA
respectively). Further, mean Tre during CISP 2 was significantly reduced by TA and PA (-
0.3 and - 0.5°C respectively). Collectively, these data indicate that both PA and TA
conferred improved cardiovascular stability and thermoregulatory function during
intermittent-sprint exercise in contrast to TG. Although reductions in exercise heart rate
during CISP 2 may be explained by mechanisms previously described, elucidating
mechanisms responsible for the reduction in Tre during exercise is less clear. Previously, it
has been suggested a decrease in hypothalamic thermoregulatory set point contributes to
a decreased resting Tre that subsequently contributes to a decreased Tre in exercise
(Garden et al., 1966; Buono et al., 1998, Armstrong, 1998). Prior to CISP 2 however,
resting Tre was not different within any condition, but tended toward a decline in PA and
TA and demonstrated a potentially meaningful effect (- 0.4 and - 0.3°C respectively, ηp2 =
0.213). n addition, decrea ed heat rod ction may contrib te to enhanced
thermoreg atory f nction d ring e erci e. However, de ite ignificant red ction in
body and peak BHC in CISP 2 compared to CISP 1, mean BHC during exercise was not
significantly different compared to CISP 1, but demonstrated a trend toward a meaningful
decline (ηp2 = 0.199) . Further, as oxygen uptake tended to be lower during CISP 2
compared to CISP 1, metabolic heat production was decreased by 10% in CISP 2, but again
was not ignificant y different from C SP 1. Fina y, im roved heat di i ation with
acc imation may contrib te to enhanced thermoreg atory f nction and im rove
hy io ogica re on e d ring e erci e in the heat. n the c rrent t dy, sk was
significantly reduced by PA and TA. Consequently, given the reductions in exercise Tre
during CISP 2 the core: skin temperature gradient for both TA and PA was increased from
CISP 1 to 2 (2.7 vs. 3.3°C and 2.9 vs. 3.2°C in TA and PA, respectively) and may have
improved heat dissipation while optimising skin blood flow allowing improved
cardiovascular function (Cheuvront et al., 2010). Further heat dissipation can be achieved
by an increase in sweat volume produced. However, sweat rate during intermittent-sprint
198
exercise in the current study was not different in any regime. When sweat rate from
intermittent-sprinting is compared to day one, six and twelve of acclimation it is
interesting to note that volumes achieved during the CISPs were only matched on day
twelve of acclimation. Greater thermal strain has been reported in intermittent compared
to continuous exercise (Nevill et al., 1995) and therefore, this lack of change may
represent an insufficient stimulus during acclimation to promote enhanced sudomotor
function during the CISPs. It has been suggested that humid heat acclimation elicits
greater increases in sweat rate (Shvartz et al., 1973: Henane, 1980). As such, use of
greater humidity during acclimation or earlier in PA when elevating heat stress may have
evoked a greater sweat response. Griefahn (1997), however refutes this contention,
demonstrating no difference in sweat rate between hot humid and dry heat acclimation.
As stated, sudomotor motor adaptation may evolve from central and peripheral
mechanisms. Use of whole body sweat rate in the current work prevents insight to the
extent of contribution from these mechanisms, therefore it is unknown whether set-point
and / or sweat gland adaptation occurred.
Consistent with reduced physiological strain, RPE during exercise was significantly
reduced after PA and TA, but not TG and could be indicative of altered group III and IV
afferent feedback in response to acclimation (Amann, 2011), or an effect of specific brain
regions and endogenous opioids (Marcora, 2009). Further, Tsen was decreased by both
acclimation regimes, but not TG. Peak Tsen was decreased in PA only indicating a possible
beneficial effect of the greater heat stress used in the final phase of progressive
compared to traditional acclimation.
6.5.3. Performance responses during Intermittent-sprint exercise in 33°C 50% rh
The drop in PPO over time during CISP 1 in PA, TG and TA was 8.2, 6.0 (P > 0.05) and
19.1% (P < 0.05) respectively. Given the TEM of the CISP for PPO identified in chapter
four, these decrements suggest a meaningful drop in performance over the duration of
exercise. Further to the drop in PPO, a strong negative correlation existed between PPO

199
and exercise Tre in TA and PA (r = -0.938 and - 0.900 respectively, all P values < 0.001). On
completion of acclimation, PPO was significantly increased in TA during CISP 2 from sprint
ten, the decrease over time was < 1% and no significant correlation was observed for this
variable and exercise Tre (r = -0.314, P = 0.178). In contrast, no change in PPO was
observed for PA and TG between CISP 1 and 2 with similar reductions over time and the
persistence of a strong negative relationship between PPO and Tre in PA (r = -0.928, P <
0.001). Further, mean work done was significantly higher in CISP 2 compared to CISP 1
only in TA. These data indicate a beneficial effect of TA on performance in intermittent-
sprinting in the heat, as reported in previous work using an identical protocol (Castle et
al., 2011) and may be due to acclimation-induced reductions in muscle temperature,
epinephrine concentration and muscle glycogen use (Castle et al., 2011). However, while
the marked difference in percent decrement between TA and the other conditions could
not be explained by relative power output (W.kg-1), body surface area or initial sprint
performance (Bishop, 2012), it is also important to note in the TA group that two
participants displayed marked negative physiological responses to exercise in the heat in
both intermittent sprinting and acclimation. For these two participants, the increase in Tre
during intermittent-sprinting in the heat was the highest of all participants in the study at
0.04°C.min-1. Further, these individuals had the greatest absolute and relative rate of
increase in body heat content during intermittent exercise (9.7, 8.4 J.min-1 and 0.15, 0.10
J.min-1.kg-1), yet two of the lowest sweat rates. Both individuals also possessed the lowest
relative aerobic fitness of all participants and the highest percentage body fat and from a
performance perspective, displayed the greatest decrease in PPO over time during CISP 1
of all participants in this thesis (43% and 25%, respectively). During acclimation these
participants displayed the greatest physiological strain, required the greatest amount of
time to acquire the heat acclimated phenotype and demonstrated some of the largest
plasma volume expansions of the whole cohort (25% and 28% respectively). Lack of
tolerance to the heat has previously been reported in young fit individuals (Moran et al.,
2007) and may be inherent or acquired, temporary or permanent and due, for example,
to lack of fitness, body composition, previous heat injury or infectious disease and
subsequent inability to regulate heat storage. As both of the individuals previously
mentioned were free of any infection for the study duration it may be their intolerance to
heat based on aforementioned criteria was markedly lower than the remainder of the TA

200
group but also the study cohort and therefore, when combined with the small group size,
may have contributed to the marked decrement in performance during the first CISP.
Similar to TA, PPO after PA tended to be higher (2.7%), but was not significantly different.
Considering Castle et al., (2011) demonstrated significance with a 2% improvement in
PPO after heat acclimation the result in the current study, although consistent with
earlier work in this thesis (chapter 5), is most likely explained by the greater variance in
the peak power data recorded from participants in the current work compared to Castle
et al., (2011). Alternately, findings may reflect a Type II error as post hoc power analysis
demonstrated a sample size of twelve would be required for significance in PPO. In
contrast to TA, PA in the current study did not ameliorate the decrement in PPO or the
negative correlation with Tre during the CISP (Decrement CISP 1 = 6.0%, CISP 2 = 4.4%).
Although similar to decrements reported in study two (chapter 5), the small decrease in
PPO in CISP 1 would have contributed to the persistence of a negative correlation
between PPO and Tre after PA. It is however, also important to note that during CISP 1
mean and peak heart rate, Tre, sk and blood lactate, although not significantly different,
tended to be lower in PA compared to TA. Further, although not significantly different,
aerobic fitness tended to be higher in PA compared to TA (46.9 ± 2.7 ml.kg-1.min-1 vs. 42.2
± 2.4 ml.kg-1.min-1, respectively) and heat production was lower during CISP 1. Rate of
heat production has been shown to mediate an anticipatory reduction in power output
(Tucker et al., 2006). Further, inhibitory feedback from group III and IV afferents sensitive
to the mechanical, biochemical and thermal state of the tissue is known to modulate CNS
drive to locomotor muscle (Amann et al., 2008, 2013). As such, it is plausible the
tendency for lower physiological responses in the PA group combined to produce better
maintenance of central drive to locomotor muscle compared to the TA group resulting in
less reduction in PPO. That PA then did not alter the decrement in drive may also be due
to the protocol whereby the extent of physiological strain induced by this protocol in its
current form may not have evoked sufficient strain for a sufficient period in the more
trained PA group. Little is known of the effect of intermittent-sprint exercise in the heat
on central and peripheral fatigue and no studies have examined how exercise-acclimation

201
may modulate fatigue of this type. As such, further work is required to confirm or refute
the aforementioned explanations for the lack of effect of PA.
6.5.4. Limitations
Research provides compelling evidence of a common mechanism for thermotolerance
and heat acclimation and consequently, evidence of heat shock protein involvement in
acquisition of the heat acclimated phenotype (Kuennen et al., 2011). Further, more
recent work proposes that extra-cellular HSP72 concentration is significantly increased
only in very hot ambient conditions where the exogenous heat stress evokes a minimum
endogenous criteria of rapid and sustained increases in core temperature to > 38.5°C and
enhanced sympathetic activity (Gibson et al., 2013). While this provides explanation for
the previously held notion that effective heat acclimation is only achieved through
attainment of a critical core temperature of ∽ 38.5°C, it also provides a criterion reference
by which responses to PA may be examined and the protocol itself judged. During PA, the
maximum increase in exercise Tre on day one (1.1°C), six (1.3°C) and twelve (1.5°C) evoked
Tre responses beyond 38.5°C only in the final stage of the protocol (day 9 - 12) and then
only for ∽ 15 minutes in each session in the final phase. Similarly, in the final phase of PA,
mean exercise Tre reached only 37.9 ± 0.5°C. Consequently, while sympathetic activity
(measured as increased heart rate) surpassed the minimum endogenous requirement as
identified in previous work (Gibson et al., 2013), it may be the progressive protocol used,
while superior to TG in maintenance of physiological strain and beneficial as it allows all
participants to complete sessions in the initial stages of the protocol thereby maximising
exposure to heat, did not evoke sufficient strain to optimise acclimation responses. This
may explain non-significant findings in some key markers of heat acclimation e.g. plasma
volume and resting Tre during acclimation sessions but also during the CISPs and is
reflected in the non-significant findings for plasma cortisol within or between regimes.
That said, accepting that improved performance during intermittent-sprinting after TA
may have been distorted by markedly lower heat tolerance of some participants in that
group, key markers of physiological and perceptual strain during intermittent-sprinting

202
were reduced by both PA and TA, indicating progressive acclimation is as effective as
traditional acclimation in this respect. Although TA and TG both evoked improvements in
markers of heat acclimation from day one to twelve it is important to remember that
such observations may merely represent decreased physiological strain as previously
reported with constant work-rate protocols (Taylor, 2000) and therefore, may reflect an
inability to optimise physiological responses to acclimation within a specific time frame.
Data presented for PA indicate that, despite a sufficient lack of strain to achieve a
minimum endogenous Tre criteria of 38.5°C, the increases in heat stress on day five and
nine were sufficient to maintain physiological strain across the protocol thereby
indicating the efficacy of this method in inducing the heat acclimated phenotype. Further
work is required to elucidate the optimal heat stress and increments required to achieve
maximal adaptation within a standard heat acclimation time frame.
6.5.5. Conclusion
In conclusion, this was the first study to examine progressive heat acclimation as a
method to maximise heat adaptation by elevating physiological strain throughout an
acclimation regime with stepwise increase in heat stress on two occasions. Further, this
was the first study to examine the effect of progressive heat acclimation on responses
during intermittent-sprint exercise in the heat. Overall, when compared against
traditional acclimation, data demonstrate progressive acclimation is a valid method for
conferring the heat acclimated phenotype. Due to the reduced heat stress in the initial
stages of progressive acclimation this protocol may permit better tolerance of initial heat
exposure and maximise exposure time in the early stages of acclimation by reducing
incidence of heat illness and limiting participant drop out. Therefore, progressive heat
acclimation may permit greater individualisation of heat acclimation and be of benefit to
certain athletes, especially those less tolerant to the heat. With the current protocol
design, increased physiological strain was evident during the acclimation regime,
however, findings indicate the degree of strain was possibly insufficient to evoke the
minimum endogenous criteria needed to elicit a maximal acclimation response for a
sufficient period of time and a subsequent performance-enhancing effect.

203
CHAPTER VII. THE EFFECT OF PROGRESSIVE HEAT ACCLIMATION ON FATIGUE
FOLLOWING INTERMITTENT-SPRINT EXERCISE IN THE HEAT
7.1. Abstract
The aims of this study were to examine central and peripheral contributions to fatigue
during intermittent-sprint exercise in 33°C, 50% relative humidity (rh) using transcranial
magnetic stimulation (TMS) and electrical femoral nerve stimulation (FNS) and to
investigate whether progressive heat acclimation could ameliorate fatigue following
exercise of this type. Seventeen male game ayer matched for ea o ygen ta e
2peak), ea ower and body rface area were divided into two gro rogre ive
heat acc imation PA, n 9 d, 0 2peak, 30.8 ± 0.7°C, 49 ± 5% rh, 4 d 33.2 ± 0.6°C, 50
± 6% rh and 4 d 35.4 ± 0.6°C, 62 6 rh) and training G, n 8 12 d, 0 2peak, 21.2 ±
0.9°C, 31 ± 6% rh). Pre and post acclimation or training, participants completed a 40
minute cycling intermittent-sprint protocol (CISP) in 33.7 ± 0.6°C, 50 ± 3.5% rh, with
neuromuscular fatigue assessment immediately before and after exercise. Maximal
voluntary contraction (MVC) and potentiated twitch force in both PA and TG were
reduced after CISP 1 (all P values < 0.05), whereas cortical voluntary activation was not
significantly different but tended to decline. PA reduced resting Tre and heart rate prior to
CISP 2 (-0.3°C; -10 b.min-1 respectively, P < 0.05). Further, exercise heart rate was reduced
by PA (-17 b.min-1, P < 0.05) and Tre tended to decline (-0.3°C, P = 0.10). Despite the
improved overall physiological strain, peak power output and work done were not
different between CISP 1 and 2. Further, the reduction in MVC and potentiated twitch
force during intermittent sprinting remained after twelve days of progressive heat
acclimation. These data indicate that during forty minutes of intermittent-sprint exercise
in the heat, neuromuscular fatigue may be primarily peripheral in origin and PA or TG
does not reduce the extent of fatigue despite a reduced physiological strain.

204
7.2. Introduction
Fatigue may be described as an exercise-induced reduction in maximal voluntary force in
a muscle or group of muscles, whether or not the task can be sustained (Gandevia, 2001;
Sidhu et al., 2009a; Millet et al., 2011). The genesis of fatigue is task specific, but may
comprise both central and peripheral components. Central fatigue is a progressive
exercise-induced reduction in voluntary activation or neural drive to a muscle and may
comprise both spinal and supraspinal components. In contrast, peripheral fatigue is
produced by changes at or distal to the neuromuscular junction, including altered
sarcolemmal excitability and excitation-contraction coupling (Gandevia, 2001; Taylor et
al., 2006, 2007; Allen et al., 2008; Boyas and Guevel, 2011). Assessments of central and
peripheral contributions to fatigue in intermittent-sprint exercise have generally been
determined using the interpolated twitch technique by direct supramaximal electrical
stimulation of the motor nerve during and immediately following a maximal voluntary
contraction (Merton, 1954). Supramaximal stimulation of the motor nerve during a
maximal voluntary contraction (MVC) induces a superimposed twitch, an indication that
voluntary drive to the muscle is not maximal (Gandevia, 2001; Taylor et al., 2006). Any
increase in the size of the superimposed twitch indicates a reduction in voluntary drive
and therefore, provides evidence of central fatigue. Supramaximal stimulation post MVC
evokes a potentiated twitch with a decrease post exercise indicative of peripheral fatigue.
Although useful for indicating central fatigue, the interpolated twitch technique does not
allow the site of central fatigue to be localised beyond proximal to the neuromuscular
junction (Goodall et al., 2012a; Ross et al., 2012). Recently, transcranial magnetic
stimulation (TMS), applied to the motor cortex, has been used to examine central fatigue
and has the advantage that it permits the site of failure of voluntary drive to be localized
(Sidhu et al., 2009b; Goodall et al., 2012a; Ross et al; 2012). Further, TMS is reliable for
the assessment of supraspinal fatigue in the knee extensors (Goodall et al., 2009; Sidhu et
al., 2009b).

205
In intermittent-sprint exercise, when 40 m running sprints or 6 s cycling sprints, both
interspersed with 30 s recovery, are completed in a temperate environment, fatigue
manifests as a significantly reduced maximal voluntary torque in both plantar flexors and
knee extensors, increased sprint time and reduced power output (Racinais et al., 2007;
Perrey et al., 2010b). In such circumstances, decrements in voluntary activation and
reduced RMS/M wave ratio measured by electrical stimulation of the motor nerve
indicate a reduction in central drive and the presence of central fatigue. In addition,
reduced maximal M wave amplitude is reported suggesting reduced sarcolemmal
excitability and peripheral fatigue. Taken together, these indicate both central and
peripheral contributions to fatigue following exercise of this type. Recently, however,
when TMS was used to assess fatigue following intermittent-sprint exercise, cortical
voluntary activation and corticospinal excitability were not altered, but potentiated
twitch was significantly depressed (Girard et al., 2013a). This suggests a predominance of
peripheral factors in fatigue during exercise of this type (Girard et al., 2013a).
Few studies have examined peripheral and central fatigue following intermittent-sprint
exercise in the heat. Using an identical protocol as previously described (Racinais et al.,
2007; Perrey et al., 2010) Girard et al., (2013b) demonstrated that fatigue was
predominantly peripherally-mediated owing to a reduced potentiated twitch and twitch
characteristics, but heat had no effect on the pattern and extent of fatigue (Girard et al.,
2013b). In contrast, Drust et al., (2005) demonstrated a greater decline in mean power
output in hot compared to control conditions when 5 x 15 s sprints were preceded by 40
minutes of intermittent exercise. Although no direct measures to explore the mechanisms
responsible for fatigue were performed, given that no differences were observed
between conditions in recognised metabolic fatigue agents, it was suggested the greater
reduction in power output in the hot trial may have been mediated by the more
pronounced hyperthermia induced in the hot trial augmenting central fatigue (Drust et
al., 2005). The discrepancy in findings in the previous studies may be explained by the
duration of the protocol and the extent of hyperthermia induced, as in the work of Girard
et al., (2013b) nine minutes of exercise was performed and average end core
temperature was < 38.5 °C, whereas in the study of Drust et al., (2005) forty minutes of

206
exercise was performed and core temperature was elevated to > 39°C. Other studies that
replicate the durations and work-rest ratios of field-based team-sports during exercise in
the heat also demonstrate reduced intermittent-sprint performance (Morris et al., 1998,
2000, 2005). However, despite suggesting that hyperthermia and central fatigue may
explain the decrement in performance, none have used methods to assess peripheral
fatigue or central fatigue where, for example, TMS would provide greater insight. As such,
there is a need for research to examine the central and peripheral contributions to
fatigue during intermittent-sprint exercise in the heat using durations and work-rest
ratios that replicate field-based team-sports.
Heat acclimation (HA) is a strategy commonly used to improve heat tolerance and reduce
performance impairment in the heat and can be achieved using constant work rate,
isothermal strain and self-regulated exercise protocols (Taylor, 2000; Hargreaves et al.,
2008). Successive heat acclimation exposures elicit beneficial physiological adaptations,
that include the lowering of resting and exercise core temperature and heart rate,
expanded plasma volume, improved sudomotor function and reduced perception of
effort and thermal sensation (Armstrong and Maresh, 1991; Sawka et al., 1996).
Typically, adaptations exhibit a biphasic response pattern and it is suggested that
complete adaptation requires 7 - 14 days, however, up to 75% of adaptations are
complete within 4 - 6 days (Pandolf, 1988; Armstrong and Maresh, 1991). Despite the
benefits of heat acclimation to exercise performance little is known of the impact of heat
acclimation on central and peripheral contributions to fatigue and no studies have
examined the effect of exercise-heat acclimation on neuromuscular fatigue following
intermittent-sprint exercise in the heat.
That heat acclimation may ameliorate central and peripheral fatigue following
intermittent-sprint exercise is conceivable for a number of reasons. Firstly, hyperthermia
that induces core temperatures of between 38.5 - 39.5°C evokes decrements in voluntary
force production and voluntary activation (Morrison et al., 2004; Thomas et al., 2006) that
are correlated with cerebral blood flow at rest and after exercise in the heat (Nybo and

207
Nielsen, 2001b; Ross et al., 2012). In hypoxia, decreased cerebral blood flow exacerbates
declining cerebral oxygenation and contributes to a two-fold greater decline in voluntary
activation (Goodall et al., 2012a). As intermittent-sprint exercise induces greater thermal
strain and pronounced hyperthermia when performed in the heat (Nevill et al., 1995,
Morris et al., 1998, 2000, 2005; Sunderland et al., 2008) this type of exercise may also
exacerbate a decline in cerebral blood flow and oxygenation contributing to a greater
decrement in voluntary activation. Heat acclimation, that has been demonstrated in this
thesis (chapter six) and other research (Patterson et al., 2004; Castle et al., 2011; Burk et
al., 2012) to reduce the extent of hyperthermia and cardiovascular strain during exercise,
may ameliorate any decline in cerebral blood flow and cerebral oxygenation by reducing
competition for cardiac output and may therefore, ameliorate decrements in voluntary
activation and central fatigue.
Secondly, it has been suggested central drive and regulation of motor unit activity may be
mediated by afferent feedback from a number of sources including, for example,
exercising muscle (Noakes, 2012; Amann et al., 2013). In muscle, activity of group III and
IV afferents that are sensitive to the mechanical, biochemical and thermal state of the
tissue, may be upregulated during exercise in the heat and provide inhibitory input to the
CNS limiting central motor drive and performance (Gandevia, 2001; Amann et al., 2013).
Heat acclimation may contribute to a decrease in activity of these afferents subsequently
decreasing the extent of inhibitory feedback to the CNS, thereby maintaining central drive
due to the improvements in heat dissipation, reduction in extent of hyperthermia and
decreased muscle glycogenolysis and lactate formation (Kirwan et al., 1987) that are
consistent with the heat acclimation phenotype.
Thirdly, RPE and thermal sensation are improved in response to heat acclimation
(Pandolf, 1977; Regan et al., 1996; Molloy et al., 2004; Sunderland et al., 2008; Castle et
al., 2011; Burk et al., 2012). Although the mechanisms are not well understood thermal
sensation has been correlated with skin temperature (Kamon et al., 1974) and RPE has
been correlated to physiological variables such as heart rate, ventilation and blood lactate

208
(Edwards et al., 1972). As such, as increased perception of effort contributes to decreased
power output and fatigue, possibly via group III and IV afferents that project through
lamina I neurons to the sensory cortex (Craig, 2002; Enoka and Duchateau, 2008),
acclimation-induced decrements in, for example, heart rate and skin temperature, as
observed in study three, may reduce thermal sensation and RPE thereby reducing the
extent of fatigue during exercise in the heat. Recent work, however, indicates afferent
feedback from the heart and lungs does not contribute significantly to the perception of
effort during exercise (Marcora, 2009). As such, alterations in central factors with heat
acclimation, for example, neural pathways and dopamine may be involved (Marcora et
al., 2009). Finally, it has been suggested that, with hyperthermia, relaxation rate of
muscle is significantly increased requiring faster motor unit firing rates to produce fusion
of force. Therefore, an inability of descending voluntary drive to compensate for altered
augmented muscle relaxation rate may contribute to central fatigue and if heat
acclimation can reduce the extent of hyperthermia it may reduce the extent of fatigue
(Todd et al., 2005).
Theoretically at least, based on the mechanisms discussed, the potential for heat
acclimation to reduce central and peripheral fatigue following intermittent-sprint exercise
in the heat exists. Recently, however, Brazaitis and Skurvydas (2010) demonstrated no
change in central fatigue during a two minute MVC exercise following seven sessions of
passive hyperthermia. However, the passive intermittent nature of the protocol used in
this study has limited application and may have limited the potential for heat acclimation-
induced change. As such, more work needs to examine the effect of heat acclimation on
central and peripheral fatigue during intermittent-sprint exercise in the heat using TMS
when work-rest ratios and durations replicate those observed in field-based team-sports.
Therefore, the purpose of this study was to examine central and peripheral contributions
to fatigue following intermittent-sprint exercise in the heat using TMS and femoral nerve
stimulation (FNS) and to investigate whether progressive heat acclimation could
ameliorate fatigue during exercise of this type. It was hypothesised intermittent-sprint
exercise completed for forty minutes in the heat would exhibit central and peripheral
fatigue and progressive heat acclimation would reduce both these components of fatigue

209
during exercise in the heat compared to control as a result of reduced physiological
strain.
7.3. Methods
7.3.1. Participants
Seventeen male University students volunteered for the study. Participants were
randomly assigned to one of two groups; Progressive Acc imation PA, n 9) and raining
G, n 8) matched for 2peak and body surface area. Participant characteristics were as
follows (mean ± S.D. for PA and TG, respectively): age 21.1 ± 1.5 and 21.4 ± 1.6 years;
height 180.5 ± 5.2 and 177.3 ± 3.6 cm; mass 81.9 ± 9.6 and 78.5 ± 12.1 kg; BSA 2.01 ± 0.13
and 1.95 ± 0.13 m2 Body fat 16.1 3. and 18.6 6.1 2peak 46.3 ± 5.1 and 44.6 ± 7.3
ml.kg-1.min-1; Peak power 3.9 ± 0.3 and 3.6 ± 0.5 W.kg-1. All participants were
moderately-trained games players and participated in sport three to five times per week.
The study was approved and conducted as described in section 3.2.
7.3.2. Experimental design
Each participant was required to visit the laboratory on sixteen separate occasions. This
included one familiarisation visit to acquaint the participant with neuromuscular function
testing (NMF), one preliminary visit and two intermittent-sprint tests in 33°C 50% rh pre
and post twelve days of PA or TG (Figure 7.1.).

210
Figure 7.1. Schematic of experimental design with measurements.
7.3.2.1. Visit 1: familiarisation
The purpose of the familiarisation visit was to provide participants with a thorough
familiarisation to the methods for electromyography, femoral nerve stimulation and
transcranial magnetic stimulation (TMS). Prior to familiarisation, all participants

211
completed a standard medical form and were screened to determine suitability to TMS
using a specific medical questionnaire (Appendix 2). Any participants for whom TMS was
contraindicated were excluded from the study.
Force and Electromyography: For measurement of voluntary and evoked contractions,
participants were seated in a custom-modified isometric chair. The hip and knee were
positioned at 90° and a load cell (Model 615, Tedea-Huntleigh, PA, USA), interfaced with a
data acquisition system, (PowerLab 15T and Lab Chart 7.2, AD Instruments, Oxford, UK)
attached to a non-compliant strap positioned just superior to the malleoli of the right
ankle. EMG activity of the right vastus lateralis and bicep femoris was recorded.
Partici ant ’ in wa haved, wabbed and c eaned with i o ro y a coho and e f-
adhesive electrodes (H59P, Kendall, Mansfield, MA, USA) were placed 2 cm apart over the
muscle bellies and the patella. The position of electrodes was marked with indelible ink,
measured and recorded using digital images to permit accurate replication on subsequent
visits. All EMG signals were amplified, band pass filtered between 20 Hz and 2 kHz,
sampled at a rate of 4 kHz and later analysed using commercially available software (Lab
Chart 7.2, AD Instruments, UK).
Femoral nerve stimulation: With participants seated as described above, single electrical
tim i of 200 μ were de ivered via 31. mm tim ating e ectrode ode 3100C, ni-
Patch™, N, USA) to the right femoral nerve using a constant current stimulator (Figure
7.2., Model DS7A, Digitmer Ltd., Hertforsdshire, UK). Electrodes were positioned high in
the femoral triangle (cathode) and midway between the iliac crest and greater trochanter
(Goodall et al., 2010). Plateaus in twitch amplitude and M wave were determined using
an incremental protocol starting at 100 mA and increasing by 20 mA until plateaus were
achieved (Goodall et al., 2012a). To ensure stimulation intensity was supra-maximal,
stimulations were then increased by 30% and kept constant throughout the trials. Mean
stimulation intensity was 1478 ± 226 mA. Participants then performed three control
MVCs to determine peak torque and peak surface EMG and a further three contractions

212
(5 s) with femoral nerve stimulation during each MVC and an additional stimulus at rest (~
2 s). Each MVC was separated by ~ 30 s.
Figure 7.2. Digitimer constant current stimulator.
Transcranial magnetic stimulation: With participants seated as described, the vertex of
the cranium, (intersection of the mid-saggital and inter-aural lines), was identified and
marked. Optimal placement for producing a large motor evoked potential (MEP) in the
vastus lateralis and a small MEP in the bicep femoris was determined in relation to the
vertex by using a magnetic stimulator and 110 mm double-cone coil positioned over the
motor cortex (Figure 7.3., Magstim 200, Magstim LTD, UK). For participants, this location
was 1.5 ± 0.78 cm contralateral to the vertex. Single pulse TMS at 30 - 40% of stimulator
output was initially used to habituate the participant to the sensation of TMS and once
achieved, single pulse TMS at 60% of stimulator output was used to determine optimal
coil placement. Once determined, the optimal placement was recorded and marked with
indelible ink for replication in future visits. Resting motor threshold (rMT) for the knee
extensors was then established using a magnetic stimulator (Magstim 200, Magstim LTD,
UK) by starting at an output of 30% and increasing in 5% increments until the motor
evoked potential (MEP) was less than 0.05 mV in more than 50% of eight single pulse
stimuli (Groppa et al., 2012). Resting motor threshold occurred at 61.2 ± 13.4% of
maximum stimulator output. Subsequently, TMS was delivered at 1.2 times resting motor
threshold during MVCs at 50, 75 and 100% to determine cortical voluntary activation
(Figure 7.4.). This stimulation intensity (73.5 ± 16%) elicited a large MEP in the vastus
lateralis (area > 50% of maximum M wave) during nee e ten or contraction at 0

213
MVC (Figure 7.5.). Applicability and reliability of TMS for measuring voluntary activation
of knee extensors has been previously determined with typical error or measurement
ranging from 3.1 - 3.7% and intra-class correlations greater than 0.85 (Goodall et al.,
2009; Sidhu et al., 2009b).
Figure 7.3. Magstim 200 and 110 mm double cone coil.
Figure 7.4. Set up for transcranial magnetic stimulation over the motor cortex and
femoral nerve stimulation.

214
Figure 7.5. Relationship between MEP area from the vastus lateralis and contraction
strength during TMS over the motor cortex. Largest MEP area was recorded during a 50%
contraction and at this contraction strength mean MEP area was 60% of maximum M
wave.
Once familiarisation to the techniques of electromyography and FNS and TMS were
achieved, participants practiced the neuromuscular fatigue assessment protocol that
would be used pre and post intermittent-sprint exercise in the heat (Figure 7.6.). This
included a warm-up of two 50 and 75% MVCs followed by three 5 s MVCs separated by 10
s with FNS during and post MVC. TMS was then superimposed over the motor cortex
during brief (5 s) 100, 75 and 50% MVCs, separated by 5 s. This constituted one set of
TMS and this process was repeated twice more interspersed with 15 s rest to give a total
of three sets. Completion of the full NMF protocol required 2.58 minutes.
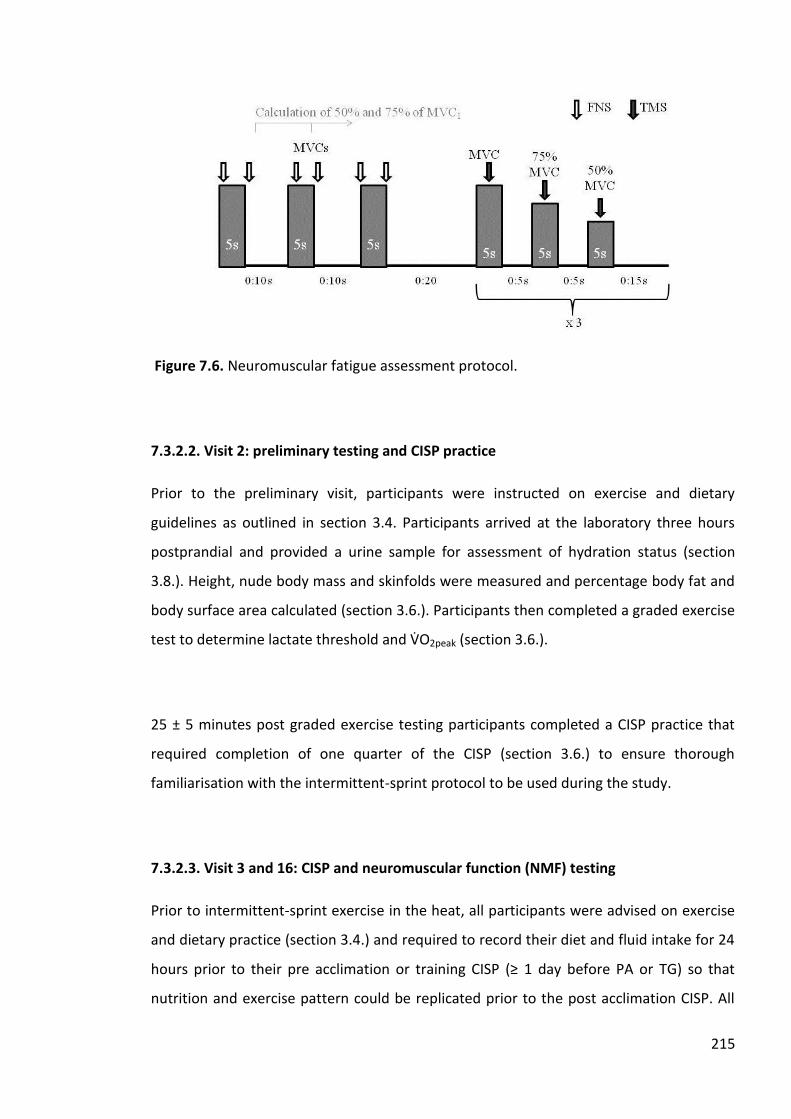
215
Figure 7.6. Neuromuscular fatigue assessment protocol.
7.3.2.2. Visit 2: preliminary testing and CISP practice
Prior to the preliminary visit, participants were instructed on exercise and dietary
guidelines as outlined in section 3.4. Participants arrived at the laboratory three hours
postprandial and provided a urine sample for assessment of hydration status (section
3.8.). Height, n de body ma and info d were mea red and ercentage body fat and
body rface area ca c ated ection 3.6.). Partici ant then com eted a graded e erci e
te t to determine actate thre ho d and 2peak (section 3.6.).
25 ± 5 minutes post graded exercise testing participants completed a CISP practice that
required completion of one quarter of the CISP (section 3.6.) to ensure thorough
familiarisation with the intermittent-sprint protocol to be used during the study.
7.3.2.3. Visit 3 and 16: CISP and neuromuscular function (NMF) testing
Prior to intermittent-sprint exercise in the heat, all participants were advised on exercise
and dietary practice (section 3.4.) and required to record their diet and fluid intake for 24
hours prior to their re acc imation or training C SP 1 day before PA or G) o that
nutrition and exercise pattern could be replicated prior to the post acclimation CISP. All

216
CISPs were completed in an environmental chamber (Section 3.7. & 3.9.) at 33.7 ± 0.6°C,
50.2 ± 3.5% rh pre and post PA or TG and NMF testing in the environmental laboratory at
21.3 ± 0.4°C, 51.7 ± 4.6% rh.
On arrival to the laboratory, all participants provided a urine sample for hydration
assessment and measured nude body mass (section 3.8.). Vertex and optimal coil position
were re-established and EMG and stimulating electrodes were re-applied. Participants
inserted a rectal probe and skin thermistors were attached (section 3.10.4.) and after 15
minutes of rest in a seated position, resting core and skin temperature were measured
and a fingertip blood sample was obtained for determination of resting blood glucose and
lactate (section 3.11.).
NMF assessment
For neuromuscular function assessment, participants were seated in a custom modified
isometric chair as previously described (Figure 7.4.). Thresholds for TMS and FNS were re-
established and participants completed a warm-up comprising two 50 and two 75%
MVCs. Participants then completed the full neuromuscular function assessment protocol
as previously described.
CISP
On completion of neuromuscular function assessment all EMG electrode positions were
marked with indelible ink and then removed. Participants entered the environmental
chamber (33.7 ± 0.6°C, 50.2 ± 3.5 % rh) and began the standard CISP warm-up (section
3.6.) followed by 40 minutes of intermittent-sprint cycling (section 3.7.) on a Monark
ergometer fitted with an SRM powermeter that continuously recorded and stored power
output at a rate of 50 Hz for the duration of exercise to permit calculation of peak power
output (PPO) and work done (WD) (section 3.5.1.). During intermittent-sprint cycling Tre,
Tsk, HR, RPE and Tsen were recorded at 1 minute into each two minute block of the CISP

217
(section 3.10.1, 3.10.4, 3.10.6). In addition, arterialised whole blood samples were
collected from a hyperemised finger and gas sampled for ∽ 45 s at 1 minute into each
fourth 2 min block (sprints 4, 8, 12, 16 and 20) during the active recovery. No fluid was
permitted during the CISP and all CISPs were repeated at the same time of day to limit
circadian effect (Winget, et al., 1985; Hill et al., 1992). Phy io ogica train inde , sk, body,
body heat content and heat production were calculated using methods described
previously (section 3.10.2., 3.10.3., 3.10.4.). Criteria for exercise termination were as
described (section 3.2.). On completion of the CISP, participants immediately exited the
chamber, towel dried, re-applied all electrodes and repeated NMF testing as previously
described. Mean time from completion of the CISP to completion of NMF assessment was
4.6 ± 0.3 minutes.
7.3.2.4. Visit 4 – 15: progressive acclimation or training
PA comprised twelve days of exercise on a cycle ergometer, 60 min.d-1 at 0 2peak
with heat stress increased in a stepwise manner on two occasions. On days 1 - 4
participants exercised in the environmental chamber at 30.8 ± 0.7°C, 49.0 ± 5.4% rh. On
day 5 - 8 heat stress was increased to 33.2 ± 0.6°C, 50.1 ± 6.2% rh and finally on days 9 -
12 the heat stress was again increased to 35.4 ± 0.6°C, 62.1 ± 6.4% rh. In TG, participants
completed twelve days of exercise in the environmental laboratory at 21.2 ± 0.9°C, 31.5 ±
6.7% rh. All sessions were completed at the same time of day and at the same time as
intermittent-sprints were performed (5 – 8 pm) to maximise any physiological responses
(Shido et al., 1999). Prior to all PA and TG sessions, participants were instructed on diet
and exercise as previously described (section 3.4.) and requested to report to the
aboratory in a e hydrated tate. Prior to every PA or G e ion artici ant ’ hydration
state was assessed and no further fluid was permitted during sessions. In addition, during
each session HR, Tre, Tsen and RPE were recorded in the final 20 s of every fifth minute and
sweat rate was determined from nude body mass measured pre and post exercise
(section 3.10.5.).

218
On day one, six and twelve of PA and TG resting HR and Tre were recorded after 15
minutes in a seated position (section 3.10.1, 3.10.4). In addition, pre and post exercise an
arterialised capillary blood sample was obtained from a hyperemised finger for
determination of haemoglobin, haematocrit and plasma volume (section 3.11.). Also on
day one, six and twelve, HR, Tre, RPE and Tsen were assessed every fifth minute in exercise.
7.3.3. Data analyses
All data were analysed offline using standard data acquisition software (Labchart 7, ADI
Instruments, UK). Peripheral voluntary activation (PVA) was determined using the
interpolated twitch technique (Merton, 1954). Specifically, the mean torque response to
femoral nerve stimulation from a superimposed twitch (SIT) during and potentiated
twitch (POT) post (~ 2 s, Figure 7.7.) from three initial MVCs in the NMF assessment
(Figure 7.6.) was used to determine peripheral voluntary activation using the equation;
Equation 7.1. Calculation of voluntary activation
VA (%) = [1-(SIT÷POT) x 100]
(Ross et al., 2007)
Figure 7.7. Data from a single participant demonstrating a potentiated twitch (Qtw,pot)

219
Figure 7.8. Data from a single participant demonstrating a superimposed twitch (SIT).
Data represent the portion of MVC in Figure 7.7. marked by dashed lines.
Cortical voluntary activation (CVA) was determined from mean torques produced during
sets of TMS at 100, 75 and 50% of MVC during the NMF assessment. As corticospinal
excitability increases during voluntary contraction it was necessary to estimate the resting
twitch amplitude for each participant (Goodall et al., 2009, Ross et al., 2012). Linear
regression was derived from the torque responses to TMS of the motor cortex during
contractions (SIT) at 100, 75 and 50% MVC and the y intercept of the regression line was
taken as the estimated resting twitch (ERT, Figure 7.9.). Cortical voluntary activation was
then calculated as;
Equation 7.2. Calculation of cortical voluntary activation
CVA (%) = [1- (SIT/ERT) x 100]
(Goodall et al., 2009)

220
Figure 7.9. Representative data from a single participant as an example of the estimation
of resting twitch using linear regression and the y intercept.
After eliciting an MEP in a target muscle there is a period of silence in EMG signal,
referred to as the cortical silent period (Figure 7.10.). During analysis, cortical silent
period (ms) was measured from the point of stimulation to the resumption of EMG
activity. Resumption of EMG was accepted as ± 2 S.D. of pre stimulus EMG for > 100 ms
(Goodall et al., 2010, 2012b). Accuracy of assessment was also confirmed by visual
inspection (Girard et al., 2013a).
Figure 7.10. Representative data from a single participant demonstrating cortical silent
period.

221
TMS-induced motor evoked potential (MEP) amplitude for the determination of
corticospinal excitability was measured offline as the absolute difference between the
maximum and minimum points (mV) (Sidhu et al., 2009b). Peak-to-peak amplitude of the
M wave (mV) evoked by femoral nerve stimulation was also determined offline using the
same method as for MEPs. MEP area and maximum M wave area were calculated as the
integral of the absolute value of the entire MEP or M wave (Sandiford et al., 2005, Sidhu
et al., 2009a). MEP area was then normalised to maximum M wave area from a nearby
MVC to ensure TMS was activating a high proportion of the knee extensor motor units
(Todd et al., 2005; Goodall et al., 2012a; Ross et al., 2012).
Contractility of muscle was assessed by measuring the amplitude of the potentiated
twitch (N) in addition to the maximal rate of force development (MRFD), maximal rate of
relaxation (MRR) and time to half relaxation (RT0.5) (ms). Maximal rate of force
development was determined as the maximal slope of the curve between 10 and 90%
amplitude, maximal rate of relaxation as the steepest decline in the twitch curve and RT0.5
as the time for the force to decay to half peak twitch amplitude (Todd et al., 2005;
Goodall et al., 2010).
7.3.4. Statistical analysis
Data were checked for normality, sphericity and variance and adjusted where necessary
using the Huynh-Feldt method or log transformation. To examine the effect of
intermittent-sprint exercise in the heat on peak power output, work done and
neuromuscular fatigue prior to PA or TG, one way repeated measures ANOVA (PPO, WD)
and dependent samples t-tests (NMF) were performed on pooled data for all seventeen
artici ant Part A). Pear on’ Corre ation coefficient wa ed to a e re ation hi
between PPO, WD and Tre. Physiological responses to twelve days PA or TG was assessed
using a three way mixed ANOVA (regime*day*time) (Part B). Subsequently, PPO, WD and
physiological responses (Part C) and neuromuscular responses (Part D) during
intermittent-sprint cycling in the heat pre-post PA or TG were assessed using a three way

222
mixed ANOVA (regime*trial*time) with repeated measures on two factors (trial*time).
Non parametric perceptual measures were assessed using a Kruskal Wallis test with
Wilcoxon signed rank test. All data were analysed using SPSS (version 20.0) and are
reported as mean ± standard deviation. Statistical significance was accepted as P < 0.05.
Effect sizes were calculated as described (section 3.13.)
7.4. Results
7.4.1. Part A: PPO, WD and neuromuscular fatigue responses to intermittent-sprint
exercise in 33°C, 50% rh (pooled data for all seventeen participants).
7.4.1.1. PPO and work done
PPO (W) was reduced during intermittent-sprint exercise in 33°C, 50% rh (main effect;
F(19,247) = 3.402, P < 0.001, ηp2 = 0.207) from sprint ten onwards (Figure 7.11., all P values <
0.05). Compared to sprint one the mean reduction in PPO in the final ten sprints was
4.0%. Work done was also reduced in the heat (main effect; F(19,247) = 3.961, P < 0.001, ηp2
= 0.221) from sprint thirteen onwards (all P values < 0.05). Compared to the first sprint,
mean work done in the final eight sprints was reduced by 4.5%. Both PPO and WD were
strongly negatively correlated with Tre during intermittent-sprint exercise (r = - 0.926, P <
0.001 and r = - 0.931, P < 0.001, PPO and WD respectively, Figure 7.12).

223
Figure 7.11. Mean (± S.D.) PPO (W) and work done (J) during CISP 1 in 33°C, 50% rh.
*Significant difference from sprint one (P < 0.05).

224
Figure 7.12. PPO (W) and work done (J) correlated with Tre (°C).
7.4.1.2. Neuromuscular fatigue
Maximal voluntary contraction force was significantly reduced after Intermittent-sprint
exercise in 33°C and 50% rh (Figure 7.13., 503 ± 90 vs 403 ± 79 N, - 19%, P < 0.001).

225
Figure 7.13. Maximal voluntary contraction force (N) pre-post CISP 1. *Significant
difference between pre and post CISP 1.
Cortical voluntary activation was reduced after intermittent-sprint exercise in 33°C, 50%
rh (Figure 7.14.; 90.9 ± 5.5 vs 84.6 ± 8.4%, P < 0.001). Similarly, peripheral voluntary
activation was reduced (Figure 7.14.; 89.7 ± 4.4 vs 86.4 ± 5.2%, P = 0.005).
Figure 7.14. Cortical (CVA) and peripheral voluntary activation (PVA) (%) pre-post CISP 1.
*Significant difference between pre and post CISP 1 (P < 0.05).

226
Potentiated twitch force (- 21.5%), maximal rate of force development (- 18.9%) and time
to half relaxation (- 37.9%) were significantly reduced after intermittent-sprint exercise in
33°C, 50% rh. Maximal relaxation rate and measures of corticospinal excitability and
conduction time were not different after intermittent-sprinting in the heat. Similarly,
Mmax amplitude, MEP area to Mmax area and RMS:M wave ratio were not significantly
different after exercise in the heat.
Table 7.1. Neuromuscular variables pre-post CISP 1.
Variable Pre Post
Q tw,pot (N) 181 ± 33 142 ± 35* MRFD (N.ms-1) 5.915 ± 4.329 4.794 ± 3.346*
MRR (N.ms-1) 0.826 ± 0.391 0.945 ± 0.584
RT0.5 (ms) 89.4 ± 26.2 55.5 ± 21.3*
Mmax amplitude (mV) 7.6 ± 4.6 7.8 ± 4.4
MEParea:Mmaxarea 52.7 ± 15.7 51.7 ± 17.6
CSP (ms) 142 ± 10 140 ± 50
Latency (ms) 20 ± 9 22 ± 1
RMS:M-wave (au) 0.048 ± 0.011 0.052 ± 0.020
ERT (N) 133 ± 41 95 ± 29*
Data are mean (± S.D.). Q tw,pot (Potentiated twitch), MRFD (maximal rate of force development), MRR (maximal rate of relaxation), RT0.5 (half relaxation time), CSP (cortical silent period), au (arbitrary units), MEP (motor evoked potential),* Significant difference between pre and post CISP 1 (all P values < 0.05)
7.4.2. Part B: Physiological and perceptual responses to twelve days of PA and TG
7.4.2.1. Body mass and hydration
Pre-exercise body mass and hydration status were not different between days in any
group (all main effect time*regime P values > 0.05, Table 7.2.) indicating participants
were in a similar physiological state prior to acclimation or training on day one, six and
twelve.

227
Table 7.2. Body mass and hydration during PA and TG on day 1, 6 and 12.
Day 1 Day 6 Day 12
Body Mass (kg) PA 81.76 ± 8.58 81.62 ± 8.49 81.00 ± 9.12
TG 77.70 ± 11.73 77.91 ± 10.86 77.74 ± 11.63
Usg
PA 1.011 ± 0.01 1.010 ± 0.01 1.004 ± 0.01
TG 1.011 ± 0.01 1.012 ± 0.01 1.010 ± 0.01
Uosm (mOsm.kg-1)
PA 384 ± 190 360 ± 231 154 ± 120
TG 358 ± 287 400 ± 245 354 ± 269
Data are mean (± S.D.).
7.4.2.2. Heart rate
There was a main effect of time on resting heart rate (b.min-1) across days one to twelve,
(F(2,30) 5.171, P = 0.012, ηp2 = 0.256, Table 7.3.). Resting heart rate in PA decreased from
65 ± 10 b.min-1 on day one to 56 ± 8 b.min-1 on day twelve (P = 0.027), but no difference
was observed in TG (P = 1.000). Heart rate increased during exercise in PA and TG each
day (main effect time: F(11,165) 94.253, P < 0.001, ηp2 = 0.863) and differed between groups
in the final five minutes of exercise on day one and from fifteen minutes onwards on day
six and twelve (main effect day*time*regime: F(22,330) 3.233, P < 0.001, ηp2 = 0.177: Post
hoc; all P values < 0.05). Mean exercise heart rate was significantly higher in PA on day six
(150 ± 16 vs. 134 ± 13 b.min-1 PA and TG respectively) and twelve (153 ± 19 vs. 128 ± 10
b.min-1 PA and TG, respectively) and in TG, exercise heart rate was significantly lower on
day twelve compared to day one (137 ± 12 vs. 128 ± 10 b.min-1) with no difference in
acclimation (main effect day*regime: F(2,30) 3.907, P = 0.031, ηp2 = 0.207: Post hoc; all P
values < 0.05, Table 7.3.). Peak heart rate was significantly higher in PA compared to TG
on day one, six and twelve and was significantly reduced in TG on day twelve compared
to day six and was significantly elevated on day twelve compared to day six during PA
(main effect day*regime: F(2,30) 7.932, P = 0.002, ηp2 = 0.346: Post hoc; all P values < 0.05,
Table 7.3.).

228
7.4.2.3. Rectal temperature
Resting Tre was reduced over time (main effect: F(2,30) 7.067, P = 0.003, ηp2 = 0.320). With
PA resting Tre was reduced by 0.3°C on day six (P < 0.05, Table 7.3.). Resting rectal
temperature was not different with TG over twelve days (P > 0.05, Table 7.3.). Tre
increased during exercise in PA and TG each day (main effect time: F(11,165) 4.063, P <
0.001, ηp2 = 0.938) and was higher in PA in the final five minutes of exercise on day six and
from twenty minutes onwards on day twelve (main effect day*time*regime: F(22,330)
9.802, P < 0.001, ηp2 = 0.395: Post hoc; all P values < 0.05). Mean exercise Tre was not
different between PA and TG over day one to twelve and was not different within groups
over the duration of PA or TG (main effect day*regime: F(2,30) 2.221, P = 0.126, ηp2 =
0.129). Peak Tre was higher in PA compared to TG on day six and twelve and was
significantly higher in PA on day six and twelve (main effect day*regime: F(2,30) 8.238, P =
0.001, ηp2 = 0.355: Post hoc; all P values < 0.05, Table 7.3.).
7.4.2.4. RPE and Tsen
Mean RPE was not different between groups on day one and six, but was significantly
higher during PA on day twelve (13.5 ± 2.2 vs 10.8 ± 1.7, PA and TG respectively) and in
TG, RPE was significantly reduced on day six and twelve compared to day one (Table 7.3.,
main effect day*regime: F(2,30) 7.562, P = 0.002, ηp2 = 0.335: Post hoc; all P values < 0.05).
Peak RPE was significantly higher in PA compared to TG on day twelve, was significantly
reduced in TG on day twelve compared to day one and was significantly higher in PA on
day twelve compared to day six (main effect day*regime: F(2,30) 7.216, P = 0.003, ηp2 =
0.325: Post hoc; all P values < 0.05, Table 7.3.). RPE increased significantly during exercise
(main effect time: F(11,165) 81.803, P < 0.001, ηp2 = 0.845) and was significantly higher at all
time points in exercise in PA compared to TG on day twelve (main effect
day*time*regime: F(22,330) 3.167, P < 0.001, ηp2 = 0.174: Post hoc; all P values < 0.05). Tsen
was significantly different between and within groups during PA and TG (Chi Squared =
56.716, P < 0.001, ES = 0.7988). Tsen in PA was significantly elevated on day six and twelve
compared to day one (all P values < 0.05, Table 7.3.) and in TG, Tsen was reduced on day
six and twelve compared to day one (all P values < 0.05, Table 7.3.). Peak Tsen was

229
significantly different between and within groups during PA and TG (Chi Squared =
40.304, P < 0.001, ES = 0.8061). Peak Tsen was higher in PA compared to TG on day one, six
and twelve. TG reduced Peak Tsen by day six and in PA, Peak Tsen was significantly elevated
on day twelve.
Table 7.3. Physiological and perceptual responses at rest and exercise in PA and TG on
day 1, 6 and 12.
Day 1 Day 6 Day 12
Resting HR(b.min-1) PA 65 ± 10 61 ± 6 56 ± 8*
TG 70 ± 14 66 ± 8 67 ± 12
Exercise HRmean (b.min-1)
PA 150 ± 18 150 ± 16 153 ± 19
TG 137 ± 12 134 13† 128 10*†
Exercise HRpeak (b.min-1)
PA 158 ± 18 161 ± 14 167 ± 8+
TG 1 1 12† 1 3 8† 13 10†+
Resting Tre(°C)
PA 37.4 ± 0.2 37.1 ± 0.2* 37.1 ± 0.2*
TG 37.5 ± 0.2 37.3 ± 0.2 37.3 ± 0.2
Exercise Tre mean (°C)
PA 37.8 ±0.5 37.8 ± 0.4 37.9 ± 0.5
TG 37.9 ± 0.4 37.7 ± 0.3 37.7 ± 0.3
Exercise Tre peak(°C)
PA 38.2 ± 0.4 38.2 ± 0.2 38.6 ± 0.2*+
TG 38.1 ± 0.3 3 .9 0.1† 3 .9 0.3†
Sweat rate (l.hr-1)
PA 0.96 ± 0.28 1.15 ± 0.32* 1.19 ± 0.51*+
TG 0.68 ± 0.35 0.6 0.21† 0.69 ± 0.22†
Exercise RPEmean
PA 14 ± 2 13 ± 2 14 ± 2
TG 13 ± 2 12 ± 2* 11 2*†
Exercise RPEpeak
PA 15.3 ± 2.2 14.2 ± 2.2 16.0 ± 2.0+
TA 15.0 ± 2.5 13.8 ± 1.6 11.8 1.9†*
Exercise Tsen mean
PA 5.9 ± 0.6 6.3 ± 0.5* 6.7 ± 0.5*
TG 5.1 ± 0.6 4.8 ± 0.5* .9 0. †*
Exercise Tsen peak
PA 6.4 ± 0.5† 6.6 ± 0.4† 7.2 ± 0.3*+†
TG 5.6 ± 0.5 5.0 ± 0.6* 5.1 ± 0.2*
Haemoglobin (g.dl-1)
PA 14.4 ± 1.5 13.9 ± 1.4 14.3 ± 1.1

230
Day 1 Day 6 Day 12
TG 15.1 ± 1.6 14.6 ± 8.9 14.5 ± 1.1 Haematocrit
PA 0.44 ± 0.02 0.44 ± 0.03 0.44 ± 0.02
TG 0.45 ± 0.04 0.45 ± 0.03 0.44 ± 0.04
PV change (%) Day 1-6 Day 6-12 Day 1-12
PA 3.5 ± 7.6 0.03 ± 4.3 3.3 ± 13.4
TG 4.8 ± 12.1 - 0.92 ± 8.77 3.6 ± 13.4
Data are mean (± S.D.).*Significant difference from day 1 (P < 0.0 ). †Significant difference between groups (P < 0.05) +Significant difference from day 6 (P < 0.05).
7.4.2.5. Sweat rate
Sweat rate was significantly higher in PA compared to TG on days six (1.15 ± 0.32 vs 0.65 ±
0.21 l.min-1) and twelve (1.19 ± 0.51 vs 0.69 ± 0.22 l.min-1 respectively) and was
significantly higher during PA on day six and day twelve compared to day one (main effect
day*regime: F(2,30) 7.562, P = 0.002, ηp2 = 0.335: Post hoc; all P values < 0.05). Sweat rate
did not change over time with TG (all P values > 0.05).
7.4.2.6. Haemoglobin, haematocrit and plasma volume
Haemoglobin was not different between or within groups over time (main effect
day*regime: F(2,30) 0.383, P = 0.685, ηp2 = 0.025, Table 7.3.). Similarly, haematocrit was not
different between or within groups over time (main effect day*regime: F(2,30) 0.337, P =
0.717, ηp2 = 0.022, Table 7.3.). Plasma volume was increased 3.4 ± 7.6 and 4.8 ± 12.1% in
PA and TG, respectively, from day one to six. From day six to twelve plasma volume
increased 0.03 ± 4.3% and decreased by -0.9 ± 8.7% in PA and TG, respectively. The
change in plasma volume was not significant within or between groups (main effect
day*regime: F(2,30) 1.622, P = 0.215, ηp2 = 0.104, Table 7.3.).

231
7.4.3. Part C: Performance, physiological and perceptual responses to intermittent-
sprint exercise in 33°C, 50% rh pre-post twelve days of PA or TG
7.4.3.1. Participants
Two participants (one from PA and TG respectively) were unable to complete the final
CISP due to injury. Consequently, data analyses for performance, physiological,
perceptual and neuromuscular responses to intermittent-sprint exercise were analysed
on fifteen participants (PA = 8, TG = 7). Pre-exercise body mass and hydration status were
not different between CISP 1 and 2 in any group (all main effect P values > 0.05) indicating
participants were in a similar hydration state prior to intermittent-sprint exercise in the
heat.
7.4.3.2. PPO and Work Done
PPO during CISP 1 and 2 was not significantly different between or within groups after PA
or TG (CISP 1, 1058 ± 148 and 935 ± 182 W in PA and TG, respectively; CISP 2, 1060 ± 120
and 995 ± 157 W in PA and TG, respectively) (main effect day*regime: F(1,13) 1.232, P =
0.289, ηp2 = 0.093, Figure 7.15.). During exercise, PPO was reduced in CISP 1 by 6.7% in PA
and by 5.3% in TG. Post PA or TG, PPO was reduced in CISP 2 by 6.8% in PA and 3.2% in
TG. The reductions in performance over time were not significant between or within
conditions (main effect regime*day*time: F(19,228) 0.304, P = 0.998, ηp2 = 0.025, Figure
7.15.). There was a significant effect of regime on work done in CISP 1 and 2 (CISP 1, 3047
± 409 and 2751 ± 495 W in PA and TG respectively; CISP 2, 2995 ± 349 and 2836 ± 157 W
PA and TG respectively) (main effect day*regime: F(1,13) 5.507, P = 0.037, ηp2 = 0.315).
Work done was reduced during CISP 1 by 4.8% in PA and 6.2% in TG. After PA and TG,
work done during CISP 2 was reduced 1 and 3% in PA and TG, respectively (main effect
regime*day*time: F(19,228) 0.340, P = 0.996, ηp2 = 0.028, Figure 7.15.).

232
Figure 7.15. Mean (± S.D.) PPO (W) and Work Done (J) in CISP 1 and CISP 2.
7.4.3.3. Heart rate
Resting heart rate prior to intermittent sprinting was not significantly different between
groups pre CISP 1 or CISP 2, but was reduced by PA (main effect day*regime: F(1,13) 4.814,
P = 0.047, ηp2 = 0.104: Post hoc; P < 0.05, Table 7.4.). Mean exercise heart rate was
reduced in CISP 2 compared to CISP 1 (main effect day: F(1,12) 18.544, P = 0.001, ηp2 =
0.607). Heart rate increased during intermittent-sprint exercise (main effect time: F(19,228)
56.816, P < 0.001, ηp2 = 0.826) and mean exercise heart rate was significantly lower in
CISP 2 after PA (main effect day*regime: F(1,12) 7.777, P = 0.016, ηp2 = 0.393: Post hoc; P <
0.05, Table 7.4) from sprint one to twenty (all P values < 0.05). TG did not reduce mean
exercise heart rate during the CISP (P = 0.335). Although peak heart rate tended to
decline after both PA and TG (-13 and -7 beats.min-1 in PA and TA respectively, Table 7.4),

233
the change was not significant from CISP 1 to 2 (main effect day*regime: F(1,12) 2.324, P =
0.151, ηp2 = 0.152).
Table 7.4. Physiological and perceptual measures during intermittent-sprint exercise
before and after PA or TG.
CISP 1 (pre intervention) CISP 2 (post intervention) Absolute Change Resting HR (b.min-1)
PA 65 ± 9 55 ± 4.2* -10
TG 67 ± 13 64 ± 10 -3
Exercise HRmean (b.min-1)
PA 159 ± 17 142 ± 18* -17
TG 160 ± 20 155 ± 18 -5
Exercise HRpeak (b.min-1)
PA 168 ± 19 155 ± 19 -13
TG 173 ± 14 166 ± 18 -7
Resting Tre (°C)
PA 37.3 ± 0.2 37.0 ± 0.2* -0.3
TG 37.5 ± 0.4 37. 5± 0.3 0.0
Exercise Tre mean (°C)
PA 37.9 ± 0.4 37.6 ± 0.4 -0.3
TG 38.0 ± 0.5 37.8 ± 0.4 -0.2
Exercise Tre peak(°C)
PA 38.5 ± 0.36 38.1 ± 0.3 -0.4
TG 38.5 ± 0.44 38.2 ± 0.3 -0.3
Exercise PSImean
PA 5.5 ± 1.8 4.7 ± 1.4 -0.8
TG 5.5 ± 1.7 4.6 ± 1.5 -0.9
Exercise PSIpeak
PA 7.2 ± 1.8 6.1 ± 1.4 -1.1
TG 7.3 ± 1.3 6.3 ± 1.1 -1.0
sk (°C)
PA 35.15 ± 0.8 34.82 ± 0.65* -0.33
TG 35.38 ± 0.7 35.08 ±0.67 -0.3
BHC (J)
PA 10615 ± 1143 10471 ± 1075 -144
TG 10224 ± 1490 10181 ± 1425 -43
Sweat rate (l.hr-1)
PA 1.31 ± 0.19 1.48 ± 0.21 +0.17
TG 1.32 ± 0.52 1.39 ± 0.35 +0.07
Blood [lactate] (mM)
PA 3.9 ± 1.1 3.2 ± 0.7 -0.7
TG 4.1 ± 1.2 3.9 ± 1.2 -0.2
O2 (l.min-1)
PA 2.3 ± 0.3 2.3 ± 0.2 0

234
TG 2.1 ± 0.2 2.2 ± 0.4 +0.1
CISP 1 (pre intervention) CISP 2 (post intervention) Absolute Change Exercise RPEmean
PA 14 ± 3 12 ± 2 -2
TG 14 ± 3 12 ± 2 -2
Exercise RPEpeak
PA 16 ± 2 13 ± 2 -3
TG 16 ± 3 12 ± 2 -4
Exercise Tsen mean
PA 6.2 ± 0.7 5.7 ± 0.5* -0.5
TG 6.2 ± 0.8 5.7 ± 0.5* -0.5
Exercise Tsen peak
PA 6.9 ± 0.6 6.3 ± 0.7 -0.6
TG 6.8 ± 0.8 6.0 ± 0.5 -0.8
Data are mean (± S.D.). *Significant difference from CISP 1.
7.4.3.4. Tre a sk
Resting Tre prior to intermittent sprinting was not significantly different between groups
pre CISP 1 or CISP 2 but was reduced by PA (main effect regime*day: F(1,13) 5.188, P =
0.046, ηp2 = 0.342: Post hoc; P < 0.05, Table 7.4.). Mean exercise Tre was reduced in CISP 2
compared to CISP 1 (main effect day: F(1,12) 19.893, P = 0.001, ηp2 = 0.624). The reduction
in Tre from CISP 1 to CISP 2 was 0.3°C in PA and 0.2°C in TG, but was not different between
or within groups (main effect day*regime: F(1,12) 3.037, P = 0.107, ηp2 = 0.202, Table 7.4.).
Similarly, Tre increased during intermittent-sprint exercise (main effect time: F(19,228) 1.523,
P < 0.001, ηp2 = 0.938) but the increase was not different between or within PA nor TG.
Although peak exercise Tre tended to decline after both PA and TG (0.4°C, 0.3°C
respectively) the change was not significant from CISP 1 to CISP 2 (main effect
regime*day: F(1,13) 2.334, P = 0.151, ηp2 0.1 2, ab e . .). sk was lower in CISP 2
compared to CISP 1 from sprint twelve onwards following PA (main effect
regime*day*time: F(19,228) 3.166, P < 0.001, ηp2 0.209: Po t hoc a P va e 0.0 , ab e
. .). G did not red ce sk during intermittent-sprint exercise in the heat (all P values >
0.05).

235
7.4.3.5. Sweat rate, PSI, BHC and heat production
Sweat rate was not different within or between groups in CISP 1 and 2 after PA or TG
(main effect regime*day: F(1,13) 0.597, P = 0.453, ηp2 = 0.044). PSI was reduced in CISP 2
(main effect day: F(1,12) 13.222, P = 0.003, ηp2 = 0.524), but was not significantly different
between or within groups after PA or TG (main effect regime*day: F(1,12) 0.388, P = 0.545,
ηp2 = 0.031). Peak PSI was reduced from CISP 1 to CISP 2 (main effect day: F(1,13) 0.012, P <
0.001, ηp2 = 0.650), but was not significantly different between or within groups after PA
or TG (main effect regime*day: F(1,13) 0.012, P = 0.914, ηp2 = 0.001). BHC (J) was lower in
CISP 2 compared to CISP 1 in all twenty sprints following PA (main effect
regime*day*time: F(19,228) 3.475, P < 0.001, ηp2 = 0.225: Post hoc; all P values < 0.05, Table
7.4.). TG did not reduce BHC during intermittent-sprint exercise in the heat (all P values >
0.05). Heat production (W and W.m2-1) in CISP 1 and CISP 2 in PA (755 ± 103 vs. 766 ± 85
W and 378 ± 51 vs. 383 ± 42 W.m2-1) and TG (697 ± 94 vs. 743 ± 126 W and 358 ± 44 vs.
381 ± 59 W.m2-1) was not significantly different within or between groups (all main effect
P values > 0.05).
7.4.3.6 Bl l e O2
Mean blood lactate concentration was not significantly different between or within PA or
TG (main effect regime*trial*time: F(4,52) 1.273, P = 0.292, ηp2 0.089, ab e . .).
Simi ar y, mean 2 did not differ between or within groups over time (main effect
regime*trial*time: F(4,52) 1.189, P = 0.328, ηp2 = 0.090, Table 7.4.).
7.4.3.7. RPE and Tsen
RPE was not significantly different between or within groups after PA or TG (main effect
regime*day: F(1,13) 0.528, P = 0.480, ηp2 = 0.039) but was reduced from CISP 1 to CISP 2
(main effect day: F(1,13) 8.830, P = 0.011, ηp2 = 0.404). RPE increased during intermittent-
sprint exercise (main effect time: F(19,247) 55.233, P < 0.001, ηp2 = 0.809), but was not
different within or between groups from CISP 1 to 2 (main effect regime*time; F(19,247)

236
0.305, P = 0.998, ηp2 = 0.023). Peak RPE was reduced from CISP 1 to CISP 2 (main effect
day: F(1,13) 16.911, P = 0.001, ηp2 = 0.565), but was not significantly different between or
within groups after PA or TG (main effect regime*day: F(1,13) 0.194, P = 0.667, ηp2 = 0.015).
Tsen was not significantly different between PA and TG in CISP 1 or CISP 2 (Chi Squared =
0.388, P = 0.533, ES = 0.009 and 2.927, 0.087, 0.075 respectively). Tsen was, however,
reduced by both PA (Chi Squared = 5.615, P = 0.018, ES = 0.1439) and TG (Chi Squared =
13.248, P < 0.001, ES = 0.2561). After PA, Tsen was lower in CISP 2 compared to CISP 1
from sprint seven (all P values < 0.05). After TG, Tsen was lower in CISP 2 compared to CISP
1 from sprint 16 – 20 (all P values < 0.05). Peak Tsen was not different between or within
groups (Chi Squared = 1.825, P = 0.177, ES = 0.1216).
7.4.4. Part D: Neuromuscular responses to intermittent-sprint exercise in the heat
7.4.4.1. Muscular function
MVC force (N) was reduced by intermittent-sprint exercise in the heat (main effect time;
F(1,13) 152.7, P < 0.001, ηp2 = 0.922) and there was a significant interaction (main effect
trial*time*regime; F(1,13) 5.013, P = 0.043, ηp2 = 0.278). Pre post CISP 1 MVC decreased in
PA (498 ± 109 vs 397 ± 98 N respectively, Table 7.5.) and was also decreased pre post
CISP 2 after twelve days of PA (507 ± 103 vs 423 ± 96, all P values < 0.05, Table 7.5.). In
TG, MVC was reduced by intermittent-sprint exercise in the heat in CISP 1 (510 ± 72 vs
411 ± 58 N) and CISP 2 (503 ± 66 vs 382 ± 38 N, all P values < 0.05, Table 7.5.).
A trend toward a reduction in peripheral voluntary activation (%) was observed in both PA
and TG in CISP 1 and CISP 2 (Table 7.5.), however, while there was an effect of time (main
effect; F(1,13) 17.165, P = 0.001, ηp2 = 0.569) there was no significant difference within or
between groups over time (main effect trial*time*regime; F(1,13) 0.270, P = 0.612, ηp2 =
0.20). ERT during PA was reduced in CISP 1 and 2 by 30.8 and 21.5% respectively (Table
7.5.). In TG ERT was also reduced in both CISPs (24.9 and 11.3%, CISP 1 and 2 respectively,
Table 7.5.). The observed differences were not significantly different within or between
groups (main effect trial*time*regime; F(1,13) 0.018, P = 0.895, ηp2 = 0.001, Table 7.5.).

237
Qtw,pot (N) was also reduced after intermittent-sprint exercise in the heat and there was a
significant interaction (main effect trial*time*regime; F(1,13) 5.743, P = 0.032, ηp2 = 0.306).
Pre-post CISP 1 Qtw,pot decreased in PA (- 24.7%) and was also reduced pre post CISP 2 (-
17.6%) (Table 7.5., all P values < 0.05). Similarly, with TG Qtw,pot was reduced pre-post
both CISPs (- 20.5 and - 19.1% respectively, all P values < 0.05, Table 7.5.). There was no
effect of time and no interaction effect of intermittent-sprint exercise on MRFD, MRR and
RT0.5 pre-post CISP 1 or CISP 2 in PA or TG (all main effect P values > 0.05, Table 7.5.).
7.4.4.2. EMG activity
Maximum M wave amplitude (mV) and area (μV.s-1) was not different pre-post CISP 1 or 2
in PA or TG (all main effect P values > 0.05, Table 7.5.). Similarly, raw RMS EMG activity of
the vastus lateralis (main effect trial*time*regime; F(1,13) 0.385, P = 0.546, ηp2 = 0.031,
Table 7.5.) and normalized activity (RMS/Mmax) (main effect trial*time*regime; F(1,13)
1.390, P = 0.261, ηp2 = 0.104, Table 7.5) were not altered by intermittent sprinting in the
heat before or after twelve days of PA or TG.
7.4.4.3. Cortical drive
There was no significant difference in cortical voluntary activation between PA and TG in
CISP 1 or CISP 2 (main effect regime*trial; F(1,13) 0.377, P = 0.550, ηp2 = 0.028), but it
differed over time (main effect time; F(1,13) 20.188, P = 0.001, ηp2 = 0.608). During CISP 1
cortical voluntary activation decreased in PA (-6.1%) and TG (-9.8%) (all P values > 0.05).
Similarly, After twelve days of PA or TG, cortical voluntary activation was reduced in both
PA and TG (5.6% and 7.5% respectively, all P values > 0.05), however there was no
difference in cortical voluntary activation within or between groups pre and post
intervention (main effect regime*trial*time; F(1,13) 0.131, P = 0.723, ηp2 = 0.010). In PA the
mean SIT pre-post CISP 1 and 2 was 4.8 ± 1.9 vs 4.6 ± 1.9% and 3.7 ± 1.6 vs 4.3 ±2.3% of
MVC respectively. After TG, SIT as a percentage of MVC in CISP 1 and 2 was 2.0 ± 1.6 vs
3.1 ± 1.7% and 2.6 ± 2.9 and 4.3 ± 3.5% respectively. These differences were not

238
significant within or between groups (main effect regime*trial*time; F(1,13) 0.052, P =
0.823, ηp2 = 0.004).
MEP amplitude (mV) and MEP area (μV.s-1) measured during brief voluntary contractions
was not affected by intermittent-sprint exercise in the heat pre-post CISP 1 or CISP 2 in PA
or TG (all main effect P values > 0.05, Table 7.5.). When MEP area was normalized to
Mmax a significant interaction was observed (main effect regime*trial*time; F(1,13) 5.743,
P = 0.032, ηp2 = 0.306). MEParea/Mmaxarea was significantly increased after TG in CISP 1
compared to CISP 2 (P = 0.036), was significantly higher post CISP before compared to
after TG (P = 0.008) and was significantly different compared to PA at this timepoint in
CISP 1 (P = 0.032). PA did not alter MEParea/Mmaxarea (all P values > 0.05). Cortical silent
period and latency were not significantly altered pre-post CISP one or two in PA or TG (all
main effect P values > 0.05, Table 7.5).
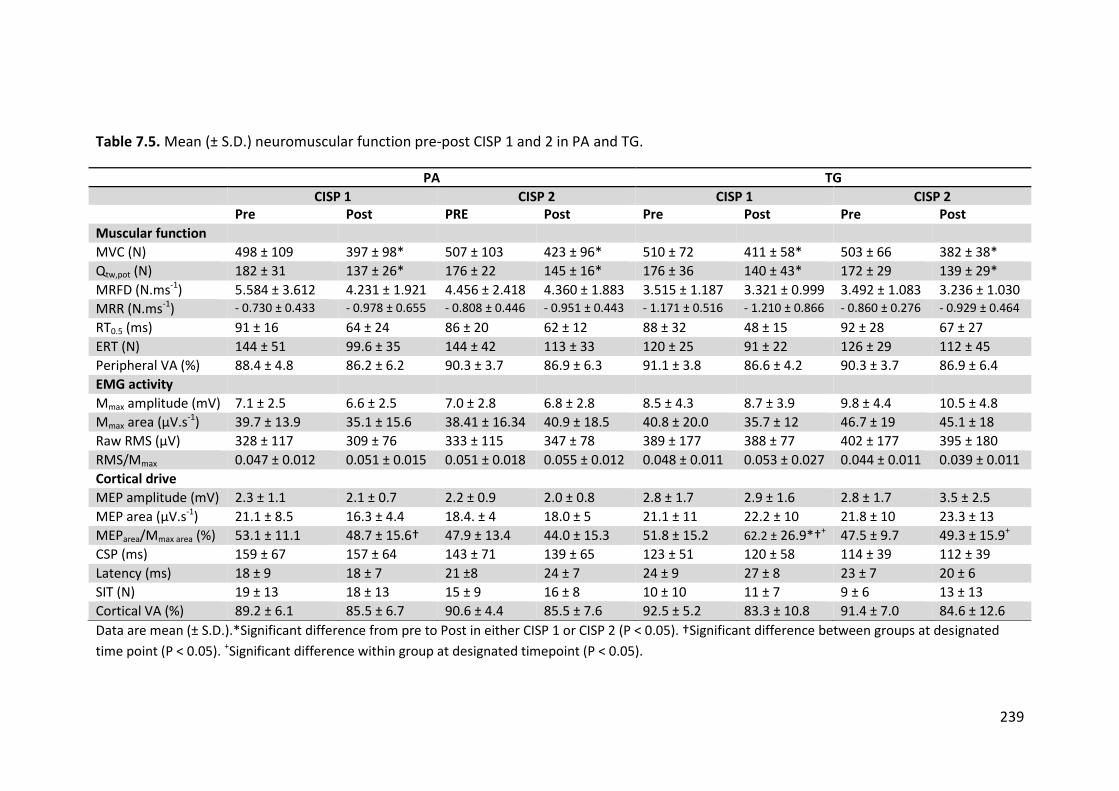
239
Table 7.5. Mean (± S.D.) neuromuscular function pre-post CISP 1 and 2 in PA and TG.
Data are mean (± S.D.).*Significant difference from re to Po t in either C SP 1 or C SP 2 P 0.0 ). †Significant difference between gro at de ignated
time point (P < 0.05). +Significant difference within group at designated timepoint (P < 0.05).
PA TG
CISP 1 CISP 2 CISP 1 CISP 2 Pre Post PRE Post Pre Post Pre Post
Muscular function
MVC (N) 498 ± 109 397 ± 98* 507 ± 103 423 ± 96* 510 ± 72 411 ± 58* 503 ± 66 382 ± 38*
Qtw,pot (N) 182 ± 31 137 ± 26* 176 ± 22 145 ± 16* 176 ± 36 140 ± 43* 172 ± 29 139 ± 29*
MRFD (N.ms-1) 5.584 ± 3.612 4.231 ± 1.921 4.456 ± 2.418 4.360 ± 1.883 3.515 ± 1.187 3.321 ± 0.999 3.492 ± 1.083 3.236 ± 1.030
MRR (N.ms-1) - 0.730 ± 0.433 - 0.978 ± 0.655 - 0.808 ± 0.446 - 0.951 ± 0.443 - 1.171 ± 0.516 - 1.210 ± 0.866 - 0.860 ± 0.276 - 0.929 ± 0.464
RT0.5 (ms) 91 ± 16 64 ± 24 86 ± 20 62 ± 12 88 ± 32 48 ± 15 92 ± 28 67 ± 27
ERT (N) 144 ± 51 99.6 ± 35 144 ± 42 113 ± 33 120 ± 25 91 ± 22 126 ± 29 112 ± 45
Peripheral VA (%) 88.4 ± 4.8 86.2 ± 6.2 90.3 ± 3.7 86.9 ± 6.3 91.1 ± 3.8 86.6 ± 4.2 90.3 ± 3.7 86.9 ± 6.4
EMG activity
Mmax amplitude (mV) 7.1 ± 2.5 6.6 ± 2.5 7.0 ± 2.8 6.8 ± 2.8 8.5 ± 4.3 8.7 ± 3.9 9.8 ± 4.4 10.5 ± 4.8
Mmax area (μV.s-1) 39.7 ± 13.9 35.1 ± 15.6 38.41 ± 16.34 40.9 ± 18.5 40.8 ± 20.0 35.7 ± 12 46.7 ± 19 45.1 ± 18
Raw RMS (μ ) 328 ± 117 309 ± 76 333 ± 115 347 ± 78 389 ± 177 388 ± 77 402 ± 177 395 ± 180
RMS/Mmax 0.047 ± 0.012 0.051 ± 0.015 0.051 ± 0.018 0.055 ± 0.012 0.048 ± 0.011 0.053 ± 0.027 0.044 ± 0.011 0.039 ± 0.011
Cortical drive
MEP amplitude (mV) 2.3 ± 1.1 2.1 ± 0.7 2.2 ± 0.9 2.0 ± 0.8 2.8 ± 1.7 2.9 ± 1.6 2.8 ± 1.7 3.5 ± 2.5
MEP area (μV.s-1) 21.1 ± 8.5 16.3 ± 4.4 18.4. ± 4 18.0 ± 5 21.1 ± 11 22.2 ± 10 21.8 ± 10 23.3 ± 13
MEParea/Mmax area (%) 53.1 ± 11.1 48.7 ± 15.6† 47.9 ± 13.4 44.0 ± 15.3 51.8 ± 15.2 62.2 ± 26.9*†+ 47.5 ± 9.7 49.3 ± 15.9+
CSP (ms) 159 ± 67 157 ± 64 143 ± 71 139 ± 65 123 ± 51 120 ± 58 114 ± 39 112 ± 39
Latency (ms) 18 ± 9 18 ± 7 21 ±8 24 ± 7 24 ± 9 27 ± 8 23 ± 7 20 ± 6
SIT (N) 19 ± 13 18 ± 13 15 ± 9 16 ± 8 10 ± 10 11 ± 7 9 ± 6 13 ± 13
Cortical VA (%) 89.2 ± 6.1 85.5 ± 6.7 90.6 ± 4.4 85.5 ± 7.6 92.5 ± 5.2 83.3 ± 10.8 91.4 ± 7.0 84.6 ± 12.6

240
7.5. Discussion
The objectives of this study were to assess the neuromuscular responses to intermittent-
sprint exercise in the heat and to examine the effect of progressive heat acclimation on
central and peripheral fatigue during intermittent-sprint exercise in the heat using TMS
and FNS. This study is the first to use TMS to assess fatigue in intermittent-sprint exercise
in the heat and a novel finding was the reduction in cortical voluntary activation when
intermittent-sprint exercise was completed over forty minutes duration in 33°C, 50% rh.
Further, supporting the evidence in chapter six, it was observed that a progressive model
of heat acclimation improves physiological strain during intermittent-sprint exercise in
the heat. However, contrary to the proposed hypothesis, progressive heat acclimation
does not alter the central or peripheral contributions to fatigue during intermittent-sprint
exercise of forty minutes duration.
7.5.1. Performance and neuromuscular function during intermittent-sprint exercise in
the heat
Pooled data for all seventeen participants completing the study was used to examine the
effect of intermittent-sprinting in 33°C and 50% rh on performance and neuromuscular
function. In contrast to more recent work (Almudehki et al., 2012; Girard et al., 2013a),
completion of the CISP reduced PPO (W) (∽ 4%) and work done (J) (∽ 4.5%). In addition,
both performance variables were significantly negatively correlated with Tre (°C) (r = -
0.926, P< 0.001 and r = -0.931, P > 0.001, PPO and WD respectively). The discrepancy
between our findings and those of recent studies cited may be due to differences in
protocols used and the extent of hyperthermia induced. Specifically, when total exercise
duration is brief, the number of sprints completed is low and the recoveries prolonged,
the extent of hyperthermia induced is small and performance is not negatively affected
(Almudehki et al., 2012; Girard et al., 2013a). In contrast, when protocols that replicate
durations and work:rest patterns of field-based, team-sports are used, similar to this
study, greater hyperthermia is induced and performance is impaired (Morris et al., 1998,

241
2000; Castle et al., 2006; 2011). For example, similar to this work, Castle et al., (2006,
2011) reported a 2 - 4% decrement in PPO using the CISP in 33°C, 50% rh. Although heat
may alter muscle metabolism, previous work in this thesis (chapter five and six) and other
research (Morris et al., 1998, 2000; Drust et al., 2005; Sunderland et al., 2005; Castle et
al., 2006) has demonstrated no difference in metabolic factors between hot and control
conditions during intermittent-sprint exercise, suggesting that such exercise maximally
taxes glycolysis and the addition of a heat stress does not contribute to elevated strain. As
such, as in previous work, the performance decrement may be attributed to a CNS
mediated effect which was further examined.
The reduction in performance in the current investigation was accompanied by a
significant reduction in maximal voluntary contraction force (∽ -19%) pre to post
intermittent-sprint exercise (Figure 7.13.), similar to that observed in other studies
(Racinais et al., 2007; Perrey et al., 2010b). Previously, decreases in MVC force have been
reported to occur in conjunction with reductions in voluntary drive due to both modest
and marked elevations in core temperature by passive hyperthermia (Morrison et al.,
2004; Thomas et al., 2006; Ross et al., 2012). As such, in the current study the reduced
MVC force may, in part, be attributed to the decrement in cortical and peripheral
voluntary activation (-4.4 and -3.3% respectively, Figure 7.14.) induced by hyperthermia
during intermittent-sprinting in the heat (peak Tre ∽ 38.5°C). MEP amplitude was not
different following intermittent-sprint exercise, indicating that motor cortex excitability
was well preserved and did not contribute to the decreased voluntary descending drive.
Similarly, cortical silent period was unaltered suggesting that intermittent-sprinting did
not alter intracortical inhibitory neuron activity and therefore, did not inhibit descending
drive. Taken together with the unchanged RMS:M wave ratio indicating no change in the
number of motorneurons recruited, absence of change in MEPs and CSP suggest that the
integrity and responsiveness of the motor neurons from motor cortex to muscle was
maintained during intermittent-sprint exercise in the heat (Sidhu et al., 2009a). However,
recovery of MEP and CSP characteristics post exercise have been reported despite the
persistence of impaired voluntary descending drive indicating a faster recovery rate for

242
these variables (Sidhu et al., 2009a). Therefore, the influence of the time from exercise
cessation to completion of the NMF protocol in the current study (∽ 4 minutes) cannot be
discounted. Given that impaired voluntary descending drive persisted despite
maintenance of motor cortex integrity, it may be that the demand of intermittent-sprint
exercise prolonged group III and IV afferent feedback providing increased feedback to the
CNS at a level upstream of the motor cortical outputs to impair voluntary descending
drive (Taylor et al., 2006, Sidhu et al., 2012a).
Previous research reports conflicting findings with respect to voluntary activation in
sprint-type exercise (Racinais et al., 2007; Perrey et al., 2010b; Girard et al., 2013a).
Reductions in voluntary activation, similar in magnitude to those reported in this study,
were reported in repeated-sprint cycling and running in temperate conditions using the
twitch interpolation technique suggesting a central contribution to fatigue in exercise of
this type (Racinais et al., 2007; Perrey et al., 2010b). Recently however, TMS was used for
the first time to examine repeated-sprint cycling in temperate conditions and, in contrast
to previous work, no reduction in voluntary activation was observed in brief MVCs (Girard
et al., 2013a). Methodological differences in the assessment of voluntary activation may
explain differences between the recent work of Girard et al., (2013a) and the earlier
studies of Racinais et al., (2007) and Perrey et al., (2010b). Essentially, the interpolated
twitch technique can provide an estimate of drive to muscles, but is proposed not to
provide an indication of descending drive to motor neurons or take into account the non-
linear input-output relationship of the motor neuron pool (Herbert and Gandevia, 1999).
In addition, increased isometric force, indicative of central fatigue, has been observed in
intact single fibres when such an occurrence should not be possible (Place et al., 2008).
Therefore, it is proposed that an alternate mechanism, increased Ca2+ concentration, may
contribute to the relative increase in the extra force produced by an interpolated twitch
as opposed to increased central fatigue. Therefore, it is suggested the interpolated twitch
technique over-estimates voluntary activation and central fatigue (Place et al., 2010).

243
While methodological limitations may explain the differences in voluntary activation
recorded in previous studies, why the current work differs from that of Girard et al.,
(2013a) when both have used TMS to assess cortical voluntary activation, remains
unclear. Greater sprint number and protocol duration in the current study may provide an
explanation. In addition, completion of the exercise in heat stress and the subsequent
hyperthermia may have contributed to findings. Hyperthermia is known to evoke
decrements in central drive and voluntary force at core temperatures similar to those
observed during intermittent-sprint exercise in the current study (Morrison et al., 2004;
Thomas et al., 2006). Further, hyperthermia has been shown to reduce cerebral blood
flow (Nybo and Nielsen, 2001b; Ross et al., 2012). In hypoxia, decreased cerebral blood
flow contributes to decreased cerebral oxygenation and a two-fold greater decrease in
cortical voluntary activation compared to control conditions (Goodall et al., 2012a). As
such, it is feasible that the duration of exercise and extent of hyperthermia induced in the
current work contributed to decreased cerebral blood flow and oxygenation that together
contributed to a decline in cortical voluntary activation. However, TMS used to assess
sustained and incremental exercise in temperate and hot environments suggests that
decrements in voluntary activation are dependent on the exercise, but independent of
the environment (Racinais and Girard, 2012). Whether this is the same when
intermittent-sprint exercise that reflects work:rest patterns and durations of field-based
team-sports is completed in a hot environment remains unclear. More recent work in a
field-based setting (Nybo et al., 2013), demonstrated using the interpolated twitch
technique that voluntary activation although reduced post exercise was not different
when a simulated football match was completed in ~ 43°C and ~ 21°C. While this again
suggests fatigue is task dependent, but environment independent it is important to note
that, due to the self-paced nature of the football match (Nybo et al., 2013), total game
distance and high intensity running declined by 7% and 26% compared to control during
the match in hot conditions which may have contributed to extent of fatigue observed
post exercise.
Suppression of MVC force after forty minutes of intermittent-sprint exercise in 33°C, 50%
rh in the current study was accompanied by a significant reduction in Qtw,pot (-21.4%)

244
within the values reported previously for repeated-sprinting exercise (Racinais et al.,
2007, Perrey et al., 2010b, Girard et al., 2013a). As an indicator of peripheral fatigue,
reductions in Qtw,pot may be mediated by altered sarcolemmal excitability whereby failure
of the Na+/K+ pump to redress the efflux of K+ to the extracellular environment may cause
membrane depolarization and impair action potential transmission and propagation
(Martin et al., 2010; Perrey et al., 2010b). Altered sarcolemmal excitability manifests in
reduced M wave amplitude, however, in repeated sprinting M wave amplitude has been
reported to increase (Racinais et al., 2007) not change (Girard et al., 2013a) or decrease
(Perrey et al., 2010b) providing conflicting evidence as to the role of sarcolemmal
excitability in repeated-sprint exercise. In the current study, M wave amplitude was also
unchanged pre-post intermittent-sprint exercise in the heat indicating that sarcolemmal
excitability was not impaired and that peripheral fatigue in exercise of this type was not
mediated by impaired action potential transmission or propagation. Discrepancies in
findings pertaining to M wave kinetics during repeated or intermittent-sprint exercise
may be explained by the mode of exercise and type of muscle contraction involved,
whereby exercise with primarily concentric work (for example, cycling) may not impair
membrane excitability, but exercise with a distinct stretch-shortening cycle (for example,
running) might (Perrey et al., 2010b).
Alterations in contractile properties of muscle have also been implicated in peripheral
fatigue (Perrey et al., 2010b; Ross et al., 2012). In the current study both MRFD and RT0.5
were reduced after intermittent-sprint exercise in the heat and MRR, although not
significant, was 12.5% faster. A reduced MRFD may contribute to peripheral fatigue
through impaired functioning of the sarcoplasmic recticulum pump altering Ca2+ release
and excitation-contraction coupling leading to reduced sprinting efficiency (Perrey et al.,
2010b). In addition, the faster relaxation rate of muscle due to exercise in the heat may
have contributed to decreased MVC force due to the higher motor unit firing rates
required to fuse force and maintain contraction (Ross et al., 2012). It has, however, been
suggested that the latter factor has limited effect in brief MVCs as used in the current
study as motor unit discharge may be sufficiently augmented during brief efforts to
maintain force (Ross et al., 2012) and overall, further work needs to be completed

245
examining the genesis of peripheral fatigue during intermittent-sprint cycle exercise in
the heat.
7.5.2. Responses to progressive heat acclimation and training
Similar to the work in chapter six, a progressive heat acclimation protocol was used in this
study to evoke adaptation and confer the heat acclimated phenotype. This protocol
employed the same stepwise increases in heat stress on day five and nine to maintain a
constant heat strain for the duration of acclimation. Similar to chapter six, the
effectiveness of the protocol was judged by its ability to evoke classic heat acclimation
responses.
In this study, twelve days of PA significantly reduced Tre (∽ 0.3°C) and heart rate (∽ 9
b.min-1) at rest and this response persisted to CISP 2 (∽ 0.3°C and ∽ 10 b.min-1). A
significant reduction in resting Tre during acclimation is in contrast with the findings of
chapter six and may be explained by the fewer groups and comparisons in the current
study. Consistent with chapter six, the reduction in resting Tre with PA was still below that
expected for heat acclimation (Wyndham et al., 1954; Patterson et al., 2004; Castle et al.,
2011). Again, as reported in chapter six, while this may support the notion that time of
day modulated the Tre response, all acclimation sessions (and CISPs) were completed at
the same time suggesting other factors may have contributed including possibly,
differences in environmental conditions, protocols and participants. (Wyndham et al.,
1954; Shido et al., 1999; Patterson et al., 2004; Castle et al., 2011).
In the current work, TG reduced exercise heart rate by day twelve (Table 7.3.). While this
may indicate improved cardiovascular stability, supported by, although not significant, a
4.8% increase in plasma volume (Table 7.3.), considering a constant work rate protocol
was used it may be argued such an observation merely reflects decreased physiological
strain (Taylor, 2000). In PA physiological and thermal strain were maintained across the

246
protocol by stepwise increase in external heat stress on day five and nine, evidenced by
no significant change in mean exercise heart rate and Tre on day one, six and twelve
(Table 7.3.). With respect to peak values, the final increase in heat stress significantly
elevated exercise heart rate and Tre compared to day six (Table 7.3.) highlighting the
efficacy of progressive acclimation in maintaining physiological strain. That strain was
enhanced in the current study by the progressive nature of the acclimation protocol is
supported by perceptual responses as RPE and Tsen were significantly elevated on day
twelve compared to six and were significantly higher than TG in the same period (Table
7.3.). By comparison, RPE and Tsen were reduced during TG in the same period.
Over twelve days, PA elevated sweat rate but TG did not have any effect (Table 7.3.). As
suggested in chapter six, increased strain in PA may simply be an artefact of the increased
heat stress, a fact supported by the lack of significant change in sweat rate during the
CISP. However, while not significant, the trend toward an increased sweat rate, (11.5 and
5% respectively), indicates that there may have been some adaptation of sudomotor
function at either a central (reduced threshold for sweating) or peripheral (improved
sweat gland function) level (Nadel et al., 1974; Buono et al., 2009).
Similar to the findings reported in chapter six, plasma volume in the current work showed
a trend toward expansion in both PA and TG that was essentially complete by day six (3.5
± 7.6% and 4.8 ± 12.1%), but was not significantly different across days. Accepting large
interindividual response may have contributed to this result, these data support the
suggestion from study three that further work is required to optimise progressive heat
acclimation to maximise this adaptation.
Twelve days of PA reduced resting heart rate and core temperature prior to CISP 2 (-10
b.min-1 and -0.3°C, respectively). During exercise, this manifested as a decreased mean
heart rate and a trend toward a reduced Tre (-17 b.min-1 and -0.3°C, respectively). RPE
tended to be lower post PA and TG, but was not significantly different. Mean thermal

247
sensation was, however, reduced by both regimes. Taken together, this may suggest the
progressive protocol used was not optimal for maximising adaptation to the heat. Given,
however, that studies have reported significance with similar change in HR and Tre (e.g.
Fox et al., 1963; Patterson et al., 2004) it is possible the variability in measures
contributed to the non-significant findings. Further, post hoc statistical power analysis
suggests low sample size may have contributed to these findings and indicates that
twelve participants per group may have provided significant effects.
7.5.3. Neuromuscular responses to intermittent-sprint exercise in the heat (analysis by
group)
When data were analysed by group no difference in PPO and WD were observed during
CISP 1 or 2 in PA or TG. That no difference in PPO was reported post acclimation, may
reflect the maximal nature of the sprinting involved in the CISP protocol and the duration
over which the analysis was conducted (i.e. 40 minutes). As 5 rint were ‘a -o t’ the
same level of fatigue may have been induced in CISP 2 (supported by similar decline in
PPO over time in both CISPs) post acclimation that, due to the fixed duration of the
protocol, prevented detection of any difference. Further, although WD was not different
it is important to note the decline over time tended to be reduced post PA (CISP 1 vs. 2;
4.8% vs 1%), but also TG (6.2% vs. 3%). Given the reliability of the CISP as identified in
chapter four, this may suggest that more work could be performed in the latter stages of
the CISP post acclimation, that, due to the duration of the protocol and design of the
study were not detected.
Although PPO and WD were not different post acclimation, maximal voluntary
contraction force was, however, reduced in both PA and TG after CISP 1 and was also
reduced in both groups after CISP 2 suggesting no effect of PA or TG. When TMS is
applied over the motor cortex during a maximal voluntary contraction evidence of a SIT
suggests cortical drive to the locomotor muscle is not maximal. Increases in post exercise
SIT indicate a decrease in cortical voluntary drive and possibly centrally (supraspinal)

248
mediated fatigue. In the current study decrements in cortical drive to exercising muscle
could not explain the reduced MVC force as, contrary to pooled data showing a significant
decrease, cortical voluntary activation was not significantly different pre-post CISP 1 and
was not changed by PA or TG when data was analysed by group (Table 7.5.). Further,
despite voluntary activation showing a trend towards a decline post intermittent-sprint
exercise before and after PA and TG (CISP 1, ~ -4 and -9% in PA and TG respectively; CISP
2, ~ -5 and -7% in PA and TG respectively) the SIT during MVCs was not different between
or within conditions. Such findings may however, be a consequence of the sample size in
this part of the study (PA = 8, TG = 7) as post hoc analysis (α = 0.05, 1 – β 0.8, r 0. )
suggests a sample size of twelve per group to achieve significance for this variable. As a
measure of corticospinal excitability, MEP amplitude was not altered pre post CISP 1 or
following PA or TG. Further, although MEParea normalised to Mmaxarea was significantly
greater in CISP 1 in TG, this measure was not affected by PA or TG. Similarly, CSP and
latency were unaffected by either intervention.
Only one previous investigation has examined neuromuscular fatigue in sprint exercise
using TMS (Girard et al., 2013a). In contrast to the current work, this study used a brief
repeated-sprint protocol in a temperate environment, but reported no change or trend
toward a decline in cortical drive or excitability during brief maximal voluntary
contractions (Girard et al., 2013a). This may be explained by the brevity of the protocol
employed and the lack of exogenous heat insult. Previously, passive hyperthermia has
resulted in decreased voluntary activation and voluntary force production (Morrison et
al., 2004, Thomas et al., 2006) and as such, the extended nature of the protocol in the
current study coupled with the inclusion of heat stress may have contributed to the trend
in cortical voluntary activation scores that, based on reliability data (Goodall et al., 2009;
Sidhu et al., 2009b) may indicate a potential meaningful change. Further work is needed
to elucidate this point. Alternately, taken together, data from this study and Girard et al.,
(2013a) may indicate that cortical drive and cortiospinal excitability are not impaired and
thus do not contribute to fatigue in repeated or intermittent-sprint exercise when cycle
sprints of < 6 s are repeated 15 - 20 times with short (30 s) or long recoveries (30 s - 2
minutes) for a duration of between nine and forty minutes in temperate or hot

249
environments. This notion contrasts with previous findings (Racinais et al., 2007; Perrey
et al., 2010b) that have demonstrated significant decrements (∽ 3%) in voluntary
activation during repeated cycling and running sprints. While the inter-individual
differences in TMS response in the current study may explain the non-significance of the
up to 9% decrements in voluntary activation, the discrepancy may also be explained by
the use of the interpolated twitch technique to estimate voluntary activation (Racinais et
al., 2007; Perrey et al., 2010b) as debate exists over the ability of this technique to
measure voluntary descending drive, as previously described. In addition, as use of the
interpolated twitch technique does not permit the site of impaired voluntary drive to be
localised, spinal contributions to fatigue cannot be discounted. Further, the intraday and
interday typical error of voluntary activation using the interpolated twitch technique is
reported as ∽ 2 - 8% (Place et al., 2007) and therefore, the data presented in the work of
Racinais et al., (2007) and Perrey et al., (2010b) may reflect variation inherent in the
measurement technique as opposed to a meaningful reduction in central drive. In
addition, although normalised EMG RMS activity was reduced pre-post intermittent-
sprinting (Racinais et al., 2007) and may be interpreted as decreased voluntary drive,
EMG activity should be interpreted with caution as amplitude cancellation and reduced
sensitivity to small modification in muscle activation compared to interpolated twitch
may compromise findings (Kalmar and Cafarelli, 1999; Farina et al., 2004). Finally,
differences in descending drive in current and previous work may relate to the
predominant type of contraction during exercise whereby the eccentric-concentric
pattern of muscle contraction in repeated running sprints may provide greater activation
of and feedback from group III and IV afferents compared to the predominantly
concentric contractions observed in cycling.
Interestingly, in the work of Girard et al., (2013a) failure of the motor cortex to maximally
activate motorne ron wa ob erved d ring ro onged 30 ) C’ . Con eq ent y, it has
been gge ted that tained C’ ho d be ed to inve tigate cortico inal function
during intermittent-sprint exercise. Considering however, that mean sprint durations in

250
intermittent field-based team-sports rarely exceed six seconds, the use of sustained
C’ to a e centra fatig e d ring e erci e wo d have imited eco ogica va idity.
The reduction in maximal voluntary contraction force observed in the current study was
accompanied by a significant decrease in Qtw,pot that also persisted post CISP 2, again
indicating no effect of PA or TG on this variable. Previously, changes in muscle contractile
properties have been implicated in neuromuscular fatigue whereby repeated running
sprints in temperate environments impaired MRFD, MRR and RT0.5, but also temperature-
induced changes with passive heating have been suggested to alter contractile properties
and contribute to fatigue (Todd et al., 2005; Perrey et al., 2010b; Ross et al., 2012). In the
current study, however, when data were analysed by group no significant change in
MRFD, MRR or RT0.5 were observed and there was no effect of PA or TG. However, MRFD
was reduced by 24% during CISP 1 but only 2% during CISP 2 in PA whereas in TG this
parameter was reduced 5.5% in CISP 1 and 7.3% in CISP 2. Similarly, MRR was faster by
24% in CISP 1 and only 15% in CISP 2 in PA, but was faster by 3% after CISP 1 and 7% after
CISP 2 in TG. Combined with the effect ize 0.2) it may gge t a meaningf effect and
therefore, possibly altered excitation-contraction coupling contributed to the observed
reduction in Qtw,pot and MVC. Previously, low frequency fatigue, indicative of impaired
excitation-contraction coupling due to reduced efficiency of the calcium cycle has been
reported during repeated running sprints (Perrey et al., 2010b). While low frequency
fatigue was not assessed during the current study and may be specific to the type of
exercise protocol used (running vs. cycling), it may have contributed to the findings of a
reduced Qtw,pot. Mmax amplitude was also not altered within or between groups after PA
or TG indicating that membrane excitability was not changed by PA or TG and that
alteration of action potential transmission and propagation did not contribute to fatigue
during intermittent-sprint exercise in 33°C and 50% rh over forty minutes duration.
Only one other study has examined the effect of heat acclimation on central and
peripheral fatigue (Brazaitis et al., 2010). This study used passive acclimation in a water
bath at waist level, repeated every other day for two weeks with a 2 minute MVC pre the

251
first and last acclimation session. The interpolated twitch technique was used to assess
central and peripheral contributions to fatigue. Heat acclimation was confirmed based on
attainment of classic heat acclimation criteria yet, despite heat adaptation, voluntary
activation and half relaxation time of muscle was not significantly different post
acclimation (Brazaitis et al., 2010). While the authors acknowledged the limitations
associated with seven non-consecutive days of passive heat acclimation, the current work
adds to this finding as similar results were reported for MRFD and MRR in this chapter.
However, given that muscle temperature is reduced during exercise after heat
acclimation (Febbraio et al., 1994) it is interesting to note that the percent reduction in
MRFD and MRR in the current chapter was lower after PA, but did not change with TG. As
such it is tempting to speculate whether a lower muscle temperature post PA may have
contributed to the reduction in percent decrement observed in PA compared to TG. If so,
it may indicate heat acclimation could, if optimized, contribute to changes in mechanical
properties of muscle that may improve peripheral fatigue. Further work with a larger
sample size (post hoc analysis n = 12 per group) is required to elucidate this possible
effect.
7.5.4. Limitations
The current investigation used a progressive acclimation protocol to induce heat
adaptations. While the protocol, judged against classic heat acclimation criteria, appears
effective, the extent of physiological strain induced was potentially below that required to
maximise physiological adaptation. Consequently, accepting that sample size may have
contributed to findings, many of the within exercise measures were not altered compared
to training, making examination of the effect of acclimation on these measures difficult.
As such, greater exogenous heat stress during each phase may have exacerbated
hyperthermia, increased duration at a minimum endogenous core temperature to
maximise responses compared to training and allowed further insight into central and
peripheral fatigue during intermittent-sprint exercise and the effect of progressive
acclimation.

252
With respect to the NMF assessment protocol used, existing studies have demonstrated
with TMS, EMG responses are recovered rapidly (Kalmar and Cafarelli, 2006). In addition,
skeletal muscle function and NMF measures have been shown to recover within 1 - 2
minutes of exercise (Froyd et al., 2013). In the current study, the time from completion of
sprinting to completion of NMF assessment was 4.6 ± 0.3 minutes. As such the potential
for recovery of central and peripheral factors during this period that may have
contributed to lack of difference pre-to-post intermittent-sprinting cannot be discounted.
Further, recent research with repeated sprint exercise has shown impaired corticospinal
f nction d ring tained C’ Girard et a ., 2013a). A ch, tained C may have
provided better insight to corticospinal function during intermittent-sprint exercise as
opposed to the brief efforts utilised in this study (Girard et al., 2013a). Finally, single pulse
TMS permits identification of supraspinal contributions to fatigue during intermittent
sprint exercise. Lack of change in cortical voluntary activation and corticospinal
excitability suggests fatigue during intermittent-sprint exercise may be peripherally
mediated. However, both supraspinal and spinal mechanisms may contribute to fatigue
and spinal mechanisms need further examination to understand fully central and
peripheral aspects of fatigue during intermittent-sprint exercise using for example,
cervicomedullary stimulations.
The decline in maximal force capacity has been shown to depend on the characteristics of
the task being performed with the type of muscle contraction, activation pattern,
intensity and duration of activity seen as critical (Martin et al., 2010). In the current study
a cycling model requiring predominantly concentric muscle activity was used to examine
fatigue in repeated sprint exercise. As such, in the context of the current work,
application of findings to field-based team-sports that are running based may be limited.
Further, it must be acknowledged that due to logistical constraints no temperate CISP
trial was performed. Therefore is not possible to elucidate whether the neuromuscular
fatigue observed is a consequence of the exercise pattern or the heat stress. In addition, a
non-exercise control group was not used in the current study and as such the effect of
training or heat acclimation compared to a non-exercise control on neuromuscular
fatigue cannot be established. Finally, use of forty minutes exercise duration replicates

253
only the first half of a team game and further work is required to elucidate peripheral and
central contributions to fatigue in the second half.
7.5.5. Conclusion
In conclusion, this was the first study to utilize TMS and FNS to examine central and
peripheral fatigue following intermittent-sprint exercise in the heat where work:rest
ratios replicated those of field-based team-sports. Further, it was the first study to use
TMS and FNS to explore modification of fatigue in intermittent-sprint exercise by
progressive heat acclimation and training. An initial novel finding from pooled data was
the existence of reduced cortical voluntary activation post intermittent-sprint exercise in
33°C, 50% rh. When data were analysed by group however, evidence indicated fatigue
was primarily peripheral in origin. A second novel finding was that progressive heat
acclimation did not alter fatigue during intermittent-sprint exercise despite evidence of
classic physiological adaptations and of a trend toward improved muscle contractile
properties. Whether use of an alternate heat acclimation regime would produce different
findings is unknown. Similarly, whether a greater exogenous heat stress or a greater
duration of intermittent sprinting eliciting a more pronounced hyperthermia would alter
fatigue also requires further investigation. Overall, data indicate that during forty minutes
of intermittent-sprint exercise in 33°C, 50% rh neuromuscular fatigue may be primarily
peripheral in origin.

254
CHAPTER VIII. GENERAL DISCUSSION
This chapter will be presented in three sections. Firstly, the principle findings from each of
the studies in chapters four to seven will be presented. Secondly, the important
physiological issues arising from the studies will be considered and future research
requirements discussed. Finally, the practical applications of this PhD will be considered.
8.1. Principle Findings
Study 1
The purpose of this study was to determine the reliability of an intermittent-sprint cycling
protocol (CISP) to be used to assess intermittent-sprint performance throughout the rest
of the thesis. In addition, the efficacy of one practice session as a means to minimise a
learning effect during main trials was examined. The study demonstrated that the CISP is
a reliable tool for assessing intermittent-sprint performance in a test-retest research
paradigm with typical errors of measurement for peak and mean power output of 2.9 and
4.2%, respectively. In addition, findings indicate that one practice trial comprising one
quarter of the CISP was sufficient to ameliorate a learning effect during main trials.
Study 2
In this study participants completed the CISP in a hot humid (HH) and a hot dry (HD)
environment, matched for heat stress. Previous research has demonstrated that in
comparison to HD, HH environments compromise evaporative heat loss and decrease
exercise tolerance (Maughan et al., 2012). Therefore, the purpose was to ascertain
whether the composition of thermal factors contributing to the environment would have
a similar effect on intermittent-sprint performance. Additionally, examining the interplay
of differing thermal factors on physiological strain allowed better understanding for

255
developing a progressive acclimation protocol. Physiological strain index (PSI) was not
significantly different in HH compared to HD environments and intermittent-sprint
exercise performance of 40 minutes duration was impaired, but not different between
these environments when matched for heat stress. As such, while findings reinforce the
importance of heat acclimation for team-sport athletes it may be suggested that, when
performance is of forty minutes duration, the composition of thermal factors contributing
to the heat stress is not a primary factor when designing a heat acclimation programme.
Study 3
The third study compared physiological and perceptual adaptation to a progressive model
of heat acclimation, that targets external heat stress to maintain physiological strain, to
those achieved using a traditional model. The study also investigated the effect of
progressive acclimation on physiological, perceptual and performance responses during
forty minutes of intermittent-sprint exercise in 33°C 50% rh. Based on the ability to evoke
classic acclimation responses and reduced physiological strain during intermittent-sprint
exercise in the heat compared to TA, PA was judged an effective method for conferring
the heat acclimated phenotype. Due to the reduced heat stress in the initial stages this
protocol may possess an advantage compared to traditional models of acclimation, in
that it may permit better tolerance of initial heat exposure and maximise exposure time
in the early stages of acclimation by reducing incidence of heat illness and limiting
participant drop out. However, while evidence suggests the current design maintained
physiological strain during the acclimation regime, the degree of strain may have been
insufficient to evoke the minimum endogenous criteria for a sufficient period of time to
elicit a maximal acclimation response and therefore, needs further optimisation.
Study 4
The aims of this study were to examine central and peripheral contributions to fatigue
during intermittent-sprint exercise in 33°C, 50% relative humidity (rh) using transcranial
magnetic stimulation (TMS) and femoral nerve stimulation (FNS) and to investigate

256
whether progressive heat acclimation or normothermic training could ameliorate fatigue
during exercise of this type. When data for CISP 1 were pooled for all seventeen
participants significant reductions were observed in MVC force, cortical (CVA) and
peripheral voluntary activation (PVA), potentiated twitch force, maximal rate of force
development, and half relaxation time. When data were analysed by group, MVC and
potentiated twitch force were significantly reduced after intermittent sprinting whereas
CVA showed a trend toward a decline but was not significantly different. The reduction in
MVC and potentiated twitch force during intermittent sprinting remained after twelve
days of progressive heat acclimation. Findings indicate that during forty minutes of
intermittent-sprint exercise in the heat neuromuscular fatigue may be primarily
peripheral in origin and progressive acclimation or training does not reduce the extent of
fatigue during exercise of this type despite reduced physiological strain.
8.2. Mechanistic Overview
This thesis attempts to explain the physiological and perceptual responses to progressive
heat acclimation compared to a traditional model at rest and during exercise while also
considering the effect of progressive heat acclimation on performance, physiological and
perceptual responses during an intermittent-sprint model of exercise that replicates field-
based team-sports. Prior to the production of this thesis a large body of research had
investigated heat acclimation using methods as classified by Taylor (2000) and examined
the efficacy of these methods using an endurance model of exercise. An array of heat
acclimation protocols differing in total number of days, duration of individual sessions,
intensity of exercise and work done (section 2.5.3. & 2.5.4.), have resulted in varying
adaptation to the heat (section 2.5.2., 2.5.3. & 2.5.4.). Further, studies use varying criteria
to determine whether heat acclimation was conferred and thus there is difficulty in
determining the efficacy of a protocol in a consistent fashion. Considering this, a review of
literature for this thesis resulted in the identification of nine key criteria (section 2.5.) that
can be used to assess the efficacy of a heat acclimation model. In the following sections
the progressive protocol used in study three and four of this thesis will be evaluated

257
against these criteria and existing acclimation protocols to determine its efficacy
accepting that, due to the progressive nature of the protocol, exercise criteria have to be
determined against data from the intermittent-sprint sessions.
Figure 8.1. Classification of the nine heat acclimation criteria that can be used to
determine the efficacy of a heat acclimation protocol (decreased heart rate and core
temperature in rest and exercise, increased sweat rate and plasma volume, reduced skin
temperature, decreased perception of effort / thermal sensation and improved physical
performance). Tre rest, Tre e e ecta tem erat re in re t or e erci e sk = skin
temperature; PV = plasma volume; HR = heart rate; Swth = sweating threshold; Swrate =
sweat rate; SGF = sweat gland function; RPE = rating of perceived exertion; Tsen = thermal
sensation; PPO = peak power output; WD = work done.
8.2.1. Progressive acclimation and thermoregulatory markers of acclimation
Functionally, heat acclimation enhances the capacity of an organism to resist heat stress
by augmenting heat dissipation and elevating the upper body temperature that can be
sustained in the heat (Horowitz and Kodesh, 2010). Such resistance is a consequence of
systemic adaptation, a chronic process dependent on heat induced reprogramming of
gene expression (Horowitz and Kodesh, 2010). Historically, a number of different heat

258
acclimation protocols, primarily considered constant work rate or isothermal, were used
to elicit systemic adaptation, synonymous with classic heat acclimation responses. Such
protocols display varying efficacy, but consistently augment heat dissipation through
decreased exercise and at rest (when reported) Tre (section 2.5.3. & 2.5.4.). In this thesis
(chapter six and seven), progressive acclimation was used to evoke acclimation responses
and, similar to existing protocols, reduced resting Tre in study four during acclimation (-
0.3°C) and prior to CISP 2 (-0.3°C), possibly due to lowering of the hypothalamic
thermoregulatory set point, reduced heat storage, cardiovascular adjustment and
attenuation of hyperpyrexic molecules (Garden et al., 1966; Buono et al., 1998,
Armstrong 1998; Shin et al., 2013). In study three, however, despite a similar reduction
during acclimation (-0.2°C) and greater reduction prior to CISP 2 (-0.4°C), resting Tre was
not statistically different across acclimation or CISPs for PA. In comparison, similar non
significant findings were reported for resting Tre in response to traditional acclimation (-
0.3°C) and prior to CISP 2 (-0.3°C). Considering the magnitude of the change in this thesis
compared to that reported by Kampmann (2008) in a review of studies (~ -0.4°C), this
may suggest sub-optimal stimulus from progressive acclimation. In contrast it may
indicate a type II error owing to the greater variability in resting Tre amongst participants
in study three and the greater number of groups in that study that necessitated more
comparisons during statistical analysis.
A further classic thermoregulatory adaptation conferred by existing heat acclimation
protocols is a reduced exercise Tre (section 2.5.2.2.) owing in part, to reduced resting Tre
and improved heat dissipation (Garden et al., 1966; Buono et al., 1998, Armstrong, 1998).
Tre during intermittent-sprint exercise was reduced in study three by both progressive (-
0.5°C) and traditional (-0.3°C) acclimation with the extent of adaptation from progressive
acclimation, not different to traditional methods, indicating the efficacy of this method. In
study four, however, exercise Tre tended to be reduced by progressive acclimation (-
0.3°C) but was not significantly different over time and not different between PA and TG.
That exercise Tre was reduced in study three but not four cannot be explained by (i)
training status, percent body fat or BSA between progressive acclimation participants in
study three compared to four nor (ii) difference in evoked Tre during exercise on day one,

259
six and twelve. Further, this discrepancy cannot be explained by the change in Tre during
intermittent-sprint exercise (Table 6.5. and 7.4.), but may be related to the lower
physiological strain evident during CISP 1 in study four compared to study three. (Table
6.5. and 7.4.). Alternatively, the discrepancy may reflect insufficient power in study four
to detect a difference as post hoc analysis suggested twelve participants would be
required to detect a significant difference.
A tho gh sk was not assessed during acclimation, the effect of progressive acclimation on
this measure can be determined from the intermittent-sprint exercise data. Twelve days
of progressive acclimation significant y red ced sk in t dy three -0. 0 C). n t dy fo r
mean sk during intermittent-sprint exercise after acclimation was also reduced post
acclimation (-0.33 C). By com ari on, traditiona acc imation t dy three) a o owered
sk (-0.95°C), but the e tent of red ction wa not different to rogre ive acc imation. he
two-fo d greater red ction in sk in study three may be explained by the greater stimulus
presented by the higher physiological strain experienced during CISP 1 in this study in
both traditiona and rogre ive acc imation gro . A high sk in conjunction with high
Tre, similar to the values reported in study three, has been shown to evoke the greatest
skin blood flow response during exercise and subsequently, greater competition for
cardiac o t t Saw a et a ., 2012). Con eq ent y, the high sk and Tre in study three may
have elevated skin blood flow, decreased the gradient for heat exchange and increased
the cardiovascular strain in study three compared to four. Decreased Tsk is reported in
response to decreased hypothalamic setpoint for sweat onset coupled with an increased
sweat rate and increased evaporation (Shvartz et al., 1973; Lorenzo and Minson, 2010).
However, sweat rate, despite being increased during traditional acclimation and
progressive acclimation, was not different during intermittent sprinting in study three or
four. Given that core temperature and skin temperature decreased in response to heat
acclimation it is likely that the threshold for the onset of sweating was reduced, i.e. a
central adaptation. Therefore, it is possible that the heat acclimation protocols used were
an insufficient stimulus to promote peripheral adaptation, accepting that whole body
sweat rate is a crude measure and does not provide an actual measure of eccrine gland
function. Such a suggestion is supported by the observation that the extent of sweating

260
induced during acclimation only approached those observed during the CISPs in the final
days of acclimation.
8.2.2. Progressive acclimation and cardiovascular markers of acclimation
Improved cardiovascular stability that is reported with existing heat acclimation protocols
(e.g. Shvartz et al., 1973; Patterson et al., 2004; Amorim et al., 2011) was also observed in
this thesis in response to progressive heat acclimation. In study three, resting heart rate
was reduced during progressive acclimation (-12 b.min-1) and was not different to the
reduction induced by traditional acclimation (-11 b.min-1). However, this response did not
persist to intermittent-sprint exercise. Prior to CISP 2, although there was a trend towards
a reduction in resting heart rate (-9 and -11 b.min-1 in traditional and progressive,
respectively), resting heart rate was not significantly reduced (Table 6.5.), but may be
explained by the greater variability in this measure prior to intermittent-sprinting. In
contrast, in study four progressive acclimation reduced resting heart rate by day twelve (-
9 b.min-1, Table 7.3.) and this response was still evident prior to CISP 2 (-10 b.min-1, Table
7.4.).
In addition to decreased resting heart rate, progressive acclimation also reduced exercise
heart rate during intermittent-sprint exercise. After twelve days of progressive
acclimation, mean exercising heart rate during intermittent sprinting was reduced in both
study three (-16 b.min-1) and four (-17 b.min-1) (Table 6.5. and 7.4.). This reduction was
not different to that observed in traditional heat acclimation within study three (-17
b.min-1) and in other work using existing heat acclimation protocols (Yamazaki and
Hamasaki, 2003; Patterson et al., 2004), again supporting that progressive heat
acclimation is at least comparable with other HA methods. In agreement with Horowitz
and Kodesh, (2010), autonomic nervous system habituation and increased vagal activity
may mediate the reduced heart rate, but centrally mediated effects including improved
cardiac efficiency or decreased sympathetic activity may also contribute (Yamazaki and
Hamasaki, 2003; Garrett et al., 2011).

261
Improved cardiovascular stability following heat acclimation has been attributed to an
expansion of plasma volume and this response has been reported using a range of
existing heat acclimation protocols (Nielsen et al., 1993, 1997; Patterson et al., 2004;
Garrett et al., 2012). In the current thesis plasma volume displayed a trend toward
expansion but the wide inter-individual responses and large variance prevented detection
of a significant difference and may be symptomatic of the method used to determine
plasma volume change (Weinstein et al., 1998).
8.2.3. Progressive acclimation and endocrine markers of acclimation
In response to heat acclimation plasma volume expansion occurs in tandem with
interstitial fluid expansion (Patterson et al., 2004). As such, extracellular fluid expansion is
considered the primary mechanism for plasma volume expansion that must therefore, be
mediated by electrolyte retention, specifically, Na+ (Wendt et al., 2007). Retention of Na+
is mediated by the hormone aldosterone, concentrations of which have been shown to
increase at rest and end exercise during heat acclimation (Armstrong et al., 1998; Garrett
et al., 2012), but also not change (Sunderland et al., 2008), possibly due to the training
status of participants, but also the protocol used. In the current thesis (study 3), plasma
aldosterone levels were not altered by either progressive or traditional heat acclimation
but tended to increase post exercise. Further, although plasma Na+ was not assessed,
sweat Na+ was determined and, despite a trend toward a reduction in both progressive (-
14%) and traditional (-15%) protocols, there was no significant difference during
acclimation (Table 6.2.) or in CISP 1 compared to CISP 2 (Table 6.6.)
A central tenet of progressive acclimation is that successive increases in heat stress
elevate physiological strain, thereby maximizing systemic adaptation. If such a notion is
correct then physiological strain should not attenuate during a progressive compared to
traditional acclimation and may be evidenced by examination of plasma cortisol
concentrations. Plasma cortisol concentration has been shown to be increased in
response to an exercise bout in the heat but, more importantly, is known to be

262
attenuated over the course of what was essentially a constant work rate protocol
(Armstrong et al., 1989). In contrast, cortisol concentration has also been shown not to
change in response to short-term intermittent and isothermal acclimation (Sunderland et
al., 2008; Garrett et al., 2009). In the current work, plasma cortisol concentration was not
different between progressive and traditional acclimation and was not different post
exercise on day one, six or twelve during progressive acclimation but tended to increase.
Further, the final increment in heat stress during progressive acclimation did not invoke
an increased cortisol response, indicating no effect of increased strain in the final stage of
the progressive heat acclimation protocol. Although other markers of heat adaptation
were evident, current data suggests a greater heat stress increment may be required to
maximise cortisol response and adaptation.
8.2.4. Progressive acclimation and temporal patterning of acclimation responses
The reprogrammed gene expression that underpins systemic adaptation in the heat
acclimated phenotype displays biphasic temporal patterning that is evoked by sustained
heat insult (Horowitz and Kodesh, 2010). Progressive heat acclimation, owing to the
decreased heat stress in the initial phase of the protocol and stepwise increases laterally,
could alter the extent or patterning of this genotypic response that may or may not affect
the heat acclimated phenotype. However, in the initial stages of progressive acclimation
resting Tre in study three and four were reduced by day six, a response that was identical
to that observed for both traditional acclimation and training. Further, despite resting
heart rate in study four not being significantly reduced until day twelve, which may
indicate alteration in temporal patterning, resting heart rate during progressive heat
acclimation in study three was significantly reduced by day six. Again this response was
identical to that observed during traditional acclimation. Taken together, these data
would appear to suggest that there is no effect of the reduced heat stress of progressive
heat acclimation on temporal patterning of the adaptation response.

263
As stated, the temporal patterning of gene expression in heat acclimation is biphasic,
considered to comprise an initial transient stage to maintain DNA integrity and a
sustained stage where signaling networks aligned to cytoprotection are enhanced
(Horowitz et al., 2004). Such activity includes upregulation of genes associated with HSPs
that confer thermotolerance, but are now suggested to play a role in systemic adaptation
and the heat acclimated phenotype (Kuennen et al., 2011). The stimulus for upregulation
of genes encoding for HSPs is heat insult and recent evidence suggests that extra cellular
HSP72 concentration is significantly increased only in very hot ambient conditions where
the exogenous heat stress evokes a minimum endogenous criteria of rapid and sustained
increases in core temperature to > 38.5°C and enhanced sympathetic activity (Gibson et
al., 2013). Therefore, given the reduced heat stress in the initial stages of the progressive
compared to traditional protocol and the fact that during the final phase of progressive
acclimation exercise Tre was greater than 38.5°C for only 10 - 15 minutes of each session
(day nine to twelve, study three and four), it is conceivable that progressive acclimation
did not evoke sufficient strain to optimise upregulation of gene expression, HSP response
and systemic adaptation. This may also explain non-significant findings in some other key
markers of heat acclimation measures across study three and four.
In 1963, Lind and Bass observed a plateau in exercise Tre and heart rate during
acclimatization that was perceived to signal the attainment of optimal heat adaptation.
Numerous studies have since reported similar findings with the overall conclusion that
heat acclimation generally requires 10 - 14 days to acquire (Armstrong and Maresh,
1991). It is now known, however, that rather than reflecting optimal heat acclimation,
plateaus in key markers of acclimation may be an artifact of constant work rate methods
and the inherent decrease in physiological strain observed over the duration of the
protocol (Taylor, 2000). To circumvent this inherent limitation and optimise adaptation,
progressive heat acclimation uses increases in heat stress to augment physiological strain
for the duration of the protocol. In the current thesis this manifested as consistently
maintained exercise Tre and heart rate over day one to twelve (Table 6.1. and 7.3.). In
contrast, with traditional acclimation in the current work, the classic plateau in
physiological responses was observed. Considering the responses to progressive

264
acclimation in the current thesis it is possible that this method may alter the temporal
patterning of adaptation with the potential for sustained / greater adaptation as the
protocol progresses. Two observations from the current data support this suggestion.
Firstly, the reduction in resting Tre at the end of progressive acclimation in study three (-
0.2°C) was augmented prior to CISP 2 (-0.4°C). This indicates a potential lag effect of
progressive acclimation whereby further physiological adaptation occurs after completion
of the protocol during recovery. Positioning of the highest heat stress in the final stage of
progressive acclimation may evoke this response and this concept is supported by Daanen
et al., (2011) and Costa et al., (2014) who reported a similar response with a progressive
type acclimation protocol. Further, with isothermal strain, Patterson et al., (2004)
demonstrated an enhanced reduction in resting Tre after twenty two days of acclimation (-
0.37°C) compared to eight (-0.2°C) again suggesting physiological adaptation can be
further augmented with an appropriate acclimation protocol. It is acknowledged,
however that this response was absent in study four thereby limiting the ability to
separate what may be a protocol mediated effect from a methodological artifact.
Secondly, acknowledging that plasma volume was not significantly different in either
study three or four and there were wide interindividual differences, it is interesting to
note that after day six only in progressive acclimation did plasma volume show a
tendency to increase further. Sustained and generalized expansion of plasma volume has
been reported when heat acclimation was maintained for twenty two days using an
isothermal model of acclimation (Patterson et al., 2004) and this indicates a similar
potential with a progressive model.
8.2.5. Progressive acclimation and perceptual responses
Consistent with the elevated heat stress of the protocol, progressive acclimation
produced significant increases in thermal sensation on day six and twelve of acclimation
in both study three and four (Table 6.3. and 7.3.). In contrast, thermal sensation was
significantly decreased by traditional acclimation and training. Sensory response is
considered an integration of inputs from exercise and temperature stimuli, but thermal
sensation is more influenced by peripheral thermal receptor input that central (Mower,

265
1976). Given that exercise intensity was the same in all conditions during acclimation in
this thesis and that skin temperature responses are correlated to thermal sensation
(Kamon et al., 1974) it is possible that altered thermal sensation ref ected difference in
sk evo ed by acc imation. D ring intermittent- rint e erci e, therma en ation wa
ignificant y red ced by traditiona , b t a o rogre ive acc imation, again o ib y
mediated by red ction in sk during CISP 2. These data reinforce the efficacy of
progressive acclimation, but it is also important to note that in study four, twelve days of
training also evoked a reduction in thermal sensation. This may have been mediated by
reductions in resting Tre and thresholds for sweating and cutaneous vasodilation that may
have been influenced by exercise intensity (Kampmann et al., 2008).
Mean RPE during acclimation was not altered by either traditional or progressive regimes
(Table 6.3. and 7.3.). In contrast to thermal sensation, RPE therefore was generally
unaffected by increases in heat stress with progressive acclimation, demonstrating the
differing origins of this measure. During intermittent-sprint exercise after acclimation RPE
was reduced by both progressive (-4 units) and traditional acclimation. However, in study
four, mean RPE tended to decline but was not different in CISP 2 compared to CISP 1
which could reflect the maximal nature of the exercise. RPE is correlated with
physiological markers during exercise (Edwards et al., 1972) and has been suggested to be
derived from peripheral afferent stimuli (Marcora, 2009), emanating from group III and IV
afferents that are abundant in skeletal muscle and sensitive to physiologic, metabolic and
mechanical stress (Craig, 2002). As such, reduced physiological and metabolic strain
derived from the combination of exercise and heat used during acclimation may have
contributed to the reduced RPE. However, there is strong evidence to suggest perception
of effort is strongly influenced, if not totally dependent, on centrally generated
corticofugal motor commands that give rise to corollary discharges (Enoka and Stuart,
1992). That is, perception of effort is centrally generated by neural signals from the motor
to sensory cortex (Marcora, 2009) that during exercise would reduce central drive
contributing to fatigue.

266
8.2.6. Progressive acclimation, intermittent-sprint performance and neuromuscular
fatigue
In the studies contained in chapters five to seven of this thesis, the mean reduction in
PPO and WD over forty minutes of intermittent-sprint exercise in the heat was
approximately 9%. By comparison, in the one temperate trial conducted (chapter five
control condition) PPO and WD were both reduced by 6%. Based on the reliability of PPO
in the CISP being 2.9% (chapter four) these data suggest a meaningful effect on
performance when intermittent-sprint exercise is conducted over forty minutes, but also
an additional meaningful effect of heat adding to the existing literature on this topic
(Figure 8.2.). Although meaningful, the decrements in performance observed in this thesis
did not consistently produce statistical significance. Chapter five (study two)
demonstrated a significant ~ 8% decrement in performance while under heat stress. In
chapter six, performance was different only after traditional (~ 19%), but not progressive
acclimation (6%), despite a 2% improvement in PPO previously being identified as a
statistically significant effect (Castle et al., 2011). In chapter seven (study four), analysis of
CISP 1 data pooled for seventeen participants highlighted significant decrements in
intermittent-sprint performance during exercise in the heat (4%), however, these did not
persist when data were analysed by group across both CISPs. This finding, coupled with
other non significant findings from earlier chapters of this thesis may suggest a loss of
tati tica ower owing to the n mber of com ari on erformed d ring AN A’ with a
conservative Bonferroni correction. Consequently, while the type I error rate was well
controlled increased type II error rate may have occurred (Field, 2009). Overall, taken
together, these data would still support that intermittent-sprinting is impaired over forty
minutes in the heat (Figure 8.2.).
Similar to existing studies (Morris et al., 1998, 2000), this thesis demonstrated strong
significant negative correlations between PPO and Tre that were generally not ameliorated
by progressive acclimation, but were by traditional acclimation. This may be related to
the sample size or individual heat tolerance levels of this group (chapter six) as previously
discussed. Alternatively, these data could indicate that progressive heat acclimation has

267
limited effect on intermittent-sprint exercise in the heat. Further, it may be that the
design of the CISP contributed to this result. Due to the maximal nature of the sprinting in
the CISP the same level of fatigue may be induced post exercise even after an
intervention such as heat acclimation. Further, due to the fixed duration of the protocol,
the improvements induced by heat acclimation that may allow the athlete to exercise for
longer and potentially impact performance, for example, during the second half of a
match, do not have sufficient impact on the maximal sprint performance or work done in
the initial forty minutes.
Figure 8.2. Percent change in sprint performance from control for existing studies
examining the effect of heat on sprint performance with data for study two of this thesis
included for comparison. PPO = peak power output; MPO = mean power output; WD =
work done TDR = total distance run; TRT = total run time; ST = sprint time; * = significant
difference from control.

268
Previous work has demonstrated that, when intermittent-sprint exercise similar in
duration and work:rest ratios to field-based team-sports is completed in a hot
environment, physiological strain is increased and performance decreased (Morris et al.,
1998, 2000, 2005, Sunderland and Nevill, 2005, Figure 2.8.). Until now, our understanding
of the central and peripheral mechanisms underpinning this fatigue has been limited,
because (i) neuromuscular fatigue has not been assessed using activity patterns similar to
field-based team-sports and we have to rely on findings from repeated-sprint ability
protocols (Racinais et al., 2007; Perrey et al., 2010b); (ii) the twitch interpolation
technique has been used to examine fatigue and does not provide insight to the site or
real extent of central fatigue; (iii) for the one study that has used TMS to elucidate central
mechanisms of fatigue (Girard et al., 2013a), a repeated-sprint ability protocol that was of
a shorter duration and with fewer sprints than most field-based matches was used and
the study was only conducted in a temperate environment. In chapter seven, the
contribution of supraspinal fatigue to intermittent-sprint exercise in the heat using an
ecologically valid team-sport protocol was determined using TMS. Contrary to that
observed with repeated-sprint activity (Girard et al., 2013a), evidence of supraspinal
fatigue was observed in addition to peripheral fatigue. However, when data were
analysed between groups, despite a trend toward decreased voluntary activation the
decrease was not significant. Heat acclimation did not ameliorate neuromuscular fatigue
during intermittent-sprinting but, interestingly, data suggest that there was a trend
toward improved maximal rate of relaxation and work done post acclimation. Although
not significantly different, this may suggest a trend towards more work completed for the
same level of fatigue indicating that an optimised heat acclimation protocol may improve
performance during intermittent-sprinting in the heat.

269
8.3. Future Perspective and Directions for Future Research
8.3.1 Future perspectives
The heat acclimated phenotype can be evoked using a variety of protocols. Assessment of
the validity of these protocols can be judged against the ability to elicit classic heat
acclimation responses. Studies, however, differ in their interpretation of the combination
of classical responses that constitute heat acclimation. Sawka et al., (1996) suggest three
classical responses, those being lower heart rate, lower core temperature, and higher
sweat rate during exercise-heat stress. Other research incorporates increased plasma
volume, reduced skin temperature, decreased perception of effort / thermal sensation or
comfort and improved physical performance (Pandolf et al., 1977; Horowitz and Kodesh,
2010). Therefore, the ability to assess objectively the efficacy of a heat acclimation
protocol is compromised. As such, there is a potential need for the development of a
benchmark set of heat acclimation responses that would serve as criteria against which all
heat acclimation protocols may be judged. Attainment of all criteria by a protocol could
identify a heat acclimation protocol that carries strong validity that perhaps, is judged as a
‘go d tandard’ benchmar . From the review of iterat re com eted for thi the i
(section 2.5.) it is proposed that nine criteria constitute the benchmark set (Figure 8.1.).
This would include; decreased resting and exercise heart rate and core temperature,
decreased skin temperature, increased sweat rate and plasma volume, improved
perceptual response and improved performance.
Theoretically, heat acclimation may be viewed from a dichotomous or continuous
perspective. Dichotomy, however, presents polar perspectives and therefore, with
respect to the ability of a protocol to elicit classic heat acclimation responses, may infer
many protocols are ineffective. Rather, it is proposed that when assessing the efficacy of
a heat acclimation protocol a continuum is more representative and appropriate,
whereby a heat acclimation protocol, dependent upon the heat acclimation criteria

270
achieved against the benchmark standard, would reside on a particular point of the
continuum (Figure 8.3.).
Figure 8.3. Theoretical continuum of heat acclimation with existing studies and data from
current thesis plotted. Existing studies taken from tables in section 2.5.3. & 2.5.4.
Progressive heat acclimation represents pooled data from study three and four of this
thesis. Position on continuum reflects the number of heat acclimation criteria achieved
against the nine identified in section 2.5.
The concept of a continuum also serves as a useful model from which to consider an
individ a ’ tate of heat acc imation. C rrent y, heat acc imation rotoco tend to ado t
a “one ize fit a a roach” whereby ath ete or individ a , irrespective of specialisation
or physical state are subjected to the same protocol to evoke systemic adaptation. It is
well known, however, that a multitude of factors modify the response to acclimation
including aerobic fitness, hydration and genetics (Pandolf, 1977; Horowitz and Kodesh,
2010, Garett et al., 2012). Further, the work in study three and four of this thesis
demonstrated that individuals display varying tolerance to the heat as displayed in earlier
work (Moran et al., 2007). As such, individuals presenting for heat acclimation are
essentially already at differing points on the heat acclimation continuum and this
therefore, requires consideration when administering heat acclimation if responses are to
be optimised. Progressive heat acclimation starts to address this issue as the reduced

271
heat stress may cater for a number of less heat tolerant individuals in the initial stages of
acclimation, but further work is required to optimise the protocol and the evoked
responses since both study 3 and 4 suggested adaptation was not maximised. This may
include use of different heat stress doses in each progressive increment.
Numerous protocols have been used to evoke heat acclimation. Taylor, (2000)
categorized these as constant work rate, controlled hyperthermia and self-regulated
methods. Since this classification there has been an emergence of evidence examining
alternate heat acclimation methods for application to an intermittent-sprint model of
exercise (Sunderland et al., 2008; Petersen et al., 2010; Brade et al., 2013). In addition,
the progressive model used in this study, although based on a constant work rate model,
provides an alternative acclimation possibility and further useful insight to the field. Given
these developments it is suggested that the classification of Taylor (2000) needs to be
extended to reflect new emerging methods of conferring heat acclimation as
demonstrated below (Figure 8.4.).
Figure 8.4. Classification of heat acclimation (Taylor, 2000). New emerging methods or
variation on existing methods shown in red.

272
8.3.2. Directions for future research
In the present thesis progressive heat acclimation was used to confer the heat acclimated
phenotype. From the data presented (chapter six and seven) this method was considered
as effective as the more traditional constant work rate methods in evoking classic heat
acclimation responses. In addition, the protocol may be beneficial for less heat tolerant
individuals as the progressive nature of the heat stress has the potential to prevent drop
out and early cessation of initial sessions due to excessive heat strain, thereby maximising
exposure time. It is unknown, however, how the progressive nature of the protocol
affects the time course and extent of cellular adaptation to heat. The heat shock protein
response is a common, acute and transient reaction to heat stress that confers
thermotolerance. Evidence now exits to suggest that thermotolerance and heat
acclimation are part of the same continuum with the heat shock protein response
important for cellular and systemic adaptation (Kueenen et al., 2011). Recent research
proposes that extra cellular HSP72 concentration is significantly increased only in very hot
ambient conditions where the exogenous heat stress evokes a minimum endogenous
criteria of rapid and sustained increases in core temperature to > 38.5°C and enhanced
sympathetic activity (Gibson et al., 2013). As such, it is unknown whether the progressive
nature of the protocol and concomitant reduced physiological strain in the initial stages
creates a suboptimal heat shock response and adaptation, or merely a different temporal
patterning of the response with greater initial lag that is optimised in the latter stages by
the stepwise increases in heat stress. The data presented in chapter six suggests the
protocol, in contrast to traditional constant work rate methods, can elevate physiological
strain and confer the acclimated phenotype, but whether this is optimal requires further
examination at a cellular level. With a different structure, the progressive model may,
evoke a greater response, but more research is required to elucidate the most
appropriate sequence / duration and insult of each heat stress increment to facilitate
possible shortening of the protocol to increase usability. Finally, isothermal strain heat
acclimation is demonstrated as an effective method to confer heat acclimation (Patterson
et al., 2004; Garrett et al., 2009, 2011). Whether progressive acclimation is as effective is
currently unknown and further research comparing these protocols when matched for
heat stress would add useful information to the field.

273
This thesis is the first to examine central and peripheral fatigue following intermittent-
sprint exercise in the heat using TMS. Although it is generally considered repeated-sprint
type exercise is limited by peripheral mechanisms, the protocols from which these data
are derived use fewer sprints and are of shorter duration than field-based team sports
and have not always been completed in the heat (Racinais et al., 2007; Perrey et al.,
2010b; Girard et al., 2013a & b). In chapter seven in the current work, when data were
pooled for all seventeen participants evidence of peripheral fatigue and decreased
cortical voluntary activation existed after forty minutes of intermittent-sprint exercise in
the heat. Decreased cerebral blood flow and cerebral oxygenation have been reported in
hypoxia compared to normoxia and correlated to a twofold greater decrease in cortical
voluntary activation despite similar levels of peripheral fatigue (Goodall et al., 2012a).
Similarly, passive (Ross et al., 2012) and exercise induced (Nybo and Nielsen, 2001b)
hyperthermia is known to decrease cerebral blood flow and therefore, theoretically
cerebral oxygenation. As such, hyperthermia may have mediated the decline in cortical
voluntary activation observed in the current study. However, no work has examined
cerebral blood flow and oxygenation during intermittent-sprint exercise in the heat to
ascertain whether hyperthermia may mediate cortical voluntary activation during this
type of activity and research in this area would add useful mechanistic information to the
field.
The duration of intermittent-sprinting in the heat in the current study may explain the
decrements in cortical voluntary activation observed in this study, but not others.
However, whether the duration of exposure to hyperthermia during intermittent-sprint
exercise may elicit greater decrements in cortical voluntary activation or peripheral
fatigue is currently unknown. The CISP protocol used in the current work provided insight
to the effects of hyperthermia on neuromuscular fatigue over forty minutes of exercise,
essentially one half of a field-based team-sport, but it is unknown whether the observed
decrements in central and peripheral fatigue during this time would be exacerbated with
a second half period. Given the increased competition for cardiac output between
metabolic and thermoregulatory demands, combined with the exercise-induced
dehydration and potential impact on cerebral blood flow, such a response is possible.

274
Recent research (Nybo et al., 2013), however, would not concur and suggests that
hyperthermia does not mediate central fatigue. In this work (Nybo et al., 2013), however,
central and peripheral fatigue were assessed before and following an actual football
match in the heat where activity was essentially self-paced. Consequently, during the
match in the heat a different pacing strategy was evident as total distance covered and
high-intensity running was reduced. As such, it is possible the effect of heat stress on
central fatigue may have been attenuated compared to a non self-paced laboratory based
protocol of a similar duration.
Compared to direct stimulation of the motor nerve, supramaximal TMS is advantageous
as it allows the site of central fatigue to be localised (Goodall et al., 2012b; Ross et al.,
2012). However, with TMS it is not possible to dissociate between cortical and spinal
contributions to evoked responses (Sidhu et al., 2012a). Modulation of spinal loop
properties e.g. net synaptic excitatory input and excitability of the motor neuron pool
may contribute to spinal mediated fatigue. During intermittent-sprint exercise, such
factors have been assessed in temperate environments using brief protocols by H-reflex
measures (Perrey et al., 2010b) and a reduction, but also no change, has been observed
indicating lack of clarity with respect to spinal fatigue in this type of exercise. More
recently, studies have also attempted to distinguish between cortical and spinal
contributions to fatigue during sustained locomotor exercise using cervicomedullary
stimulation of the descending tracts below the level of the motor cortex, in addition to
TMS (Sidhu et al., 2012a, 2012b), but this technique has not been applied to intermittent-
sprint exercise. As such, examination of spinal contributions to fatigue during prolonged
intermittent-sprint exercise in the heat could be assessed using both H-reflex and
cervicomedullary stimulation methods and such work would add useful insight to
neuromuscular fatigue during intermittent-sprint exercise.
The mechanisms of fatigue in intermittent-sprint exercise show task dependency varying
with the duration, intensity and type of contraction (Bishop, 2012). Recent research
suggests that fatigue during activity of this type is mediated primarily by peripheral

275
mechanisms (Perrey et al., 2010b; Girard et al., 2013a) and therefore, understanding of
the genesis of peripheral fatigue is important. Much research has relied upon the use of
single twitch stimuli to ascertain central fatigue, but this method cannot be used to
characterise the peripheral fatigue. Recent work has used the ratio of low and high
frequency stimuli in short duration running sprints to ascertain low frequency fatigue and
demonstrated that this type of peripheral fatigue predominates in sprint-running exercise
(Perrey et al., 2010b). Low frequency fatigue indicates failure of excitation contraction
coupling, relates to the reduced efficacy of the calcium cycle and is dependent on the
intensity of exercise (Martin et al., 2010). Whether this type of fatigue persists when
sprints are cycling based and performed in the heat in quantities, durations and work:rest
ratios that simulate field-based team sports is currently unknown and requires further
research.
8.4. Practical Application of Findings
The CISP, presented in study four, has been used in previous work to assess intermittent-
sprint exercise performance (Castle et al., 2006, Maxwell et al., 2008; Castle et al., 2011).
Prior to this thesis, the reliability of the CISP had not, however, been determined. From
the experimental data presented in chapter four it is now known that the CISP is a reliable
measure of intermittent-sprint performance. Given that cycling-based protocols provide
valid assessment of repeated-sprinting in match-play (Bishop et al., 2001) the CISP may
therefore, serve as a suitable protocol for examination of differing interventions and
training on performance and metabolism in intermittent-sprint exercise and is more
conducive to sensitive assessment of complex physiological variables compared to
running-based models.
Data presented in chapter 5 highlights the need for heat acclimation for games players
when competing in hot environments. However, the experimental data presented
suggests that, while the overall heat load in acclimation should match expected

276
conditions the composition of thermal factors contributing to the total heat stress should
not be a primary concern when planning the heat acclimation programme, particularly for
durations upward of forty minutes.
The practical importance of the data presented in chapter six and seven is that
progressive heat acclimation may provide a valid alternative model of acclimation for
athletes in preparation for competition. While it is acknowledged that progressive
acclimation did not induce statistical performance improvements during intermittent-
sprint exercise, up to 2.7% and 3.8% improvements in PPO and work done were observed.
In the context of the participants in the current thesis such differences equate to an
increase of ~ 30 W or ~ 110 J. Coupled with the reduced physiological strain and improved
thermal comfort this may represent a meaningful change in performance during this type
of exercise in the heat and may confer advantages during self-paced match play over
durations greater than forty minutes. The progressive acclimation protocol uses a
constant work rate as its basis, but attempts to optimise heat acclimation responses
through the use of successive heat stress increments. This gradual introduction to heat
stress may prove beneficial to athletes that show evidence of heat intolerance. Further,
as comparative evidence from hypoxia demonstrates a beneficial effect of environmental
manipulating in a health-based population (MacKenzie et al., 2011) it is conceivable that
progressive heat acclimation may be beneficial to, for example, an elderly population who
display a marked decrease in the ability to cope with heat stress. As such, progressive
heat acclimation may serve to individualise the heat acclimation process. With limited
evidence for progressive heat acclimation, work in the current thesis serves as a basis for
future research examining the optimisation of this method and further individualisation
of the heat acclimation process through, for example, manipulation of the dose and
increment of heat stress. Currently, Isothermal strain heat acclimation also proposes to
optimise heat adaptation. Little is known, however, of the effect of the increasing
workload associated with this method on training state and immune function response in
an athletic population. In addition, such a method may not be viable for inducing heat
acclimation in, for example, an elderly population where the increasing amount of work
required to elicit and maintain a core temperature of 38.5°C may not be sustainable. With

277
respect to traditional protocols, the sudden exposure to high heat stress associated with
this type of protocol may be too great an insult. Consequently, for both athletic and
elderly populations, progressive heat acclimation may prove a viable alternative method
of acclimation to the heat.
The use of TMS in conjunction with the interpolated twitch technique to examine fatigue
during intermittent-sprint exercise in the heat provides useful practical insight to the
genesis of neuromuscular fatigue during exercise of this type. Use of these techniques in
a hot environment over durations that replicate field-based team-sports provide new
knowledge that may permit better understanding of the factors contributing to fatigue
during exercise of this type and how it may be ameliorated to improve or maintain
performance. The work presented in chapter seven provides insight to the effect of heat
acclimation on markers of central and peripheral fatigue. Although the evidence suggests
heat acclimation did not ameliorate central and peripheral fatigue, the percent
decrement in work done over time and the maximal rate of relaxation tended to be
reduced after heat acclimation (chapter 7). This may suggest a potential benefit of heat
acclimation to intermittent-sprint exercise that may be augmented if performance
extends to a second half.
8.5. Conclusion
In conclusion, the data presented in chapter five, six and seven suggest that intermittent-
sprint exercise performance is impaired when completed in the heat over a period of
forty minutes. Similar to previous research that posits a possible hyperthermia induced
central fatigue (Morris et al., 1998, 2000, 2005; Castle et al., 2011), in this thesis which is
the first to examine neuromuscular fatigue during intermittent-sprinting using TMS,
evidence of a reduction in central drive was present after forty minutes of intermittent
sprinting in the heat when data were pooled for all participants. Further data analysis,
however, revealed only a trend toward reduced central drive that, while possibly

278
meaningful based on the reliability of the measurement technique, indicated a
predominance of peripheral fatigue during exercise of this type. Given that intermittent-
sprint performance was reduced in the heat, the effect of heat acclimation in
ameliorating this response was investigated. A progressive heat acclimation protocol was
used that, based on the evidence presented in chapters six and seven, was deemed
effective in conferring the heat acclimated phenotype. The progressive acclimation model
reduced physiological strain and thermal comfort during intermittent-sprint exercise in
the heat but, in contrast to traditional acclimation, did not ameliorate the reduction in
performance and the significant negative correlation between power output and Tre. PA
did, however, increase power output after acclimation by 2%, which, although not
significant in this work and possibly not meaningful based on the reliability of the CISP,
has been demonstrated significant in other work (Castle et al., 2011). Neuromuscular
fatigue, measured using TMS following intermittent-sprint exercise in the heat, was not
ameliorated by acclimation. Of note, however, was that the percent reduction in maximal
rate of force development (MRFD) and maximal relaxation rate (MRR) was lower after PA,
but did not change with TG. As such it is possible an acclimation induced reduction in
physiological strain may have initiated a trend toward an improved mechanical property
of muscle. As such, it may be that progressive heat acclimation, if optimised, could
contribute to changes in mechanical properties of muscle that may improve peripheral
fatigue during intermittent-sprinting. Future investigations should examine the
endogenous strain and temporal patterning and dose of progressive heat acclimation to
elucidate the optimal heat stress and sequencing to maximise the adaptations conferred
by acclimation of this type.

279
CHAPTER IX. REFERENCES
Allen, D.G., Lamb, G.D., & Westerblad, H. (2008) "S e eta c e Fatig e : Ce ar Mechanisms", Physiological Reviews, 88 (1), 287-332.
Almudehki, F., Girard, O., Grantham, J., et al., (2012) "Hot ambient conditions do not alter intermittent cycling sprint performance", Journal of Science and Medicine in Sport, 15 (2), 148-152.
Amann, M. (2011) "Central and peripheral fatigue: interaction during cycling exercise in humans", Medicine and Science in Sports and Exercise, 43 (11), 2039-2045.
Amann, M., & Dempsey, J.A. (2008) "Locomotor muscle fatigue modifies central motor drive in healthy humans and imposes a limitation to exercise performance", The Journal of Physiology, 586 (1), 161-173.
Amann, M., Venturelli, M., Ives, S.J., et al., (2013) "Peripheral fatigue limits endurance exercise via a sensory feedback-mediated reduction in spinal motoneuronal output", Journal of Applied Physiology, 115 (3), 355-364.
Amorim, F., Yamada, P., Robergs, R., et al., (2011) "Effects of whole-body heat acclimation on cell injury and cytokine responses in peripheral blood mononuclear cells", European Journal of Applied Physiology, 111 (8), 1609-1618.
Andrzejewski, M., Chmura, J., Pluta, B., et al., (2013) "Analysis of sprinting activities of professional soccer players", Journal of Strength and Conditioning Research, 1 (6), 2134-2140.
Aoyagi, Y., McLellan, T.M. & Shephard, R.J. (1995) "The effect of 6 versus 12 days of heat acclimation on heat tolerance in lightly exercising men wearing protective clothing", European Journal of Applied Physiology, 71 (2-3), 187-196.
Aoyagi, Y., McLellan, T.M., & Shephard, R.J. (1997) "Interaction of physical training and heat acclimation: The thermophysiology of exercising in a hot climate", Sports Medicine, 23 (3), 173-210.
Armstrong, L.E. (1998) "Heat acclimatization", in Fahey, T.D. (Ed.), Encyclopaedia of Sports Medicine and Science [Online], Available: <URL:http://www.sportsci.org/encyc/heataccl/heataccl.html> [Accessed 30th November 2013].
Armstrong, L.E. (2000) Performing in Extreme Environments, Champaign, Illinois: Human Kinetics.

280
Armstrong, L.E., Crago, A.E., Adams, R., et al., (1994b) "Use of infrared temperature scanner during triage of hyperthermic runners", Sports Medicine, Training and Rehabilitation, 5 (3), 243-245.
Armstrong, L.E. & Dziados, J.E. (1986) "Effects of Heat Exposure on the Exercising Adult" in Bernhardt, D.B. (Ed.), Sports Physical Therapy, Churchill Livingstone: New York.
Armstrong, L.E., Francesconi, R.P., Kraemer, W.J., et al., (1989) "Plasma cortisol, renin and aldosterone during an intense heat acclimation program", International Journal of Sports Medicine", 10 (1), 38-42.
Armstrong, L.E., & Maresh, C.M. (1991) "The induction and Decay of Heat Acclimatisation in trained athletes", Sports Medicine, 12 (5), 302-312.
Armstrong, L.E., Maresh, C.M., Castellani, J.W., et al., (1994a) "Urinary indices of hydration status", International Journal of Sports Nutrition, 4 (3), 265-279.
Astrand, P.O., Rodahl, K., Dahl, H.A. et al., (2003) Textbook of Work Physiology. Physiological Basis of Exercise, (4th edition), Champaign, IL: Human Kinetics.
Atkinson, G. & Nevill, A. (1998) "Statistical methods for assessing measurement error (reliability) in variables relevant to sports medicine", Journal of Sports Medicine, 26 (4), 217-238.
Avellini, B.A., Kamon, E., & Krajewski, J.T. (1980) "Physiological responses of physically fit men and women to acclimation to humid heat", Journal of Applied Physiology, 49 (2), 254-261.
Backx, K., Naughton, L.M., Crickmore, et al., (2000) "Effects of Differing Heat and Humidity on the Performance and Recovery from Multiple High Intensity, Intermittent Exercise Bouts", International Journal of Sports Medicine, 21 (6), 400-405.
Baker, J.S., McCormick, M.C., & Robergs, R.A. (2010) "Interaction among skeletal muscle metabolic energy systems during intense exercise", Journal of Nutrition and Metabolism [Online]. Available <
http://www.hindawi.com/journals/jnme/2010/905612/> [Accessed 15 July 2013].
Ball, D., Burrows, C. & Sargeant, A. . 1999) “H man ower o t t d ring re eated rint cyc e e erci e: the inf ence of therma tre ”, European Journal of Applied Physiology, 79 (4), 360 -366.
Ba om, P., Seger, ., Sjodin, B. et a ., 1992) “ a ima inten ity intermittent rint exerci e:effect of recovery d ration”, International Journal of Sports Medicine, 13 (7), 528-533.
Bangsbo, J. (1994) Fitness Training in Football – a scientific approach, Bagsvaerd, Denmark:HO Storm.

281
Bangsbo, J., Madsen, K., Kiens, B., et al., (1996) "Effect of muscle acidity on muscle metabolism and fatigue during intense exercise in man", The Journal of Physiology, 495 (Pt 2), 587-596.
Bangsbo, J., Nørregaard, L., & Thorsø, F. (1991) "Activity profile of competition soccer", Canadian Journal of Sport Sciences, 16 (2), 110-116.
Barnett, A., & Maughan, R.J. (1993) "Response of unacclimatized males to repeated weekly bouts of exercise in the heat", British Journal of Sports Medicine, 27 (1), 39-44.
Barro , ., a q er, ., Sant’anna, . 1999) "High inten ity motion pattern analysis of Brazilian elite soccer players in different positional roles", Medicine & Science in Sports & Exercise, 31, S260.
Bartlett, J.W., & Frost, C. (2008) "Reliability, repeatability and reproducibility: analysis of measurement errors in continuous variables", Ultrasound in Obstetrics & Gynecology, 31 (4), 466-475.
Bean, W.B. & Eichna, L.W. (1943) "Performance in relation to environmental temperature", Federal Proceedings, 144-158.
Benzinger, T.H. (1969) "Heat regulation: homeostasis of central temperature in man", Physiological Reviews, 49 (4), 671-759.
Bicego, K.C., Barros, R.C.H., & Branco, L.G.S. (2007) "Physiology of temperature regulation: comparative aspects", Comparative Biochemistry and Physiology. Part A, Molecular & Integrative Physiology, 147 (3), 616-639.
Bigland-Ritchie, B., Johansson, R., Lippold, O.C., et al., (1983) "Contractile speed and EMG changes during fatigue of sustained maximal voluntary contractions" Journal of Neurophysiology, 50 (1), 313-324.
Billaut, F. & Bishop, D. (2009) "Muscle fatigue in males and females during multiple sprint exercise", Sports Medicine, 39 (4), 257-278.
Billaut F., Bishop, D.J., Schaerz, S., Noakes, T.D. (2011) "Influence of knowledge of sprint number on pacing during repeated sprint exercise", Medicine and Science in Sports and Exercise, 43 (4), 665-672.
Bishop, D.J. (2012) "Fatigue during intermittent-sprint exercise", Clinical and Experimental Pharmacology & Physiology, 39 (9), 836-841.
Bishop, D., Spencer, M., Duffield, R., et al. 2001) “ he va idity of a re eated rint abi ity te t”, Journal of Science and Medicine in Sport, 4 (1), 19-29.
Blagden, C. (1775) Phil. Trans in MacPherson (1962).

282
Bland, J.M. & Altman, D.G. (1986) "Statistical methods for assessing agreement between two methods of clinical measurement" Lancet, 1 (8476) 307-310.
B oomfie d, ., Po man, ., ’Donogh e, P. 200 ) "Phy ica demand of different positions in FA Premier League soccer", Journal of Sports Science & Medicine, 6 (1), 63-70.
Boddington, M.K., Lambert, M.I., St Clair Gibson, A., et al (2002) "A time-motion study of female field hockey players", Journal of Human Movement Studies, 4, 229-249.
Bogdanis, G.C., Nevill, M.E., Boobis, L.H., et al., (1996) "Contribution of phosphocreatine and aerobic metabolism to energy supply during repeated sprint exercise" Journal of Applied Physiology, 80 (3), 876-884.
Bonner, R.M., Harrison, M.H., Hall, C.J. et al., (1976) "Effect of heat acclimation on intravascular response to acute heat stress in man", Journal of Applied Physiology, 41, (5), 708-713.
Borg, G. (1970) "Perceived exertion as an indicator of somatic stress" Scandinavian Journal of Rehabilitative Medicine, 2 (2), 92-98.
Boulant, J.A. (2000) "Role of the preoptic anterior hypothalamus in thermoregulation and fever", Clinical Infectious Diseases, 31, (s5) s157-161.
Bo ant, .A. 2006) "Ne rona ba i of Hamme ’ mode for et-point thermoregulation" Journal of Applied Physiology, 100 (4), 1347-1354.
Bourdon P. (2000) Physiological Tests for Elite Athletes, Champaign, Illinois: Human Kinetics.
Boyas, S., & Guével, A. (2011) "Neuromuscular fatigue in healthy muscle: underlying factors and adaptation mechanisms", Annals of Physical and Rehabilitation medicine, 54 (2), 88-108.
Brade, C., Dawson, B., & Wallman, K. (2013) "Effect of precooling and acclimation on repeat-sprint performance in heat", Journal of Sports Sciences, 31 (7), 779-786.
Bradley, P.S., Sheldon, W., Wooster, B., et al., (2009) "High-intensity running in English FA Premier League soccer matches", Journal of Sports Sciences, 27 (2), 159-168.
Brazaitis, M., & Skurvydas, A. (2010) "Heat acclimation does not reduce the impact of hyperthermia on central fatigue", European Journal of Applied Physiology, 109 (4), 771-778.
Brotherhood, J.R. (2008) "Heat stress and strain in exercise and sport" Journal of Science and Medicine in Sport, 11 (1), 6-19.

283
Bruton, J.D., Lännergren, J., & Westerblad, H. (1998) "Effects of CO2-induced acidification on the fatigue resistance of single mouse muscle fibers at 28°C", Journal of Applied Physiology, 85 (2), 478-483.
Brutsaert, T.D. & Parra, E.J. (2006) "What makes a champion: explaining variation in human athletic performance", Respiratory Physiology and Neurobiology, 152 (2-3), 109-123.
Budd, G. . 2001) “A e ment of therma tre – the e entia ”, Journal of Thermal Stress, 26 (4-5), 371-374.
B dd, G. . 2008) “ et-bulb globe temperature (WBGT) – it hi tory and it imitation ”, Journal of Science and Medicine in Sport, 11 (1), 20-32.
Buono, M.J., Ball, K.D., & Kolkhorst, F.W. (2007) "Sodium ion concentration vs. sweat rate relationship in humans", Journal of Applied Physiology, 103 (3), 990-994.
Buono, M.J., Heaney, J.H. & Canine, K.M. (1998) "Acclimation to humid heat lowers resting core temperature", American Journal of Physiology: Regulatory Integrative and Comparative Physiology, 274 (5 Pt 2), R1295-R1299.
Buono, M.J., Martha, S.L., & Heaney, J.H. (2009) "Peripheral sweat gland function is improved with humid heat acclimation", Journal of Thermal Biology, 34 (3), 127-130.
Burk, A., Timpmann, S., Kreegipuu, K., et al., (2012) "Effects of heat acclimation on endurance capacity and prolactin response to exercise in the heat" European Journal of Applied Physiology, 112 (12), 4091-4101.
Buskirk, E.R. (1977) "Temperature regulation with exercise" Exercise and Sport Sciences Reviews, 5, 45-88.
Cabanac, M. (2006) "Adjustable set point: to honor Harold T. Hammel", Journal of Applied Physiology, 100 (4), 1338-1346.
Cacchio, A., Cimini, N., Alosi, P., et al., (2009) "Reliability of transcranial magnetic stimulation-related measurements of tibialis anterior muscle in healthy subjects", Clinical neurophysiology, 120 (2), 414-419.
Cahill, N., Lamb, K., Worsfold, P., et al., (2013) "The movement characteristics of English Premiership rugby union players", Journal of Sports Sciences, 31 (3), 229-237.
Cansev, M., & Wurtman, R.J. (2007) Aromatic Amino Acids in the Brain, in Lajtha, A., Oja, S.S., Schousboe, A. et al., (Eds.), Handbook of Neurochemistry and Molecular Neurobiology (3rd ed., pp. 59–97), USA: Springer.
Capriotti, P.V, Sherman, M.W. & Lamb, D.R. (1999) "Reliability of power output during intermittent high-intensity cycling", Medicine and Science in Sports and Exercise, 31 (6), 913-915.

284
Castle, P.C., (2006) "Alleviating the negative effects of heat stress upon intermittent sprint exercise" PhD thesis.
Ca t e, P.C., acDona d, A.L., Phi , A., et a ., 2006) “Precoo ing eg m c e im rove intermittent
sprint exercise performance in hot, humid condition ”, Journal of Applied Physiology, 100 (4), 1377-1384.
Castle, P., Mackenzie, R.W., Maxwell, N., et al., (2011) "Heat acclimation improves intermittent
sprinting in the heat but additional pre-cooling offers no further ergogenic effect", Journal of Sports Sciences, 29 (11), 1125-1134.
Cedaro, R. (1992) "Environmental factors and exercise performance: A review. 1. Heat and acclimatisation", Excel, 8, 61 - 72.
Charkoudian, N. (2010) "Mechanisms and modifiers of reflex induced cutaneous vasodilation and vasoconstriction in humans", Journal of Applied Physiology, 109 (4), 1221-1228.
Cheung, S. (2010) Advanced Environmental Exercise Physiology, Champaign, Illinois: Human Kinetics.
Cheung, S.S. & McLellan, T.M. (1998)" Heat acclimation, aerobic fitness, and hydration effects on tolerance during uncompensable heat stress", Journal of Applied Physiology, 84 (5), 1731-1739.
Cheung, S.S., McLellan, T.M., & Tenaglia, S. (2000) "The thermophysiology of uncompensable heat stress. Physiological manipulations and individual characteristics", Sports medicine, 29 (5), 329-359.
Cheuvront, S.N., Kenefick, R.W., Montain, S.J., et al., (2010) "Mechanisms of aerobic performance impairment with heat stress and dehydration", Journal of Applied Physiology, 109 (6), 1989-1995.
Chinevere, T.D., Kenefick, R.W., Cheuvront, S.N., et al., (2008) "Effect of heat acclimation on sweat minerals", Medicine and Science in Sports and Exercise, 40 (5), 886-891.
Convertino, V.A., Greenleaf, J.E., & Bernauer, E.M. (1980) "Role of thermal and exercise factors in the mechanism of hypervolemia", Journal of Applied Physiology, 48 (4), 657-664
Cooper, K.E. (2002) "Some historical perspectives on thermoregulation", Journal of Applied Physiology, 92 (4), 1717-1724.
Costa, R.J.S., Crockford, M.J., Moore, J.P. et al., (2014) "Heat acclimation responses of an ultra-endurance running group preparing for hot desert-based competition", European Journal of Sport Science, s1, s131-141.

285
Cotter, J.D., Patterson, M.J., & Taylor, N.A.S. (1997) "Sweat distribution before and after repeated heat exposure", European Journal of Applied Physiology, 76 (2), 181-186.
Coughlan, G.F., Green, B.S., Pook, P.T., et al., (2011) "Physical game demands in elite rugby union: a global positioning system analysis and possible implications for rehabilitation", The Journal of Orthopaedic and Sports Physical Therapy, 41 (8), 600-605.
Craig, A.D. (2002) "How do you feel? Interoception: the sense of the physiological condition of the body", Nature Reviews, Neuroscience, 3 (8), 655-666.
Crandall, C.G., & González-Alonso, J. (2010) "Cardiovascular function in the heat-stressed human", Acta Physiologica, 199 (4), 407-423.
Cunniffe, B., Proctor, W., Baker, J.S., et al., (2009) "An evaluation of the physiological demand of elite rugby union using global positioning system tracking software", Journal of Strength and Conditioning Research, 23 (4), 1195-1203.
Da Silva, J.F., Guglielmo, L.G.A., Carminatti, L.J., et al., (2011), Validity and reliability of a new fie d te t Carminatti’ test) for soccer players compared with laboratory-based measures. Journal of Sports Sciences, 29 (15), 1621-1628.
Daanen, H.A.M., Jonkman, A.G., Layden, et al., (2011) "Optimising the acquisition and retention of Heat Acclimation", International Journal of Sports Medicine, 32 (11), 822-828.
Davis, J.M. (1995) "Central and peripheral factors in fatigue", Journal of Sports Sciences, 13, s49-53.
Davi , . . Bai ey, S.P. 199 ) “Possible mechanisms of central nervous system fatigue d ring e erci e”, Medicine and Science in Sports and Exercise, 29 (1), 45-57.
Decorte, N., Lafaix, P.A., Millet, G.Y., et al., (2012) "Central and peripheral fatigue kinetics during exhaustive constant-load cycling", Scandinavian Journal of Medicine & Science in Sports, 22 (3), 381-391.
De iter, C. ., one , D.A., Sargeant, A. ., et a ., 1999) “ em erat re effect on the rates of isometric force development and relaxation in the fresh and fatigued human add ctor o ici m c e”, Experimental Physiology, 84 (6), 1137-1150.
Deutsch, M.U., Kearney, G.A. ehrer, N. . 200 ) “ ime - motion analysis of professional rugby union players during match - ay”, Journal of Sports Sciences, 25 (4), 461 - 472
Di Salvo, V., Baron, R., González-Haro, C., et al., (2010) "Sprinting analysis of elite soccer players during European Champions League and UEFA Cup matches", Journal of Sports Sciences, 28 (14), 1489-1494.

286
Di Salvo, V., Gregson, W., Atkinson, G., et al., (2009) "Analysis of high intensity activity in Premier League soccer", International Journal of Sports Medicine, 30 (3), 205-212.
Di , D.B., Co ti , D.L. 19 ) “Ca c ation of the ercentage change in vo me of b ood, a ma, and red ce in dehydration”, Journal of Applied Physiology, 37 (2), 247-248.
Docherty, D., Wenger, H.A. & Neary, P. 1988) “ ime - motion analysis related to the hy io ogica demand of r gby”, Journal of Human Movement Studies, 14, 269-277.
Drust, B., Rasmussen, P., Mohr, M., et al., 200 ) “ evation in core and m c e temperature impairs repeated sprint erformance”, Acta Physiologica Scandinavica, 183 (2), 181-190.
DuBois, D., & DuBois, E.F. (1916) "A formula to estimate the approximate surface area if height and weight be known", Archives of Internal Medicine, 17, 863-871.
Duffield, R., King, M., & Skein, M. (2009) "Recovery of voluntary and evoked muscle performance following intermittent-sprint exercise in the heat", International Journal of Sports Physiology and Performance, 4 (2), 254-268.
Dupont, G., Moalla, W., Guinhouya, C., et al., (2004) "Passive versus active recovery during high-intensity intermittent exercises", Medicine and Science in Sports and Exercise, 36 (2), 302-308.
Durnin J.V. & Womersley J. (1974) "Body fat assessed from total body density and its estimation from skinfold thickness: measurement on 481 men and women aged from 16 to 72 years", British Journal of nutrition, 32 (1), 77-97.
D thie, G., Pyne, D. Hoo er, S. 200 ) “ ime – motion analysis of 2001 and 2002 Super 12 r gby”, Journal of Sports Sciences, 23, (5), 523-530.
Edwards, R.H., Melcher, A., Hesser, C.M., et al., (1972) "Physiological correlates of perceived exertion in continuous and intermittent exercise with the same average power output", European Journal of Clinical Investigation, 2 (2), 108-114.
Ellis, H. (1758) Phil. Trans. 50, 754 in MacPherson, (1962)
Ely, B.R., Cheuvront, S.N., Kenefick, R.W., et al., (2010) "Aerobic performance is degraded, despite modest hyperthermia, in hot environments", Medicine and Science in Sports and Exercise, 42 (1), 135-141.
Ely, B.R., Ely, M.R., Cheuvront, S.N., et al., (2009) "Evidence against a 40°C core temperature threshold for fatigue in humans", Journal of Applied Physiology, 107 (5), 1519-1525.

287
Enoka, R.M., & Duchateau, J. (2008) "Muscle fatigue: what, why and how it influences muscle function" The Journal of Physiology, 586 (1), 11-23.
Enoka, R.M., & Stuart, D.G. (1992) "Neurobiology of muscle fatigue", Journal of Applied Physiology, 72 (5), 1631-1648.
Epstein, Y., & Moran, D.S. (2006) "Thermal comfort and the heat stress indices", Industrial health, 44 (3), 388-398.
Epstein, Y., Rozenzweig, T., Heled, Y., et al., (2010) "The impact of heat acclimation on pro- and anti- inflammatory cytokine response", Medicine & Science in Sports & Exercise, 42, 274-275.
Farina, D., Merletti, R. & Enoka, R.M. (2004) "Neural Control of Movement The extraction of neural strategies from the surface EMG", Journal of Applied Physiology, 96 (4), 1486-1495.
Falk, B., Radom- aac, S., Hoffman, . ., et a ., 1998) “ he effect of heat e o ure on performance and recovery from high-inten ity, intermittent e erci e”, International Journal of Sports Medicine, 19 (1), 1-6.
Faul, F., Erdfelder, E., Lang, A.-G., et al., (2007), "G*Power 3: A flexible statistical power analysis program for the social, behavioral, and biomedical sciences", Behaviour Research Methods, 39, 175-191.
Febbraio, M.A., Snow, R.J., Hargreaves, M., et al., (1994) "Muscle metabolism during exercise and heat stress in trained men: effect of acclimation", Journal of Applied Physiology, 76 (2), 589-597.
Fein, J.T., Haymes, E.M. & Buskirk, E.R. (1975) "Effects of daily and intermittent exposures on heat acclimation of women", International Journal of Biometeorology, 19 (1), 41-52.
Field, A. (2009) Discovering Statistics Using SPSS, London: Sage.
Finberg, J.P. & Berlyne, G.M. (1977) "Modification of renin and aldosterone response to heat by acclimatization in man", Journal of Applied Physiology, 42 (4), 554-558.
Fox, R.H., Goldsmith, R., Hampton, I.F., et al., (1964) "The nature of the increase in sweating capacity produced by heat acclimatization", The Journal of Physiology, 171, 368-376.
Fox, R.H., Goldsmith, R., Hampton, I.F. et al., (1967) "Heat acclimatization by controlled hyperthermia in hot-dry and hot-wet climates", Journal of Applied Physiology, 22 (1), 39-46.
Fox, R.H., Goldsmith, R., & Kidd, D.J. (1963) "Blood flow and other thermoregulatory changes with acclimatization to heat", The Journal of Physiology, 166, 548-562.

288
Francesconi, R.P., Sawka, M.N. & Pandolf, K.B. (1983) "Hypohydration and heat acclimation: plasma renin and aldosterone during exercise", Journal of Applied Physiology, 55 (6), 1790-1794.
Frank, S.M., Srinivasa, N.R., Bulcao, C.F. et al. (1999) "Relative contribution of core and cutaneous temperatures to thermal comfort and autonomic responses in humans", Journal of Applied Physiology, 86 (5), 1588-1593.
Frye, A.J., Kamon, E., (1983) "Sweating efficiency in acclimated men and women exercising in humid and dry heat", Journal of Applied Physiology, 54 (4), 972-977.
Froyd, C., Millet, G.Y., & Noakes, T.D. (2013) "The development of peripheral fatigue and short-term recovery during self-paced high-intensity exercise" The Journal of Physiology, 591 (Pt 5), 1339-1346.
Fujii, N., Honda, Y., Ogawa, T., et al., (2012) "Short-term exercise-heat acclimation enhances skin vasodilation but not hyperthermic hyperpnea in humans exercising in a hot environment", European Journal of Applied Physiology, 112 (1), 295-307.
Gabbett, . . 2010) “ he deve o ment of a te t of repeated-sprint ability for elite women’ occer ayer ”, Journal of Strength and Conditioning Research, 24 (5), 1191-1194.
Gaitanos, G.C., Williams, C., Boobis, L.H., et al., (1993) "Human muscle metabolism during intermittent maximal exercise", Journal of Applied Physiology, 75 (2), 712-719.
Galloway S.D. & Maughan, R.J. (1997) "Effects of ambient temperature on the capacity to perform prolonged cycle exercise in man", Medicine and Science in Sports and Exercise, 29 (9), 1240-1249.
Gandevia, S.C. (1998) "Neural control in human muscle fatigue: changes in muscle afferents, motoneurones and motor cortical drive", Acta Physiologica Scandinavica, 162 (3), 275-283.
Gandevia, S.C. (2001) "Spinal and Supraspinal Factors in Human Muscle Fatigue", Physiological Reviews, 81 (4), 1725-1789.
Gandevia, S.C. (1992) "Some central and peripheral factors affecting human motoneuronal output in neuromuscular fatigue", Sports Medicine, 13 (2), 93-98.
Gard, P.R. (1998) Human Endocrinology, Adingdon: CRC Press.
Garden, J.W., Wilson, I.D. & Rasch, P.J. (1966) "Acclimatization of healthy young adult males to a hot-wet environment", Journal of Applied Physiology, 21 (2), 665 -669.

289
Garrett, A.T., Rehrer, N.J., & Patterson, M.J. (2011) "Induction and decay of short-term heat acclimation in moderately and highly trained athletes", Sports Medicine, 41 (9), 757-771.
Garrett, A.T., Creasy, R., Rehrer, N.J., et al., (2012) "Effectiveness of short-term heat acclimation for highly trained athletes", European Journal of Applied Physiology, 112 (5), 1827-1837.
Garrett, A.T, Goosens, N.G., Rehrer, N.J., et al., (2014) "Short-term heat acclimation is effective and may be enhanced rather than impaired by dehydration", American Journal of Human Biology, 26, 311-320.
Garrett, A.T, Goosens, N.G., Rehrer, N.J., et al., (2009) "Induction and decay of short-term heat acclimation", European Journal of Applied Physiology, 107 (6), 659-670.
Gibson, O.R., Dennis, A., Parfitt, T., et al., (2013) "Extracellular Hsp72 concentration relates to a minimum endogenous criteria during acute exercise-heat exposure", Cell Stress and Chaperones. Available: < http://link.springer.com/article/10.1007%2Fs12192-013-0468-1> [Accessed 15 January 2014].
Gill. N. & Sleivert, G. (2001) "Effect of daily versus intermittent exposure on heat acclimation", Aviation, Space and Environmental Medicine, 72 (4), 385 -390.
Girard, O., Bishop, D.J., & Racinais, S. (2013a) "Neuromuscular adjustments of the quadriceps muscle after repeated cycling sprints", PloS one, 8 (5). Available: < http://www.plosone.org/article/info%3Adoi%2F10.1371%2Fjournal.pone.0061793> [Accessed 15 January 2014].
Girard, O., Bishop, D.J., & Racinais, S. (2013b) "Hot conditions improve power output during repeated cycling sprints without modifying neuromuscular fatigue characteristics", European Journal of Applied Physiology, 113 (2), 359-369.
Girard, O., Mendez-Villanueva, A. & Bishop, D.J. (2011) "Repeated-sprint ability - part I: factors contributing to fatigue", Sports Medicine, 41 (8), 673-694.
Glaister, M., Hauck, H., Abraham, C.S., et al., (2009) "Familiarization, reliability, and comparability of a 40-m maximal shuttle run test", Journal of Sports Science & Medicine, 8 (1), 77-82.
Glaister, M., Howatson, G., Lockey, R.A., et al., (2007) "Familiarisation and reliability of multiple sprint running performance indices", Journal of Strength and Conditioning Research, 21 (3), 857-859.
Glaister, M., Witmer, C., Clarke, D.W., et al., (2010) "Familiarisation, reliability and evaluation of a multiple sprint running test using self selected recovery periods", Journal of Strength and Conditioning Research, 24 (12), 3296-3301.

290
Glaister, M. (2005) "Multiple Sprint Work: Physiological Responses , Mechanisms of Fatigue and the Influence of Aerobic Fitness", Sports Medicine, 35 (9), 757-777.
Gleeson, M. (1998) "Temperature regulation during exercise", International Journal of Sports Medicine, 19 (S2), S96-99.
González-Alonso, J. (2012) "Human thermoregulation and the cardiovascular system", Experimental physiology, 97 (3), 340-346.
Gonzalez-Alonso, J., & Calbet, J.A. (2003) "Reductions in Systemic and Skeletal Muscle Blood Flow and Oxygen Delivery Limit Maximal Aerobic Capacity in Humans", Circulation, 107 (6), 824-830.
González-Alonso, J., Calbet, J.A., & Nielsen, B. (1998) "Muscle blood flow is reduced with dehydration during prolonged exercise in humans", The Journal of Physiology, 513 (Pt3), 895-905.
González-Alonso, J., Crandall, C.G., & Johnson, J.M. (2008) "The cardiovascular challenge of exercising in the heat", The Journal of Physiology, 586 (1), 45-53.
González-alonso, J., Mora-rodríguez, R., & Coyle, E.F. (2000) "Stroke volume during e erci e : interaction of environment and hydration", American Journal of Physiology, 278 (2), H321-330.
González-Alonso, J., Teller, C., Andersen, S.L., et al., (1999) "Influence of body temperature on the development of fatigue during prolonged exercise in the heat", Journal of Applied Physiology, 86 (3), 1032-1039.
Goodall, S., González-Alonso, J., Ali, L., et al., (2012a) "Supraspinal fatigue after normoxic and hypoxic exercise in humans", The Journal of Physiology, 590 (Pt11), 2767-2782.
Goodall, S., Howatson, G., Romer, L., & Ross, E.Z. (2012b) "Transcranial magnetic stimulation in sport science: A commentary", European Journal of Sport Science, s1, s332-40.
Goodall, S., Romer, L.M. & Ross, E.Z. (2009) "Voluntary activation of human knee extensors measured using transcranial magnetic stimulation", Experimental physiology, 94 (9), 995-1004.
Gooda , S., o , .Z. omer, L. . 2010) “ ffect of graded hy o ia on ra ina contributions to fatigue with unilateral knee-extensor contraction ”, Journal of Applied Physiology, 109 (6), 1842-1851.
Greenhaff, P.L., Söderlund, K., Ren, J.M., et al., (1993) "Energy metabolism in single human muscle fibres during intermittent contraction with occluded circulation", The Journal of Physiology, 460, 443-453.

291
Griefahn, B. (1997) "Acclimation to three different hot climates with equivalent wet bulb globe temperatures", Ergonomics, 40 (2), 223-234.
Grine, F.E., Fleagle, J.G., & Leakey, R.E. (Eds) (2009). The First Humans – Origin and Early Evolution of the Genus Homo, Dordrecht, Netherlands: Springer.
Groppa, S., Oliviero, A., Eisen, A. et al. (2012) "A practical guide to diagnostic transcranial magnetic stimulation: Report of an IFCN committee", Clinical Neurophysiology, 123 (5), 858-882.
Hamlin, M.J., & Hellemans, J. (2007) "Effect of intermittent normobaric hypoxic exposure at rest on haematological, physiological, and performance parameters in multi-sport athletes", Journal of Sports Sciences, 25 (4), 431-441.
Hammel, H.T., Hardy, J.D., & Fusco, M.M. (1960) "Thermoregulatory responses to hypothalamic cooling in unanesthetised dogs", American Journal of Physiology, 198 (3), 481-486.
Hammel, H.T. (1965) "Neurons and temperature regulation", In: Yamamoto and Brobeck, (1965).
Hargreave , . and Febbraio, . 1998) “Limit to e erci e erformance in the heat”, International Journal of Sports Medicine, 19 (S2), S115-116.
Harrison, M.H., Edwards, R.J., Graveney, M.J., et al., (1981) "Blood volume and plasma protein responses to heat acclimatization in humans", Journal of Applied Physiology, 50 (3), 597-604.
Havenith, G., & Van Middendorp, H. (1986) Determination of the individual state of acclimatization. Institute For Perception, Netherlands, 1-86.
Heled, Y., Moran, D.S., Mendel, L., Laor, A., Pras, E., & Shapiro, Y. (2004) "Human ACE I/D polymorphism is associated with individual differences in exercise heat tolerance", Journal of Applied Physiology, 97 (1), 72-76.
Henane, R., & Valatx, J.L. (1973) "Thermoregulatory changes induced during heat acclimatization by controlled hyperthermia in man", The Journal of Physiology, 230 (2), 255-271.
Herbert, R.D., & Gandevia, S.C. (1999) "Twitch interpolation in human muscles: mechanisms and implications for measurement of voluntary activation", Journal of Neurophysiology, 82 (5), 2271-2283.
Hill, D.W., Borden, D.O., Darnaby, K.M., et al., (1992) "Effect of time of day on aerobic and anaerobic responses to high intensity exercise", Canadian Journal Sport Sciences, 17 (4), 316-319.

292
Hobson, R.M., Watson, P., & Maughan, R.J. (2013) "Acute tryptophan depletion does not improve endurance cycling capacity in a warm environment", Amino Acids, 44 (3), 983-991.
Hodge, D., Jones, D., Martinez, R., et al., (2013) "Time course of the attenuation of sympathetic nervous activity during active heat acclimation", Autonomic Neuroscience : asic & Clinical, 177 (2), 101-103.
Hoffman, J.R., Falk, B., Radom-Isaac, S., et al., (1996) "The effect of environmental temperature on testosterone and cortisol responses to high intensity intermittent exercise in humans", European Journal of Applied Physiology, 75 (1), 83-87.
Hopkins, W.G. (2000a) "Measures of Reliability in Sports Medicine and Science", Sports Medicine, 30 (1), 1-15.
Hopkins, W.G. (2000b) Calculating likely (confidence) limits and the likelihood for true values [Online], Available: <URL: http://www.sportsci.org/resource/stats/xcl.xls,> [Accessed 4 April 2011].
Hopkins, W.G. (2007) A spreadsheet for deriving a confidence interval, mechanistic inference and clinical inference from a P value [Online], Available: < http://www.sportsci.org/2007/wghinf.htm> [Accessed 26 May 2009].
Hopkins, W.G., Schabort, E. J. & Hawley, J. A. (2001) "Reliability of Power in Physical Performance Tests", Journal of Sports Medicine, 31 (3), 211-234.
Horowitz, M. (1998) "Do cellular heat acclimation responses modulate central thermoregulatory activity?", News in Physiological Sciences, 13, 218-225.
Horowitz, M. (2002) "From molecular and cellular to integrative heat defense during exposure to chronic heat", Comparative Biochemistry and Physiology. Part A, Molecular & Integrative Physiology, 131 (3), 475-483.
Horowitz, M., Eli-Berchoer, L., Wapinski, I., et al., (2004) "Stress-related genomic responses during the course of heat acclimation and its association with ischemic-reperfusion cross-tolerance", Journal of Applied Physiology, 97 (4), 1496-1507.
Horowitz, M., & Kodesh, E. (2010) "Molecular signals that shape the integrative responses of the heat-acclimated phenotype", Medicine and Science in Sports and Exercise, 42 (12), 2164-2172.
Horstman, D.H., & Christensen, E. (1982) "Acclimatization to dry heat: active men vs. active women", Journal of Applied Physiology: Respiratory, Environmental and Exercise Physiology, 52 (4), 825-831.
Houmard, J.A., Costill, D.L., Davis, J.A., et al., (1990) "The influence of exercise intensity on heat acclimation in trained subjects", Medicine and Science in Sport and Exercise, 22 (5), 615-620.

293
Hurwitz, S., Cohen, R.J., & Williams, G.H. (2004) "Diurnal variation of aldosterone and plasma renin activity: timing relation to melatonin and cortisol and consistency after prolonged bed rest", Journal of Applied Physiology, 96 (4) 1406-1414.
Inghilleri, M., Berardelli, A., Gruccu, G., et al., (1993) "Silent period evoked by transcranial stimulation of the human cortex and cervicomedullary junction", The Journal of Physiology, 466, 521-534.
Insler, S.R., & Sessler, D.I. (2006) "Perioperative Thermoregulation and Temperature Monitoring" Anesthesiology Clinics of North America, 24 (4), 823-837.
Jay, O. & Kenney, G.P. (2007) "The determination of changes in body heat content during exercise using calorimetry and thermometry", Journal of the Human-Environmental System, 10 (1), 19-29.
Jessen, C. (2001) Temperature Regulation in Humans and Other Mammals, London: Springer
Johnson, J.M., & Kellogg, D.L. (2010) "Local thermal control of the human cutaneous circulation", Journal of Applied Physiology, 109 (4), 1229-1238.
Jones, D.A. (2010) "Changes in the force-velocity relationship of fatigued muscle: implications for power production and possible causes", The Journal of Physiology, 588 (Pt16), 2977-2986.
Kalmar, J.M., & Cafarelli, E. (1999) "Effects of caffeine on neuromuscular function", Journal of Applied Physiology, 87 (2), 801-808.
Kalmar, J.M., & Cafarelli, E. (2006) "Central excitability does not limit post fatigue voluntary activation of quadriceps femoris", Journal of Applied Physiology, 100, 1757-1764.
Kampmann, B., Bröde, P., Schütte, M., et al., (2008) "Lowering of resting core temperature during acclimation is influenced by exercise stimulus" European Journal of Applied Physiology, 104 (2), 321-327.
Kamon, E., Pandolf, K., & Cafarelli, E. (1974) "The relationship between perceptual information and physiological responses to exercise in the heat" Journal of Human Ergology, 3 (1), 45-54.
Karatzaferi, C., de Haan, A., Van Mechelen, W., et al., (2001) "Metabolic changes in single human muscle fibres during brief maximal exercise", Experimental Physiology, 86 (3), 411-415.
Kellogg, D.L. (2006) "In vivo mechanisms of cutaneous vasodilation and vasoconstriction in humans during thermoregulatory challenges", Journal of Applied Physiology, 100 (5), 1709-1718.

294
Kenefick, R.W., Maresh, C.M., Armstrong, L.E., et al., (2007) "Rehydration with fluid of varying tonicities: effects on fluid regulatory hormones and exercise performance in the heat", Journal of Applied Physiology, 102 (5), 1899-1905.
Kenney, W.L. (1998) "Heat flux and storage in hot environments", International Journal of Sports Medicine, 19 (2), S92-95.
Kenny, L., & Johnson, J.M. (1992), "Control of skin blood flow during exercise", Medicine and Science in Sports and Exercise, 24 (3), 303-312.
King, D.S., Costill, D.L., Fink, W.J., et al., (1985) "Muscle metabolism during exercise in the heat in unacclimatised and acclimatised humans", Journal of Applied Physiology, 59 (5), 1350-1354.
Kirby, C.R. & Convertino, V.A. (1986) "Plasma aldosterone and sweat sodium concentrations after exercise and heat acclimation ", Journal of Applied Physiology", 61 (3), 967-970.
Kirwan, J.P., Costill, D.L., Kuipers, H., et al., (1987) "Substrate utilization in leg muscle of men after heat acclimation", Journal of Applied Physiology, 63 (1), 31-35.
Kondo, N., Shibasaki, M., Aoki, K., et al., (2001) "Function of human eccrine sweat glands during dynamic exercise and passive heating", Journal of Applied Physiology, 90 (5), 1877-1881.
Kraning, K.K., & Gonzalez, R.R. (1991) "Physiological consequences of intermittent exercise during compensable and uncompensable heat stress", Journal of Applied Physiology, 71 (6), 2138-2145.
Kresfelder, T.L., Claassen, N., & Cronjé, M.J. (2006) "Hsp70 Induction and hsp70 Gene polymorphisms as Indicators of acclimatization under hyperthermic conditions", Journal of Thermal Biology, 31 (5), 406-415.
Kroeze, W.K., Kristiansen, K., & Roth, B.L. (2002) "Molecular biology of serotonin receptors structure and function at the molecular level", Current Topics in Medicinal Chemistry, 2 (6), 507-528.
Krustrup, P., Mohr, M., Ellingsgaard, H., et al., (2005). "Physical Demands during an Elite Female Soccer Game: Importance of Training Status", Medicine & Science in Sports & Exercise, 37 (7), 1242-1248.
Kuennen, M., Gillum, T., Dokladny, K., et al., (2011) "Thermotolerance and heat acclimation may share a common mechanism in humans", American Journal of Physiology. Regulatory, Integrative and Comparative Physiology, 301 (2), 524-533.
Kumar, P, & Clark, M. (Eds.), (2012) Clinical Medicine, (8th edition), Spain: Elsevier.
Kurz, A. (2008) "Physiology of Thermoregulation", Best Practice & Research Clinical Anaesthesiology, 22 (4), 627-644.

295
Laursen, P.B., Francis, G.T., Abbiss, M.J., et al., (2007) "Reliability of time-to-exhaustion versus time-trial running tests in runners", Medicine and Science in Sports and Exercise, 39 (8), 1374-1379.
Lemmink, K.A., Elferink, M.T. & Visscher, C. (2004) "Evaluation of the reliability of two field hockey specific sprint and dribble tests in young field hockey players", British Journal of Sports Medicine, 38 (2), 138-142.
Lieberman, D.E., Bramble, D.M., Raichlen, D. A., et al., (2009) "Brains, Brawn, and the evolution of human endurance running capabilities", in Grine, F.E., Fleagle, J.G. & Leakey, R.E. (Eds), The First Humans - Origin and Early Evolution of the Genus Homo (pp. 77–92), Dordrecht: Springer Netherlands.
Lind, A.R., & Bass, D.E. (1963) "Optimal exposure time for the development of acclimatization to heat", Federal Proceedings, May-Jun, 22, 704-708.
Linnane, D. ., Brac en, . ., Broo , S., et a ., 200 ) “ ffect of hy erthermia on the metabo ic responses to repeated high-inten ity e erci e”, European Journal of Applied Physiology, 93 (1-2), 159-166.
Lorenzo, S., Halliwill, J.R., Sawka, M.N., et al., (2010) "Heat acclimation improves exercise performance" Journal of Applied Physiology, 109 (4), 1140-1147.
Lorenzo, S., & Minson, C.T. (2010) "Heat acclimation improves cutaneous vascular function and sweating in trained cyclists", Journal of Applied Physiology, 109 (6), 1736-1743.
Lothian, F., & Farrally, M. (1994) "A time-motion analysis of women's hockey", Journal of Human Movement Studies, 26, 255-265.
Ludbrook, J. (1997) "Comparing methods of measurement", Clinical and Experimental Pharmacology and Physiology, 24 (2), 193-203.
Luetkemeier, M.J., Flowers, K.M., & Lamb, D.R. (1994) "Spironolactone administration and training-induced hypervolemia", International Journal of Sports Medicine, 15 (6), 295-300.
Löscher, W.N., & Nordlund, M.M. (2002) "Central fatigue and motor cortical excitability during repeated shortening and lengthening actions", Muscle & Nerve, 25 (6), 864-872.
MacDougall, J.D., Reddan, W.G., Layton, C.R., et al., (1974) "Effects of metabolic hyperthermia on performance during heavy prolonged exercise", Journal of Applied Physiology, 36 (5), 538-544.

296
Macefield, G., Hagbartht, K.E., Gorman, R., et al., (1991) "Decline in spindle support to alpha motoneurones during sustained voluntary contractions", The Journal of Physiology, 440, 497-512.
Machado-Moreira, C.A., de Castro Magalhães, F., Vimieiro-Gomes, A.C., et al., (2005) "Effects of heat acclimation on sweating during graded exercise until exhaustion", Journal of Thermal Biology, 30 (6), 437-442.
MacKenzie, R., Maxwell, N., Castle, P., et al., (2011) "Acute hypoxia and exercise improve insulin sensitivity in individuals with type 2 diabetes", Diabetes/Metabolism Research and Reviews, 27 (1), 94-101.
MacLeod, H., Bussell, C. & Sunderland, C. (2007) "Time-motion analysis of elite women's field hockey, with particular reference to maximum intensity movement patterns", International Journal of Performance Analysis in Sport, 7 (2), 1-12.
MacLeod, H., & Sunderland, C. (2012) "Reliability of the physiological and metabolic responses to a field hockey specific treadmill protocol for elite female players", Journal of Sports Medicine and Physical Fitness, 52 (4), 351-358.
acPher on, . . 1962) “ he a e ment of the therma environment: A review”, British Journal of Industrial Medicine, 19 (3), 151-164.
Macutkiewicz, D., & Sunderland, C. (2011) "The use of GPS to evaluate activity profiles of elite women hockey players during match-play", Journal of Sports Sciences, 29 (9), 967-973.
Magalhães, F.C., Amorim, F.T., Passos, R.F., et al., (2010) "Heat and exercise acclimation increases intracellular levels of Hsp72 and inhibits exercise-induced increase in intracellular and plasma Hsp72 in humans", Cell Stress & Chaperones, 15 (6), 885-895.
Maloyan, A., Palmon, A., & Horowitz, M. (1999) "Heat acclimation increases the basal HSP72 level and alters its production dynamics during heat stress", The American Journal of Physiology, 276 (5 Pt 2), R1506-1515.
Marcora, S. (2009) "Perception of effort during exercise is independent of afferent feedback from skeletal muscles, heart, and lungs", Journal of Applied Physiology, 106 (6), 2060-2062.

297
Marshall, H.C., Ferguson, R.A, & Nimmo, M.A. (2006) "Human resting extracellular heat shock protein 72 concentration decreases during the initial adaptation to exercise in a hot, humid environment", Cell Stress & Chaperones, 11 (2), 129-134.
Martin, V., Kerhervé, H., Messonnier, L.A., et al., (2010) "Central and peripheral contributions to neuromuscular fatigue induced by a 24-h treadmill run", Journal of Applied Physiology, 108 (5), 1224-1233.
arino, F. . 200 ) “Antici atory reg ation and avoidance of cata tro he d ring e erci e-ind ced hy erthermia”, Comparative Biochemistry and Physiology Part B: Biochemistry and Molecular Biology, 139 (4), 561-569.
arino, F. ., Lambert, . . Noa e , .D. 200 ) “S erior erformance of African r nner in warm h mid b t not in coo environmenta condition ”, Journal of Applied Physiology, 96 (1), 124-130.
Maughan, R.J. & Leiper, J.B, (1995) "Sodium intake and post-exercise rehydration in man", European Journal of Applied Physiology, 71 (4), 311-319.
Maughan, R.J., Otani, H., & Watson, P. (2012) "Influence of relative humidity on prolonged exercise capacity in a warm environment", European Journal of Applied Physiology, 112 (6), 2313-2321.
Maughan, R.J. & Shirreffs, S. (2004) "Exercise in the Heat: challenges and opportunities", Journal of Sports Sciences, 22 (10), 917-927.
Maughan, R.J., Shirreffs, S.M. & Leiper, J.B. (2007) "Errors in the estimation of hydration status from changes in body mass", Journal of Sports Sciences, 25 (7), 797-804.
Maxwell, N.S., Aitchison, T.C., & Nimmo, M.A. (1996), "The effect of climatic heat stress on intermittent supramaximal running performance in humans", Experimental Physiology, 81 (5), 833-845.
a we , N.S., Ca t e, P.C., S encer, . 2008) “ ffect of recovery inten ity on ea ower output and the development of heat strain during intermittent-sprint exercise while nder heat tre ”, Journal of Science and Medicine in Sport, 11 (5), 491-499.

298
Maxwell, N.S., Gardner, F. & Nimmo, M.A. (1999) "Intermittent running: muscle metabolism in the heat and the effect of hypohydration", Medicine and Science in Sports and Exercise, 31 (5), 675-683.
Maxwell, N.S., McKenzie, R.W., & Bishop, D. (2009) "Influence of hypohydration on intermittent-sprint performance in the heat", International Journal of Sports Physiology and Performance, 4 (1), 54-67.
McClung, J.P., Hasday, J.D., He, J.R., et al., (2008) "Exercise-heat acclimation in humans alters baseline levels and ex vivo heat inducibility of HSP72 and HSP90 in peripheral blood mononuclear cells", American Journal of Physiology: Regulatory, Integrative and Comparative Physiology, 294 (1), R185-191.
McGawley, K., & Bishop, D. (2006) "Reliability of a 5 x 6-s maximal cycling repeated-sprint test in trained female team-sport athletes", European Journal of Applied Physiology, 98 (4), 383-393.
McNeil, C.J., Giesebrecht, S., Khan, S.I., et al., (2011) "The reduction in human motoneurone responsiveness during muscle fatigue is not prevented by increased muscle spindle discharge", The Journal of Physiology, 589 (Pt 15), 3731-3738.
Meeusen, R., & Watson, P. (2007) "Amino Acids and the Brain : Do hey P ay a o e in “Centra Fatig e”?", International Journal of Sport Nutrition and Exercise Metabolism, 17, s37-s46.
Meeusen, R., Watson, P., Hasegawa, H., et al., (2006) "The Serotonin Hypothesis and Beyond", Sports Medicine, 36 (10), 881-909.
Mendez-villanueva, A., Edge, J., Suriano, R., et al., (2012) "The Recovery of Repeated-Sprint Exercise is Associated with PCr Resynthesis , while Muscle pH and EMG Amplitude Remain Depressed", PLoS One, 7 (12), 4-13.
Mendez-Villanueva, A., Hamer, P., & Bishop, D. (2008) "Fatigue in repeated-sprint exercise is related to muscle power factors and reduced neuromuscular activity", European Journal of Applied Physiology, 103 (4), 411-419.
Merton, P.A. (1954) "Voluntary strength and fatigue", The Journal of Physiology, 123 (3), 553-564.
Millet, G.Y., Martin, V., Lattier, G., et al., (2003) "Mechanisms contributing to knee extensor strength loss after prolonged running exercise", Journal of Applied Physiology, 94 (1), 193-198.

299
Millet, G.Y, Tomazin, K., Verges, S., et al., (2011) "Neuromuscular consequences of an extreme mountain ultra-marathon", PloS one, 6 (2), e17059. doi:10.1371/journal.pone.0017059.
Missale, C., Nash, S.R., Robinson, S.W., et al., (1998) "Dopamine receptors: from structure to function", Physiological Reviews, 78 (1), 189-225.
Mitchell, D., Senay, L.C., Wyndham, C.H., et al., (1976) "Acclimatization in a hot, humid environment: energy exchange, body temperature, and sweating", Journal of Applied Physiology, 40 (5), 768-778.
Mendez-Villan eva, A., Hamer, P. Bi ho , D. 2008) “Fatig e in re eated-sprint exercise i re ated to m c e ower factor and red ced ne rom c ar activity”, European Journal of Applied Physiology, 103, (4) 411-419.
Mohr, M., Krustrup, P., & Bangsbo, J. (2003) "Match performance of high-standard soccer players with special reference to development of fatigue", Journal of Sports Sciences, 21 (7), 519-528.
ohr, ., r tr , P. Bang bo, . 200 ) “Fatig e in occer: A brief review”, Journal of Sports Sciences, 23, (6) 593-599.
Mohr, M., Mujika, I., Santisteban, J., et al., (2010), "Examination of fatigue development in elite soccer in a hot environment: a multi-experimental approach", Scandinavian Journal of Medicine & Science in Sports, 20 (s3), 125-132.
Mohr, M., Nybo, L., Grantham, J., et al., (2012) "Physiological responses and physical performance during football in the heat", PloS one, 7 (6), 1-10.
Mohr, M., Rasmussen, P., Drust, B., et al., (2006) "Environmental heat stress, hyperammonemia and nucleotide metabolism during intermittent exercise", European Journal of Applied Physiology, 97 (1), 89-95.
Molloy, J.M., Smith, J.W., & Pascoe, D.D. (2004) "Effect of a 14 day high intensity exercise protocol on heat acclimation responses", Medicine & Science in Sports & Exercise, 36, S83.
Montain, S.J., & Coyle, E.F. (1992) "Influence of graded dehydration on hyperthermia and cardiovascular drift during exercise", Journal of Applied Physiology, 73 (4), 1340-1350.
ooney, .G., H nter, . ., ’Brien, B. ., et a ., 2011) "Reliability and validity of a novel intermittent peak running speed test for Australian football", Journal of Strength and Conditioning Research, 25 (4), 973-979.
Mora-Rodriguez, (2012) "Influence of aerobic fitness on thermoregulation during exercise in the heat", Exercise and Sport Sciences Reviews, 40 (2), 79-87.

300
Moran, D.S., Erlich, T. & Epstein, Y. (2007) "The heat tolerance test: an efficient screening tool for evaluating susceptibility to heat", Journal of Sport Rehabilitation, 16, 215-221.
Moran, D.S., Montain, S.J. & Pandolf, K.B. (1998b) "Evaluation of different levels of hydration using a new physiological strain index", American Journal of Physiology, 275 (3 Pt 2), 854-860.
Moran, D.S., & Pandolf, K.B. (1999) "Wet bulb globe temperature (WBGT)-to what extent is GT essential?", Aviation, Space and Environmental Medicine, 70 (5), 480-484.
Moran, D.S., Pandolf, K.B., Shapiro, Y., Heled, Y., Shani, Y., Mathew, W.T. & Gonzalez, R.R. 2001) “An environmenta tre inde S ) a a b tit te for the wet bulb globe tem erat re BG )” Journal of Thermal Biology 26 (4-5), 427 - 431.
Moran, D., Pandolf, K., Vitalis, A., et al., (2004) "Evaluation of the environmental stress index (ESI) for the southern hemisphere", Journal of Thermal Biology, 29 (7-8), 535-538.
oran, D.S., Shitzer, A. Pando f, .B. 1998a) “A hy io ogica train inde to eva ate heat tre ” The American Journal of Physiology, 275 (1 Pt 2), 129-134.
Morris, J.G., Nevill, M.E., Boobis, L.H., et al., (2005) "Muscle metabolism, temperature, and function during prolonged, intermittent, high-intensity running in air temperatures of 33° and 17°C", International Journal of Sports Medicine, 26 (10), 805-814.
Morris, J.G., Nevill, M.E., Lakomy, H.K.A., et al., (1998) "Effect of a hot environment on performance of prolonged, intermittent, high intensity shuttle running", Journal of Sports Sciences, 16 (7), 677-686.
orri , .G., Nevi , . . i iam , C. 2000) “Phy io ogica and metabo ic re on e of female games and endurance athletes to prolonged, intermittent, high-intensity r nning at 30˚C and 16˚C", European Journal of Applied Physiology, 81 (1-2), 84-92.
Morrison, S., Sleivert, G.G., & Cheung, S.S. (2004) "Passive hyperthermia reduces voluntary activation and isometric force production", European Journal of Applied Physiology, 91 (5-6), 729-736.
Moseley, P.L. (1997) "Heat shock proteins and heat adaptation of the whole organism", Journal of Applied Physiology, 83 (5), 1413-1417.
Mougios, V. (2006) Exercise Biochemistry, Champaign, Illinois: Human Kinetics.
Mower, G.D. (1976) "Perceived intensity of peripheral thermal stimuli is independent of internal body temperature", Journal of Comparative and Physiological Psychology, 90 (12), 1152-1155.

301
Nadel, E.R., Bullard, R.W. & Stolwijk, JA. (1971) "Importance of skin temperture in the regulation of sweating", Journal of Applied Physiology, 31 (1), 80-87.
Nadel, E.R., Pandolf, K.B., Roberts, M.F., et al., (1974) "Mechanisms of thermal acclimation to exercise and heat", Journal of Applied Physiology, 37 (4), 515-520.
Nadel, E.R., Roberts, M.F., Wenger, C.B., et al., (1976) "Sweating and skin blood flow control during progressive acclimation", Israel Journal of Medical Sciences, 12 (8), 812-814.
Nagashima, K. (2006) "Central mechanisms for thermoregulation in a hot environment", Industrial Health, 44 (3), 359-367.
Nakagawa, S. & Cuthill, I.C. (2007) "Effect size, confidence interval and statistical significance: a practical guide for biologists", Biological Reviews of the Cambridge Philosophical Society, 82 (4), 591-605.
Nakamura, K. (2011) "Central circuitries for body temperature regulation and fever", American Journal of Physiology. Regulatory, Integrative and Comparative Physiology, 301 (5), R1207-1228.
Nakamura, K., & Morrison, S.F. (2010) "A thermosensory pathway mediating heat-defense responses", Proceedings of the National Academy of Sciences of the United States of America, 107 (19), 8848-8853.
Nevill, A.M., Atkinson, G. (1997) "Assessing the agreement between measurements recorded on a ratio scale in sports medicine and sports science," British Journal of Sports Medicine, 31 (4), 314-318.
Nevill, M.E., Garrett, A., Maxwell, N.S., et al., (1995) "Thermal strain of intermittent exercise at 10 and 35°C in man", The Journal of Physiology, 483, 124-125.
Newsholme, E.A., Acworth, I. & Blomstrand, E. (1987) "Amino acids, brain neurotransmitters and a function link between muscle and brain that is important in sustained exercise" in Benzi, G. (Ed.), Advances in myochemistry, London: John Libbey Eurotext.
Newsholme, E.A., & Blomstrand, E. (2006) "Branched-chain amino acids and central fatigue", The Journal of Nutrition, 136 (1), s274S-276.
Nicho a , C. ., N ta , F. . i iam , C. 2000) “ he Lo ghboro gh ntermittent Sh tt e Test: A field test that simulates the activity pattern of soccer", Journal of Sports Sciences, 18 (2), 97-104.
Nielsen, B. (1996) "Olympics in Atlanta: a fight against physics" Medicine and Science in Sports and Exercise, 28 (6), 665-668.

302
Nielsen, B. (1998) "Heat acclimation-mechanisms of adaptation to exercise in the heat", International Journal of Sports Medicine", 19 (s2), s154-156.
Nielsen, B., Hales, J.R., Strange, S., et al., (1993) "Human circulatory and thermoregulatory adaptations with heat acclimatisation and exercise in a hot dry environment", The Journal of Physiology, 460, 467-485.
Nie en, B., ohr, ., ar ov, C., et a ., 2003) “ ffect of high-intensity intermittent training on potassium kinetics and performance in human skeletal muscle", The Journal of Physiology, 554 (Pt3), 857-870.
Nielsen, B., Strange, S., Christensen, N.J., et al., (1997) "Acute and adaptive responses in humans to exercise in a warm, humid environment", Pflügers Archiv : European Journal of Physiology, 434 (1), 49-56.
Noakes, T.D. (2012) "fatigue is a brain-derived emotion that regulates the exercise behavior to ensure the protection of whole body homeostasis", Frontiers in Physiology, 11 (3), 82. doi: 10.3389/fphys.2012.00082.
Nybo, L., & Nielsen, B. (2001a) "Hyperthermia and central fatigue during prolonged exercise in humans", Journal of Applied Physiology, 91 (3), 1055-1060.
Nybo, L., & Nielsen, B. (2001b) "Middle cerebral artery blood velocity is reduced with hyperthermia during prolonged exercise in humans", The Journal of Physiology, 534 (Pt 1), 279-286.
Nybo, L., & Nielsen, B. (2001c) "Perceived exertion is associated with an altered brain activity during exercise with progressive hyperthermia", Journal of Applied Physiology, 91 (5), 2017-2023.
Nybo, L., Dalsgaard, M.K., Steensberg, A., et al., (2005) "Cerebral ammonia uptake and accumulation during prolonged exercise in humans", The Journal of Physiology, 563 (Pt 1), 285-290.
Nybo, L., Girard, O., Mohr, M., et al., (2013) "Markers of muscle damage and performance recovery after exercise in the heat", Medicine and Science in Sports and Exercise, 45 (5), 860-868.
O'Brien, B., Gill, N. & English, R. (2004) "A comparison of low and high intensity exercise strategies on heat acclimatisation", Journal of Science and Medicine in Sport, 7 (Pt 4) s3.
Ohya, T., Aramaki, Y., & Kitagawa, K. (2013) "Effect of duration of active or passive recovery on performance and muscle oxygenation during intermittent sprint cycling exercise", International Journal of Sports Medicine, 34 (7), 616-622.

303
Oliver, J.L., Arm trong, N. i iam , C.A. 200 ) “ e iabi ity and va idity of a occer-specific test of prolonged repeated- rint abi ity”, International Journal of Sport Physiology and Performance, 2 (2), 137-149.
Oliver, J.L., Williams, C.A., & Armstrong, N. (2006) "Reliability of a Field and Laboratory Test of Repeated Sprint Ability", Pediatric Exercise Science, 18 (3), 339-350.
’Donogh e, P.G., Par er, D. 2002) " ime-motion analysis of FA Premier League soccer competition" Journal of Sports Sciences, 20 (1), 26.
Pando f, .B., 1998) “ ime co r e of heat acc imation and it decay”, International Journal of Sports Medicine, 19 (2), s157-s160.
Pandolf, K.B., Burse, R.L. & Goldman, R.F. (1977). "Role of physical fitness in heat acclimatisation, decay and reinduction", Ergonomics, 20 (4), 399-408.
Pandolf, K.B., Cadarette, B.S., Sawka, M.N. et al., (1988) "Thermoregulatory responses of middle-aged and young men during dry-heat acclimation", Journal of Applied Physiology, 65 (1), 65-71.
Parkin, J.M., Carey, M.F., Zhao, S., et al., (1999) "Effect of ambient temperature on human skeletal muscle metabolism during fatiguing submaximal exercise", Journal of Applied Physiology, 86 (3), 902-908.
Parolin, M.L., Chesley, A., Matsos, M.P., et al., (1999) "Regulation of skeletal muscle glycogen phosphorylase and PDH during maximal intermittent exercise", American Journal of Physiology, 277 (5 Pt1), E890-E900.
Paton, C.D., & Hopkins, W.G. (2001) "Tests of cycling performance", Sports Medicine, 31 (7), 489-496.
Patterson, M.J., Stocks, J.M., & Taylor, N.A.S. (2004) "Sustained and generalized extracellular fluid expansion following heat acclimation", The Journal of Physiology, 559 (Pt 1), 327-334.
Parsons, K.C. (2003) Human Thermal Environments: The effects of hot, moderate and cold environments on human health, comfort and performance, London: Taylor and Francis.
Parsons, K.C. 2006) “Heat Stre Standard S 2 3 and it G oba A ication”, Industrial Health, 44 (3), 368-379.
Pepper, S.J. (1985) "The effect of heat acclimation on the responses of cortisol and ACTH to a heat tolerance test", Medicine and Science in Sports and Exercise, 17 (2), 210.
Périard, J.D., Caillaud, C., & Thompson, M.W. (2011a) "Central and peripheral fatigue during passive and exercise-induced hyperthermia" Medicine and Science in Sports and Exercise, 43 (9), 1657-1665.

304
Périard, J.D., Cramer, M.N., Chapman, P.G., et al., (2011b) "Neuromuscular function following prolonged intense self-paced exercise in hot climatic conditions", European Journal of Applied Physiology, 111 (8), 1561-1569.
Perrey, S. De Paula Orca Smirmaul, B., Bosio, A., et al., (2010a) "Afferent feedback from fatigued locomotor muscles is/is not an important determinant of endurance exercise performance. Journal of Applied Physiology, 108 (2), 458-468.
Perrey, S., Racinais, S., Saimouaa, K., et al., (2010b) "Neural and muscular adjustments following repeated running sprints", European Journal of Applied Physiology, 109 (6), 1027-1036.
Petersen, C.J., Portus, M.R., Pyne, D.B. et al., (2010) "Partial heat acclimation in cricketers using a 4 day high intensity cycling protocol", International Journal of Sports Physiology and Performance, 5 (4) 535-545.
Phillips, W.T., Batterham, A.M., Valenzuela, J.E. et al., (2004) "Reliability of Maximal Strength Testing in Older Adults", Archives of Physical Medicine and Rehabilitation, 85 (2), 329-334.
Piantadosi, C.A. (2003) The Biology of Human Survival. Life and Death in Extreme Environments, Oxford: Oxford University Press.
Place, N., Bruton, J.D., & Westerblad, H. (2009) "Mechanisms of fatigue induced by isometric contractions in exercising humans and in mouse isolated single muscle fibres", Clinical and Experimental Pharmacology & Physiology, 36 (3), 334-339.
Place, N., Maffiuletti, N.A., Martin, A., et al., (2007) "Assessment of the reliability of central and peripheral fatigue after sustained maximal voluntary contraction of the quadriceps muscle", Muscle & Nerve, 35 (4), 486-495.
Place, N., Yamada, T., Bruton, J.D., et al., (2008) "Interpolated twitches in fatiguing single mouse muscle fibres: implications for the assessment of central fatigue", The Journal of Physiology, 586 (Pt 11), 2799-2805.
Place, N., Yamada, T., Bruton, J.D., et al., (2010) "Muscle fatigue: from observations in humans to underlying mechanisms studied in intact single muscle fibres", European Journal of Applied Physiology, 110 (1), 1-15.
Portner, H.O. (2002) "Climate variability and the energetic pathways of evolution: the origin of endothermy in mammals and birds", Physiological and Biochemical Zoology, 77 (6), 959-981.
Powers, S.K., & Jackson, M.J. (2008). Exercise- nd ced idative Stre : Ce ar Mechanisms and Impact on Muscle Force Production. Physiological Reviews, 88, 1243–1276.

305
Racinais, S., Bishop, D., Denis, R., et al., (2007) "Muscle deoxygenation and neural drive to the muscle during repeated sprint cycling", Medicine and Science in Sports and Exercise, 39 (2), 268-274.
Racinais, S., & Girard, O. (2012), "Neuromuscular failure is unlikely to explain the early exercise cessation in hot ambient conditions", Psychophysiology, 49 (6), 853-865.
Racinais, S., Mohr, M., Buchheit, M., et al., (2012) "Individual responses to short-term heat acclimatisation as predictors of football performance in a hot, dry environment", British Journal of Sports Medicine, 46 (11), 810-815.
Ramanathan, N.L. (1964) "A new weighting system for mean surface temperature of the human body", Journal of Applied Physiology, 19 (3), 531-533.
Ramanathan, N.L. Be ding, H.S. 19 3) “Phy io ogica eva ation of the BG inde for occ ationa heat tre ”, American Industrial Hygiene Association Journal, 34 (9), 375-383.
am inini, ., Bo io, A., Ferrare i, ., et a ., 2011) “ atch re ated fatig e in occer ayer ”, edicine and Science in S ort and erci e, 43 (11), 2161-2170.
Regan, J.M., Macfarlane, D.J., & Taylor, N.A. (1996) "An evaluation of the role of skin temperature during heat adaptation", Acta physiologica Scandinavica, 158 (4), 365-375.
ei y, . 199 ) “ nergetic of high-intensity exercise (soccer) with particular reference to fatigue", Journal of Sports Sciences, 15 (3), 257-263.
Reilly, T., & Thomas, V. (1976) "A motion analysis of work-rate in different positional roles in professional football match-play", Journal of Human Movement Studies, 2, 97-107.
Rey, E., Lago-Penas, C., Lago-Ballesteros, J., et al., (2010) "The effect of a congested fixture period on the activity of elite soccer", Biology of Sport, 27, 181-185.
Rienzi, E., Drust, B., Reilly, T., et al., (2000) "Investigation of anthropometric and work-rate profiles of elite South American international soccer players", Journal of Sports Medicine and Physical Fitness, 40 (2), 162-169.
Roberts, M.F., Wenger, C.B., Stolwijk, J.A., et al., (1977) "Skin blood flow and sweating changes following exercise training and heat acclimation", Journal of Applied Physiology, 43 (1), 133-137.
Roberts, S.P., Stokes, K.A., Trewartha, G., et al., (2010) "Effects of carbohydrate and caffeine ingestion on performance during a rugby union simulation protocol", Journal of Sports Sciences, 28 (8), 833-842.
Roberts, S.P., rewartha, G., Higgitt, . ., et a ., 2008) “ he hy ica demand of e ite ng i h r gby nion”, Journal of Sports Sciences, 26, (8), 825-833.

306
Robinson, S., Turrell, E.S., Belding, H.S., et al., (1943) "Rapid acclimatization to work in hot climates", American Journal of Physiology, 140 (2), 168-176.
Roelands, B., Goekint, M., Buyse, L., et al., (2009) "Time trial performance in normal and high ambient temperature: is there a role for 5-HT?" European Journal of Applied Physiology, 107 (1), 119-126.
Roelands, B., Goekint, M., Heyman, E., et al., (2008) "Acute norepinephrine reuptake inhibition decreases performance in normal and high ambient temperature", Journal of Applied Physiology, 105 (1), 206-212.
Roelands, B., Hasegawa, H., Watson, P., et al., (2008) "The effects of acute dopamine reuptake inhibition on performance", Medicine and Science in Sports and Exercise, 40 (5), 879-885.
Roelands, B., & Meeusen, R. (2010) "Alterations in central fatigue by pharmacological manipulations of neurotransmitters in normal and high ambient temperature", Sports Medicine, 40 (3), 229-246.
Roelands, B., de Koning, J., Foster, C., et al., (2013) "Neurophysiological determinants of theoretical concepts and mechanisms involved in pacing", Sports Medicine, 43 (5), 301-311.
Romanowski, W., & Grabiec, S. (1974) "The role of serotonin in the mechanism of central fatigue", Acta Physiologica Polonica, 25 (2), 127-134.
o , .Z., Cotter, .D., i on, L., et a ., 2012) “Cerebrova c ar and corticomotor function during progre ive a ive hy erthermia in h man ”, Journal of Applied Physiology, 112 (5), 748-758.
o , .Z., idd eton, N., Shave, ., et a ., 200 ) “Corticomotor e citabi ity contrib te to ne rom c ar fatig e fo owing marathon r nning in man”, Experimental Physiology, 92 (2), 417-426.
o i, S., Ha ett, ., o ini, P. ., et a ., 2009) “Safety, ethica con ideration , and application guidelines for the use of transcranial magnetic stimulation in clinical ractice and re earch”, Clinical Neurophysiology, 120 (12) 2008-2039.
Rowell, L.B. (1993) Human Cardiovascular Control. Oxford, UK: Oxford University Press.
Rowell, L.B., Marx, H.J., Bruce, R A., et al., (1966) "Reductions in cardiac output, central blood volume, and stroke volume with thermal stress in normal men during exercise", The Journal of Clinical Investigation, 45 (11), 1801-1816.
Sandiford, S.D., Green, H.J., Duhamel, T.A., et al., (2005) "Muscle Na-K-pump and fatigue responses to progressive exercise in normoxia and hypoxia", American Journal of Physiology, 289 (2), 441-449.

307
Sargeant, A. . 198 ) “ ffect of m c e tem erat re on eg e ten ion force and hort term ower o t t in h man ”, European Journal of Applied Physiology, 56 (6), 693-694.
Sawka, M.N., Cheuvront, S.N., & Kenefick, R.W. (2012) "High skin temperature and hypohydration impair aerobic performance", Experimental Physiology, 97 (3), 327-332.
Sawka, M., Francesconi, R. Young, A., et al., (1983a) "Influence of hydration level and body fluids on exercise performance in the heat", Journal of the American Medical Association", 252 (9), 1165-1169.
Sawka, M.N., Leon, L.R., & Montain, S.J., et al., (2011) "Integrated physiological mechanisms of exercise performance, adaptation and maladaptation to heat stress", Comprehensive Physiology, 1 (4). Available <
http://www.comprehensivephysiology.com/WileyCDA/CompPhysArticle/refId-c100082.html> [Accessed 19 January 2014].
Sawka, M.N. & Montain, S.J. (2000) "Fluid and Electrolyte supplementation for exercise heat stress", American Journal of Clinical Nutrition, 72 (2), s564-s572.
Sawka, M.N., Toner, M.M., Francesconi, R.P., et al., (1983b) "Hypohydration and exercise: effects of heat acclimation, gender, and environment", Journal of Applied Physiology, 55 (4), 1147-1153.
Sawka, M.N., Wenger, B.C., & Pandolf, K.B. (1996) "Thermoregulatory responses to acute exercise-heat stress and heat acclimation", Handbook of Physiology: A Critical, Comprehensive Presentation of Physiological Knowledge and Concepts, section 4. Available < http://onlinelibrary.wiley.com/doi/10.1002/cphy.cp040109/abstract > Accessed 15 Jan 2013].
Sawka, M.N., Young, A.J., Cadarette, B.S., et al., (1985) "Influence of heat stress and acclimation on maximal aerobic power2, European Journal of Applied Physiology and Occupational Physiology, 53 (4), 294-298.
Sawka, M.N., Young, A. J., Pandolf, K.B., et al., (1992) "Erythrocyte plasma and blood volume of healthy young men", Medicine & Science in Sports & Exercise, 24 (4), 447-453.
Schmitt, E., Gehrmann, M., Brunet, M., et al., (2007) "Intracellular and extracellular functions of heat shock proteins: repercussions in cancer therapy", Journal of Leukocyte Biology, 81 (1), 15-27.
Segar, W.E., & Moore, W.W. (1968) "The Regulation of Antidiuretic Hormone Release in Man: Effects of change in position and ambient temperature", Journal of Clinical Investigation, 47 (9), 2142-2151.
Selye, H. (1946) "The general adaptation syndrome and the diseases of adaptation", The Journal of Clinical Endocrinology", 6 (2), 117-Senay, L.C., & Kok, R. (1977) "Effects of

308
training and heat acclimatization on blood plasma contents of exercising men", Journal of Applied Physiology, 43 (4), 591-599.
Senay, L.C., Mitchell, D., & Wyndham, C.H. (1976) "Acclimatization in a hot, humid environment: body fluid adjustments", Journal of Applied Physiology, 40 (5), 786-796.
Sessler, D.I. (2008) "Temperature monitoring and perioperative thermoregulation", Anesthesiology, 109 (2), 318-338.
Shapiro, Y., Hubbard, R.W., Kimbrough, C.M., et al., (1981) "Physiological and hematological responses to summer and winter dry-heat acclimation", Journal of Applied Physiology, 50 (4), 792-798.
Shibasaki, M., Wilson, T.E., & Crandall, C.G. (2006) "Neural control and mechanisms of eccrine sweating during heat stress and exercise", Journal of Applied Physiology, 100 (5), 1692-1701.
Shido, O., Sugimoto, N., Tanabe, M., et al., (1999) "Core temperature and sweating onset in humans acclimated to heat given at a fixed daily time", The American Journal of Physiology, 276 (4 Pt 2), R1095-1101.
Shin, Y.O., Lee, J.B., Min, Y.K., et al., (2013) "Heat acclimation affects circulating levels of prostaglandin E2, COX-2 and orexin in humans", Neuroscience Letters, 10 (542), 17-20.
Shvartz, E., Saar, E., Meyerstein, N., & Benor, D. (1973) "A comparison of three methods of acclimatization to dry heat", Journal of Applied Physiology, 34 (2), 214-219.
Sidhu, S.K., Bentley, D.J., & Carroll, T.J. (2009a) "Locomotor exercise induces long-lasting impairments in the capacity of the human motor cortex to voluntarily activate knee extensor muscles", Journal of Applied Physiology, 106 (2), 556-565.
Sidhu, S.K., Bentley, D.J., & Carroll, T.J. (2009b) "Cortical voluntary activation of the human knee extensors can be reliably estimated using transcranial magnetic stimulation", Muscle & Nerve, 39 (2), 186-196.
Sidhu, S.K., Cresswell, A.G., & Carroll, T.J. (2012a) "Motor cortex excitability does not increase during sustained cycling exercise to volitional exhaustion", Journal of Applied Physiology, 113 (3), 401-409.
Sidhu, S.K., Hoffman, B.W., Cresswell, A.G., et al., (2012b) "Corticospinal contributions to lower limb muscle activity during cycling in humans", Journal of Neurophysiology, 107 (1), 306-314.
Singh, T.K., Guelfi, K.J., Landers, G., et al., (2010) "Reliability of a contact and non-contact simulated team game circuit", Journal of Sports Science & Medicine, 9 (4), 638-642.

309
Siri, W.E. (1961) "Body composition from fluid space and density" in Brozek, J. & Hanschel, A. (Eds.), Techniques for measuring body composition (pp. 223-244), Washington D.C.: National Academy of Science.
Smith, J.L., Martin, P.G., Gandevia, S.C., et al., (2007), "Sustained contraction at very low forces produces prominent supraspinal fatigue in human elbow flexor muscles", Journal of Applied Physiology, 103 (2), 560-568.
Smolander, J., Ilmarinen, R., Korhonen, O., et al., (1987) "Circulatory and thermal responses of men with different training status to prolonged physical work in dry and humid heat", Scandinavian Journal of Work and Environmental Health, 13 (1), 37-46.
Soares, D.D., Coimbra, C.C., & Marubayashi, U. (2007) "Tryptophan-induced central fatigue in exercising rats is related to serotonin content in preoptic area", Neuroscience Letters, 415 (3), 274-278.
Søgaard, K., Gandevia, S.C., Todd, G., et al., (2006) "The effect of sustained low-intensity contractions on supraspinal fatigue in human elbow flexor muscles", The Journal of Physiology, 573 (Pt 2), 511-523.
Sohar, E., Adar, R. & Kaly, J. 1963) “Com ari on of the environmenta heat load in various art of rae ” Bulletin of the Research Council of Israel, 10E, 111-115.
S encer, ., Bi ho , D., Daw on, B., et a ., 200 ) “Phy io ogica and metabo ic re on e of repeated- rint activitie ”, Sports Medicine, 35 (12), 1025-1044.
Spencer, M., Fitzsimons, M., Dawson, B., et al., (2006) "Reliability of a repeated-sprint test for field-hockey", Journal of Science and Medicine in Sport, 9 (1-2), 181-184.
Spencer, M., Lawrence, S., Rechichi, C., et al., 200 ) “ ime-motion analysis of elite field hockey with special reference to repeated- rint activity”, Journal of Sports Sciences, 22 (9), 843-850.
Stathi , C.G., Zhao, S., Carey, .F. et a ., 1999) “P rine o after re eated rint bo t in h man ” Journal of Applied Physiology, 87 (6), 2037-2042.
Strachan, A.T., Leiper, J.B. & Maughan, R.J. (2004) "Paroxetine administration failed to influence human exercise capacity, perceived effort or hormone responses during prolonged exercise in a warm environment", Experimental Physiology, 89 (6), 657-664.
Strachan, A.T., Leiper, J.B., & Maughan, R.J. (2005) "Serotonin2c receptor blockade and thermoregulation during exercise in the heat", Medicine and Science in Sports and Exercise, 37 (3), 389-394.
Sunderland, C., Marwood, S., & Nevill, M. (2003) "Effect of heat acclimatization on field hockey skill performance", Journal of Sports Sciences, 21 (4), 290.

310
Sunderland, C., Morris, J.G., & Nevill, M.E. (2008) "A heat acclimation protocol for team sports", British Journal of Sports Medicine, 42 (5), 327-333.
Sunderland, C. & Nevill, M.E. (2005), "High-intensity intermittent running and field hockey skill performance in the heat", Journal of Sports Sciences, 23 (5), 531-540.
Tanner, R. & Gore, C. (2013) Physiological Tests for Elite Athletes (2nd edition), Champaign, Illinois: Human Kinetics.
Taylor, N.A.S. (2000) "Principles and practices of heat adaptation" Journal of the Human Environmental System, 4 (1) 11-22.
Taylor, J.L., Butler, J.E., Allen, G.M., et al., (1996) "Changes in motor cortical excitability during human muscle fatigue", The Journal of Physiology, 490 (Pt 2), 519-528.
Taylor, J.L., Butler, J.E., & Gandevia, S.C. (2000) "Changes in muscle afferents, motoneurons and motor drive during muscle fatigue", European Journal of Applied Physiology, 83 (2-3), 106-115.
Taylor, J.L., & Gandevia, S.C. (2001) "Transcranial magnetic stimulation and human muscle fatigue" Muscle & Nerve, 24 (1), 18-29.
Taylor, J.L., & Gandevia, S.C. (2008) "A comparison of central aspects of fatigue in submaximal and maximal voluntary contractions", Journal of Applied Physiology, 104 (2), 542-550.
Taylor, L., Midgley, A.W., Chrismas, B., et al., (2011) "Daily hypoxia increases basal monocyte HSP72 expression in healthy human subjects", Amino Acids, 40 (2), 393-401.
Taylor, N.A.S., Patterson, M.J., Regan, J.M. et al., (1997) Heat Acclimation procedures: Preparation for humid heat exposure [online]. Available: <URL: http://handle.dtic.mil/100.2/ADA335196> [Accessed 5 November 2013].
Taylor, J.L., Todd, G. & Gandevia, S.C. (2006) "Evidence for a supraspinal contribution to human muscle fatigue" Clinical and Experimental Pharmacology and Physiology, 33 (4), 400-405.
hom, .C. 19 9) “ he di comfort inde ”, Weatherwise, 12, 57-60 in Epstein et al., (2006).
Thomas, M.M., Cheung, S.S., Elder, G.C. et al., (2006) "Voluntary muscle activation is impaired by core temperature rather than local muscle temperature", Journal of Applied Physiology, 100 (4), 1361-1369.
Todd, G. Butler, J.E., Taylor, J.L. et al., (2005) "Hyperthermia: a failure of the motor cortex and the muscle", The Journal of Physiology, 563 (Pt 2), 621-631.

311
Todd, G., Taylor, J.L. & Gandevia, S.C. (2003) "Measurement of voluntary activation of fresh and fatigued human muscles using transcranial magnetic stimulation", The Journal of Physiology, 551 (Pt 2), 661-671.
Toner, M.M, (1986) "Perceptual and physiological responses during exercise in cool and cold water", Perceptual and motor skills, 62 (1), 211-220.
Tong R.J., Bell, W., Ball, G., et al., (2001) "Reliability of power output measurements during repeated treadmill sprinting in rugby players", Journal of Sports Sciences, 19 (4), 289-297.
Tucker, R., Marle, T., Lambert, E.V., et al., (2006) "The rate of heat storage mediates an anticipatory reduction in exercise intensity during cycling at a fixed rating of perceived exertion", Journal of Physiology, 574 (Pt3), 905-915.
Tucker, R., Rauch, L., Harley, Y.X., et al., (2004) "Impaired exercise performance in the heat is associated with an anticipatory reduction in skeletal muscle recruitment", Pflügers Archiv: European Journal of Physiology, 448 (4), 422-430.
Tumilty, L., Davison, G., Beckmann, M. et al., (2011) "Oral tyrosine supplementation improves exercise capacity in the heat", European Journal of Applied Physiology, 111 (12), 2941-2950.
Turk, J., & Thomas, I.R. (1975) "Artificial Acclimatization To Heat", Annals of Occupational Hygiene, 17 (3-4), 271-278.
Turk, J., & Worsley, D.E. (1974), A technique for rapid acclimatization to heat for the army, Army Personnel Research Establishment Report 12/74, Farnborough, U.K: Ministry of Defence.
Verdaguer-Codina, J., Martin, D.E., Pujol-Amat, P., et al., (1993) "How heat stress influences athletics: Lessons learnt from the 1992 Olympic Games", New Studies in Athletics, 8 (2), 35-60.
Vernon, H.M. (1930) The Journal of Physiology in MacPherson (1962).
Vickery, T. (2013) 2014 FIFA World Cup: England can conquer heat, humidity and travel [online], Available: <http://www.bbc.co.uk/sport/0/football/25273835> [Accessed 12th December 2013]
Watson, P., Hasegawa, H., Roelands, B., et al., (2005) "Acute dopamine/noradrenaline reuptake inhibition enhances human exercise performance in warm, but not temperate conditions", The Journal of Physiology, 565 (Pt 3), 873-883.
Watt, K.K., Hopkins, W.G., & Snow, R.J. (2002) "Reliability of performance in repeated sprint cycling tests" Journal of Science and Medicine in Sport, 5 (4), 354-361.

312
Weller, A.S., Linnane, D.M., Jonkman, A.G., et al., (2007) "Quantification of the decay and re-induction of heat acclimation in dry-heat following 12 and 26 days without exposure to heat stress", European Journal of Applied Physiology, 102 (1), 57-66.
Weinstein, Y., Bediz, C., Dotan, R. & Falk, B. (1998) "Reliability of peak lactate, heart rate and plasma volume following the Wingate test", Medicine and Science in Sports and Exercise, 30 (9), 1456-1460.
Wendt, D., van Loon, L.J. & Lichtenbelt, W.D. (2007) "Thermoregulation during exercise in the heat: strategies for maintaining health and performance", Sports Medicine, 37 (8), 669-682.
Westerblad, H., Allen, D.G. & Lännergren, J. (2002) "Muscle fatigue: Lactic acid or inorganic phosphate the major cause", News in Physiological Sciences, 17, 17-21.
Westerblad, H., Bruton, J.D. & Katz, A. (2010) "Skeletal muscle: energy metabolism, fiber types, fatigue and adaptability", Experimental Cell Research, 316 (18), 3093-3099.
Wilkinson, D.J., Smeeton, N.J. & Watt, P.W. (2010) "Ammonia metabolism, the brain and fatigue; revisiting the link", Progress in Neurobiology, 91 (3), 200-219.
Williams, C. (1990) "Metabolic Aspects of Exercise" in Reilly, T., Secher, N., Snell, P. & Williams, C. (eds), Physiology of Sports, London: Spon.
Williams, C.A. & James, D.V. (2001) Science for Exercise and Sport, London: Routledge.
Winget, C.M., De Roshia, C.W., & Holley, D.C. (1985) "Circadian rhythms and athletic performance", Medicine and Science in Sports and Exercise, 17 (5), 498-516.
Winter, E.M. & Fowler, N. (2009) "Exercise defined and quantified according to the Sy teme nternationa d’ nite ", Journal of Sports Sciences, 27 (5), 447-460.
Withers, R.T., Maricic, Z., Wasilewski, S. & Kelly, L. (1982) "Match analyses of Australian professional soccer players", Journal of Human Movement Studies, 8 (4), 159-176.
Wragg, C.B., Maxwell, N.S. & Doust, J.H. (2000) "Evaluation of the reliability and validity of a soccer-specific field test of repeated sprint ability", European Journal of Applied Physiology, 83 (1), 77-83.
Wyndham, C.H., Rogers, G.G., Senay, L.C. et al., (1976) "Acclimatization in a hot, humid environment: cardiovascular adjustments", Journal of Applied Physiology, 40 (5), 779-785.
Wyndham C.H., Strydom, N.B., Morrison, J.F., et al., (1954) "Responses of unacclimatized men under stress of heat and work", Journal of Applied Physiology, 6 (11), 681-686.
Yag o , C.P. inard, D. 19 ) “Contro of heat ca a tie at mi itary training centre ”, Archives of Industrial Health, 16 (4), 302-305.

313
Yamada, P.M., Amorim, F.T., Moseley, P., et al., (2007) "Effect of heat acclimation on heat shock protein 72 and interleukin-10 in humans", Journal of Applied Physiology, 103 (4), 1196-1204.
Yamamoto, W.S., & Brobeck, J.R. (1965) Physiological Controls and Regulation, Philadelphia, PA: Saunders.
Yamanaka, K., Haga, S., Shindo, M., et al., (1988) "Time and motion analysis in top class soccer games" in Reilly, T., Lees, A., Davids, K. & Murphy, W.J. (Eds), Science and Football, London: E & F Spon.
Yamazaki, F. & Hamasaki, K. (2003) "Heat acclimation increases skin vasodilation and sweating but not cardiac baroreflex responses in heat-stressed humans", Journal of Applied Physiology", 95, 1567-1574.
Young, A.J., Sawka, M.N., Levine, L., et al., (1985) "Skeletal muscle metabolism during exercise is influenced by heat aclimation", Journal of Applied Physiology", 59 (6), 1929-1935.
Zhang, S. Meng, G., Wang, Y. & Li, J. (1992) "Study of the relationships between weather conditions and the marathon race, and of meteorotropic effects on distance runners", International Journal of Biometeorology, 36 (2), 63-68.

314
University of Brighton PLEASE READ THE FOLLOWING CAREFULLY
Sport and Exercise Science Persons will be considered unfit to do the experiment/exercise task if they:
Welkin Laboratories have a fever, suffer from fainting spells or dizziness
have suspended training due to a joint or muscle injury
PHYSIOLOGY INFORMED CONSENT & MEDICAL QUESTIONNAIRE have a known history of medical disorders, i.e. high blood pressure, heart or lung disease
Name……………………………………………………. and, if appropriate to the study design :
Age………………….. have had hyper/hypothermia, heat exhaustion, or any other or cold disorder; have anaphylactic shock symptoms to needles, probes or other medical-type equipment;
Are you in good health? Yes/No have chronic or acute symptoms of gastrointestinal bacterial infections;
If no, please explain (e.g. dysentery, salmonella); have a history of infectious diseases (e.g. HIV, Hepatitis B);
How often do you currently participate in vigorous physical activity? have a known history of rectal bleeding, anal fissures, haemorrhoids, or any other
(e.g. running, swimming, cycling, team sports) condition of the rectum. < once a month
once a month DECLARATION 2-3 times per week
4-5 times per week I……………………………………………………………..hereby
> 5 times per week volunteer to be a subject in experiments/investigations during the period of
Have you suffered from a serious illness or accident? Yes/No ………………………………………………………………………20……… If yes, please give particulars
My replies to the above questions are correct to the best of my belief and I understand
Do you suffer, or have you ever suffered from :- that they will be treated with the strictest confidence. The experimenter has fully informed
Respiratory problems (e.g. asthma, bronchitis)? Yes No me of, and I have understood, the purposes of the experiment and possible risks involved. Diabetes? Yes No
Epilepsy? Yes No I understand that I may withdraw from the experiment at any time and that I am under no
High or low blood pressure Yes No obligation to give reasons for withdrawal or to attend again for experimentation. Cardiovascular problems? Yes No
Are currently taking medication or dietary supplements? Yes/No Furthermore, if I am a student, I am aware that taking part or not taking part in this experiment
If yes, please give particulars: will neither be detrimental to, nor further my position as a full-time student.
In the last 3 months, have you consulted your G.P. for any condition? Yes/No I undertake to obey the laboratory/study regulations and the instructions of the experimenter If yes, please give particulars: regarding safety, subject only to my right to withdraw declared above.
Are you currently taking part (or have you recently taken part) in any Signature of Subject…………………………………………………Date……………………. Other laboratory experiment? Yes/No Signature of Experimenter……………………………………….. …Date …………………….
Appendix 1. General medical questionnaire and informed consent form

315
APPENDIX 2. TMS specific health questionnaire
Participant Health Questionnaire
Title of Study: Progressive heat acclimation and central fatigue in high intensity intermittent sprint exercise in the heat
Principle Investigator: Mark Hayes
The following health questionnaire will help us to determine whether you are able to take part in the
above titled study. Although slight, the methods used in this study carry some risk if there are
underlying health conditions. Please answer each question as honestly as possible to enable us to
ensure that the protocol is safe for you. The data collected will be kept strictly confidential, and
your results will be completely anonymous in any subsequent publication or presentation.
What is your date of birth? …………………………………
When did you last see your doctor? ………………………………….
Are you currently taking any medication? Yes / No
If yes, please describe below:
.....................................................................................................................................................
To the best of your knowledge, please indicate Yes or No in answer to the questions overleaf:

316
1. Do you have any medically inserted metal plates or pins?
Yes / No
2. Have you ever been diagnosed as having heart disease or a heart condition?
Yes / No
3. Do you suffer from chest pains, heart palpitations or tightness of the chest?
Yes / No
4. Do you feel pain in your chest when you undertake physical activity?
Yes / No
5. Do you have a cardiac pacemaker?
Yes / No
6. Have you had a neurosurgical procedure?
Yes / No
7. Do you have known high blood pressure?
Yes / No
8. Do you have known low blood pressure or do you often feel faint? Yes / No
9. Do you suffer from epilepsy?
Yes / No
10. Have you ever had any type of a seizure?
Yes / No
11. Have you ever had a brain injury, tumour or infection, including meningitis?
Yes / No
12. Do you have any other brain problem or congenital brain defect? Yes / No
13. Have you ever had a head injury? Yes / No

317
14. Have you ever had a stroke?
Yes / No
15. Have you had a cold or feverish illness in the last month?
Yes / No
16. Do you ever lose balance because of dizziness, or do you ever lose consciousness?
Yes / No
17. Have you suffered an upper respiratory tract infection in the last month? Yes / No
18. Do you have any known allergies? (Please specify) Yes / No
19. Have had hyper/hypothermia, heat exhaustion, or any other heat or cold disorder Yes / No
20. Have you had anaphylactic shock symptoms to needles, probes or other Yes / No medical-type equipment.
21. Have you had a history of infectious diseases (e.g. HIV, Hepatitis B); Yes / No
22. Have you ever had rectal bleeding, anal fissures, haemorrhoids, or any other Yes/No condition of the rectum.
23. Have you had exposure to a hot environment in the last 4 weeks Yes / No
If the answer to any of the above details is yes, please give further details below: . . . . . . . . . . . . . . . . . . . . . . . . . . . . . . . . . . . . . . . . . . . . . . . . . . . . . . . . . . . . . . . . . . . . . . . . . . . . . . . . . . . . . . . . . . . . . . . . . . . . . . . . . . . . . . . . . . . . . . . . . . . . . . . . . . . . . . . . . . . . . . . . . . . . . . . . . . . . . . . . . . . . . . . . . . . . . . . . . . . . . . . . . . . . . . . . . . . . . . . . . . . . . . . . . . . . . . . . . . . . . . . . . . . . . . . . . . . . . . . . . . . If you feel at all unwell because of temporary illness such as cold or fever please inform the investigator. If your health status changes so that you would subsequently answer Yes to any of the above questions, please notify the investigator immediately. I have read and fully understand this health questionnaire. I confirm that to the best of my knowledge, the answers are correct and accurate. I know of no reason why I should not participate in this study, and I understand that I will be taking part at my own risk.

318
Participant name (please PRINT) . . . . . . . . . . . . . . . . . . . . . . . . . . . . . . . . . . . . . . . . . . . . . . . .
Participant signature . . . . . . . . . . . . . . . . . . . . . . . . . . . . . . . . . . . . . . . . . . . . . . . . . . . . . . . . . . .
Date . . . . . . . . . . . . . . . . . . . . . . . . . . . . . . . . . . . . . . . . . . . . . . . . . . . . . . . . . . . . . . . . . . . . . . . . . .
Witnessed by researcher (please PRINT) . . . . . . . . . . . . . . . . . . . . . . . . . . . . . . . . . . . . . . . . .
Researcher signature . . . . . . . . . . . . . . . . . . . . . . . . . . . . . . . . . . . . . . . . . . . . . . . . . . . . . . . . . .
Date . . . . . . . . . . . . . . . . . . . . . . . . . . . . . . . . . . . . . . . . . . . . . . . . . . . . . . . . . . . . . . . . . . . . . . . . .


![Past Perfect Progressive & Future Perfect Progressive Part 2[1]](https://static.fdocuments.us/doc/165x107/55cf92fe550346f57b9aff35/past-perfect-progressive-future-perfect-progressive-part-21.jpg)