The effect of pre-exercise standing posture on running ...
120
1 The effect of pre-exercise standing posture on running performance in adolescent males by Duncan Peter Sutcliffe Dissertation submitted in partial fulfilment of the requirements for the degree MSc Sports Science Faculty of Health Sciences Department of Physiology University of Pretoria SUPERVISOR: Dr Kim Nolte 2018-09-24
Transcript of The effect of pre-exercise standing posture on running ...

1
The effect of pre-exercise standing posture on running
performance in adolescent males
by
Duncan Peter Sutcliffe
Dissertation submitted in partial fulfilment of the requirements for the
degree
MSc Sports Science
Faculty of Health Sciences
Department of Physiology
University of Pretoria
SUPERVISOR:
Dr Kim Nolte
2018-09-24

2
DECLARATION

3
This dissertation is dedicated to my parents
For your constant love and support. You showed me that hard work and a positive
mindset are the building blocks for success.

4
ACKNOWLEDGEMENTS
I WOULD LIKE TO THANK:
• My supervisor, Dr Kim Nolte for her guidance and support throughout the whole
research process. Your wisdom and calmness made you the perfect mentor.
• Dr Steve Olorunju for his statistical analysis support. Any queries were answered
in an efficient manner.
• The University of Pretoria for the financial funding of my MSc Sports Science
degree.
• Kevin Crossman for helping with data collection and data analysis. Quantitative
postural assessments are extremely time consuming, which requires a lot of
patience. For that I thank you.
• Devlin Eyden for volunteering to provide support with the equipment used, as well
as assisting during the testing sessions.
• Yaw Fosu Amoah for assisting with participant preparation and daily testing at the
private High School.
• Bruce Collins and Jack Sechana for providing participant numbers from their
respective sport teams.
• Fundi Hlobo, Godfrey Mashegwane and Thabo Matebedi for providing participant
numbers from their respective elite athlete division.

5
SYNOPSIS
Limited research has focused on the possible effects of standing posture on running
performance. The aim of the study was to assess the relationship between postural
assessment scores and running performance results, and to further compare the
postural assessment scores between participant groups (high-performance running
academy and private high school athletes).
The sample consisted of athletes (n = 30) from an elite running academy and (n = 60)
from a private high school in Pretoria (age = 15.51 ± 1.63 years). A modified technique
of Watson and Mac Donncha which assesses eleven common areas of postural
problematic areas was used.1 Sprint speed ability was assessed using the 10, 20 and
40 metre sprint tests. The 20-metre shuttle run test (Bleep test) was conducted which
assessed the aerobic endurance abilities of the participants.
Overall posture rating (mean ± SD) of the elite athlete group (48.20 ± 4.09) was higher
than the private high school group (44.83 ± 4.42) (p = 0.00). The Bleep test results
(mean ± SD) were also superior for the elite athlete group (10.59 ± 1.88) in comparison
to the private high school group (8.26 ± 1.94) (p = 0.00). Furthermore, 10m, 20m and
40m sprint speed results (mean ± SD) were superior for the elite athlete group (1.81s
± 0.12, 3.02s ± 0.23, 5.39s ± 0.31, respectively) in comparison to the private high
school group (2.07s ± 0.27, 3.50s ± 0.34, 6.35s ± 0.62, respectively) (p = 0.00). With
both groups combined, moderate negative correlations were found between overall
posture rating and the 20m and 40m sprint test results (r = -0.47, p = 0.00; r = -0.54,
Title The effect of pre-exercise standing posture on running
performance in adolescent males.
Candidate Duncan Peter Sutcliffe Supervisor Dr Kim Nolte Degree MSc Sports Science

6
p = 0.00 respectively). Furthermore, moderate positive correlations were found
between overall posture rating and the Bleep test results (r = 0.43, p = 0.00).
From the results of this study, higher overall posture ratings (better posture) were
correlated with better speed and aerobic endurance. Therefore, good posture may not
only have important health implications but also may be beneficial for sports
performance in speed and endurance related sports and activities.
Key words: Posture, imbalance, sprint speed, aerobic endurance, elite athlete, private
high-school

7
TABLE OF CONTENTS
1 TITLE PAGE 1
2 DECLARATION 2
3 DEDICATION 3
4 ACKNOWLEDGEMENTS 4
5 SYNOPSIS 5
6 TABLE OF CONTENTS 7
7 LIST OF FIGURES 8
8 LIST OF TABLES 9
9 GLOSSARY 10
10 LIST OF ABBREVIATIONS 11
11 CHAPTER 1 - INTRODUCTION 12
12 CHAPTER 2 - LITERATURE REVIEW 21
13 CHAPTER 3 - METHODOLOGY AND DESIGN 40
14 CHAPTER 4 - RESULTS AND DISCUSSION 51
15 CHAPTER 5 - SUMMARY, CONCLUSIONS AND RECOMMENDATIONS 77
16 REFERENCES 81
17 ANNEXURES 93

8
LIST OF FIGURES
FIGURE 1 Ankle/foot posture 24
FIGURE 2 Knee interspace posture 25
FIGURE 3 Knee hyperflexion posture 26
FIGURE 4 Lordotic posture 27
FIGURE 5 Kyphotic posture 28
FIGURE 6 Scoliotic posture 29
FIGURE 7 Round shoulders posture 31
FIGURE 8 Forward head postures 31
FIGURE 9 Abducted scapulae posture 32
FIGURE 10 Pelvic tilt posture 33
FIGURE 11 The set up for sprint speed assessments 44
FIGURE 12 The set-up for the postural assessments 46
FIGURE 13 The 20m shuttle run test 47
FIGURE 14 Participant numbers included in the research study 52
FIGURE 15 Bar chart of 10m, 20m, 40m sprint results by participant group 55
FIGURE 16 Bar chart of bleep test levels by participant group 55
FIGURE 17 Bar chart of 10m, 20m, 40m sprint results by athlete type 57
FIGURE 18 Bar chart of bleep test levels by athlete type 57
FIGURE 19 Bar chart of 10m, 20m, 40m sprint results by weight category 59
FIGURE 20 Bar chart of bleep test levels by weight category 59

9
LIST OF TABLES
TABLE 1 Demographic data for the three participant groups 53
TABLE 2 Summary statistics for the measurements by participant group 54
TABLE 3 Summary statistics for the measurements by athlete type 56
TABLE 4 Summary statistics for the measurements by weight category 58
TABLE 5 The correlation of the 10M, 20M, 40M, bleep test and total posture
result within the HPC group 60
TABLE 6 The correlation of the 10M, 20M, 40M, bleep test and total posture
result within the private high school group 61
TABLE 7 The correlations of 10m, 20m, 40m, bleep test and total posture
result within both participant groups combined 62
TABLE 8 Postural differences between participant groups (HPC and private
high school) 63
TABLE 9 Postural differences between athlete types (HPC speed, HPC
endurance and private high school) 64
TABLE 10 Postural differences according to weight categories 65

10
GLOSSARY
• Bipedalism - A way of locomotion where the hind legs are independently used for
movement
• Homo erectus - An extinct species that were able to stand upright.
• Exercise related transient abdominal pain - Caused by various actions that require
repetitive upper body movements and is generally referred to as a stitch.
• Maximal voluntary oxygen consumption - A measure of an athlete’s endurance
capacity (cardiorespiratory fitness) which is determined during incremental exercise
by measuring an individual’s oxygen consumption.
• Cervical Vertebrae - Seven upper vertebrae which constitutes the neck region.
• Thoracic Vertebrae - Twelve middle vertebrae which forms the trunk region
• Lumbar Vertebrae - Five lower vertebrae between the rib and pelvic region.
• Gait Cycle - A full cycle of walking/running which is initiated by the foot touching the
ground and ending when the same foot touches the ground again.
• Neutral Spine - This occurs when all 3 natural spinal curvatures are in the correct
positions which causes the spine to be in good alignment.
• Musculoskeletal Balance - Arrangements of body parts relative to one another which
allows for an equilibrium state.
• Lactate Threshold - When the intensity of specific exercise is increased, which
causes the lactate build-up to occur faster than the lactate removal.

11
LIST OF ABBREVIATIONS
Abbreviation Meaning
ml.kg-1.m-1 Average energy expenditure (average oxygen cost)
B.C. Before Christ
WADA World anti-doping agency
HPC High Performance Centre
ETAP Exercise related transient abdominal pain
VO2 max Maximal voluntary oxygen consumption
FHRSP Forward head, round shoulders posture
GRF Ground reaction force
BF% Body fat percentage
C7 C = Cervical Vertebrae
T1, T3, T6, T9, T12 T = Thoracic Vertebrae
L3, L5 L = Lumbar Vertebrae
kg Kilogram
VO2 peak A plateau in the human body where oxygen consumption
is observed during maximum physical effort

12
CHAPTER 1 INTRODUCTION
1.1. BACKGROUND INFORMATION 13
1.2. DEFINING THE RESEARCH PROBLEM 16
1.3. PURPOSE OF THE STUDY 17
1.4. AIMS AND OBJECTIVES OF THE STUDY 18
1.5. RELEVANCE AND MOTIVATION FOR THE STUDY 18
1.6. LIMITATIONS OF THE STUDY 19
1.7. STRUCTURE OF THE DISSERTATION 20

13
1.1. BACKGROUND INFORMATION
As foretold by Darwin, “bipedalism is the defining feature of the earliest hominins3 and
thus marks a critical divergence of the human lineage from the other apes”.2 Rodman
and McHenry further explained this finding by hypothesizing that the evolution into
bipedalism was for the sole purpose of reducing the cost of locomotion in relation to
the last common ancestor of chimpanzees and humans.4 Sockol et al. clarified that
the cost of transport for human walking was seventy-five percent less than
chimpanzee locomotion (mL.kg-1.m-1). Therefore, hominins reduced the energy cost
of walking and foraging which provided an evolutionary advantage over other apes.5
Upright posture has been an adaptation that occurred over five million years ago. “It
probably took more than five million years to make our hind limbs able to support the
whole-body weight while standing”.6
“Evolution selected specific biomechanical features that make human locomotion
mechanically efficient”.7 Regular upright locomotion is a unique human evolutionary
adaptation that occurred over a vast time frame.8-9 It was further explained that these
adaptations are caused by skeletal and muscular alterations over the course of
history.8-9 Adaptations towards an upright posture has led to increases in human
endurance due to improved economy of the gait cycle, although motility was reduced.6
Even though an erect posture is less stable compared other primates, the human brain
adapted over the course of time which allows for accurate skeletomuscular
adjustments which is essential for maintaining body stability.10 “Other anatomical
changes exist that increased the range of movements which could be used to stabilize
the body, such as an enhanced flexibility of the spine for lower back movements”.10
Compliant walking is the walking style possessed by unevolved bipedal species which
sustains the body’s center of mass in a fixed position during the gait cycle.10 Although
this form of locomotion is extremely stable, efficiency of movement is affected.10 Homo
Sapiens evolved to a more “stiff gait by creating a postural instability with its constant
raising then lowering of the body’s center of mass”.10 This unstable style of locomotion
creates phases of body instability and thus increases the chances of tripping or

14
falling.10 “Striding bipedalism is a key derived behavior of hominids that possibly
originated soon after the divergence of the chimpanzee and human lineages”.11 This
form of locomotion was an essential stepping stone for the evolution of walking and
running. “Although bipedal gaits include walking and running, running is generally
considered to have played no major role in human evolution because humans, like
apes, are poor sprinters compared to most quadrupeds”.11 The Homo erectus species
adapted their physiological and physical structures which set them apart from other
primate species. These adaptations included the formation of upright postures which
ultimately allowed the species to participate in long-distance endurance running.11-12
Archaeological findings suggest that endurance running is a modification of the Homo
species more than 2 million years ago, which may have been a contributing factor for
human evolution.11
Inevitably, as human movements have evolved over time, competitions were
formulated to identify superior performances in sport. “A sport is defined as an activity
requiring direct physical competition with an opponent(s), has established procedures
and rules, and defined criteria for determining victory”.13 “Records of competitive
racing date back to the first recorded Olympic games that took place in 776 B.C. in
Greece”.14 In particular, running performances are based according to the type of
running event, namely; sprints, middle distance and long distance. As the level of
competition increases, so does the need for new methods to improve performances.
Analysing sporting performances has been an integral part of the evolution of sport,
which introduced the use of notational analysis. Hughes recognized the four functions
of notational analysis as; “technical evaluation, tactical evaluation, analysis of
movement and statistical compilation”.15 A sports biomechanist is an individual who
makes use of notational analytics to improve sporting performances. Various
researchers explained that biomechanists predominantly focus their efforts on sports
which are based around a movement technique, such as running.16-17 “Performance
enhancements can be in the form of medical or technological enhancements which
opens up new possibilities for modifying the body and enhancing performances”.18
Some medical performance enhancements may be deemed illegal in sport, which lead
to the development of the World anti-doping agency (WADA) in 1999. Over a long
period of time, sport has established fairly strict anti-doping rules to reduce the

15
unwarranted use performance enhancements.18 Illegal performance enhancements
have been produced in order to attain victories in the specific sports while going
against various sporting rules.
Due to the fact that running is a fundamental task, it has been labelled as the most
accessible sport worldwide. Fundamental tasks like running needs to be implemented
at an early age to ensure positive growth and development. It is also essential to
identify all the factors that may affect running performances and general health.
Posture may be one of these factors and thus formed the need to identify if a
relationship exists between posture and running performances. Although posture has
been identified as an important contributor towards general health, limited research
has provided its direct effect on running performances.

16
1.2. DEFINING THE RESEARCH PROBLEM
Over the past decade, a significant amount of research has been conducted on the
effects of backpacks on adolescents, as well as the long-term effects of bad posture.
Deficits with regards to an individual’s health or workload are commonly linked to
musculoskeletal impairments, which in turn, has led to an increased interest in postural
optimization.19 It was further explained that an increased interest has been directed
towards the effects of backpacks on posture.19 Although posture is a vital aspect of
general health, limited research has provided its direct effect on running performances.
It is easy to categorize body posture as body shape and dimensions and look past the
underlying concept of posture. Abd-Elkader and EL-Bab explained that “posture is
limited to one’s body shape and its outer limits”.20 In addition to this, it was further
specified that “sufficient body posture is the mechanical relationship between different
body organs and systems; bones, muscles and nervous”.20 If body posture is
problematic, the mechanical relationships are consequently affected.
Inevitably, as the technological field is expanding, so will the regular usage of
cellphones, tablets and laptops while maintaining improper posture. This may lead to
the loss of normal curvature and increased stresses on the cervical spine. “These
stresses may lead to early wear, tear, degeneration, and possibly surgeries”.21
According to Hansraj, completely avoiding technology is not the answer, but improving
the manner of which the technology is used can be beneficial in decreasing the
chances of attaining muscular imbalances.21 It was further explained that “individuals
should make an effort to look at their phones with a neutral spine and to avoid spending
hours each day hunched over”.21
It is difficult to narrow down the individual causes of running performance deficits due
to its multifaceted nature, therefore, the researcher will scientifically analyse how an
individual’s static standing posture may affect running performances. Running with
regards to speed and endurance, is an activity which requires involvement from both
postural and phasic muscles. An imbalance between the two may lead to detriments
in running performances. It is important to emphasize postural development from a
young age to avoid negative side effects of poor posture later in life. “Many minor

17
deviations in posture are related to problems of muscular development, and the forces
produced during exercise are then unequally distributed and as a result, the chances
of sustaining an injury are increased”.22 Furthermore, postural deviations are
commonly caused by individualised lifestyle patterns.23-24 When a certain muscle
group is favoured, imbalances are a common finding. Singer and Dip further
emphasized this fact by explaining that muscular imbalances ultimately lead to
postural problems, such as; compromised joint mechanics, resulting in compromised
overall mechanics.25 There are two types of muscles: postural and phasic.26 Postural
muscles are used for standing and walking while phasic muscles are used for
running.26 When an individual commences a gait cycle movement, specific gait
mechanics request effective firing patterns from the postural muscles to maintain
muscular balance and control, while the phasic muscles promote the forward
movement of the runner.26 Due to constant postural muscle activation to contest the
effects of gravity, they have a tendency to shorten and become tight. In comparison,
phasic muscles typically may remain in an elongated state. Runners experience long
periods of constant training which may cause postural muscle tightness and
shortening.26-27 Fredericson and Moore further extrapolated this fact; “muscles which
are used frequently can shorten and become dominant in a motor pattern.26 If a muscle
predominates in a motor pattern, its antagonist may become inhibited and cause a
muscle imbalance”.26 Adolescents who have not yet developed postural control, or
who have developed postural control in a negative growth fashion, may not be have
the necessary postural standing stability, thus having an unstable base of support for
running. Stable base of support is built on a stable core structure. “A weakness or lack
of sufficient coordination in core musculature can lead to less efficient movements,
compensatory movement patterns, strain, overuse, and injury”.26,28
1.3. PURPOSE OF THE STUDY
Relationships obtained through the research procedures may help identify the link
between posture and performance in running. The relationship between pre-exercise
standing posture and running performance in adolescents can be used to further
increase the pool of knowledge on performance parameters.

18
1.4. AIMS AND OBJECTIVES OF THE STUDY
Aim:
• To assess the relationship between postural assessment scores and running
performance results, and to further compare the postural assessment scores
between the participant groups (private high-school and a high-performance
running academy).
Objectives:
• To assess the postural assessment scores of eleven postural components, running
endurance results from 20m multistage shuttle run tests and running speed results
from 10m, 20m and 40m sprint tests within the two participant groups (private high-
school and a high-performance running academy).
• To correlate the eleven postural assessment scores, running speed results from
10m, 20m and 40m sprint tests and running endurance results from 20m multistage
shuttle run tests between the two participant groups (private high-school and a
high-performance running academy.
1.5. RELEVANCE AND MOTIVATION FOR THE STUDY
Performance analysis is forever growing in the world of sport. A vast amount of capital
is being placed into an array of methods and techniques to better an athlete’s
performance, while limited effort is allocated to the structural components, namely
posture. Postural promotion at a young age may have major benefits later in life,
including quality of life, improved health and sporting performances. Ages 14-18 are
vital stages in terms of growth and development. Various researchers believe that
muscle flexibility and tightness are key determinants of body postural statuses, which
are highly affected during the pubertal stages.29-31 “It is important to remember that the
stage of development of postural responses may influence the ability of the child to
maintain a relaxed standing posture”.32 Although posture is a vital aspect of general
health, limited research has provided its direct effect on running performances.

19
Posture is a component of health and performance that is severely neglected at all
ages and levels of participation. Evidence has shown that good posture may have
endless benefits for an individual, while postural limitations may lead to an array of
problems. Lowman stated: “If steps are taken to correct malalignment or structural
deviation, the individual involved will not only be protected against injury, but the
efficiency of his performance will improve up to maximum capacity”.33 Many activities
that promote postural growth have been substituted for sedentary activities with
inadequate postural benefits. Postural deviations are commonly caused by
individualised sedentary lifestyle habits.23-24
Postural imbalances identified may have detrimental effects on performances in an
array of sporting codes, as well as the individual’s general health. If postural deviations
are identified, interventions can be implemented at every educational level to identify,
correct and maintain postural imbalances which may prevent long term effects on the
individual. In addition, specialised postural improvement programs may benefit all
individuals regardless of postural statuses. Inadequate research has provided the
direct effects of standing posture on running performance. As the world of sport is
forever growing, so is the emphasis on performance analysis.
1.6. LIMITATIONS OF THE STUDY
The following factors could be considered as limitations to the study:
• Participants for the study were limited to elite level sprint and endurance athletes
from the high-performance running academy (HPC) and students at a private high
school in Pretoria.
• Some private high school participants play numerous sports, and therefore could
have acquired higher fatigue levels in comparison to other participants.
• The high-performance running academy sprint and endurance athletes had
different in-season and off-season periods which may have affected their
performance and fatigue levels.

20
1.7. STRUCTURE OF THE DISSERTATION
• Chapter 1: Background information of the research study, the purpose of the study
conducted, the specific objectives that were followed by the researcher, the
significance of the study, and limitations overcome in the study
• Chapter 2: The theory of the research topic which is described by various
information sources, which was further related to the research project.
• Chapter 3: Describes the procedures used to gather and analyse the research
data. All the aspects that played a role in data collection were explained.
• Chapter 4: All research results are specified, and then further discussed so that
conclusion can be made.
• Chapter 5: Composed of a general summary of the research study, and
recommendations for future research.
• References: All research sources that were used to gather information was
thoroughly referenced. This is based on the guidelines set by the University of
Pretoria.
• Annexures: Consists of all the necessary documentation used before and during
the testing procedures.

21
CHAPTER 2
LITERATURE REVIEW
2.1. INTRODUCTION 22
2.2. LITERATURE OVERVIEW 22
2.2.1. DEFINING POSTURE 22
2.2.2. DEFINING AEROBIC RUNNING ENDURANCE 34
2.2.3. DEFINING RUNNING SPEED 36
2.2.4. ASSESSING POSTURE 37
2.2.5. COMPLICATIONS OF INCORRECT POSTURE 38

22
2.1. INTRODUCTION
Regardless of gender or age, postural promotion strategies should be directed to
acquiring a neutral spine. Postural shortcomings can be identified and corrected by
conducting relatively simple exercises. Even though postural imbalances may be
simple to identify and correct, more emphasis is often placed on fat loss and muscle
building. Janda proposed that “the most recognisable cause of postural imbalances is
sedentary lifestyle patterns”.23 It was further explained that “sedentary lifestyle patterns
are implicated to favour the postural muscles in relation to phasic muscles, thus
ultimately leading to muscular imbalances”.23 Sedentary lifestyle patters may include
improper sitting, standing and lying positions.
2.2. LITERATURE OVERVIEW
2.2.1 DEFINING POSTURE:
Good posture has been defined as “a state of musculoskeletal balance that involves
a minimal amount of stress or strain to the body”.27 As an individual commences in a
certain task or action, body segments are shifted to accommodate movements. As
body segments shift, so does one’s posture. Watson defined good posture as “a
situation when the centre of gravity of each body segment is placed vertically above
the segment below”.34 Fredericson and Moore summed up the fundamental positives
of postural promotion by stating that “when the system works efficiently, the result is
appropriate distribution of forces; optimal control and efficiency of movement;
adequate absorption of ground-impact forces; and an absence of excessive
compressive, translation, or shearing forces on the joints of the kinetic chain”.26
Although postural muscles have many different individual functions, the primary aim is
to preserve a state of muscular balance, and therefore to ensure an upright posture.35-
36 It was further stipulated that when physical inactivity or muscular imbalances occur,
postural muscles predominantly tighten, while working phasic muscles are likely to

23
become weak.35-36 Janda further explained that specific postural assessment
strategies should be put in place to examine tightened postural muscles and
weakened phasic muscles.23,37 Furthermore, once the assessment has been
conducted, treatment strategies can be planned and executed to treat muscular
imbalances.23,37 “A treatment rationale should include appropriate mobilization
therapies along with improving muscle extensibility of ‘tight’ postural muscles and
facilitating ‘weakened’ phasic muscles”.23,37
Discussed below are eleven common areas of posture deviances and their
relationships to running.
• Ankle/Foot Posture – Based on pronation or supination of the foot. The foot is an
important factor which starts the mechanical processes of running. “A foot is
positively aligned when the bisection of posterior surface of the calcaneus is
perpendicular to the ground”.38 Consequently, any deviations in the foot or ankle
structures will have a chain reaction effect on surrounding structures. Certain
structural adaptations in the foot may have adverse effects on foot alignments, and
consequently, a reduced mechanical productivity during the gait cycle.39 The foot
and ankle structures are the primary defence units against shock absorption when
running. The structural composition of the foot and ankle structures are vital for
load absorption, and therefore are essential to absorb the excessive loads which
are shifted superiorly up the leg while running.40 It was further explained that:
“supinated feet are limited in shock absorption properties and are prone to higher
stresses, while pronated feet have greater contact areas, more flexible structures
and lead to decreased loads absorbed by musculoskeletal structures of the foot”.38
It was found that different shoes contain diverse cushioning strategies to combat
the effects of shock absorption, and therefore, the rate of oxygen consumption
varied between different shoes, with shoes having more cushioning usually being
associated with lower oxygen consumption levels.41 This finding can be related to
the shock absorption properties of pronated and supinated feet structures, by
providing evidence that increased shock absorption in pronated feet may lead to
decreased oxygen consumption levels. When an individual has postural problems

24
in the feet that cannot be fixed by means of cushioning strategies, orthotic devices
may be used. Various authors extrapolated the effectiveness of orthotic devices,
by explaining that “…reduced muscle activity, increases muscular performance,
and feeling comfortable”,42-43 are just a few benefits of introducing orthotic devices
to a runner. This emphasizes the effectiveness of good foot structures for the
provision of good running performances.
Figure 1. Ankle/foot posture

25
• Knee Interspace – Based on genu varum or genu valgus positions of the knee.
Clement explained that a mechanical compensation is often caused by genu varum
or genu valgus, and therefore, results in a decreased mechanical efficiency due to
increased muscle activations for a specific movement.44 Knee valgus, often known
as knock knees, is renowned to severely increase the lateral forces acting on the
knee structure.45 Increased forces acting on a joint often results in compensatory
deficiencies and even injuries. Dierks et al. identified that a valgus position of the
knee is commonly shaped by excessive femoral adduction and
underdeveloped/weak hip abductors.45 A structurally strong agonist-antagonist
muscle combination of the hamstring and quadricep muscles, stabilized the knee
and greatly reduced the chances of generating genu varum or genu valgus.46 Most
of the knee valgus/varum research has been aimed at promoting injury prevention,
and not directed towards improving performances in sport.
Figure 2. Knee interspace posture

26
• Knee hyperflexion/extension – “An important determinant of the mechanics of
running is the effective vertical stiffness of the body, which is escalated by
increases in running speed”.47 Groucho running is a running technique where one’s
knee angles are reduced to decrease the vertical stiffness acting on the ankle, knee
and hip joints.47 Groucho running is a technique used by individuals who have
limited shock absorption mechanisms throughout the gait cycle, and thus allow for
knee hyperflexion to decrease the amount of shock absorbed. It was further stated
that “Groucho running can be responsible for as much as a fifty percent increase
in the rate of energy utilization, as measured by steady state oxygen
consumption”.47 As human evolution has progressed, bent postures have been
abandoned due to the inevitable negative effect on locomotion. Grasso et al.
proposed that “in looking for the effects of posture on the locomotor patterns, we
keep in mind that there exist inevitable mechanical consequences of a bent
posture”.7 Biewener supported this statement by explaining that increased
muscular activity results in a decreased efficiency, and therefore, resulting in a
decline in the mechanical advantage during locomotion.48 Limited research has
been conducted on the relationships between knee hyperextension and running
performance.
Figure 3. Knee hyperflexion posture

27
• Lordosis - It is commonly described that lumbar lordosis is “an increased
lumbosacral angle, shortening of the hip flexors and erector spinae, and
lengthening of the abdominals”.27 Lordosis is a common postural deformation
which may cause aches and discomfort in the lumbar region, especially during
running. Janda suggests that low back disorders may be caused by imbalances
between postural and phasic muscles, “where tightness of the hip flexors and
lumbar erector muscles may inhibit gluteal and abdominal muscles to compromise
lumbar spine mechanics, encouraging spinal dysfunction”.23 Janda further
specified that an individual’s running gait may also be affected due to a restriction
in the hip and pelvic region due to symptoms originating from the lower back
region.23 Singer and Dip explained that insufficient abdominal and gluteal strength,
as well as tight iliopsoas and hamstrings muscles are primarily the cause of lordotic
postures.25 Strong relationships have been found between lumbar lordosis and the
severity of exercise related transient abdominal pain (ETAP).49
Figure 4. Lordotic posture

28
• Kyphosis - Rounded back and forward lean is commonly described as kyphosis.
Certain sports demand repetitive movement patterns, which over time, may lead
to altered anterior-posterior arches of the spine.50 Misalignment of a thoracic
segment causing kyphosis will ultimately cause a biomechanical disadvantage of
functional movements.21 Abd-Elkader and EL-Bab extrapolated that certain sport
specific abilities and one’s mechanical power may become compromised due to
restrictions caused by kyphotic curvatures.20 This was further explained by
Watson, who related kyphotic postures to reduced lung function results, which may
have adverse effects on sprint running, and even more so with endurance
running.22 Individuals with a kyphotic posture are found to be prone to regular
ETAP episodes, as well as experiencing them at a greater intensity.49 Abd-Elkader
and EL-Bab identified the relationships between the severity of kyphosis and;
“systolic blood pressure value (r = -0.857), diastolic blood pressure value (r =
0.898), heart rate (r = -0.741), vital capacity (r = 0.784), maximal oxygen uptake
(VO2 max) (r = -0.741), hemoglobin ratio (r = -0.714) and a direct relationship
between kyphosis and lactic acid level after three minutes of exercise”.20
Figure 5. Kyphotic posture

29
• Scoliosis - In a study based on scoliotic postures, one-fifth of the testing sample,
who had scoliosis, also had variations in leg lengths.25 Singer and Dip further
investigated the work of various researchers on the compensatory effect of leg
length variations and concluded that it may be a coping mechanism for low back
pain,51 from local spasm in iliopsoas,52 or as a result of structural scoliosis.53 It is
essential to incorporate full range of motion and complete joint range mobility
exercises to prevent muscle shortening in postural muscles, which may eventually
lead to muscular imbalances and joint dysfunctions.25 The research findings of
Taylor can be related to the findings of Di-Rocco and Vaccaro who described the
effect that idiopathic scoliosis has on running performance. They found that both
lung function and work capacity levels were reduced.53-54 It was hypothesized that
the postural stability of individuals who have scoliosis is greatly reduced, but the
running mechanics and gait patterns remain normal.55
Figure 6. Scoliotic posture

30
• Round Shoulders and Forward head - Forward-head, rounded-shoulder posture
(FHRSP) is a detailed postural irregularity that may results in unwanted pain and/or
other pathological circumstances.56 “FHRSP is defined as excessive anterior
orientation of the head or glenohumeral joint relative to the vertical plumb line of
the body”.57-58 As humans have adapted due to evolutionary transformations,
precise biomechanical features have enabled us to become more mechanically
effective with regards to gait and movement mechanics.7 It was further stated that
“for walking speeds >1 m/s, the plane orientation of bent locomotion indicates a
much lower mechanical efficiency relative to erect locomotion”.7 This statement
places emphasis on how human mechanical movement patterns have evolved into
more efficient upright patterns due to postural changes. Cavagna et al. deduced
that “erect posture is mechanically efficient in humans because the centre of body
mass vaults over the supporting limb like an inverted pendulum”.59 This inhibits the
loss of energy by transferring the kinetic energy into potential energy.59 Grasso et
al. concluded from research testing, that when a participant adopted a bent
posture, the mean electromyography (EMG) reading was increased by all muscles
involved.7 This supports the findings by Cavagna et al. that an erect posture
incorporates less muscle activation compared to a bent posture for a given
movement, thus, is beneficial for endurance activities.59 Various researchers
specified that forward shoulder postures may be caused by “overdeveloped,
shortened, or tight anterior shoulder girdle muscles, such as the serratus anterior,
pectoralis major, pectoralis minor, and upper trapezius muscles”.27,60 Furthermore,
forward shoulder postures may be triggered by weakened or stretched trapezius
muscles, whose primary function is to retract the scapulae to the spine.27,60-61
Insufficient research describes the relationships between shoulder symmetry and
running performance.

31
Figure 7. Round shoulders posture
Figure 8. Forward head postures

32
• Abducted Scapulae – Culham and Peat postulated that “the resting position of the
scapula is altered in subjects with abnormal cervical and thoracic spine sagittal
plane arrangements”.61 There is an inevitable relationship that exists between
sprinting performances and arm swing mechanics, especially when maximal effort
in produced.62 Performance improvements with regards to sprinting may be
accomplished by incorporating effective arm swing motions, which are proven to
be interrelated with lower limb mechanics.63 “When the arm-swing motion is
restricted by constraining scapular motion, it clearly limits the humerothoracic
extension of the backward-swinging arm.64 As a result, the scapular constraint
affects the stance-leg motion and whole-body position during the first step, thereby
reducing the sprint speed”.64 An effective approach to re-establish acceptable
scapular posture and muscular activity surrounding the scapular, includes “bracing
or taping the scapulothoracic articulation”.56 Limited research has provided
information linking scapulae mechanics to aerobic running endurance.
Figure 9. Abducted scapulae posture

33
• Pelvic Tilt – It has been elucidated that tightened iliopsoas, erector spinae, tensor
fascia latae and the rectus femoris ultimately cause postural muscular imbalances,
thus creating an anterior pelvic tilt.27,65 The pelvic region is the connecting point
between the legs and the upper body, and therefore requires stability and muscular
balance to allow certain movement patterns to occur.66 Massive forces are
produced by the leg drive phase when running, and therefore require constant
pelvic stability.67 Anterior pelvic tilt is not only limited to decrements in performance
standards but is also a major source of hamstring injuries.68-69 Contrary to popular
belief, Slocum and James hypothesized that an anterior pelvic tilt accompanied
with lumbar extension may lead to improved lower leg extension capabilities, and
thus increased leg thrust abilities.70 The pelvic region requires physiological
coordination from the lower limbs and spinal region for any running movements,
and therefore, requires precise neuromuscular activation mechanisms.71
Figure 10. Pelvic tilt posture

34
2.2.2 DEFINING AEROBIC RUNNING ENDURANCE
Aerobic endurance exercises form part of many sporting codes and is an effective
technique to maintain a good health status. “Endurance exercise training results in
profound adaptations to the cardiorespiratory and neuromuscular systems that
enhance the delivery of oxygen from the atmosphere to the mitochondria”.72 Core
posture is a major determinant of mechanical efficiency, thus limitations in core
posture may cause running endurance efficiency problems.26 This was further
emphasized by explaining that a stable core, as well as a strong foundation of
muscular balance is vital for middle and long-distance runners to propel them forward
when running.26 Morton and Callister found strong relationships between postural
abnormalities and ETAP.49 ETAP is a common occurrence when high intensity running
in conducted and may lead to a reduction in aerobic endurance performance
standards.
• VO2 max – Howley defined VO2 max as “the maximal aerobic power of an
individual”,73 which was further clarified by Rowell: “VO2 max is the best measure
of the functional limit of the cardiovascular system”.74 Hill and Lupton found that
the rate at which oxygen is consumed during exercise is directly related to the
increases of speed until maximum oxygen consumption levels are met.75 This was
further elaborated by Baechle and Earle: “As the duration of the aerobic endurance
event increases, so does the proportion of total energy demand that must be met
by aerobic metabolism”.76 A strong positive correlation has been shown to exist
between VO2 max and performance in aerobic endurance events.77 Numella et al.
explained that running economy is typically determined by measuring the steady-
state oxygen consumption at the submaximal running speed.78 Ray and Cureton
conducted tests on the difference between standing and supine VO2 man results
in cycling.77 Results were conclusive that standing cycling leads to a significant
increase in VO2 max results compared to supine cycling.77 This may provide
evidence that posture can hinder the oxygen delivery process to working muscles
for a given task due to the structural setup of an individual. Various researchers
concluded that athletes with specific spinal cord abnormalities (kyphosis, lordosis

35
scoliosis), had reduced breathing capabilities, which ultimately affected the VO2
max and physical performances of the participants.20,79-81
• Lactate threshold – Lamb stated that: “the best competitor among athletes with
similar VO2 max values are typically the people who can sustain aerobic energy
production at the highest percentage of their VO2 max without accumulating large
amounts of lactic acid in the muscles and blood”.82 Abd-Elkader and EL-Bab
established direct relationships between kyphosis and lactic acid level after three
minutes of exercise, by explaining that breathing complications caused by kyphotic
postures ultimately diminished the waste removal efficiency, thus resulting in a
build-up of lactate.20
• Running economy - Economical runners consume less oxygen for a given
workload, and thus can sustain the given workload for longer periods of time.78
Saunders et al. reported strong relationships between increased levels of
endurance running performances and an effective running economy.83 Numella et
al. concluded that: “running economy is affected by the net vertical impulse of the
ground reaction force (GRF),84 stride length,59 change in speed during ground
contact phase,85 and vertical stiffness of a leg spring”.84,86 This was further
explained by various researchers who stated that; “a successful endurance runner
is characterized by less vertical oscillations,87 longer stride lengths,59 shorter
ground contact times,88 less changes in speed during the ground contact phase85
and a lower first peak in the vertical component of the ground reaction force”.89
According to Saunders et al. “GRF’s reflect the functional and mechanical
requirements during stance”.83 When an athlete makes physical contact with the
ground, specific muscle groups will be activated for the purpose of initiating forward
movement while maintaining constant stability.83-84 Disproportionate fluctuations in
momentum in various directions; “vertical, anterior-posterior and medial-lateral”
may be identified as uneconomical in terms of the metabolic energy
requirements.84 Heise and Martin hypothesized that “less economical runners
would exhibit greater support requirements during foot contact”.84 Upright posture
has been found to decrease the volume of muscle activation which is essential for
economical running, and furthermore, “places the GRF vector nearer to the hip and

36
knee joints and confines large moments to the ankle, where muscle fibers are
short”.5 When an athlete chooses their own stride length, the gait cycle becomes
more natural and therefore becomes a more economical running technique.90
Running economy can be linked to both running technique and body structure.
Watson related posture to running economy by explaining that postural alignment
issues may cause increased energy consumption, and therefore reduced
mechanical efficiency.34
2.2.3 DEFINING RUNNING SPEED
Since many sports incorporate sprint components, sprint running is an essential pre-
requisite for participation in many sporting codes.91-92 Numella et al. defined running
speed as “the product of stride rate and stride length”.78 Ninety percent of speed
improvements are produced through the increase of stride length, thereafter, the final
ten percent of speed improvements can only be produced by increasing stride rate.93-
94 A fundamental component of running speed is the ground contact phase, where the
sprinter has the ability to initiate a forceful leg drive. Since the foot makes contact with
the ground, a driving force can be applied, and therefore impact the stride length and
running speed. Many researchers have concluded that; as running speed increases,
so does the intensity of GRF on the runner.94-96 “Runners reach faster top speeds by
applying greater support forces to the ground not by more rapid leg movements”.95
Hunter et al. described that the most important factors of sprint running are the
horizontal and vertical factors.97 “Also, of interest are the two subcomponents of the
anterior-posterior horizontal GRF: a braking GRF acts posteriorly and usually occurs
early in the stance phase, while a propulsive GRF acts anteriorly and usually occurs
later in the stance phase”.97 General postural configurations may be an important
determinant in running speed performances. Sprinters should stand upright with a
forward lean to provide the body with the essential position to initiate the pushing leg
drive action which is crucial for improving speed.66,95 It was concluded that, in order to
increase the aerial time and forward propulsion, one must incorporate larger forces
upwards against gravity.95 This could also be accomplished through consistent arm
actions, which promotes between five and ten percent of the entire lift force throughout
the gait cycle.98

37
2.2.4 ASSESSING POSTURE
Watson and Mac Donncha emphasized the fact that posture is inevitably and important
factor of health and performance but is also an extremely difficult aspect to assess.1
Posture is a very complicated aspect to measure because imbalances may be
extremely minuscule, which is difficult to identify with the human eye. Ruivo et al.
stated that: “postural assessments through photography may be a simple method that
allows the acquisition of quantitative values to define the alignment of body
segments”.99 “Static photographic analysis with reflective markers placed on specified
anatomical landmarks may be more suited to large-scale studies”.100 “This is because
it is relatively cheap, requiring only a camera, markers and adhesive tape; is highly
portable; and permits the measurement of several posture angles simultaneously”.100
Weber et al. further emphasized this fact by stating: “photogrammetry is the most
widely used method for noninvasive measurement of postural measures, as it
eliminates the risk of exposure to harmful radiation encountered with the radiographic
method”.101 Photogrammetry is a method of assessment used by many sport and
health related specialists. It allows for the quantification of a postural assessments by
assessing various angles and distances by means of specialized software
programs.101-102 X-Rays may be an accurate method of postural assessments, but is
found to be extremely expensive, time consuming and can only assess a single
postural aspect at a time. It was explained that “recent technology improvements have
paved the way for a development of highly reliable and applicable methods, such as
low-dose x-ray scanning (Lodox Systems Ltd, Johannesburg, South Africa)”.103 “The
Wickens Kiphuth procedure is effective for the assessment of antero-posterior aspect
of posture, but participant preparation is time consuming”.1 In a research study
conducted by Arnheim et al., postural imbalances and assessment methods were
partially explained, but extremely limited explanations were given on the reliability of
the methods used.104 One of the more popular field methods of postural assessments
is the New York posture rating scale. It is a very simple qualitative method that uses
three pictures for each of the thirteen postural areas being assessed.105 These pictures
are extremely vague, and no evidence is provided on their origin and formulation.
Watson and Mac Donncha stated that the New York posture rating scale “has no
specific defining criteria assigned to each posture category”,1 which makes it difficult

38
when assessing miniscule postural imbalances. The Watson and Mac Donncha
technique clearly indicates which postural aspect is being identified for each diagram,
while the New York rating scale includes more than one postural area per diagram.
Furthermore, the New York posture rating scale is only a qualitative assessment
measure. This could increase the chances of interrater reliability, while the Watson
and Mac Donncha technique uses a combination of quantitative and qualitative
measures to ensure the most valid results.
The technique used by Watson and Mac Donncha had a “reproducibility of postural
scores that exceeded 85% for all the aspects assessed”.1 It was further explained that
the techniques used are appropriate for researching the relationships between posture
and various other variables.1 Furthermore, the research methods accurately evaluated
the most prominent posture aspects in an effective an efficient manner.1
2.2.5 COMPLICATIONS OF POOR POSTURE
Kendall et al. stated that: “poor posture is a faulty relationship of the various parts of
the body which produces increase strain on the supporting structures and in which,
there is less efficient balance of the body over its base of support”.27 Increased strain
to surrounding structures may have consequential effects on running performances. It
is important to remember that there may be multiple causes of postural imbalances at
a given time, with many resulting consequences. An individual’s posture is a critical
component of regular balance,106 while research illustrates that postural imbalances
are extremely common in adolescents.107 “Posture of adolescents can be affected by
both internal and external influences, which may make adolescents more susceptible
to injury”.108 A disruption in regular postural development during pubertal stages can
lead to harmful developments later in life.109 According to Tattersall and Walshaw:
“postural deviations alter the body mechanics, causing uneven pressure on joint
surfaces and ligament strain”.110 Running performance standards are strongly linked
to a certain set of structural characteristics and body mechanics which is due to certain
exercises/movements requiring similar biological tissue configuration.111 Tattersall and
Walshaw explained that individuals with poor posture may acquire weaknesses in the

39
antigravity muscles in conjunction with the weakened antagonists of tightened
muscles, which is considered a muscular imbalance.110 According to Weyand and
Davis, there are numerous consequences of having a poor posture and often require
corrective exercises.111 It was further elucidated that imbalances need to be corrected
by strengthening the weakened muscles.110 Initially, a muscular imbalance is found to
be a functional problem, which is further developed into a structural alteration.112
Muscular imbalances initially affect the muscles, cartilage and ligaments, and
eventually affects the bones and joints of an individual.112 “The latter is known as fixed
postural abnormalities which is commonly associated with blocks and pain, which
often requires medical treatment”.112 When the imbalance is still in the functional
abnormality stage, corrective muscular exercises which are specific to the imbalances
of the individual can lead to beneficial results and improvements.113-115
In addition, physical components are only one side of the spectrum. Poor posture
along with low body weight may reinforce poor body image and reduce self-
confidence”.110 Watson further clarified the mental side of postural imbalances by
stating that: “individuals with poor posture look less well and are more likely to have a
poor self-image and self-confidence”.22 Self-confidence has a major role in the mental
state of the individual during sporting preparations and competitions.

40
CHAPTER 3
METHODOLOGY AND DESIGN
3.1. INTRODUCTION 41
3.2. STUDY DESIGN 41
3.3. POPULATION AND SAMPLING 42
3.4. MEASUREMENTS AND PROCEDURES 43
3.5. DATA ANALYSIS 48
3.6. ETHICAL CONSIDERATIONS 49
3.7. FACILITIES AND EQUIPMENT 50
3.8. CONCLUSION 50

41
3.1. INTRODUCTION
Many research studies have been based around the effects of backpacks on
adolescents, as well as the long-term effects of bad posture.19 Limited research has
identified the direct relationships between posture and running performances. The
researcher followed a specified method and study design which scientifically analysed
the correlational and comparisons between the participant groups. The methodology
and design for the research study was based around three main testing procedures,
namely; postural assessments, sprint tests and endurance tests. Stated below are the
materials and methods that were used to gather data. This includes the study design,
population and sampling, measurements and procedures, data analysis, ethical
considerations and facilities and equipment.
3.2. STUDY DESIGN
A cross-sectional, descriptive, correlational study design was followed. The
relationships that existed between postural assessment scores and running
performances, namely: the 10, 20 and 40-meter sprint test as well as the 20-metre
shuttle run test (bleep test) was examined.
• Cross sectional aspect - Involved the examining of data from two participant groups
(high performance running academy and private high school) at a given point in
time.
• Descriptive aspect - The study was descriptive in nature as the relationship
observed between the postural assessments and running performance was
thoroughly described.
• Comparative aspect - The researcher compared the postural scores between the
high-performance running academy and the private high school participants to
identify whether superior running performances may be linked to postural scores.
Furthermore, there was also a comparison conducted between the high-
performance running academy sprint athletes and the high-performance running
academy endurance athletes.

42
3.3. POPULATION AND SAMPLING
Participants were recruited from a private high school and a high-performance running
academy in Pretoria. Participants and parents/guardians were informed of the
requirements of the study and asked to complete an informed consent/assent form
before the testing date. Participants were placed into ten-kilogram weight categories
instead of age groups to negate the effects of pubertal influences on running results.
• The first 60 healthy male students between the ages of 14 and 18 from a specified
private high school that met the inclusion criteria voluntarily participated in the
study.
• 15-20 healthy male sprint athletes between the ages of 14 and 18 from the high-
performance running academy that met the inclusion criteria voluntarily participate
in the study.
• 15-20 healthy male endurance athletes between the ages of 14 and 18 from the
high-performance running academy that met the inclusion criteria voluntarily
participated in the study.
Inclusion criteria
• Healthy male high-school students from a private school in Pretoria.
• Healthy male sprint and endurance athletes from a high-performance running
academy.
• All ethnic and racial groups were open to volunteer.
• Participants couldn’t have any current injuries or illnesses that prevented maximal
effort in performance testing. Confirmation was obtained from relevant
coaching/managerial staff.
Exclusion criteria
• Individuals who had any injuries or illnesses that may have prevented maximal
effort in performance testing.
• Females weren’t allowed to participate in the study.
• Individuals with body fat percentages (BF%) other than the prescribed healthy

43
fitness zone (7.0% – 22.2%), weren’t allowed to participate in the study (Appendix
1).
• Individuals who had muscle soreness or stiffness from various other sporting
activities, that may have prevented maximal effort in performance testing.
• Any individuals who failed to meet the inclusion criteria.
3.4. MEASUREMENTS AND PROCEDURES
Three tests were conducted and included:
• 10, 20 and 40 metre sprint tests using a photoelectric light system was conducted
to assess the sprint speed abilities of participants (Smart Speed Pro, Fusion Sport,
Chicago Illinois). All sprint tests were conducted on outdoor grass fields after
school time. Some testing days varied in ambient temperature.
• A modified technique of Watson and Mac Donncha, which qualitatively and
quantitatively assessed eleven common areas of postural problematic areas was
performed.1 Environmental conditions were maintained by ensuring that all the
postural assessments were conducted indoors after school time.
• The 20-metre shuttle run test using a pre-recorded audio track and a speaker
system was used to assess the aerobic endurance abilities of the participants
(Australian Bleep Test Version). All the 20-metre shuttle run tests were conducted
on outdoor grass fields after school time. Some testing days varied in ambient
temperature
Three separate days were used to conduct the full spectrum of testing procedures for
each participant. Testing day one (sprint speed assessment), testing day two (postural
assessment) and testing day three (aerobic endurance assessment). A minimum of
24 hours was given between each speed and endurance test. Before each speed and
endurance testing session, a standardized warm-up of ten minutes was conducted
that primarily included jogging, running and dynamic stretches. The purpose was to
increase muscle/tendon flexibility, minimizing injury, enhance athletic performance,
and generally preparing the participants for the workload ahead. For increased
reliability, relationships between weight divisions was used as an alternative to age

44
group divisions to rule out the effects of pubertal influences (ten-kilogram weight
divisions). BF% was also used in coherence with the exclusion criteria to rule out
effects of body fat on running performance results, and thus ensuring valid results
(Appendix 1).116 The BF% of all participants was tested prior to research testing by the
sport science staff at the given facilities (private high school and high-performance
running academy). The sum of 7 skinfolds was assessed at both facilities which was
used to calculate BF%.117 Pre-participation explanations for each testing session was
executed to ensure reliable results and a clear understanding of procedures. The
results from the three days of testing were obtained and recorded on the data
collection sheets (Appendix 2-4).
3.4.1 TESTING DAY ONE (SPRINT SPEED ASSESSMENT)
Testing on day one was conducted in one session per age group at the private school,
and in one session for all the high-performance running academy athletes. BF% and
body mass was assessed prior to speed testing. The photoelectric light systems were
used to assess the sprint abilities of the participants. Sprint assessments for 10m, 20m
and 40m was measured. Each distance marker contained one Smart Speed light to
measure the time taken to reach that point. Participants were instructed to sprint
maximally throughout the allocated distances without stopping or slowing down.
Values were recorded in (seconds) for completing allocated distances. The better of
two attempts per participant was recorded for data collection. All participants were
instructed to wear comfortable training shorts, a comfortable training shirt and regular
running shoes. No running spikes or barefoot running was permitted.
Figure 11. The set up for sprint speed assessments

45
3.4.2 TESTING DAY TWO (POSTURAL ASSESSMENT)
Postural assessments were conducted using both qualitative and quantitative
measures. A high-quality high-definition (HD) video camera was placed perpendicular
and centrally 10ft (3,048 metres) from the platform at a height of 120 centimetres.1
The camera was horizontally and vertically levelled using the tripod spirit level.
Software generated plumb lines were used instead of the reference method’s free
hanging plumb lines. Footage recorded was in the form of video recorded data instead
of photographs for the sole purpose that minor movements may have altered the
postural scores. The landmarks were marked before testing with the use of adhesive
dots. This enabled the researcher to accurately measure and/or calculate certain
values for postural scoring. The landmarks were as follows; patellar notch, greater
trochanter, both clavicular heads, both iliac spines, tibial tuberosity, centre of the
patellae, C7/T1, T3, T6, T9, T12, L3, L5, most prominent point of the sacrum and the
centre of the calcaneus.1 Participants were asked to stand completely relaxed, upright,
staring ahead with their chin parallel to the ground (Frankfort plane) and their elbows
and knees fully extended.1 Fingers and thumbs were pointed forward and the
participant’s heels were touching. When instructed, the participant would rotate and
stand 90 degrees clockwise; this was repeated so that the anterior, lateral and
posterior aspect of the participant was recorded.1 All participants were instructed to
remove all items of clothing, except ski-pants that sit tight on the skin. No shoes or
socks were worn during the postural assessment. The participants obtained a postural
rating of five, three or one for each postural area (ankle posture, knee interspace, knee
hyperextension/flexion, lordosis, kyphosis, scoliosis, round shoulders, abducted
scapulae, shoulder symmetry, forward head and pelvic tilt).1 “A score of five
corresponds to good body mechanics that ranges from no deviation to a level just
above that of the previous category. A score of three corresponds to a moderate
deviation and a score of one corresponds to a marked deviation”.1 An overall score of
55 from all 11 postural components corresponds to a perfect posture. The postural
assessment procedure was conducted by the researcher, as well as a qualified
Dartfish technologist. This was done separately for the purpose of attaining an
objective view and thus decreasing the chances of biased results. Conflicting results
were re-assessed until both analysts were in agreeance.

46
• The first procedure involved observing one or two scoring criteria photographs to
designate a participant to a qualitative posture category.1 The 11 separate aspects
which were assessed are as follows: ankle posture (Appendix 5), knee interspace
(Appendix 6), knee hyperextension/flexion (Appendix 7), lordosis (Appendix 8),
kyphosis (Appendix 9), scoliosis (Appendix 10), round shoulders (Appendix 11),
abducted scapulae (Appendix 11), shoulder symmetry (Appendix 12), forward
head (Appendix 13).1
• The second procedure involved the superimposing of scoring criteria photos from
the Watson and Mac Donncha method onto the videos of participants using
Dartfish Pro software (version 8 and 9) (Appendix 5 - 13).1 A 30cm ruler was
presented in all the video footage so that the software calibration was accounted
for and the scaling was precise.
• The third procedure was conducted to either support or reconsider the qualitative
judgement, which involved the use of quantitative methods of assessment.1 The
analysis of video captured footage in a quantitative method was conducted using
Dartfish Pro (version 8 and 9). This allowed for pinpoint analysis of postural
deviances and thus furthers the validity of results. The third procedure was the
deciding deduction if the first and second postural procedures were conflicting.
Figure 12. The set-up for postural assessments

47
3.4.3 TESTING DAY 3 (AEROBIC ENDURANCE ASSESSMENT)
The high-performance running academy group testing was conducted in one session
and took place after school time as part of their interim testing. Testing at the specified
private school was conducted in multiple testing sessions during the physical
education periods due to the large number of participants. The 20m shuttle run test
(bleep test) was conducted in accordance to Leger and Lambert (Figure 13).118 The
participants ran between two lines in the allocated timeframe which was situated 20m
apart. The speed started off slow but increased gradually. If the line was not reached
before the beep sounds, a warning was given. The test was stopped if the participant
didn’t reach within three metres of the line,118 or two consecutive warnings were
obtained. The tests took place on grass fields for all participants. Scores obtained are
in the form of running levels.118 All participants were instructed to wear comfortable
training shorts, a comfortable training shirt and regular running shoes. No running
spikes or barefoot running was permitted.
Figure 13. The 20m shuttle run test

48
3.5. DATA ANALYSIS
An independent statistician from the South African Medical Research Council
(SAMRC) assisted with the statistical analysis. Descriptive statistics were used to
describe the participants and assessment results. The statistical tool that was used
was Strata 14.2 (Strata Worldwide). Significance was set at p < 0.05, and the data is
illustrated in tables and graphs. Data captured from all the participants that complied
with all the criteria of the testing procedures was analysed.
Pearson product-moment correlation coefficient was used to examine the strength of
relationships between different postures and running performances (10m, 20m, 40m
and bleep test). The co-efficient of determination (r) is reported. The closer r is to ± 1
the stronger the monotonic relationship.119
➢ 0.00 - 0.19 ‘very weak’
➢ 0.20 - 0.39 ‘weak’
➢ 0.40 - 0.59 moderate
➢ 0.60 - 0.79 ‘strong’
➢ 0.80 - 1.00 ‘very strong’
Tabstat was used to identify summary statistics (mean and standard deviation) for all
measurements within each participant group and athlete type. Two-sample t test with
unequal variances was used as a measure of comparison between participant groups.
Bonferroni correction tests were used to assess all running performance results (10m,
20m, 40m and bleep test) and postural assessment results between weight categories.
Furthermore, Bartlett's test for equal variances was used to present the outcome
measures (10m, 20m, 40m and total posture) between weight categories. Kruskal-
Wallis equality-of-populations rank test was used to assess the correlation level
changes at each individual group, sub-group level and weight category.

49
3.6. ETHICAL CONSIDERATIONS
Faculty of Health Sciences MSc Committee and Research Ethics Committee
clearance was obtained before the commencement of the research study. Protocol
number 141/2017 (Appendix 14). Informed consent/assent from the participants’
parents and/or guardians were collected before testing (Appendix 15-16). A thorough
verbal explanation of all assessments as well as a full briefing session was given to all
the participants, and all questions were answered by the researcher.
Risks associated with participation in the study was explained to the participants and
included, but was not limited to, muscle pain, muscle stiffness, fatigue, and in rare
instances dizziness. The risks associated with the study were based primarily on the
sprint and endurance tests which required maximal efforts, and thus increased
susceptibility of injuries. Participation in the study remained voluntarily; this was made
clear in the explanation and consent/assent forms. The participants could stop the
tests at any time if necessary.
Risks were reduced by the implementation of an in-depth explanation of all testing
procedures and the participants were required to perform a warm-up. Anonymity was
maintained throughout the full testing procedure using a numbering system. The
names of the participants will not be published or presented. Confidentiality will also
be ensured, and the raw data will be stored for up to 15 years (Appendix 17). The
video recorded footage was only seem by the primary researcher and the supporting
video analyst. Recorded footage will be stored in a secure place and will not be visually
published in any way.

50
3.7. FACILITIES AND EQUIPMENT
Research testing was conducted at two different facilities;
• The high-performance running academy facility allowed for testing to take place on
a selected sports field in conjunction with the biomechanics video analysis room.
Testing took place after school time as part of the interim year testing. Prior
permission to use these facilities was obtained via a written letter (Appendix 18).
• The private high school allowed for testing to take place on a designated sports
field in conjunction with a video analysis room. Testing took place during the
physical education periods during the school day. Prior permission to use these
facilities was obtained via a written letter (Appendix 19).
Research equipment that needed permission and clearance (Appendix 20-21);
• Smart Speed (Smart Speed Pro, Fusion Sport)
• Bleep test soundtrack (Australian Bleep Test Version)
• Dartfish (Dartfish connect plus, version 8 and 9)
3.8. CONCLUSION
Chapter three explained all the methodologies used to collect the relevant data, and
the study design that was followed by the researcher to attain valid and reliable results.

51
CHAPTER 4
RESULTS AND DISCUSSION
4.1. INTRODUCTION 52
4.2. RESULTS 52
4.3. DISCUSSION 66
4.4. CONCLUSION 76

52
4.1. INTRODUCTION
Parameters that were taken into account for statistical purposes, are fully discussed
in this chapter. Data was analysed using a variety of statistical tests as previously
mentioned in the data analysis section. Results are illustrated in graphs and tables
and then further explained in the discussion section.
4.2. RESULTS
4.2.1. PARTICIPANT INFORMATION DESCRIPTIVE STATISTICS
As shown in Figure 14, the research study included two main groups (age = 15.51 ±
1.63 years), namely: a private high school (n = 60) and high-performance running
academy athletes (n = 30). The high-performance running academy group was divided
into HPC sprint (n = 15) and HPC endurance (n = 15) athlete types.
Figure 14. Participant numbers included in the research study (n = 90)
0
5
10
15
20
25
30
35
40
45
50
55
60
Private high school HPC sprint HPC endurance
Par
tici
pan
t N
um
ber
s
Participant Groups

53
Table 1 – Demographic data for the three participant groups
Table 1 illustrates that the grade, age, mass and number of sports (mean ± SD) of the
three participant groups was (10.07 ± 0.21, 15.92 ± 0.59, 63.10 ± 3.86, 1.57 ± 0.80,
respectively) (p < 0.05).
Group Grade Age (years) Mass (kg) Number of
sports
HPC Sprint
(Mean ± SD)
10.33 ± 1.30
16.47 ± 1.32 67.30 ± 5.90 1.00 ± 0.00
HPC Endurance
(Mean ± SD)
10.07 ± 1.24
16.20 ± 1.11 58.00 ± 6.63 1.00 ± 0.00
Private high school
(Mean ± SD)
9.82 ± 1.60
15.10 ± 1.69 64.10 ± 13.42 2.70 ± 0.49
Total
(Mean ± SD) 10.07 ± 0.21 15.92 ± 0.59 63.10 ± 3.86 1.57 ± 0.80

54
4.2.2. DIFFERENCES BETWEEN PARTICIPANT GROUPS DESCRIPTIVE
STATISTICS
Table 2 - Summary statistics for the measurements by participant group
Table 2 and Figure 15 illustrate that the 10m, 20m and 40m sprint test results (mean
± SD) were superior for the high-performance running academy group (1.81s ± 0.12,
3.02s ± 0.23, 5.39s ± 0.31, respectively) in comparison to the private high school group
(2.07s ± 0.27, 3.50s ± 0.34, 6.35s ± 0.62, respectively) (p < 0.05).
Figure 16 shows that the bleep test results (mean ± SD) was also superior for the high-
performance running academy group (10.59 ± 1.88) in comparison to the private high
school group (8.26 ± 1.94) (p < 0.05).
The total posture scores (mean ± SD) of the high-performance running academy group
(48.20 ± 4.09) was higher than the private high school group (44.83 ± 4.42) (p < 0.05).
Group 10m (s) 20m (s) 40m (s) Bleep Total
Posture
HPC (Mean ± SD) 1.81 ± 0.12 3.02 ± 0.23 5.39 ± 0.31 10.59 ± 1.88 48.20 ± 4.09
Private high school
(Mean ± SD) 2.07 ± 0.27 3.50 ± 0.34 6.35 ± 0.62 8.26 ± 1.94 44.83 ± 4.42
Total (Mean ± SD) 1.98 ± 0.26 3.34 ± 0.38 6.03 ± 0.70 9.04 ± 2.21 45.96 ± 4.58

55
Figure 15. Bar chart of 10m, 20m, 40m sprint results by participant group (n = 90)
(p < 0.05).
Figure 16. Bar chart of the bleep test levels by participant group (n = 90) (p < 0.05).
0
1
2
3
4
5
6
7
HPC Private high school
Spri
nt
(sec
on
ds)
Participant Group
Mean 10m Mean 20m Mean 40m
0123456789
101112
HPC Private high school
Ble
ep (
leve
ls)
Participant Group

56
4.2.3. DIFFERENCES BETWEEN ATHLETE TYPE DESCRIPTIVE STATISTICS
Table 3 - Summary statistics for the measurements by athlete type
Table 3 and Figure 17 illustrate that the 10m, 20m and 40m sprint results (mean ± SD)
were superior for the HPC sprint group (1.73s ± 0.09; 2.88s ± 0.22; 5.18s ± 0.20) in
comparison to the HPC endurance group (1.88s ± 0.11; 3.16s ± 0.15; 5.60s ± 0.25)
and private high school group (2.07s ± 0.27; 3.50s ± 0.34; 6.35s ± 0.62) (p < 0.05).
Figure 18 shows that the bleep test results (mean ± SD) were superior for the HPC
endurance group (11.90 ± 1.53) in comparison to the HPC sprint group (9.29 ± 1.17)
and private high school group (8.26 ± 1.94) (p < 0.05).
The total posture results (mean ± SD) were superior for the HPC sprint group (49.13
± 3.96) in comparison to the HPC endurance group (47.27 ± 4.13) and private high
school group (44.83 ± 4.42) (p < 0.05).
Group 10m (s) 20m (s) 40m (s) Bleep Total
Posture
HPC Endurance
(Mean ± SD) 1.88 ± 0.11 3.16 ± 0.15 5.60 ± 0.25 11.90 ± 1.53 47.27 ± 4.13
HPC Sprint
(Mean ± SD) 1.73 ± 0.09 2.88 ± 0.22 5.18 ± 0.20 9.29 ± 1.17 49.13 ± 3.96
Private high school
(Mean ± SD) 2.07 ± 0.27 3.50 ± 0.34 6.35 ± 0.62 8.26 ± 1.94 44.83 ± 4.42
Total
(Mean ± SD) 1.98 ± 0.26 3.34 ± 0.38 6.03 ± 0.70 9.04 ± 2.21 45.96 ± 4.58

57
Figure 17. Bar chart of 10m, 20m, 40m sprint results by athlete type (n = 90) (p < 0.05)
Figure 18. Bar chart of bleep test levels by athlete type (n = 90) (p < 0.05).
0
1
2
3
4
5
6
7
HPC Endurance HPC Sprint Private high school
Spri
nt
(sec
on
ds)
Athlete Type
10m 20m 40m
0
1
2
3
4
5
6
7
8
9
10
11
12
13
HPC Endurance HPC Sprint Private high school
Ble
ep(l
evel
s)
Athlete Type

58
4.2.4. DIFFERENCE IN WEIGHT CATEGORIES DESCRIPTIVE STATISTICS
Table 4 - Summary statistics for the measurements by weight category
Table 4 and Figure 19 illustrate that the 70-80-kilogram (kg) weight category was
superior in the 10m (1.85s ± 0.13), 20m (3.13s ± 0.21) and 40m (5.60s ± 0.41) sprint
test results (mean ± SD) in relation to the other weight categories (p < 0.05).
Furthermore, figure 20 shows that the 50-60-kilogram (kg) weight category was
superior in the bleep test results (mean ± SD) (9.50 ± 2.56) in comparison to the 40-
50kg (8.10 ± 1.47), 60-70kg (9.40 ± 2.01), 70-80kg (9.30 ± 1.77) and 80+kg (6.80 ±
2.17) weight categories (p < 0.05).
The total posture results (mean ± SD) were superior for the 70-80kg weight category
(47.47 ± 3.20) in comparison to the 40-50kg (41.00 ± 3.52), 50-60kg (46.89 ± 5.71),
60-70kg (46.77 ± 3.84) and 80+kg (44.14 ± 3.63) weight categories (p < 0.05).
Weight category (kg) 10m (s) 20m (s) 40m (s) Bleep test Total posture
40-50 (Mean ± SD) 2.14 ± 0.23 3.66 ± 0.32 6.69 ± 0.64 8.10 ± 1.47 41.00 ± 3.52
50-60 (Mean ± SD) 2.02 ± 0.26 3.40 ± 0.40 6.05 ± 0.69 9.50 ± 2.56 46.89 ± 5.71
60-70 (Mean ± SD) 1.92 ± 0.91 3.26 ± 0.39 5.89 ± 0.67 9.40 ± 2.01 46.77 ± 3.84
70-80 (Mean ± SD) 1.85 ± 0.13 3.13 ± 0.21 5.60 ± 0.41 9.30 ± 1.77 47.47 ± 3.20
80+ (Mean ± SD) 2.22 ± 0.49 3.56 ± 0.34 6.57 ± 0.61 6.80 ± 2.17 44.14 ± 3.63

59
Figure 19. Bar chart of 10m, 20m, 40m sprint results by weight category (n = 90)
(p < 0.05).
Figure 20. Bar chart of bleep test levels by weight category (n = 90) (p < 0.05).
0
1
2
3
4
5
6
7
8
40-50 50-60 60-70 70-80 80+
Spri
nt
(sec
on
ds)
Weight Categories (kg)
Mean 10m Mean 20m Mean 40m
0
1
2
3
4
5
6
7
8
9
10
40-50 50-60 60-70 70-80 80+
Ble
ep (
leve
ls)
Weight Categories (kg)

60
4.2.5. CORRELATIONS BETWEEN POSTURE AND PERFORMANCE MEASURES
Table 5 - The correlation between the 10M, 20M, 40M, bleep test and total posture
result within the HPC group
10m 20m 40m Bleep Total Posture
10m 1.0000
20m 0.8595* 1.0000
40m 0.8635* 0.7193* 1.0000
Bleep Test 0.4419 0.3569 0.5265* 1.0000
Total Posture -0.2345 -0.2973 -0.2699 0.2080 1.0000
* Statistically significant (p < 0.05).
Table 5 illustrates very strong positive correlations between the 10m sprint test results
with the 20m and 40m sprint test results (r = 0.86, r = 0.86 respectively) (p < 0.05).
Furthermore, there was a strong positive correlation between the 20m sprint test
results and the 40m sprint test results (r = 0.72) (p < 0.05). A moderate positive
correlation was observed between the bleep test results and 40m sprint test results (r
= 0.53) (p < 0.05). A weak negative correlation was observed between total posture
results and 10m, 20m and 40m sprint test results (r = -0.23, r = -0.30, r = -0.27
respectively) (p < 0.05). Furthermore, a weak positive correlation was observed
between total posture results and bleep test results (r = 0.21) (p < 0.05).

61
Table 6: The correlation between the 10M, 20M, 40M, bleep test and total posture
result within the private high school group
10m 20m 40m Bleep Total Posture
10m 1.0000
20m 0.8522* 1.0000
40m 0.8056* 0.9585* 1.0000
Bleep Test -0.4691* -0.5684* -0.6000* 1.0000
Total Posture -0.2447 -0.3717* -0.4920* 0.3698* 1.0000
* Statistically significant (p < 0.05).
Table 6 illustrates very strong positive correlations between the 10m sprint test results
with the 20m and 40m sprint test results (r = 0.85, r = 0.81, respectively) (p < 0.05).
Furthermore, there was a very strong positive correlation between the 20m sprint test
results and the 40m sprint test results (r = 0.96) (p < 0.05). Moderate negative
correlations were observed between the bleep test and 10m and 20m sprint test
results (r = -0.47, r = -0.57, respectively) (p < 0.05). A strong negative correlation was
observed between the bleep test results and 40m sprint test results (r = -0.60) (p <
0.05). A weak negative correlation was observed between total posture results and
20m sprint test results (r = -0.37) (p < 0.05). A moderate negative correlation was
observed between total posture results and the 40m sprint test results (r = -0.49) (p <
0.05). Furthermore, a weak positive correlation was observed between total posture
results and bleep test results (r = 0.37) (p < 0.05).

62
Table 7 - The correlations between the 10m, 20m, 40m, bleep test and total
posture result within both participant groups combined
10m 20m 40m Bleep Total Posture
10m 1.0000
20m 0.8812* 1.0000
40m 0.8524* 0.9489* 1.0000
Bleep Test -0.4644* -0.5352* -0.5688* 1.0000
Total Posture -0.3599* -0.4725* -0.5387* 0.4343* 1.0000
* Statistically significant (p < 0.05).
Table 7 illustrates very strong positive correlations between the 10m sprint test results
with the 20m and 40m sprint test results (r = 0.88, r = 0.85, respectively) (p < 0.05).
Furthermore, there was a very strong positive correlation between the 20m sprint test
results and the 40m sprint test results (r = 0.95) (p < 0.05). Moderate negative
correlations were observed between the bleep test results and all 10m, 20m and 40m
sprint test results (r = -0.46, r = -0.54, r = -0.57, respectively) (p < 0.05). A weak
negative correlation was observed between the total posture results and the 10m
sprint test results (r = -0.36) (p < 0.05). Moderate negative correlations were observed
between the total posture results and the 20m and 40m sprint test results (r = -0.47, -
0.54, respectively) (p < 0.05). Furthermore, a moderate positive correlation was
observed between total posture results and bleep test results (r = 0.43) (p < 0.05).

63
4.2.6. DIFFERENCES IN POSTURAL ASPECTS
Table 8 - Postural differences between participant groups (HPC and private high
school)
* Statistically significant (p < 0.05).
According to Table 8, the Kruskal-Wallis H test showed that there was a significant
difference in postural scores for knee interspace (χ2(2) = 10.57), round shoulders
(χ2(2) = 5.23) and pelvic tilt (χ2(2) = 3.76) between the HPC and private high school
groups (p < 0.05). Differences in various postural aspects may provide evidence that
factors such as specificity of training, frequency of training, specialised strength and
conditioning and restriction of sedentary behaviour may contribute to the postural
differences between the groups.
Postural aspect Chi-squared with ties χ2(2) Probability (p)
Knee interspace 10.572 with 1 d.f. 0.0011*
Shoulder symmetry 2.679 with 1 d.f. 0.1017
Knee hyperextension/flexion 3.300 with 1 d.f. 0.0693
Lordosis 0.599 with 1 d.f. 0.4388
Kyphosis 1.584 with 1 d.f. 0.2081
Round shoulders 5.234 with 1 d.f. 0.0222*
Abducted scapulae 0.530 with 1 d.f. 0.4666
Forward head 0.679 with 1 d.f. 0.4100
Pelvic tilt 3.762 with 1 d.f. 0.0524*
Ankle posture 3.538 with 1 d.f. 0.0600
Scoliosis 2.276 with 1 d.f. 0.1314

64
4.2.7. DIFFERENCES BETWEEN ATHLETE TYPE
Table 9 - Postural differences between athlete types (HPC speed, HPC
endurance and private high school)
* Statistically significant (p < 0.05).
According to Table 9, the Kruskal-Wallis H test showed that there was a significant
difference in postural scores for knee interspace and round shoulders between the
HPC sprint, HPC endurance and private high school groups (χ2(2) = 11.15, χ2(2) =
5.97, respectively) (p < 0.05).
Postural aspect Chi-squared with ties χ2(2) Probability (p)
Knee interspace 11.147 with 2 d.f. 0.0038*
Shoulder symmetry 3.395 with 2 d.f. 0.1831
Knee hyperextension/flexion 3.600 with 2 d.f. 0.1653
Lordosis 0.600 with 2 d.f. 0.7408
Kyphosis 3.120 with 2 d.f. 0.2101
Round shoulders 5.972 with 2 d.f. 0.0505*
Abducted scapulae 2.018 with 2 d.f. 0.3646
Forward head 2.225 with 2 d.f. 0.3288
Pelvic tilt 4.324 with 2 d.f. 0.1151
Ankle posture 3.897 with 2 d.f. 0.1425
Scoliosis 3.793 with 2 d.f. 0.1501

65
4.2.8. DIFFERENCES BETWEEN WEIGHT CATEGORY
Table 10 - Postural differences according to weight categories
* Statistically significant (p < 0.05).
According to Table 10, the Kruskal-Wallis H test showed that there was a significant
difference in postural scores for abducted scapulae between the various weight
categories (χ2(2) = 15.07) (p < 0.05).
Postural aspect Chi-squared with ties χ2(2) Probability (p)
Knee interspace 9.241 with 4 d.f. 0.0553
Shoulder symmetry 3.808 with 4 d.f. 0.4326
Knee hyperextension/flexion 7.483 with 4 d.f. 0.1125
Lordosis 2.927 with 4 d.f. 0.5701
Kyphosis 2.879 with 4 d.f. 0.5782
Round shoulders 8.099 with 4 d.f. 0.0880
Abducted scapulae 15.069 with 4 d.f. 0.0046*
Forward head 7.676 with 4 d.f. 0.1042
Pelvic tilt 2.745 with 4 d.f. 0.6013
Ankle posture 5.998 with 4 d.f. 0.1993
Scoliosis 9.025 with 4 d.f. 0.0605

66
4.3. DISCUSSION
THE RELATIONSHIP BETWEEN POSTURE AND RUNNING PERFORMANCE
The 10m, 20m, 40m sprint test results were superior for the HPC group (1.81s ± 0.12,
3.02s ± 0.23, 5.39s ± 0.31, respectively) in comparison to the private high school group
(2.07s ± 0.27, 3.50s ± 0.34, 6.35s ± 0.62, respectively) (p < 0.05). The bleep test
results (mean ± SD) were also superior for the HPC group (10.59 ± 1.88) in
comparison to the private high school group (8.26 ± 1.94) (p < 0.05). The private high
school participants are encouraged to participate in at least three different sports at
school, and therefore, incorporate cross training into their training schedules.
According to the results from Foster et al., a participant group that incorporated cross
training had significantly less improvements in running performance than the direct
training participant group.120 This can be related to the findings of this study, that the
HPC participant’s primary training focus is on direct training, which can be related to
the superior running speed and endurance results in comparison to the private high
school participants, who are involved in a variety of sports and activities
simultaneously. It was stated that: “sport-specific training is defined as exercise
regimes that involve technical and/or tactical tasks similar to those of the athletes’
chosen sport”.121 Several researchers identified prominent increases in the highest
point of oxygen consumption (VO2 peak), resulting from sport-specific training
programs in elite junior athletes.122-124 It is also important to understand that the HPC
participants must have significant sporting talents to be part of the HPC school. This
ensures that they are proficient in a specific sport, such as sprint running or endurance
running.
The 10m, 20m and 40m sprint results (mean ± SD) were superior for the HPC sprint
group (1.73s ± 0.09; 2.88s ± 0.22; 5.18s ± 0.20) in comparison to the HPC endurance
group (1.88s ± 0.11; 3.16s ± 0.15; 5.60s ± 0.25) and private high school group (2.07s
± 0.27; 3.50s ± 0.34; 6.35s ± 0.62) (p < 0.05). These results were to be expected due
to the HPC sprint group already participating at a national and/or international level of
performance, with sprinting being their chosen sporting focus. Furthermore, specific

67
training procedures and methods were put in place for the HPC sprint group to try
increase sprint performances. This can be related to the results of Kotzamanidis et al.
who provided evidence that a resistance training program in conjunction with a
running-velocity training program can promote improvements in strength and running
speed.125 Various researchers provided evidence that running velocity can be
improved by several training interventions, “such as sprint training without external
resistance, towing, overspeed”,126 and “specific plyometric (speed bound)
exercises”.127
The bleep test results (mean ± SD) were superior for the HPC endurance group (11.90
± 1.53) in comparison to the HPC sprint group (9.29 ± 1.17) and private high school
group (8.26 ± 1.94) (p < 0.05). These results were to be expected due to the HPC
endurance athletes already participating at a national and/or international level of
performance. The intensity, duration and frequency of training sessions are far higher
for the HPC endurance athletes in comparison to the private high school. Furthermore,
the HPC endurance athletes are used to training sessions involving bleep tests or
similar exercises directed at improving the aerobic endurance of the athletes. Tomlin
and Wenger explained that superior aerobic fitness levels provides the ability for
improved recovery, which contributes to suspending the onset of fatigue, which
ultimately, gives the athlete the ability to participate in sustained high-intensity
exercise.128 Baquet et al. found that “aerobic physical training of 3-4 sessions per week
for 8-12 weeks has been shown to increase VO2 peak over and above the normal
increase attributable to age and maturation by around eight to ten percent”.129 This
was further clarified that the rise in VO2 max was primarily caused by an increase in
maximal stroke volume, as a result of aerobic training programs.130
For sprint performance correlations, a negative correlation between sprint test results
and total posture results meant that an improved sprinting performance was
associated with better posture results. For endurance performance correlations, a
positive correlation between bleep test results and total posture results meant that an
improved endurance performance was associated with better posture results. When
both participant groups were combined, the researcher identified very strong positive
correlations between the 10m sprint test results with the 20m and 40m sprint test

68
results (r = 0.88, r = 0.85, respectively) (p < 0.05). Furthermore, there was a very
strong positive correlation between the 20m sprint test results and the 40m sprint test
results (r = 0.95) (p < 0.05). These results were expected. Moderate negative
correlations were observed between the bleep test results and all 10m, 20m and 40m
sprint test results (r = -0.46, r = -0.54, r = -0.57, respectively) (p < 0.05). In agreeance
with the results of this research study, it was previously found that sprint speed results
may be related to bleep test results and therefore, endurance running
performances.131 A weak negative correlation was observed between the total posture
results and the 10m sprint test results (r = -0.36) (p < 0.05). Furthermore, moderate
negative correlations were observed between the total posture results and the 20m
and 40m sprint test results (r = -0.47, -0.54, respectively) (p < 0.05). Sayers and Young
et al. explained that good sprint running performances are built on a solid muscular
balance structure.66-67 According to Sayers and Young et al., an upright posture is an
important component for sprinters. It was further explained that while sprinting, a
forward lean provides the body with the essential position to initiate the pushing leg
drive action which is crucial for improving speed.66-67 Singer and Dip explained that
the overall mechanics of running is affected as a result of muscular imbalances and
compromised joint mechanics.25 Phasic muscles are responsible for the forward
movement of the runner, while the postural muscles to maintain muscular balance and
control.26 These findings may provide evidence that standing posture may be related
to sprint performances, due to the use of both postural muscles and phasic muscles
while running. A moderate positive correlation was observed between total posture
results and bleep test results (r = 0.43) (p < 0.05). This finding can be supported by
various researchers; A strong foundation of muscular balance including a stable core
is vital for middle and long-distance runners.26 According to the research of Morton
and Callister, strong relationships existed between postural abnormalities and ETAP,
which may lead to a reduction in aerobic endurance performance standards.49 Watson
explained that there is an inevitable relationship between posture and running
economy, and further elucidated that postural alignment issues may cause a reduction
in mechanical efficiency, thus decreasing performance levels in aerobic running.34
Upright posture has been recognized to improve the economy of running by
decreasing the amount of muscle activation which is essential for middle and long-
distance running.5 As previously mentioned, Fredericson and Moore clarified the

69
benefits of attaining a positive muscular balance for a good posture, by stating that
“when the system works efficiently, the result is appropriate distribution of forces;
optimal control and efficiency of movement; adequate absorption of ground-impact
forces; and an absence of excessive compressive, translation, or shearing forces on
the joints of the kinetic chain”.26 According to a research conducted by the American
Medical Athletic Association (AMAA), numerous athletes ignore the “anatomical
anatomy and kinesiology of running, and with it, the physiology and biomechanics of
exercise”.132 It was further explained that “posture can play a crucial role in improving
athletic performance, as well as in alleviating aches and pains and avoiding injury”.132
The HPC group had very strong positive correlations between the 10m sprint test
results with the 20m and 40m sprint test results (r = 0.86, r = 0.86 respectively) (p <
0.05). Furthermore, there was a strong positive correlation between the 20m sprint
test results and the 40m sprint test results (r = 0.72) (p < 0.05). These results were
expected. A moderate positive correlation was observed between the bleep test
results and 40m sprint test results (r = 0.53) (p < 0.05). This correlation indicates that
superior bleep test score may result in slower sprint times. This may be caused by the
specificity of training conducted by the HPC athletes, which is based around the
athletic event of each athlete.
Similar results were noted in the private high school participants. The private high
school group had very strong positive correlations between the 10m sprint test results
with the 20m and 40m sprint test results (r = 0.85, r = 0.81, respectively) (p < 0.05).
Furthermore, there was a very strong positive correlation between the 20m sprint test
results and the 40m sprint test results (r = 0.96) (p < 0.05). These results were
expected. Moderate negative correlations were observed between the bleep test and
10m and 20m sprint test results (r = -0.47, r = -0.57, respectively) (p < 0.05). Contrary
to the HPC group, a strong negative correlation was observed between the bleep test
results and 40m sprint test results for the private high school group (r = -0.60) (p <
0.05). This can be related to the research of Pyne et al. who assessed the correlation
between repeated sprint ability and sprint speed.131 Results were conclusive that
repeated sprint ability using a 6x30-m distance was closely related to sprint speed.131
A weak negative correlation was observed between total posture results and 20m

70
sprint test results (r = -0.37) (p < 0.05). Furthermore, a moderate negative correlation
was observed between total posture results and the 40m sprint test results (r = -0.49)
(p < 0.05). These findings can be supported by the finding of Sayers and Young et al.
who said that posture is a vital component of sprint running performances, due to an
upright stance combined with a forward lean to promote a powerful leg drive action.66-
67 A weak positive correlation was observed between total posture results and bleep
test results (r = 0.37) (p < 0.05).
POSTURAL DIFFERENCES BETWEEN COMPETITIVE AND NON-COMPETITIVE
ATHLETES
The total posture scores (mean ± SD) of the HPC group (48.20 ± 4.09) was higher
than the private high school group (44.83 ± 4.42) (p < 0.05). It was highlighted that
“children with excellent posture spent significantly more time per week doing organized
sport than children with poor posture”.112 This can be related to the training regimes in
the participant groups; the HPC athletes had significantly higher training frequencies
and durations in comparison to the private high school group. Furthermore, the
potential for problematic sedentary lifestyle patterns are far more restricted for the
HPC group due to strict daily routines and less free time due to intense training
schedules. This can be related to the research of Janda who clarified that specific
sedentary lifestyle patterns are often the cause of postural imbalances over time.23
The total posture results (mean ± SD) were superior for the HPC sprint group (49.13
± 3.96) in comparison to the HPC endurance group (47.27 ± 4.13) and private high
school group (44.83 ± 4.42) (p < 0.05). As previously mentioned, better postures are
common in children who conduct regular weekly physical activities.23 This can be the
reason why the posture results of the HPC sprint and HPC endurance athlete types
were superior in relation to the private high school posture results. Horak identified
morphology as one of the biomechanical factors affecting standing posture.133 The
finding indicates that somatotype has an impact on various components of physical
performance.134 Specifically, mesomorphy may have a significant positive influence
on sprint running gains, and the ectomorphic component may be positively associated

71
with aerobic capacity gains.134 The results from Kratěnová et al. quantified that body
masses may be directly related to postural scores, with higher body masses resulting
in higher postural scores.112 Although this study did not have sufficient evidence of
scoliotic postures, Kratěnová et al. discovered that “there was a lower occurrence of
X-ray confirmed scoliosis in children with higher body weight”.112 Furthermore, “a
higher fat tissue layer can hide existing skeletal problems and may also contribute to
the stability of the spine”.112 This may explain why the HPC sprint group with higher
body masses had superior postural scores in comparison to the HPC endurance
group.
There was a significant difference in postural scores for knee interspace between the
HPC and private high school groups (χ2(2) = 10.57) (p < 0.05). The knee interspace
results were superior for the HPC group in comparison to the private high school
group. This may have been achieved by effective strength and conditioning programs
conducted by the HPC group on a regular basis. Goldfuss et al. concluded that
physically strong hamstring and quadricep muscles greatly decreased the chances of
obtaining genu varum or genu valgus.46 The strength and conditioning programs may
target the aspects explained by Goldfuss et al., which may have decreased the
chances of knee varum or valgus imbalances in the HPC participants. Muscles
surrounding the knee structure play significant roles in ensuring knee stability and
movement.135 Substantial knee valgus and knee varus muscle strength is essential for
executing various functional tasks like running, while maintaining stability in the knee
joint.135 These conclusions may provide evidence that good knee postures are needed
for superior running performances. Furthermore, there was a significant difference in
postural scores for knee interspace between the HPC sprint, HPC endurance and
private high school (χ2(2) = 11.15) (p < 0.05). The knee interspace results were inferior
for the private high school group in comparison to the HPC endurance athletes. This
can be further supported by Clement who explained that a mechanical compensation
is often caused by genu varum or genu valgus, and therefore results in a decreased
mechanical efficiency of movement.44 A mechanical efficiency will severely inhibit the
performances of the HPC endurance athletes due to the requirements of middle and
long-distance running. Furthermore, the knee interspace results were inferior for the
private high school group in comparison to the HPC sprint athletes. This may have

72
been achieved by effective strength and conditioning programs conducted by the HPC
sprint athletes on a regular basis. The strength and conditioning programs may have
specific approaches to prevent knee varum or valgus imbalances. An example of this
can be explained by Goldfuss et al. who concluded that “a structurally strong agonist-
antagonist muscle combination of the hamstring and quadricep muscles, stabilized the
knee and greatly reduced the chances of generating genu varum or genu valgus”.46
These results may provide evidence that knee interspace may affect running speed
and endurance performances.
There was a significant difference in postural scores for round shoulders between the
HPC and private high school groups (χ2(2) = 5.23) (p < 0.05). There is limited research
based around shoulder posture alignment among adolescents.99 In the research study
conducted by Chansirinukor et al., an increase in mean shoulder posture angles
(rounder shoulders) was related to backpack use.108 This was further supported by
various researchers; “many researchers have linked muscular imbalances in the
shoulder to inefficient backpack use,136 insufficient ergonomics in the seating
arrangement at in schools,137 psychosocial factors such as depression or stress,138
and the practice of spending many hours seated with incorrect posture in school and
in front of computers and televisions”.139 The HPC group had superior shoulder
posture results in comparison to the private high school group. Although both
participant groups were at school for a similar duration every day, the duration of class
time and sedentary “free time” is more prominent for the private high school group in
comparison to the HPC group. This can be related to the research findings of Janda,
who explained that the time spent doing sedentary tasks are often the cause of
postural imbalances over time.23 The HPC group had regular daily training sessions
and less sedentary time which may decrease the chances of muscular imbalances
and may contribute to superior shoulder postures. Furthermore, there was a significant
difference in postural scores for round shoulders between the HPC sprint, HPC
endurance and private high school (χ2(2) = 5.97) (p < 0.05). Although rounded
shoulder postures were found in all three athlete types, the private high school
participates had far more incidences of this imbalance. In a study conducted by Ruivo
et al. “58% of the adolescent participants displayed some degree of postural
abnormality in the shoulder region”.99 Cavagna et al. emphasized that an erect posture
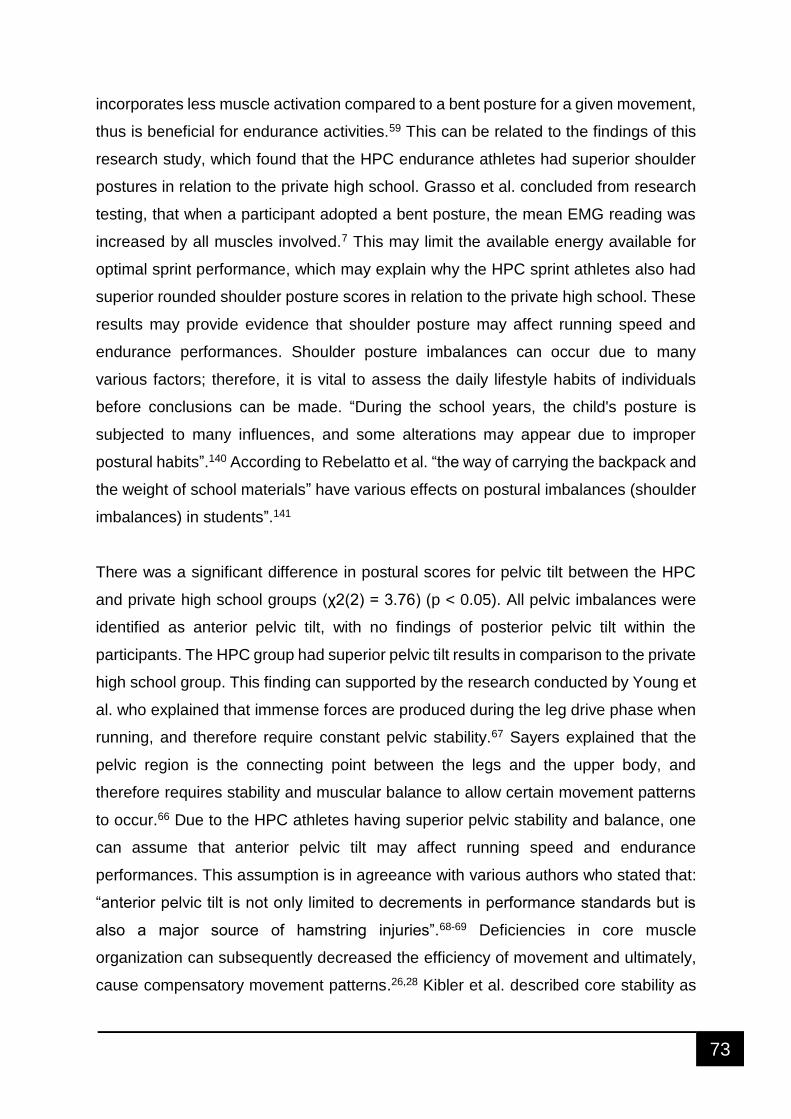
73
incorporates less muscle activation compared to a bent posture for a given movement,
thus is beneficial for endurance activities.59 This can be related to the findings of this
research study, which found that the HPC endurance athletes had superior shoulder
postures in relation to the private high school. Grasso et al. concluded from research
testing, that when a participant adopted a bent posture, the mean EMG reading was
increased by all muscles involved.7 This may limit the available energy available for
optimal sprint performance, which may explain why the HPC sprint athletes also had
superior rounded shoulder posture scores in relation to the private high school. These
results may provide evidence that shoulder posture may affect running speed and
endurance performances. Shoulder posture imbalances can occur due to many
various factors; therefore, it is vital to assess the daily lifestyle habits of individuals
before conclusions can be made. “During the school years, the child's posture is
subjected to many influences, and some alterations may appear due to improper
postural habits”.140 According to Rebelatto et al. “the way of carrying the backpack and
the weight of school materials” have various effects on postural imbalances (shoulder
imbalances) in students”.141
There was a significant difference in postural scores for pelvic tilt between the HPC
and private high school groups (χ2(2) = 3.76) (p < 0.05). All pelvic imbalances were
identified as anterior pelvic tilt, with no findings of posterior pelvic tilt within the
participants. The HPC group had superior pelvic tilt results in comparison to the private
high school group. This finding can supported by the research conducted by Young et
al. who explained that immense forces are produced during the leg drive phase when
running, and therefore require constant pelvic stability.67 Sayers explained that the
pelvic region is the connecting point between the legs and the upper body, and
therefore requires stability and muscular balance to allow certain movement patterns
to occur.66 Due to the HPC athletes having superior pelvic stability and balance, one
can assume that anterior pelvic tilt may affect running speed and endurance
performances. This assumption is in agreeance with various authors who stated that:
“anterior pelvic tilt is not only limited to decrements in performance standards but is
also a major source of hamstring injuries”.68-69 Deficiencies in core muscle
organization can subsequently decreased the efficiency of movement and ultimately,
cause compensatory movement patterns.26,28 Kibler et al. described core stability as

74
‘‘the ability to control the position and motion of the trunk over the pelvis to allow
optimum production, transfer and control of force and motion to the terminal segment
in integrated athletic activities”.142 The muscles surrounding the hip and pelvis are
essential for reducing and transmitting the tremendous forces acting on the pelvic
region during running, which is considered essential in sprint and endurance
running.143 Since core musculature is the support base for an individual’s posture,
Fredericson and Moore hypothesized that “core musculature helps to stabilize the
spine, pelvis, and kinetic chain during functional movements, which results is
appropriate distribution of forces; optimal control and efficiency of movement;
adequate absorption of ground-impact forces”.26
THE INFLUENCE OF BODY MASS (WEIGHT CATEGORIES) ON RUNNING
PERFORMANCE AND POSTURE
The 70-80kg weight category was superior in the 10m (1.85s ± 0.13), 20m (3.13s ±
0.21) and 40m (5.60s ± 0.41) sprint test results (mean ± SD) in relation to the other
weight categories (p < 0.05). The 70-80kg weight category was composed of
participants who had larger muscle masses in relation to the lower weight categories.
According to Sayers, larger muscles masses are essential to produce forceful leg
drives which are vital components of sprint running performances.66 This was further
emphasized by Weyand and Davis who explained that sprinters are relatively large
and muscular, and further hypothesized that the larger body masses of sprinters are
directly related to the greater GRF produced, which is essential for superior sprint
running performances.111 This finding can be related to the research conducted by
Thorstensson et al., who assessed the physical changes due to sprint related, strength
exercises. It was concluded that increased thigh circumferences were considered
beneficial to sprint performances.144 The worst sprint results were attained by the
80+kg weight category 10m (2.22s ± 0.49), 20m (3.56s ± 0.34) and 40m (6.57s ± 0.61)
(p < 0.05), which included participants who just made inclusion criteria with regards to
high BF%. This means that some participants from this weight category had larger
body masses, in conjunction with higher BF% in comparison to the other weight
categories. In a study conducted by Sporis et al., results showed that higher BF% are

75
inversely related to sprint performances in adolescents.145 This was further supported
by the research of Weyand et al. who concluded that Olympic sprint event runners
maintained a mean BF% of (9.3 ± 1.8%).95 These findings may explain why the 80+kg
weigh category acquired the worst sprint results. Furthermore, having a body weight
that was below 50kg also had negative impacts on sprint speed results. This finding
can be related to findings of Castro-Piñero et al. who assessed the relationship
between sprint performance and weight status.146 It was concluded that underweight
adolescents achieved inferior sprint results in comparison to the normal weight
participants when participating in a 30m sprint test with a standing start.146
The 50-60-kilogram (kg) weight category was superior in the bleep test results (mean
± SD) (9.50 ± 2.56) in comparison to the 40-50kg (8.10 ± 1.47), 60-70kg (9.40 ± 2.01),
70-80kg (9.30 ± 1.77) and 80+kg (6.80 ± 2.17) weight categories (p < 0.05). This result
was expected due to more than half of the HPC endurance athlete’s body masses
falling in the 50-60kg weight category. The participants in the 50-60kg weight category
had relatively low body masses in conjunction with low BF%. According to Weyand
and Davis, endurance runners are evidently restricted in both body mass and muscle
mass.111 Various researchers explained that higher upper extremity masses were
considered to be uneconomical in terms of endurance running, which lead to the
reduction in upper extremity use and therefore a reduction in endurance running
results.147-149
The total posture results (mean ± SD) were superior for the 70-80kg weight category
(47.47 ± 3.20) in comparison to the 40-50kg (41.00 ± 3.52), 50-60kg (46.89 ± 5.71),
60-70kg (46.77 ± 3.84) and 80+kg (44.14 ± 3.63) weight categories (p < 0.05). As
previously discussed, Kratěnová et al. found higher body masses to be beneficial in
terms of postural scores.112 This may explain why the 70-80kg weight category in this
study had far superior postural scores in comparison to the 40-50kg weight category.
Kratěnová et al. further emphasized that individuals who are considered underweight
are more susceptible to poor postures.112 This can be related to the posture results of
the 40-50kg weight category, which attained the worst postural scores in comparison
to the other weight categories. It is important to remember that there are inevitably
other factors that may influence posture. “There are intrinsic and extrinsic factors, such

76
as heredity, the environment or physical conditions in which the subject lives,
socioeconomic level, emotional factors, and physiologic alterations due to human
growth and development”.109
There was a significant difference in postural scores for abducted scapulae between
the various weight categories (χ2(2) = 15.07) (p < 0.05). Abducted scapular postures
were more frequent in individuals in the 40-50kg and 50-60kg weight categories. This
can be related to the findings of Kratěnová et al. who discussed that individuals who
are considered underweight are more susceptible to poor postures.112 It was further
emphasized that “higher fat tissue layer can hide existing skeletal problems”, which
may promote higher incidences of abducted scapulae in the lower weight
categories.112 The 70-80kg weight category which mainly consisted of the HPC sprint
athletes, had superior scapular posture scores in comparison to the other weight
categories. This can be related to the findings of other researchers; “In first accelerated
running, the arm-swing motion affects lower limb kinematics62 and relates to the
performance level of the sprinter in the 100-m dash63 and the sprint time150 of the
athlete”. Winged scapular is extremely common during the childhood due to poor
scapulothoracic fixation.151-152 According to Tanaka and Farah: “shoulder protraction
is mechanically associated with the scapular abduction; it can be also related to its
lateral rotation and to the medial rotation of the shoulders, which occurs because of
the predominant action of serratus anterior and major pectoral muscles over the
rhomboid and trapezius muscles”.153 These findings may provide evidence that muscle
imbalances around the scapular are common in adolescents and children, and
therefore require effective strategies to correct, so that positive growth and improved
running performances can be achieved.
4.4. CONCLUSIONS
Chapter 4 listed all the research results which was further discussed so that
conclusions could be made.

77
CHAPTER 5
SUMMARY, CONCLUSIONS AND RECOMMENDATIONS
5.1. INTRODUCTION 78
5.2. SUMMARY 78
5.3. CONCLUSIONS 79
5.4. RECOMMENDATIONS 80

78
5.1. INTRODUCTION
Chapter five briefly summarizes the research study completed by the researcher.
Major findings will be discussed and general recommendations to future research
papers will be covered. Final conclusions will be emphasized.
5.2. SUMMARY
Chapter one included all the background information of the research study, the
purpose of the study conducted, the specific objectives that were followed by the
researcher, the significance of the study, delimitations that occurred in the study and
limitations overcome in the study. The two major objectives that the research study
followed:
• To assess the postural assessment scores of eleven postural components, running
endurance results from 20m multistage shuttle run tests and running speed results
from 10m, 20m and 40m sprint tests within the two participant groups (private high-
school and a high-performance running academy).
• To correlate the eleven postural assessment scores, running speed results from
10m, 20m and 40m sprint tests and running endurance results from 20m multistage
shuttle run tests between the two participant groups (private high-school and a
high-performance running academy.
Chapter 2 explained the theory behind the research topic which is described by various
information sources, which was further related to the research project. This was
achieved by a thorough literature review which explained the background information
explained by various other researchers. Posture, Speed and endurance was
thoroughly defined.

79
Chapter 3 describes the procedures used to gather and analyse the research data. All
the aspects that played a role in data collection were explained. Study design,
population and sampling, measurements and procedures, data analysis and ethical
considerations
Chapter 4 examines all the research results, and then further discusses them so that
conclusions could be made. Descriptive statistics for each test were explained and
significant correlations were highlighted.
Chapter 5 is composed of a general summary of the research study, and
recommendations for future research is explained.
5.3. CONCLUSIONS
From the results of this study, higher overall posture ratings (better posture) are
correlated with better speed and aerobic endurance. It was concluded that the HPC
athlete group achieved better sprint, endurance and postural results in comparison to
the private high school group. It was further concluded that children should follow
specific exercise programmes to maintain or improve posture. This will provide a solid
base for physical development and will ensure a healthy muscular balance throughout
the body. Teachers, coaches and sport scientists should be educated on the effects
of poor posture and therefore, try promoting an effective posture during class and
sport. Early postural identification is the key to ensuring positive posture in children.
Early identification will allow for postural imbalances to be corrected before puberty
and therefore, ensuring effective development. Furthermore, correcting postural
imbalances in children will not only enhance self-esteem, but also promote a positive
mindset which is essential for growth and development

80
5.4. RECOMMENDATIONS
Due to the research testing technique, acquiring female participants within the age
category would be a difficult task due to ethical boundaries and consent. The effect of
pre-exercise standing posture on running performance in adolescent females may
yield different results in comparison to the findings of this study. Research methods
can be adapted to incorporate female participants and thus, increase the pool of
knowledge on the effect of standing posture on running performances. Further
research can be conducted to assess whether postural promotion before puberty is
beneficial to the development of the individual. This may limit the incidences of
problematic postures and therefore may promote improved growth and development.
Research focus can also be directed to the effect of posture on sporting career
longevity. Identifying the relationship between static posture and the time span of a
professional sporting career may be an insightful and significant finding. Assessing the
relationship between standing posture and the emotional state of adolescents may
also provide valuable results. This may provide evidence linking standing posture to
self-esteem and self-worth.

81
REFERENCES
1. Watson AWS, Mac Donncha C. A reliable technique for the assessment of
posture: Assessment criteria for aspects of posture. J Sports Med Phys Fitness.
2000;40(3):260-70.
2. Darwin C (1871) The Descent of Man, and Selection in Relation to Sex (John
Murray, London); reprinted (1981) (Princeton Univ, Princeton).
3. Zollikofer CPE, Ponce de Leon MS, Lieberman DE, Guy F, Pilbeam D, Likius A,
Mackaye HT, Vignaud P, Brunet M. Nature. Virtual cranial reconstruction of
Sahelanthropus tchadensis. 2005;434:755–759.
4. Rodman PS, McHenry HM. Bioenergetics and the origin of hominid bipedalism.
American Journal of Physical Anthropology. 1980 Jan;52(1):103-6.
5. Sockol MD, Raichlen DA, Pontzer H. Chimpanzee locomotor energetics and the
origin of human bipedalism. Proceedings of the National Academy of Sciences.
2007 Jul 24;104(30):12265-9.
6. Kurbel S, Rapan S. Evolution of human posture and bipedal locomotion within a
provisional time frame of harsh climate changes. Periodicum biologorum. 2015
Mar 31;117(1):11-5.
7. Grasso R, Zago M, Lacquaniti F. Interactions between posture and locomotion:
motor patterns in humans walking with bent posture versus erect posture. J.
Neurophysiol. 2000;83:288-300.
8. Crompton RH, Weijie LY, Günther M, Savage R. The mechanical effectiveness
of erect and “bent-hip, bent-knee” bipedal walking inAustralopithecus afarensis.
Journal of Human Evolution. 1998 Jul 1;35(1):55-74.
9. Spoor F, Wood B, Zonneveld F. Implications of early hominid labyrinthine
morphology for evolution of human bipedal locomotion. Nature. 1994
Jun;369(6482):645.
10. Skoyles JR. Human balance, the evolution of bipedalism and dysequilibrium
syndrome. Medical hypotheses. 2006 Jan 1;66(6):1060-8.
11. Bramble DM, Lieberman DE. Endurance running and the evolution of Homo.
Nature. 2004 Nov;432(7015):345.
12. Schmid P. Functional interpretation of the Laetoli footprints. In: Meldrum DJ,
Hilton CE, editors. Biped to Strider: The emergence of modern human walking,

82
running, and resource transport. New York: Kluwer Academic/Plenum; 2004. p.
49–62.
13. Poliakoff MB. Combat sports in the ancient world: Competition, violence, and
culture. Yale University Press; 1987.
14. Finley MI, Pleket HW. The Olympic Games: the first thousand years. Courier
Corporation; 2012 May 24. Page 6.
15. Hughes M. A review of patterns of play in squash. Sports Science. 1986:363-8.
16. Hughes MD, Bartlett RM. The use of performance indicators in performance
analysis. Journal of sports sciences. 2002 Jan 1;20(10):739-54.
17. Yeadon MR, Challis JH. Future directions for performance related research in
sports biomechanics. Sports Council; 1992.
18. Breivik G, Hanstad DV, Loland S. Attitudes towards use of performance-
enhancing substances and body modification techniques. A comparison between
elite athletes and the general population. Sport in society. 2009 Aug 1;12(6):737-
54.
19. Steele E, BialocerkowskI A, Grimmer K. The postural effects of load carriage on
young people; a systematic review. BMC Musculoskelet Disord. 2003;4:12.
20. Abd-Elkader SF, EL-Bab MF. The Back Rotation Resulted from the Wrong Body
Conditions of Long-Distance Competitors and its Impact on Some Physiological
and Morphological Variables and Recording Level. World. 2010;3(4):329-36.
21. Hansraj KK. Assessment of stresses in the cervical spine caused by posture and
position of the head. Surg Technol Int. 2014 Nov;25(25):277-9.
22. Watson AWS. Physical fitness and athletic performance. 2nd edition. London:
Longman; 1995;63-5
23. Janda V. Muscles as a pathologic factor in back pain. In: Buswell J, Gibson-Smith
M (eds), Proceedings of the International Federation of Manipulative Therapists,
Christchurch. New Zealand. 1982;1-24.
24. Mannheimer JS, Rosenthal RM. Acute and chronic postural abnormalities as
related to craniofacial pain and temporomandibular disorders. Dent Clin North
Am. 1991;35:185-208.
25. Singer KP, Dip PE. A New Musculoskeletal Assessment in a Student Population.
The J Orthop Sports Phys Ther. 1986;8(1):34-41.

83
26. Fredericson M, Moore T. Muscular Balance, Core Stability, and Injury Prevention
for Middle and Long-Distance Runners. Phys Med Rehabil Clin N Am 16.
2005;669-89.
27. Kendall F, McCreary E, Provance P. Muscle testing & function. Baltimore:
Williams and Wilkins. 1993;50:685-90.
28. Akuthota V, Ferreiro A, Moore T, and Fredericson M. Core stability exercise
principles. Curr. Sports Med. Rep. 2008;7(1):39-44.
29. Bloomfield J, Ackland TR, Elliot BC. Applied Biomechanics and Anatomy in Sport
Melbourne: Blackwell Scientific Publications. 1994;40-92.
30. Karlin LI. Injury to the hip and pelvis in the skeletally immature athlete. In The
Lower Extremity and Spine in Sports Medicine. (Ed): Nicholas JA, Hershman EB.
St Louis: Mosby; 1986;1292-1332.
31. Wojtys EM. Sport injuries in the immature athlete. Orthop Clin North Am.
1987;18:689-694.
32. McEvoy M, Grimmer K. Reliability of upright posture measurements in primary
school children Maureen. BMC Musculoskeletal Disorders. 2005;6:35.
33. Lowman C. Faulty posture in relation to performance. J Sport Health Sci.
1958;29:14-5.
34. Watson AWS. Sports injuries in footballers related to defects of posture and body
mechanics. J Sports Med Phys Fitness. 1995;35:289-94.
35. Janda V. Muscles and motor control in low back pain. Assessment and
management. In: Twomey LT (Ed.) Physical therapy of the low back. Churchill
Livingstone: New York. 1987;253-78.
36. Janda V. The technique of therapy of postural and phasic muscles. New Zealand
Manip Ther Assoc Tech Newsletter. 1977;2:1-3.
37. Janda V: On the concept of postural muscles and posture in man. Aust J
Physiother. 1983;29:83-85.
38. Chang YW, Hung W, Wu H, Chiu YC, Hsu HC. Measurements of foot arch in
standing, level walking, vertical jump and sprint start. International Journal of
Sport and Exercise Science. 2010;2(2):35-42.
39. Williams DS, III, McClay IS, Hamill J. Arch structure and injury patterns in
runners. Clin Biomech. 2001;16:341-7.

84
40. Cubucku S, Alimoglu MK, Balci N, Beyazova M. Plantar arch type and strength
profile of the majory ankle muscle groups: a morphometric-isokinetic study.
Isokinet Exerc Sci. 2005;13:217-22.
41. Frederick EC, Clarke TC, Hansen JL, Cooper LB. The effects of shoe cushioning
on the oxygen demands of running. In: Biomechanical Aspects of Sports Shoes
and Playing Surfaces (eds B. Nigg & B. Kerr). 1983;107-14.
42. Johnston CAM, Taunton JE, Lloyd-Smith DR, McKenzie DC. Preventing running
injuries. Practical approach for family doctors. Can Fam Physician.
2003;49:1101-9.
43. Nigg BM, Nurse MA, Stefanyshyn DJ. Shoe inserts and orthotics for sport and
physical activities. Med Sci Sports Exerc. 1999;3:S421-8.
44. Clement DB. The practical application of exercise training principles in family
medicine. Can Fam Physician. 1982;28:929-32.
45. Dierks TA, Manal KT, Hamill J, Davis IS. Proximal and Distal Influences on Hip
and Knee Kinematics in Runners with Patellofemoral Pain during a Prolonged
Run. J Orthop Sports Phys Ther. 2008;38(8):448-56.
46. Goldfuss AJ, Morehouse CA, Leveau BF. Effect of muscular tension on knee
stability. Med. Sci. Sports. 1973;5:267-71.
47. Mcmahon TA, Valiant G, Frederick EC. Groucho running. J Appl Physiol.
1987;62(6):2326-37.
48. Biewener A. Biomechanics of mammalian terrestrial locomotion. Science.
1990;250:1097-1103.
49. Morton DP, Callister R. Influence of posture and body type on the experience of
exercise-related transient abdominal pain. J Sci Med Sport. 2010;13:485-48.
50. Lichota M, Plandowska M, Mil P. The shape of anterior-posterior curvatures of
the spine in athletes practising selected sports. Pol. J. Sport Tourism.
2011;18:112-6.
51. Giles LGF, Taylor JR. Low back pain associated with leg length inequality. Spine.
1981;6:510-21.
52. Grieve GP. Treating backache-a topical comment. Physiotherapy. 1983;69:316.
53. Taylor JR. Scoliosis and growth patterns of asymmetry in normal vertebral
growth. Acta Orthop Scand. 1983;54:596-602.

85
54. Di-Rocco PJ, Vaccaro P. Cardiopilmonary functioning in adolescent patients with
mild idiopathic scoliosis. Arch Phys Med Rehabil. 1988;69:198-201.
55. Chen PQ, Wang JL, Tsuang YH, Liao TL, Huang PI, Hang YS. The postural
control and gait pattern of idiopathic scoliosis in adolescents. Clin Biomech.
1998;13(1):52-8.
56. Cole AK, McGrath ML, Harrington SE, Padua DA, Rucinski TJ, Prentice WE.
Scapular bracing and alteration of posture and muscle activity in overhead
athletes with poor posture. Journal of athletic training. 2013 Jan;48(1):12-24.
57. Lewis JS, Green A, Wright C. Subacromial impingement syndrome: the role of
posture and muscle imbalance. J Shoulder Elbow Surg. 2005a;14(4):385–392.
58. Lewis JS, Wright C, Green A. Subacromial impingement syndrome: the effect of
changing posture on shoulder range of movement. J Orthop Sports Phys Ther.
2005b;35(2):72–87.
59. Cavagna G, Heglund N, Taylor C. Mechanical work in terrestrial locomotion: two
basic mechanisms for minimizing energy expenditure. Am. J. Physiol.
1977;233,243-61.
60. Peterson DE, Blankenship KR, Robb JB, Walker MJ, Bryan JM, Stetts DM, et al.
Investigation of the validity and reliability of four objective techniques for
measuring forward shoulder posture. J Orthop Sports Phys Ther. 1997;25(1):34-
42.
61. Culham E, Peat M. Spinal and shoulder complex posture: Measurement using
the 3Space Isotrak. Clin Rehabil. 1993;309-18.
62. Lockie RG, Callaghan SJ, Jeffriess MD. Acceleration kinematics in cricketers:
implications for performance in the field. J Sport Sci Med. 2014;13(1):128–36.
63. Slawinski J, Bonnefoy A, Leveque JM, Ontanon G, Riquet A, Dumas R, et al.
Kinematic and kinetic comparisons of elite and well-trained sprinters during sprint
start. J Strength Cond Res. 2010a;24(4):896–905.
64. Otsuka M, Ito T, Honjo T, Isaka T. Scapula behavior associates with fast sprinting
in first accelerated running. SpringerPlus. 2016;5:682.
65. Jull G, Janda V. Muscles and motor control in low back pain: Assessment and
management in: Physical Therapy of the Low Back. 1987;253-78.
66. Sayers M. Running techniques for running rugby. New Zealand Coach.
1999;7:20-3.

86
67. Young W, Benton D, John-Pryor M. Resistance training for short sprints and
maximum-speed sprints. Strength Cond J. 2001;23(2):7.
68. Geraci MC Jr. Overuse injuries of the hip and pelvis. J Back Musculoskelet
Rehabil. 1996;1;6(1):5-19.
69. Klein KK, Roberts CA. Mechanical problems of marathoners and joggers: Cause
and solution. Am Correct Ther J. 1976;30:187-91.
70. Slocum DB, James SL. Biomechanics of running. JAMA. 1968; 205:721-28.
71. Vogt L, Pfeifer K, Banzer W. Neuromuscular control of walking with chronic low-
back pain. Man Ther. 2003;8(1):21-8.
72. Jones AM, Carter H. The effect of endurance training on parameters of aerobic
fitness. Sports Med. 2000;29:373-86.
73. Howley ET, Bassett DR, Welch HG. Criteria for maximal oxygen uptake: review
and commentary. Medicine and science in sports and exercise. 1995 Sep
1;27(9):1292-301.
74. Rowell LB. Human cardiovascular adjustments to exercise and thermal stress.
Physiological reviews. 1974 Jan;54(1):75-159.
75. Hill AV, Lupton H. Muscular exercise, lactic acid, and the supply and utilization
of oxygen. QJM: Quarterly Journal of Medicine. 1923 Jan;1(62):135-71.
76. Baechle TR, Earle RW, Wathan D. Resistance Training. In: Essentials of
Strength Training and Conditioning. Ed: Baechle TR, Earle RW. 3rd edition.
Champaign, IL: Human Kinetic; 2008;396.
77. Ray CA, Cureton KJ. Interactive effects of body posture and exercise training on
maximal oxygen uptake. J. Appl. Physiol. 1991;71(2):596-600.
78. Numella A, Keranen T, Mikkelsson LO. Factors Related to Top Running Speed
and Economy. Int J Sports Med. 2007;28(8):655-61.
79. Kesten S, Garfinkel SK, Wright T, Rebuck AS. Impaired exercise capacity in
adults with moderate scoliosis. CHEST Journal. 1991;99(3):663-6.
80. Lenke LG, White DK, Kemp JS, Bridwell KH, Blanke KM, Engsberg JR.
Evaluation of ventilatory efficiency during exercise in patients with idiopathic
scoliosis undergoing spinal fusion. Spine (Phila Pa 1976). 2002;27:2041-5.
81. Michand PA, Caudery M, Schutzy S. Assessment of physical activity with ape do
motor and its relationship with VO among adolescents. in Switzerland, Soz
Praventivmed. 2002;47:107-15.

87
82. Lamb DR. Basic principles for improving sport performance. Sports Sci Exch.
1995;8:1-5.
83. Saunders PU, Pyne DB, Telford RD, Hawley JA. Factors Affecting Running
Economy in Trained Distance Runners. Sports Med. 2004;34(7):465-85.
84. Heise GD, Martin PE. Are variations in running economy in humans associated
with ground reaction force characteristics? Eur J Appl Physiol. 2001;84:438-42.
85. Kaneko M, Ito A, Fuchimoto T, Shishikura Y, Toyooka J. Influence of running
speed on the mechanical efficiency of sprinters and distance runners. In: Winter
DA, Norman RW, Wells RP, Heyes KC, Patla AE (eds). Biomechanics IX-B.
Champaign, IL, USA: Human Kinetics. 1985;307-12.
86. Dalleau G, Belli A, Bourdin M, Lacour J-R. The spring-mass model and the
energy cost of treadmill running. Eur J Appl Physiol. 1998;77:257-63.
87. Gregor RJ, Kirkendall D. Performance efficiency of world class female marathon
runners. In: Asmussen E, Jørgensen K (eds). Biomechanics VI-B. Baltimore,
USA: University Park Press. 1978;40-5.
88. Paavolainen LM, Nummela AT, Rusko HK. Neuromuscular characteristics and
muscle power as determinants of 5-km running performance. Med Sci Sports
Exerc. 1999;31:124-30.
89. Williams KR, Cavanagh PR. Relationship between distance running mechanics,
running economy, and performance. J Appl Physiol. 1987;63:1236-45.
90. Cavanagh PR, Williams KR. The effect of stride length variation on oxygen
uptake during distance running. Med Sci Sports Exerc. 1982;14:30-3.
91. Reilly T, Bangsbo J, Franks A. Anthropometric and physiological predispositions
for elite soccer. J Sport Sci. 2000;18(9):669-83.
92. Sayers M. Running techniques of field sport players. Sport Coach.
2000;23(1):26–7.
93. Luhtanen P, Komi PV. Mechanical factors influencing running speed. In:
Asmussen E, Jørgensen K (eds). Biomechanics VI-B. Baltimore, USA: University
Park Press. 1978;23-9.
94. Mero A, Komi PV. Forve, EMG, and elasticity-velocity relationships at
submaximal and supramaximal running speeds in sprinters. Eur J Appl Physiol
1986;55:553-61.

88
95. Weyand PG, Sternlight DB, Bellizzi MJ, Wright S. Faster top running speeds are
achieved with greater ground reaction forces not more rapid leg movements. J
Appl Physiol. 2000;89:1991-99.
96. Kyröläinen H, Belli A, Komi PV. Biomechanical factors affecting running
economy. Med Sci Sports Exerc. 2001;33:1330-1337.
97. Hunter JP, Marshall RN, McNair PJ. Relationships between ground reaction
force impulse and kinematics of sprint-running acceleration. Journal of applied
biomechanics. 2005 Feb;21(1):31-43.
98. Hinrichs RN, Cavanagh PR, Williams KR. Upper extremity function in running. 1:
Centre of mass and propulsion considerations. Int. J. Sport Biomech.
1987;3:222-41.
99. Ruivo RM, Pezarat-Correia P, Carita AI. Intrarater and interrater reliability of
photographic measurement of upper-body standing posture of adolescents.
Journal of manipulative and physiological therapeutics. 2015 Jan 1;38(1):74-80.
100. Perry M, Smith A, Straker L, Coleman J, O'Sullivan P. Reliability of sagittal
photographic spinal posture assessment in adolescents. Advances in
Physiotherapy. 2008 Jan 1;10(2):66-75.
101. Weber P, Corrêa EC, Milanesi JM, Soares JC, Trevisan ME. Craniocervical
posture: cephalometric and biophotogrammetric analysis. Brazilian Journal of
Oral Sciences. 2016 Dec 12:416-21.
102. Raine S, Twomey LT. Posture of the head, shoulders and thoracic spine in
comfortable erect standing. Aust J Physiother. 1994;40(1):25-32.
103. Beningfield S, Potgieter H, Nicol A, van As S, Bowie G, Hering E, Lätti E. Report
on a new type of trauma full-body digital X-ray machine. Emerg Radiol.
2003;10:23-9.
104. Arnheim DD, Auxter D, Crowe WG. Principles and methods of adapted physical
education and recreation. 3rd edition. St Louis: C V. Mosby Company. 1977
105. Johnson, Barry L & Nelson, Jack K. Practical measurements for evaluation in
physical education, 4th ed, (Burgess Pub, Edina, MN). 1986
106. Shumway-Cook A, Woollacott MH. Motor control: translating research into
clinical practice. Lippincott Williams & Wilkins; 2007.
107. Cho CY: Survey of faulty postures and associated factors among Chinese
adolescents. J Manipulative Physiol Ther, 2008, 31: 224–229 [PubMed]).

89
108. Chansirinukor W, Wilson D, Grimmer K, Dansie B. Effects of backpacks on
students: measurement of cervical and shoulder posture. Australian Journal of
physiotherapy. 2001 Jan 1;47(2):110-6.
109. Penha PJ, João SM, Casarotto RA, Amino CJ, Penteado DC. Postural
assessment of girls between 7 and 10 years of age. Clinics. 2005 Feb;60(1):9-
16.
110. Tattersall R, Walshaw MJ. Posture and cystic fibrosis. Journal of the royal society
of medicine. 2003;96(Suppl 43):18.
111. Weyand PG, Davis JA. Running performance has a structural basis. J Exp Biol.
2005;208:2625-31.
112. Kratěnová J, ŽEjglicová K, Malý M, Filipová V. Prevalence and risk factors of
poor posture in school children in the Czech Republic. Journal of School Health.
2007 Mar;77(3):131-7.
113. Grøholt EK, Stigum H, Nordhagen R, Köhler L. Recurrent pain in children, socio-
economic factors and accumulation in families. European journal of
epidemiology. 2003 Oct 1;18(10):965-75.
114. Brügger A. Kinesiological aspects of functional limitations during movement and
posture. Rehabilitácia. 1993;26:136-44.
115. Filipová V, Kratenová J, Trestrová Z. National Program of Health—Grant
Projects for the Support of Health 1994-2004. Prague, Czech Republic: Regional
Public Health Authority and Institute of Health of the Middle Bohemian Region.
2005.
116. Plowman SA, Meredith MD. (Eds.). Fitnessgram/Activitygram Reference Guide
(4th Edition). Dallas, TX: The Cooper Institute. 2013;3:7-9.
117. Robertson SM, Cullen KW, Baranowski J, Baranowski T, Hu S. Factors related
to adiposity among children aged 3 to 7 years. Journal of the American Dietetic
Association. 1999 Aug 1;99(8):938-43.
118. Leger LA, Lambert JA. maximal multistage 20-m shuttle run test to predict dot
VO2 max. Eur J Appl Physiol Occup Physiol. 1982;49(1):1-2.
119. Rebekić A, Lončarić Z, Petrović S, Marić S. Pearson's or spearman's correlation
coefficient-which one to use?. Poljoprivreda (Osijek). 2015 Jan 1;21(2):47-54.

90
120. Foster C, Hector LL, Welsh R, Schrager M, Green MA, Snyder AC. Effects of
specific versus cross-training on running performance. European journal of
applied physiology and occupational physiology. 1995 Jul 1;70(4):367-72.
121. Harrison CB, Gill ND, Kinugasa T, Kilding AE. Development of aerobic fitness in
young team sport athletes. Sports Medicine. 2015 Jul 1;45(7):969-83.
122. Chamari K, Hachana Y, Kaouech F, Jeddi R, Moussa-Chamari I, Wisloff U.
Endurance training and testing with the ball in young elite soccer players. Br J
Sports Med. 2005;39(1):24–8.
123. Buchheit M, Laursen PB, Kuhnle J, Ruth D, Renaud C, Ahmaidi S. Game-based
training in young elite handball players. Int J Sports Med. 2009;30(4):251–8.
124. Impellizzeri F, Marcora SM, Castagna C, Reilly T, Sassi A, Iaia FM, et al.
Physiological and performance effects of generic versus specific aerobic training
in soccer players. Int J Sports Med. 2006;27(6):483–92.
125. Kotzamanidis C, Chatzopoulos D, Michailidis C, Papaiakovou G, Patikas D. The
effect of a combined high-intensity strength and speed training program on the
running and jumping ability of soccer players. The Journal of Strength &
Conditioning Research. 2005 May 1;19(2):369-75.
126. Delecluse C. Influence of strength training on sprint running performance. Sports
Medicine. 1997 Sep 1;24(3):147-56.
127. Rimmer E, Sleivert G. Effects of a plyometrics intervention program on sprint
performance. The Journal of Strength & Conditioning Research. 2000 Aug
1;14(3):295-301.
128. Tomlin DL, Wenger HL. The relationship between aerobic fitness and recovery
from high intensity exercise. Sports Med. 2001;31(1):1–11.
129. Baquet G, Van Praagh E, Berthoin S. Endurance training and aerobic fitness in
young people. Sports Med. 2003;33(15): 1127–43.
130. Obert P, Mandigouts S, Nottin S, Vinet A, N’Guyen LD, Lecoq AM.
Cardiovascular responses to endurance training in children: effect of gender.
European journal of clinical investigation. 2003 Mar;33(3):199-208.
131. Pyne DB, Saunders PU, Montgomery PG, Hewitt AJ, Sheehan K. Relationships
between repeated sprint testing, speed, and endurance. The Journal of Strength
& Conditioning Research. 2008 Sep 1;22(5):1633-7.
132. AMAA Journal. 2004;17(1):8-10.

91
133. Horak FB. Clinical assessment of balance disorders. Gait & posture. 1997 Aug
1;6(1):76-84.
134. Marta CC, Marinho DA, Barbosa TM, Carneiro AL, Izquierdo M, Marques MC.
Effects of body fat and dominant somatotype on explosive strength and aerobic
capacity trainability in prepubescent children. The Journal of Strength &
Conditioning Research. 2013 Dec 1;27(12):3233-44).
135. Zhang LQ, Xu D, Wang G, Hendrix RW. Muscle strength in knee varus and
valgus. Medicine & Science in Sports & Exercise. 2001 Jul 1;33(7):1194-9
136. Ramprasad M, Alias J, Raghuveer AK. Effect of backpack weight on postural
angles in preadolescent children. Indian pediatrics. 2010 Jul 1;47(7):575-80
137. Murphy S, Buckle P, Stubbs D. Classroom posture and self-reported back and
neck pain in schoolchildren. Applied ergonomics. 2004 Mar 1;35(2):113-20
138. Prins Y, Crous L, Louw QA. A systematic review of posture and psychosocial
factors as contributors to upper quadrant musculoskeletal pain in children and
adolescents. Physiotherapy theory and practice. 2008 Jan 1;24(4):221-42
139. Brink Y, Crous LC, Louw QA, Grimmer-Somers K, Schreve K. The association
between postural alignment and psychosocial factors to upper quadrant pain in
high school students: A prospective study. Manual therapy. 2009 Dec
1;14(6):647-53
140. Casarotto RA, Liberti EA. Anthropometric data of pre-school children in the city
of São Paulo. Physiotherapy and Research. 1994; 1 (1): 27-33
141. Rebelatto JR, Caldas MA, Vitta AD. Influence of transport of school material on
the occurrence of postural deviations in students. Rev. bras. ortop. 1991 Dec; 26
(11/12): 403-10
142. Kibler WB, Press J, Sciascia A. The role of core stability in athletic function.
Sports Med 2006; 36 (3): 189-98
143. Geraci MC, Brown W. Evidence-based treatment of hip and pelvic injuries in
runners. Physical Medicine and Rehabilitation Clinics. 2005 Aug 1;16(3):711-47.
144. Thorstensson A, Sjödin B, Karlsson J. Enzyme activities and muscle strength
after “sprint training” in man. Acta Physiologica Scandinavica. 1975
Jul;94(3):313-8.

92
145. Sporis G, Jukic I, Ostojic SM, Milanovic D. Fitness profiling in soccer: physical
and physiologic characteristics of elite players. The Journal of Strength &
Conditioning Research. 2009 Oct 1;23(7):1947-53.
146. Castro-Piñero J, González-Montesinos JL, Keating XD, Mora J, Sjöström M, Ruiz
JR. Percentile Values for Running Sprint Field Tests in Children Ages 6-17
Years: Influence of Weight Status. Res Q Exerc Sport 2010 06;81(2):143-51.
147. Gupta M, Dashottar A, Borstad JD. Scapula kinematics differ by body mass
index. Journal of applied biomechanics. 2013 Aug;29(4):380-5.
148. Pietilainen KH, Kprio J, Borg P, et al. Physical inactivity and obesity: a vicious
circle. Obesity (Silver Spring). 2008;16:409–414.
149. Maffiuletti NA, Jubeau M, Munzinger U, et al. Differences in quadriceps muscle
strength and fatigue between lean and obese subjects. Eur J Appl Physiol.
2007;101:51–59.
150. Lockie RG, Murphy AJ, Spinks CD. Effects of resisted sled towing on sprint
kinematics in field-sport athletes. The Journal of Strength & Conditioning
Research. 2003 Nov 1;17(4):760-7.
151. Kendall FP, McCreary EK, Provance PG, Abeloff D, Andrews PJ, Krausse
CC. Muscles, evidence and functions; with Posture and pain. editor
Manole; 1995
152. Gross RH. The Pediatric Examination. In: Morrisy RT, Weinstein SL. Pediatric
Orthopaedics. Philadelphia: Lippincott-Raven Publishers; 1996:51-89.
153. Tanaka C, Farah EA. Functional anatomy of the muscular chains. Physiotherapy
and Research. 1997;4(1):39-40.

93
FACULTY OF HEALTH SCIENCES
Http://www.up.ac.za
Appendix 1 - Body fat percentages and healthy fitness zone
(HFZ = Healthy fitness zone)

94
FACULTY OF HEALTH SCIENCES
Http://www.up.ac.za
Appendix 2: PARTICIPANT DATA COLLECTION SHEET
Participant Number
First Name Surname Grade Age Weight

95
FACULTY OF HEALTH SCIENCES
Http://www.up.ac.za
Appendix 3: SPEED AND ENDURANCE DATA COLLECTION SHEET
Data Collection Sheet
Participant Number
Endurance Results
Bleep test score
Sprint Results Attempt 1
10m Sprint (seconds)
20m Sprint (seconds)
40m Sprint (seconds)
Sprint Results Attempt 2
10m Sprint (seconds)
20m Sprint (seconds)
40m Sprint (seconds)

96
FACULTY OF HEALTH SCIENCES
Http://www.up.ac.za
Appendix 4: POSTURE DATA COLLECTION SHEET
Data Collection Sheet
Participant Number
Postural Scores
Knee interspace
Shoulder symmetry
Knee hyperextension/flexion
Lordosis
Kyphosis
Round shoulders
Abducted scapulae
Forward head
Pelvic Tilt
Ankle posture
Scoliosis
Total Posture

97
FACULTY OF HEALTH SCIENCES
Http://www.up.ac.za
Appendix 5 - Scoring criteria for the assessments of ankle posture. Left indicates
good ankle posture. Right indicates marked deviation in ankle posture.

98
FACULTY OF HEALTH SCIENCES
Http://www.up.ac.za
Appendix 6 - Scoring criteria for the assessments of knee interspace. Left
indicates knee varus. Right Indicates knee valgus.

99
FACULTY OF HEALTH SCIENCES
Http://www.up.ac.za
Appendix 7 - Scoring criteria for the assessments of knee hyperextension and
flexion. Left indicates knee hyperflexion. Right indicates knee hyperextension.

100
FACULTY OF HEALTH SCIENCES
Http://www.up.ac.za
Appendix 8 - Scoring criteria for the assessments of lordosis. Top indicates
the scoring criteria of lordosis. Bottom indicates the quantitative procedure to
attain the lordosis score.

101
FACULTY OF HEALTH SCIENCES
Http://www.up.ac.za
Appendix 9 - Scoring criteria for the assessments of kyphosis. Left indicates
good kyphotic posture. Right indicates marked deviation in kyphotic posture.

102
FACULTY OF HEALTH SCIENCES
Http://www.up.ac.za
Appendix 10 - Scoring criteria for the assessments of scoliosis. Top indicates
the scoring criteria for C-curve scoliosis. Bottom indicates the scoring criteria
for S-curve scoliosis.

103
FACULTY OF HEALTH SCIENCES
Http://www.up.ac.za
Appendix 11 - Scoring criteria for the assessments of round shoulders and
abducted scapulae. Left indicates good shoulder and scapulae posture. Right
indicates marked deviations in forward shoulder and abducted scapulae
postures.

104
FACULTY OF HEALTH SCIENCES
Http://www.up.ac.za
Appendix 12 - Scoring criteria for the assessment of shoulder symmetry.
Left indicates good shoulder symmetry. Right indicates marked deviations in
shoulder symmetry.

105
FACULTY OF HEALTH SCIENCES
Http://www.up.ac.za
Appendix 13 - Scoring criteria for the assessment of forward head. Left
indicates good head posture. Right indicates marked deviations in head
posture.

106
Appendix 14

107
FACULTY OF HEALTH SCIENCES
Http://www.up.ac.za
Appendix 15
Researcher contact details:
Mr Duncan Peter Sutcliffe [12086984]
24 Boekenhout Street, Brummeria, Pretoria, 0184
Tel: 082 222 63506
E-mail: [email protected]
PARTICIPANT INFORMATION CONSENT DOCUMENT
Dear Participant
You are invited to participate in this research study titled:
“The effect of pre-exercise standing posture on running performance in
adolescent males”
This document contains important information pertaining to the study. Please feel free
to ask questions if anything is unclear, or if you are uncertain about any aspect of the
study.

108
PURPOSE:
In the study, the researcher will correlate postural assessments to running
performances, namely; running speed and running endurance. Relationships obtained
through the research process may help identify the link between posture and
performance in running. The relationship between pre-exercise standing posture and
running performance in adolescents can be used to further increase the pool of
knowledge on performance parameters, and thus better the standard of running and
reduce the occurrences of running related injuries.
PROCEDURES:
• 10, 20 and 40 metre sprint tests using the HPC photoelectric light system will be
conducted to assess the sprint speed abilities of participants (Smart Speed Pro –
Fusion Sport).
• A modified postural assessment technique will be used which qualitatively and
quantitatively assesses eleven common areas of postural problematic areas.
• The 20-metre shuttle run test using a pre-recorded audio track and a speaker
system will be used to assess the aerobic endurance abilities of the participants
(Australian Bleep test version).
Three separate days will be used to conduct the full spectrum of testing procedures
for each participant. A minimum of 24 hours will be given between each speed and
endurance test. Before each speed and endurance testing session, a standardized
warm-up of ten minutes will be conducted that will be primarily jogging, running and
dynamic stretches. The purpose is to increase muscle/tendon flexibility, minimizing
injury, enhance athletic performance, and generally preparing the participants for the
workload ahead. For increased reliability, correlations between weight divisions will
be used as an alternative to age group divisions to rule out the effects of pubertal
influences (ten-kilogram divisions). Body fat percentages will also be to rule out effects
of body fat on running performance results. Pre-participation explanations for each
testing session will be executed to ensure reliable results and a clear understanding
of procedures. It is important to note that the time of test manipulation was not
regulated due to the inconsistent participant availability.

109
5.4.1 Testing day one (Sprint Speed Assessment)
Body fat percentages and body mass will be assessed prior to sprint speed
assessments. The use of the HPC photoelectric speed lights will be used at both HPC
and a private high school for testing. Sprint speeds of 10m, 20m, and 40m will be
assessed. Values will be recorded in (seconds) for completing allocated distances.
The better of two attempts per participant will be recorded for data collection. The
participant is to give maximal effort in their sprint tests to achieve valid results. The
participant will be instructed to wear regular sporting outfits with an emphasis being
placed on regular running shoes. Barefoot or running spikes will not be permitted.
5.4.2 Testing day two (Postural Assessment)
Postural assessments will be conducted using both qualitative and quantitative
measures. A high-quality HD video camera will be placed perpendicular and centrally
10ft (3,048 metres) from the platform at a height of 120 centimetres. Footage will be
in the form of video recorded data instead of photographs for the sole purpose that
minor movements may alter postural scores. Dartfish Pro (version 8 and 9) will be
used to assessments. When instructed, the participant will rotate and stand 90
degrees clockwise; this will be repeated so that the anterior, lateral and posterior
aspect of the participant is recorded. The landmarks will be marked before testing with
the use of adhesive dots. This will enable the researcher to more accurately measure
and/or calculate certain values for postural scoring. The landmarks are as follows:
Patellar notch, greater trochanter, both clavicular heads, both iliac spines, tibial
tuberosity, centre of the patellae, C7/T1, T3, T6, T9, T12, L3, L5, most prominent point
of the sacrum and the centre of the calcaneus. Participants will be asked to stand
completely relaxed, upright, staring ahead with their chin parallel to the ground and
fully extend elbows and knees. Fingers and thumbs are to be pointed forward and the
participant’s heels should be in contact. Postural rating will be assigned a score of
either 5,3 or 1. A score of 5 corresponds to good body mechanics that ranges from no
deviation to a level just above that of the previous category. A score of 3 corresponds
to a moderate deviation and a score of 1 corresponds to a marked deviation. Overall
score of 55 from all 11 postural components corresponds to a perfect posture. Racing
tights that are no more than 6mm deep will be worn by all participants.

110
Postural testing will be compromised of three testing procedures:
• The first procedure involved observing one or two scoring criteria to designate a
participant to a qualitative posture category. The 11 separate aspects which will be
assessed are as follows: Ankle posture, Knee interspace, Knee
hyperextension/flexion, Lordosis, Kyphosis, Scoliosis, Round Shoulders, Abducted
Scapulae, Shoulder symmetry and Forward Head. Pelvic Tilt will also be assessed
due to its role in running performance.
• The second procedure involved the superimposing of scoring criteria photos onto
the videos of participants using Dartfish Pro software (version 8 and 9) to further
analyse the postural structures.
• The third procedure was used either to support or reconsider the qualitative
judgement and involved the use of quantitative methods of assessment. The
analysis of video captured footage in a quantitative method using Dartfish Pro
software (version 8 and 9). This allows for pinpoint analysis of postural deviances
and thus furthers the validity of results. The third procedure will be the deciding
deduction if first and second procedures are conflicting.
Testing Day 3 (Aerobic Endurance Assessment)
The 20m shuttle run test (Bleep Test) will be conducted. Scores obtained will be in the
form of running stage number, which will then be converted to distance covered
meters. The participant is to give maximal effort in their bleep test to achieve valid
results. The participant will be instructed to wear regular sporting outfits with an
emphasis being placed on regular running shoes. Barefoot or running spikes will not
be permitted.
RISKS AND DISCOMFORTS:
Risks associated with the study include, but are not limited to, muscle pain, muscle
stiffness, fatigue, and in rare instances dizziness. In the case of an acute adverse
event the patient will be referred or treated by medical personnel at the University of
Pretoria. The risks associated with the study are based primarily on the sprint and
endurance tests which require maximal efforts, and thus increased susceptibility of
injuries. Participation in the study remains voluntarily; this will be made clear in the

111
explanation and consent/assent forms. The participants are allowed to stop the tests
at any time if necessary. Risks will be reduced by implementing an in-depth
explanation of all testing procedures. Furthermore, the risk of sustaining an injury will
be reduced by conducting and foreseeing an effective warm up for each physical test.
EXCLUSION CRITERIA:
• Individuals with any present injuries or illnesses that may prevent maximal effort in
performance testing will be excluded from the study.
• Female individuals may not participate in the study.
• Individuals with body fat percentages greater than the prescribed health fitness
zone may not participate in the study.
• Individuals who have muscle soreness or stiffness from various other sporting
activities, that may prevent maximal effort in performance testing will be excluded
from the study.
BENEFITS:
Positive benefits to the participants would include general postural analysis, as well as
running performance assessments. Any postural imbalances identified may have
detrimental effects on performances in an array of sporting codes, as well as their
general health. Interventions can be implemented at every educational level to identify,
correct and maintain postural imbalances which may prevent long term effects on the
individual. Specialised postural improvement programs may benefit all individuals
regardless of postural statuses
CONFIDENTIALITY:
Participation in the study remains voluntarily; this will be made clear in the explanation
and consent/assent forms. The participants can stop the tests at any time if necessary.
The raw data obtained from the players will be kept up to 15 years. Anonymity will be
maintained throughout the full testing procedure by use of a numbering system. The
names of all participants involved will not be published or presented.
Take note that your participation is voluntary and that you are not being forced to take
part in this study. Although you agree to participation, you retain the right to withdraw

112
from participation in the study at any time, without negative consequences.
I, ____________________________________________ (full name of participant),
have read the above information and have been informed of the procedures,
requirements, benefits and risks of participating in this research project.
I hereby also grant permission to participate in this research study and that I will not
withhold any information that may be of importance to the researcher. I hereby also
grant the researcher permission to use my data of my participation in this study and
that my results may be used for publication and/or presentation purposes, with
anonymity ensured.
_________________________
Full names or participant Signature of participant
_________________________
Signature of witness
_________________________ ______________________
Signature of researcher Date

113
FACULTY OF HEALTH SCIENCES
Http://www.up.ac.za
Appendix 16
PARTICIPANT INFORMATION ASSENT DOCUMENT
Dear Participant
You are invited to participate in this research study titled:
“The effect of pre-exercise standing posture on running performance in
adolescent males”
You will form part of the research study where your body posture, running speed, and
running fitness levels will be tested. Body posture is a major aspect of general health,
as well as sporting performances. The aim of the research being conducted is to
identify whether your posture may affect your running abilities.
About 60 students from a private high school and 30 athletes for the HPC High School
are going to take part in this study. Testing will take place from June 2017 – March
2018. The running tests must be completed as best you can. The posture tests are
pain free and very quick. Testing will occur over three separate days.
• Day 1 is the Running Speed Tests
• Day 2 is the Running Fitness Tests
• Day 3 is the Posture Tests

114
Any postural problems that you may have, may reduce your sporting performances
and reduce the general health.
If you do not want to take part or you may decide not to carry on. No-one will force you
to carry on. Speak to your parents and/or guardians when deciding whether to take
part.
If you sign at the bottom it will mean that you have read this paper, and that
you would like to be in this study
_________________________
Full names or participant Signature of participant/guardian
_________________________
Signature of witness
_________________________ ______________________
Signature of researcher Date

115
Appendix 17

116
Appendix 18

117
Appendix 19

118
Appendix 20

119
Appendix 21

120
Appendix 22


![Journal of Ergonomics · 2019-04-18 · standing. Standing appears to unload the passive tissue structures of the back thus providing a resting position from the seated posture [3].](https://static.fdocuments.us/doc/165x107/5e6af769e9327370462925c9/journal-of-ergonomics-2019-04-18-standing-standing-appears-to-unload-the-passive.jpg)