The Effect of Patriarchal Culture on Women’s Labor Force Participation
26
The Effect of Patriarchal Culture on Women’s Labor Force Participation Ishac Diwan and Irina Vartanova First draft, June 2016 Financial support by ERF is gratefully acknowledged. Support by the UNDP in the context of the preparation of background work for the Arab Human Development report, in the form of access to the Gallup data is also acknowledged.
-
Upload
economic-research-forum -
Category
Government & Nonprofit
-
view
347 -
download
3
Transcript of The Effect of Patriarchal Culture on Women’s Labor Force Participation

The Effect of Patriarchal Culture on Women’s Labor Force Participation
Ishac Diwan and Irina VartanovaFirst draft, June 2016
Financial support by ERF is gratefully acknowledged. Support by the UNDP in the context of the preparation of background work for the Arab Human Development report, in the form of access to the Gallup data is also acknowledged.

Regional estimates of female labor force participation rates, 1992 and 2012, (adults 25 and older)
Source: ILO database

What explains FLFP variations?
• Global/country literature:– Small variations through time/large variations through
regions– Through time/development: a U curve, high FLFP for
poor and rich countries– FLFP Rises with education.
• But– What explains regional variation? If it is culture, how
to measure it, and how does it play out in the household?
– In which ways does education matter?

plan• A micro/macro regression analysis - cross-sectional,
not time series• Measure patriarchal culture from opinion polls• We use WVS and Gallup
1. Replicate base model (education, regions)2. Can patriarchal culture explain regional differences?3. Unbundle education?
– Emancipation in values?– Higher wages?– Better bargaining position for women?
1. FLFP: • Comparing data from ILO, WVS, and Gallup• Large regional variation that cannot be explained by economic
considerations

FLFP rises with education regional variation remains, but falls, at higher
levels of education

multi-level modeling• Basic relation is between FLFP and education• We are interested in explaining both cross country, and
within country variation • Likely presence of heteroscedasticity suggests that we need
to model variance • Basic model(s)
– We use a linear ML probability model– Intercept depends on:
• GDP capita and its square• Regional controls
– Slope depends on• Effect of education and other individual characteristics• Education first as a fixed effect, then as a random effect

FLFP base model (1)Individual characteristics - fixed effect slopes
WVS GallupEducation middle (low = ref.) 0.130*** 0.106***
Education High 0.269*** 0.241***
Married (single - ref) -0.189*** -0.106***
1 child (0 - ref) -0.056*** -0.025***
4 and more children -0.132*** -0.086***
Age 15-25 (>65 = ref) 0.147*** na
35 - 45 0.239*** 0.031***
55 - 65 0.156*** -0.009**
Religious faith -0.022*** -0.019***
Denom: None (Christ = ref) 0.014* -0.003
Muslim -0.103*** -0.058***
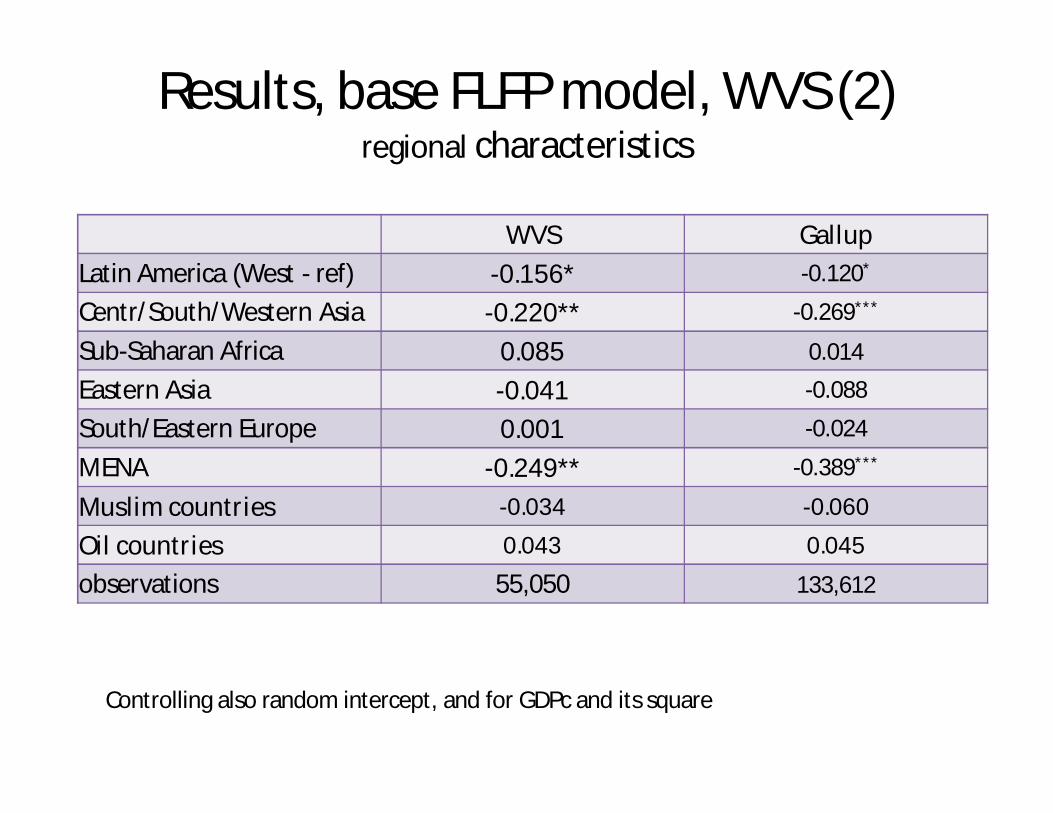
Results, base FLFP model, WVS (2)regional characteristics
WVS GallupLatin America (West - ref) -0.156* -0.120*
Centr/South/Western Asia -0.220** -0.269***
Sub-Saharan Africa 0.085 0.014
Eastern Asia -0.041 -0.088
South/Eastern Europe 0.001 -0.024
MENA -0.249** -0.389***
Muslim countries -0.034 -0.060 Oil countries 0.043 0.045 observations 55,050 133,612
Controlling also random intercept, and for GDPc and its square

Random education model: widely different effects of education on FLFP in regions
Effect of education on FLFP largest in MENA, lowest in the West

More generally, effect of high education highest when FLFP among uneducated low

In sum
• If culture is to “explain” FLFP, it should have:– The “right” macro impact across countries– At the micro within country-level: a differential
impact on the uneducated (large) and the educated (small)
– Moreover, the question about the “meaning” of education remains – is it measuring other more theoretically relevant variables?

2. Patriarchal culture
• Patriarchal Values (PV) involve a gender division of labor
• Definition: average of a 3 variables index (standardized within 0-1 range):
1. When jobs are scarce, men should have more right to a job than women.
2. On the whole men make better political leaders than women do.
3. A university education is more important for a boy than for a girl.
• Use ML-model to look at within and across country determinants of PV

Values in regions (WVS)

Values 1 – individual effects - WVSFemale -0.097***
Edu middle (low – ref) -0.058***
High -0.107***
Married (single – ref) 0.012***
1 child (0 – ref) 0.005*
4 and more children 0.023***
Age <25 (>65 – ref) -0.035***
25 – 35 -0.039***
45 – 55 -0.045***
Religious faith 0.022***
Denom: None (Christ – ref) -0.016***
Muslim 0.042***

Values 2: regional effects – largest PV in MENA
South/Eastern Europe 0.123***
Latin America 0.026
Centr/South/Western Asia 0.257***
MENA 0.258***
Eastern Asia 0.222***
Sub-Saharan Africa 0.177***
Oil country 0.059**
Muslim country 0.027

Random slopes model
-- Regional differences in the effect of education on PV – effect muted in Mena (unlike effect of education on FLFP) -- Existence of a gender gap in PV, largest in MENA – this suggests HH bargaining can be an important part of the story

3. FPLP and culture

FLFP: a simple ML model
WVS Gallup
Edu middle (low - ref) 0.127*** 0.106***
Edu High 0.262*** 0.241***
Individual patriarchal values -0.023*** N.A
Country patriarchal values -0.094* -0.043
Latin America (West - ref) -0.139* -0.120*
Centr/South/Western Asia -0.087 -0.173*
Sub-Saharan Africa 0.189 0.057
Eastern Asia 0.084 -0.016
South/Eastern Europe 0.065 0.008
MENA -0.107 -0.280**

But
• Effects of PVs significant and regional dummies largely go away in WVS – not in Gallup, the difference probably due to personal
PV variable not available• But the effects of education on FLFP and culture
not in sync for MENA, suggesting that other variables need to be brought into play– Can we replace education by more behavioral
variables?– If culture matters, does the gender gap, which varies
widely by region, also make a difference?

4. New hypotheses – unbundling the effects of education
1. Emancipation: effect of education on values –by controlling for values
2. Wages: economic attraction of work – need to estimate HH income, and female marginal income
3. Bargaining power: education (of higher wages) confer more power within the HH, especially when the gender gap is large

Estimating marginal income
• WVS, Gallup provide HH income (WV relative, Gallup absolute)
• We estimate wife’s income as the difference between HH income of women that work, and that do not work, for each level of education, using Gallup
• We get one marginal income by country X education cell


Full modelWVS Gallup
Individual PV -0.021*** -0.029*** na naCountry values -0.093* -0.085 -0.029 -0.004Edu middle (Low – ref) 0.122*** 0.094***
Edu high 0.251*** 0.220***
HH incomeMarginal income 0.328*** 0.663***
Gender gap -0.019 -0.008 -0.019 -0.026Gender gap x Edu middle 0.033*** 0.013***
Gender gap x Edu high 0.069*** 0.018***
Gender gap x Marginal income 0.126*** 0.080***

Regional dummies and fitnessWVS WVS Gallup Gallup
South/Eastern Europe 0.051 0.085 -0.002 0.059
Latin America -0.117 -0.083 -0.115* 0.008
Centr/South/Western Asia -0.123 -0.087 -0.209* -0.121
MENA -0.142 -0.152 -0.306** -0.247*
Eastern Asia 0.066 0.092 -0.049 0.033
Sub-Saharan Africa 0.199 0.146 0.064 0.060
In Gallup, regional dummies do not go away, probably because personal values are missing. Also, fitness of model does not improve compared to model 2.
In WEVS on the other hand, all regional dummies go away, and the model has a better fit than model 2.

Main findings
• Individual values, marginal income, and gender gap the main determinants of regional variations -
• Thus policy can have a great influence: education and higher wages can beat “culture”