The Effect of Minimum Wage on Employment in Malta The Effect of Minimum Wage on Employment in Malta...
26
1 The Effect of Minimum Wage on Employment in Malta Melchior Vella and Lino Briguglio Department of Economics, University of Malta 2014
Transcript of The Effect of Minimum Wage on Employment in Malta The Effect of Minimum Wage on Employment in Malta...

1
The Effect of Minimum Wage on Employment in Malta
Melchior Vella and Lino Briguglio
Department of Economics, University of Malta
2014

2
Abstract
This study analyses the relationship between the effect of changes in the national minimum wage on
labour demand, measured by aggregate hired employment, using data pertaining to Malta for 1975-
2011. The findings indicate that employment is influenced by changes in GDP and by the average
wage rates, and that there is a positive relationship between the average wage rate and the minimum
wage rate, with a lag on one year. This implies that employment is negatively related to the minimum
wage, via the latter‟s effect on the average wage rate. The study concludes that, the estimated
elasticities of labour demand with respect to the minimum wage rate are -0.2 in the short run and -0.5
in the long run, everything else remaining constant.
Keywords: Labour Demand, Labour Force and Employment, Size, and Structure, Wages,
Compensation, and Labour Costs

3
The Effect of Minimum Wage on Employment in Malta
1. Introduction
There is considerable debate on the effect of the imposition of a national minimum wage on
employment. Views on the minimum wage are various but can be grouped under two headings. The
neo-classical view argues that if the minimum wage is set above the equilibrium wage rate, the result
would be deficient demand unemployment. By contrast, advocates of a wage floor postulate that a
minimum standard of living is imperative in safeguarding human capital in terms of health and
strength, which yields to higher productivity.
The effects of minimum wage legislation on employment have been widely examined in
economic literature. The effects on aggregate employment were first discussed in Stigler (1946, p.
361), who adopted the neo-classical position that “the higher the minimum-wage, the greater will be
the number of covered workers who are discharged.” Neumark and Wascher (2008) demonstrated that
an arbitrary minimum wage above equilibrium has two side-effects. First, both cost of production and
price of output increase, and quantity demanded falls, which leads to an output gap. Second, a
minimum wage induces firms to substitute capital for labour creating a disemployment effect. By
contrast, economists of the Keynesian school of thought (Herr et al., 2009) considered the minimum
wage as a “nominal anchor” which prevents deflation circumstances in the real economy.
A standard model where a minimum wage brings about positive employment effects arises
within a monopsonistic employer, where firms have a degree of discretion in wage-setting, say, due to
geographical immobility. This effect was first noted in Robinson (1933) who argued that the
imposition of a binding minimum wage on a non-discriminating monopsony can increase employment
(cited in Neumark and Wascher, 2008), if not fixed too high. Up until recently monopsony models
4
were not deemed relevant (Brown, 1999), as one-company towns are rare in a globalised world.
However, there are instances whereby monopsony power still exists.1
An overview of the literature survey relating to important empirical studies is provided in Vella
(2013). Vella argues that early studies mainly used time-series methods and typically found that a 1%
increase in minimum wage reduced employment by 0.1% to 0.3% (Brown et al., 1982; Brown, 1988).
By contrast, these conclusions were challenged by Card and Krueger (1995a, b) on methodological
considerations as well as on empirical results. These studies using longitudinal data analysed specific
cases of minimum wage increases on specific industries or states. Their key aspect was that by using
the difference-in-difference approach, variation in minimum wage at a point in time is investigated to
identify its effects. A famous example of research is by Card and Krueger (1994) who classify
countries that changed the minimum wage as the treatment group whilst other countries which were
left unexposed to the treatment are set as the control variables. The assumption is that changes in
employment in the control groups only reflected fluctuating economic conditions. Treatment groups,
however, were affected both by similar economic conditions and by the change in the minimum wage
legislation. By comparing changes in employment in both groups, they netted out the effects of
changes in economic conditions and determined the effect of minimum wage on employment. The
authors concluded that a minimum wage increase may not have had any adverse employment effects.
An alternative method for analysing effects of minimum wage on employment is by using
pooled cross-section or longitudinal data. They produce weaker evidence on the impact of minimum-
wage than time-series studies. By way of example Comola and Mello (2011, p. 81) observed that “in
many cross-sectional studies the estimated employment elasticity of the minimum wage is statistically
insignificant.” These are deemed reliable, nevertheless, as they allow for greater variation in relative
minimum wage rates across employees, employers, or regions (Card and Krueger, 1995a).
1 A case in point is the restaurant industry, whereby workers receive tipped income which is inversely related to
employment, so that the basic wage bill will have to increase to restore the lost income (Wessels, 1997). This
empirical research concludes that just like in a monopsony there is a positive relationship between minimum-
wage and employment.
5
The literature is therefore ambiguous and no hard and fast conclusions can be drawn from
studies on this subject (Stewart, 2004). As Lemos (2004, p. 219) states “there is no consensus on the
direction and size of the effect on employment.”
There has not been much research on the impact of the minimum wage on employment in
Malta. This is surprising considering that the minimum wage covers all Maltese workers and it has
been consistently argued by employers‟ associations that any wage increases beyond productivity
gains would threaten Malta‟s competiveness (Malta Chamber, 2013; Malta Employers‟ Association,
2009). In contrast, it was recently suggested by Caritas Malta (2012) that an increase in the minimum
wage rate by 13.8% is warranted, as the prevailing rate was too low to cover the cost of living of low
income families.
Given this disagreement, as well as the current economic climate, this article discusses the
extent to which minimum wage affects employment in Malta. In this study, the hypothesis to be tested
is that an increase in minimum wage negatively affects employment, keeping all other things constant.
This paper is organised as follows. Following this introduction, the study briefly presents the
most important features of the system of the minimum wage, while Section 3 presents an appraisal of
views amongst social partners in Malta. Section 4 presents an overview of trends in labour demand
variables during the study period, followed by Section 5 which discusses some methodological issues
and the estimation procedure. Section 6 estimates the impact of minimum wage on employment in
Malta over the period 1975 to 2011, while the last section concludes with a number of policy
implications.
2. The System of Minimum Wage in Malta
The national minimum wage was introduced on December 2, 1974, through the Conditions of
Employment (Regulation) Act, commonly known as CERA, with the aim of “ensuring an equitable
distribution of income…[and]…narrowing the wide differences between income earners”
(Development Plan for Malta 1973-1980 Supplement, 1977, p. 14). CERA was responsible for the
6
provision of minimum conditions in various sectors (Greenland, 2012). There were earlier attempts at
imposing a minimum wage in the Maltese industrial sectors such as the Stevedores and Port Workers
Ordinance of 1939 and the Factories Ordinance of 1940 (Baldacchino, 2011). Between 1974 and
1976, the national minimum wage varied by approximately 20 % between male and female workers
until the „equal pay equal work‟ policy was introduced in 1976 which ended minimum gender pay
discrimination.
During the past two decades or so, the Maltese national minimum wage has been set by the
Government in the National Minimum wage Standard Order on the recommendation of the
Employment Relations Board, a tripartite body compromising four representatives of employees and
four representatives of employers, together with four members appointed by the Government. In
addition, the Standard Order applies to all workers, except to those covered by sectoral regulation
orders, in which case, the minimum wage in the sectoral regulation order applies. Before the
enactment of the Employment and Industrial Relations Act (2002), these were established with the
recommendations of the relevant Wage Councils. The Wages Councils are now acting as sub-
committees to the Board. Moreover, different minimum wage rates for workers aged: under 17 years,
17 years, and 18 years and over apply. The Standing Order sets the minimum wage on weekly basis.
The statutory national and sectoral minimum wage generally increases annually, and is
announced in the Government Budget Speech in November of each year. It is an amount over and
above the increases stipulated by collective agreements, taking effect every January 1 of the following
year (Attard, 2010). The adjustment is currently based on a system, labelled Cost of Living
Adjustment (COLA) which was agreed upon in December 1990, between employer organizations,
unions, and Government. The COLA is calculated on the basis of a twelve-month moving average
inflation rate as at September multiplied by the base wage, where the official index of inflation is the
Retail Price Index. The base wage represents a wage level agreed upon in 1990 and which has since
then been augmented annually by the COLA.
One characteristic of the COLA, is that, unlike other forms of wage indexation observed in
European countries, compensation is granted by a flat amount, independent of the wage level, rather
than a percentage indexation of all wage levels by inflation. Hence, the negative effect of wage

7
indexation on competitiveness is smaller at higher wage levels relative to the base wage.2 This implies
that since the COLA has only augmented the minimum wage over the majority of the sample period,
the elasticity of average wage to minimum wage is expected to be positive and less than one.
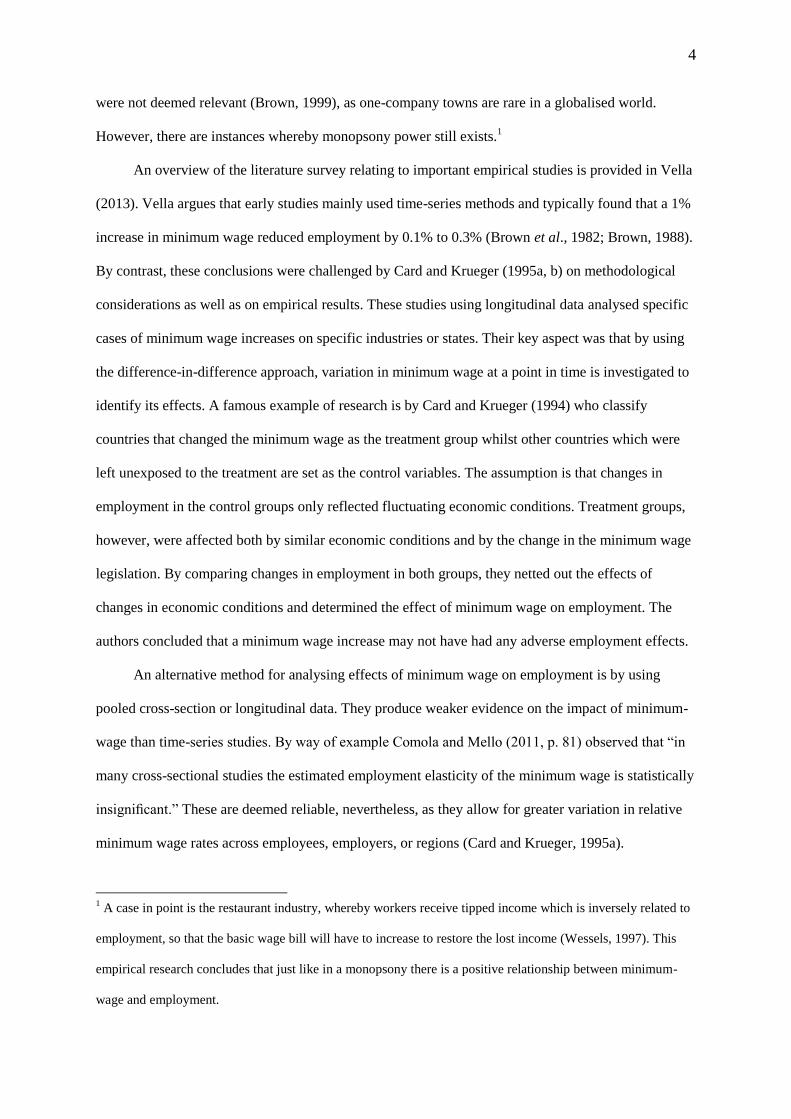
Figure 1 illustrates how minimum wage in Malta, measured in nominal and real terms, changed
since 1974. The national minimum wage has gone up from €23.29 per week in 1974 to €153.45 per
week in 2013. The only uninterrupted period where a contraction in real terms was registered is 1981-
1989. The centralised agreement in the early 1990s led to moderate increases. In the period 2000 to
2013 the nominal minimum wage increased at about 3% per annum.
Figure 1. National minimum wage in real terms, 1974-2011, 2005=100 RPI, € rate per week
Source: Department of Industrial and Employment Relations, Own calculations
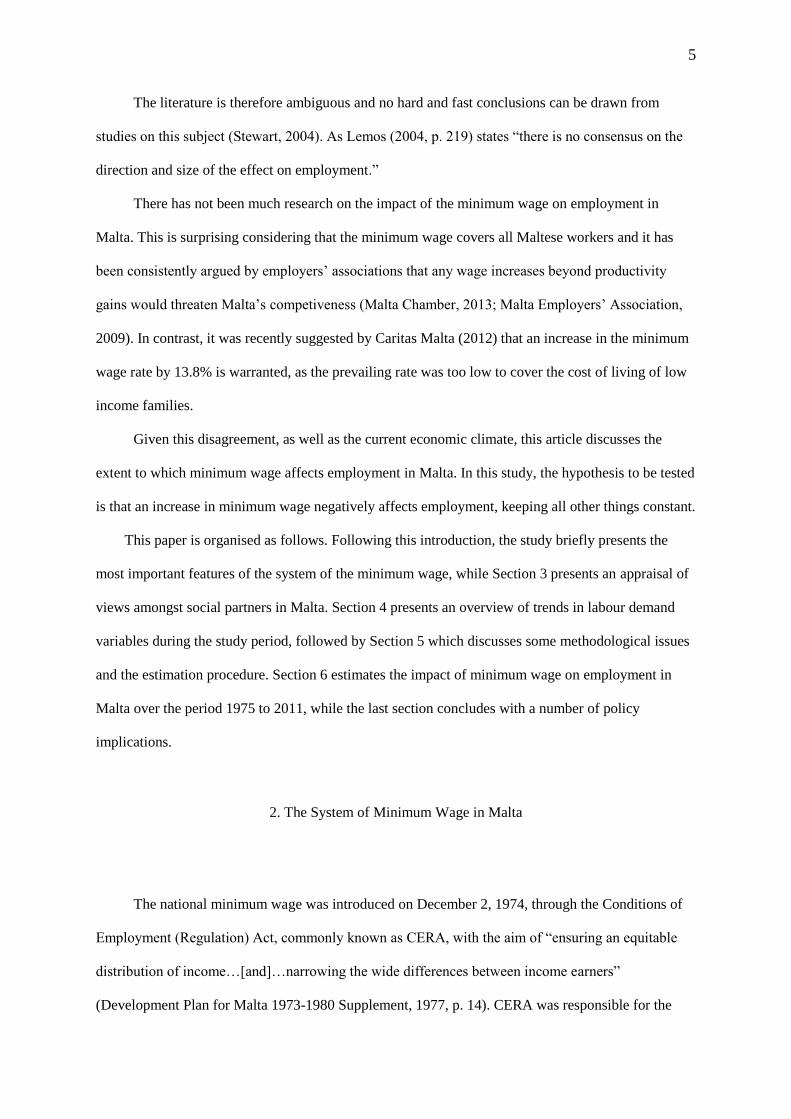
Figure 2 shows the relationship between the minimum wage and the average wage rate in
Malta, calculated as the first year-on-year difference of logarithmic change for both variables. It
2 The National Agreement on Industrial Relations provides for opt-out clauses from giving the COLA in times
of restructuring or competitiveness challenges. Examples include prolonged recession, decline in private sector
employment, and unanticipated inflation. This agreement also stipulates that opt-out clauses apply at micro
level. Such clauses allow a certain degree of wage flexibility at enterprise level when most needed.
0
20
40
60
80
100
120
140
160
1974 1977 1980 1983 1986 1989 1992 1995 1998 2001 2004 2007 2010
Year
Minimum Wage Rate (at market prices)
Real Minimum Wage Rate (at 2005 prices)

8
appears from the figure that changes in minimum wage may have affected the average wage rate with
a lag of one year.
Figure. 2. Annual Percentage Rates of Change of Average Wage and Minimum Wage in Real Terms,
1975-2011, 2005=100 GDP Deflator, in logarithmic scale
Source: Department of Industrial and Employment Relations, Own calculations
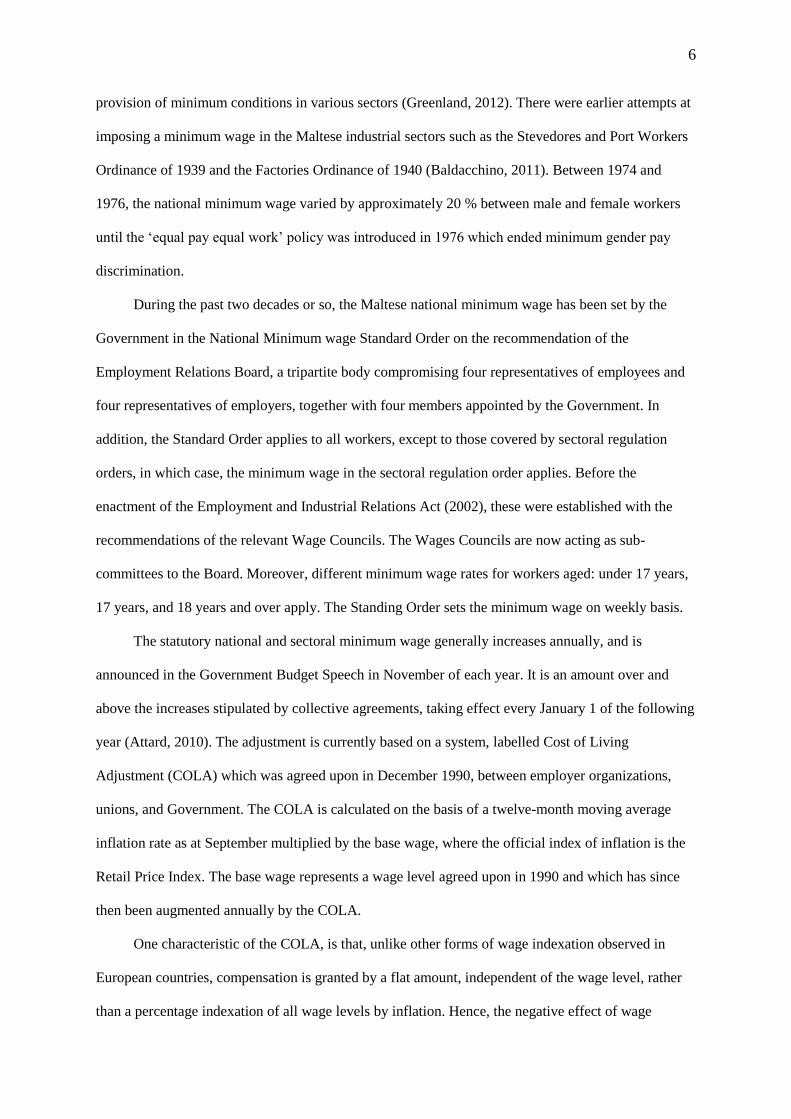
Minimum wages are often expressed relative to average earnings to determine how they fit the
existing wage distribution of a particular country. A measure, which takes into account the relative
changes of minimum wage to average wage, is the Kaitz Index. The Index is calculated by the
following formula:
The index was applied to Maltese data as shown in Figure 3.
-0.06
-0.05
-0.04
-0.03
-0.02
-0.01
0
0.01
0.02
0.03
0.04
0.05
0.06
1975 1978 1981 1984 1987 1990 1993 1996 1999 2002 2005 2008 2011
Change in Minimum-Wage
Change in Average Wage
9
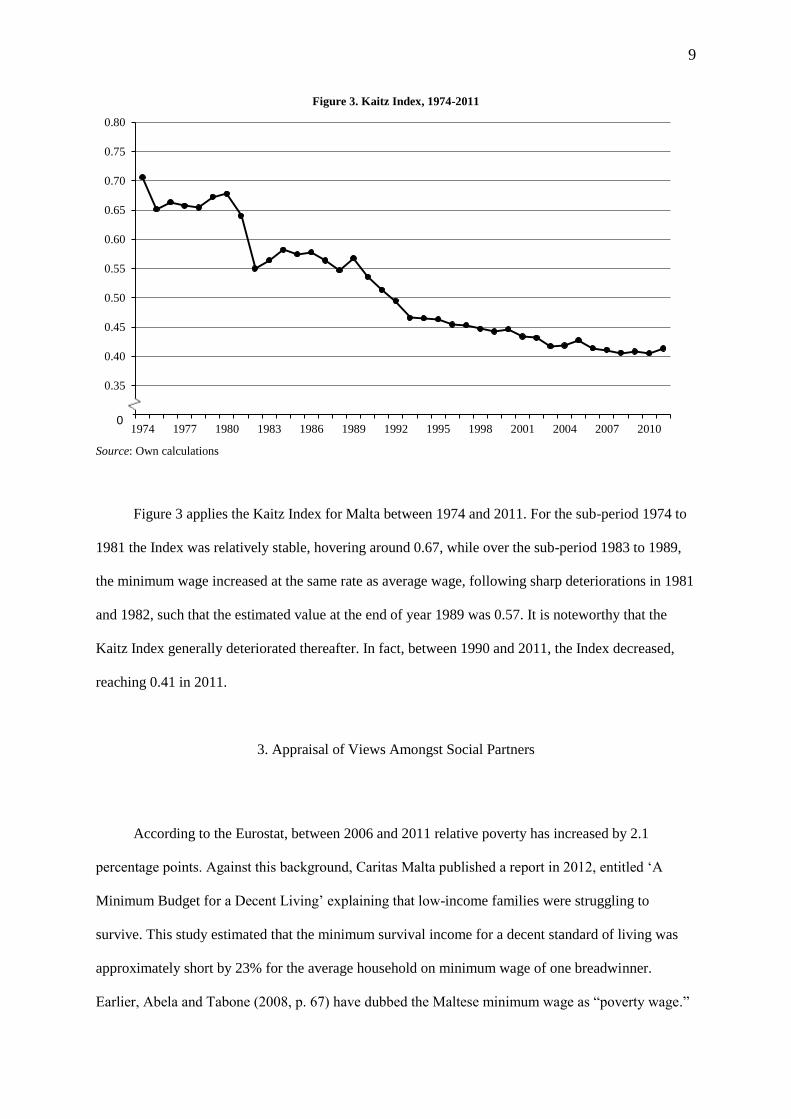
Figure 3. Kaitz Index, 1974-2011
Source: Own calculations
Figure 3 applies the Kaitz Index for Malta between 1974 and 2011. For the sub-period 1974 to
1981 the Index was relatively stable, hovering around 0.67, while over the sub-period 1983 to 1989,
the minimum wage increased at the same rate as average wage, following sharp deteriorations in 1981
and 1982, such that the estimated value at the end of year 1989 was 0.57. It is noteworthy that the
Kaitz Index generally deteriorated thereafter. In fact, between 1990 and 2011, the Index decreased,
reaching 0.41 in 2011.
3. Appraisal of Views Amongst Social Partners
According to the Eurostat, between 2006 and 2011 relative poverty has increased by 2.1
percentage points. Against this background, Caritas Malta published a report in 2012, entitled „A
Minimum Budget for a Decent Living‟ explaining that low-income families were struggling to
survive. This study estimated that the minimum survival income for a decent standard of living was
approximately short by 23% for the average household on minimum wage of one breadwinner.
Earlier, Abela and Tabone (2008, p. 67) have dubbed the Maltese minimum wage as “poverty wage.”
0.30
0.35
0.40
0.45
0.50
0.55
0.60
0.65
0.70
0.75
0.80
1974 1977 1980 1983 1986 1989 1992 1995 1998 2001 2004 2007 20100

10
The Caritas Malta study stimulated a national debate and was discussed in the Malta Council for
Economic and Social Development (MCESD Meeting 186, 2012) which is an Institution seeking to
attain consensus amongst trade unions, employers‟ associations, and the Government (known in Malta
as the social partners). Considerations relating to equity were expressed, suggesting that an upward
adjustment alleviate relative poverty, especially for the working poor (Caritas Malta, 2012). The
objections included that raising minimum wage would have adverse effects on Malta‟s
competitiveness. Particularly, it was asserted that raising the minimum wage would lead to
inflationary pressures, cause unemployment and increases the incidence of underground employment
(Malta Employers‟ Association, 2012a, b).
In examining views about minimum wage, due to Malta‟s limited natural resources endowment,
the concern amongst social partners and governments has always been related to competitiveness. As
observed by Debono and Rizzo (2009), social partners agree that the national minimum wage is
fundamental to ensure a minimum standard of living. However, disagreements are expressed
regarding the automatic granted statutory changes in minimum wage. Employers contend that wages
should be topped only if these are matched productivity increases, and any increments beyond
productivity gains jeopardize Malta‟s competiveness (Malta Employers‟ Association, 2009; Malta
Chamber, 2013). Amongst employers some argue that the COLA mechanism should apply only to
low-wage earners only (Malta Employers‟ Association, 2012a, b). By contrast unions support
automatic increases given across the board, contending that the purchasing power of minimum wage
earners should be maintained.
4. Changes in Labour Demand Variables
Table 1 presents the average annual rate of change of the main variables associated with the
Maltese aggregate labour demand. The analysis is applied to the period 1975–2011, and this period is,
in Table 1, divided into eight-yearly sub-periods. The general conclusion that emerges from Table 1 is
that the 1980-1984 sub-period saw the worst performance in employment. The 2000-2004 sub-period

11
was also difficult, although less than that of the first half of the eighties. The fastest rates of increase
in employment occurred during the 1975-1979 and 1985-1989 sub-periods. It is interesting to note
that between 1990 and 2011 there was positive trend in aggregate employment.
Table 1.
Percentage annual rate of change of labour demand variables. Averages for 1975-2011 and sub-periods.
1975-79 1980-84 1985-89 1990-94 1995-99
Wage and salary
earners (FTE) 3.39 -1.07
* 3.26 1.22 1.35
Real GDP at factor cost 14.14 2.87 4.23 5.54 4.69
Real average wage 9.34 4.08* 0.23
* 5.00 3.22
2000-04 2005-09 2010-11 1975-2011
Wage and salary
earners (FTE) 0.97
* 1.45 1.81
* 1.53
Real GDP at factor cost 0.77* 3.26
* 2.61
* 4.88
Real average wage 0.96* 1.11
* -0.88 3.18
*Indicates that the estimate was not different from zero at the 95% level of statistical significance
It can be seen in Table 1 that the early eighties were characterised by the most severe
contraction in economic output during our study period. The period, which saw the highest increase in
GDP, was 1975-1979 that also experienced extension of social welfare programs. It appears that GDP
growth have tended to decrease until 1980-1984, rising again till 1990-1994, and generally declining
thereafter. As expected, the rate of change of employment was smaller than that of GDP. This would
seem to suggest that during the study period, additional output might be partially produced by
overtime work in the short-run. The findings will be useful regarding the response of labour demand
to change in output in the short-run and the long-run.
During the period of study Table 1 also shows the changing level of average earnings measured
in real terms. It appears that average wage rate between 1975 and 1979 has increased rapidly. The
opposite was the case during the eighties, when the wage-freeze policy was operative in Malta, and
between 2010 and 2011. For the period starting from 1990 to 1994 employee compensation increased
overwhelming, however, generally increasing at a diminishing rate thereafter.

12
5. Methodology
The methodological framework proposed in this study takes a three-step technique. First, the
elasticity of labour demand with respect to the average wage rate is estimated from a labour demand
equation derived from the C.E.S. production function. In the second step, the elasticity of the average
wage rate to the minimum wage rate is estimated from an equation linking the two variables. In the
final step, the product of the elasticities derived from the first and second step yields the elasticity of
minimum wage with respect to employment.
(a) Specification of labour demand
The approach used in this study is to use the marginal productivity condition of the C.E.S.
production function to derive a labour demand equation (Briguglio, 1984, 1985). The production
function can be expressed as:
where is net-output, is demand for labour, is capital, and is the state of technology.
From which the marginal productivity condition, expressed in logs is:
where is the average wage rate, and is the state of technology in each period, taking the
value of , where is the number of years in the sample, and is the error term.
The equation assumes full adjustment of labour demand to wage rates, output and technology
denoted by , where is the desired demand for labour.
By incorporating a partial adjustment scheme

13
where and are the actual (or observed) labor demand at time and while is the
desired labour demand at time we will obtain the following short term labour demand equation.
1
The adjustment coefficient, , is expected to have positive value not exceeding unity. The
adjustment would be full if . Partial adjustment implies that is a positive fraction. Therefore,
is the speed of adjustment.
The coefficient on the wage rate, measures the elasticity of substitution, which is the
responsiveness of percentage change in factor proportions brought about by percentage change in
factors‟ relative prices. This parameter has important implications for policy-makers as its magnitude
sheds light on the extent to which wage policy measures can succeed in influencing factor
proportions. For example, if the elasticity of substitution is close to zero, it is implied that an increase
in wage rate is unlikely to induce firms to substitute labour for capital because there is little
opportunity of substitution between inputs.
Another parameter that is of special interest is the output elasticity of labour demand, measured
by . This quantifies the responsiveness of labor demand to output whereby an expansion of output
by a firm is expected to favourably affect labour demand.
According to equation 1, the estimates of and measure the short-run and the long-run
elasticity of substitution, respectively. This implies that if is found to be equal to zero, and
consequently equal to unity, it is assumed that there is full-adjustment; indicating that the short-run
and long-run labour demand equations coincides

14
(b) Relationship between average wage and minimum wage
This study adopts a simple and intuitive approach relating to the link between the average wage
rate with the minimum wage rate as follows:3
2
where is the wage rate at time and represents the minimum wage lagged by one
year. It is assumed, that the lag of one year represents the time taken for the effect of the minimum
wage to being felt on the average wage – an observation made above with regard to the data. The
parameter measures the elasticity of average wage rate with respect to the minimum wage. It can
be argued that an increase in minimum wage causes an upward push on average wage in two ways
(Bazen and Martin, 1991). First, firms tend to substitute away from unskilled minimum wage earners
to other inputs, such as skilled workers, which are now relatively less expensive. Therefore, firms are
willing to accept higher wage bills in response to an increase in demand (the substitution effect).
Second, firms have an incentive to raise wage rates to prevent workers from producing less than the
optimal level of productivity, due to unfavourable work comparisons. The size of increase depends on
the elasticity of substitution of alternative types of labour (the equity effect).
(c) Estimation Procedure
Equation 1 expresses the labour demand function, in which stands for aggregate employment
in full-time equivalent, stands for average employee compensation measured in real terms,
stands for the gross value added also measured in real terms, and is the state of technology in each
period, taking the value of , where is the number of years in the sample. In equation 1 both
and were normalised by the GDP deflator.
3 An alternative approach is presented in Appendix A.

15
Equation 2 expresses the relationship between average wage and minimum wage, in which
is average employee compensation measured in real terms, and stands for minimum wage
measured in real terms. In equation 2 both variables were deflated by the Retail Price Index.
We expect the parameters on and to be negative and that on to be positive. As
already noted, the coefficient on is expected to have a positive numerical value of between 0
and 1.
Both equations 1 and 2 were estimated by OLS. Before running the regression model it is to be
noted that the use of OLS relies on stochastic process being stationary as otherwise it would produce
spurious regression with high and t-values that have no economic meaning. In this case, all
variables were found integrated of order-one, using the Augmented Dickey-Fuller (ADF) test. To
solve this problem of nonstationarity all variables were measured in first difference as otherwise the
standard asymptotic assumptions do not hold with nonstationary data.
It is pertinent here to explain the difference between equilibrium and disequilibrium in the
labour market as explained in Briguglio (1984). In the real world, wage rates may not be equal to their
equilibrium level and may not therefore clear the market in all periods. This means that excess supply
of and excess demand for employment may exist and persist. Therefore it is reasonable to assume that
labour market may not clear, in which case it would not be correct to assume that employment
measures labour demand. Thus if there is excess supply in the market, the observed labour transacted
in the market will actually represent labour demand, but if there is excess demand, the observed
labour transacted will represent labour supply. This is called the „short-side‟ of the market.
In addition, it is assumed that certain rate of unemployment is compatible with excess demand
in line with the Phillips Curve where a positive unemployment rate of 4% might signify full
employment. It appears from screening of data4 that a 4% rate of unemployment was compatible with
4 The unemployment rate data for many years rested only on head-count computation of registered full-time
unemployed. The rate of unemployment is computed as where is a 12-month
average number of persons registering as unemployed in year t and is the number of gainfully occupied
persons.
16
full employment in Malta.5 It was therefore decided that observed employment was considered as
representing labour demand in periods when unemployment was 4% or higher; meaning that during
these years there was excess supply and consequently labour demand was observed.
6. Estimated Results
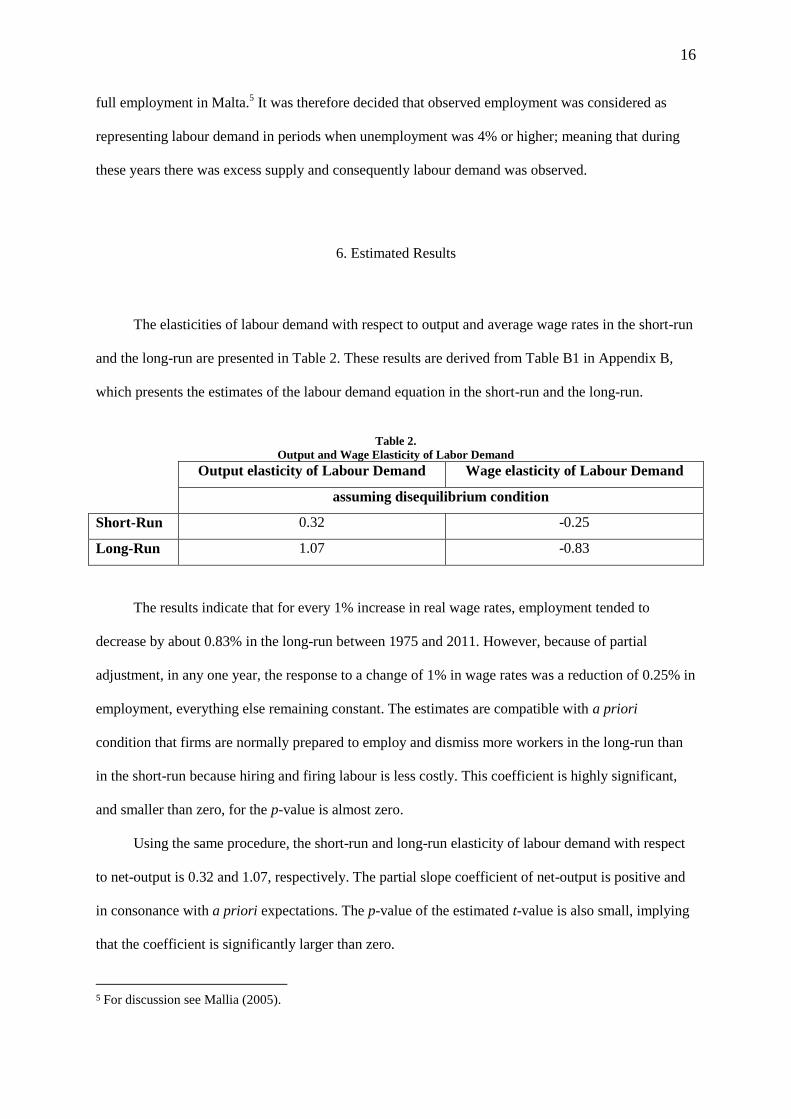
The elasticities of labour demand with respect to output and average wage rates in the short-run
and the long-run are presented in Table 2. These results are derived from Table B1 in Appendix B,
which presents the estimates of the labour demand equation in the short-run and the long-run.
Table 2.
Output and Wage Elasticity of Labor Demand
Output elasticity of Labour Demand Wage elasticity of Labour Demand
assuming disequilibrium condition
Short-Run 0.32 -0.25
Long-Run 1.07 -0.83
The results indicate that for every 1% increase in real wage rates, employment tended to
decrease by about 0.83% in the long-run between 1975 and 2011. However, because of partial
adjustment, in any one year, the response to a change of 1% in wage rates was a reduction of 0.25% in
employment, everything else remaining constant. The estimates are compatible with a priori
condition that firms are normally prepared to employ and dismiss more workers in the long-run than
in the short-run because hiring and firing labour is less costly. This coefficient is highly significant,
and smaller than zero, for the p-value is almost zero.
Using the same procedure, the short-run and long-run elasticity of labour demand with respect
to net-output is 0.32 and 1.07, respectively. The partial slope coefficient of net-output is positive and
in consonance with a priori expectations. The p-value of the estimated t-value is also small, implying
that the coefficient is significantly larger than zero.
5 For discussion see Mallia (2005).

17
Empirical data show that labour demand has increased over time despite the fact that wage rates
have also increased. One reason is that as wages were rising, output was rising too. During the study
period, the negative effects of wage rates on labour demand have been more than offset by the
positive effect of output, as indicated by the coefficient on these variables.
The regression analysis of the average wage relationship as per equation 2 indicates the
existence of a positive relationship between average and minimum wage lagged by one year. This
equation is similar to Bazen and Martin (1991), in which their approach is based on the assumption is
that workers have a „target‟ real wage which itself is a function of inter alia labour productivity, real
minimum wage, and unemployment rate.
The national minimum wage elasticity with respect to average wage is estimated to be 0.60
between 1975 and 2011. The nature and size of coefficient agree with our a priori expectations and
both the individual and joint null-hypothesis are rejected at 1% level. It is to be noted that this is a
mechanical interpretation of the coefficient. Note that the r-squared is low signifying nonsystematic
factors on the minimum wage were substantial.6
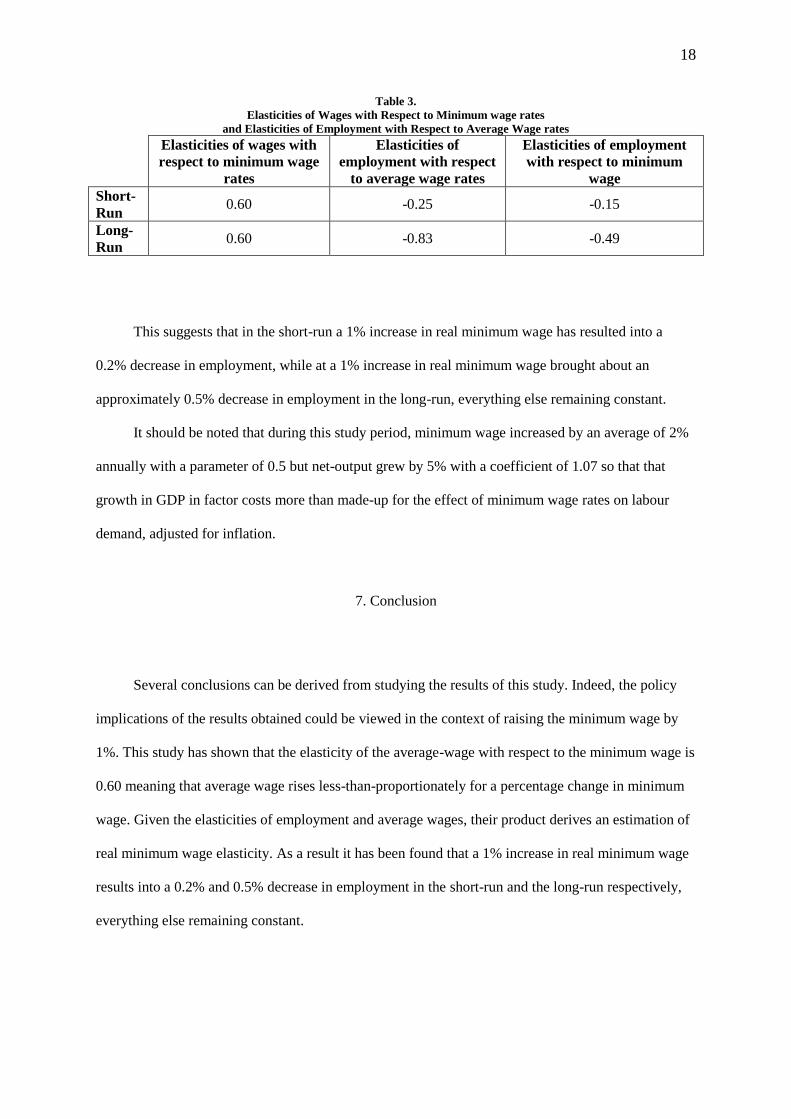
(a) Computing the employment: minimum wage elasticity
Given the elasticities of employment with respect to the average wage rate and that of the
average wage rates to the minimum wage rate, we derive an estimation of effect of the minimum
wage rate on employment as the product of the two elasticity estimates, as shown in Table 3.
6 Compared with the results of other comparable studies, the reported estimated elasticities are similar to those
obtained by Bazen and Martin (1991) {-0.2 to -0.23} and Neumark and Wascher in 2000 {-0.1 to -0.3}.
18
Table 3.
Elasticities of Wages with Respect to Minimum wage rates
and Elasticities of Employment with Respect to Average Wage rates
Elasticities of wages with
respect to minimum wage
rates
Elasticities of
employment with respect
to average wage rates
Elasticities of employment
with respect to minimum
wage
Short-
Run 0.60 -0.25 -0.15
Long-
Run 0.60 -0.83 -0.49
This suggests that in the short-run a 1% increase in real minimum wage has resulted into a
0.2% decrease in employment, while at a 1% increase in real minimum wage brought about an
approximately 0.5% decrease in employment in the long-run, everything else remaining constant.
It should be noted that during this study period, minimum wage increased by an average of 2%
annually with a parameter of 0.5 but net-output grew by 5% with a coefficient of 1.07 so that that
growth in GDP in factor costs more than made-up for the effect of minimum wage rates on labour
demand, adjusted for inflation.
7. Conclusion
Several conclusions can be derived from studying the results of this study. Indeed, the policy
implications of the results obtained could be viewed in the context of raising the minimum wage by
1%. This study has shown that the elasticity of the average-wage with respect to the minimum wage is
0.60 meaning that average wage rises less-than-proportionately for a percentage change in minimum
wage. Given the elasticities of employment and average wages, their product derives an estimation of
real minimum wage elasticity. As a result it has been found that a 1% increase in real minimum wage
results into a 0.2% and 0.5% decrease in employment in the short-run and the long-run respectively,
everything else remaining constant.

19
In answering the question whether minimum wage should be increased, decreased or entirely
abolished, one should look at the minimum wage from various aspects, and not just at its effect on
labour demand.
The minimum wage arrangement has major social repercussions. Periodic increases in
minimum wage are intended to compensate low wage earners for inflation, although this is not so for
higher wage earners, given that it is granted at a flat rate. The basic idea is that minimum wage covers
basic needs of the average family and a decline in its purchasing power would result in economic
hardship and poverty.
Changes in minimum wage should also be viewed from the labour supply side perspective. If
there is no minimum wage adjustment labour supply might be affected negatively because low-paid
market activities become less attractive, particularly because of the small difference between social
allowances and the minimum wage.7 A small benefit-wage gap could reduce the opportunity cost of
unemployment, because social benefits could be difficult to renounce especially if remuneration
packages are low. Indeed, a recent study by the Employment and Training Corporation (ETC) found
that a low benefit-wage gap is one of the main factors that constrain low-income persons in finding a
job.
7 On this issue see Zerafa (2007).

20
References
Abela, A. & Tabone, C. (2008), Family poverty and social exclusion with a special emphasis on
children. Kummissjoni Nazzjonali Familja, Malta.
Attard, J. (2010), Industrial Relations in Malta: Revised Legislation, Miller Distributors Limited,
Malta.
Baldacchino, G. (2011), “National Labor Law Profile: Malta”, available at:
http://www.ilo.org/ifpdial/information-resources/national-labour-law-
profiles/WCMS_158914/lang--en/index.htm (accessed 20 November 2012).
Bazen, S. & Martin, J.P. (1991), “The Impact of the Minimum Wage on Earnings and Employment in
France”, OECD Economic Studies, Vol. 16 Spring, pp. 199-221.
Briguglio, L. (1987), “Disequilibrium Labour Market Models: A Diagrammatic Approach”, Economic
and Social Studies, Vol. 4, pp. 51-69.
Briguglio, L. (1985), “The Specification and Estimation of the Labour Demand Relation: Survey of
the Literature”, Economic and Social Studies, Vol. 2, pp. 33-57.
Briguglio, L. (1984), “The Specification and Estimation of a Disequilibrium Labor Market Model”,
Applied Economics, Vol. 16, pp. 539-554.
Briguglio, L. (1982), The Specification and Estimation of Model for the Maltese Aggregate Labor
Market. Unpublished doctoral dissertation, University of Essex, United Kingdom.
Brown, C. (1999), “Minimum Wages, Employment, and the Distribution of Income”, in O.
Ashenfelter & D. Card (eds.), Handbook of Labor Economics, (3rd edn.), Elsevier Science B.V,
Amsterdam, pp. 2101-2163.
Brown, C. (1988), “Minimum Wage Laws: Are They Overrated?”, Journal of Economic Perspectives,
Vol. 2, pp. 133-145.
Brown, C., Gilroy, C., and Kohen, A. (1982), “The Effect of the Minimum Wage on Employment and
Unemployment: A Survey”, Journal of Economic Literature, Vol. 20 No. 2, pp. 487-258.
21
Card, D. & Krueger, A. (1995a), Myth and Measurement: The New Economics of the Minimum Wage,
Princeton University Press, New Jersey.
Card, D. & Krueger, A. (1995b), Time-Series Minimum wage Studies: A Meta-analysis. The
American Economic Review, Vol. 85 No. 2, pp. 238-243.
Debono, M. & Rizzo, S. (2009), “Malta: Wage Formation”, available at:
http://www.eurofound.europa.eu/eiro/studies/tn0808019s/mt0808019q.htm (accessed 20
October 2012).
Employment and Training Corporation. (2007), Lone Mothers on Benefits: Their Work Aspirations
and Experiences. ETC, Malta.
Farrugia, K., Mckay, L., Sammut, J. & Piscopo, S. (2012), A Minimum Budget for a Decent Living: A
research study by Caritas Malta focusing on three low-income household categories. Caritas
Malta, Malta.
General Workers‟ Union. (2012), “Il-GWU Mħassba Serjament Dwar l-Għoli tal-Ħajja”, available at:
http://www.gwu.org.mt/news/1927-details.aspx (accessed 22 April 2012).
Greenland, C. (2012), The Evolution of Collective Agreements, Miller Union Press: Malta.
Herr, H., Kazandziska, M. & Mahnkopf-Praprotnik, S. (2009). The Theoretical Debate about
Minimum Wages (Global Labor University Working Papers No. 6).
Koutsogeorgopoulou, V. (1994), “The Impact of Minimum Wages on Industrial Wages and
Employment in Greece”, International Journal of Manpower, Vol. 15 No. 2, pp. 86-99.
Layard, R., & Bean, C. (1989), “Why does unemployment persist?”, Scandinavian Journal of
Economics, Vol. 91 No. 2, pp. 371-396.
Lemos, S. (2004), “Minimum Wage Policy and Employment Effects: Evidence from Brazil”,
Economía, Vol. 5 No. 1, pp. 219-226.
Malta Council of Economic and Social Development. (2012), “Council Meetings”, available at:
http://www.mcesd.org.mt/mcesd/content.aspx?id=101564 (accessed 15 December 2012).
Mallia, M, (2005), “The Maltese Labor Market and Frictional Unemployment”, Bank of Valletta
Review, Vol. 32, pp. 47-61.
22
Malta Chamber. (2013), “Policies: The Malta Chamber of Commerce, Enterprise and Industry”,
available at http://www.maltachamber.org.mt/content.aspx?id=180094 (accessed April 22
2013).
Malta Employers‟ Association. (2012a), Social Policy Measures for a Decent Living: A Response by
the Malta Employers’ Association to the Caritas Study. Malta Employers' Association: Malta.
Malta Employers‟ Association. (2012b), Strength in Unity: A Memorandum to Political Parties, Malta
Employers' Association, Malta.
Malta Employers‟ Association. (2009), Report on Survey: Impact of COLA on Employers in Times of
Recession. Malta Employers' Association, Malta.
Neumark, D. & Wascher, W. (2008), “The Effects of Minimum Wages on Employment” in Minimum
Wages, (1st edn.), MIT Press, USA, pp. 37-106.
Neumark, D. & Wascher, W. (2000), “Minimum Wages and Employment: A Case Study of the Fast-
Food Industry in New Jersey and Pennsylvania: Comment”, American Economic Review, Vol.
90 No. 5, pp. 1362-1396.
Nickell, S.J. & Andrews, M. (1983), “Unions, Real Wages and Employment in Britain 1951-79”,
Oxford Economic Papers, Vol. 35 November, pp. 183-206.
Office of the Prime Minister. (1977), Development Plan for Malta Supplement 1973-1980. Economic
Division: Malta.
Stewart, M. (2004), “The impact of the introduction of the UK minimum wage on the employment
probabilities of low wage workers”, Journal of the European Economic Association, Vol 2, pp.
67-97.
Vella, M. (2013), The Impact of the National Minimum Wage on Employment in Malta. Unpublished
dissertation, University of Malta, Malta.
Wessels, W. (1997), “Minimum Wages and Tipped Services”, Economic Inquiry, Vol. 35 No. 2, pp.
334-349.
Zerafa, M.A, (2007), “Unemployment Benefits and Incentives to Seek Employment in Malta”, Bank
of Valletta Review, Vol 36 Autumn, pp. 47-61.
23
Appendix A Real-Wage Equation
In analysing the effect of the minimum wage on employment in Malta, the approach of this
study takes the product of the wage elasticity of labour demand, obtained from the labour demand
specified in Equation 1, with the elasticity of average wage with respect to the minimum wage. The
technique used to estimate the latter is similar to Bazen and Martin (1991) and Koutsogeorgopoulou
(1994), discussed below.
One type of time-series approach derives its model from the real-wage equation. The basic
assumption is that workers have a „target‟ real wage which itself is a function of inter alia labor
productivity, real minimum wage, and unemployment rate.
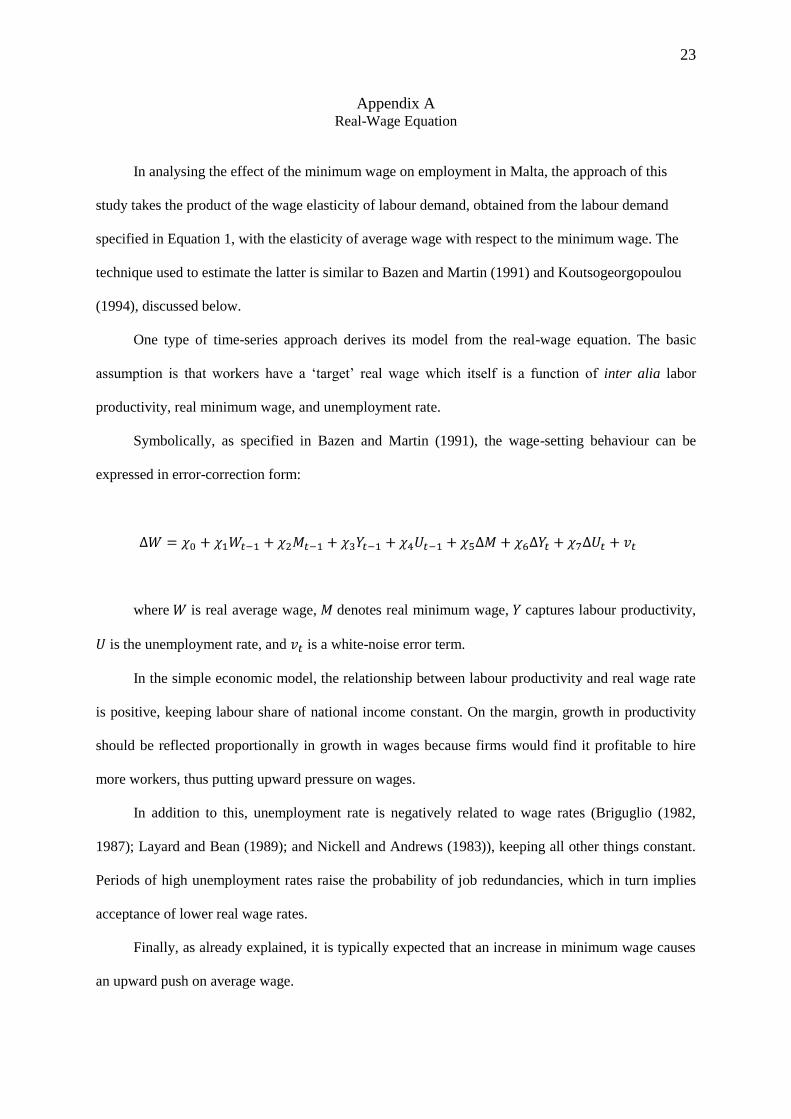
Symbolically, as specified in Bazen and Martin (1991), the wage-setting behaviour can be
expressed in error-correction form:
where is real average wage, denotes real minimum wage, captures labour productivity,
is the unemployment rate, and is a white-noise error term.
In the simple economic model, the relationship between labour productivity and real wage rate
is positive, keeping labour share of national income constant. On the margin, growth in productivity
should be reflected proportionally in growth in wages because firms would find it profitable to hire
more workers, thus putting upward pressure on wages.
In addition to this, unemployment rate is negatively related to wage rates (Briguglio (1982,
1987); Layard and Bean (1989); and Nickell and Andrews (1983)), keeping all other things constant.
Periods of high unemployment rates raise the probability of job redundancies, which in turn implies
acceptance of lower real wage rates.
Finally, as already explained, it is typically expected that an increase in minimum wage causes
an upward push on average wage.

24
The approach discussed above was not adopted because the quality of data in Malta is
sometimes poor and inconsistent. A case in point is the unemployment rate, which for many years
rested only on head-count computation of registered full-time unemployed.

25
Appendix B
Table B1
Estimated Labor Demand, assuming disequilibrium labour market
Equation: 1
Sample 1975 2011
Included observations: 25
t-Statistic
R-Squared Adjusted R-Squared F-statistic
Table B2
Estimated wage equation
Equation: 2
Sample 1975 2011
Included observations 36
t-Statistic
R-Squared Adjusted R-Squared F-statistic
Variables: and denote total wage and salary earners in year t and t-1, in full-time
equivalent. and denote average employee compensation in year t, and gross value added, in
year t, measured in real terms using the GDP deflator. is technology reflected by a linear trend.
is average Employee Compensation in year t, measured in real terms using the RPI. denotes
minimum wage in year t, measured in real terms using the RPI. All variables are in logarithms. The
labour demand equation was augmented with a dummy variable indicating structural shift that
occurred in 1982 and 1988. 1982 was characterised by high inflation rate, while 1988 captures a
change in government.
Both equations performed satisfactorily in terms of diagnostic (Jarque-Bera Test, Variance
Inflation Factors, Breusch–Pagan–Godfrey Test, and Breusch-Godfrey Serial Correlation LM Test)
and stability tests (Quandt-Andrews Test, and Chow Forecast Test).

26
Appendix C
Variables used for computing the model variables are defined together with their respective
computation.
Total aggregate employment in full-time equivalent:
Real average hourly employee compensation using GDP
deflator:
Real average hourly employee compensation using
Retail Price Index:
Real gross domestic product at factor cost: Real minimum wage:
Basic Data
number of gainfully occupied persons (full-timers) in year t.
umber of self-employed in year t.
number of wage and salary earners that have part-time job as primary activity
income from employment
gross domestic product at factor cost
minimum wage in year t
implicit GDP deflator, in year t, with 2005=100
retail Price Index, in year t, with 2005=100
Sources: National Statistics Office, Malta (various issues)