All Eyes on Asset Quality Microfinance Global Valuation Survey 2010

THE EFFECT OF MICROFINANCE LOANS ON THE ASSET
GROWTH OF CLIENTS’ ENTERPRISES THROUGH GROUP
LENDING: EVIDENCE FROM KADET LTD- KENYA
BY
NDIKU RONALD MAKOANI
D61/61077/2011
A RESEARCH PROJECT REPORT SUBMITTED IN PARTIAL
FULFILLMENT OF THE REQUIREMENTS FOR THE AWARD OF
THE DEGREE OF MASTER OF BUSINESS ADMINISTRATION
UNIVERSITY OF NAIROBI
NOVEMBER 2013

ii
DECLARATION
This project research is my original work and has not been submitted to any other
university for academic purposes.
Signed………………………………………………….Date………………………
Ronald M. Ndiku
D61/61077/2011
This project research report has been submitted for examination with my approval as the
University supervisor.
Signed…………………………………………………Date……………………….
Dr. Fredrick Ogilo
Lecturer School of Business
University of Nairobi

iii
ACKNOWLEDGEMENT
I thank the Almighty God for His grace that has enabled me to do the research work to
completion. I also thank my dad, my siblings, brother in law and my nephew for the
unrelenting encouragements and support towards my course. I also acknowledge my
supervisor Dr. Ogilo who was of great help in guiding me through the project research
period.
I finally acknowledge the entire management of the University of Nairobi for enabling
access library resources and internet usage, as well as the management of KADET ltd
who generously allowed me use the institution’s data for my research.

iv
DEDICATION
I dedicate this project to my dad Joachim Ndiku and brother-in-law Timothy Mutua for
their unwavering support over the research period.

v
ABSTRACT
The main objective of the research sought to establish the effect of microfinance loans on
the asset growth of clients’ enterprises through group lending for the case of Kenya
Agency for the Development of Enterprise and Technology (KADET Ltd)-microfinance
arm of World Vision Kenya. Specifically the research was to find and analyze the effect
of microfinance loans on asset growth. Existing studies have focused little on the effect
of micro loans on clients enterprises’ asset growth hence the findings of this report will
add to the body of the existing knowledge .The research was a case study of Kenya
Agency for the Development of Enterprise and Technology limited and used a casual
research design to come up with findings and conclusions. The population of the research
consisted of 15,614 enterprises from which a sample of 80 approved loans was randomly
selected across ten out of thirteen branches of KADET Ltd. The research utilized
secondary data from KADET Ltd database for the analysis. The study used a regression
model to analyze asset growth between years 2010 and 2013 in reference to loans
acquired within the same period, where 2010 acted as the base year. Coefficient of
determination was used to determine how much of the variations in assets were explained
by changes in microfinance loans acquired by the clients. The findings indicated that
microfinance loans explained a small percentage of the asset growth of the clients’
enterprises. Further, F test was used to interpret the significance level of the microfinance
loans to enterprise asset growth. The findings indicated that the microfinance loans had
an effect on the clients’ enterprise asset growth; however, the effect depicted a significant
negative relationship between microfinance loans and the enterprise’s asset growth-this
meant that as the loans grew the assets diminished. From the research findings, it was
concluded that KADET Ltd microfinance loans do not contribute to asset growth of their
clients’ businesses. If the main purpose of lending to clients for Kadet is to grow their
business assets, then the study recommended a revision of purpose since it doesn’t meet
the objective. This was because the Microfinance loans were found to have a significant
negative effect on the growth of clients’ assets. This being a case study, the findings may
not be inferred to the entire industry of microfinance as a result it was recommended that
a similar study to be undertaken using a bigger population of companies in the industry.
Further it should incorporate other variables like skill on business management and
capacity building and training, for comprehensive results.

vi
TABLE OF CONTENTS
DECLARATION............................................................................................................... ii
ACKNOWLEDGEMENT ............................................................................................... iii
DEDICATION.................................................................................................................. iv
ABSTRACT ....................................................................................................................... v
TABLE OF CONTENTS ................................................................................................ vi
ABBREVIATIONS AND ACRONYMS ...................................................................... viii
LIST OF TABLES ........................................................................................................... ix
CHAPTER ONE: INTRODUCTION ............................................................................. 1
1.1 Background of the Study ...................................................................................... 1
1.2 Research Problem ...................................................................................................... 4
1.3 Objectives of the Study ............................................................................................. 6
1.4 Value of the Study ..................................................................................................... 6
CHAPTER TWO: LITERATURE REVIEW ................................................................ 7
2.1 Introduction ............................................................................................................... 7
2.2 Theoretical Review ................................................................................................... 7
2.2.1 Social Capital Theory ......................................................................................... 7
2.2.2 Joint Liability Theory ......................................................................................... 9
2.2.3 Quasi-Hyperbolic Preference Theory ............................................................... 11
2.2.4 Business Constraint Model ............................................................................... 12
2.3 Empirical Review .................................................................................................... 12
2.4 Summary of Literature Review ............................................................................... 17
CHAPTER THREE: METHODOLOGY .................................................................... 18
3.1 Introduction ............................................................................................................. 18
3.2 Research Design ...................................................................................................... 18
3.3 Population of Study ................................................................................................. 18
3.4 Sampling Design ..................................................................................................... 18
3.5 Data Collection ........................................................................................................ 19
3.6 Data Analysis .......................................................................................................... 19
3.6.1 Measurement of Variables ................................................................................ 20

vii
3.6.2 Model Interpretation ......................................................................................... 20
CHAPTER FOUR: DATA ANALYSIS, RESULTS AND DISCUSSIONS .............. 22
4.1 Introduction ............................................................................................................. 22
4.2 Descriptive Statistics ............................................................................................... 22
4.3 Correlation Matrix ................................................................................................... 23
4.4 Regression Analysis ................................................................................................ 23
4.5 Test of Significance of the Model ........................................................................... 24
4.6 Test of Reliability of the Model .............................................................................. 25
4.7 Interpretation of Results .......................................................................................... 25
CHAPTER FIVE: SUMMARY, CONCLUSIONS AND RECOMMENDATIONS
........................................................................................................................................... 27
5.1 Introduction ............................................................................................................. 27
5.2 Summary of Findings .............................................................................................. 27
5.2.1 Measurement of the effect of microfinance loans on the clients’ business assets
................................................................................................................................... 27
5.2.2 Microfinance loans’ contribution to asset growth of the clients’ micro
enterprise ................................................................................................................... 28
5.3 Conclusion ............................................................................................................... 28
5.4 Recommendations ................................................................................................... 29
5.5 Limitations of the Study .......................................................................................... 29
5.6 Suggestions for Further Research ........................................................................... 29
REFERENCES ................................................................................................................ 30
APPENDICES ................................................................................................................. 35
List of sampled clients for the study ............................................................................. 35
Letter of Introduction .................................................................................................... 41

viii
ABBREVIATIONS AND ACRONYMS
AMFI Association of Microfinance Institutions
ANOVA Analysis Of Variance
CFA Co-Financing Agency
EU European Union
KWFT Kenya Women Finance Trust
KADET Kenya Agency for the Development of Enterprise and Technology
MFI Microfinance Institution
MIS Management Information system
MIX Microfinance Information Exchange
NGO Non- Governmental organization
SME Small and Medium enterprise
SPSS Statistical Package for Social Sciences
UN United Nations
UNCDF United Nations Capital Development Fund
US United States of America
USD United States Dollar

ix
LIST OF TABLES
Table 4.1 Descriptive statistics…………………….……………………………...page 22
Table 4.2 Correlations of loans and assets ……..……………………………….. Page 23
Table 4.3 Coefficients of the Regression Model ……………………………..…...page 23
Table 4.4 ANOVA ………..…………………………….…….………………..... Page 24
Table 4.5 Statistics Analysis….………………………..………………………......page 25
1
CHAPTER ONE: INTRODUCTION
1.1 Background of the Study
Most developing countries have a large informal sector, constituted of small unregistered
businesses. In such economies more people are becoming micro-entrepreneurs, selling
goods on the streets, adding to their income through home production, or farming on
small scale due to increasing formal unemployment. Their enterprises rely mostly on
money lenders or microfinance loans as sources of capital (Rhyne, 2001).
Ledgerwood (2002) defines microfinance as the provision of financial services to low
income clients including the self employed. She describes six activities associated with
microfinance; small loans that are typically working capital, informal appraisals of
borrowers and investments, collateral substitutes such as group guarantees or compelled
savings, access to repeat and larger loans based on repayment performance, streamlined
loan disbursements and monitoring and secure savings products (Ledgerwood, 2002).
Micro enterprise is a type of small business, with five or fewer employees and requiring
seed capital of not more than $35,000 (EU). Micro enterprises have three characteristics:
they are generally owned and managed by same individual or group of individuals, they
lack market power, are legally independent in the sense that they are not owned by larger
group of firms.
The theory of financial intermediation from which microfinance roots was first coined by
Fischer (1970) in his article ‘Banking and interest rates in a world without money.’ The
current development of the theory has extended to the economic role of financial
intermediation building on the economics of imperfect information that began to emerge
2
during the 1970s with seminal contribution of Akerlof (1970), Spence (1973), Rothschild
and Stigliz (1975). Financial intermediaries exist to reduce information and transaction
costs that arise from information asymmetry between borrowers and lenders (Claus and
Grimes, 2003). The concept of microfinance began in 1976 when Yunus Muhamad lent
$27 to 42 stool makers in Bangladesh (Federal Reserve Bank of St. Louis Review 2008).
Yunus pioneering efforts have brought renewed attention to the field of microfinance as a
tool to eliminate poverty. From the gesture of the $ 27 lent out to stool makers, the
Grameen Bank was founded and has grown to include more than 5.5 million members
with greater than $ 5.2 billion in disbursed loans (Federal Reserve Bank of St. Louis
Review 2008).
Hamze (2000) discusses Grameen bank model as characterized by a strict focus on low
income groups, compulsory savings and strong emphasis on training for members and
bank staff, homogeneous group formation and integration of socio-economic
development agenda with banking for the poor, it operates exclusively for the poor on the
premise that rural people, who own too little land to support themselves as farmers, can
never the less make productive use of small loans and repay them on time. The Grameen
model tackles the problem of information asymmetry and imperfect enforcement that
plague the credit markets through group based lending where the individual’s continued
access to credit is linked to group’s repayment behavior, strict observance of the norms of
group behavior forces the members to be socially and economically responsible to each
other creating pressure for members’ self monitoring and contract enforcement.
Mobilization of members’ savings forms another integral part of Grameen lending in
which microfinance is embedded. This requires borrowers to save to promote financial

3
discipline and provides an alternative source of finance for consumption-smoothing. It
also acts as deterred against group collusion since part of the savings is forfeited if the
group disbands and insures both the borrowers and the lenders against disaster (Khandker
et al, 1995).
Grameen model exercise lending without traditional collateral since most microfinance
customers belong to poor echelon in the society hence may not manage to raise collateral
but rather use social collateral via group lending. Group lending encompasses the
principle of joint liability where the group takes over the underwriting, monitoring and
enforcement of loan contracts form the lending institution (Wenner, 2005). The
microfinance focus on the micro entrepreneur is to provide capital on the small scale
entrepreneurs who do not have access to the formal banking sector (Wenner 2005).
Mobilization of member savings forms another integral part of the Grameen bank lending
(Khandker et al, 1995).
The development of microfinance in Kenya started with Kenya Women Finance Trust
(KWFT), heavily borrowing from the Grameen bank model, in 1981 with a specific focus
on women. There are currently 59 microfinance institutions in Kenya under the umbrella
of the Association of Microfinance institutions of Kenya (AMFI) serving 6.5 million,
poor and middle class families (Mix Market report, 2013).
The microfinance institutions under the umbrella of AMFI in August 2010 made
decisions to focus on improvement of service delivery and participate in mainstream
national development. In August, 2010 AMFI members met and agreed on; Whole sale
MFIs should ensure their operations are within their mission: poverty alleviation reflected

4
on interest rates, operations and capacity building of clients. Focus on three pillars; Social
responsibility, financial sustainability and environmental management. These are aimed
at removing industry stereotypes on focus on financial sustainability and poverty
alleviation (Bennet, 2010).
Kenya’s microfinance date back to early 1980s and has transformed to become one of the
most developed in the region through innovation and government policy. Leading
contributors to this dynamism are M-Pesa’s success in mobile banking, the passing of the
Finance Act of 2010 allowing for agent banking and the development of effective credit
bureaus throughout the country (Mix market report, 2012). The microfinance Act of 2006
and the supportive Deposit taking Microfinance Act of 2008 have together paved way for
institutional transformation in Kenya. As a result of this we have 9 deposit taking
microfinance in Kenya (Omino, 2005).
1.2 Research Problem
The Grameen model on which microfinance lending roots is based on group lending. The
group members exercise joint liability and consecutive loans are awarded based on
previous repayment. Despite the apparent success and popularity of microfinance, there
was no clear evidence that microfinance development have positive effects on clients’
enterprise (De Aghion and Morduch, 2010). There have been arguments examining
effects of microfinance which are inconclusive (MicroBanking Bulleting, 1997). One
group argued that microfinance provides a basis to help the poor due to the lower interest
rates and improved access to loan. The costs of these small loans are very high hence the
poor need help to cover these costs otherwise they will have to pay unacceptably high

5
interest rates. The other argument according to the microfinance bulleting of 1997 was
that, the microfinance can provide long term services only if it operated on a sustainable
basis. At the heart of the discussion lie the question, how much clients actually benefit
from microfinance loans and whether or not the poorer households benefit more than
others. As long as the majority of the microfinance institutions use subsidies in one form
or another, one has to compare costs and benefits of supporting microfinance programs to
alternative ways of development aid. As long as the effect has not been assessed, the
discussion about the use of subsidies has to remain inconclusive.
The effect can be measured through microfinance offering comparatively lower interest
rates; hence the direct effect can be measured by reduction in borrowing costs which may
lead to increase in income levels. In view of this argument the research was aimed at
evaluating whether MFI’s loans have an effect on the asset growth of the beneficiaries’
enterprises.
Microfinance institutions in Kenya aimed to support self help groups with micro loans,
where as there are 59 MFIs operating in the country, little documentation and thus little
proof and evidence exists to point out the role played by microfinance in asset growth of
the clients who subscribe to them. To fill this gap, this study sought to analyze and
document the effect of the microfinance loans on clients’ enterprise asset growth, a case
study of Kadet ltd-Kenya
The specific questions that guided the research in this report were: Does the microfinance
loans have an effect on the clients’ enterprise assets? What’s the effect of microfinance
loans to clients’ enterprise assets?

6
1.3 Objectives of the Study
i) To find the effect of microfinance loans on the clients’ business assets
ii) To analyze microfinance loans’ contribution to asset growth of the clients’ micro
enterprises.
1.4 Value of the Study
The findings of this study will be useful to various stakeholders such as government,
researchers, academicians, MFIs and NGOs. The study will advise the government on the
contribution of microfinance in the growth of the economy.
Researchers will benefit from the research in that it will provide a platform for extensive
research on microfinance loans in developing countries. The findings will add to the body
of knowledge in existence about the microfinance loans’ effect on asset growth of
beneficiaries. It will pave a way forward for potential NGOs looking forward to help in
sustainable development of SMEs to understand the difficulties they may come across
and how they can succeed in their endeavors.
Microfinance institutions will specifically benefit from this study by making use of the
findings to improve on the identified gaps with a view of ensuring their clients derive the
most from the loans they advance to them.

7
CHAPTER TWO: LITERATURE REVIEW
2.1 Introduction
This chapter examined both theoretical and empirical literature on microfinance loans,
and their effect on asset growth of beneficiaries among self help groups. In this section, a
discussion on the theories supporting microfinance activities, findings from earlier
studies on effects of microfinance loans on asset growth is done. The sections ends with a
summary.
2.2 Theoretical Review
This section provided a discussion on the different theories that support the link between
microfinance loans and development of small business. The theories discussed are the
Social capital theory, jointly Liability theory, Quasy-hyperbolic theory and the business
constraint model.
2.2.1 Social Capital Theory
The theory of the social capital in its present form and associated meaning was developed
by (Bourdieu, 1977). Social capital refers to the institution, relationships and norms that
shape the quality and quantity of the society’s social interactions (Bourdieu, 1977). The
impact of high social capital is heightened information flow that enables borrowers self
selection process as a means to mitigate adverse selection in credit markets, this mitigates
risk through information availability of other group members’ projects. They sort
themselves into homogeneous groups, through an assortative matching process.

8
Broadly, social capital can be seen in terms of five dimensions: first, networks-literal
associations that vary in density and size, and occur in both individuals and groups;
second, reciprocity-expectation that in short or long term, kindness and services will be
returned; third, trust-willingness to take initiatives(or risk) in a social context based on
assumption that others will respond as expected; fourth, social norms-the unwritten
shared values that direct behavior and interactions; and fifth, personal and collective
efficacy-the active and wiling engagement of the citizens within participative community
(Bourdieu, 1977). These five dimensions manifest themselves in various combinations
and shape the interaction amongst the members of a group, organization, community,
society or simply network and can be studied through various perspectives.
Increasing evidence shows that social cohesion is critical for societies to prosper
economically and for development to be sustainable. Social capital is not just the sum of
the institutions which comprise a society: it is the glue that holds them together. This
theory will be used in this study to explain the recent expanded role of microfinance to
small business development. In this regard, the recent flourish of microfinance as a
development agency is directly linked to the developments in application of social capital
theory (Morduch, 2000). While the idea of rotating credit groups is old as commerce
itself, its rise to mainstream prominence as a development strategy, like social capital,
coincides with the recent resurgence of neo-liberal economic ideology.
The all inclusivity of the development entailed in microfinance is now commonly
justified through efficiency and empowerment arguments that draw on the principles of
social capital theory. Small entrepreneurs in many rural agrarian societies typically lack
the collateral, literacy, numeracy and freedom to compete for credit from conventional

9
institutional sources. Thus extending credit for small-scale enterprises will likely have a
beneficial outcome for all household members, poor communities, and lenders
themselves (Morduch, 2000). The dominant model of microfinance-group lending model
pioneered by Prof. Yunus of Bangladesh through Grameen bank-socializes the costs of
lending to the poor by providing them with access to credit on the basis of ‘Social
collateral’ obtained through membership in borrower’s groups. Here social capital helps
correct the imperfect information about borrowers lacking in formal credit and
employment histories and substitutes for collateral by ensuring against default through
social sanction and peer enforcement.
For small and Micro enterprises (SMEs), the theory goes, participation yields not only an
economic pay off in increased access to financial services, but also an empowerment
payoff in new forms of bridging and linking social capital that emerge from participation
in networks of borrowers’ groups (Servon, 1998). Hamze (2000) describes in his study
of the Grameen bank in Bangladesh, borrowers’ interaction at ‘centre meetings’ (during
which borrowers’ groups convene to repay their loans) facilitates their ability to establish
and strengthen networks outside their kinship groups and living quarters. Donors thus
consider microfinance to be ‘win-win’ approach to the development because investors
can mobilize bonding social capital to enhance the financial viability of the banking with
SMEs and the poor.
2.2.2 Joint Liability Theory
This theory was coined by (Ghatak and Guinnane, 1999). The first theoretical wave on
microfinance focused exclusively on joint liability. The term joint liability can be
interpreted in several ways, which can be lumped under two categories. First, under

10
explicit joint liability, when one borrower cannot repay his/her loan, group members are
contractually required to repay in his/her stead. Such repayments can be forced through
the threat of common punishment, typically the denial of future credit to all members of
the defaulting group or by drawing on a group savings fund that serves as collateral.
Second, the perception of joint liability can be implicit, that is, borrowers believe that if a
group member defaults, the whole group will become ineligible for future loans even if
the lending contract does not specify this punishment. As a result of this, the group
creates an incentive for individual members to screen and monitor each other and enforce
repayment in order to reduce the risk of having to contribute to the repayment of the
loans of others and to ensure access to future loans. One form in which this can happen
is, if the microfinance organization chooses to fold its operations when faced with
delinquency. Ghatah and Guinnane (1999) review the key mechanisms proposed by
various theories through which joint liability could improve repayment rates and the
welfare of credit – constrained borrowers. These all have – screening, monitoring,
auditing and enforcement – by utilizing the local information and social capital that exist
among borrowers.
According to Wydick (2001), sanctions in form of group expulsions are endogenous in
that, they represent a credible threat that comprises part of a perfect Bayesian equilibrium
punishment strategy. An institution that gives SMEs and the poor people the proper
incentives to utilize information about their neighbors and to apply non financial
sanctions to delinquent borrowers can do better that a conventional bank. Joint liability
theory is best exhibited in the current microfinance practice through co-guaranteeing
mechanism which has enabled the industry practitioners post exemplary results.

11
2.2.3 Quasi-Hyperbolic Preference Theory
Fischer and Ghatak (2009) proposed an alternative theory based on present-biased, quasi-
hyperbolic preferences in order to capture the belief of many microfinance practitioners
that clients benefit from the fiscal discipline required by a frequent repayment schedule.
Their work is motivated by a pervasive sense among practitioners that frequent
repayment is critical to achieving high repayment rates. This belief is captured well in the
following observation by Muhamad Yunus. Yunus (2007) observed that it is hard to take
a huge wad of bills out of one’s pocket and pay the lender. There is enormous temptation
from one’s family business to use that money to meet immediate consumption needs.
Borrowers find this incremental process easier than having to accumulate money to pay a
lump sum because their lives are always under strain, always difficult.
The model that captures this is stark in order to highlight one particular effect. If
borrowers are present-biased, frequent repayment can increase the maximum loan size for
which repayment is incentive-compatible. Intuitively, when borrowers are present-biased,
the immediate gain to defaulting on any large repayment is subject to significant
temptation. When these payments are spread out, the instantaneous repayment burden at
any time is smaller and thus less subject to temptation (Fischer and Ghatak, 2009). When
borrowers are subject to frequent repayment, they cultivate discipline which they can
apply in business with positive benefits. Microfinance beneficiaries are largely
borrowing to repay on frequent installment basis compared to lump sum hence the theory
is in the biggest extend practiced in the microfinance lending.

12
2.2.4 Business Constraint Model
The study also adapted Ansoff’s (1965) framework for classifying the types of decision
needed to start and maintain a successful business and analyzing common problems faced
by small business owners. This framework categorizes small business constraints as
administrative, operating, strategic and exogenous. Administrative constraints focus on
the organizational structure and its capability to obtain and develop necessary resources.
These problems include personnel, finance, and management issues. Operating,
constraints deal with issues of allocating resources in an efficient manner and are more
common in the functional areas of a business. Examples include marketing, operations,
and inventory management. Strategic constraints involve the ability of small business
owners to match their product or service with the demands of the external environment
(Harris and Gibson, 2006). This requires that business owners understand the nature of
their business and the needs of their customers. Business owners with strategic issues will
need assistance with general management and marketing issues. Exogenous constraints
include financial issues, infrastructure issues, technology and demand conditions.
MFIs use technology in loans disbursements, monitoring and evaluation. They have
elaborate systems of administration to offer best service to their customers. The products
developed must meet the customer needs otherwise the MFI will lose its niche and face
extinction as a consequence.
2.3 Empirical Review
The Government of Kenya, many international donor agencies and a large number of
Kenyan NGOs consider microfinance as a key instrument for micro-enterprise growth

13
and poverty alleviation (Hospes, Musinga, & Ong’ayo, 2002). Previous studies showed
that a number of factors hamper the growth of small businesses, including lack of
financial resources; however, the degree to which limited financial resources alone are a
major obstacle to business growth is still unclear. Earlier studies show that additional
capital is often not required to carry out a successful business activity and that lack of
capital can be compensated through creativity and initiative (Diagne, 2001). Kallon
(1990) found that, the amount of capital needed to start a business is significantly
negative when related to the rate of growth for the business. He also found that access to
commercial credit did not contribute to entrepreneurial success in any significant way,
and if it did, the relationship would be negative. This section discussed the various
studies carried out in Kenya regarding microfinance loans and micro enterprises and how
they are linked.
A study by Amanda et al, (2007) on access to financial services by women owned
businesses in Kenya established that access to financial services ranked as the biggest
hindrance to microenterprise growth. The study by Amanda et al further indicated that
microfinance sector is highly segmented and disconnected. MFIs target different market
niches and operate under different methodologies and organizational missions. Kenyan
MFIs, especially the non-bank ones, often lack the financial and institutional capacity to
diversify their lending products and offer business support programs to their clients. The
study further noted that even though well-delivered microfinance is a great poverty
reduction tool, it is not well established how much it contributes to women who wish to
grow their enterprises beyond the micro level. Women business owners who have

14
outgrown the maximum loan limits from microfinance institutions have great difficulties
obtaining as small as Ksh.1 million from commercial banks.
The study by Amanda et al, (2007) further indicated that commercial banks provided the
widest range of services, but until recently, they were not interested in serving Small and
Medium enterprises (SMEs) because of the perception of the higher credit risk and the
high transaction costs. With an improved macroeconomic frame work and lower interest
rates, more banks have recognized the potential of lending to SMEs and have developed
products targeting this growing sector. It is observed that despite some positive trends by
the banks and microfinance institutions in reaching out to the SMEs, Small and Micro
Entrepreneurs reported that they continued to encounter ‘challenges of smallness’ when
they approached a traditional financial institution. However, this study went a step further
to seek to establish how microfinance loans affect the growth of assets of the
beneficiaries’ enterprises.
Another study carried out on effect of MFIs service on businesses in Kenya was carried
out by Hospes, Musinga and Ongoayo (2000). This study was an evaluation of micro-
finance programs in Kenya as was supported through the Dutch co-financing programme.
The study focused on KWFT and established that its clients were empowered by
microfinance services to undertake a variety of enterprises. These range from small trade
through hawking and different shops of service provision including running of private
clinics, schools, hairs salons and sale of bathrooms and toilets services in slum areas.
Some clients according to this study were involved in agro-based production and
marketing while a few undertook manufacturing of clothing item and food processing. A
few of the businesses were operated in formal commercial place with businesses building

15
and facilities, majority of them took place in informal sites including the homestead or
just under a tree, while many were mobile with no fixed abode.
Hospes, Musinga and Ongoayo (2002) through a sample survey undertaken as part of the
assessment also established that a large proportion of clients did not have business
structures. According to this study, on average, enterprises run by KWFT clients had
been in existence for 8.2 years. About half (49.2%) of the enterprises were, however,
fairly young having been in operation for no more than five years by the time of the study
with a significant percentage (17.2%) being only two years old or less. The study did not
relate use of microfinance loans to asset growth but rather gave a descriptive analysis of
clients of microfinance services; this study went a step further and related use of
microfinance loans and the enterprise asset growth.
Another study which was carried out on microfinance impact on businesses was by
United Nations Capital Development Fund (2003). This was a case study of Nigeria,
Kenya, Malawi and Haiti. It aimed at establishing the impact that MFI services had on
individuals, communities and enterprises. In terms of enterprises’ assets- some impact
was found in Nigeria, for Malawi and Haiti no impact on enterprises assets could be
observed. For Kenya, where the findings relied on qualitative research, there was
deficiency in data to make a conclusion. Further, the study concluded that the
programmes in Nigeria and Kenya, which operated in diversified economies, which
additionally experienced sharp declines in the general macroeconomic environment over
the past two years before the study, showed no impact in levels of enterprises income as a
result of participation in the UNCDF-supported MFI. The study by UNCDF (2003) was a
case of only those enterprises that had benefited from UNCDF-supported MFIs. The

16
current study was aimed at finding the effect of microfinance loans on beneficiary’s
enterprises for the case of KADET ltd.
A study by Muganga (2010) was aimed at estimating the impacts of microfinance
programs on business performance and individual well being in Kenya and South Africa.
It was a comparative study of the situation in the two countries. It established that as the
overall amount and number of loans to the poor increase, there was a direct positive
relationship with the recipient’s income over time. Presumably, the intent behind this
form of lending was to provide the very poor with the same opportunities afforded to the
other economic classes. Thus, if utilized effectively, microfinance is a tool that the poor
can use to pull themselves out of poverty. Muganga’s study also aimed at testing if that
was the case in developing economics. This was to evaluate if microfinance was indeed
achieving its goals. Since the small loans provided were designed to increase
entrepreneurship activity in the region studied. The study however was not inclusive in
the aspect of business asset growth hence did not show any correlation to use of
microfinance loans. This study therefore was aimed at finding out the effect of KADET
ltd loans to asset growth of its clients’ businesses.
Coleman (1999, 2001) analyzed a microfinance program in Northeast Thailand; he found
the impact of microfinance institutions on wealth was either non-significant or negative.
He attributed the negative impact to the small size of the loans. Being too small for
investment, the loans were used for consumption; households went to money lenders to
finance the repayments, leading to vicious circle of borrowing. When he distinguished
between wealthy and poor clients, he found that, only the wealthy clients benefited from
the loans.

17
2.4 Summary of Literature Review
After an extensive review of literature on microfinance, it was clear that most studies
focused on microcredit and the impact on the communities served. Existing reviews were
deficient on the intrinsic values that microfinance brought to the community. Emphasis
had been laid mainly on credit access rather than the role it plays in asset growth of the
clients’ enterprise. Besides the success stories in Bangladesh and KWFT studies, there
was little or no study on the proposed approach in Kenya. This research report intended
to bridge the existing gap by assessing the effect of microfinance loans in asset growth of
the consumers’ businesses among self help groups for the case of KADET ltd.

18
CHAPTER THREE: METHODOLOGY
3.1 Introduction
This chapter gave the study approach and methodology. It describes the research design,
target population, study area, sampling and sampling technique, data collection technique
and data analysis techniques which was be used in the study.
3.2 Research Design
The causal research design was used to carry out the research. Cooper and Schindler
(2006) indicate a causal study as designed to establish the influence of one variable(s) on
another, which depicts causation. Causal research is typically structured with a clearly
stated objective of discovering associations and causal relationships among different
variables. The causal study was necessary to generate detailed information regarding the
key aspects in order to develop profiles of those aspects: how microfinance loans cause
enterprises to grow in asset.
3.3 Population of Study
The target population for this study was all micro enterprises served by Kadet ltd- Kenya.
These were the enterprises that are licensed and have physical business structures.
3.4 Sampling Design
A simple random sampling method was used to select a sample of ten of the thirteen
KADET branches and 80 approved loan applications. Simple random sampling was
applied since the population consisted of subjects who had similar properties (Yin, 2003).

19
3.5 Data Collection
The study used secondary data which was provided by KADET Ltd (MFI affiliate to
World Vision Kenya). It consisted of information on 80 clients and covered the time
April 2010 to June 2013. KADET Ltd is a registered Microfinance since 2000 and is in
the process of acquiring deposit taking license. It offers credit facilities to small and
microenterprises in rural and urban areas. In June 2013 it was serving 15,614 clients with
an outstanding loans amounting to USD 5, 294,117. 54% of these loans were extended to
women. The high concentration of micro-enterprises in commerce sector is mirrored in
the distribution of the outstanding loans, 70% went to commerce, 15% to agriculture,
10% to production, 5% to service industry.
3.6 Data Analysis
Data was analyzed using Statistical Package for Social Sciences (SPSS) program and
presented using tables that gave clear picture at a glance. A regression analysis was
performed on the variables to determine whether microfinance loans predicted asset
growth of SMEs served by KADET ltd.
To measure the effect of the loans on asset growth the study used a logarithmic
regression model below, that was used by Evans (1987b).
Where K are assets and A contains additional variables, among which are the number and
log average size of prior loans and income. T’ represents year 2013 and T represents

20
2010 and L represents the average loan amount acquired within the period T’ and T
arrived at summing all the loans then divide by time lapse in years. Ɛ is error term.
3.6.1 Measurement of Variables
The variables in the model were measured as per the criteria discussed here under: The
depended variable measured the average change in assets
per year for the period. The independent variable is measured by taking the natural
logarithm of the sum of the loans within period T and T’
The effect of the loans was measured using the ‘client’s use of their loans’. When a client
obtains a loan, he/she faces inter temporal optimization problem for decision, how much
of this loan to invest in his/her business and how much to consume directly. If clients
were not capital constrained, the optimal levels of assets would solely be driven by
prices, expected returns and interest rates. Since most KADET ltd clients face constrains
on the size of their loans, the levels of prior assets and income (from their business) play
a crucial role for their decision on how much to invest. Analysis of the asset growth of
the clients in years 2010 to 2013 was to help measure the effect. If clients invested the
additional fund and used them productively, assets should have been higher than before
the loan was taken hence if KADET loans contributed to an increase in assets, higher
loans should have led to higher growth rates as long as the level of assets is sub-optimal.
3.6.2 Model Interpretation
Coefficient of correlation (r) is statistical measurement of the relationship between two
variables was used to measure the strength of relationship between microfinance loans
and clients’ asset growth. It ranges in the interval of -1≤ r ≤ 1, the closer r is to the ends
the stronger the relationship. Coefficient of determination (R squared) indicates how

21
much of the dependent variable ‘asset’ can be explained by the independent variable-
loans. It ranges in the interval, .
The researcher utilized the Z-test at 5% level of significance to test the hypothesis as it is
recommended for data above 30 variables. When a predictor variable has a low P value
(< 0.05) it’s likely to have a meaningful addition to the model because changes in the
predictors’ value are related to the changes in the response variable. Conversely, a larger
P value suggests that changes in the predictor are not associated with changes in the
response.
22
CHAPTER FOUR: DATA ANALYSIS, RESULTS AND
DISCUSSIONS
4.1 Introduction
This chapter discussed the data analysis, findings, interpretations and presentation. The
objectives of the study were to find out the effect of microfinance loans on clients’
enterprise asset growth and to analyze the effect of Microfinance loans on clients’
enterprise assets. Data for each variable was analyzed using correlation and thereafter, a
regression analysis was tabulated and the findings discussed.
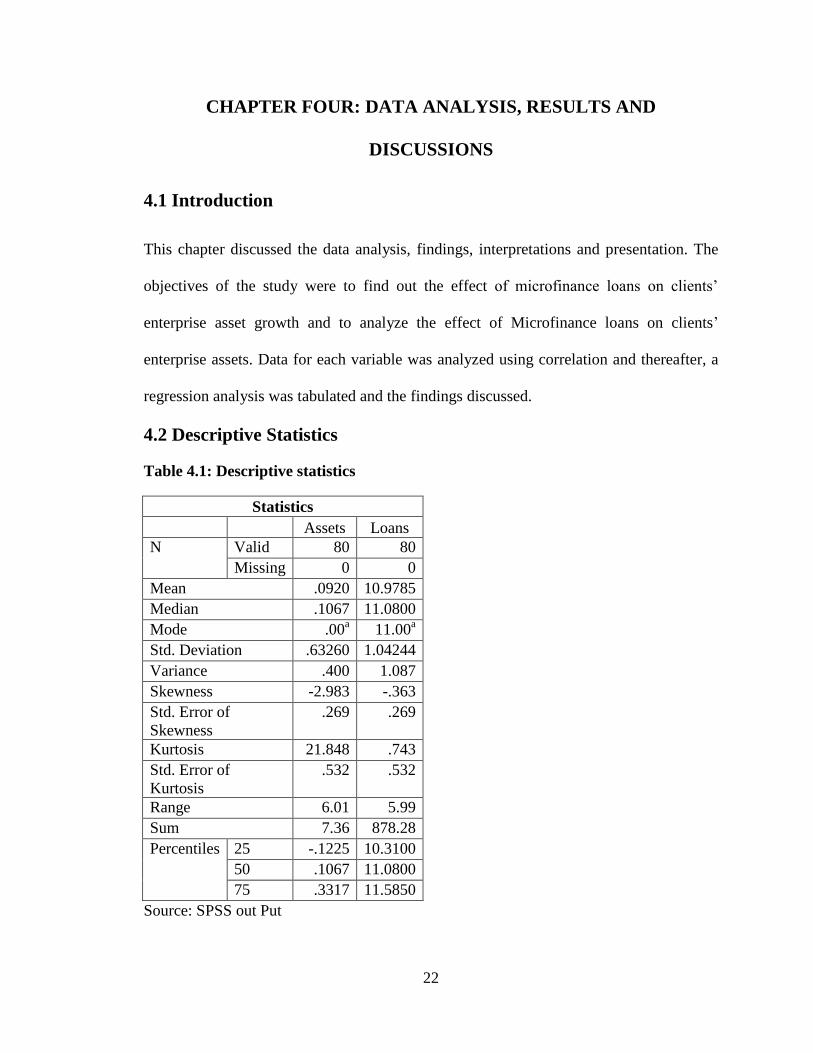
4.2 Descriptive Statistics
Table 4.1: Descriptive statistics
Statistics
Assets Loans
N Valid 80 80
Missing 0 0
Mean .0920 10.9785
Median .1067 11.0800
Mode .00a 11.00
a
Std. Deviation .63260 1.04244
Variance .400 1.087
Skewness -2.983 -.363
Std. Error of
Skewness
.269 .269
Kurtosis 21.848 .743
Std. Error of
Kurtosis
.532 .532
Range 6.01 5.99
Sum 7.36 878.28
Percentiles 25 -.1225 10.3100
50 .1067 11.0800
75 .3317 11.5850
Source: SPSS out Put

23
4.3 Correlation Matrix
Table 4.2: Correlations of Assets and Loans
Y LnL
Pearson
Correlation
Y 1.000 -.368
lnL -.368 1.000
Sig. (1-
tailed)
Y . .000
lnL .000 .
N Y 80 80
lnL 80 80
Source: SPSS out put
Correlation is the measure of relationship between two variables. From table 2 above the
correlation coefficient (r) was -0.368 meaning that there existed a weak negative
relationship between microfinance loans and the growth of clients’ assets. That meant
that an increase in microfinance loans led to a decrease in assets in the clients’ enterprise.
4.4 Regression Analysis
Table 4.3: Coefficients of the regression model
Coefficients
Model
Unstandardize
d Coefficients
Standardize
d
Coefficients
T Sig.
95.0%
Confidence
Interval for B Correlations
B
Std.
Error Beta
Lower
Boun
d
Upper
Boun
d
Zero
-
order
Partia
l Part
1 (Constant
)
2.544 .705
3.611 .00
1
1.142 3.947
LnL -.223 .064 -.368 -
3.496
.00
1
-.351 -.096 -.368 -.368 -.368
Source: SPSS out put

24
The result of regression equation for the model based on the outcome in table 3 was
expressed as below;
Y= 2.544 – 0.223InL
From the above equation, it meant that the clients’ enterprise asset grows by 2.544 when
the acquired loan is zero. It also meant that when the loan size increased by one unit, the
clients’ enterprise assets decreased by 0.223 units.
4.5 Test of Significance of the Model
Table 4.4: ANOVA
Model
Sum of
Squares Df
Mean
Square F Sig.
1 Regression 4.283 1 4.283 12.223 .001a
Residual 27.332 78 .350
Total 31.615 79
Source: SPSS out put
A predictor variable is said to be significantly related with the response variable if its P-
Value is less than 0.05 (at 5% significance level). From table 4 above the p-value of the
predictor variable (microfinance loans) was found to be 0.001 which was less than 0.05.
This implied that there exists a significant negative relationship between the microfinance
loans and clients’ asset growth. This finding was interpreted to mean that, an increase in
microfinance loans led to a decrease in enterprise assets.

25
4.6 Test of Reliability of the Model
Table 4.5: Statistics Analysis
Model R R Square
Adjusted
R Square
Std. Error
of the
Estimate
Change Statistics
R Square
Change F Change df1 df2
Sig. F
Change
1 .368a .135 .124 .592 .135 12.223 1 78 .001
Source: SPSS out put
The coefficient of determination (R2) measures the degree of variations in the response
variable that can be explained by the changes in the predictor variable in a regression
equation. From table 5 above, R2 was found to be 0.135 meaning that 13.5% variations in
asset growth of clients’ businesses can be explained by changes in loan size. This meant
that 86.5% variations in asset growth were explained by other variables outside the
model.
A t-test was finally conducted to ascertain whether the predictor variable significantly
predicted the depended variable at the 5% significance level. Testing whether the
coefficient of loans is equal to zero at 5% level of significance yields a P-value of 0.001,
which is significant. This meant that the predictor variable is significantly reliable in
explaining the asset variations in the clients’ enterprises.
4.7 Interpretation of Results
The Pearson correlation coefficient of microfinance loans was found to be -0.368 which
meant that there was a weak negative relationship between loans and asset growth. That
meant that an increase in microfinance loans led to a decrease in assets in the clients’
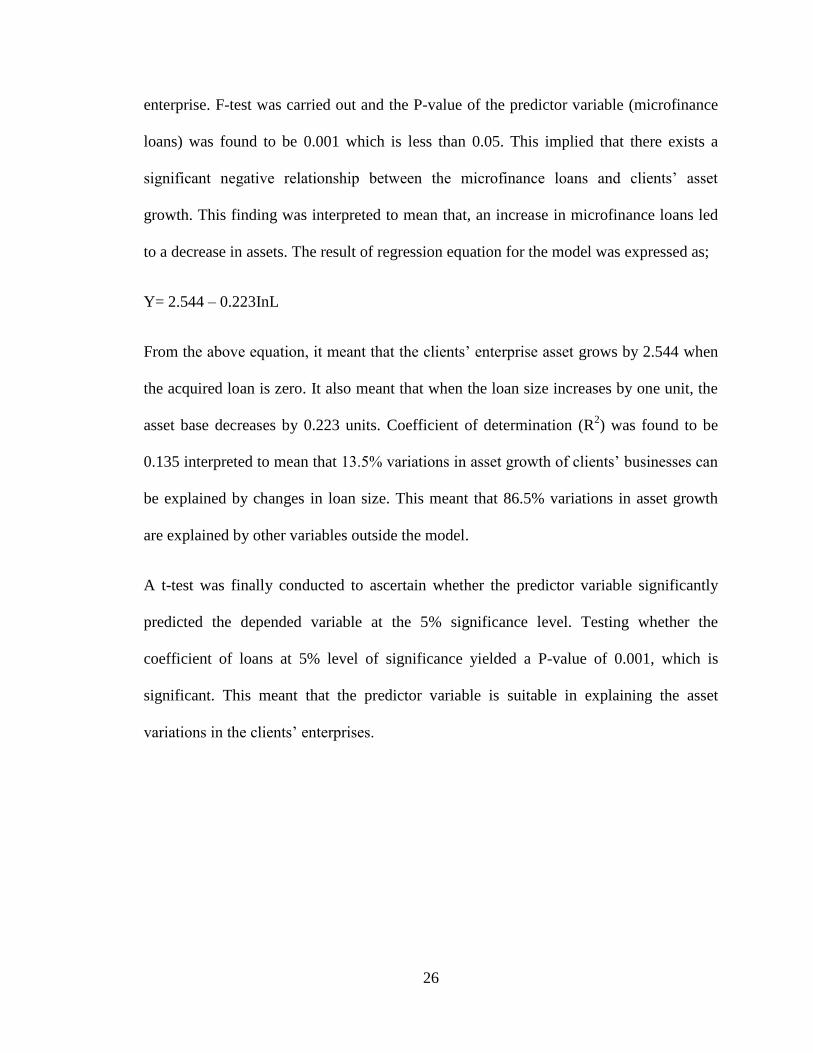
26
enterprise. F-test was carried out and the P-value of the predictor variable (microfinance
loans) was found to be 0.001 which is less than 0.05. This implied that there exists a
significant negative relationship between the microfinance loans and clients’ asset
growth. This finding was interpreted to mean that, an increase in microfinance loans led
to a decrease in assets. The result of regression equation for the model was expressed as;
Y= 2.544 – 0.223InL
From the above equation, it meant that the clients’ enterprise asset grows by 2.544 when
the acquired loan is zero. It also meant that when the loan size increases by one unit, the
asset base decreases by 0.223 units. Coefficient of determination (R2) was found to be
0.135 interpreted to mean that 13.5% variations in asset growth of clients’ businesses can
be explained by changes in loan size. This meant that 86.5% variations in asset growth
are explained by other variables outside the model.
A t-test was finally conducted to ascertain whether the predictor variable significantly
predicted the depended variable at the 5% significance level. Testing whether the
coefficient of loans at 5% level of significance yielded a P-value of 0.001, which is
significant. This meant that the predictor variable is suitable in explaining the asset
variations in the clients’ enterprises.

27
CHAPTER FIVE: SUMMARY, CONCLUSIONS AND
RECOMMENDATIONS
5.1 Introduction
The chapter gave the summary of findings, conclusions of the research based on the
findings in chapter four, recommendations, limitations of the study and recommendations
for further research.
5.2 Summary of Findings
The study used regression analysis to establish the relationship between microfinance
loans and client enterprise asset growth for the case of Kadet ltd-Microfinance firm in
Kenya. The findings of the research were discussed in line with the objectives that led the
study as follows:
5.2.1 Measurement of the effect of microfinance loans on the clients’ business assets
Analysis of the effect of microfinance loans to asset growth of the enterprise of KADET
ltd clients was carried out by use of the F test. Drawing reference on table 5 in chapter
four, The F test was found to have a P-value of 0.001 which is less than 0.05. These
findings indicated that the model was significantly suitable in explaining the dependent
variable (asset growth). The findings showed that Microfinance loans have significant
effect on clients businesses’ assets. This meant that, a change in microfinance loans
affected the level of assets in the client’s enterprises. This finding helped to realize the
objective of finding out whether microfinance loans had an effect on client’s enterprises.

28
5.2.2 Microfinance loans’ contribution to asset growth of the clients’ micro
enterprise
An analysis was carried out to determine the contribution of microfinance loans to asset
growth of Kadet clients’ enterprises through a regression equation. Referring to table 3 in
chapter four, the coefficient of microfinance loans was found to be -0.223 which meant
that an increase in microfinance loans by one digit resulted to a decrease in asset by
0.223. The finding indicated that there was a significant negative relationship between
microfinance loans and asset growth of clients’ business assets. The findings of the
analysis helped to realize the contribution of microfinance loans have on client’s
enterprise asset growth as an objective of the study.
5.3 Conclusion
Based on the findings in chapter four, it was found that microfinance loans affect clients’
enterprise asset growth. The research concluded that there exists a significant negative
relationship between the micro- finance loans and asset growth of clients’ enterprises.
The negative correlation coefficient meant that there existed a weak negative relationship
between microfinance loans and the growth of clients’ assets. The findings on coefficient
of determination indicated that the model explained a smaller part of the asset variations
while bigger parts of the asset variations were explained by other factors.
The overall conclusion was that, Kadet ltd microfinance loans do have an effect to its
client’s enterprises however a further analysis of the effect pointed out that, there was a
negative relationship between the amount of loans a client acquired within a period of
time and the level of assets within the same time. As the amount of loans increase, the
level of assets diminishes.
29
5.4 Recommendations
The study recommended that if the sole motive of KADET ltd microfinance loans was to
grow customers’ enterprise assets, then the motive needs a revision. This was because the
Microfinance loans were found to shrink the clients’ assets.
5.5 Limitations of the Study
The study was hampered by several limitations including the accessibility of information;
it was an uphill task convincing the management of KADET ltd to approve for the
provision of the data. Due to the restriction to access of information, the study
encountered the limitation of time in data analysis. The findings of the study also
indicated that the independent variable chosen for the study were not exhaustive hence
the study encountered a limitation in the explanatory power of the independent variable.
5.6 Suggestions for Further Research
This being a case study, the findings may not be inferred to the whole industry of
microfinance as a result it is recommended that a similar study may be undertaken using
a bigger population of companies within the sector which have not been covered by
earlier studies. The study should however identify the relevant control variables in the
industry for comprehensive results.

30
REFERENCES
Amanda, E., Cutura, J., Dione, N., Gillson, I., Manuel, C., & Thongori, J. (2007).Gender and
economic growth in Kenya: Unleashing the power of women). Nairobi, World Bank.
Anderson, J., Tedeschi, G., & Adiel, M. (2008). Here today, Gone tomorrow: Can
dynamic incentive make microfiance more flexible? Journal of development
Economics, 80, 84-105.
Ansoff, H.L. (1965). Corporate strategy: An analytical Approach to Business Policy for growth
and expansion,McGraw-Hill, New York.
Black, F. (1970). Banking and interest rates in a world without Money. The effects of
uncontrolled banking. Journal of bank research, 1, 9-20.
Bourdieu, P. (1977). Outline of a theory of practice. Cambridge, UK: Cambridge University
Press.
Christen, E. S., & Servon, L.J. (2005). Credit and Social Capital: The community Development
Potential of U.S Micro enterprise Programs. Journal on Housing Policy Debate, 9,
115-149
Cook, M. (2010). Group-based Financial institutions for the rural poor in Bangladesh: An
institutional and household level analysis. Research Report of the international Food
Policy Research Institute, 120, 97-100.
Cooper, D.R. & Schindler, P.S. (2006). Business research methods. (8th
ed.). MacGraw
Hill/Irwin, Boston.

31
Daley-Harris, S. (2009). State of the Microcredit Summit Campaign Report.Washington D C:
Microcredit summit Campaign.
De Aghion, A. B., & Morduch, J. (2010). The economics of microfinance (2nd
ed.). Cambridge:
MIT Press.
Diagne, A. (2001). Access to credit and it’s impact on welfare in Malawi. Research report
116. Washington, DC: International Food Policy Research Institute.
Dupas, P., & Robinson, J. (2009). Savings constraints and microenterprise development:
Evidence from a field experiment in Kenya (Working paper, 14693). National
Bureau of Economic Research.
Eicher, C. K., & Staaz, J. M. (1998) Agricultural development: An international perspective
(3rd
ed). USA: The Johns Hopkins University Press.
Eyiah, A. (2010). Exploring Entrepreneurship in a declining economy. Journal of developmental
Entrepreneurship, 5, 20-35.
Ghatak, M., & Giunnane. (1999). The economics of Lending with Joint Liability: Theory and
Practice. Journal of Development Economics, 60, 195-228.
Grieco, M. (1998). Meeting the Moment. Microfinance and the Social Exclusion agenda. The
Business School, University of North London.
Hamze, I. A. (2000). The Role of Micro Credit in Poverty Alleviation: Profile of the Micro
Credit Sector in Lebanon: New York: United Nations.

32
Hiedhus, A.C. (1995). Can Microcredit Bring development? Journal of development
economics, 86, 1-21.
Hospes, O., Musinga, M., & Ongoaya, M. (2002). An evaluation of Microfinance Programs in
Kenya as supported through the Dutch Co-Financing Programme: With a Focus on
KWFT, Netherlands Co-financing Programme. International Food Policy Research
(IPFR).Retrieved on 11th
July, 2013 from www.gdrc.org/icm/
Kallon, K.M. (1990). The Economics of Sierra Leonean Entreprenuership.University press of
America, Lanhan, MD.
Karlan, D., & Zinman, J. (2010b). Expanding Microentreprise Credit Access: Using
randomized supply decisions to estimate the impacts. Review of Financial studies,
23, 433-464.
Marcus, R., Porter, B., & Harper, C. (1999). Money matter: Understanding Microfinance. Safe
the Children. London.
Mary, K. (2006). A guide to interview guides. Retrieved on 24th
June, 2013 from http://www.ed-
web3.educ.msu.edu
Muganga, D. (2010). The Role of Regulation and Supervision of Microfinance Institutions:
Evidence from South Africa and its implications on the development of non-Deposit
taking Microfinance Regulation in Kenya. Phd. Thesis5 submitted to the state university
of Bergamo, Italy.

33
Mugenda, O. M., & Mugenda, A. G. (1999). Research Methods: Quantitative and Quantitative
Approaches. Acts Press, Nairobi.
Omino, G. (2005). Regulation and Supervision of Microfinance institutions in Kenya.Retrieved
on 17th
July, 2013 from www.microfinancegateway.org
Pitt, M. M., & Khandker, S. R. (1998). The impact of group-based credit programmes on poor
households in Bangladesh: does the gender of participants matter? Journal of political
Economy, 106, 958-996.
Rothschild, M., & Stigliz, J.E. (1975). Equilibrium in Competitive Insurance Markets. Technical
Report, 170, IMSSS Stanford University.
Sabana, B. (2005). A Report from the field: Incorporating microfinance into Kenya’s Economic
Recovery Strategy (2002). University of Liverpool.
Servon, C. (1998). Competition and Microfinance. University of California: Berkeley
mimeograph.
Scholtens, B., & Wensveen, D.V. (1999). A critique on the theory of financial intermediation . A
journal of Banking and finance, 24, 1243-1251.
United Nations Capital Development Fund (2003).Microfinance programme Impact Assessment.
Enterprising Solutions Global Consulting, New York.
Wenner, D. (2005). Financial Constrains on small Business entrepreneurs: A transkei case study.
Acta Academia, 29, 70-89.

34
Woller, M. (2008). The microfinance Revolution: Sustainable Finance for the poor. (1st Ed):
Washington D.C, World bank.
Wydick, B. (2009). Can Social Cohension be Harnessed to Repair Market Failures? Evidence
from Group Lending In Guatemala. Economic Journal, 109, 463-475.
Yin, R.K. (2003).Case study research design and methods (3rd
Ed): Saga Publications, London.
Yunus, M. (2003).Banker to the Poor: Micro-Lending and the Battle Against World Poverty:
New York.
Yunus, M. (2007). What is microcredit?” Grameen bank.Retrieved 24th
June 2013 from
www.grameen-info,org/bank/whatis microcredit.htm.

35
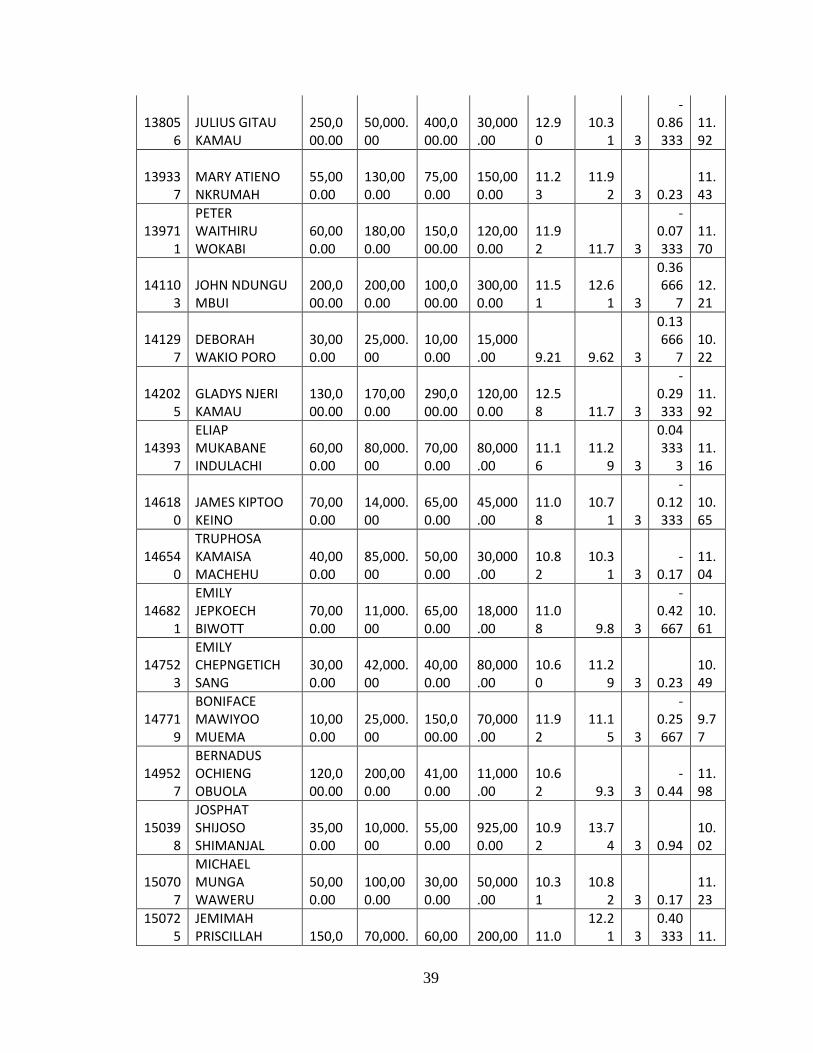
APPENDICES
List of sampled clients for the study
customer_id customer_name
Loan amount 2010
Approved amount 2013
Assets 2010
Assets 2013
ln K(2010)
lnK1(2013)
T1-T Y lnL
100834
ANNASTARSIA NGUHI NDUNI
200,000.00
250,000.00
100,000.00
150,000.00
11.51
11.91 3
0.13333
3
12.32
101561
MARGARET WANJIRU MWANGI
125,000.00
150,000.00
500,000.00
170,000.00
13.12
12.04 3
-0.36
11.83
102358
PETER KABETA MUTUNE
40,000.00
60,000.00
60,000.00
60,000.00 11 11 3 0
10.82
102554
JOSEPH KIOKO SOTA
20,000.00
20,000.00
60,000.00
200,000.00 11
12.21 3
0.40333
3
9.90
103304
DAVID KAGIRI NYAGUTHII
95,000.00
50,000.00
100,000.00
120,000.00
11.51 11.7 3
0.06333
3
11.19
103497
MORNICA ALUOCH NGODE
300,000.00
300,000.00
150,000.00
45,500.00
11.92
10.73 3
-0.39667
12.61
104101
NANCY WATETU KAMAU
84,000.00
60,000.00
220,000.00
120,000.00 12.3 11.7 3 -0.2
11.18
104548
DAMA KIPONDA MWAMBEGU
10,000.00
30,000.00
11,500.00
30,000.00
9.35 10.3 3
0.31666
7
9.90
105323
CECILIA WAIRIMU
40,000.00
70,000.00
50,000.00
39,000.00
10.82
10.57 3
-0.08333
10.92
105890
JOB GICHIMU GATHERU
100,000.00
190,000.00
250,000.00
400,000.00
12.43 12.9 3
0.15666
7
11.88
106119
PAUL WAMBUA KIVUVA
64,000.00
120,000.00
70,000.00
80,000.00
11.16
11.29 3
0.04333
3
11.43
106373
MARGARET NJERI KIRERU
80,000.00
50,000.00
12,000.00
80,000.00
9.39
11.29 3
0.63333
3
11.08
106921
ELIJA KIRERU MWANIKI
40,000.00
75,000.00
60,000.00
100,000.00
11.00
11.51 3 0.17
10.96

36
107980
HELLEN ADHIAMBO NGESA
15,000.00
20,000.00
2,000.00
5,000.00
7.60 8.52 3
0.30666
7
9.77
109264
PHILIP NGANATHA WAGARA
52,000.00
85,000.00
70,000.00
100,000.00
11.16
11.51 3
0.11666
7
11.13
109588
JOHN KIBE KAMANDE
60,000.00
120,000.00
45,000.00
45,000.00
10.71
10.71 3 0
11.41
110123
SUSAN WANJIRU MUIYURO
60,000.00
180,000.00
70,000.00
300,000.00
11.16
12.61 3
0.48333
3
11.70
111150
SUSAN WAMBUI NDINGURI
50,000.00
70,000.00
30,000.00
60,000.00
10.31 11 3 0.23
11.00
111389
HILDERH AKINYI OKWARO
80,000.00
60,000.00
15,000.00
20,000.00
9.62 9.9 3
0.09333
3
11.16
111900
CHARO MNGWARI MAGAHA
20,000.00
30,000.00
15,000.00
150,000.00
9.62
11.92 3
0.76666
7
10.13
111914
ATHUMANI CHIMVATSI KOMBO
15,000.00
42,000.00
15,000.00
13,000.00
9.62 9.47 3
-0.05
10.26
112034
JOSEPH KARUCINI MWAURA
295,000.00
200,000.00
200,000.00
170,000.00
12.21
12.04 3
-0.05667
12.42
112496
BEATRICE WANJIKU MUCHIRI
78,000.00
40,000.00
82,000.00
70,000.00
11.31
11.16 3
-0.05
10.99
112585
CHRISTINE MWEI
70,000.00
100,000.00
85,000.00
35,000.00
11.35
10.46 3
-0.29667
11.35
112992
SALINE CHEPKEMBOI RUTTO
27,900.00
30,000.00
20,000.00
150,000.00
9.90
11.92 3
0.67333
3
10.27
114946 CHEPKOK ISACK
20,000.00
70,000.00
8,500.00
50,000.00
9.05
10.82 3 0.59
10.71
115086
SAMSON ONYANGO MIYUK
50,000.00
100,000.00
60,000.00
100,000.00
11.00
11.51 3 0.17
11.23
115632
JOYCE MUHONJA
50,000.00
100,000.00
170,000.00
90,000.00
12.04
11.41 3
-0.21
11.23
117073
ANNAH CHEPNGETICH
40,00
200,00
120,0
280,00
11.7
12.54 3 0.28
11.

37
0.00 0.00 00.00 0.00 0 70
118419
GRACE WANJIKU WAHUNGU
84,000.00
16,000.00
110,000.00
100,000.00
11.61
11.51 3
-0.03333
10.82
119472
LINAH SOKOME RUTTO
20,000.00
30,000.00
30,000.00
70,000.00
10.31
11.16 3
0.28333
3
10.13
119726
DOMNIC ONYANGO OOKO
100,000.00
200,000.00
115,000.00
80,000.00
11.65
11.29 3
-0.12
11.92
119846
DANIEL MUNGUI MUTETI
90,000.00
250,000.00
80,000.00
220,000.00
11.29 12.3 3
0.33666
7
12.04
119969
BARANABAS SIMBO WERE
60,000.00
80,000.00
35,000.00
500,000.00
10.46
13.12 3
0.88666
7
11.16
120303
STEPHEN KIPKOSGEI MAIYO
40,000.00
70,000.00
35,000.00
100,000.00
10.46
11.51 3 0.35
10.92
121877
ABRAHAM KIPRUTO KOKWON
100,000.00
105,000.00
160,000.00
30,000.00
11.98
10.31 3
-0.55667
11.54
121896
RAHAB WAITHIRA KAMUNGURA
10,000.00
30,000.00
80,000.00
30,000.00
11.29
10.31 3
-0.32667
9.90
122191 SYUKI KIMANZI
70,000.00
80,000.00
150,000.00
120,000.00
11.92 11.7 3
-0.07333
11.23
122910
SELINAH OMENYA MASIRE
90,000.00
96,000.00
150,000.00
-
11.92 0 3
-3.97333
11.44
123772
HIRAMU NJUGUNA MACHARIA
70,000.00
100,000.00
30,000.00
20,000.00
10.31 9.9 3
-0.13667
11.35
123805
ISABELLA WANJIKU CHEGE
70,000.00
30,000.00
100,000.00
100,000.00
11.51
11.51 3 0
10.82
124352
PURITY WAMBUI SIMON
40,000.00
100,000.00
28,000.00
80,000.00
10.24
11.29 3 0.35
11.16
124812
JOSEPH JOMO LANDO
10,000.00
35,000.00
20,000.00
40,000.00
9.90 10.6 3
0.23333
3
10.02
125334
JULIUS WAWERU KINYANJUI
150,000.00
500,000.00
100,000.00
2,000,000.00
11.51
14.51 3 1
12.69
12600 AGNES NJERI 9.21 3 0.07

38
8 NGATIA 40,000.00
60,000.00
8,000.00
10,000.00
8.99 3333
10.82
126582
ROSEMARY ANYANGO MUHANDO
60,000.00
40,000.00
100,000.00
10,000.00
11.51 9.21 3
-0.76667
10.82
128488 SELLY TARUS
250,000.00
400,000.00
300,000.00
610,000.00
12.61
13.32 3
0.23666
7
12.69
128529
MARY WAIRIMU KARIUKI
40,000.00
100,000.00
20,000.00
9,000,000.00
9.90
16.01 3
2.03666
7
11.16
128590
GEORGE RIITHO MAHIRA
120,000.00
180,000.00
200,000.00
1,200,000.00
12.21 14 3
0.59666
7
11.92
129427
HELLEN KOBILO CHEPCHIENG
20,000.00
50,000.00
30,000.00
40,000.00
10.31 10.6 3
0.09666
7
10.46
129681
ELIZABETH NDUNGE MUASYA
15,000.00
25,000.00
8,000.00
80,000.00
8.99
11.29 3
0.76666
7
9.90
131065
DAVID NJUGUNA
260,000.00
365,000.00
800,000.00
1,200,000.00
13.59 14 3
0.13666
7
12.65
131675
ANNASTASIA NDILE MUSYOKI
15,000.00
50,000.00
15,000.00
180,000.00
9.62 12.1 3
0.82666
7
10.39
132160
PETER KURIA NGETHE
40,000.00
50,000.00
80,000.00
120,000.00
11.29 11.7 3
0.13666
7
10.71
133017
JOYCE CHAO MWANDAIRO
50,000.00
75,000.00
40,000.00
23,000.00
10.60
10.04 3
-0.18667
11.04
135365
CHRISTOPHER KAHINDO NJAGU
125,000.00
275,000.00
120,000.00
50,000.00
11.70
10.81 3
-0.29667
12.21
135653
DEBORAH MUTHONI MBUGUA
173,250.00
250,000.00
70,000.00
130,000.00
11.16
11.78 3
0.20666
7
12.26
136950
GIBSON MUASA MUOKI
80,000.00
120,000.00
36,000.00
170,000.00
10.49
12.04 3
0.51666
7
11.51
137222
JUSTINE MKALA MWANDEMBE
10,000.00
101,500.00
20,000.00
35,000.00
9.90
10.46 3
0.18666
7
10.93
137671
JACKSON WAMUTU MAINA
40,000.00
80,000.00
60,000.00
80,000.00
11.00
11.29 3
0.09666
7
11.00
39
138056
JULIUS GITAU KAMAU
250,000.00
50,000.00
400,000.00
30,000.00
12.90
10.31 3
-0.86333
11.92
139337
MARY ATIENO NKRUMAH
55,000.00
130,000.00
75,000.00
150,000.00
11.23
11.92 3 0.23
11.43
139711
PETER WAITHIRU WOKABI
60,000.00
180,000.00
150,000.00
120,000.00
11.92 11.7 3
-0.07333
11.70
141103
JOHN NDUNGU MBUI
200,000.00
200,000.00
100,000.00
300,000.00
11.51
12.61 3
0.36666
7
12.21
141297
DEBORAH WAKIO PORO
30,000.00
25,000.00
10,000.00
15,000.00
9.21 9.62 3
0.13666
7
10.22
142025
GLADYS NJERI KAMAU
130,000.00
170,000.00
290,000.00
120,000.00
12.58 11.7 3
-0.29333
11.92
143937
ELIAP MUKABANE INDULACHI
60,000.00
80,000.00
70,000.00
80,000.00
11.16
11.29 3
0.04333
3
11.16
146180
JAMES KIPTOO KEINO
70,000.00
14,000.00
65,000.00
45,000.00
11.08
10.71 3
-0.12333
10.65
146540
TRUPHOSA KAMAISA MACHEHU
40,000.00
85,000.00
50,000.00
30,000.00
10.82
10.31 3
-0.17
11.04
146821
EMILY JEPKOECH BIWOTT
70,000.00
11,000.00
65,000.00
18,000.00
11.08 9.8 3
-0.42667
10.61
147523
EMILY CHEPNGETICH SANG
30,000.00
42,000.00
40,000.00
80,000.00
10.60
11.29 3 0.23
10.49
147719
BONIFACE MAWIYOO MUEMA
10,000.00
25,000.00
150,000.00
70,000.00
11.92
11.15 3
-0.25667
9.77
149527
BERNADUS OCHIENG OBUOLA
120,000.00
200,000.00
41,000.00
11,000.00
10.62 9.3 3
-0.44
11.98
150398
JOSPHAT SHIJOSO SHIMANJAL
35,000.00
10,000.00
55,000.00
925,000.00
10.92
13.74 3 0.94
10.02
150707
MICHAEL MUNGA WAWERU
50,000.00
100,000.00
30,000.00
50,000.00
10.31
10.82 3 0.17
11.23
150725
JEMIMAH PRISCILLAH
150,0
70,000.
60,00
200,00
11.0
12.21 3
0.40333
11.

40
WAKIO 00.00 00 0.00 0.00 0 3 61
150742 MARY ARONYA
40,000.00
30,000.00
55,000.00
1,000,000.00
10.92
13.82 3
0.96666
7
10.46
151386
LUCY ATIENO OYOYO
39,000.00
40,000.00
80,000.00
30,000.00
11.29
10.31 3
-0.32667
10.58
151458
KARISA SAHA KOMBE
40,000.00
12,600.00
80,000.00
100,000.00
11.29
11.51 3
0.07333
3
10.18
203131 GIKERA MIRIGI
30,000.00
100,000.00
50,000.00
45,000.00
10.82
10.71 3
-0.03667
11.08
Source: KADET Ltd Database

41
Letter of Introduction
To: Operations Director
KADET LTD
P.O. Box 1676-00200
From: Ronald Ndiku
School Of Business
Mombasa Campus
Date: 19/09/ 2013
Dear Sir
RE; REQUEST FOR RESEARCH DATA
I am a Master In Business Administration (Finance) student in University of Nairobi
(UON) undertaking a Research Project on ‘The Effect of microfinance loans on clients’
enterprise asset growth’. The research is being carried out as part of the requirements of
obtaining the degree. I have chosen KADET ltd as a case study for my topic. I kindly
request for the assistance in data collection by helping me access relevant in information
in loan applications.
My sample size is of 80 approved and 30 non approved loan applications. I will draw
information of the sample as of 2010 and similar information as of 2013 for effective
analysis. The information provided will exclusively be used for academic purposes only
and will be treated with utmost confidence. I will share with KADET ltd the findings of
the analysis for your information.
Your and assistance will be highly appreciated.

42
Yours faithfully, Dr. Fredrick Ogilo
Ronald Ndiku – D61/61077/2011 Supervisor
(MBA.Student) __________________