THE EFFECT OF LOG PILING ON LIQUEFACTION
15
THE EFFECT OF LOG PILING ON LIQUEFACTION Saima RIAZ 1 , Atsunori NUMATA 2 , Kaori MIMURA 3 , Hiroaki IKEDA 4 and Toshikazu HORI 5 1 Student Member of JSCE, Department of Civil Engineering, Waseda University (3-4-1, Okubo, Shinjuku-ku, Tokyo 169-8555, Japan) E-mail: [email protected] 2 Member of JSCE, Chief Research Engineer, Research Institute of Technology, Tobishima Corporation (5472, Kimagase, Noda-shi, Chiba, 270-0222, Japan) E-mail: [email protected] 3 Member of JSCE, Junior Engineer, Engineering Department, Kanematsu-NNK Corporation (3-2 Kojimachi, Chiyoda-ku, Tokyo, 102-0083, Japan) E-mail: [email protected] 4 Member of JSCE, Engineer, Showa Material Corporation (2-45, Kita 20 Chome Hondoori, Shiroisi-ku, Sapporo city, Hokkaido) E-mail: [email protected] 5 Laboratory Chief, Department of Geotechnical & Hydraulic Engineering, National Institute of Rural Engineering (2-1-6 Kannondai, Tsukuba-shi, Ibaraki 305-8609, Japan) E-mail: [email protected] This paper introduces a liquefaction mitigation method that uses log piles as environmentally friendly and practical solution for strengthening civil engineering structures. The liquefaction mitigation measure ex- plored in this paper can be used to increase the earthquake resistance of loose sands by improving the density of soil. During the Tohoku Pacific earthquake in 2011, liquefaction was pervasive in large portions of the region, especially in Tokyo Bay and the city of Urayasu. Extensive liquefaction caused extensive damage to residential properties, electricity, water, sewage networks, and bridges. The mitigation of global warming is an important issue that requires immediate attention. Because the use of wood can be effective for preventing global warming, the authors have considered it to mitigate liquefaction damage. A series of large-scale shaking table tests was performed to investigate the effect of liquefaction mitigation by log piling into sandy ground. The results indicate that the method of log piling is an effective liquefaction mitigation compared with methods for increasing density, such as the densification method. Portable dy- namic cone penetration (PDCP), Swedish weight sounding (SWS), automatic ram sounding (ARS), piezo drive cone (PDC), and flat dilatometer (FDM) tests, as well as field tests, were performed in the city of Urayasu. These tests were performed to confirm the effectiveness of log piling on liquefaction mitigation. Key Words: liquefaction, shaking table, global warming, log piles, sounding 1. INTRODUCTION In 2011, an earthquake occurred along the Pacific coast of the Tohoku and Kanto regions of Japan. The earthquake caused extensive damage to life, property and nuclear power plants due to a tsunami and in- tensive earthquake motion. Although Tokyo is lo- cated approximately 380 km from the epicenter, the ground motions detected during the earthquake were strong enough to cause significant liquefaction to loose reclaimed soils in Tokyo Bay and the city of Urayasu 1)-4) . Many residential and commercial buildings and lifeline facilities in Urayasu experi- enced extensive damage due to soil liquefaction. Soil liquefaction caused severe damage to founda- tions, lifelines, and waterfront structures. Excessive settlement and lateral spreading of the ground and landslides were induced by liquefaction. Many studies on soil liquefaction have been performed to understand the mechanism of liquefaction and the dynamic responses of foundations in a liquefiable soil 5)-11) . The results of these studies provided the basis for the evaluation of mitigation methods for liquefaction hazards 12)-16) . Journal of JSCE, Vol. 2, 144-158, 2014 144
Transcript of THE EFFECT OF LOG PILING ON LIQUEFACTION

THE EFFECT OF LOG PILING ON
LIQUEFACTION
Saima RIAZ
1, Atsunori NUMATA
2, Kaori MIMURA
3,
Hiroaki IKEDA4 and Toshikazu HORI
5
1Student Member of JSCE, Department of Civil Engineering, Waseda University
(3-4-1, Okubo, Shinjuku-ku, Tokyo 169-8555, Japan)
E-mail: [email protected] 2Member of JSCE, Chief Research Engineer, Research Institute of Technology, Tobishima Corporation
(5472, Kimagase, Noda-shi, Chiba, 270-0222, Japan)
E-mail: [email protected] 3Member of JSCE, Junior Engineer, Engineering Department, Kanematsu-NNK Corporation
(3-2 Kojimachi, Chiyoda-ku, Tokyo, 102-0083, Japan)
E-mail: [email protected] 4Member of JSCE, Engineer, Showa Material Corporation
(2-45, Kita 20 Chome Hondoori, Shiroisi-ku, Sapporo city, Hokkaido)
E-mail: [email protected] 5Laboratory Chief, Department of Geotechnical & Hydraulic Engineering, National Institute of Rural Engineering
(2-1-6 Kannondai, Tsukuba-shi, Ibaraki 305-8609, Japan)
E-mail: [email protected]
This paper introduces a liquefaction mitigation method that uses log piles as environmentally friendly and
practical solution for strengthening civil engineering structures. The liquefaction mitigation measure ex-
plored in this paper can be used to increase the earthquake resistance of loose sands by improving the
density of soil. During the Tohoku Pacific earthquake in 2011, liquefaction was pervasive in large portions
of the region, especially in Tokyo Bay and the city of Urayasu. Extensive liquefaction caused extensive
damage to residential properties, electricity, water, sewage networks, and bridges. The mitigation of global
warming is an important issue that requires immediate attention. Because the use of wood can be effective
for preventing global warming, the authors have considered it to mitigate liquefaction damage. A series of
large-scale shaking table tests was performed to investigate the effect of liquefaction mitigation by log
piling into sandy ground. The results indicate that the method of log piling is an effective liquefaction
mitigation compared with methods for increasing density, such as the densification method. Portable dy-
namic cone penetration (PDCP), Swedish weight sounding (SWS), automatic ram sounding (ARS), piezo
drive cone (PDC), and flat dilatometer (FDM) tests, as well as field tests, were performed in the city of
Urayasu. These tests were performed to confirm the effectiveness of log piling on liquefaction mitigation.
Key Words: liquefaction, shaking table, global warming, log piles, sounding
1. INTRODUCTION
In 2011, an earthquake occurred along the Pacific
coast of the Tohoku and Kanto regions of Japan. The
earthquake caused extensive damage to life, property
and nuclear power plants due to a tsunami and in-
tensive earthquake motion. Although Tokyo is lo-
cated approximately 380 km from the epicenter, the
ground motions detected during the earthquake were
strong enough to cause significant liquefaction to
loose reclaimed soils in Tokyo Bay and the city of
Urayasu1)-4). Many residential and commercial
buildings and lifeline facilities in Urayasu experi-
enced extensive damage due to soil liquefaction.
Soil liquefaction caused severe damage to founda-
tions, lifelines, and waterfront structures. Excessive
settlement and lateral spreading of the ground and
landslides were induced by liquefaction. Many
studies on soil liquefaction have been performed to
understand the mechanism of liquefaction and the
dynamic responses of foundations in a liquefiable
soil5)-11). The results of these studies provided the
basis for the evaluation of mitigation methods for
liquefaction hazards12)-16).
Journal of JSCE, Vol. 2, 144-158, 2014
144

Yasuda and Ogasawara17) evaluated a counter-
measure for liquefaction that involved the installa-
tion of steel pipes, which they determined to be ef-
fective against liquefaction. Numata et al.18) analyzed
wooden piles as a remedial measure against lique-
faction using the 1964 Niigata earthquake as an
example. They considered a countermeasure that
involved driving wooden piles into the ground,
which they determined to be effective against ground
liquefaction. They discussed the durability of wood
and misunderstandings concerning the utilization of
wood as a structural element in the field of civil en-
gineering. They determined that wood could be used
as a countermeasure against liquefaction.
Yoshida et al.19) conducted an experimental study of
a liquefaction countermeasure using log piling for
residential houses. Small-scale shaking table tests in
a 1-g gravity field were performed using a model
ground. They discovered that wooden piles could
increase the resistance of the ground to liquefaction
by increasing the ground density by piling and the
dissipation of excess pore water pressure along the
surfaces of the piles. As a result, the magnitude of the
settlement of the house, which was set on the im-
proved ground with piling logs, was minimized.
Global warming is a significant issue in this cen-
tury, for which all persons should be responsible. It is
primarily caused by the indiscriminate deforestation
and production of carbon dioxide by burning fossil
fuels. Wood is instrumental in climate change be-
cause trees absorb carbon dioxide from the atmos-
phere as they grow. Therefore, the expansion of
forests is a completely natural way to offset global
warming. The amount of carbon dioxide that trees
absorb from the atmosphere would increase if wood
was harvested and used as material for improving
foundations instead of steel and concrete, which re-
quire a substantially greater amount of fossil fuels
and produce carbon dioxide during manufactur-
ing20)-24).
Currently, Japan is a forest-rich country; therefore,
a vast amount of wood could be harvested. Because
the use of wood is effective for mitigating global
warming, the authors have considered it as a mitiga-
tion measure for liquefaction damage. Logs are
rarely used in structural foundations. However, dur-
ing the construction of the Niigata station in 1958,
logs were piled into the ground to construct the
foundation. As a result, no damage occurred during
the 1964 Niigata earthquake in Japan25); however, a
building next to the station, which had a concrete pile
foundation, incurred some structural damage. Piled
logs continue to support the existing Niigata station;
these logs may not decay. These findings are evi-
dence that wooden piles can be used as a liquefaction
countermeasure.
Wooden piles have been used to remedy liquefac-
tion; this environmentally friendly and economical
technique is important, specifically, for developing
countries, such as Pakistan, where cost and economic
considerations are critical.
Liquefaction-induced flow caused significant
damage to structures during previous earthquakes,
such as the 1964 Niigata earthquake, the 1983 Ni-
honkai-chubu earthquake, and the 2011 Tohoku Pa-
cific earthquake in Japan. Studies on liquefaction
began immediately after the Niigata earthquake.
However, the 1995 Hyogoken-nambu earthquake
and the 2011 Tohoku earthquake accelerated these
studies due to significant damage to buildings, roads,
and bridges. After the occurrence of these earth-
quakes, many studies based on shaking table tests
and analyses were performed.
Several predictions and countermeasures have been
proposed and introduced in several design codes. The
developed countermeasures have been applied to
existing structures. Among these countermeasures,
the installation of log piles as structural members is a
relatively new countermeasure that is effective
against liquefaction. The effectiveness of this method
was demonstrated by conducting shaking table tests
in the laboratory and in the field. The main objectives
of the study are as follows:
1. To examine the liquefaction behavior of the im-
proved foundation using wooden piles.
2. To obtain a cost-effective, practical, and envi-
ronmentally friendly solution for liquefaction miti-
gation.
3. To reveal the effect of log piling on liquefaction.
4. To increase the resistance of the ground to lique-
faction by increasing ground density and confining
pressure.
5. To compare the effects of the densification method
and the log piling method on liquefaction.
2. THE SHAKING TABLE TEST
(1) Experimental setup
A series of large-scale shaking table tests was
conducted in a 1-g gravity field to evaluate and
demonstrate this technique for liquefiable sand dur-
ing an earthquake. The model ground was set up in a
rigid steel container 3,600 mm long, 5,700 mm wide,
and 1,800 mm high. The container was divided into
two parts; each part had a width of 2,300 mm with a
1,100 mm cavity between each part (as shown in Fig.
2). The loose liquefiable model ground was com-
posed of Kasumigaura sand with a relative density of
approximately 48%. The model ground was prepared
using two methods: the densification method and the
log piling method.
145
To evaluate structural damage caused by liquefac-
tion, a load of concrete with a mass of 1.1 t (proto-
type contact pressure of 1.1 t/m2) was placed on the
ground surface, which was assumed equivalent to a
2-level wooden house.
Logs with diameters of 8 cm and lengths of 100 cm
were used. Piles were driven by statically pushing
them into the model ground with an oil jack. The tree
species of the logs was Japanese cedar.
Kishida, et al.26) performed 1-g and centrifuge tests
and revealed that the scale of the model ground did
not affect the relationship between the log length and
the thickness of the liquefaction layer, and the rela-
tionship between the settlement of the improved
ground and the settlement of the unimproved ground.
Large-, medium- and small-scale shaking table tests
were conducted in this study. The tests did not yield
differing results, which indicate that the scale of the
model ground does not affect the settlement results
obtained from the shaking table tests.
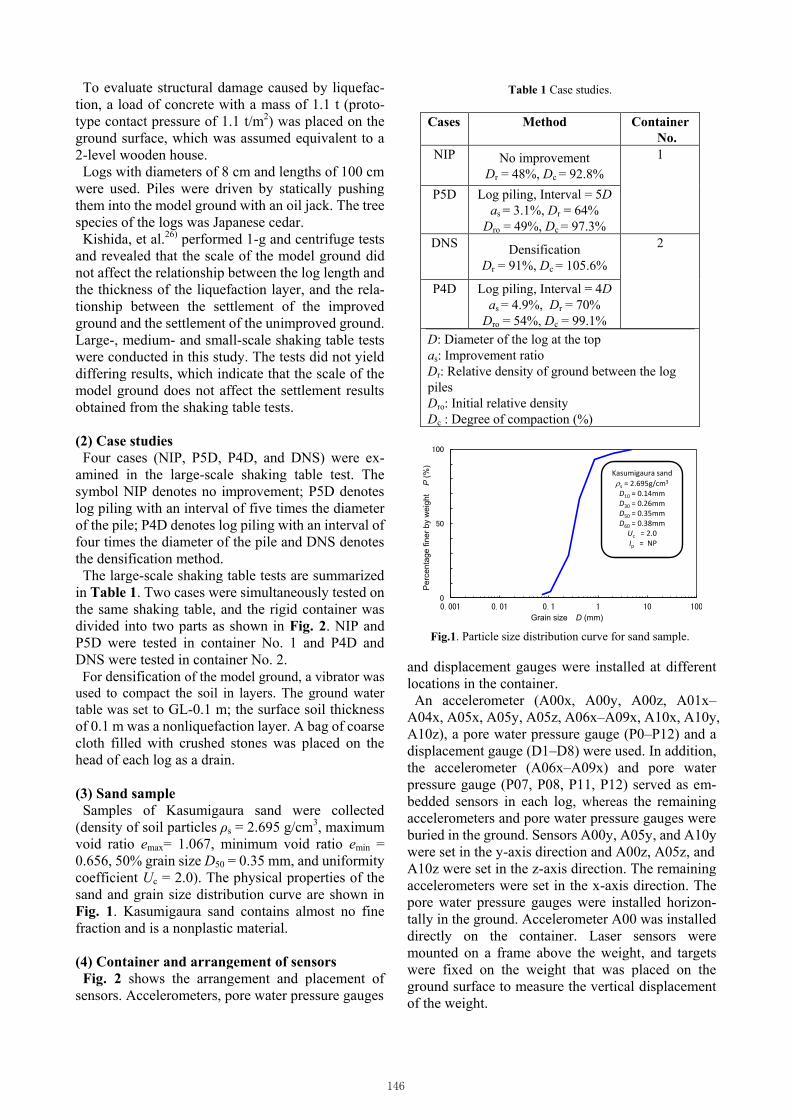
(2) Case studies
Four cases (NIP, P5D, P4D, and DNS) were ex-
amined in the large-scale shaking table test. The
symbol NIP denotes no improvement; P5D denotes
log piling with an interval of five times the diameter
of the pile; P4D denotes log piling with an interval of
four times the diameter of the pile and DNS denotes
the densification method.
The large-scale shaking table tests are summarized
in Table 1. Two cases were simultaneously tested on
the same shaking table, and the rigid container was
divided into two parts as shown in Fig. 2. NIP and
P5D were tested in container No. 1 and P4D and
DNS were tested in container No. 2.
For densification of the model ground, a vibrator was
used to compact the soil in layers. The ground water
table was set to GL-0.1 m; the surface soil thickness
of 0.1 m was a nonliquefaction layer. A bag of coarse
cloth filled with crushed stones was placed on the
head of each log as a drain.
(3) Sand sample
Samples of Kasumigaura sand were collected
(density of soil particles ρs = 2.695 g/cm3, maximum
void ratio emax= 1.067, minimum void ratio emin =
0.656, 50% grain size D50 = 0.35 mm, and uniformity
coefficient Uc = 2.0). The physical properties of the
sand and grain size distribution curve are shown in
Fig. 1. Kasumigaura sand contains almost no fine
fraction and is a nonplastic material.
(4) Container and arrangement of sensors
Fig. 2 shows the arrangement and placement of
sensors. Accelerometers, pore water pressure gauges
and displacement gauges were installed at different
locations in the container.
An accelerometer (A00x, A00y, A00z, A01x–
A04x, A05x, A05y, A05z, A06x–A09x, A10x, A10y,
A10z), a pore water pressure gauge (P0–P12) and a
displacement gauge (D1–D8) were used. In addition,
the accelerometer (A06x–A09x) and pore water
pressure gauge (P07, P08, P11, P12) served as em-
bedded sensors in each log, whereas the remaining
accelerometers and pore water pressure gauges were
buried in the ground. Sensors A00y, A05y, and A10y
were set in the y-axis direction and A00z, A05z, and
A10z were set in the z-axis direction. The remaining
accelerometers were set in the x-axis direction. The
pore water pressure gauges were installed horizon-
tally in the ground. Accelerometer A00 was installed
directly on the container. Laser sensors were
mounted on a frame above the weight, and targets
were fixed on the weight that was placed on the
ground surface to measure the vertical displacement
of the weight.
Table 1 Case studies.
Cases Method Container
No.
NIP No improvement
Dr = 48%, Dc = 92.8%
1
P5D Log piling, Interval = 5D
as = 3.1%, Dr = 64%
Dro = 49%, Dc = 97.3%
DNS Densification
Dr = 91%, Dc = 105.6%
2
P4D Log piling, Interval = 4D
as = 4.9%, Dr = 70%
Dro = 54%, Dc = 99.1%
D: Diameter of the log at the top
as: Improvement ratio
Dr: Relative density of ground between the log
piles
Dro: Initial relative density
Dc : Degree of compaction (%)
Fig.1. Particle size distribution curve for sand sample.
0
50
100
0.001 0.01 0.1 1 10 100
Pe
rce
nta
ge
fin
er
by w
eig
ht
P (
%)
Grain size D (mm)
Kasumigaura sand
s = 2.695g/cm3
D10 = 0.14mmD30 = 0.26mmD50 = 0.35mmD60 = 0.38mmUc = 2.0Ip = NP
146
(a) NIP & P5D
(b) DNS & P4D
Fig.2 Sensor location in large-scale shaking table test.
Weight
(1m×1m×0.5m, 1.1t)
2.30 2.30
3.6
00.6
01.2
0
0.1
0
0.3
0
Log piling (P5D)
5D
(@0
.40
m×
7=
2.8
0m
)
No Improvement (NIP)
Log
(D 0.08m×L 1.00m, Cedar)
1.10
0.3
00.3
0 0.2
0
2.30 2.301.10
1.15 1.150.30
0.55 [email protected]=1.20
3.6
00.4
0@
0.4
0x7=
2.8
00.4
0
D1,D2 D3,D4
A05x,A05y,A05z
D1
D2
D3
D4
P01
P02
P03
P04
P05
P06
P07
P08
P09
P10
P11
P12
A01x
A02x
A03x
A04x
A06x
A07x
A08x
A09x
A10x,A10y,A10z
D5,D6 D7,D8
A00x,A00y,A00z
A00x,A00y,A00z
D5
D6
D7
D8
P01,P02
A01x,A02x
A03x,A04x,
A05x,A05y,A05z
P03,P04P05,P06
P07,P08
A06x,A07x
P09,P10 P11,P12
A10x,A10y,A10
z
A08x,A09x
Displacement Gauge
Accelerometer
Pore water pressure gauge
Cavity: Partition/ Division/
Hollow space
Direction
of
Shakin
g
Cavity
Weight
(1m×1m×0.5m, 1.1t)
2.30 2.30
3.6
00.6
01.2
0
0.1
0
0.3
0
Log piling (P4D)
4D
(@0
.32
m×
8=
2.5
6m
)
Densification (DNS)
Log
(D0.08m×L1.00m, Cedar)
1.10
0.3
00.3
0 0.2
0
2.30 2.301.101.15 1.15
0.30
0.51 [email protected]=1.28
3.6
00.5
2@
0.3
2x8=
2.5
60.5
2
D1,D2 D3,D4
A05x,A05y,A05z
D1
D2
D3
D4
P01
P02
P03
P04
P05
P06
P07
P08
P09
P10
P11
P12
A01x
A02x
A03x
A04x
A06x
A07x
A08x
A09x
A10x,A10y,A10z
D5,D6 D7,D8
A00x,A00y,A00z
A00x,A00y,A00z
D5
D6
D7
D8
P01,P02
A01x,A02x
A03x,A04x,
A05x,A05y,A05z
P03,P04P05,P06
P07,P08
A06x,A07x
P09,P10 P11,P12
A08x,A09x
A10x,A10y,A10z
Direction
of
Shakin
g
Cavity
Displacement Gauge
Accelerometer
Pore water pressure gauge
Cavity: Partition/ Division/
Hollow space
Y
X Case 2
147

The initial relative density Dro, the relative density
after improvement Dr, and the improvement ratio are
shown in Table 1. The improvement ratio as is defined as the percentage
improvement of the improved foundation over its un-
improved state, which is calculated by the interval
between the logs (4D, 5D) and the cross section of
the log at the top as follows (shown in Fig. 3):
2B
Aas (1)
In the log piling method, the relative density Dr was
calculated by the density between the log piles using
the diameter at the top of the log piles multiplied by
the ground thickness. In the densification method, the
relative density Dr was calculated by the ground
thickness.
(5) Model ground construction
a) Natural model ground (NIP)
The natural model ground was constructed using the
following procedure and as shown in Fig. 4 (a):
1) Sensors were installed at each layer level, i.e.,
heights of 300, 600, 900, and 1,100 mm.
2) Wet sand was poured through a perforated mesh
into the water to a maximum thickness of 300 mm.
3) This procedure was done twice to make sand lay-
ers reach heights of 600 mm and 1,100 mm. After
each layer was created, the ground was leveled.
4) Water level was set at a height of 1,000 mm.
5) A layer of surface soil with a thickness of 100 mm
was placed on the ground and the ground was leveled.
This step completed the initial construction of the
ground.
b) Compacted model ground (DNS)
The compacted model ground was constructed as
follows:
1) Sensors were installed at the same depth as the
initial ground.
2) Wet sand was poured into the water to achieve a
maximum thickness of 300 mm.
3) The soil was compacted with a vibrator to check
the density of the soil.
4) This procedure was done twice to construct sand
layers with heights of 600 mm and 1,100 mm. After
each layer was created, the ground was leveled.
5) The water level was established at a height of
1,000 mm.
6) Surface soil with a thickness of 100 mm was
placed on the ground and then the ground was leveled.
This step completed the construction of the
compacted model ground.
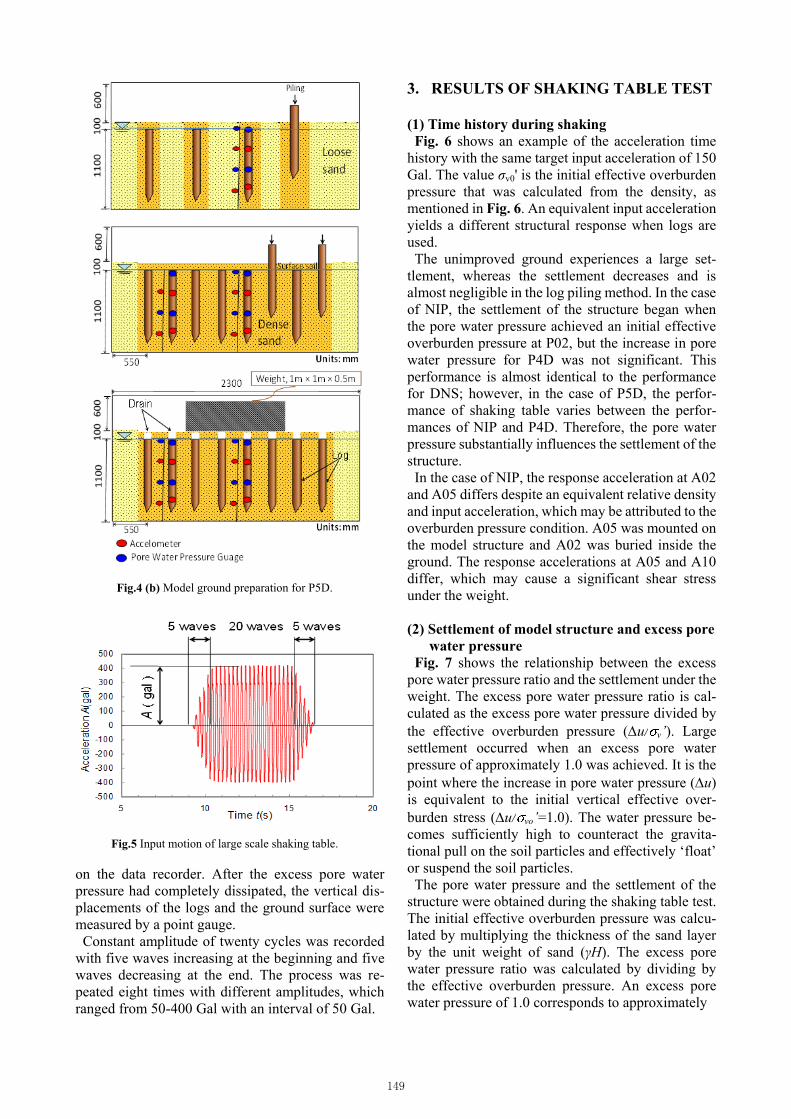
c) Log piling model ground (P5D, P4D)
The log piling ground was constructed as follows
and as shown in Fig. 4 (b):
1) The initial ground was constructed using the same
steps for the NIP model ground.
2) Piles were statically pushed into the ground at
pre-determined intervals and alternate positions.
3) Piles were inserted into the ground between the
previously inserted piles.
4) After installing the piles, drains were placed above
the heads of the piles at a depth of 10 cm. Weight was
placed on the surface of the ground after completion
of the model ground.
(6) Input motion
The model ground was shaken in a horizontal di-
rection with a sinusoidal wave with peak amplitude
of 50 Gal, frequency of 4 Hz and duration of 8 sec, as
shown in Fig. 5. The pore water pressures and re-
sponse accelerations were simultaneously recorded
Fig.3 Improvement ratio.
Fig.4 (a) Schematic of unimproved model ground.
148
on the data recorder. After the excess pore water
pressure had completely dissipated, the vertical dis-
placements of the logs and the ground surface were
measured by a point gauge.
Constant amplitude of twenty cycles was recorded
with five waves increasing at the beginning and five
waves decreasing at the end. The process was re-
peated eight times with different amplitudes, which
ranged from 50-400 Gal with an interval of 50 Gal.
3. RESULTS OF SHAKING TABLE TEST
(1) Time history during shaking
Fig. 6 shows an example of the acceleration time
history with the same target input acceleration of 150
Gal. The value σv0' is the initial effective overburden
pressure that was calculated from the density, as
mentioned in Fig. 6. An equivalent input acceleration
yields a different structural response when logs are
used.
The unimproved ground experiences a large set-
tlement, whereas the settlement decreases and is
almost negligible in the log piling method. In the case
of NIP, the settlement of the structure began when
the pore water pressure achieved an initial effective
overburden pressure at P02, but the increase in pore
water pressure for P4D was not significant. This
performance is almost identical to the performance
for DNS; however, in the case of P5D, the perfor-
mance of shaking table varies between the perfor-
mances of NIP and P4D. Therefore, the pore water
pressure substantially influences the settlement of the
structure.
In the case of NIP, the response acceleration at A02
and A05 differs despite an equivalent relative density
and input acceleration, which may be attributed to the
overburden pressure condition. A05 was mounted on
the model structure and A02 was buried inside the
ground. The response accelerations at A05 and A10
differ, which may cause a significant shear stress
under the weight.
(2) Settlement of model structure and excess pore
water pressure
Fig. 7 shows the relationship between the excess
pore water pressure ratio and the settlement under the
weight. The excess pore water pressure ratio is cal-
culated as the excess pore water pressure divided by
the effective overburden pressure (u/ v’). Large
settlement occurred when an excess pore water
pressure of approximately 1.0 was achieved. It is the
point where the increase in pore water pressure (u)
is equivalent to the initial vertical effective over-
burden stress (u/ vo’=1.0). The water pressure be-
comes sufficiently high to counteract the gravita-
tional pull on the soil particles and effectively ‘float’
or suspend the soil particles.
The pore water pressure and the settlement of the
structure were obtained during the shaking table test.
The initial effective overburden pressure was calcu-
lated by multiplying the thickness of the sand layer
by the unit weight of sand (γH). The excess pore
water pressure ratio was calculated by dividing by
the effective overburden pressure. An excess pore
water pressure of 1.0 corresponds to approximately
Fig.4 (b) Model ground preparation for P5D.
Fig.5 Input motion of large scale shaking table.
149

(a) NIP (b) P5D
(c) DNS (d) P4D
Fig.6 An example of time history of shaking table test (target input motion 150Gal).
A05
A02
P01P02
P03P04
-500
0
500
0 5 10
Input Acc A00y
Input Acc A00z
Input A
ccele
ratio
nA
(cm
/s2)
0 5 10
Input Acc A00x
Ave: 157gal
-5
0
5
10
15
Excess
pore
wate
r pre
ssure
⊿
u (
kP
a)
P02σvo'
Response ACC A05x)
-500
0
500
Accele
ration
A (c
m/s
2) Response Acc(A02x)
-5
0
5
10
15
P01 σvo'
Excess
pore
wate
r pre
ssure
⊿
u (
kP
a)
P03 σvo'
P04 σvo'
Time t (s)
Free Field
Time t (s)
Under Structure
0
20
40
60
80
100Settle
ment S
(m
m)
NIP
Observed settlement
Response Acc (A10x)
-5
0
5
10
15
P06σvo'
Excess
pore
w
ate
r pre
ssure
⊿
u (
kP
a)
P10σvo'
-5
0
5
10
15
P05 σvo'
Excess
pore
wate
r pre
ssure
⊿u (k
Pa)
-500
0
500
0 5 10
Input Acc A00y
Input Acc A00z
Input A
ccele
ration
A (
cm
/s2)
P09σvo'
0 5 10
Input Acc A00x
Ave: 157gal
-500
0
500Response Acc(A07x)
Accele
ratio
nA
(cm
/s2)
0
20
40
60
80
100
P5D
Settle
ment S
(m
m)
Observed settlement
Time t (s)
Free Field
Time t (s)
Under Structure
A10
A07
P05P06 P09
P10
A10
A07
P05P06 P09
P10
-500
0
500
Accele
ratio
n
A (c
m/s
2) Response Acc(A07x)
-500
0
500
0 5 10
Input Acc A00y
Input Acc A00z
Input A
ccele
ratio
nA
(cm
/s2)
Response Acc A10x
-5
0
5
10
15
P06 σvo'
Excess
pore
w
ate
r pre
ssure
⊿
u (k
Pa)
P10 σvo'
-5
0
5
10
15
P05
σvo'
Excess
pore
w
ate
r pre
ssure
⊿
u (k
Pa)
0 5 10
Input Acc A00x
Ave: 165gal
P09
σvo'
Time t (s)
Free Field
Time t (s)
Under Structure
0
20
40
60
80
100
P4D
Settle
ment S
(m
m)
Observed settlement
-5
0
5
10
15
P02 σvo'
Excess
pore
wate
r re
ssure
⊿u (k
Pa)
0
20
40
60
80
100
DNS
Settle
ment S
(m
m)
Observed settlement
-500
0
500
Accele
ratio
n
A (cm
/s2) Response Acc(A02x)
-500
0
500
0 5 10
Input Acc A00yInput Acc A00z
Input A
ccele
ration
A (
cm
/s2)
Response Acc (A05x)
P04 σvo'
P03
σvo'
0 5 10
Input Acc A00x
Ave: 165gal
Time t (s)
Free Field
Time t (s)
Under Structure
-5
0
5
10
15
P01
σvo'
Excess
pore
wate
r pre
ssure
⊿u (k
Pa)
A05
A02
P01P02
P03P04
150
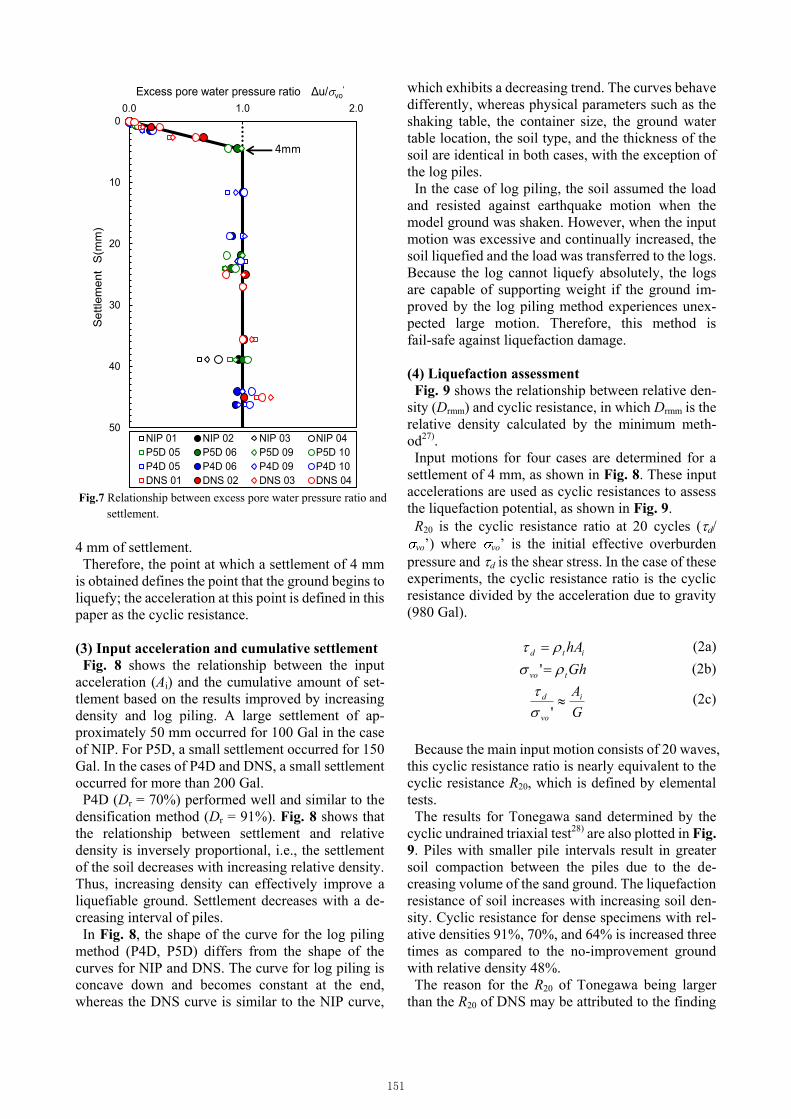
4 mm of settlement.
Therefore, the point at which a settlement of 4 mm
is obtained defines the point that the ground begins to
liquefy; the acceleration at this point is defined in this
paper as the cyclic resistance.
(3) Input acceleration and cumulative settlement
Fig. 8 shows the relationship between the input
acceleration (Ai) and the cumulative amount of set-
tlement based on the results improved by increasing
density and log piling. A large settlement of ap-
proximately 50 mm occurred for 100 Gal in the case
of NIP. For P5D, a small settlement occurred for 150
Gal. In the cases of P4D and DNS, a small settlement
occurred for more than 200 Gal.
P4D (Dr = 70%) performed well and similar to the
densification method (Dr = 91%). Fig. 8 shows that
the relationship between settlement and relative
density is inversely proportional, i.e., the settlement
of the soil decreases with increasing relative density.
Thus, increasing density can effectively improve a
liquefiable ground. Settlement decreases with a de-
creasing interval of piles.
In Fig. 8, the shape of the curve for the log piling
method (P4D, P5D) differs from the shape of the
curves for NIP and DNS. The curve for log piling is
concave down and becomes constant at the end,
whereas the DNS curve is similar to the NIP curve,
which exhibits a decreasing trend. The curves behave
differently, whereas physical parameters such as the
shaking table, the container size, the ground water
table location, the soil type, and the thickness of the
soil are identical in both cases, with the exception of
the log piles.
In the case of log piling, the soil assumed the load
and resisted against earthquake motion when the
model ground was shaken. However, when the input
motion was excessive and continually increased, the
soil liquefied and the load was transferred to the logs.
Because the log cannot liquefy absolutely, the logs
are capable of supporting weight if the ground im-
proved by the log piling method experiences unex-
pected large motion. Therefore, this method is
fail-safe against liquefaction damage.
(4) Liquefaction assessment
Fig. 9 shows the relationship between relative den-
sity (Drmm) and cyclic resistance, in which Drmm is the
relative density calculated by the minimum meth-
od27).
Input motions for four cases are determined for a
settlement of 4 mm, as shown in Fig. 8. These input
accelerations are used as cyclic resistances to assess
the liquefaction potential, as shown in Fig. 9.
R20 is the cyclic resistance ratio at 20 cycles (d/
vo’) where vo’ is the initial effective overburden
pressure and d is the shear stress. In the case of these
experiments, the cyclic resistance ratio is the cyclic
resistance divided by the acceleration due to gravity
(980 Gal).
itd hA (2a)
Ghtvo ' (2b)
G
Ai
vo
d '
(2c)
Because the main input motion consists of 20 waves,
this cyclic resistance ratio is nearly equivalent to the
cyclic resistance R20, which is defined by elemental
tests.
The results for Tonegawa sand determined by the
cyclic undrained triaxial test28) are also plotted in Fig.
9. Piles with smaller pile intervals result in greater
soil compaction between the piles due to the de-
creasing volume of the sand ground. The liquefaction
resistance of soil increases with increasing soil den-
sity. Cyclic resistance for dense specimens with rel-
ative densities 91%, 70%, and 64% is increased three
times as compared to the no-improvement ground
with relative density 48%.
The reason for the R20 of Tonegawa being larger
than the R20 of DNS may be attributed to the finding
Fig.7 Relationship between excess pore water pressure ratio and
settlement.
0
10
20
30
40
50
0.0 1.0 2.0
NIP 01 NIP 02 NIP 03 NIP 04
P5D 05 P5D 06 P5D 09 P5D 10
P4D 05 P4D 06 P4D 09 P4D 10
DNS 01 DNS 02 DNS 03 DNS 04
Excess pore water pressure ratio Δu/vo'
Se
ttle
me
nt
S(m
m)
4mm
151

that the response acceleration at the ground surface is
larger than the response acceleration of the input
motion. If response accelerations are used for DNS,
then the DNS curve will be higher and closer to the
Tonegawa curve (elemental test line). The R20 of the
log piling is larger than the R20 of the DNS for the
same relative density and the same input motion.
(5) Relationship between relative density and
settlement
Fig. 10 shows the relationship between relative
density and the amount of settlement at the 150 Gal
target input acceleration to compare the densification
method with the log piling method. Fig. 10 was de-
veloped using the settlement value at 150 Gal from
Fig. 8 for four different cases (NIP, P5D, P4D, and
DNS). The relative density in the ground between the
log piles was calculated considering the change in
ground surface height.
Settlements of the ground that were improved by
log piling were less than the settlements obtained by
the densification method, which indicate that log
piling is more effective than the densification method
for the same relative density.
In Fig. 10, four types of sands (Kasumigaura, Silica,
Toyoura, and Tonegawa) are used to verify the per-
formance of other sands and the scales of the shaking
table. Toyoura sand is a special sand with no fine
particles (0%). Silica sand is artificial sand with 11%
fine particles, and Tonegawa sand is natural sand
with 8% fine particles.
A small-scale container with internal dimensions of
760 mm × 400 mm × 280 mm was used to perform
the tests on Toyoura sand and Tonegawa sand. For
the small-scale test, an input motion of 5 Hz with 5
waves in the rising part, 22 main motion waves and 5
waves in the ending part was observed. The input
motion was uniaxial in the longitudinal direction of
the shaking table. The input motion increased the
amplitude of this wave at every 50 Gal stage 29). A
weight of 11.5 kg was placed on the model ground to
measure the settlement under the weight.
A medium-scale container with dimensions of
1,000 mm × 2,500 mm × 1,000 mm was used to
perform tests on the silica sand. An input motion of
1.5 Hz with 22 waves in the rising part, 30 main
motion waves and 7 waves in the ending part was
observed. In the medium-scale container, no weight
was placed on the surface of the model ground and
the settlement was determined by measuring the
settlement of the ground surface30).
Fig.8 Relationship between input acceleration and cumulative
settlement.
Fig.9 Relationship between relative density and cyclic re-
sistance.
(a) Toyoura sand (b) Tonegawa sand
(c) Silica sand (d) Kasumigaura sand
Fig.10 Relationship between relative density and settlement.
0
50
100
150
200
250
0 100 200 300 400 500
NIP
P5D
P4D
DNS
Input Acceleration Ai (gal)C
um
mu
lative
Se
ttle
me
nt Σ
S(m
m)
Dr= 48%
Dr= 71%Dr= 60%
Dr= 91%
0.0
0.2
0.4
0 10 20 30 40 50 60 70 80 90 100
Cyclic r
esis
tance
R20
Relative Density Drmm(%)
Tonegawa sand
Kasumigaura (Densification)
Kasumigaura (Log piling)
Tonegawa
CS = 4mmNc = 20
DNS
Log piling
0
10
20
30
40 50 60 70 80 90 100
Log piling
Density increase
Relative density Dr (%)
Se
ttle
me
nt S
(m
m)
Small scale shaking table 150galToyoura sandDro=50%
0
5
10
40 50 60 70 80 90 100
Log piling
Density increase
Relative density Dr (%)
Se
ttle
me
nt S
(m
m)
Small scale shaking table 150galTonegawasandDro=45%
0
5
10
40 50 60 70 80 90 100
Log piling
Density increase
Relative density Dr (%)
Se
tte
lme
nt S
(mm
)
Medium scale shaking table 150galSilica sandDro=60%
0
50
100
40 50 60 70 80 90 100
Log piling
Density increase
Relative density Dr (%)
Se
ttle
me
nt S
(mm
)
Large scale shaking table 150galKasumigaura sandDro=48%
152
In each case, the log piling line is always above the
density increase line, which indicates that log piling
is more effective than the densification method.
4. GROUND INVESTIGATION BETWEEN
LOGS
Numerous factors affect liquefaction strength, e.g.,
relative density, coefficient of cohesion Cc, grain
size distribution, soil type, confining pressure, per-
meability of soil, prior stress-strain history and
overconsolidation ratio.
In this paper, the relative density and confining
pressure are considered to be the key factors for im-
proving liquefaction resistance. The model grounds
were strengthened by the log pile and densification
methods.
The ground improved by the DNS method is
strengthened by densification. Numerous types of
soundings were performed to explain the increase in
liquefaction resistance in the case of the ground im-
proved by log piling.
(1) Sounding tests
The following tests were performed on the model
ground:
a) Portable dynamic cone penetration test (PDCPT)
b) Swedish weight sounding (SWS) test
c) Automatic ram sounding (ARS) test
d) Piezo drive cone (PDC) test
The results of these tests and the flat dilatometer
(DMT) test will be separately discussed.
a) Portable dynamic cone penetration test
The PDCPT is performed by dropping a 5 kg
hammer from a height of 50 cm to measure the pen-
etration depth per blow for each tested depth31). The
penetration depth ranges from 100 to 120 cm and the
cone diameter is 2.5 cm with a 60° angle with the
bottom edge.
The following formulae32) are used to calculate the
corrected N value for PDCPT:
If 4dN
dNN 30.01.1 (3a)
If 4dN
dNN 66.0 (3b)
where Nd is the number of blow counts to a maximum
depth of 100 mm (number).
b) Swedish weight sounding test
The equipment for this test consists of a screw point
at the tip, a steel rod with a length of 1 m, a dead
weight of 1,000 N and a top handle. The equipment is
rotated and the number of half rotations (180o rota-
tions) required for 1 m of penetration is counted
(Nsw)33). If the soil is hard, Nsw is significant.
The following formula34) is used to calculate the N
value obtained from the SWS test:
swsw NWN 067.0002.0 (4)
where
Wsw: dead weight of Swedish sounding (N)
Nsw: number of half rotations (180° rotations) for a 1
m penetration.
c) Automatic ram sounding test
In the automatic ram sounding test, a rod with a
length of 1 m, a diameter of 32 mm and a weight of
63.5 kg is used. The cone has an outside diameter of
45 mm, length of 90 mm and weight of 5 kg. The
height of fall for the ARS is 500 mm and the depth of
penetration is 200 mm35).
For ARS
dNN (5a)
If 5dN
dmd NN (5b)
If 5dN
dmdmd NNN (5c)
where
Nd: number of blow counts (number)
Ndm: mean number of blow counts to a maximum
Fig.11 Positions of sounding tests.
Log piling (P5D)
5D
(@0
.40m×
7=
2.8
0m
)
No Improvement (NIP)
3.6
00
.40
@0
.40
x7
=2
.80
0.4
0
PDCPT ARSSWS PDC DMT Unit :m
2.4
0
2.30 2.301.100.55 [email protected]=1.200.55 0.40 0.40 0.40 0.55
Log piling (P4D)
4D
(@0
.32
m×
8=
2.5
6m
)
Densification (DNS)
3.6
0
0.5
2@
0.3
2x8
=2
.56
0.5
2
3.6
0
0.3
0
2.4
00
.30
0.3
0
0.3
0
2.30 2.301.100.51 [email protected]=1.280.55 0.40 0.40 0.40 0.55
Cavity
Cavity
3.6
0
0.3
0
0.3
00
.30
0.3
0
153

depth of 200 mm (number)
ΔNdm: mean number of blow counts due to friction or
torque (number).
d) Piezo drive cone test
The PDC is a handheld device designed to penetrate
soils to depths of 1 m with a 20 mm diameter cone.
The 60° cone is forced into the ground by rising and
dropping an 8 kg hammer36). The following formu-
lae37) are used to calculate the corrected N value for
the PDC:
dmd NN
2
1
dNN
rd Md
N 16.010
where
Ndm: mean value of blow counts to a maximum depth
of 20 cm
Nd: penetration resistance
d: penetration depth (cm)
Mr: torque or moment (N-m).
(2) Results of sounding tests
Fig. 11 shows the positions of the sounding tests
performed before and after the improvement in the
ground. Fig. 12 shows the results of the sounding
tests, which show the relationship between the SPT
N-value and the depth.
The SPT N-values explained in the figures were
obtained from each sounding test and converted from
each result. The data for equivalent depths were av-
eraged for each case. The results of the NIP case by
ARS was almost zero because the blow energy was
too strong for very loose sand.
The results show that the N-value increases with
increasing depth; the N-values of P5D, P4D, and
DNS are greater than the N-values of NIP; and the
N-values of P4D are greater than the N-values of P5D,
with the exception of PDCP and ARS. The increase
in the N-value with increasing depth can be attributed
to the increase in confining pressure and improved
density. Due to the increase in the N-value, the den-
sity of the ground also increases. These results reveal
that the ground between the logs was strengthened by
log piling and the densification method.
Fig. 13 shows the relationship between the relative
density and the N-values for a depth of 0.7 m. The
relationship obtained by Meyerhof38) is also plotted
in Fig. 13. Meyerhof's data significantly differ from
the data in this paper. Because the overburden pres-
sure in this study is considerably low, the absolute
value is not important; however, the shape is useful
information.
DNS is only one datum; thus, the relationship ob-
tained by the densification method was denoted by a
broken red line, which signifies Meyerhof's rela-
tionship. The relationship obtained by log piling
yields a higher N-value than the relationship obtained
by the densification method. Due to an increase in the
N-value for the ground between the piled logs, the
density of the ground also improved.
(3) Flat dilatometer test
Confining pressure is one of the most important
factors affecting liquefaction resistance. DMT was
used to estimate the lateral stiffness or horizontal earth
pressure of the soil before and after improvement by
DNS and log piling.
The flat dilatometer is an in situ device that is used
to determine the in situ soil lateral stress and the soil
lateral stiffness, and to estimate other engineering
properties of subsurface soils. This test measures the
horizontal earth pressure by placing a board-shaped
instrument with a thickness of 15 mm and a width of 96
mm width into the ground and pushing the ground
horizontally using a circular expandable steel mem-
brane with a diameter of 60 mm on one side.
The test involves driving this steel blade into the
ground, inflating the steel membrane and measuring
the corresponding pressure and deformation. The
penetration of the steel blade is usually achieved
using common in situ penetration equipment; for
instance, the equipment used in the standard pene-
tration test. The DMT can be used to test extremely
soft soils to extremely stiff soils39).
The primary reason for the increased N-value for
the ground between the piled logs is the increased
density and confining pressure. To clarify the effect
of confining pressure, the horizontal earth pressure
was measured by the DMT. The horizontal earth
pressure was measured at two points for each case of
NIP, P5D, P4D, and DNS. The data from the NIP
were used as the original ground data prior to im-
provement.
Fig. 14 displays the results of the DMT: (a) shows
the effective horizontal earth pressure with depth and
(b) shows the rate of increase after improvement. The
data obtained from the two points in each case were
averaged at the same depth. No datum is obtained using
the DMT for depths greater than 0.5 m because the NIP
ground was too soft for this instrument. The rates of
increase exceed 1.0 and range from approximately 1.1
to 1.5, with the exception of one point. The horizontal
earth pressure increases from 1.1 to 1.5 times as large
as the pressure prior to improvement. The increase in
the N-value may be due to the increasing horizontal
earth pressure.
(4) Verification of remedial measures
The reduction in the susceptibility to liquefaction is
(6a)
(6b)
154
Fig.12 Results from the sounding tests.
(a) SWS (b) PDCPT
(c) ARS (d) PDC
Fig.13 Relationship between relative density and N values.
0.0
0.2
0.4
0.6
0.8
1.0
1.2
1.4
1.6
1.8
2.0
2.2
0 2 4 6 8 10
NIP-SWS
P5D-SWS
P4D-SWS
DNS-SWS
De
pth
D(
m)
N Value (Number)
(a) SWS
0.0
0.2
0.4
0.6
0.8
1.0
1.2
1.4
1.6
1.8
2.0
2.2
0 2 4 6 8 10
NIP-CPT
P5D-CPT
P4D-CPT
DNS-CPT
De
pth
D(
m)
N Value (Number)
(b) PDCPT
0.0
0.2
0.4
0.6
0.8
1.0
1.2
1.4
1.6
1.8
2.0
2.2
0 2 4 6 8 10
NIP-ARS
P5D-ARS
P4D-ARS
DNS-ARS
De
pth
D(
m)
N value (Number)
(c) ARS
0.0
0.2
0.4
0.6
0.8
1.0
1.2
1.4
1.6
1.8
2.0
2.2
0 2 4 6 8 10
NIP-PDC
P5D-PDC
P4D-PDC
DNS-PDC
De
pth
D(
m)
N value (Number)
(d) PDC
0
1
2
3
4
5
6
7
8
9
10
40 50 60 70 80 90 100
0.7m (Log piling)
0.7m (Density increase)
Relative Density Dr (%)
PDCPTN
IP
P5D
P4D
DN
S
N V
alu
e
Meyerhof
Large scale shaking table
0
1
2
3
4
5
6
7
8
9
10
40 50 60 70 80 90 100
0.7m (Log piling)
0.7m (Density increase)
Relative Density Dr (%)
SWS
NIP
P5D
P4D
DN
S
N V
alu
e
Meyerhof
Large scale shaking table
0
1
2
3
4
5
6
7
8
9
10
40 50 60 70 80 90 100
0.7m (Density increase)
0.7m (Log piling)
Relative Density Dr (%)
N V
alu
e
Large scale shaking table
NIP
P5D
P4D
DN
S
Meyerhof
ARS
0
1
2
3
4
5
6
7
8
9
10
40 50 60 70 80 90 100
0.7m (Log piling)
0.7m (Density increase)
Relative Density Dr (%)
N V
alu
e
PDC
NIP
P5D P
4D
DN
S
Meyerhof
Large scale shaking table
155
based on the increase in N-values (strength) and
confining pressure. Because no direct method can be
used to estimate the increased liquefaction resistance,
the effect of ground improvement (degree of com-
paction) was confirmed by N-values obtained from
different sounding tests.
Another reason for the increased liquefaction re-
sistance is that the shear modulus of the ground-logs
complex ground is higher than the shear modulus of
the original ground. The shear modulus of wood is
approximately 600 MPa and the shear modulus of the
ground is approximately 10 MPa. Therefore, the
shear modulus of the combined ground-logs compo-
site ground is higher than the shear modulus (610
MPa) of the original ground. The liquefaction re-
sistance is higher due to the increase in the shear
modulus of the improved ground. Sounding tests
(SWS, PDCP, ARS, and PDC) and flat dilatometer
tests were used to confirm the effective improvement
on liquefaction.
Another reason for the reduced liquefaction may be
the dissipation of pore water pressure along the pe-
riphery of the logs. During driving, the shear stress
along the direction of the axis of the pile caused an
increase in the total radial stress, which in turn
caused an increase in the pore water pressure. The
excess pore pressures generated in this process are
subsequently assumed to dissipate by outward radial
flow of pore water along the surface of the pile. Thus,
the ground will densify due to the increase in effec-
tive radial stress.
In addition, it is easy to generate a void and water
film between the surface of the wood and the parti-
cles of sand because the surface of the wood is coarse
and wooden piles move laterally by shaking. There-
fore, water can dissipate along the periphery of the
logs. As a result, resistance to liquefaction should
increase.
5. CONCLUSIONS
A series of 1g shaking table tests was carried out to
evaluate the performance of two ground improve-
ment techniques against liquefaction, log piling, and
densification. A test with no improvement was also
performed to compare the behaviors of sands.
Considering the effect of installing log piles in
densifying the ground and densification by com-
pacting the soil, liquefaction analysis is proposed that
uses pore pressure generation and settlement of
structure for the ground treated with log piles. Both
the settlement of structure and excess pore water
pressure are considered to be affected as they de-
crease because of densification. This densification
decreases with distance from the log pile. Observing
the test macroscopic phenomenon and analyzing the
data of pore pressure and settlement, the following
conclusions were reached:
1) The effect of liquefaction mitigation by the log
piling method is larger than the effect of lique-
faction mitigation by the densification method.
2) The degree of compaction is increased by 106%
by the log piling method and 113% by the den-
sification method as compared to unimproved
ground. 3) If the ground improved by the log piling method
experiences significant earthquake motion, the
log is capable of supporting overburden stress
because the log cannot liquefy absolutely.
Therefore, this method is fail-safe against liq-
uefaction damage.
4) The effect of liquefaction mitigation by the log
piling method increases with decreasing inter-
vals between the logs and by piling logs with 4D
intervals, which is equivalent to the effect of the
densification method with 91% relative density.
5) The primary reason for the increase in liquefac-
tion resistance is that the ground is strengthened
by an increase in density and confining pressure.
6) Results of tests performed on loose specimens
(Dr=48%) indicate that higher pore pressure is
developed with decreasing relative density.
Loose specimens showed up to three times
higher liquefaction potential compared to dense
specimens (Dr=91%, 70%, 64%).
7) Safe side design for log piling method is possi-
ble for liquefaction mitigation by estimating
liquefaction resistance from calculated ground
density between log piles. 8) Ground-logs complex ground has higher shear
modulus than original ground; therefore, lique-
faction resistance will also increase.
ACKNOWLEDGEMENTS: The financial assis-
tance provided by Waseda University, Japan is
Fig.14 Results of the DMT.
0.0
0.2
0.4
0.6
0.8
1.0
1.2
0 10 20 30 40 50
Depth
GL-(
m)
Effective horizontal earth pressure P0'
(kPa)
NIP-DMT
P5D-DMT
P4D-DMT
DNS-DMT
Average DMT
0.0
0.2
0.4
0.6
0.8
1.0
1.2
0 1 2 3
Depth
GL-(
m)
Rate of increase of effective
horizontal earth pressure P0a'/P0b'
P5D-DMT
P4D-DMT
DNS-DMT
Average DMT
156

gratefully acknowledged. The authors acknowledge
Professor Masanori Hamada (Waseda University) for
his continued support. The authors are grateful for
the assistance of Masaho Yoshida (Professor), Ta-
kumi Murata (Fukui National College of Technolo-
gy), Tadashi Hara (Associate Prof.), Akiko Sakabe
(Kochi University) and Syusei Ogawa (Nagaoka
University of Technology) in the shaking table tests.
The authors also appreciate the assistance by the staff
members of Tobishima Corporation, especially
Shigero Miwa.
REFERENCES 1) Tokimatsu, K. and Katsumata, K.: Liquefaction-induced
damage to buildings In Urayasu city during the 2011
Tohoku Pacific Earthquake, Proceedings of the Interna-
tional Symposium on Engineering Lessons Learned from
the 2011 Great East Japan Earthquake, Tokyo, Japan,
2012.
2) Yoshida, M., Miyajima, M. and Numata, A.: Experimental
Study on liquefaction countermeasure technique by log
Piling for residential houses, 15th World Conference on
earthquake Engineering (15th WCEE), Lisbon, Portugal,
2012.
3) Orense, R.P.: Soil liquefaction and slope failures during the
2011 Tohoku, Japan Earthquake, NZSEE Annual Technical
Conference & AGM, 2012.
4) Ochi, S. and Suzuoki, M.: The lessons of the Great East
Japan Earthquake 2011 and the countermeasures against
earthquakes and tsunami in future- Fundamental Concepts
behind Future Tsunami Disaster Prevention, Proceedings of
the 43rd joint meeting of U.S.-JAPAN panel on wind and
seismic effects, UJNR, pp. 49-60, 2011. 5) Finn, W.D.L., Pickering, D.J. and Bransby, P.L.: Sand
liquefaction in triaxial and simple shear tests, Journal of
Soil Mechanics and Foundations Division, ASCE 97 (SM4),
pp. 639-659, 1971.
6) Idriss, I.M. and Boulanger, R.W.: Semi-empirical proce-
dures for evaluating liquefaction during earthquakes,
Journal of Soil Dynamics and Earthquake Engineering, Vol.
26, pp. 115-130, 2006.
7) Ishihara, K.: Liquefaction and flow failure during earth-
quakes, Geotechnique, Vol. 43, No. 3, pp. 321-376, 1993.
8) Ishihara, K. and Yoshimine, M.: Evaluation of settlements
in sands deposits following liquefaction during earthquakes,
Soils and Foundations, Vol. 32, No. 10, pp. 173-188, 1992.
9) Seed, H. B. and Idriss, I. M.: Evaluation of liquefaction
potential of sand deposits based on observations of per-
formance in previous earthquakes, In-situ Testing to Eval-
uate Liquefaction Susceptibility, ASCE National Conven-
tion, St. Louis, Missouri, pp. 81-544, 1981.
10) Ueng, T. S.: Shaking Table Tests for Studies of Soil Liq-
uefaction and Soil-Pile Interaction, Geotechnical Engi-
neering Journal of the SEAGS & AGSSEA, Vol. 41, No.1,
pp. 1-10, 2010.
11) Towhata, I.: Geotechnical Earthquake Engineering,
Springer Series in Geomechanics and Geoengineering,
2008.
12) Hamada, M. and Wakamatsu, K.: Liquefaction, Ground
Deformation and their caused damage to structures, The
1995 Hyogoken-Nanbu earthquake - investigation into
damage to civil engineering structures, Committee of
Earthquake Engineering, Japan Society of Civil Engineers,
pp. 45-92, 1996.
13) Yoshimi, Y. and Tokimatsu, K.: Settlement of buildings on
saturated sand during earthquakes, Soils and Foundations,
Vol. 17, No. 1, pp. 23-38, 1977.
14) Tokimatsu, K.: Recommendations for design of building
foundations considering liquefaction and lateral spreading,
The Kenchiku Gijutsu, No. 563, pp. 126-131, 1997. (in
Japanese)
15) Idriss, I. M. and Boulanger, R. W.: Soil Liquefaction During
Earthquakes, Earthquake Engineering Research Institute
(EERI), 2008.
16) Yoshida, N., Yasuda, S., Kiku, M., Masuda, T. and Finn, W.
D. L.: Behavior of sand after liquefaction, Proceedings of
5th US-Japan Workshop on Earthquake Resistant Design of
Lifeline and Countermeasures against Soil Liquefaction, pp.
181-198, 1994.
17) Yasuda, S. and Ogasawara, M.: Studies on several coun-
termeasures against liquefaction-induced flow and an ap-
plication of a measure to existing bridges in Tokyo, Journal
of Japan Association for Earthquake Engineering (JAEE),
Vol.4,No.3(Special Issue), pp. 370-376, 2004.
18) Numata, A., Yoshida, M. and Hamada, M.: An example of
applying wood piles as a countermeasure against liquefac-
tion during the 1964 Niigata earthquake, Journal of Japan
Wood Research Society (JWRS), ISSN:0021-4795, Vol.55,
No.5, pp. 305-315, 2009.
19) Yoshida, M., Miyajima, M. and Numata, A.: Liquefaction
Countermeasure Technique by Using Logs, Progress of
Geo-Disaster Mitigation Technology in Asia, Springer, pp.
293-311, 2012.
20) Metz, B., Davidson, O. R., Bosch, P. R., Dave, R., Meyer, L.
A. (eds) : Contribution of Working Group III to the Fourth
Assessment Report of the Intergovernmental Panel on
Climate Change, IPCC, pp. 27-93, 2007.
21) Report on Research and Development in Agriculture, For-
estry and Fisheries No.23, Impact of Global Warming on
Agriculture, Forestry and Fisheries and Possible Counter-
measures in Japan, Agriculture, Forestry and Fisheries Re-
search Council, Ministry of Agriculture, Forestry and
Fisheries, Japan, 2007.
22) Ramanathan, V. and Carmichael, G.: Global and regional
climate changes due to black carbon, Nature Geoscience,
Vol. 1, pp. 221–227, 2008.
23) Muschett, F.D.: Integrating Global Sustainable Develop-
ment and Environmental Conservation, Next Generation
Climate Mitigation, pp.18-21, 2004.
24) Richard, S.L.: On the scientific basis for global warming
scenarios, Environmental Pollution, Vol. 83, pp. 124-134,
1994.
25) Numata, A., Motoyama, H., Momohara, I., Nagao, H.,
Hamada, M. and Yoshida, M.: Method of small-scale
shaking table test on measures against liquefaction by tree
trunks piling, Proceedings of the 13th International Summer
Symposium in conjunction with JSCE 66th Annual Con-
ference, Japan Society of Civil Engineers, CS13, pp. 17-18,
2011. (in Japanese)
26) Kishida, K., Tsutsumi, K., Nakamati, R., Tonsho, N. and
Hamada, M.: An experimental study on measures by
wooden pile foundations against soil liquefaction and
ground flow, Proceedings of the 10th Symposium on the Use
of Wood for Civil Engineering, Japan Society of Civil En-
gineers, pp. 95-101, 2011. (in Japanese)
27) Numata, A. and Shimamoto, E.: Liquefaction resistance of
non-plastic fine soils under condition of SPT N-values and
relative density, Journal of JSCE, No.764/III-67, pp.
287-305, 2004. (in Japanese)
28) Numata, A. and Shimamoto, E.: Liquefaction resistance of
non-plastic fine soils under condition of SPT N-values and
157
relative density, Journal of JSCE, No.764/III-67, pp.
287-305, 2004. (in Japanese)
29) Riaz, S., Hamada, M., Numata, A. and Motoyama, H.:
Development of a countermeasure against soil liquefaction
by driving wooden piles, Proceedings of the 14th Interna-
tional Summer Symposium in conjunction with JSCE 67th
Annual Conference, Japan Society of Civil Engineers, 2012.
30) Riaz, S., Numata, A. and Hamada, M.: Study of liquefaction
measures by wooden piles comparing different types of
soils, Proceedings of the 11th Symposium on the Use of
Wood for Civil Engineering, Japan Society of Civil Engi-
neers, pp. 81-86, 2012.
31) Jeffrey, E. H. and Tim, L. J.: A dynamic cone penetrometer
for measuring soil penetration resistance, America Journal
of Soil Science Society, Vol. 66, No. 4, pp. 1320-1324,
2002.
32) Japanese Geotechnical Society: Method for Portable dy-
namic cone penetration test, Japanese Standards for Ge-
otechnical and Geo-environmental Investigation Methods,
pp. 274-279, 2004. 33) Tsukamoto, Y., Ishihara, K. and Sawada, S.: Correlation
between penetration resistance of Swedish weight sounding
tests and SPT blow counts in sandy soils, Soils and Foun-
dations, pp. 13-24, 2006. 34) Japanese Geotechnical Society: Method for Swedish
Weight Sounding test, Japanese Standards for Geotechni-
cal and Geo-environmental Investigation Methods, pp.
280-289, 2004. 35) Japanese Geotechnical Society: Method for Automatic Ram
Sounding test, Japanese Standards for Geotechnical and
Geo-environmental Investigation Methods, pp. 330-331,
2004. 36) ASTM D5778-95: Standard Test Method for Performing
Electronic Friction Cone and Piezocone Penetration testing
of Soils, ASTM Section 4, Vol. 4.09, Soil and Rock(II),
1997.
37) Sawada, S.: Estimation of liquefaction potential using dy-
namic penetration with pore pressure transducer, Proceed-
ings of International Conference on Cyclic Behavior of
Soils and Liquefaction Phenomenon, Bochum, pp. 305-312,
2004.
38) Meyerhof, G.G.: Discussion on soil properties and their
measurement, session 2, Proceedings of 4th International
Conference on Soil Mechanics and Foundation Engineering
(ICSMFE), Vol. III, London, United Kingdom, p. 110,
1957.
39) Marchetti, S., Monaco, P., Totani, G. and Calabrese, M.:
The flat dilatometer test (DMT) in soil Investigations, In-
ternational Conference on In situ Measurement of Soil
Properties, Bali, Indonesia, 2001.
(Received July 16, 2013)
158