The effect of formate on cytochrome aa3 and on electron transport in the intact respiratory chain
17
Biochimica et Biophysica Acta, 430 (1976) 13-29 © Elsevier ScientificPublishing Company, Amsterdam - Printed in The Netherlands BBA 47071 THE EFFECT OF FORMATE ON CYTOCHROME aa3 AND ON ELECTRON TRANSPORT IN THE INTACT RESPIRATORY CHAIN PETER NICHOLLS* Institute of Biochemistry, University of Odense, Niels Bohrs Alld, DK-5000 Odense (Denmark) (Received September 10th, 1975) SUMMARY 1. Formate inhibits cytochrome c oxidase activity both in intact mitochondria and submitochondrial particles, and in isolated cytochrome aa3. The inhibition in- creases with decreasing pH, indicating that HCOOH may be the inhibitory species. 2. Formate induces a blue shift in the absorption spectrum of oxidized cyto- chrome aa 3 (a3+a33+) and in the half-reduced species (a2+a33+). Comparison with cyanide-induced spectral shifts, towards the red, indicates that formate and cyanide have opposite effects on the aa 3 spectrum, both in the fully oxidized and the half- reduced states. The formate spectra provide a new method of obtaining the difference spectrum of a32 + minus a3 a+, free of the difficulties with cyanide (which induces marked high --* low spin spectral shifts in cytochrome a3 3 +) and azide (which induces peak shifts of cytochrome a 2 ÷ towards the blue in both ~- and Soret regions). 3. The rate of formate dissociation from cytochrome a2+aa3+-HCOOH is faster than its rate of dissociation from a 3 +a 33 +_HCOOH, especially in the presence of cytochrome c. The K i for formate inhibition of respiration is a function of the reduc- tion state of the system, varying from 30 mM (100 ~o reduction) to 1 mM (100 oxidation) at pH 7.4, 30 °C. 4. Succinate-cytochrome c reductase activity is also inhibited by formate, in a reaction competitive with succinate and dependent on [formate] 2. 5. Formate inhibition of ascorbate plus N,N,N',N'-tetramethyl-p-phenyl- enediamine oxidation by intact rat liver mitochondria is partially released by uncou- pler addition. Formate is permeable through the inner mitochondrial membrane and no differences in 'on' or 'off' inhibition rates were observed when intact mitochondria were compared with submitochondrial particles. 6. NADH-cytochrome c reductase activity is unaffected by formate in sub- mitochondrial particles, but mitochondrial oxidation of glutamate plus malate is subject both to terminal inhibition at the cytochrome aa3 level and to a slow extra * Present address: Department of BiologicalSciences,Brock University, St. Catharines, Ontario L2S 3Al, Canada. Abbreviations: TMPD, N,N,N',N'-tetramethyl-p-phenylenediamine; FCCP, trifluoromethoxy carbonyl cyanide phenylhydrazone.
-
Upload
peter-nicholls -
Category
Documents
-
view
216 -
download
4
Transcript of The effect of formate on cytochrome aa3 and on electron transport in the intact respiratory chain

Biochimica et Biophysica Acta, 430 (1976) 13-29 © Elsevier Scientific Publishing Company, Amsterdam - Printed in The Netherlands
BBA 47071
T HE EFFECT OF FORMATE ON CYTOCHROME aa3 AND ON ELECTRON
TRANSPORT IN THE INTACT RESPIRATORY CHAIN
PETER NICHOLLS*
Institute of Biochemistry, University of Odense, Niels Bohrs Alld, DK-5000 Odense (Denmark)
(Received September 10th, 1975)
SUMMARY
1. Formate inhibits cytochrome c oxidase activity both in intact mitochondria and submitochondrial particles, and in isolated cytochrome aa3. The inhibition in- creases with decreasing pH, indicating that HCOOH may be the inhibitory species.
2. Formate induces a blue shift in the absorption spectrum of oxidized cyto- chrome aa 3 (a3+a33+) and in the half-reduced species (a2+a33+). Comparison with cyanide-induced spectral shifts, towards the red, indicates that formate and cyanide have opposite effects on the aa 3 spectrum, both in the fully oxidized and the half- reduced states. The formate spectra provide a new method of obtaining the difference spectrum of a32 + minus a3 a+, free of the difficulties with cyanide (which induces marked high --* low spin spectral shifts in cytochrome a3 3 +) and azide (which induces peak shifts of cytochrome a 2 ÷ towards the blue in both ~- and Soret regions).
3. The rate of formate dissociation from cytochrome a2+aa3+-HCOOH is faster than its rate of dissociation from a 3 +a 33 +_HCOOH, especially in the presence of cytochrome c. The K i for formate inhibition of respiration is a function of the reduc- tion state of the system, varying from 30 mM (100 ~o reduction) to 1 mM (100 oxidation) at pH 7.4, 30 °C.
4. Succinate-cytochrome c reductase activity is also inhibited by formate, in a reaction competitive with succinate and dependent on [formate] 2.
5. Formate inhibition of ascorbate plus N,N,N' ,N ' - te tramethyl -p-phenyl - enediamine oxidation by intact rat liver mitochondria is partially released by uncou- pler addition. Formate is permeable through the inner mitochondrial membrane and no differences in 'on' or 'off' inhibition rates were observed when intact mitochondria were compared with submitochondrial particles.
6. NADH-cytochrome c reductase activity is unaffected by formate in sub- mitochondrial particles, but mitochondrial oxidation of glutamate plus malate is subject both to terminal inhibition at the cytochrome aa3 level and to a slow extra
* Present address: Department of Biological Sciences, Brock University, St. Catharines, Ontario L2S 3Al, Canada.
Abbreviations: TMPD, N,N,N',N'-tetramethyl-p-phenylenediamine; FCCP, trifluoromethoxy carbonyl cyanide phenylhydrazone.

14
inhibition by formate following uncoupler addition, indicating a third site of formate action in the intact mitochondrion.
I N T R O D U C T I O N
According to the classical picture of cytochrome oxidase developed by Keilin [1 ] and formalised by Lemberg [2], the two cytochromes involved, a and a3, have chemically distinct structures. Cytochrome a has a haemochromogen structure, with protein ligands at both 5th and 6th iron coordination positions, while cytochrome a3 has a haemoglobin-like structure with weak or no ligands at the 6th coordination site, according to this model [2]. Alternative models have been proposed recently in which cytochromes a and a 3 have identical structures, with the apparent differences in reactivity the result of strong negative cooperativity between the two haems [3], or different structures, but both of the same spectroscopic type [4] with the apparent spectroscopic differences the result of haem-haem interactions.
The original model was in part based on the development of analogies by comparing inhibitor action on various ferric haemoproteins of the 'haemoglobin' type, including methaemoglobin and metmyoglobin as model systems, as well as catalase, various peroxidases, and cytochrome oxidase (see [1]). Table I compares the action of some haemoprotein ligands on four haem enzymes and the two haemo- globins. Cytochrome aa 3 has a pattern of inhibition that closely resembles that shown
TABLE I
R E A C T I O N S OF F E R R I C H A E M PROTEINS WITH L I G A N D S
See refs. 5-7 for details.
Haem protein Ligand reaction
Form Spin state and K~ of complexes* bound
C N - N3 - S H - F -
1. Methaemoglobin { low and metmyoglobin anion / 4 p M a. b
2. Catalase { low (mammalian) acid** , 8/~M
3. Cytochrome c { low peroxidase, ,~, acid 2 p M
4. Horse radish { low peroxidase acid 4/~M
5. Cytochrome c t low oxidase (aa3) acid ~ 0.1 p M
mixed low 7/~M a 70/zM b
50 t iM b
high low 1 . 2 m M <, 50 t tM
mixed 2
--< 10 m M
low? low 600 mM ~ 10 p M
low? low 50 ltM 0.3 # M
high 60 m M a 27 m M b
high 250 m M
high 0.2 m M
high 100 mM
high 50 mM
* At pH 7.0 and room temperature. ** Or concerted binding o f anion plus proton.
*** From baker 's yeast. Methaemoglobin.
b Metmyoglobin.
15
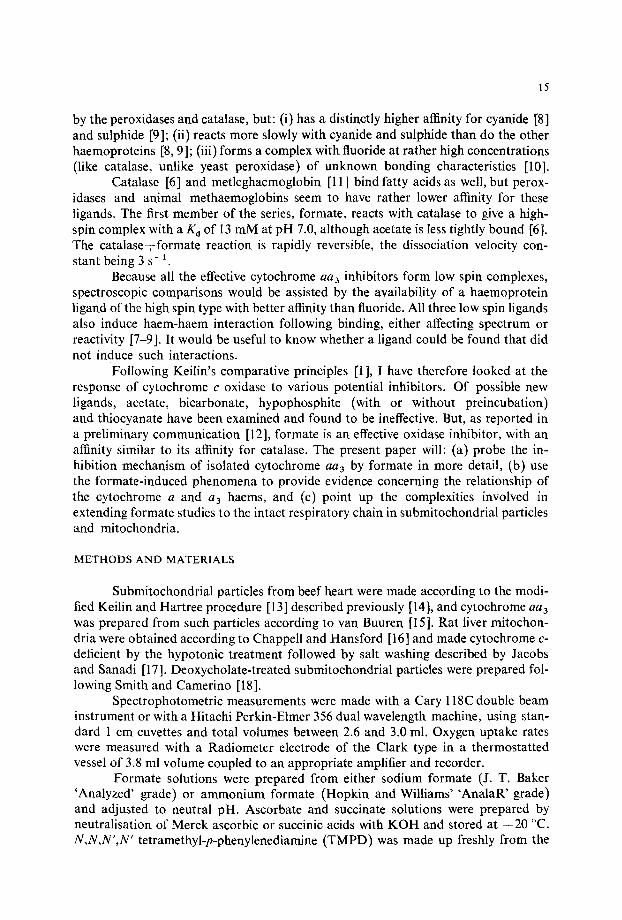
by the peroxidases and catalase, but: (i) has a distinctly higher affinity for cyanide [8] and sulphide [9]; (ii) reacts more slowly with cyanide and sulphide than do the other haemoproteins [8, 9]; (iii) forms a complex with fluoride at rather high concentrations (like catalase, unlike yeast peroxidase) of unknown bonding characteristics [10].
Catalase [6] and metleghaemoglobin [11 ] bind fatty acids as well, but perox- idases and animal methaemoglobins seem to have rather lower affinity for these ligands. The first member of the series, formate, reacts with catalase to give a high- spin complex with a K d of 13 mM at pH 7.0, although acetate is less tightly bound [6]. The catalase+formate reaction is rapidly reversible, the dissociation velocity con- stant being 3 s- 1.
Because all the effective cytochrome aa 3 inhibitors form low spin complexes, spectroscopic comparisons would be assisted by the availability of a haemoprotein ligand of the high spin type with better affinity than fluoride. All three low spin ligartds also induce haem-haem interaction following binding, either affecting spectrum or reactivity [7-9]. It would be useful to know whether a ligand could be found that did not induce such interactions.
Following Keilin's comparative principles [1 ], I have therefore looked at the response of cytochrome c oxidase to various potential inhibitors. Of possible new ligands, acetate, bicarbonate, hypophosphite (with or without preincubation) and thiocyanate have been examined and found to be ineffective. But, as reported in a preliminary communication [12], formate is an effective oxidase inhibitor, with art affinity similar to its affinity for catalase. The present paper will: (a) probe the in- hibition mechanism of isolated cytochrome aa3 by formate in more detail, (b) use the formate-induced phenomena to provide evidence concerning the relationship of the cytochrome a and a3 haems, and (c) point up the complexities involved in extending formate studies to the intact respiratory chain in submitochondrial particles and mitochondria.
METHODS AND MATERIALS
Submitochondrial particles from beef heart were made according to the modi- fied Keilin and Hartree procedure [l 3] described previously [14], and cytochrome aa a
was prepared from such particles according to van Buuren [15]. Rat liver mitochon- dria were obtained according to Chappell and Hansford [16] and made cytochrome c- deficient by the hypotonic treatment followed by salt washing described by Jacobs and Sanadi [17]. Deoxycholate-treated submitochondrial particles were prepared fol- lowing Smith and Camerino [18].
Spectrophotometric measurements were made with a Cary 118C double beam instrument or with a Hitachi Perkin-Elmer 356 dual wavelength machine, using stan- dard 1 cm cuvettes and total volumes between 2.6 and 3.0 ml. Oxygen uptake rates were measured with a Radiometer electrode of the Clark type in a thermostatted vessel of 3.8 ml volume coupled to an appropriate amplifier and recorder.
Formate solutions were prepared from either sodium formate (J. T. Baker 'Analyzed' grade) or ammonium formate (Hopkin and Williams' 'AnalaR' grade) and adjusted to neutral pH. Ascorbate and succinate solutions were prepared by neutralisation of Merck ascorbic or succinic acids with KOH and stored at --20 °C. N , N , N ' , N ' tetramethyl-p-phenylenediamine (TMPD) was made up freshly from the

16
dihydrochloride (BDH chemicals). Cyanide was added as small aliquots of 0.5 M KCN solution (not previously neutralized in order to avoid evaporation losses). NADH was from Boehringer Co., NaN 3 from Merck, rotenone from BDH Co., and trifluoromethoxy carbonyl cyanide phenylhydrazone (FCCP) a gift from Dr. P. Heytler of du Pont Co.
Cytochrome c was Sigma Type VI (horse). Cytochrome aa 3 content is deter- mined in all preparations using AE, 605-630 nm, reduced-oxidized, equal to 27 m M - 1 • cm -1 (equivalent to 13.5 mM -~ • cm -1 per haem a equivalent). All difference spectra (Figs. 2, 3 and 4) have been manually corrected for baseline anomalies (espe- cially noticeable in the 575-625 nm region with the Cary 118 C).
RESULTS
Inhibition o f cytochrome c oxidase: equilibria and spectra As outlined previously [12], formate slows the rate of oxygen uptake in mix-
tures of ascorbate (:q-TMPD), cytochrome c, and cytochrome aa 3 whether monitored polarographically, or spectrophotometrically by changes in the cytochrome c steady state. At the same concentrations formate has only a slight effect on the rate of reduc- tion of cytochrome c by ascorbate. Inhibition of cytochrome c oxidase by formate levels between 5 and 25 mM takes a finite time (a few tens of seconds) to complete at pH 7.4, 30 °C, but is more rapid at more acid pH values. Formate is released on anaerobiosis, and competes with azide for its binding site [12].
Fig. 1 illustrates the effect of formate on cytochrome aa 3 in submitochondrial particles oxidizing ascorbate plus TMPD. The particles were preincubated for 5 min in the presence of inhibitor before addition of substrate. Both formate and azide in- crease the steady state reduction levels in the s-peak (IA) and Sorer (1B) regions and extend the anaerobiosis times. But formate, unlike azide, shows (i) an initially higher inhibition level at 605 nm, relaxing to a steady state inhibition level, and (ii) a slow
A B
605 -630 nm ( a ) ~ . ~ f
',, [ii t k.~__,,~.~COO- ascorbate
~%, ascorbate TMPD ~" . . . . . c .-,-4 lb/--4,k +TMPD -~ (a) "-"~,( 0 .01A
1"20 S~I J, t...,,----
(a)
/"("b)" T 4 4 5 - 4 5 5 n m
I
T 0-03 A ±
F20S4
Fig. 1. Effect of formate and azide on the steady state reduction of cytochromes a and aa in sub- mitochondrial particles oxidizing ascorbate plus TMPD. A, 605-630 nm; B, 445-455 nm. Approx. 4 mg • ml-1 submitochondrial particles (2 ttM cytochrome aa3) in 67 mM phosphate pH 7.4 plus 10 mM ascorbate and 175/~M TMPD, 2.8 ml volume, 27 °C. (a) control (uninhibited), ; (b) plus 35 mM Na formate, - - - ; (c) plus 0.75 mM Na azide,
17
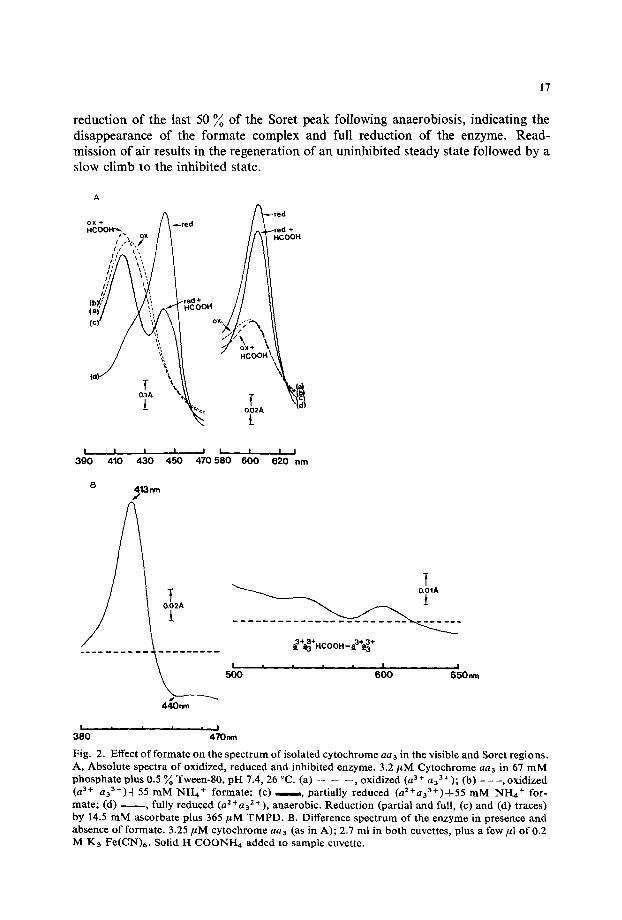
reduction of the last 50 % of the Sorer peak following anaerobiosis, indicating the disappearance of the formate complex and full reduction of the enzyme. Read- mission of air results in the regeneration of an uninhibited steady state followed by a slow climb to the inhibited state.
A
/ / ~ r e d
i i , , ~', I I I ii / ~, I: A / / l '°" / \ "Y \ °xx./;;%
i oi,,
| I I I I I I I l
390 410 430 450 470 580 600 620 nm
B 413 nm /
440nm
I i * i * I I
500 600 650nm
| I ! I I •
380 470nm
Fig. 2. Effect of formate on the spectrum of isolated cytochrome aaa in the visible and Soret regions. A, Absolute spectra of oxidized, reduced and inhibited enzyme. 3.2 #M Cytochrome aa3 in 67 mM phosphate plus 0.5 % Tween-80, pH 7.4, 26 °C. (a) -- -- - - , oxidized (a 3+ a33+); (b) - - - , oxidized (a 3+ aa3+)+55 mM NI-I~ + formate; (c) , . , m , partially reduced (a2+aa3+)-t-55 mM NI-I4 + for- mate; (d) , fully reduced (a2+aaZ+), anaerobic. Reduction (partial and full, (c) and (d) traces) by 14.5 mM ascorbate plus 365 #M TMPD. B. Difference spectrum of the enzyme in presence and absence of formate. 3.25 #M cytochrome an3 (as in A); 2.7 ml in both cuvettes, plus a few #1 of 0.2 M Ka Fe(CN)6. Solid I~ COONH4 added to sample cuvette.
18
Fig. 2A gives the c~- and Soret-region spectra of the four states for the purified enzyme. Spectrum (a) is that of the oxidized enzyme with peaks at about 420 nm and 600 nm. Spectrum (b) is that induced by formate addition, showing a shift of 5 nm to the blue in the Sorer region and a slight sharpening of the peak at 600 nm. On addition of ascorbate+TMPD, which, in the absence of cytochrome c induces a rather slow but otherwise normal catalytic steady state [19], spectrum (c) is seen, that of a 'half reduced' state (a 2 +a 3 +). Unlike the corresponding spectra for the cy- anide, azide and sulphide complexes [9], the Soret peak of t he a3 3+ component re- mains at 415 rim, presumably as the a33+ HCOOH complex. The spectrum of the reduced cytochrome a component is then clearly separated at 445 nm. At anaerobio-
a2"a~* HCOOH /
a~? 3"HCN ; ~ ~2~3"HCOOH
| I i . I I 3 9 0 nm 470 580 6 0 0 620 nm
.~:~. ;" HCOOI ~k
370 470 nm
c 2 . 2 . 2 . 3 .
:a / \ O.01A /
I / / . I , I ~ ,
500 550 600 650 nm
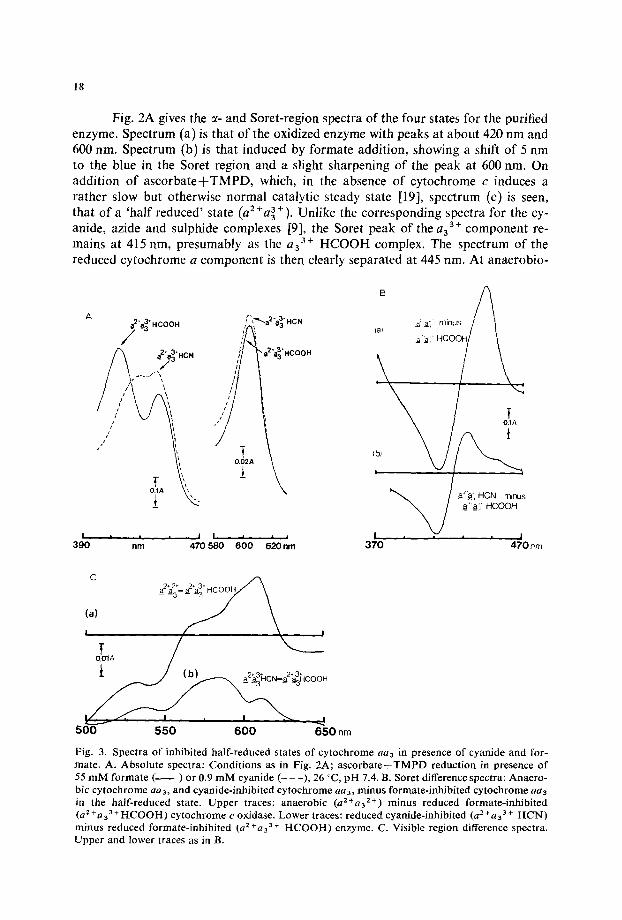
]Fig. 3. Spectra of inhibited half-reduced states of cytochrome aa~ in presence of cyanide and for- mate. A. Absolute spectra: Conditions as in Fig. 2A; ascorbateTTMPD reduction in presence of 55 raM formate ( ) or 0.9 mM cyanide (- - -), 26 °C, pH "1.4. B. Sorct difference spectra: Anaero- bic cytochrome aa3, and cyanide-inhibited cytochrome aa3, minus formate-inhibited cytochrome ae3 in the half-reduced state. Upper traces: anaerobic (a=+a32+) minus reduced formate-inhibited (a s +a33 +HCOOH) cytochrome c oxidase. Lower traces: reduced cyanide-inhibited (a 2 +a~ 3 + HCN) minus reduced formate-inhibited (a 2 +aa 3. HCOOH) enzyme. C. Visible region difference spectra. Upper and lower traces as in B.

19
sis (or on addition of dithionite) full reduction occurs at both 445 and 605 nm. As with cyanide, and unlike the cases of azide and sulphide [9], the half-reduced state shows no shift of the ~-peak compared with the anaerobic state.
Fig. 2B shows the difference spectrum of the oxidized enzyme in presence and absence of formate under slightly different conditions. Complete formation of the formate complex was achieved by addition of solid ammonium formate to the sample cuvette, in the presence of ferricyanide to prevent autoreduction. A sharp peak at 413 nm (a) and small changes in the visible region (b) are seen. When other cytochrome a a 3 preparations were used, with initial Soret peaks at 423-425 rim, the formate difference spectrum gave a sharp trough in the 430 nm region (not shown). With oxidized preparations possessing Soret peaks at 418-420 nm, the formate dif- ference spectrum showed only a small trough in the 430-450 nm zone (Fig. 2B). Cytochrome a a 3 as prepared may contain a variable mixture of spin states, as suggested by its broad Sorer peak [2]. Further spectral comparisons were therefore made between the cyanide and formate complexes. Fig. 3A compares the half-reduced states obtained with cyanide and formate as terminal inhibitors. Cytochrome a is reduced in each case, and the difference spectrum, the Soret and visible regions of which are shown in Fig. 3B and C (lower traces), is that of a3 3 + HCN minus a 3 3 + HCOOH, in the presence of reduced cytochrome a. The half-reduced difference spectrum, where both haems are presumably in identical oxidation states, can then be compared with the dif- ference spectrum that appears on anaerobiosis (Fig. 3, B and C, upper traces). Again, according to the classical picture [2], this is the spectrum of an 2+ minus a3 3+
HCOOH, in the presence of reduced cytochrome a. Is the spectral (spin state?) shift that occurs on going from the cyanide to the
formate complex a function of the oxidation state of cytochrome a? Fig. 4 displays the difference spectrum between the cyanide and formate complex of the fully oxidized form of the enzyme, a spectrum which may be compared with its half-reduced coun- terpart in Fig. 3. A similar red shift is induced by cyanide in the Soret region, and an analogous, but possibly not identical 'low spin' 580 nm band is shown by the cyanide but not by the formate complex in the visible region.
370 I
{ a )
nm 470 , . I I , , , , I n n i I
500 6()0 nm 650
O.01A O.05A
a3+a33~-ICN minus a3+a3~l-ICOOU
Fig. 4. Difference spectrum of the cyanide and formate complexes of ferric cytochrome aa3. Con- ditions as in Fig. 2A, but in the absence of ascorbate plus TMPD, and in the presence of 180 #M ferricyanide to prevent autoreduction, pH 7.4, 26 °C. (a) Soret region, (b) visible region.

20
Kinetic aspects o f formate inhibition Steady state experiments carried out with cytochrome aa 3 plus cytochrome c,
or with intact submitochondrial particles (cf. Fig. 1) indicate the occurrence of similar spectral effects to those shown in Figs. 2-4, at more rapid overall rates. Dual wave- length experiments at 608-600 nm confirmed that no marked blue shift of the ~- peak occurs with formate under these conditions; this is also indicated in Figs. 2 and 3 above for the system turning over slowly with ascorbate plus TMPD alone.
Fig. 5 shows how fast formate reacts with the oxidized enzyme. The rate of this reaction (about 1.3 M-~ • s-1 at pH 7.48 and 26 °C) is unaffected bythe presence of ferric cytochrome c. The dissociation equilibrium constant is close to 1 mM (inset). The computed 'off' constant is then 0.0013 s- ~. The rate of formate displace- ment by cyanide (right hand side of figure) seems to be somewhat greater than this value, suggesting a direct displacement. As with cyanide [8] the 'off' constant can also be determined by measuring the rate of reduction of the half-reduced to the fully reduced form (cf. trace (b) in Fig. 1B). Fig. 6 shows the results of an experiment of this kind. The directly measured 'off' constant (indicated by the sloping line of trace (a) between dithionite and cytochrome c additions) is of the same order of magnitude (approx. 0.002 s- ~) as that computed from Fig. 5. However, the addition of catalytic amounts of cytochrome c accelerates the reduction (and therefore the dissociation rate of formate) to a rate of 0.035 s-~. A similar acceleration is seen in the case of the cyanide complex (trace b), although both dissociation rates are much smaller for this complex than for the formate complex.
Table II lists the apparent K~ values (50 % inhibition or 50 % binding) together with rates of formate association and dissociation. K i values are highest, and "kof["
S
/ / /
/'
/0.013 s /
413-430nm
+ O,95mM formate/J
I / /
*9"5 mM/ / f '~ format~/ /~
/ /~0 '0022 s -1 J
~+0.95mM ~---- 5min..~-Jl formate
+0.9mM
...4 f'-
4-36 mM f ~ +0 9ram +3.7raM f°rma!e/. - - ~ - - - - XX,I//KeN 'orm 4eSt- . . . . . . . . k +tSmM
. . . . ~ / KCN formate j _ - . . . . . . \ r.t~- - + 3.5mM f //KCN
S
1 i ~, '\t
-T- i .... 0.02 A I ~ ! J ' I
Fig. 5. Kinetics o f fo rmate binding to oxidized cy tochrome aaa, and its displacement by cyanide, measu red spectrophotometr ical ly . Main figure: increase in 413-430 n m absorbance on adding excess of fo rmate (left hand initial trace) or a series o f small al iquots (right h a n d initial trace) o f formate and cyanide. Inset: change in absorbance with respect to formate concentrat ion, plotted as 1/(1--~t) where c~ = propor t iona l convers ion to aa3- formate (100 % ~ c~ o f 1.0). Condi t ions as in Figs. 2 and 3, p H 7 .48.26 °C.
21
445nm ---'-
10 nmoles cyt c
dithionite O.~A
(b) + HCN . . . . . . ~_
(a) + f o r m a t e ~ ~-40 s--a
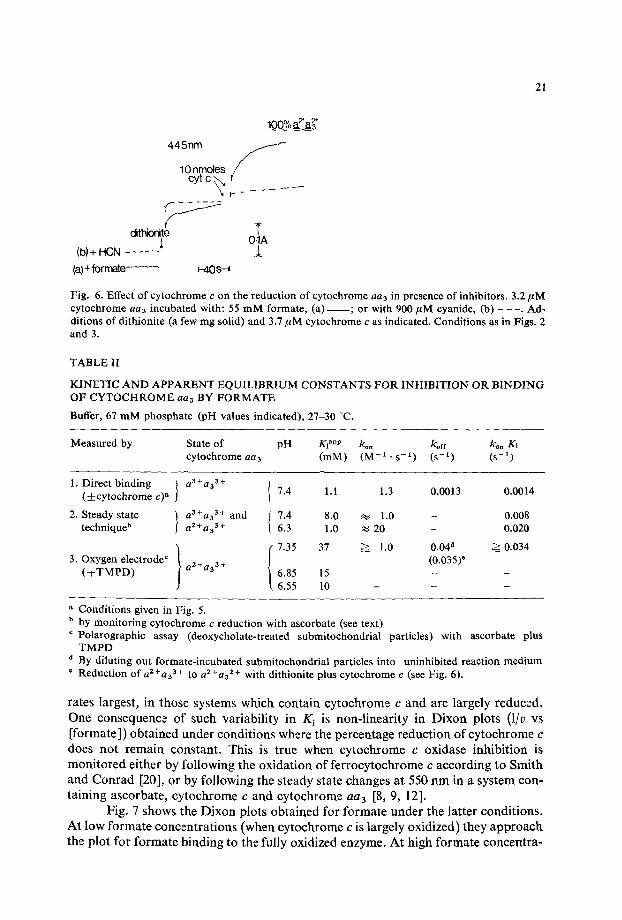
Fig. 6. Effect of cytochrome c on the reduction of cytochrome aa3 in presence of inhibitors. 3.2/*M cytochrome aaa incubated with: 55 mM formate, (a)- ; or with 900/zM cyanide, (b) - - -. Ad- ditions of dithionite (a few mg solid) and 3.7 #M cytochrome c as indicated. Conditions as in Figs. 2 and 3.
TABLE II
KINETIC AND APPARENT EQUILIBRIUM CONSTANTS FOR INHIBITION OR BINDING OF CYTOCHROME aa3 BY FORMATE
Buffer, 67 mM phosphate (jpH values indicated), 27-30 °C.
Measured by State of pH KI app ko. kofr ko. Kl cytochrome aa3 (raM) (M - I • s -~) (s - l ) (s - l )
1. Direct binding } a3+a33+ { (~:cytochrome c) a 7.4 1.1 1.3 0.0013 0.0014
2. Steady state ~ aa+aa 3+ and / 7.4 8.0 ~, 1.0 - 0.008 techniq ueb / aZ+as 3+ t 6.3 1.0 ~ 20 - 0.020
3. Oxygen electrode c a2+a33 + (0.035) e (d-TMPD) 6.85 15 - - -
6.55 10 - - -
Conditions given in Fig. 5. b by monitoring cytochrome c reduction with ascorbate (see text) c Polarographic assay (deoxycholate-treated submitochondrial particles) with ascorbate plus
TMPD a By diluting out formate-incubated submitochondrial particles into uninhibited reaction medium e Reduction of a 2+a33 + to a 2+aa 2+ with dithionite plus cytochrome c (see Fig. 6).
rates largest , i n those sys tems which c o n t a i n cy toch rome c a n d are largely reduced . O ne consequence o f such var iab i l i ty in Ki is n o n - l i n e a r i t y in D i x o n plots ( l / v vs [ formate ]) o b t a i n e d u n d e r cond i t i ons where the percentage r educ t i on o f cy toch rome c does n o t r e m a i n cons tan t . This is t rue w h e n cy toch rome c oxidase i n h i b i t i o n is m o n i t o r e d ei ther by fo l lowing the o x i d a t i o n of f e r rocy toch rome c accord ing to Smi th a n d C o n r a d [20], or by fo l lowing the s teady state changes a t 550 n m in a sys tem con- t a i n i n g ascorba te , cy toch rome c a n d cy toch rome aa3 [8, 9, 12].
Fig. 7 shows the D i x o n plots o b t a i n e d for fo rma te u n d e r the la t te r cond i t ions . A t low fo rma te c o n c e n t r a t i o n s (when cy toch rome c is largely oxidized) they a p p r o a c h the p lo t for fo rma te b i n d i n g to the ful ly oxidized enzyme . A t h igh fo rma te c o n c e n t r a -

22
) " ' ' " o . , ~
s4 ," / =oo,:~.K-"
3 / n . : Olo !/// .;" ~ o r b a t e -TMPD
Oi ~ i i i
25 50 75 100 mM formate
Fig. 7. Dixon plots of reciprocals of rates against formate concentration. Control activity ~ 1.0 in all cases. O, UI, 80 nM cytochrome aa 3 in presence of 33 ttM cytochrome c and 1.9 mM ascorbate; 67 mM phosphate plus 0.5 ~ Tween-80, in absence (©) and in presence ([]) of 0.5 ~ asolectin. Maximal turnovers between 300 and 400 s- ~. T, A, deoxycholate-treated submitochondrial parti- cles (80 and 160 nM aa3 equivalent) in presence of 30/tM cytochrome e and 0.7 mM (y ) or 3.6 mM (A) ascorbate. II, deoxycholate-treated submitochondrial particles in the oxygen electrode system, with 26/~M cytochrome c, 7.9 mM ascorbate, 260 ItM TMPD, and preincubating the particles with formate for 30 to 60 rain. '~o c' indicates reduction level of cytochrome c in steady state spectro- photometric systems (O, ~], v , A) where v ~ ([c2+]/[c3+])o. ([c3+]/[c2+lh and subscripts 'o' and 'i" indicate before and after formate addition, respectively (cf. refs. 8, 9). ' a 3 + a 3 3 + ' indicates slope of 1/(1 --~) line inserted from inset in Fig. 5.67 mM phosphate, pH 7.4, 27"-30 °C.
tions the plots obtained by the steady state method are parallel to the plot obtained in the presence o f T M P D by the oxygen electrode technique, in which cytochrome e is kept nearly fully reduced. Both the isolated cytochrome aa3 and the ' intact ' mem- brane preparat ions behave in this way. This phenomenon is seen at high (7.4) and at low (6.3) p H values. But the rate o f formate binding increases, and the apparent K~ values decrease as the p H decreases, at both high and low cytochrome c reduction levels (see data in Table II). An explanation is thus offered for the phenomenon seen in Fig. IA, where the initial reduction level on addit ion o f formate is higher than the final steady state, following the increase in K~. Dur ing a series of formate additions in the steady state (eft ref. 12) the half times for successive changes decrease, which also reflects increasing values o f K i and the dissociation velocity constant.
Inhibition o f electron transport in the intact respiratory chain and in mitochondria In the succinate oxidase system [12] at very low steady state levels of cyto-
chrome c reduction, the addit ion o f formate causes an inhibition on the oxidase side o f cytochrome c, and hence increases the steady state reduction level. With particles and in media permitting higher uninhibited cytochrome c reduction levels anomalous results are obtained (Fig. 8). The initial effect o f formate was a ' lag' phase or a decline in the reduction level o f cytochrome c, followed later by a rise. Such effects were ab- sent f rom, or much less marked in the N A D H oxidase system. Secondly, formate addit ion to untreated particles induced only small changes in the redox state o f en-
23
100%
2/Jmol 550-540nm NaN3 / I
~ dithionite / \lOO~moL :
t/5OpmoI ,formate j' 3/Jmol [ ~.fofmate ~' •
- - - - t t a ° " . . . . . . . . 4 I ~
NADH(a). !/£O~I" " ""'" ~A ........... (b) "~r ~uccinate O.
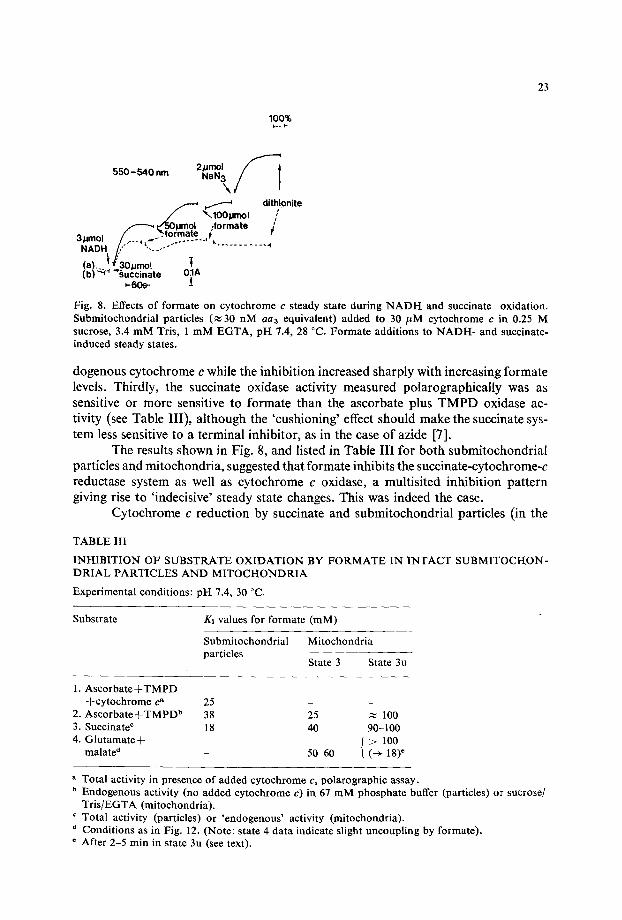
Fig. 8. Effects o f formate on cy tochrome c s teady state dur ing N A D H and succinate oxidat ion. Submitochondr ia l part icles ( ~ 30 n M aa3 equivalent) added to 30 # M cytochrome c in 0.25 M sucrose, 3.4 m M Tris, 1 r aM E G T A , p H 7.4, 28 °C. F o rma te addi t ions to N A D H - and succinate- induced steady states.
dogenous cytochrome c while the inhibition increased sharply with increasing formate levels. Thirdly, the succinate oxidase activity measured polarographically was as sensitive or more sensitive to formate than the ascorbate plus TMPD oxidase ac- tivity (see Table III), although the 'cushioning' effect should make the succinate sys- tem less sensitive to a terminal inhibitor, as in the case of azide [7].
The results shown in Fig. 8, and listed in Table III for both submitochondrial particles and mitochondria, suggested that formate inhibits the succinate-cytochrome-c reductase system as well as cytochrome c oxidase, a multisited inhibition pattern giving rise to 'indecisive' steady state changes. This was indeed the case.
Cytochrome c reduction by succinate and submitochondrial particles (in the
T A B L E III
I N H I B I T I O N OF S U B S T R A T E O X I D A T I O N BY F O R M A T E IN I N T A C T S U B M I T O C I - [ O N - D R I A L P A R T I C L E S A N D M I T O C H O N D R I A
Exper imenta l condi t ions: pI-I 7.4, 30 °C.
Substrate K~ values for formate (raM)
Submitochondr ia l Mi tochondr ia particles
State 3 State 3u
1. A s c o r b a t e + T M P D + c y t o c h r o m e c • 25 - -
2. A s c o r b a t e + T M P D b 38 25 ~ 100 3. Succinate ¢ 18 40 90-100 4. G l u t a m a t e + ~ > 100
malate a - 50-60 ~ (---> 18) *
a Tota l activity in presence o f added cy tochrome c, polarographic assay. b Endogenous activity (no added cy tochrome c) in 67 m M phospha te buffer (particles) or sucrose/
T r i s / E G T A (mitochondria) . c Tota l activity (particles) or ' endogenous ' activity (mitochondria) . d Condi t ions as in Fig. 12. (Note: state 4 da ta indicate slight uncoup l ing by formate) . = After 2-5 rain in state 3u (see text).

24
8 i
i
"71 0 / Sl n-2
O~ lb ,2b 3b 4'0 s'o 6~ ~ 8~omMEforrnate-~(o) 0 1000 2000 3~000 4()00 5000(rnM)' [forrnate]=(.)
Fig. 9. Dixon plots for formate inhibition of succinate-cytochrome c reductase activity. ©--©, l/v plotted against [formate]; • - - • , 1Iv plotted against [formate] 2. 18/,g ml- ~ submitochondrial particles (8.8 nM aa3 equivalent) reducing 30/tM cytochrome c; 19 mM NaN3, 11.5 mM succinate, 67 mM Na+/K + phosphate pH 7.4, 28.5 °C, 550-540 nm measurements.
presence of 19 m M azide as terminal inhibitor) was blocked by formate, but not by acetate. Dixon plots of this inhibition show an upward curvature (i.e. in the opposite direction to that seen with the cytochrome c oxidase plots given in Fig. 7) as in Fig. 9. Replotting the data against the square of the formate concentration, assuming that n ~-- 2 for the inhibition, gives an approximately straight line. The amount of formate (150) required for 5 0 ~ inhibition increased f rom l l m M at 3 .9raM succinate through 20 m M at 11.5 m M succinate to 33 m M at 34,5 m M succinate. The values of I s o 2 are thus proportional to succinate concentration, indicating that one molecule of succinate can compete with two of formate, presumably at the succinate dehydrogenase level.
Complex responses are also seen when the intact mitochondrial system is treated with formate. Outer-membrane-stripped mitochondria (cytochrome-c-de- ficient mitochondria added to a cytochrome c-containing medium) reduce cytochrome c on addition of succinate as do submitochondrial particles. Formate addition, both in state 4 and in state 3u (FCCP present) induces an initial sudden drop in the steady state reduction, followed after a brief lag by a rise indicating terminal inhibition. The inhibition on the reductase side is thus much less marked in the mitochondria, per- haps because active succinate accumulation keeps the dehydrogenase saturated.
Fig. 10 shows that both states 4 and 3u are formate-sensitive, but respiration rates with succinate and normal rat liver mitochondria show that state 3u is less sensitive than state 3; this is like the case of azide [21], where FCCP releases in- hibit/on in state 3. Table I I I gives some illustrative values. Because of (i) the potential inhibition of succinate dehydrogenase (Fig. 9) and (ii) the effects of cytochrome c redox level on K i (Fig. 7) these rather small differences cannot be interpreted reliably.
However, Fig. l 1 shows that there is evidence for release of the formate in- hibition of coupled respiration by FCCP addition to rat liver mitochondria oxidizing a s c o r b a t e + T M P D in 'state 4'. The apparent respiratory control ratio rises from

25
lOO% ~.-
,' / ', 50~mol , , , formate } 15nmol ',. >~
," Fccp
........ " J \ / / r ~,'-~ I', -"'---, ,-" t 01A
( b ) ~ _ . ~ ,, L". ~, 50~mot t ' , - ~ "~30jumol formate J-
lnmol ' succinate rotenone ~60s~
Fig. I0. Response of outer-membrane-stripped mitochondria to formate in the coupled and un- coupled states. 75/4 cytochrome c-deficient rat liver mitochondria (~ 0.9 mg protein) added to 2.6 ml of 0.25 M sucrose, 3.4 mM Tris, 1.0 mM EGTA medium plus 33 yM cytochrome c and further additions as indicated. Final volume 2.7 ml, pI-[ 7.4, 27 °C. 550-540 nm. (a) - - - (and dashed arrows), formate added before FCCP; (b) (and solid arrows), FCCP added before formate.
1.5 to 2.9 as the formate concentra t ion is increased f rom zero to 86 m M ; the Ki
for formate lies between 20 and 25 m M in the absence o f F C C P and between 90 and
100 m M in its presence. The p redominan t effect here may be a shift in the rate-
l imiting step f rom the FCCP- independen t cytochrorne c reduct ion to the F C C P - dependent cy tochrome c oxidation.
M w Formate (F) none
46 ~,/'/~-" 13 mM
/ ~ N ~ S ~ F ~ 86mM I /"f 2 " " ,
11-6o --I
Fig. 11. Inhibition of mitochondrial oxidation of ascorbate plus TMPD by formate, and its release by uncoupler. Polarographic experiments with 0.31 mg ml- t (protein) rat liver mitochondria (Mr) oxidizing 7.9 mM ascorbate and 0.66 mM TMPD in 250 mM sucrose, 3.4 mM Tris, 5 mM phos- phate, 1.0 mM EGTA, pH 7.4, 31 °C. 'F' indicates addition of 13, 26, 53 and 86 mM formate, and 'FCCP' addition of 0.26 pM FCCP. Note: time scale runs from right to left.

26
25 umol ' ~ . ~-'~2.5 pmol forma~/\~/REM glutamate
./ ~<~ lOpmol Ki>,oomM .#Amo, ":'/ \
j oc 7 /
5 M02 K i ~18 mM / _ / ~ / / ~5min-----I
_ _ / ......... 02-0
Fig. 12. Inhibition of mitochondrial oxidation of glutamate plus malate by formate, its release by uncoupler, and the final increased inhibition. Polarographic experiments with 0.96 mg ml- 1 (protein) rat liver mitochondria oxidizing 3.3 mM glutamate plus 13 mM DL-malate (i.e. 6.5 mM L-malate) in 250 mM sucrose, 3.4 mM Tris, 5 mM phosphate, 1.0 mM EGTA, pH 7.2, 30 °C. Additions of 2.6 mM ADP, 0.4/~M FCCP and formate as indicated. 'Kt' indicates apparent Kt for formate in states 3 3u and 3u (final inhibited). Note: time scale runs from right to left.
As NADH-cytochrome c reductase is formate insensitive, FCCP release of formate inhibition was studied with glutamate plus malate as substrate. The initial release of formate inhibition of state 3 respiration by FCCP, shown in Fig. 12, lasts not more than about 2 rain and is followed by a more powerful inhibition of state 3u flux by formate. This phenomenon indicates a third site of formate in- hibition in the intact mitochondrion, involving the glutamate-oxaloacetate trans- aminase, the malate dehydrogenase, or a membrane metabolite carrier as formate sensitive. The K i values in the glutamate-malate system (Table III), like those with succinate, must therefore be treated cautiously as deriving from multiple inhibition sites.
Mitochondria were also incubated with formate and then diluted out into media free of formate but containing substrate and uncoupler. The lag phases in restoration of activity observed were of the order of 17 s (pH 7.4, 30 °C), no greater than similar lag phases obtained with submitochondrial particles. The rate of formate release is controlled by the off constant at the catalytic centre (,~ 0.04 s-1, Table II) and not by the rate of formate diffusion across the inner mitochondrial membrane. Mitochondrial swelling experiments with ammonium salts, according to Chappell and Haarhoff [22], confirmed that formate was a permeant anion. Slightly slower than acetate, perhaps because of its lower pK value, it nevertheless moved at least as rapidly as did phosphate, and therefore much faster thart the binding reactions (cf. Figs. 11 and 12).
DISCUSSION
Formate as a ligand for cytochrome aa3 Formate seems to be unique among cytochrome e oxidase inhibitors in leaving
the 413 nm peak, observed with the ferric form, in approximately the same place in the half-reduced (a 2 +a33 + HCOOH) species (Fig. 2). The Soret peaks characteristic of reduced cytochrome a and oxidized cytochrome a3 are therefore clearly separated.

27
The a-peak of the half-reduced formate-inhibited form is however closely similar to that seen with a typical low spin ligand such as cyanide (Fig. 3); the correlation between the height of this peak and that of the asymmetric 'cytochrome a' Soret band in both cyanide and formate complexes, as well as in the aerobic uninhibited steady state (cf. Fig. 1), shows that the classical picture of cytochrome a as a haemochromogen- like compound [2] is quite consistent with the new observations.
The difference spectrum between the cyanide and formate complexes is rather similar whether the fully oxidized enzyme (cytochrome a ferric) is used (Fig. 4) or the half-reduced species (cytochrome a ferrous, Fig. 3). This suggests that cyanide may induce the same spectral change (spin state change?) in cytochrome a 3 whether cy- tochrome a haem is reduced or oxidized. The broad absorption in the visible region indicates such a change in both states (cf. Fig. 3C, lower trace, with Fig. 4 trace (b)). Such a conclusion is necessary if the 'difference' method of obtaining the spectrum of "cytochrome a 3 F e E + minus aa Fe 3 +" is to be valid. Figure 3C (upper trace), which shows the apparent spectrum of 'cytochrome a 3 F e 2+ minus a 3 F e 3+ HCOOH', can be compared with that obtained using the difference method by deducting the presumed cyanide effect [23]. The two are similar but not identical.
It can therefore be suggested that both formate-a33+ and cyan-a33+ remain in the same spin state as cytochrome a becomes reduced (high-spin for formate, low- spin for cyanide). Azide, on the other hand, gives a half-reduced Soret band much like that with cyanide (see Fig. 1 in ref. 9), yet its action on the fully oxidized spectrum is rather small [24]. It thus seems likely that a red-shift occurs in the Sorer peak of the azide-a33+ complex as cytochrome a becomes reduced, suggesting a high ~ low- spin change. EPR measurements show the appearance of a low-spin azide signal on reduction of cytochrome a [25]. Azide binding is known to shift the spectrum of reduced cytochrome a towards the blue [21], and this shift may thus reflect the spin state change in the other haem group. It may be noted that azide is the one ligand that gives rise to both high- and low-spin complexes with other haem proteins (Table I).
Although formate gives no spectroscopic sign of haem-haem interactions, like cyanide [8] it does show kinetic evidence of such interactions (Fig. 7, Table II). The half-reduced form has about a thirty fold lower affinity for formate than the oxidized form. This lowered formate affinity on reduction of cytochrome a (or cop- per) is apparently largely due to an increased rate of formate dissociation (Table II). This increase cannot however be secured unless cytochrome e is present, even if dithionite has reduced the rest of the molecule (Fig. 6). Electron transfer to the a3 haem does not occur readily from ferrous cytochrome a, but requires cytochrome e as a catalyst. Moreover the rate of reduction of cytochrome a 3 in presence of excess formate is not a simple measure of the rate of formate dissociation. The electron seems actively to displace the ligand (that is, the liganded form is not 100 % inhibited). Fig. 6 suggests that the same may be true for the cyanide complex. The cyanide com- plex is the opposite of the formate complex with respect to its apparent Ki (or Kd) value, which was postulated to decrease on going from the cyan-ferric to the half- reduced cyanide-blocked species [8].
Both cyanide (Fig. 5) and azide [12] compete with formate for its binding site. I tentatively conclude that formate can bind, essentially in the form of the undisso- ciated acid, at the sixth coordination position of the ferric cytochrome a 3 iron to give a high-spin ferric complex similar to that with catalase [6].
28
Formate as a respiratory inhibitor The action of formate on the intact respiratory chain clearly cannot be ac-
counted for solely in terms of its effects on cytochrome aa 3 (Figs. 8, 11 and 12). Firstly, it is not only a competitive inhibitor of the particulate succinate dehydroge- nase system (Fig. 9), but rather unexpectedly reacts according to a square law, so that K~ for succinate becomes K m (K' i+[IJ2)/K' i where K'j = 9 . 1 0 -6 M 2 at pH 7.4, 27 °C. It is tempting to think that two molecules of formate together are needed to simulate one molecule of the classical inhibitor malonate; formate is reported to act as an activator of the soluble dehydrogenase [26] but no detailed binding studies have been reported.
Formate, although it interacts with cytochrome an3 in both energized and de- energized systems (Fig. I0), inhibits state 3 respiration rather more than state 3u respiration (Table III and Fig. 11 ). It thus mimics azide [21 ] in this respect, and makes it unlikely that the behaviour of tile latter towards coupled systems has anything to do with the s-peak shift of ferrous cytochrome a. Formate induces no such shift (Figs. 2 arid 3). Kinetic explanations of the release of azide and formate inhibition by uncouplers [27] are rendered more likely. But the multiple effects of formate make a quantitative analysis of its action difficult. In the glutamate-malate system, which was used instead o f succinate because NADH dehydrogenase appears formate-insensitive, a third type of formate inhibition became apparent after a few minutes' incubation of the mitochondria in state 3u (Fig. 12), the locus of which remains to be identified.
The hope that formate could be used as a topological probe for cytochrome a3 location in membranes [12] has not been realised. Although it takes a finite time to penetrate the mitochondrion, its binding rate is too slow for any advantage to be taken of this. Studies are, however, being made with artificial cytochrome oxidase- containing vesicles, whose formate permeability may be lower than that of mito- chondria.
Finally, could formate act as a physiological inhibitor of cytochrome c oxidase? Of the available ligands, it is the only one that occurs in appreciable quan- tities in vivo. It is normally metabolised to formyltetrahydrofolate or oxidized to CO2 directly (in bacteria) or peroxidatively by H202 and catalase (in some mammals). It is unlikely that formate could reach even the millimolar level needed to bind ferric enzyme, let alone the 20-fold higher level required to block the fully active system. Cytochrome e oxidase remains an enzyme for which no natural controlling substrates have been identified and whose action in vivo depends only on its substrates, cyto- chrome c and oxygen, and the energization state of the mitochondrial membrane.
A C K N O W L E D G E M E N T S
Cytochrome c oxidase, and mitochondrial preparations, were made by Jack P. Pedersen. I also thank Finn B. Hansen, Mette Miller, and Lars Chr. Petersen for discussions. The Hitachi Perkin-Elmer 356 was purchased from a grant to Dr. Hans Degn by the Danish Science Research Council (Statens Naturvidenskabelige Forskningsrgtd).
29
REFERENCES
1 Keilin, D. (1966) The History of Cell Respiration and Cytochrome (J. Keilin, ed.), Cambridge University Press, Cambridge
2 Lemberg, R. (1969) Physiol. Revs. 49, 48-121 3 Tiesjema, R. H., Muijsers, A. O. and van Gelder, B. F. (1973) Biochim. Biophys. Acta 305, 19-28 4 Leigh, J. S., Jr., Wilson, D. F., Owen, C. S. and King, T. E. (1974) Arch. Biochem. Biophys. 160,
476-486 5 Nicholls, P. (1962) Oxygenases (Hayaishi, O., ed.), pp. 273-305, Academic Press, New York 6 Nicholls, P. and Schonbaum, G. R. (1963) The Enzymes (Boyer, P. D., Lardy, H. and Myrbiick,
K., eds.), 2nd edn, Vol. 8, pp. 147-225, Academic Press New York 7 Nicholls, P. and Chance, B. (1974) Molecular Mechanisms of Oxygen Activation (Hayaishi, O.,
ed.), pp. 479-534, Academic Press, New York 8 Nicholls, P., van Buuren, K. J. H, and Van Gelder, B. F. (1972) Biochim. Biophys. Acta 275,
279-287 9 Nicholls, P. (1975) Biochim. Biophys. Acta 396, 24-35
10 Muijsers, A. O., van Buuren, K. J. H. and van Gelder, B. F. (1974) Biochim. Biophys. Acta 333, 430-438
11 Ellfolk, N. (1961) Acta Chem. Scand. 15, 975-984 12 Nicholls, P. (1975) Biochem. Biophys. Res. Commun. 67, 610-616 13 Keilin, D. and Hartree, E. F. (1947) Biochem. J. 41,500-503 14 Petersen, L. C., Nicholls, P. and Degn, H, (1976), submitted for publication 15 van Buuren, K. J. H. (1972) Ph.D. thesis, University of Amsterdam, Gerja, Waarland 16 Chappell, J. B. and Hansford, R. G. (1972) Subcellular Components, Preparation and Fractio-
nation (G. D. Birnie, ed.), pp. 77-91, Butterworths and University Park Press, London 17 Jacobs, E. E. and Sanadi, D. R. (1960) J. Biol. Chem. 235, 531-534 18 Smith, L. and Camerino, P. C. (1963) Biochemistry 2, 1432-1439 19 Kimelberg, H. K. and Nicholls, P. (1969) Arch. Biochem. Biophys. 133, 327-335 20 Smith, L. and Conrad, H. E. (1956) Arch. Biochem. Biophys. 63, 403-413 21 Wilson, D. F. and Chance, B. (1967) Biochim. Biophys. Acta 131,421-430 22 Chappell, J. B. and Haarhoff, K. N. (1967) Biochemistry of Mitochondria (E. C. Slater, Z.
Kaniuga and L. Wojtczak, eds.), pp. 75-91, Academic Press, New York 23 Nicholls, P. (1974) Dynamics of energy-transducing membranes (Ernster, L., Estabrook, R. W.
and Slater, E. C., eds.), pp. 39-50, Elsevier, Amsterdam 24 Wever, R., Muijsers, A. O., van Gelder, B. F., Bakker, E. P. and van Buuren, K. J. H. (1973)
Biochem. Biophys. Acta 325, 1-7 25 van Gelder, B. F. and Beinert, H. (1964) Biochim. Biophys. Acta 189, 1-24 26 Kearney, E. B., Ackrell, B. A. C., Mayr, M. and Singer, T. P. (1974) J. Biol. Chem. 249, 2016-
2020 27 Nicholls, P. and Kimelberg, H. K. (1972) Biochemistry and Biophysics of Mitochondrial Mem-
branes (Azzone, G. F., Carafoli, E., Lehninger, A. L., Quagliariello, E. and Siliprandi, N., eds,), pp. 17-32, Academic Press, New York