The Effect Of Financial Derivatives On The Financial ...
62
THE EFFECT OF FINANCIAL DERIVATIVES ON THE FINANCIAL PERFORMANCE OF COMMERCIAL BANKS IN KENYA BY AKUN FAITH ANYANGO D61/74237/2014 A RESEARCH PAPER SUBMITTED IN PARTIAL FULFILMENT OF THE REQUIREMENTS FOR THE AWARD OF THE DEGREE OF MASTER OF BUSSINESS ADMINISTRATION OF UNIVERSITY OF NAIROBI. 2016
Transcript of The Effect Of Financial Derivatives On The Financial ...

THE EFFECT OF FINANCIAL DERIVATIVES ON THE FINANCIAL
PERFORMANCE OF COMMERCIAL BANKS IN KENYA
BY
AKUN FAITH ANYANGO
D61/74237/2014
A RESEARCH PAPER SUBMITTED IN PARTIAL FULFILMENT OF THE
REQUIREMENTS FOR THE AWARD OF THE DEGREE OF MASTER OF
BUSSINESS ADMINISTRATION OF UNIVERSITY OF NAIROBI.
2016

ii
DECLARATION
I declare that this is my original work and has never been presented for a degree in any
other university
Signature…………………………….. Date…………………….
AKUN FAITH ANYANGO
D61/74237/2014
This project has been submitted for examination with my approval as University
supervisor.
Signature…………………………… Date…………………….
DR. WINNIE NYAMUTE
DEPARTMENT OF FINANCE AND ACCOUNTING,
SCHOOL OF BUSINESS,
UNIVERSITY OF NAIROBI.

iii
ACKNOWLEDGEMENTS
I express my appreciation to my supervisor, Dr. Winnie Nyamute who dedicated a lot of
time and effort to my work. This undertaking would not have been possible without her
sincere comments, criticism, advice, and suggestions.
I would also like to thank the Central Bank of Kenya for unconditionally availing me the
information I needed. Special thanks to the entire teaching fraternity in the school of
business, University of Nairobi for affording me the opportunity to acquire the
knowledge required to fulfill this project.
Last but not least, I would like to thank my family members for their encouragements,
prayers, and financial support throughout the program.

iv
DEDICATION
This study is dedicated to my mum Florence Awino Akun for her tireless effort and
sacrifice to ensure I attain university education. My siblings for their guidance,
encouragement and caring support. The Almighty God for His unceasing blessings
without which it is impossible to accomplish anything.

v
TABLE OF CONTENTS
DECLARATION.............................................................................................................. ii
ACKNOWLEDGEMENTS ........................................................................................... iii
DEDICATION................................................................................................................. iv
TABLE OF CONTENTS ................................................................................................ v
ABSTRACT .................................................................................................................... xii
CHAPTER ONE: INTRODUCTION ............................................................................ 1
1.1 Background of the Study ........................................................................................... 1
1.1.1 Financial Derivatives.............................................................................................. 2
1.1.2 Financial Performance............................................................................................ 3
1.1.3 Effect of Financial Derivatives on Financial Performance .................................... 4
1.1.4 Commercial Banks in Kenya.................................................................................. 6
1.2 Research Problem ........................................................................................................7
1.3 Objective of the Study ...............................................................................................10
1.4 Value of the Study ......................................................................................................10
1.4.1 Regulators............................................................................................................. 10
1.4.2 Scholars and Researchers ..................................................................................... 10
1.4.3 Investors ............................................................................................................... 11
1.4.4 Practitioners .......................................................................................................... 11
1.4.5 Commercial Banks ............................................................................................... 11

vi
CHAPTER TWO:LITERATURE REVIEW ................................................................12
2.1 Introduction ................................................................................................................12
2.2 Theoretical Review.....................................................................................................12
2.2.1 Capital Structure Irrelevance Theory ................................................................... 12
2.2.2 The Financial Intermediary Theory ...................................................................... 13
2.2.3 The Risk Management Theory ............................................................................. 14
2.3 Determinants of Financial Performance ..................................................................15
2.3.1 Capital Structure ................................................................................................... 15
2.3.2 Risk and liquidity Management ........................................................................... 16
2.3.3Economic Conditions ............................................................................................ 16
2.4 Conceptual Framework .............................................................................................17
2.5Empirical Review ........................................................................................................17
2.6 Summary of Literature Review ................................................................................20
CHAPTER THREE: RESEARCH METHODOLOGY ..............................................22
3.1Introduction .................................................................................................................22
3.2Research Design ..........................................................................................................22
3.3 Population and Sample ..............................................................................................22
3.4 Data Collection ...........................................................................................................23
3.5 Data Analysis ..............................................................................................................23
3.5.1 Analytical Model ..................................................................................................... 23

vii
3.5.2 Test of Significance ................................................................................................. 25
CHAPTER FOUR: DATA ANALYSIS, PRESENTATION AND
INTERPRETATION .......................................................................................................26
4.1 Introduction ................................................................................................................26
4.2 Descriptive Analysis ...................................................................................................26
4.2.1 Return on Assets ...................................................................................................... 26
4.2.2 Financial derivatives .................................................................. ………………. 27
4.2.3 Liquidity Ratio ......................................................................................................... 28
4.2.4Shareholder‟s equity ratio ......................................................................................... 29
4.3Regression Analysis ..................................................................................................... 30
Model Summary ...............................................................................................................31
4.3 Interpretation of Findings .........................................................................................35
CHAPTER FIVE: SUMMARY, CONCLUSION AND RECOMMENDATIONS ...37
5.1 Introduction ................................................................................................................37
5.2 Summary .....................................................................................................................37
5.3 Conclusion ..................................................................................................................38
5.4 Limitations of the Study ............................................................................................39
5.5 Recommendations ......................................................................................................40
5.5.1 Policy Recommendations........................................................................................41
5.5.2 Suggestions for Further Research .........................................................................41

viii
REFERENCES .................................................................................................................44
APPENDIX I ....................................................................................................................50

ix
LIST OF TABLES
Table 4.1 Return on Assets ...................................................................................................26
Table 4.2 Financial Derivatives ............................................................................................27
Table 4.3 Liquidity Ratio ......................................................................................................28
Table 4.4 Shareholder‟s equity ratio .....................................................................................29
Table 4.5 Model Summary .................................................................................................31
Table 4.6 ANOVA Summary ...............................................................................................31
Table 4.7 Regression coefficients .........................................................................................33

x
LIST OF FIGURES
Fig.4.1: Return on Assets, 2011-2015 .....................................................................................27
Fig.4 2: Financial Derivatives, 2011-2015 ..............................................................................28
Fig. 4.3: Liquidity Ratio, 2011-2015 .......................................................................................29
Fig.4 4:Shareholder‟s equity ratio, 2011-2015 ........................................................................30
xi
LIST OF ABREVIATTIONS
CBA Commercial Bank of Africa
CBK Central Bank of Kenya
CFC Credit Finance Corporation
NSE Nairobi Securities Exchange
NIC National industrial credit
OBS Off balance Sheet Activities
ROA Return on Assets
ROE Return on Equity

xii
ABSTRACT
The increasing propensity of commercial banks to take part in derivative activities is one
of the notable developments in the present day financial markets. Latterly, the financial
innovation improvements, deregulation and development of the financial markets,and
banks‟ margins decreases, due to low-quality loan applicants, motivate the commercial
banks to provide advanced services and products to expand their profits. Profits from
traditional banking activities has been decresing whilst the competitiveness of markets
have been increasing thus forcing banks to undertake derivative activities.The objective
of this study was to establish the effect of financial derivatives on the financial
performance of commercial banks in Kenya. The study involved an in depth analysis of
financial derivatives and its effects on the financial performance of commercial banks
and thus descriptive research design was found to be appropriate. Secondary data about
the commercial banks‟ notional amount of derivatives, total assets, liquidity ratio and
total shareholders‟ equity was collected from the Central Bank of Kenya bank
supervision annual reports (2011-2015) and analyzed using multiple regression.
Statistical Package for Social Sciences (SPSS version 18) was used obtain the regression
output. Return on Assets (ROA) was used as the proxy for financial performance while
financial derivatives, liquidity ratio and shareholders‟ equity ratio were the predictor
variables.The findings of the study indicated that there is an insignificant relationship
between the financial performance (ROA) of commercial banks in Kenya and financial
derivatives. Additionally, the negative nature of the relationship means that a unit
change(increase) in financial derivatives will result to a decrease in financial perfomance
of commecial banks in Kenya.Consequently, therefore,financial derivatives should be
properly used in a manner that is instrumental to the goal of a sound and safe banking
system in kenya.
1
CHAPTER ONE
INTRODUCTION
1.1 Background of the Study
Derivatives go back similarly as Antiquity. Derivatives instruments were initially created
to promote trade and protect the supply of commodities to cover farmers against crop
failures. Over the years, derivatives were being used as a source of funding and also as a
means to search for quick profits. In order to protect the supply of commodities and
promote trade, both in geographical distance and time, the rulers‟ codes as a matter of
fact demanded a written form of buying, selling and other trade related agreements so as
to give sellers and buyers the best conceivable lawful assurance to take part in trade in
Ancient Mesopotamia. The primary reason for this was to minimize the “your word
against mine” saying in the event of disagreements. (Steve and Christian, 2012)
The utilization of derivatives instruments by commercial banks has risen in the previous
two decades. In spite of broadly accessible information on derivative utilization,
empirical research evidence on its effects is mixed. One conceivable reason to such
opposing outcomes is whether the banks utilize derivatives for hedging or trading
function. Data unveiled by a wide range of firms, including banking industries and non-
financial firms have been used by previous studies in attempting to enhance our
comprehension of how the firms utilize derivatives. Distinguishable assumption in almost
the greater part of all of this literature has been that firms, including financial firms,

2
utilize derivatives for hedging. Nevertheless, Faulkender and Chernenko(2011) indicated
that non-financial firms utilize derivatives for speculation as well as for hedging.
1.1.1 Financial Derivatives
These are financial instruments that derive their values from the values of other
underlying assets, like,interest rates,equities,commodities, foreign exchange and bonds.
E.g. a Treasury bond futures contract commits the parties to exchange a Treasury bond at
a future date for a predetermined price. The futures contract‟s value relies on the
underlying Treasury bond‟s value. By the way of illustration, supposing the treasury
bond‟s price increases, the futures contract‟s value will also increase because futures
contract‟s buyer now qualify to get an asset with a greater value.
The four primary kinds of derivatives instruments are options, forwards, swaps, and
futures.The users of these instruments are permitted to fullfill the need for efficient
protection against risks caused by the underlying security price changes. That is, those
who use derivatives are able to protect themselves against uncertainties in interest and
exchange rates, credit worthiness, as well as commodity and equity prices. Clearly,
derivative transactions include the transferingof risks from entities who are unable or less
willing to manage them to entities that are able or more willing to do so. Derivatives
insruments are currently popular amid a large number of both financial and non finacial
firms(Nystedt, 2004).

3
The traditional borrowing and lending activities of the commercial banks exposed them
to financial market risk and this is generally the reason why they take part in derivative
activities. Financial derivatives present a cost effective approach to manage these
financial market risk without attracting extra charges to the commercial banks. Banks can
use derivatives to hedge liability and asset positions as the instruments allow them to take
a position in the derivative market that is opposite and equal to a planned future or
current position in the cash or spot market. Thus, irregardless of the price changes, gains
in one market will balance losses in the other.
1.1.2 Financial Performance
This is a test of how properly a firm can utilize the assets from its essential business
operations to create incomes. Financial performance is typically utilized as the measure
of the general financial health a firm throughout a particular time period. Commercial
banks assume a critical part in allocating the country‟s economic resource as they
continuously direct funds from the depositors to investors. Banks need to be profitable in
order to ensure sustainable intermediation function. Good financial performance ensures
that the shareholders are rewarded for their investment. This, thus, motivates them to
bring in additional investment and hence leads to economic growth. Poor banking
performance on the other hand result to banking crisis and failure which have negative
impact on the economic growth.
De Young and Rice (2004) noted that in recent years, commercial banks have taken
advantage of deregulation to make handsome amounts of revenues from non-traditional
4
banking routines like derivatives usage, securities brokerage, investment banking and
mutual funds sales and insurance underwriting and agency. Interest margins that banks
earn by intermediating amongst borrowers and depositors keep on being the essential
profits source for most commercial banks.
The basic goal of commercial banks is profit but they also have other economic and
social goals. There are various ways to ensure the profitability of a bank but according to
Quach, (2005), the profitability of a bank is measured using three ratios. The first ratio is
the return on equity ratio (ROE), which is the amount that the banks earn relative to the
total amount of invested shareholders equity. A high ROE is favorable for a bank as it
shows its ability to generate cash internally. According to Khrawish (2011), it shows how
efficiently and effectively a bank is utilizing shareholders‟ funds.
The second ratio is the asset return ratio of the bank‟s net income to its average total asset
and it tests the bank‟s capacity to create income by using the assets at its disposal. A high
ROA shows the bank is efficiently utilizing its resources. The third ratio is the net interest
margin ratio which measures the amount of interest lenders are paid and interest income
created by banks. Higher bank profitability is associated with a higher net interest
margin. This could however also mean riskier lending practices associated with
considerable loan loss provision.
1.1.3 Effect of Financial Derivatives on Financial Performance
The increasing propensity of banks to take part in derivative activities is one of the
notable developments in the present day financial markets. Latterly, the financial

5
innovation improvements, deregulation and development of the financial markets,and
banks‟ margins decreases, due to low-quality loan applicants, motivate the commercial
banks to provide advanced services and products to expand their gains. Profits from
traditional banking activities has been decresing whilst the competitiveness of markets
have been increasing thus forcing banks to utilize derivative activities.Hasan and
Ebrahim(2004) found out that the betterment of the banks non-interest earnings was as a
result of developing new sorts of financial instruments.
OBS activities such as derivatives, commitments and guarantees are at times the primary
revenues sources of the bank. Commercial banks can evade taxes or regulatory costs and
generate high earnings by participating in derivative markets due to the fact that deposit
insurance premiums and reserve requirements are not enforced on off balance sheet
activities. Nevertheless, these activities can attract market,credit and operational risks and
other risks, which may influence liquidity and solvency of the commercial banks.
Conversly, notable increase in commercial banks‟ derivatives activities might be due to
increased credit,interest and foreign exchange rate risk exposures, banks encountered in
international and domestic markets. Financial derivatives provide a means to hedge these
risks without needing to make comprehesive adjustments to their statement of finacial
position.
Managing risks by using financial derivatives is less costly and could substitute for
expensive capital and give banks the flexibility to achieve their desired risk exposures
without changing their original business objectives. However, financial derivatives also

6
expose investors to additional risks. Entering a position in derivatives does not need
much initial investment, but future cash flows given fluctuation of the underlying assets
could be huge due to the high leverage behind the contracts. Thus, speculating and
inappropriate hedging with derivatives have the potential to cause severe financial losses
and even bankruptcy.
1.1.4 Commercial Banks in Kenya
Commercial banks are financial intermediaries that symbolize a vital and robust part of
the business world as they serve as the global economy‟s financial resources mobilization
points. An efficient, well-functioning, and well-developed banking sector is a critical
requirement for investment and saving decisions required for fast economic growth. This
is because a system by which the most efficient and profitable projects of a country are
continuously and systematically funded is provided by the banking sector. Commercial
banks channel the needed funds from surplus spending to deficit spending units in the
economy and this enables them to execute monetary policy and provide a means for
facilitating payment for services and goods in the international and domestic trade.
The traditional lending and borrowing activities of the commercial banks expose them to
financial market risk and this is generally the main reason why they participate in the
derivertive markets.Commercial banks can evade taxes or regulatory costs and generate
high earnings by participating in derivative markets due to the fact that deposit insurance
premiums and reserve requirements are not enforced on off balance sheet activities.
Nevertheless, off balance sheet activities can attract market,credit and operational risks

7
and other risks, which may influence liquidity and solvency of the commercial banks.
Conversly, notable increase incommercial banks‟ derivatives activities might due to
increased credit, foreign exchange and interest rate risk exposures, ecountered by the
banks in international and local markets. Financial derivatives provide a means to hedge
these risks without requiring them to make comprehesive adjustments to their statement
of financial position.
1.2 Research Problem
The commercial banks are working on innovative ways to achieve profits instead of
traditional methods, and hedging of systemic risks by using financial derivatives because
of the uncertainty and high volatility in the global and domestic financial markets.
Compared to on-balance sheet asset-liability management, managing risks by using
financial derivatives, normally known as off-balance sheet activities, gives the
commercial banks the flexibility to attain their preffered risk exposures without changing
their original business goals.derivative use is also less costly could substitute for
expensive capital. However, financial derivatives also expose investors to additional
risks. Entering a position in derivatives does not need much initial investment, but future
cash flows given fluctuation of the underlying assets could be huge due to the high
leverage behind the contracts. Thus, speculating and inappropriate hedging with
derivatives have the potential to cause severe financial losses and even bankruptcy.
8
There are 42 licensed commercial banks in Kenya. Kenya‟s derivatives market got a
boost after The Nairobi Securities Exchange (NSE) recently signed up six Banks who
will act as clearing members in readiness for the derivatives Market. The Co-operative
bank of Kenya, Stanbic bank, CBA bank, NIC bank, Barclays bank of Kenya and Chase
bank have already signed up as clearing members and a number of other banks are
scheduled to sign up in the near future.
Greenbaum Kanatas and Deshmukh, (1983) indicated that commercial banks that utilize
derivative can face less uncertainty in interest rates and thus increse their lending
activities which then lead to higher returns compared to the fixed fee for service activities
return.This is possible if the interest rate risk can be managed using derivatives. The total
gain of commercial banks that utilise derivatives to control uncertainty in interest rates
would therefore be higher than those that do not. Stern and Linan (1994) and Jason and
Taylor (1994) indicated that derivative trading for the purpose of profit is very risky and
can subject the firm to large amount of losses and as stated by the study conducted by
Pandey (2005) derivative contracts have developed rapidly from uncomplicated financial
futures to a broad range of complex and exotic securities all over the world. According to
Tsetsekos and Varangis, 1997; Ilyina, (2004) the use of derivatives can promote the
financial risk exposure management because they enable investors to transfer and
unbundle financial risk.
Kamenchu (2013) stated that trade liberation and legal framework are the major factors
hindering and slowing down the adoption the use of derivatives in Kenya. According to

9
Njoroge(2013)Kenyan companies commonly use swaps and forward contracts. The
companies‟ utilize swaps when they are planning to exchange cash flows in the future
while forward contracts are used to hedge against their imports and exports. Nzuki (2010)
indicated that Kenyan oil companies commonly utilize a hybrid of derivatives,
predominantly forward contracts and futures market. As they appear to think about the
price volatility of crude oil. Gitogo(2013) indicated that a relationship exists between the
commercial bank‟s financial performance and financial derivatives although his study
focused only on a time frame of 1 year. My study tends to fill the gap by focusing on a
time frame of 5 years (2011-2015) so as to get more reliable findings.
The utilization of derivatives by companies in the emerging markets for hedging purposes
has increased over the last few years. The derivative market has therefore faced a swift
growth in the recent times. Even though derivative utilization data is more broadly
accessible in the developed countries, empirical literature on if the utilization of
derivative results to a rise in the financial performance of a company is nevertheless
debatable mostly in the developing world.Previous literature mostly focuses on
determining how a firm‟s risk level of is altered by derivatives as derivatives are
contracts used to manage risks. This study will focus commercial banks which many
studies have not covered. Literature on how commercial bank‟s financial performance is
affected by derivatives is limited even though inappropriate derivative activities usually
result to a large amount of trading losses that could lead to bankruptcy and financial
difficulty and thus this study will answer the question do financial derivatives affect the
financial performance of commercial banks in Kenya.

10
1.3 Objective of the Study
To determine the effects of financial derivatives on the financial performance of
commercial banks in Kenya.
1.4 Value of the Study
1.4.1 Regulators
The study‟s findings will supply the regulators with deeper understanding that can be
used to facilitate best practices and regulatory policy formulation. The regulators like the
Capital Markets Authority, Central Bank of Kenya and Kenya Bankers Association can
use this study‟s findings, recommendations and conclusions to enact and improve
regulation and operation procedures of financial derivatives in Kenya.
1.4.2 Scholars and Researchers
Scholars will find this study‟s findings to be significant as it will provide an up to date
and top notch information on how the commercial bank‟s financial performance is
affected by the use of financial derivatives. Fellow researchers will also find this study‟s
findings to be of significance as they will rely on it for further proof and knowledge on
how the commercial bank‟s financial performance is affected by the use of financial
derivatives.
11
1.4.3 Investors
The this study‟s findings will benefit investors and potential investors as they will be able
to determine how commercial bank‟s financial performance is affected by the utilization
of financial derivatives and thus make better financial decisions.
1.4.4 Practitioners
Management teams of banking institutions can this study‟s findings to understand and
appreciate the necessary environment for financial derivatives to thrive. The study also
sheds light on major criticisms, shortcomings and risks that are associated with financial
derivatives instruments. In general, commercial banks practitioners and other participants
in the Kenyan financial sector can utilize the findings to better the nature, organization
and capital outlay of their present and future financial derivatives investments.
1.4.5 Commercial Banks
The commercial banks will utilize this study‟s findings and recommendations to allocate
resources to the areas that will spur growth of financial derivatives and deliver greater
returns to their shareholders.
12
CHAPTER TWO
LITERATURE REVIEW
2.1 Introduction
This chapter reviews the existing literature related to the subject of the study as described
by different scholars, authors, analyst and researchers. Literature review presents the
study with a clarification of the theoretical rationale of the problem under study and also
previous research finding that relate to the problem at hand. The literature is reviewed
from periodicals, published books, working papers and reports. This chapter explains the
theoretical orientation and empirical framework.
2.2 Theoretical Review
The theories reviewed here are capital structure irrelevance theory, financial intermediary
theory and the risk management theory
2.2.1 Capital Structure Irrelevance Theory
Modigliani and Miller (1958) developed the capital structure irrelevance theory which
implies that in a perfect world, a commercial bank‟s hedging activities and how the bank
is financed does not affect the equity value of the bank. Nevertheless, market
imperfections produce incentives for firms to hedge so that they can reduce the cost of
financial distress,increase their after-tax cash flow, and lower other costs like the agency
cost, cost of asymmetric information and expensive external financing cost.

13
According to Smithson, Nance and Smith (1993) and Smith and Stulz (1985)in a firm
with a convex expected corporate tax liability function and whose main objective is value
maximizion, when the pretax income is relatively high, hedging can result to a reduced
tax liability. An increase in the pre tax income will result to a increase in the benefits of
hedging if theafter tax cash flow functionis made more concave by the tax function.
Concurrently Stulz and Smith (1985) imply that hedging can result to reduced expected
cost of bankruptcy as the financial distress probability decreases with the reduced
variation in cash flow.Stein Scharfstein and Froot (1993) indicated that the demand for
costly external financing is reduced due to increased cash flows from hedging Therefore,
hedging activities of commercial banks‟ encouraged by thier wish to lower the future
investment‟s expensive external financing needs.
2.2.2 The Financial Intermediary Theory
The objective of intermediation theory is to clarify the existence of financial
intermediaries. In essence, the existence of financial intermediaries is as a result of
absence of complete information at the right time, presence of high cost of transaction
and the regulation method.Diamond (1984) developed the financial intermediary theory
which argues that banks should not take risks that they have no advantage of monitoring
orcannot be able to control. Permitting the commercial banks to hedge systematic risks
can lead to an additional decrease in the cost ofdelegation to monitor loan borrowers.
Therefore, hedging permits banks to get excellent profits from diversification by
decreasing the cost of delegation, that acts as a lending incentive.
14
Diamond (1984) indicated that delegated monitoring do not just presume economies of
scale but also provides a reason why depositors don‟t need to monitor the bank itself. He
found out that the bank‟s moral hazard problem decreases when the bank‟s size increases
and even disappears completely if the bank holds a portfolio of assets that is fully
diversified (including derivatives in their portfolio). Thus, the bank holding a portfolio of
assets that is fully diversified leads the depositors to hold debt contracts that are risk-free
and thus they do not need to continuously monitor the bank.
2.2.3 The Risk Management Theory
The theory of risk management (Stulz, 1996 and Froot 1993) argues that in order to bring
down the costs related to expensive external funding banks utilize hedging strategies. In
an unfavorable external environment the banks may find coming up with external funds
to be expensive (Admati(2012). A bank partly avoids the need for refinancing by hedging
undiversifiable risks (Froot 1993), mostly exchange and interest rate risks and thus
reducing its cost of funding.
Thakor and Boot(1991) imply that banks that have substantial off balance sheet activities
(e.g. loan commitments) reduce their risks exposures relative to those that lend on a spot
market. This depends on the perception that a bank is locked into the current interest rate
loan commitment locks into, which reduces the bank‟s borrowers asset substitution
problem incase future interest rates increases. In case the financial derivatives hedging
purpose prevails, it is expected that greater derivatives utilization is connected with less
uncontrollable risk exposures of a bank.

15
Nevertheless, using financial derivatives to hedge also has a disadvantage. In the event
that banks participate in the credit derivatives market, the informational value of a bank
loan stops to exist (Morisson 2005). More precisely, the bank is not exposed to the
borrower‟s prospective default anymore if it gets credit default protection. Hence, the
bank can no longer engage in its borrowers screening and monitoring, and thus an
increase in its risk. The primary business of banks with large sizes is trading and
generating financial derivatives together with other innovative financial products (Marinč
and Boot 2008). The banks‟ involvement in derivatives markets might therefore be
triggered by a motive to make profit rather than by hedging goals.
2.3 Determinants of Financial Performance
2.3.1 Capital Structure
Smithson, Nance and Smith, and (1993) and Stulzand Smith (1985) indicated that in a
firm with a convex expected corporate tax liability function and whose main objective is
value maximizion, when the pretax income is relatively high, hedging can result to a
reduced tax liability. An increase in the pre tax income will result to a increase in the
benefits of hedging if theafter tax cash flow function is made more concave by the tax
function.
Smith and Stulz (1985) also indicated that hedging can lead to a decrease in the expected
bankruptcy cost as because with decreased cash flow variation, the probability of
financial distress decreases. Stein, Scharfstein andFroot (1993) indicated that the demand
for expensive external financing is reduced as a result of increased cash flows from

16
hedging Therefore, hedging activities of commercial banks‟ encouraged by thier wish to
reduce the future investments‟ expensive external financing.
2.3.2 Risk and liquidity Management
Risk management of a firm impacts its financial performance. Choi and Elyasiani
(1996),Flannery and James (1984) found out that if the large banks‟ foreign exchange and
interest risk are measured as stock return‟s sensitivity to interest and foreign exchange
rate risk derivative reduce these risks. Hartarska and Shen (2013) indicated that during
the 2008 financial crisis derivatives assisted agricultural banks boost their profitability
and lower their sensitivity to credit risk and interest risk
Liquidity is also a determinant of banks financial performance and it is the ability of the
bank to meet its obligations. Dang (2011) suggest that a positive relationship exists
between banks profitability and adequate level of liquidity.
2.3.3Economic Conditions
Derivative instruments have increasingly become a crucial part of commercial banks
portfolio of assets that they use to mitigate their interest and foreign exchange rate risk
exposure. As volatility of interest rates continues to increase, commercial banks have
acknowledged the benefits of interest rate swaps and futures in decreasing risk and
attaining optimal financial performance.

17
2.4 Conceptual Framework
Risk Management
Financial
derivatives
Capital structure
Shareholder‟s
equity ratio
Liquidity
Liquidity
ratio
Financial performance of commercial
Banks
Return on Assets( ROA)
Independent Variables Dependent Variable
Banks‟ risks
Interest rate risks
Foreign exchange risks
Banks‟
leverage
Banks‟
Liquidity
position
2.5Empirical Review
Kanatas, Deshmukh and Greenbaum (1983) indicated that commercial banks that utilize
derivative can face less uncertainty in interest rates and thus increse their lending
activities which then lead to higher returns compared to the fixed fee for service activities
return.This is possible if the interest rate risk can be controlled using derivatives. The
Figure 1: Conceptual Framework

18
total profitability of commercial banks would therefore be higher relative to the banks in
which derivatives are not used to control for interest rates uncertainty.
Moser, Brewer, Saunders and Jackson conducted a study and found out that for savings
and loan institutions, a negative correlation exists between risk and derivative activities.
They found that there was a substantial increase in fixed-rate mortgage portfolios of
savings and loans (S&Ls) and thus indicating that derivatives are utilized by the financial
institutions for the purpose of hedging , which therefore clarify the decrease in the risk
volatility due to increase in derivative usage.
Rosen and Gorton (1995) found out that the net income changes as a result of to the
interest rate changes is partly neutralized by the opposite changes in net incomes from
hedging interest rate risk by using swaps, and therefore derivatives assist in managing
most of the uncontrollable risks at commercial banks. Moser and Zhao (2009b) indicated
that both the off- and on-balance sheet risk management methods of banks efficiently and
effectively decrease the interest rate sensitivity of bank stocks.
Choi and Elyasiani (1996),James and Flannery (1984) found out that derivative reduce
large bank‟s interest and foreign exchange risk if the risk is measured as stock returns
sensitivity to foreign exchange risk and interest rate risk respectively. Hartarska and Shen
(2013) indicated that during the 2008 financial crisis derivatives assisted agricultural
banks boost their profitability and lower their sensitivity to credit risk and interest risk.

19
Other studies indicated that commercial banks risks increases when they use derivatives.
Hirtle (1997), Elyasiani and Choi(1997), found out that large dealer BHCs stock returns
were more sensitive to uncertainties in interest rate than the other BHCs and that the
interest rate sensitivity of stock returns is increased by interest rate derivatives. Angbazo
(1997) found out that while off-balance sheet activities increased banks‟ exposure to on-
balance sheet liquidity risk and interest rate risk these activities also enhance profitability
of the bank by permitting activities otherwise restricted with equity or debt financing.
The results about how bank performance is affected by derivatives are mixed and this
probably because it is not easy to differentiate in practice hedging and speculating
derivative activities and that above studies focused on large banks which have
considerable speculating derivative activities and market making that permit them to
lessen, if not evade, non-hedging derivative activities disruptions.
Kamenchu (2013) stated that trade liberation and legal framework are the major factors
hindering and slowing down the adoption the use of derivatives in Kenya. According to
Njoroge(2013) Kenyan companies commonly use swaps and forward contracts. The
companies utilize swaps when they are planning to exchange cash flows in the future
while forward contracts are used to hedge against their imports and exports. Nzuki (2010)
indicated that Kenyan oil companies commonly utilize a hybrid of derivatives,
predominantly forward contracts and futures market. As they appear to think about the
price volatility of crude oil. Gitogo(2013) indicated that a relationship exist between the
commercial banks „financial performance and financial derivatives and although his

20
study focused only on a time frame of 1 year. My study tends to fill the gap by focusing
on a time frame of 5 years (2011-2015) so as to get more reliable findings.
Mumoki (2009) indicated that the the most frequently used instrument was the forward
contract. The money market hedge and the currency swap were also frequently used.
Parallel loans (Back-to-back loan), foreign currency denominated debt and cross hedging
techniques were moderately used. Futures contract, foreign currency option and leading
and lagging techniques were occasionally used. prepayment was the least used
technique..
Nasurutia(2013) found out that there was a significant relationship foreign exchange
exposure and derivative usage. And that given the negative nature of the relationship it
means that a unit change derivative usage will significantly influence a decrease in
foreign exchange exposure.consequently, therefore, derivative usage is effective in
management of foreign exchange exposure.
2.6 Summary of Literature Review
A number of both international and local studies have been carried out on different
features of derivatives financial performance and hedging of commercial banks. Locally
though, there is a rarity on studies that explore the relationship of the two.The results
about how bank performance is affected by derivatives are mixed and this probably
because it is not easy to differentiate in practice hedging and speculating derivative
activities and that above studies focused on large banks which have considerable

21
speculating derivative activities and market making that permit them to lessen, if not
evade, non-hedging derivative activities disruptions.
Some of the previous studies indicate thats derivatives act as a complement to banks‟
lending activities (Diamond 1984) while others find that derivatives find that derivatives
increase commercial banks‟ riskiness (Gorton and Rosen 1995). Literature on how
commercial bank‟s financial performance is affected by derivatives is limited even
though inappropriate derivative activities usually result to trading losses large enough to
lead to bankruptcy and financial difficulty.My study tries to fill these gaps in the existing
literature and present empirical evidence on how the commercial banks‟ financial
performance is affected by derivatives.
22
CHAPTER THREE
RESEARCH METHODOLOGY
3.1Introduction
This chapter highlights the methods used by researchers to undertake the research. These
methods include research design, population, sampling, data collection methods and data
analysis methods.
3.2Research Design
Research design is the structure and plan of analysis formulated so as to get answers to
research questions (Kerlinger 1986). Mugenda and Mugenda (1999) on the other hand
define research design as the outline plan or scheme utilized to obtain answers to the
research problems. Descriptive research design entails collecting data which outlines
events and then organizing, tabulating, depicting, and describing the collected data and it
normally employs visual aids like charts and graphs to assist the reader in understanding
distribution of the data (Glass and Hopkins 1984). Descriptive research design will be
appropriate for this study because it will involve an in depth study of how the financial
performance of commercial banks is affected by financial derivatives.
3.3 Population and Sample
A population is a well-defined or set of people, group of things or households, events,
elements, and services, that are being studied (Ngechu 2004). This definition ensures that
23
population of interest is homogeneous. The target population for this study is the
commercial banks who use financial derivatives in Kenya. The population of registered
commercial banks in Kenya as at December 31 2015 comprises of 43 banks according to
the Central Bank of Kenya.
3.4 Data Collection
Secondary data was used for the purpose of this study and this data was derived from the
commercial banks financial statements. Data from the Central Bank of Kenya was also
useful in the study. The study period was between2011-2015
3.5 Data Analysis
Both qualitative and quantitative data analysis methods were utilized for this study
because both approaches complement each other. Quantitative data analysis includes
descriptive statistics. Descriptive data analysis was done by use of measures of central
tendency which include means and standard deviations. Qualitative data was analyzed by
identifying, examining and interpreting of themes and patterns in the textual data and thus
discovering how these patterns and themes help in answering the research question. To
present the information, frequency tables, charts, graphs, words and figures were used.
Data analysis was done using SPSS and Excel software.
3.5.1 Analytical Model
Regression analysis involves many techniques used for modeling and analyzing various
variables with the focal point being the relationship between one or more independent
24
variables and a dependent variable (Tofallis 2009). A multiple linear regression method
of analysis was used in the study as it describes the extent of linear relationship between
the dependent variables and a number of other independent variables (Nachmias 1999).
This assisted in understanding the changes in the value of the dependent variable when
any one of the independent variables is varied while the other independent variables are
held constant.
Mathematically the linear regression line was expressed using the following equation
Performanceit=α+ β1DERit +β4EAit +β6LIQit+ εit
where:
Performanceit= Return on Assetsof bank ith at time t.
DERit= Derivative activities of bank ith at time t. Derivative activities are approximated
by the notional value of the contracts. Forwards, swaps and options are combined to be
one variable.
EAit= shareholder‟s equity to total assets of bank ith at time t.
LIQit= liquid assets to total assets of bank ith at time t.
ε it = random error-term.
βi the systematic risk for bank ith over the period ending at time t
The study employed return on assets as a proxy for profitability. The ratio of equity to
total assets was used to control for bank‟s leverage since the use of debts may lead to
better management. The liquid assets to total assets ratio was used to measure the bank‟s
liquidity position.

25
βi was used to measure bank‟s exposure in terms of foreign exchange rate and interest
rate risks due to derivative activities. These variables are included since derivative
activities have been widely used as a tool for banks in hedging against foreign exchange
rate exposures and interest rates risk.
3.5.2 Test of Significance
Correlation coefficient will be used to quantify the strength of linear relationship. The
value of the correlation coefficient ranges between +1 and -1. A positive correlation
suggests a positive relationship exists between the independent variables and the
dependent variable while a negative correlation implies a negative relationship between
variables.
In order to test the power of explanation of the entire regression equation, coefficient of
determination R2
will be used. To determine the degree to which changes in an
independent variable X can be used to explain changes in a dependent variable Y and
also the usefulness in a regression model, ANOVA techniques will be used.

26
CHAPTER FOUR
DATA ANALYSIS, PRESENTATION AND INTERPRETATION
4.1 Introduction
This chapter presents the data obtained as per the research methodology and its analysis.
The data was analyzed with the aid of the Statistical package for social sciences
(SPSS).The data is presented in tables in subsequent sections.
4.2 Descriptive Analysis
4.2.1 Return on Assets
The cumulative return on assets earned by commercial banks in Kenya yearly between
2011-2015 was obtained from the banking sector survey reports issued by the Central
bank of Kenya. Table 4.1 below shows the findings.
Table 4.1 Return on Assets
Year 2011 2012 2013 2014 2015
ROA (%) 4.40 4.70 4.70 3.40 2.90
Source: Research Findings
Commercial banks financial performance over the period covered by the study was
highest in the year 2012 and 2013, during which the return on assets stood at 4.70% in
both the years. The lowest ROA recorded over the entire period was 2.90% in 2015 and a
ROA of 3.40% and 4.40% was recorded in 2014 and 2011 respectively.Figure 4.1 below
further illustrates the trend in the commercial banks‟ performance over the study period.

27
Fig.4.1: Return on Assets, 2011-2015
Source: Research Findings
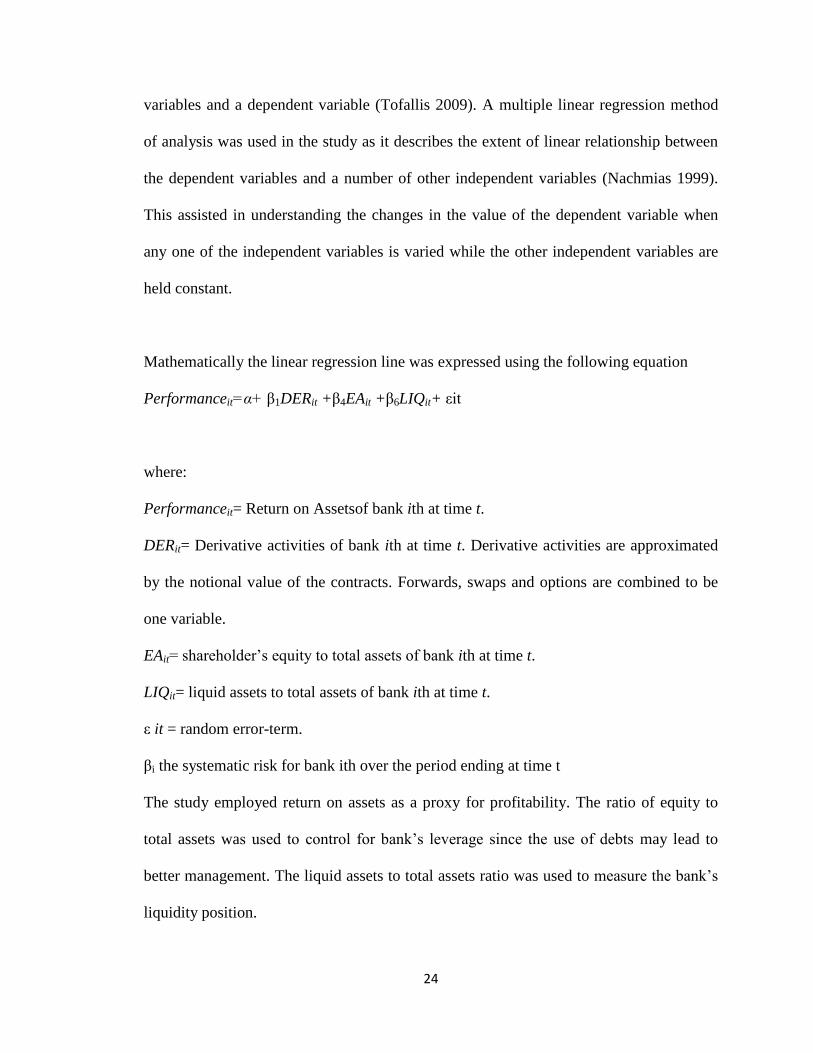
4.2.2 Financial derivatives
One of the determinants of commercial banks‟ financial performance has been cited as
the banks risk management. Financial derivatives present a powerful tool for managing
risks faced by commercial banks in conducting their ordinary businesses. The data on
financial derivatives cumulatively held in the Kenyan banking sector was obtained from
the CBK bank supervision annual reports. These are tabulated as follows.
Table 4.2 Financial Derivatives
Year 2011 2012 2013 2014 2015
Financial derivatives(forwards, swaps
and options) (Ksh M)
183291 256778 225868 267049 336233
Source: Research Findings
Financial derivatives notional value was highest in 2015 where the value stood at Ksh.
336,233,000 and lowest in 2011 where the value was Ksh. 183,291,000.the notional value
0
1
2
3
4
5
6
2011 2012 2013 2014 2015 2016
RO
A
Year
ROA
28
of the contracts stood at Ksh.256,778,000,Ksh.225,868,000, Ksh.267,049,000 in 2012,
2013, and 2014 respectively. . The figure below best illustrates this trend.
150000
200000
250000
300000
350000
2011 2012 2013 2014 2015
Fin
an
cia
l d
eriv
ati
ves
Years
Financial derivatives(forwards, swaps and options)
Fig.4 2: Financial Derivatives, 2011-2015
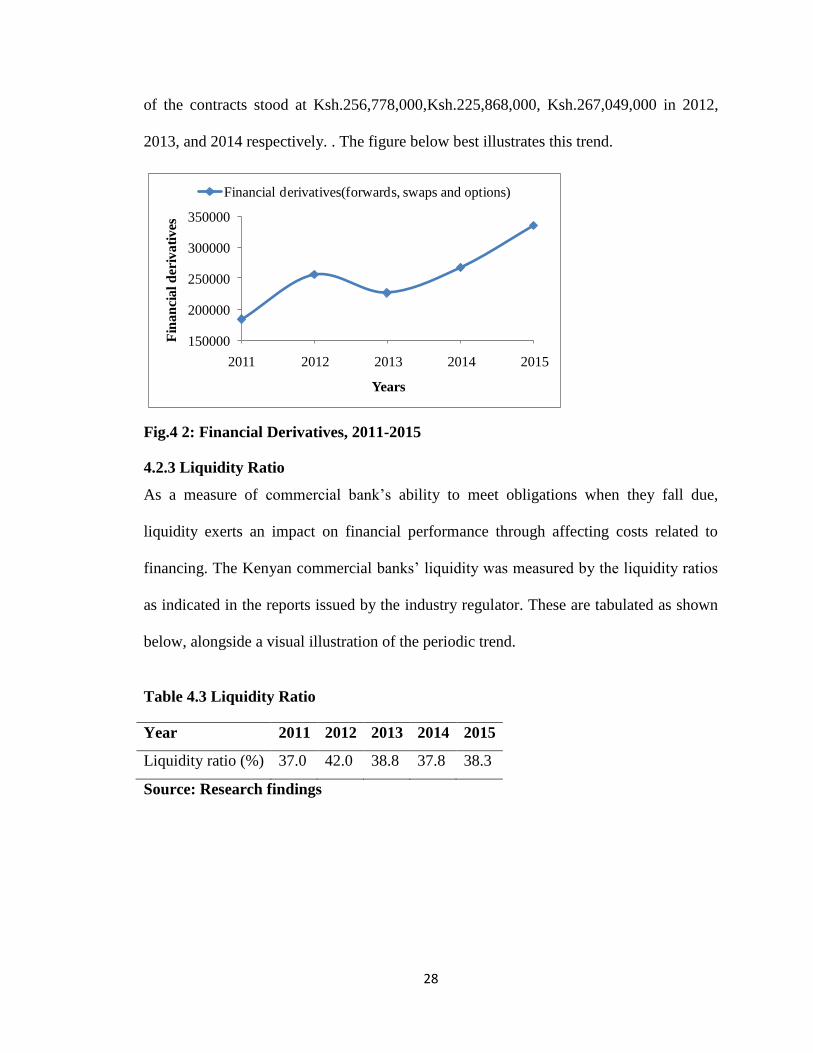
4.2.3 Liquidity Ratio
As a measure of commercial bank‟s ability to meet obligations when they fall due,
liquidity exerts an impact on financial performance through affecting costs related to
financing. The Kenyan commercial banks‟ liquidity was measured by the liquidity ratios
as indicated in the reports issued by the industry regulator. These are tabulated as shown
below, alongside a visual illustration of the periodic trend.
Table 4.3 Liquidity Ratio
Year 2011 2012 2013 2014 2015
Liquidity ratio (%) 37.0 42.0 38.8 37.8 38.3
Source: Research findings

29
Fig. 4.3: Liquidity Ratio, 2011-2015
Source: Research Findings
The banking industry„s liquidity was satisfactory throughout the study period given that
the liquidity ratio in all the years remained above the 20% minimum level required by the
regulations. This further pointed to the stability of the sector. Liquidity was highest in
2012, during which the average liquidity ratio for the banking sector stood at 42%.This
was followed by a decline to 38.8% in 2013and a further decline to 37.8% in the year
2014 before the increase to 38.3% in 2015.This Liquidity ratio was lowest in the year
2011, as indicated by the figure which stood at 37.0%.
4.2.4Shareholder’s equity ratio
Considering the use of debts maylead to better management, the ratio of total equity to
total assets(shareholders equity ratio) is used to control for bank‟s leverage.This data was
obtained from the annual reports issued by the industry regulator. Tabulated below are
the findings.
Table 4.4Shareholder’s equity ratio
Year 2011 2012 2013 2014 2015
Total equity to total assets ratio (%) 14.4 15.6 16.1 15.7 15.5
36.0037.0038.0039.0040.0041.0042.0043.00
2010 2011 2012 2013 2014 2015 2016
Liq
uid
ity
Rat
io
Years
Liquidity ratio

30
Source: Research Findings
The banking industry„s shareholders‟ equity ratio was lowest in 2011 during which the
shareholders equity ratio stood at14.4%. This was followed by an increase to 15.6% in
2012 .The shareholders equity ratio was highest in 2013during which the ratio stood at
16.1%.This was followed by a decline to 15.7% and 15.5 in 2014 and 2015 respectively.
This is further illustrated in the following figure.
Fig.4 4: Shareholder’s equity ratio, 2011-2015
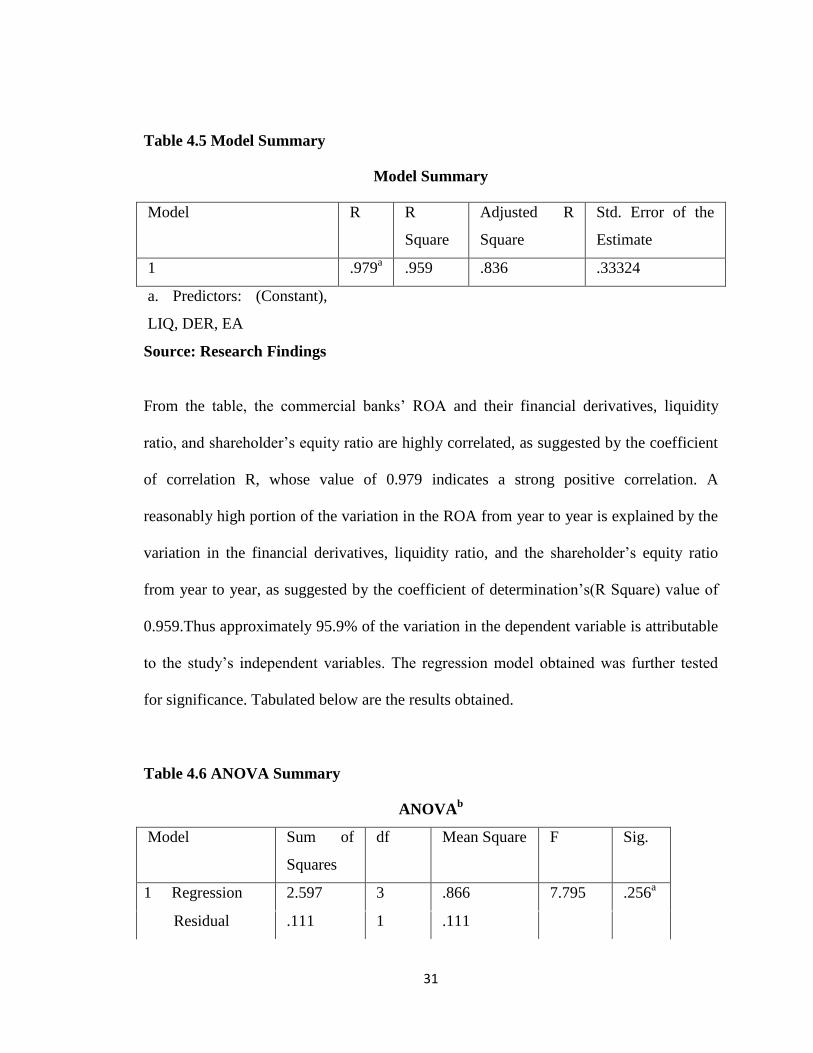
4.3Regression Analysis
In seeking to determine the effect of financial derivatives, liquidity ratio, the
shareholder‟s equity ratio on the ROA of Kenyan commercial banks over the period
2011-2015, the ROA in each year was regressed against each year‟s financial derivatives,
liquidity ratio and the shareholder‟s equity ratio. The table below summarizes the
regression model obtained.
14.2014.4014.6014.8015.0015.2015.4015.6015.8016.0016.20
2010 2012 2014 2016shar
eh
old
ers
eq
uit
y ra
tio
Years
sharehoder's Equity Ratio
31
Table 4.5 Model Summary
Model Summary
Model R R
Square
Adjusted R
Square
Std. Error of the
Estimate
1 .979a .959 .836 .33324
a. Predictors: (Constant),
LIQ, DER, EA
Source: Research Findings
From the table, the commercial banks‟ ROA and their financial derivatives, liquidity
ratio, and shareholder‟s equity ratio are highly correlated, as suggested by the coefficient
of correlation R, whose value of 0.979 indicates a strong positive correlation. A
reasonably high portion of the variation in the ROA from year to year is explained by the
variation in the financial derivatives, liquidity ratio, and the shareholder‟s equity ratio
from year to year, as suggested by the coefficient of determination‟s(R Square) value of
0.959.Thus approximately 95.9% of the variation in the dependent variable is attributable
to the study‟s independent variables. The regression model obtained was further tested
for significance. Tabulated below are the results obtained.
Table 4.6 ANOVA Summary
ANOVAb
Model Sum of
Squares
df Mean Square F Sig.
1 Regression 2.597 3 .866 7.795 .256a
Residual .111 1 .111

32
Total 2.708 4
a. Predictors:
(Constant), LIQ,
DER, EA
b. Dependent
Variable: ROA
Source: Research
Findings
From the table, the F statistic computed to test the significance of the resulting regression
model has a significance value of 0.256. Given that this exceeds the 0.05 significance
level at which the model was tested for significance, the model may not be significant in
describing the relationship between commercial banks‟ ROA between 2011-2015 and
their financial derivatives, liquidity and shareholder‟s equity ratios over the same period.
Besides the test of significance of the regression model, the coefficients of the regression
model obtained were also tested for significance .The results of the significance tests are
as tabulated below.

33
Table 4.7 Regression coefficients
Coefficientsa
Model
Unstandardized
Coefficients
Standardized
Coefficients
t Sig.
95.0% Confidence
Interval for B
B Std. Error Beta
Lower
Bound
Upper
Bound
1 (Constant) -4.575 4.593 -.996 .501 -62.933 53.784
DER -1.386E-5 .000 -.950 -4.202 .149 .000 .000
EA .210 .319 .162 .658 .629 -3.841 4.260
LIQ .229 .096 .533 2.378 .253 -.993 1.451
a. Dependent Variable: ROA
Source: Research Findings
From the findings, none of the coefficients of the regression model including the
constant, shareholder‟s equity ratio, financial derivatives and liquidity ratio are
significant. The significance values of the t statistic used in testing their significance are
above the 0.05 significance level at which the significance tests were performed. Thus,
the changes that occurred in ROA of the commercial banks with changes in the other
variables that were independent were not significant.
Table 4.7 depicts the numerical relationship between the independent variable and the
predictor variables in the following resultant equation:
ROA=-4.575-1.386E-5DER+0.210EA+0.229LIQ
The coefficients and their signs are of particular importance.The regression coefficients

34
shows that a unit increase in shaereholders equity ratio led to a increase ROA by 0.210
units. Likewise a unit increase in liquidity ratio led to increase in ROA by 0.229 units. On
the contrary, a unit increase in financial derivatives led to a decreasein ROA by 1.386E-5
units. From the findings above,financial derivatives have no significant impact on the
ROA at 5%level of significance as indicated by the p values; 0.149>.05.
Descriptive statistics was computed for both metcices measuringKenyan commercial
banks financial performance of and the resultwere as tabulated below
Descriptive Statistics
N Minimum Maximum Mean
Std.
Deviation
ROA 5 2.90 4.70 4.0200 .82280
DER 5 183291.00 336233.00 253843.8000 56416.55361
EA 5 14.40 16.10 15.4600 .63482
LIQ 5 37.00 42.00 38.7800 1.91885
The result for the study period 2011-2015 shows that the total derivative among the 43
commercial banks in Kenya is 253843.800 with a standard deviation of 56416.55361.
The total shareholders equity ratio is 15.46 with a standarsd deviation of 0.63482 and the
maen forthe commercial banks‟ liquidity ratio is 38.78 with a standard deviation of
1.981885.

35
4.3 Interpretation of Findings
The study found that, the commercial banks‟ ROA and their financial derivatives,
liquidity ratio, and shareholder‟s equity ratio are highly correlated, as suggested by the
coefficient of correlation R, whose value of 0.979 indicates a strong positive correlation.
A reasonably high portion of the variation in the ROA from year to year is explained by
the variation in the financial derivatives, liquidity ratio, and the shareholder‟s equity ratio
from year to year, as suggested by the coefficient of determination‟s(R Square) value of
0.959.Thus approximately 95.9% of the variation in the dependent variable is attributable
to the study‟s independent variables.
Descriptive statistics were computed for both metrics measuring Kenyan commercial
banks financial performance. The result for the study period 2011-2015 shows that the
total derivative among the 43 commercial banks in Kenya is253843.800 with a standard
deviation of 56416.55361. The total shareholders equity ratio is 15.46 with a standarsd
deviation of 0.63482 and the maen forthe commercial banks‟ liquidity ratio is 38.78 with
a standard deviation of 1.981885.
The coefficients and their signs are of particular importance.The regression coefficients
shows that a unit increase in shaereholders equity ratio led to a increase ROA by 0.210
units. Likewise a unit increase in liquidity ratio led to increase in ROA by 0.229units. On
the contrary, a unit increase in financial derivatives led to a decreasein ROA by 1.386E-5
units. From the findings above,financial derivatives have no significant impact on the
ROA at 5% level of significance as indicated by the p values; 0.149>.05.
36
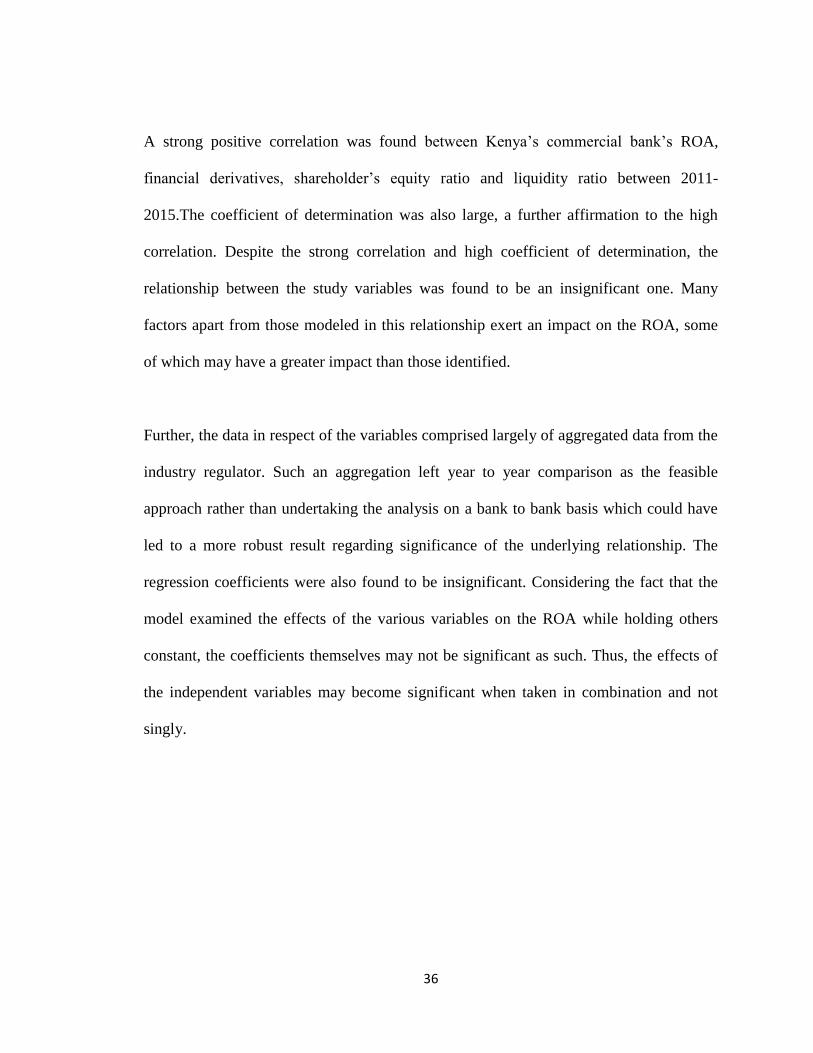
A strong positive correlation was found between Kenya‟s commercial bank‟s ROA,
financial derivatives, shareholder‟s equity ratio and liquidity ratio between 2011-
2015.The coefficient of determination was also large, a further affirmation to the high
correlation. Despite the strong correlation and high coefficient of determination, the
relationship between the study variables was found to be an insignificant one. Many
factors apart from those modeled in this relationship exert an impact on the ROA, some
of which may have a greater impact than those identified.
Further, the data in respect of the variables comprised largely of aggregated data from the
industry regulator. Such an aggregation left year to year comparison as the feasible
approach rather than undertaking the analysis on a bank to bank basis which could have
led to a more robust result regarding significance of the underlying relationship. The
regression coefficients were also found to be insignificant. Considering the fact that the
model examined the effects of the various variables on the ROA while holding others
constant, the coefficients themselves may not be significant as such. Thus, the effects of
the independent variables may become significant when taken in combination and not
singly.

37
CHAPTER FIVE
SUMMARY, CONCLUSION AND RECOMMENDATIONS
5.1 Introduction
This chapter summarizes the findings of the study, draws related conclusions and
suggests policy recommendations. The study‟s limitations are also cited with suggestions
being offered for further research.
5.2 Summary
This study was carried out with the objective of establishing the effect of financial
derivativesonthe fiancial performance of commercial banks in Kenya. To achieve
theabove objective, a regression analysis was conducted whereby ROA was regressed
against financial derivatives ,shareholders eqiuty ratio and liquidity ratio of commecial
bankis in kenya between 2011-2015. Data for both the dependent and predictor variables
were obtained from CBK.
When the analysis of the relationship between the individual independent variables and
ROA was carried out, financial derivatives were found to have anegative relationship
with ROA meaning that an increase inderivatives resulted in a corresponding decrease in
ROA and vice versa (refer to table 4.6). The relationship between financial derivative and
38
ROA was in addition found to be insignificant at as indicated by the p-value
(0.149>.05.).Thiscrucial finding is consistent with the literature and is in particular
consonance with Choi and Elyasiani (1997 and Flannery and James (1984); among
others.
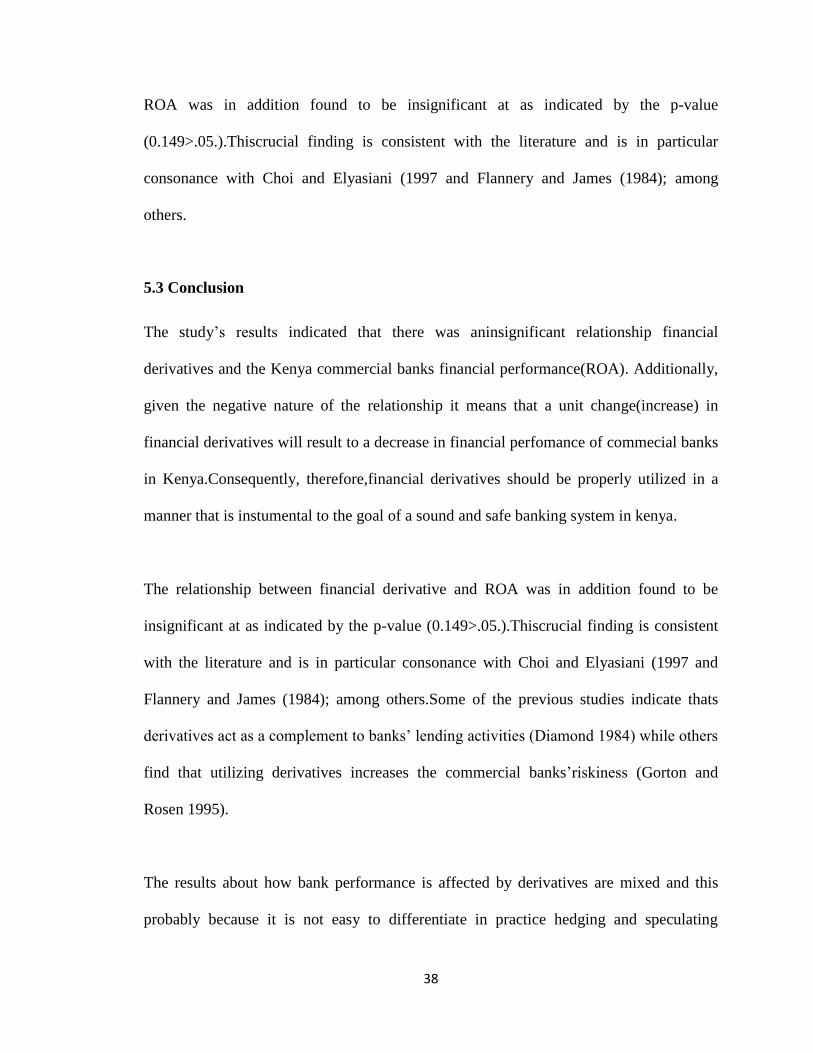
5.3 Conclusion
The study‟s results indicated that there was aninsignificant relationship financial
derivatives and the Kenya commercial banks financial performance(ROA). Additionally,
given the negative nature of the relationship it means that a unit change(increase) in
financial derivatives will result to a decrease in financial perfomance of commecial banks
in Kenya.Consequently, therefore,financial derivatives should be properly utilized in a
manner that is instumental to the goal of a sound and safe banking system in kenya.
The relationship between financial derivative and ROA was in addition found to be
insignificant at as indicated by the p-value (0.149>.05.).Thiscrucial finding is consistent
with the literature and is in particular consonance with Choi and Elyasiani (1997 and
Flannery and James (1984); among others.Some of the previous studies indicate thats
derivatives act as a complement to banks‟ lending activities (Diamond 1984) while others
find that utilizing derivatives increases the commercial banks‟riskiness (Gorton and
Rosen 1995).
The results about how bank performance is affected by derivatives are mixed and this
probably because it is not easy to differentiate in practice hedging and speculating

39
derivative activities and that above studies focused on large banks which have
considerable speculating derivative activities and market making that permit them to
lessen, if not evade, non-hedging derivative activities disruptions.
5.4 Limitations of the Study
The data used in assessing the relationship between the study variables was aggregated
data provided by the industry regulator CBK. Such data could not allow an analysis at the
bank level, making it difficult to ascertain the manner in which the variables changed
from bank to bank as a result of the different characteristics of each bank. In addition
such an aggregation left year to year comparison as the feasible approach rather than
undertaking the analysis on a bank to bank basis which could have led to a more robust
result regarding significance of the underlying relationship
The study period chosen covered only 5 years, which may not be adequate for
generalization of the findings to a longer time period. Further, there was marked variation
in this same period in the banking industry resulting from differences in the regulatory
regime from year to year, number of banking institutions, macroeconomic and
competitive circumstances alongside others. These differences were not accounted for,
and could thus serve to limit the assumption of homogeneity among all the years selected
for the study.
Despite the strong correlation and high coefficient of determination, the relationship
between the study variables was found to be an insignificant one considering the fact that

40
the model examined the effects of the various variables on the ROA while holding others
constant, the coefficients themselves may not be significant as such thus, the effects of
the independent variables may become significant when taken in combination and not
singly. Many factors apart from those modeled in this relationship exert an impact on the
ROA, some of which may have a greater impact than those identified while the model
only included the three (financial derivatives, liquidity ratio and the shareholder equity
ratio).
The focus of this study was on the three financial derivatives used by the commercial
banks in Kenya which are forwards swaps and options. The study looked at the effect of
the three financial derivatives as one variable and failed to study the effect of each
financial derivative separately.Forwards, swaps and options were combined to be one
variable in this study.
Financial derivatives affect the large banks and the small banks differently due to
difference in capital structure, asset base, amount of risks taken and many more. In
contrast to large banks, small banks hold more liquid assets have more conservative
capital structures and are more cautious to risky investments. This study did not separate
the large and the small banks and looked at all the 43 commercial banks in Kenya.
5.5 Recommendations
The study recommends that derivative accounting and valuation procedures and
derivative educational programs be established and embraced to demystify Kenya„s

41
derivative market. This would enable the finance offices to understand each and every
hedging practice advantages and disadvantages as currently most commercial banks do
not have a steady policy on derivative utilization and financial risks management is
merely left on the whims and devices of managers and thus making investors incur
agency costs.
Clearly, the banking system‟s soundness is an issue of essential concern to society. The
study therefore recommends that regulatorscarefully and continously monitor the
banks'derivative activities to assure that the increasingly popularinstruments are used in a
manner that is instumental to the goal of a sound and safe and banking system.
5.5.1 Policy Recommendations
This study recommends that sound risk management process such as ensuring that
procedures and policies that delineate clearly the lines of responsibility for managing
risk.
This study also recommends that commercial banks put in place adequate risk measuring
systems and appropriately create structured limits on risk taking.
5.5.2 Suggestions for Further Research
A study should be carried out replicating this study, using data in respect of specific
commercial banks. This may allow an examination of how the variables relate at the bank

42
level in addition to yielding insights concerning bank specific factors that may exert an
impact on the financial performance.
Research should also be conducted incorporating a longer period exceeding the 5 years
that were used in this study .This would improve the generalizability of the study findings
to diverse settings. It should also include robust mechanisms for controlling for the
differences occurring between clusters of various years due to a diverse set of
circumstances. Such control of differences may strengthen the basis of the resultant
findings.
Considering the fact that the model examined the effects of the various variables on the
ROA while holding others constant, the coefficients themselves may not be significant as
such thus, the effects of the independent variables may become significant when taken in
combination and not singly and also many factors apart from those modeled in this
relationship exert an impact on the ROA, therefore study that includes other factors
which may have a greater impact than those identified should be conducted. Thus, the
effects of the independent variables may become significant when taken in combination
and not singly.
Further research could also be conducted to determine the effect of financial derivatives
on the financial performance of commercial banks in Kenya by looking at each derivative
separately as in this studyforwards, swaps and options are combined to be one variable.

43
The effects of financial derivative on the financial performance on the large and small
banks should be looked at separately.

44
REFERENCES
Acharya, V. V., &Yorulmazer, T. (2008).Information Contagion and Bank Herding.
Journal of Money, Credit and Banking, 40(1), 215-231.
Allayannis, G., & Weston, J. P. (2001).The Use of Foreign Currency Derivatives and
Firm Market Value.Review of Financial Studies 14, 243-276.
Allen, F., and Sanatomero, A., (1997.)The theory of financial intermediation. Journal of
Banking and Finance 21, 1461-1485.
Barton, J. (2001). Does the use of financial derivatives affect earnings
managementdecisions? The Accounting Review, 71(1), 1-26.
Boot, A. W. A., &Thakor, A. V. (1991).Off-Balance Sheet Liabilities, Deposit Insurance
and Capital Regulation.Journal of Banking & Finance, 15(4), 825-846.
Boot, A. W. A., &Marinč, M. (2008).The Evolving Landscape of Banking.Industrialand
Corporate Change, 17(6), 1173-1203.
Boot, A. W. A. (2014).Financial Sector in Flux.Journal of Money, Credit and Banking,
46(s1), 129-135.
45
Booth, J. R., Smith, R. L., & Stolz, R. W. (1984). Use of interest rate futures by financial
institutions.Journal of Bank Research15(1), 15–20.
Berkman, H. & Bradbury, M. E. (1996).Empirical evidence on the corporate use of
derivatives.Financial Management, vol. 25 (2), 5-14.
Brewer, E. III, B.A. Minton, and J.T. Moser. (2000). “Interest-rate derivatives and bank
lending.” Journal of Banking and Finance24: 353-379.
Brewer, E. III, W.E. Jackson III, and J.T. Moser. (2001). “The value of using interest rate
derivatives to manage risks at U.S. banking organizations.” Federal Reserve
Bank ofChicago Economic Perspectives: 49-64.
Brewer, E. III, W.E. Jackson III, and J.T. Moser. (1996). “Alligators in the swamp: the
impact of derivatives on the financial performance of depository institutions.”
Journal of Money,Credit, and Banking28(3): 482-497.
Chance, D. M. (1995), “A Chronology of Derivatives”, DerivativesQuarterly, vol. 2,
Winter, pp. 1-8.
Chernenko, S. &Faulkender, M. (2011).The Two Sides of Derivatives Usage:
Hedgingand Speculative with Interest Rate Swaps.Journal of Financial and
QuantitativeAnalysis46, 1727-1754.

46
Carter, D. A., & Sinkey, J. F. Jr. (1998). The use of interest rate derivatives by end-users:
The case of large community banks. Journal of Financial Services Research,
14(1), 17–34.
Choi, J. J., & Elyasiani, E. (1997). Derivatives exposure and the interest rate and exchange
rate risks of US banks. Journal of FinancialServices Research, 12(2/3), 267–286.
DeYoung, R, and Rice T. (2004). How do banks make money? A variety of business
strategies, Federal Reserve Bank of Chicago.
Diamond, D.W.. 1984. “Financial intermediation and delegated monitoring.” Review
ofEconomics Studies 51: 393-414.
Deshmukh, Sudhakar, Stuart Greenbaum, George Kanatas. "Interest Rate Uncertainty and
the Financial Intermediary's Choice of Exposure." Journal of Finance 38(Mar
1983), 141-47.
Froot, K. A., Scharfstein, D. S., & Stein, J. C. (1993). Risk Managements Coordinating
Corporate Investment and Financing Policies. The Journal of Finance, 48(5),
1629-1658.
Fiordelisi, F., & Marques-Ibanez, D. (2013). Is Bank Default Risk Systematic? Journal of
Banking & Finance,37(6), 2000-2010.
47
Flannery, M., & James, C. (1984). The Effect of Interest Rate Changes on the Common
Stock Returns of Financial Institutions. The Journal of Finance, 39(4), 1141-
1153.
Gitogo, J.K. (2012). The Relationship between Derivatives and Financial Performance of
Commercial banks in Kenya.Unpublished MBA Dissertation, University
ofNairobi, Nairobi.
Gorton, G., & Rosen, R. (1995). Banks and derivatives. National Bureau of Economic
Research, Working Paper No. 5100.
Géczy, C., Minton, B., &Schrand, C. (1997). Why Firms Use Currency Derivatives. The
Journal of Finance, 52(4), 1323-1354.
Jason, Georgette and Jeffrey Taylor. "Derivatives Force First Closure of Money Fund."
The Wall Street Journal, 28 September 1994, p. Cl.
Kamenchu, I.J. (2013). Factors leading to slow adoption of derivatives use in Kenya; A
case of Commercial banks in Kenya. International Journal of economics and
Finance 1 (3).
48
Kerlinger, F. N. (1986) “Foundations of behavioral Research”, (3rd edition) Fort worth:
Holt, Rinehart and Winston Inc.
Mugenda,O. M. and Mugenda A. G. (1999) “Research methods: Quantitative and
Qualitative approaches”, Nairobi; Acts Press.
Mugenda,O. M. and Mugenda A. G. (2003) “Research methods”, Lab Graphics, Nairobi-
Kenya.
Mumoki, A.N. (2009). Foreign Exchange Risk Management: Strategies and Techniques
used by Banks in Kenya to Manage Foreign Exchange Risk.
Exposure.Unpublished MBA Dissertation, University of Nairobi, Nairobi.
Modigliani, F., & Miller, M.H. (1958). The cost of capital, corporation finance and the
theory of investment. The American Economic Review, 48(3), 261–297.
Njoroge, N, Matumo M. & Maina, K. (2013). Factors influencing development of
financial derivatives markets, Global Advanced Research Journal of Management
and Business.
Nasurutia, A. (2013)Effectiveness of financial derivatives in managing Foreign
Exchange Exposure among commercial banks in Kenya MBA Dissertation,
University of Nairobi.

49
Nance, D. R., Smith, C. W. Jr., and Smithson, C. W., (1993) .On the Determinants of
Corporate Hedging. Journal of Finance 48, 267-284.
Nystedt, J. (2004). Derivative market competition: OTC Markets versus Organised
Derivative Exchanges.IMF working paper WP/04/61.
Santomero, A. M. (1995). Financial Risk Management: The Whys and Hows; Financial
Markets, Institutions and Instruments, 4 (5), 1-14.
Steve, K.,& Christian, P. (2012).The History of Derivatives: A Few Milestones, EFTA
Seminar on Regulation of Derivatives Markets
Smith, C. W., and Stulz, R., (1985). The determinants of firm‟s hedging policies. Journal
of Financial and Quantitative Analysis 20, 391-405.
Stulz, R., (1990). Managerial discretion and optimal financing policies.Journal of
Financial Economics26, 3-27.

50
APPENDIX I
Year ROA (%)
Liquidity
Ratio (%)
Financial
Derivatives
(KSH. M)
Shareholders’ Equity
(KSH. M)
Total Assets
(KSH. M)
Shareholder’s equity
ratio (%)
2011 4.4 37 183291 286,450 1,988,846 14.4
2012 4.7 42 256778 357,037 2,289,649 15.6
2013 4.7 38.8 225868 426,496 2,656,639 16.1
2014 3.4 37.8 267049 501,733 3,199,396 15.7
2015 2.9 38.3 336233 540,578 3,492,643 15.5
Raw data
Source: CBK website (www.centralbank.go.ke)