THE EFFECT OF DRAMA AND THE ELEVENTH GRADE STUDENTS’ …
40
1 Terbit Online pada laman webjurnal:https://jurnal.stairahmaniyah.ac.id/index.php/alulum Vol. 1 No. 1 (2021) ISSN Media Elektronik: xxxx-xxxx THE EFFECT OF DRAMA AND THE ELEVENTH GRADE STUDENTS’ SELF- ESTEEM IN IMPROVING THEIR SPEAKING ABILITY AT RAHMANIYAH HIGH SCHOOL OF SEKAYU MUSI BANYUASIN ABSTRACT: The teaching of English is the most important thing in this era. Getting students to speak English in class can sometimes be extremely easy. In good class atmosphere, students who get on with each other, and whose English is at an appropriate level, will often participate freely and enthusiastically if teachers give them a suitable topic and task. However, at other times it is not easy to get students going. But a problem that occurs more often than any of these is the natural reluctance of some students to speak and to take part. Based on the limitation of the problems above, the main problems of the study were stated in the following questions: 1. Is there a significant difference in speaking ability between students who are taught by using drama method and those who are taught with conventional method? 2. Is there a significant effect of self-esteem on students’ speaking ability? 3. Is there a significant interaction effect of methods used and self- esteem on students’ speaking ability? In the experimental class, the researcher applied drama method and nother group was the control group which was taught with conventional method. The writer took the students’ self-esteem questionnaire scores, pretest, and posttest. Both groups were posttested. Posttest scores were compared to determine the effectiveness of the treatment. It started from 10 th November until 28 th november 2020 Keywords: The Effect Of Drama, Students’ Self- Esteem, Speaking Ability Diterima Redaksi: 21-06-2021 Selesai Revisi: 24-06-2021 Diterbitkan Online: 04-07-2021 CHAPTER I INTRODUCTION This chapter presents (a) background of the study, (b) problems, (c) objective of study, and (d) significance of the study. A. Background of the Study The teaching of English is the most important thing in this era. Getting students to speak English in class can sometimes be extremely easy. In good class atmosphere, students who get on with each other, and whose English is at an appropriate level, will often participate freely and enthusiastically if teachers give them a suitable topic and task. However, at other times it is not easy to get students going. But a problem that occurs more often than any of these is the natural reluctance of some students to speak and to take part. Rebecca (1990:5) states that gaining a new language necessarily involves developing four language skills in varying degrees and combinations: listening, reading, speaking and writing among language teachers. In Indonesia, the English instruction is administered based on
Transcript of THE EFFECT OF DRAMA AND THE ELEVENTH GRADE STUDENTS’ …

1
Terbit Online pada laman webjurnal:https://jurnal.stairahmaniyah.ac.id/index.php/alulum
Vol. 1 No. 1 (2021) ISSN Media Elektronik: xxxx-xxxx
THE EFFECT OF DRAMA AND THE ELEVENTH GRADE STUDENTS’
SELF- ESTEEM IN IMPROVING THEIR SPEAKING ABILITY AT RAHMANIYAH
HIGH SCHOOL OF SEKAYU MUSI BANYUASIN
ABSTRACT: The teaching of English is the most important thing in this era. Getting
students to speak English in class can sometimes be extremely easy. In good class
atmosphere, students who get on with each other, and whose English is at an appropriate
level, will often participate freely and enthusiastically if teachers give them a suitable
topic and task. However, at other times it is not easy to get students going. But a
problem that occurs more often than any of these is the natural reluctance of some
students to speak and to take part.
Based on the limitation of the problems above, the main problems of the study
were stated in the following questions: 1. Is there a significant difference in speaking
ability between students who are taught by using drama method and those who are taught
with conventional method? 2. Is there a significant effect of self-esteem on students’
speaking ability? 3. Is there a significant interaction effect of methods used and self-
esteem on students’ speaking ability?
In the experimental class, the researcher applied drama method and nother
group was the control group which was taught with conventional method. The writer took
the students’ self-esteem questionnaire scores, pretest, and posttest. Both groups were
posttested. Posttest scores were compared to determine the effectiveness of the treatment.
It started from 10th November until 28th november 2020
Keywords: The Effect Of Drama, Students’ Self- Esteem, Speaking Ability
Diterima Redaksi: 21-06-2021 Selesai Revisi: 24-06-2021 Diterbitkan Online: 04-07-2021
CHAPTER I
INTRODUCTION
This chapter presents (a)
background of the study, (b) problems,
(c) objective of study, and (d)
significance of the study.
A. Background of the Study
The teaching of English is the
most important thing in this era.
Getting students to speak English in
class can sometimes be extremely easy.
In good class atmosphere, students
who get on with each other, and whose
English is at an appropriate level, will
often participate freely and
enthusiastically if teachers give them a
suitable topic and task. However, at
other times it is not easy to get
students going. But a problem that
occurs more often than any of these is
the natural reluctance of some students
to speak and to take part.
Rebecca (1990:5) states that
gaining a new language necessarily
involves developing four language
skills in varying degrees and
combinations: listening, reading,
speaking and writing among language
teachers.
In Indonesia, the English
instruction is administered based on

2
the curriculum for English subject, the
objective of studying English at
Senior High Schools (Sekolah
Menengah Atas) is the students should
master four basic skills of language,
namely: listening, speaking, reading
and writing.
Speaking is a process of
communication, so the learners must
be able to express their thought and
feeling when they are speaking.
Brown (2004:140) states the speaking
is a productive skill that can be
directly and empirically observed,
those observations are invariably
colored by the accuracy effectiveness
of a test takers’s listening skill, which
necessarily compromises the realibility
and validity of oral production test.
Speaking is one of four skills
in English learning, but in reality, it is
seldom practiced by the students.
Students of foreign language are easier
to speak in another language. But the
problems are situations and conditions,
which sometimes cannot support to
speak in a foreign language. Harmer
(2007: 345) states the students are
often reluctant to speak because they
are shy and are not predisposed to
express themselves in front of other
people, especially when they are being
asked to give personal information or
opinions. They are worried about
speaking badly and therefore losing
face in front of their classmates.
Furthermore, Harmer
(2007:347) points out some aspects
that makes students speak in
classroom. They include students’
interest, enthusiasm, active class
participants and development of warm
and friendly classroom atmosphere.
Therefore, teachers need to play a
number of different roles during
different speaking activities.
In the teaching and learning
activities, especially in developing the
student’s speaking ability with group
that respond well to drama activities,
putting on one scene, or a short drama,
can be both enjoyable and rewarding.
Many students love planning,
costumes, travelling, and so on. In
teaching speaking, a teacher’s needs
for his/her language lesson are the
knowledge of the best and most
effective methods to use and her skill
in handling it with perseverance and
courage to carry on the work with
humour and enjoyment. A teacher
herself should use her inisiative to
make the students satisfied. One of the
techniques is English learning through
drama.
According to Thompson and
Evans (2005:14), drama can be used
within the context of other subjects as
a method for exploration of facts or
relationships or to enhance
understanding. It can be a means of
focusing a child’s experience and
putting their learning into a realistic
context. Drama can broaden children’s
understanding of concepts, develop
their use and understanding of
language and provide memorable
creative experiences which can be
drawn on in future problem-solving
situations. There are a variety of
drama techniques that lend themselves
to creative thinking and can be used to
develop language skills.
Based on the writer’s
preliminary investigation and
experience in teaching the eleventh
grade students of Rahmaniyah Senior
High School of Sekayu Musi
Banyuasin, it indicates that they had
low interest, individual learning, little
experience, and were shy to speak
English in class. To handle the above
problem the writer finds that drama
strategy could be applied as one of the
effective and efficient techniques in
developing and motivating the
students to increase their abilities in
speaking.
As a facilitator, the teacher
should know about what students need.
As the teacher of English, she or he
must be more active to create and

3
motivate his or her students in learning
and make his or her lesson more
interesting. It would prevent the
students from boredom in learning. In
this case, teachers must solve the
problems by presenting a new way in
teaching. That is why the teacher
should find out an appropriate
technique in teaching and learning
processes.
Esteem is worth and value that
we apply to people, places and
situations. We have esteem for an
exemplary performance whether it is
in sports, acting, or simply doing the
right thing. Messenger (2013:5) states
self- esteem plays a role in almost
everything we do. People with high
self- esteem do better and find it easier
to make friends. They tend to have
better relationship with peers and
adults, feel happier find easier to deal
with mistakes, disappointment, and
failures, and are more likely to stick
with something until they succeed.
Through all those facts above,
the researcher is interested to do a
research with the title “The Effect of
Drama and the Eleventh Grade
Students Self-Esteem in Improving
Their Speaking Ability at
Rahmaniyah High School of Sekayu
Musi Banyuasin.”
B. Problems
The problem presented in this
study deals with the students’ low
ability in speaking and to be solved
through the strategy of drama, that is
assumed to help students overcome
their difficulties in learning speaking.
Many times the teaching of English
language does not fulfill its goals.
Even after years of English teaching,
the learners do not gain the confidence
of using English in and outside the
class. The learners could not use the
language in the reality. Their output in
the language learning is just limited
on doing an exercise based on the text
books and in understanding grammar,
but isolated with real communication.
The writer found there were
three problems in learning speaking.
The first problem is connecting with
teacher investigation based on the
reflection in teaching and learning
processes, the students’ achievement
in speaking is still under Criteria
Minimal Completeness it occurs
because in teaching learning processes
the students are stilll asked to speak in
front of class only, while drama is one
techinique for motivating the students
to speak in class. The second problem
is the teacher still use a convensional
technique in teaching and learning
processes. In the convensional method
the teacher commonly asks the
students to speak after the teacher
explains the technique of speaking.
The last problem is the students in
eleventh class has low motivation in
learning English.
The teachers of English need
to vary the technique in speaking, one
of them is drama. This technique
might increase the students’ speaking
ability in English learning. One of the
techniques that the writer finds
effective and efficient is drama in
speaking.
Drama might be an appropriate
teaching techinque for the eleventh
grade students of the science class
with this technique. It could be easier
for the eleventh grade students to
speak English based on the real
situation, condition and context in
their life. By using drama and
selfesteem technique, teaching and
learning processes will work
communicatively, students can speak
English, because they have
experienced practice in speaking
English in class by drama.
1. Limitation of the Problems
The limitation of the problem
in this study was limited on the
application of drama and eleventh

4
grade students self-esteem in
improving their speaking ability at
Rahmaniyah Senior High School of
Sekayu Musi Banyuasin. The drama is
about the legend, the title is “Timun
Mas (Golden Cucumber)”
2. Formulation of the Problems
Based on the limitation of the
problems above, the main problems of
the study were stated in the following
questions:
1) Is there a significant
difference in speaking ability between
students who are taught by using
drama method and those who are
taught with conventional method?
2) Is there a significant
effect of self-esteem on students’
speaking ability?
3) Is there a significant
interaction effect of methods used and
self-esteem on students’ speaking
ability?
C. Objectives of the Study
The objectives of this research are
to find out whether or not :
1) there is a significant
difference in speaking
ability of the students
who are taught by using
drama method and
those who are taught
using conventional
method;
2) there is a significant
effect of self-esteem on
students’ speaking
ability;
3) there is a significant
significant interaction
effect of methods used
and self-esteem on
students’ speaking
ability;
D. Significance of the Study
This research is intended to
offer an alternative technique
of drama and the students self
esteem in speaking. The
significance of study is as
follows:
1) For the Teachers of English
The significance of this study
for the teacher is expected to remaind
the teachers about the importance of
drama and students’ self esteem in
teaching and learning process, because
the teacher may improve the quality of
teaching and leraning activities. They
can support and motivate the students
to achieve the objectives of education.
And by writing this thesis, the writer
hoped that it will give contribution to
the teachers of English to solve the
problem in teaching speaking,
especially in eleventh grade students
Senior High School of Rahmaniyah
Sekayu.
2) For the Students The significance of this study
for the students are, by writing this
thesis the writer hopes, it can improve
the students’ ability in speaking. So,
they can practice their ability in their
life.
3) For the Researcher Herself
This study can be used to
improve the writer’s knowledge and
skills in speaking, and can enlarge the
writers experiences
4) For the School This study can be used as a
practical contribution in increasing
and develoving the quality of
education.
CHAPTER II
LITERATURE REVIEW
The present discussion
elaborates the basic theories for this
study. It describes: (a) concept of
speaking, (b) speaking ability, (c)
teaching of speaking, (d) speaking
evaluation, (e) concept of self-esteem,
(f) concept of drama, (g) teaching
procedures of speaking ability, (h)
concept of ability, (i) related previous
studies, and (j) hypotheses.

5
A. Concept of Speaking
Speaking has an important
role in human beings’ life. Speaking is
used for communication among people
in a society in order to keep in
relationship going well. Richard
(1990:67) says through speaking,
someone can express his ideas,
emotion, attention, reactions, to other
person and situation and influence
other person. So through speaking
someone can communicate or express
what he wants from others and
responds to the speaker.
According to Harmer
(2007:345-362), students are often
reluctant to speak because they are shy
and are not predisposed to expressing
themselves in front of other people,
especially when they are being asked
to give personal information or
opinions. Frequently, too, they are
worried about speaking badly and
therefore losing face in front of their
classmates. In such situations there are
a number of things we can do to help:
preparation, the value of repetation,
big groups, small groups and
mandatory participation.
B. Speaking Ability
Speaking is a productive skill.
As such, its development is
undertaken after the receptive skill of
listening comprehension. For native
speakers, active speech combines both
a code and message. The one of
language skills is speaking. Speaking
is the productive skill where the
teacher must have a basic
methodological model for teaching
this skill. Harmer (2007:275-276)
states that a key factor in the success
of productive skill tasks is the way
teachers organize them and how they
respond to the students’ work.
C. Teaching of Speaking
Speaking is a process of
communication, because the language
learner must be able to express their
mind and feeling when they are
speaking. It is the expressing of
someone to show their feeling and
mind.
The listener and the speaker
are straight by face-to-face
communication in expressing their
ideas. In teaching speaking there are
various ways or techniques that may
be the teacher in effort to improve the
speaking achievement and make the
students have chance to converse with
other people in the world.
The controlled or guided
speaking activities means that the
teacher controls speaking activities.
According to Littlewood (1984:7), the
techniques for controlled practice can
be adapted so that the learner is helped
to related language forms to their
potential functional and or social
meaning.
D. Speaking Evaluation
There are some theories about
speaking competence. Hughes
(1990:111) states that the components
of speaking are accent, grammar,
vocabulary, fluency and
comprehension. This research is used
the criteria of (Hughes, 1990:111)
from these criteria, the researcher only
take for of them, there are
pronunciation, grammar, vocabulary,
and fluency .
E. Concept of Self Esteem
Self-esteem is argued,
safeguards people against the ill
effects stemming from many of life's
problems.
According to Goodman, et al
(2001:1)
Self Esteem premise assumes
that people with high self-esteem, in
contrast to those with low self-esteem,
will behave in more socially

6
acceptable and responsible ways, will
somehow be more resilient to life's
vicissitudes, will generally display
higher achievement in conventional
pursuits, and will ultimately possess
greater socio emotional well-being.
Self-esteem is a disposition
that a person has which represents his
judgment of his own worthiness.
Branden (1998:78) defines self-esteem
as “the experience of being competent
to cope with the basic challenge of life
and being worthy of happiness.
According to Branden (1998:90), self-
esteem is the sum a feeling of personal
worth. It exists as a consequence of
the implicit judgment that every
person has of their ability to face
life’s challenges.to understand and
solve problems, and their right to
achieve happiness, and given respect.
F. Concept of Drama
From the description above,
the using of drama can enhance and
improve the student speaking ability in
English. Caplan (2011:7) states
participation in drama activity
encourages students and teachers to do
the following things.
a. Integrate concepts,
skills, and ideas from various subject
areas, including social students,
mathematics, science, and literacy.
b. Gain an understanding
of real world events from the past and
the present, the individuals who
shaped these events, and the
individuals who may influence them in
the future.
c. Develop reading
comprehension skills by entering the
world of a text through role playing,
interacting with others, visualizing
events, concepts, and information, and
dramatizing the experiences of
fictional characters and real life
individuals.
d. Produce written works
in a variety of contexts for different
audiences that demonstrate increasing
technical skill, self confidence, and
effective discover and scrutinize
ethical aspects of social issues such as
equity, social justice, citizenship, civil
rights, bigotry, bullying, and other
forms of antisocial behavior and their
reversals from various points of view
e. Generate and use
spoken, written, visual, and
multimodal texts that demonstrate
increasing fluency in the way of vivid
description, sensory details, and
effective persuasive and self-reflective
writing.
f. Understand and
develop compassion for others’
representations of ideas, values,
beliefs, experiences, and life
conditions–from literary characters
and challenged individuals to
historical figures.
g. Acquire critical
thinking skills in terms of examining,
questioning, and perhaps challenging
social practices and the language,
actions, and beliefs that drive these
practices, and investigating and
evaluating texts concerning their
manner of representing certain people,
groups, and notions of reality.
h. Gain social skills
through group problem solving,
listening to differing views, respecting,
weighing, and perhaps acting on
another’s proposals, and expressing
empathy and compassion; and develop
appreciation for the art of drama and
theater.
From the description above,
the learning will be effective and
enjoy through drama activities. Using
drama and drama activities has clear
advantages for language learning. It
encourages students to speak, it gives
them the chance to communicate, even
with limited language, using non-
verbal communication, such as body
movements and facial expression.
Using drama to teach English results
in real communication, involving ideas,

7
emotions, feelings, appropriateness
and adaptability.
CHAPTER III
RESEARCH METHOD
This part discusses (a) method
of research, (b) place and time of
study, (c) research design, (d) research
variables, (e) operational definitions,
(f) population and sample, (g)
technique for collecting data, (h)
validity and reliability of instruments
and (i) technique for analyzing the
data.
A. Method of Research
The purpose of this research is
to find the quantitative descriptive
method was used in this study, the
data were obtained by questionaire
(self-esteem), drama method and
speaking (speaking score). Both of
two variables, firstly were described,
and then they would find the
correlation, at the last they was found
the determination of the independent
variable on the dependent variable by
simple regression technique.
According to Hatch and Lazaraton
(1991:467), regression than is a way of
predicting performance on the
dependent variable by on eor more
independents variable. The procedure
is, first, the researcher measured
students’ motivation by using
questionnaires, and second used test to
find out students’ speaking ability.
After that, the researcher used t-test,
then the regression and the last the
researcher also used two-way
ANOVA analysis based on the result
of questionnaires and test.
Simple regression was useful
when we needed to predict scores on a
test on the basis of another test. The
researcher will be used this method
because it is appropriate to describe
the influence of the independent
variable on the dependent variable.
Variables were the condition or
characteristic that the experimenter
manipulates controls or observes (Best,
1994:137).
B. Place and Time of Study
The location of research was in
Rahmaniyah Senior High School of
Sekayu Musi Banyuasin in the
academic year of 2020-2021, located
at Jalan Laut Kelurahan Serasan Jaya
Sekayu. The study was conducted in
12 meetings including pretest and
posttest activities to see the
effectiveness of drama technique to
develop the students speaking ability.
In the experimental class, the
researcher applied drama method and
another group was the control group
which was taught with conventional
method. The writer took the students’
self-esteem questionnaire scores,
pretest, and posttest. Both groups were
posttested. Posttest scores were
compared to determine the
effectiveness of the treatment. It
started from 10th
November until 28th
november 2020
C. Research Design
This study that used is a causal
design to see the effect between the
independent variables to the dependent
variable. The variables in this study:
Where :
X1
Independent Variable (X1)
= Self-esteXem2 Dependent Variable (X2)
= Drama method
Dependent Variable (Y)
= Speaking Ability
This study to see the influence in partial of X1 to Y, X2 to Y and
then X1 and X2 together to variable Y.
D. Research Variables
A variable is defined as
any characteristic that can change or
differ from time to time, from place to
Y

8
place or from one individual or group
to another (Robertson, 1987:30).
According to Fraenkel, at al (1990:36),
a variable is deined as any
characteristic that is not always the
same that is any characteristic that
varies.
There were two kinds
of variables in this study, independent
and dependent variable. McMillan
(1992:22) states that independent
variable that comes first and
influences or predicts the result, while
the dependent variable that is affected
by or is predicted by the independent
variable.
E. Operational Definitions
Operational definition
is very important to thesis research
because it can make the reader
understand what is being studied.
There are four important terms to
define operationally in this study
which the writer discusses.,
1) Teaching is the work or
profession of a teacher to facilitate
pupils to learn a particular subject and
how to do something.
2) Speaking is the process
of communication, so the learners
must be able to express their thought
and feeling when they are speaking.
3) Drama is a technique
of communicative language teaching,
where the students have to use gesture,
expression, body language and voice.
4) Self-esteem is argued,
safeguards people against the ill
effects stemming from many of life’s
problems.
F. Population and Sample
1. Population
Population is the larger
group to which one hopes to apply the
result is called the population(Fraenkel,
et al. 1990:91). Population is a
generalization area that consists of
object or subject that has quality and
specific criteria which is decided by
the researcher to observe and then to
put the conclusion of it (Sugiono,
2009:80)
The population of this
study would be all the eleventh grade
students of Rahmaniyah Senior High
School of Sekayu in the academic year
of 2020-2021. The total number of the
population was 81 as presented in
table 1 below.
TABLE 1
The Population of The
Research
N O
CL
ASS
STUD
ENTS
1 XI
IIS 1 26
2 XI
IIS 2 25
3 XI
MIA 30
Tot al
81
(Source: Rahmaniyah Senior
High School of Sekayu in the
Academic Year of 2020-2021).
2. Sample
Sample in research study refers
to any group on which information is
obtained. It is selected in such a way
that it represents, the large group
(population) from which it is obtained
(Fraenkel, at al., 2012:91).
However, if the subject in the
population are more than 100, it is
better for the researcher to take all of
the population. The sample can be
taken around 10-15% or 20-25% or
more (Arikunto, 2006:134)
In this research, the sample
was taken from population of
Rahmaniyah Senior High School of
Sekayu. In this study, the sample was
taken by using random sampling.
Firstly, the write has organized the
sampling process into stages where the
unit of analysis was systematically
grouped and gave a questionnaire.

9
Secondly, she selected a
sampling technique for each stage into
high self-esteem and low self-esteem.
Then, students from each category
were taken and then they were
grouped into experimental and control
groups since they were from same
level of their class. The kind of
random sampling in this research is
simple random sampling.
G. Technique For Collecting Data
In collecting the data in
this study, a set of questionnaire and
test were used to prove the hypothesis.
The data were collected from
pretest and posttest of experiment.
Besides, the data were also collected
from questionnaire. The questionnaire
was used to know the students’
responses toward existence of drama
and self esteem in improving speaking
ability.
1) Pretest and Posttest
According to Wiersma (1991:
108) the addition of a pretest given
prior to administering the
experimental treatments essentially
extend the posttest-only control group
design to the pretest-posttest control
group design. The subject are
randomly assigned to the two or more
groups and tested just prior to the
experiment on a supposedly relevant
antecedent variable, possibly a second
form of the test that measures the
dependent variable.
2) Questionnaire of Self-
Esteem
A questionnaire is the main
means of collecting quantitative
primary data. A questionnaire enables
quantitative data to be collected in a
standardized way so that the data are
internally consistent and coherent for
analysis (www.terry.Uga.Edu/~rg
rover).
In this study, the questionnaire
consisted of 25 items of self-esteem
scale for English students. The items
of the questinnaire were ready-made.
The items of the questinnaire were
adopted from SOAR Program 2003 (in
Sinta S 2013:52). The ranging of the
scale category assessment used:
Always, Often, Sometimes, Rarely, and
Never.
The data from the
questionnaire were analyzed to get the
scores used. The formula is as below :
In this study, the researcher
also used mean formula to know the
average of students’ score of the
questionnaire. The formula is as
follows:
M = ∑x
N
Explanation :
M : Average of Student’s
Score
∑x : Total Score
N : Number of
Students
TABLE 2
Percentage of Self- esteem Scale
Percetage of Score Category Assessment
81 – 100 Always
61 – 80 Often
41 – 60 Sometimes
10
21 – 40 Ralely
0 – 20 Never
(Source : SOAR Program 2003, in Sinta S. 2013:52)
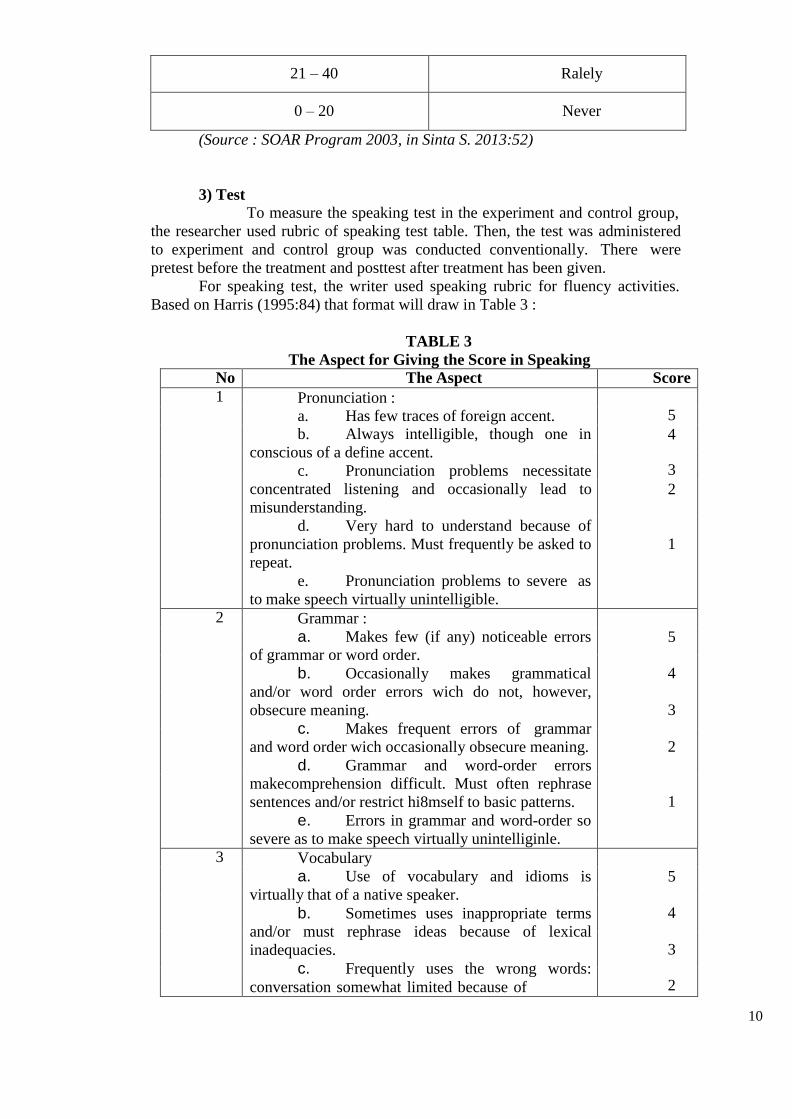
3) Test
To measure the speaking test in the experiment and control group,
the researcher used rubric of speaking test table. Then, the test was administered
to experiment and control group was conducted conventionally. There were
pretest before the treatment and posttest after treatment has been given.
For speaking test, the writer used speaking rubric for fluency activities.
Based on Harris (1995:84) that format will draw in Table 3 :
TABLE 3
The Aspect for Giving the Score in Speaking
No The Aspect Score
1 Pronunciation :
a. Has few traces of foreign accent. b. Always intelligible, though one in
conscious of a define accent.
c. Pronunciation problems necessitate
concentrated listening and occasionally lead to
misunderstanding.
d. Very hard to understand because of
pronunciation problems. Must frequently be asked to
repeat.
e. Pronunciation problems to severe as
to make speech virtually unintelligible.
5
4
3
2
1
2 Grammar :
a. Makes few (if any) noticeable errors
of grammar or word order.
b. Occasionally makes grammatical
and/or word order errors wich do not, however,
obsecure meaning.
c. Makes frequent errors of grammar
and word order wich occasionally obsecure meaning.
d. Grammar and word-order errors
makecomprehension difficult. Must often rephrase
sentences and/or restrict hi8mself to basic patterns.
e. Errors in grammar and word-order so
severe as to make speech virtually unintelliginle.
5
4
3
2
1
3 Vocabulary
a. Use of vocabulary and idioms is
virtually that of a native speaker.
b. Sometimes uses inappropriate terms
and/or must rephrase ideas because of lexical
inadequacies.
c. Frequently uses the wrong words:
conversation somewhat limited because of
5
4
3
2

11
inadequate vocabulary. d. Misuse of words and very limited
vocabulary make comprehension quite difficult.
e. Vocabulary limitations so extreme as
to make conversation virtually impossible.
1
4 Fluency: a. Speech as fluent and effortless as that
of a native speaker.
b. Speed of speech seems to be slightly
affected by language problems.
c. Speed and fluency are rather strongly
affected by language problems.
d. Usually hesitant; often forced into
silence by language limitations.
e. Speech is also halting and
fragmentary as to make conversation virtually
impossible.
5
4
3
2
1
(rubric for fluency activities. Based on Harris, 1995:84 in Fitria, 2012:38- 40)
H. Validity and Reliability of
Instruments
1) Validity of the Test
Fraenkel, et al (1990:127) state
that validity refers to the
appropriateness, meaningfulness and
usefulness of the specific inferences
researchermade based on the data they
collected. In this case, the researcher
used one of the types of validity that
was content validity. After the
instrument has been constructed, then
to make the test materials have
validity, it was only used a written test.
5 = Always
4 = Often
3 = Sometimes
2 = Rarely
1 = Never
To know the content validity of the
test, the researcher wrote test
specification. The questionnaire type
of self esteem.
The questionnaire type of self-
esteem scale for English Students
Self-esteem scale for English
students
Direction :
1. Read the statements
clearly, and then giving check list ( )
and the following exercise allows you
to evaluate your self esteem using this
scale :
2. Please answer the questions from your deep heart
Name :
Class :
Student Number :
No. Statements 1 2 3 4 5
Success
1. Do you
know your strength and

12
weakness in
speaking class so
you will know
how the way to
speak English fluently?
2.
Are you
still confused with
what is needed to
speak English well?
3.
Are you
proud of when
you get a good
scores in speaking class?
4.
Do you
proud when you
can speak English
Well?
5. Do you do
your best to speak English well?
6.
Do you
feel ambitions to
get an excellent
score in speaking class?
7.
Do you
feel happy when
you finish
speaking class
well ?
Planning
8.
Do you
prepare well when
you take a
speaking subject test ?
9. Are you
serious in joining speaking class?
10.
Do you make a mid
mapping in every
topic that you get
from your
teacher?
11. Are you
serious in speaking subject

13
to get better score
than your friend’s?
12.
Are you
active or less to
give answer and
question when
speaking class
process ?
13.
Do you learn speaking
subject without
score target?
14.
Do you
join in speaking
subject only to
fulfil the
requirement of
teacher?
15.
Do you
focus on speaking
class because of others?
16.
Do you
finish the assignment in
speaking class
because of
yourself?
17.
Do you
need your
teacher’s support
to do your best in
speaking class?
18.
Do you
join in speaking
class because of your friends ?
Creativity
19.
Do you
have a trick in
enriching your vocabulary?
20.
Do you
find bay yourself
the easiest way to
speak English
well?
21. Do you
bring your
dictionary in

14
every meeting for speaking class?
22.
Do you like to make
perfect your
vocabulary before
speak?
23.
Do you
find the way to
enjoy in speaking class ?
24.
Do you
like debate class
to increase your
speaking skill?
25.
When you
find the problem
in speaking class,
will you solve the
problem and find
the best solution on it?
2) Reliability of the Test
Reliability is concerned with
the consistency of score obtained from
assesment (McMillan, 1992:35).
Before doing the research, the test is
field tested for its reliability. To know
or to find out whether the test
instrument was reliable or not, the
researcher used inter-rater reliability to
know testing how similarly students
score items. The data from the try out
result was then analyzed by using
Cronbach’s Alpha found in SPSS 19
Version.
The Self-esteem questionnaire
had been tried out and distributed to
the eleventh grade students’ of
Rahmaniyah High School of Sekayu
Musi Banyuasin. The result of the try
out had been analyzed byusing
Cronbach Alphha in SPSS 19 to show
the reliability.
Based on the analysis of the
reliability and validity of the try out
test, it found that the Self-esteem
questionnaire chosen in this study was
reliable and valid.
TABLE 4
THE RESULT OF TRY OUT
NUMBER
OF
STUDEN TS
RATE
R 1
RATE
R 2
TOTAL
SCOR
E
1
70
70 14
0
70
2
75
70
14 5
72,5

15
3
65
70
13 5
67,5
4
70
65
13 5
67,5
5
75
80 15
5
77,5
6
80
75
15 5
77,5
7
60
65 12
5
62,5
8
70
70 14
0
70
9
85
80 16
5
82,5
10
70
60
13 0
65
11
65
65
13 0
65
12
70
65 13
5
67,5
13
75
75 15
0
75
14
60
65
12 5
62,5
15
75
70 14
5
72,5
16
65
65
13 0
65
17
70
75
14 5
72,5
18
80
75 15
5
77,5
19
60
60
12 0
60
20
70
75 14
5
72,5
21
80
75
15 5
77,5
22
75
70
14 5
72,5
23
75
65
14 0
70
24
70
65
13 5
67,5
The interpretation of Alpha Cronbach value in this study was made based
on following table.
TABLE 5
THE RESULT OF
RELIABILITY OF TEST ITEMS

16
Descriptive Statistics
M ean
Std.
Deviation
N
ATE
R1
7
1,25
6,63
5
24
ATE
R2
6
9,58
5,69
5 24
TABLE 6
Correlations
RATER1 RATER2
RATER1 Pearson Correlation 1 ,705**
Sig. (2-tailed) ,000
Sum of Squares and
Cross-products 1012,500 612,500
Covariance 44,022 26,630
N 24 24
RATER2 Pearson Correlation ,705** 1
Sig. (2-tailed) ,000
Sum of Squares and
Cross-products 612,500 745,833
Covariance 26,630 32,428
N 24 24
**. Correlation is significant at the 0.01 level (2-tailed).
score in the first and the second
experimental group were classified
Variable result between two
raters shown the correlation
coefficient value with the alpha value
α = 0.01 or 1 % was 0.705 (r obtained).
If the r obtained exceeded that r table
(0.515), it means that the test
instrument was reliable. It showed in
table above.
I. Technique for
Analyzing the Data
In analyzing the data, the
researcher firstly analyzed the
students’ pretest and posttest in the
experimental group (using drama
technique) and second experimental
group (using traditional method) by
using ANOVA. Then, the students
students’ score level into upper,
middle, and lower score level to know
the effect of teaching speaking ability.
Before analyzing the data, the
test of normality and homogenity of
the sample was done to measure the
data from the students pretest and
posttest.
In the experimental group was
taught by using drama technique and
control group by using traditional
method. To mesure the data used t-test
and then the researcher also used
regression to know the
interactioneffect to the teaching of
using drama technique and students’
self-esteem, two way ANOVA in
SPSS 19 was used, they were
presented below.

17
1) The t-test was used to
measure each of the students’ speaking
ability between two groups. In this
study, after normality and
homogeneity test are done, namely
independent sample t-test. A test is
used to examine more closely the
group differences. After speaking test
a) =
b)
c)
was administrated, the scores were
then tabulated and computed using
independent sample t-test.
According to Riduwan
(2009:179), to calculate the formula of
Independent t-test the, formula is as
follows :
Where:
t = t-tes
= Parameter Score
SD = Standar Deviation
N = The Number of the Students
X = The Individual Score
= The Mean Score
2) The two- way ANOVA was used to measure an interaction effect
between the drama technique and students’ self-esteem on speaking ability.
According to Riduwan (2009:203), to calculate ANOVA manually is as
below :
JKT = - )
JKA = - )
JKB = - )
JKAB = - - JKA – JKB )
JKD = JKT - JKA - JKB – JKAB
) Note :
JKT : Jumlah Kuadrat Total (Sum of Total Kuadrat)
JKA : Jumlah Kuadrat Menurut Faktor A (Sum of Kuadrat based
on Factor A
JKB : Jumlah Kuadrat Menurut Faktor B (Sum of Kuadrat based
on Factor B)
JKAB : Jumlah Kuadrat Menurut Faktor A dan B (Sum of Kuadrat
based on Factor A and B)
JKD : Jumlah Kuadrat Menurut Faktor D (Sum of Kuadrat based
on Factor D)
Looking for Degrees of Freedom (dbA; dbB; dbAB; dbD; dbT),
) with formulas:
dbA (line) = b – 1
SD=

18
dbB (column) = k – 1
dbAB (interaction) = (dbA) . (dbB)
dbD (residue) = N – (b.k)
dbT (Total) = N – 1
Calculating the Mean Squares between Groups (KRA; KRB;
) KRAB; KRD), with formulas:
KRA =
Calculate Fcount (FA; FB; FAB), with formulas: )
Calculate Ftable (FA; FB; FAB), with formulas: ) FA (table) = FA (α) (dbA : dbD)
FB (table) = FB (α) (dbB : dbD)
FAB (table) = FAB (α) (dbAB : dbD)
Make a table of summary Two Ways ANOVA
)
CHAPTER IV
FINDINGS AND
INTERPRETATIONS
The purpose of this chapter is
to present: the findings and
interpretations of the study.
1.1. Findings
From this study, the writer
discusses the data description obtained
from pretest and posttest on speaking
achievement test in the experimental
and control groups. The scores of
students’ speaking ability in pretest
and posttest were rated or marked by
two raters. The collections of primary
data were presented and analyzed
referring to the objectives of the study.
The data presented in pretest and
posttest scores of experimental and
control group. Then, the data were
analyzed by using SPSS version, to
know the significance of the findings.
In other words, it was used to
investigate students’ self-esteem and
students’ scores of speaking
achievement.
4.1.1 The result of The Test
The pretest and posttest were
given to the students in experimental
and control group. The pretest was
given to the students in experimental
and control group before the
researcher conducted her experiment.
The posttest was given after the pretest
conducted by researcher.
4.1.1.1 Pretest and Posttest
Scores in Experimental Group
The first time the students gave
pretest, the post-test was conducted
after the treatment or teaching
speaking with drama method. The test
given to the students were exactly the
same as in the pre-test. The data were
also analyzed and calculated.
In experimental group,
it was found that the lowest score of
pretest was 62,5, the mean score was
67,750 and standard deviation was 3,

19
7504. The chart below showed the
percentage of the scores.
HISTOGRAM 1
Percentage of pretest score in experimental group
pre_exp
7
6
5
4
3
2
1
0
62.5
65.0
67.5
70.0
72.5
75.0
Mean = 67.75 Std. Dev. = 3.7504
pre_exp N = 24
From the histogram above, it could be seen there was four students who
got the lowest score, which was 62,5, there were seventeen students who got 65,0
to 72,5 and there were three students who got the highest score, which were 7,5. It
meant that the students’ scores of the pretest in experimental group have the
normality distribution.
Based on the calculation in the pretest scores of the students’ speaking
skill in the experimental group, four students (16,7 %) got the lowest score, it was
62,5; five students (20,8 %) got 65,0; six students (25,0 %) got 67,5; three
students (12,5 %) got 70,0; two students (8,3 %) got 71,0; one student (4.2%) got
70;three students (12.5%) got 70.5; three students (12.5 %) got 71,0; two students
(8.3 %) got 72,0; one student (4.2 %) got 72,5; one student (4,2%) got 72,5; one
student (4.2%) got 74,5 and one student (4,2%) got the highest score, it was 75,0.
The students pretest score of experimental group could be seen in Table below.
TABLE 7
THE FREQUENCY OF PRETEST SCORE IN EXPERIMENTAL
GROUP
Fre
quency
P ercent
V
alid
Percent
Cum
ulative
Percent
alid
2,5 4
1 6,7
1 6,7
16,7
5,0
5 2
0,8 2
0,8 37,5
Freq
uen
cy

20
Meanw
HISTOGRAM 2
Percentage of posttest score in experimental group
post_exp
6
5
4
3
2
1
0
70.0
72.5
75.0
77.5
80.0
82.5
85.0
Mean = 75.979
Std. Dev. =
4.0176
N = 24
post_exp
post_exp
From the histogram above, it could be seen there was three students who
got the lowest score, which was 70,0, there were nineteen students who got 72,5
to 82,5 and there were two students who got the highest score, which were 85,5. It
meant that the students’ scores of the posttest in experimental group have the
normality distribution.
Based on the calculation in the posttest scores of the students’ speaking
skill in the experimental group, three students (12,5%) got the lowest score, it was
70,0; five students (20,8%) got 72,5; three students (12,5%) got 75,0; two students
(8,3%) got 75,5; five students (20,8%) got 77,5; four students (16,7%) got 80,0;
Fre
qu
en
cy
7,5 6
2 5,0
2 5,0
62,5
0,0 3
1 2,5
1 2,5
75,0
1,0 2
8 ,3
8 ,3
83,3
2,0 1
4 ,2
4 ,2
87,5
2,5 1
4 ,2
4 ,2
91,7
4,5
1 4
,2 4
,2 95,8
5,0 1
4 ,2
4 ,2
100, 0
otal
24 1
00,0 1
00,0

21
one student (4,2%) got 82.5 and one student (4,2%) got the highest score, it was
85,0. The students posttest score of experimental group could be seen in Table
below.
TABLE 8
THE FREQUENCY OF POSTTEST SCORE IN EXPERIMENTAL
GROUP
Freq
uency
P
ercent
Val
id Percent
Cum
ulative Percent
alid 0,0 3 1
2,5
12,
5 12,5
2,5 5 2
0,8
20,
8 33,3
5,0 3 1
2,5
12,
5 45,8
5,5 2 8
,3 8,3 54,2
7,5 5 2
0,8
20,
8 75,0
0,0 4 1
6,7
16,
7 91,7
2,5 1 4
,2 4,2 95,8
5,0 1 4
,2 4,2
100,
0
otal 24 1
00,0
100
,0
TABLE 9
THE PRETEST AND POSTTEST SCORES IN THE
EXPERIMENTAL GROUP
Statistics
p
re_exp
p
ost_exp
N Valid 2 2 4 4
Missing 0 0
Mean 6 7 7,750 5,979
Std. Error of Mean , , 7655 8201

22
Median 6 7 7,500 5,500
Mode 6 7 7,5 2,5(a)
Std. Deviation 3 4 ,7504 ,0176
Variance 1 1 4,065 6,141
Range 1 1 2,5 5,0
Minimum 6 7 2,5 0,0
Maximum 7 8 5,0 5,0
Sum 1 1 626,0 823,5
a Multiple modes exist. The smallest value is shown
4.1.1.2 Pretest and Posttest Scores in Control Group
The first time the students gave pretest, the post-test was conducted after
the treatment or teaching speaking with drama method . The test given to the
students were exactly the same as in the pre-test. The data were also analyzed and
calculated.
In control group, it was found that the lowest score of pretest was
60,0, the mean score was 64,417 and standard deviation was 2,9068. The chart
below showed the percentage of the scores.
HISTOGRAM 3
Percentage of pretest score in control group
pre_cont
7
6
5
4
3
2
1
0
60.0
62.0
64.0
66.0
68.0
70.0
Mean = 64.417 Std. Dev. = 2.9068 N = 24
pre_cont
Fre
qu
en
cy

23
M
From the histogram above, it could be seen there was four students who
got the lowest score, which was 60,0, there were eightteen students who got 62,0
to 68,0 and there were two students who got the highest score, which were 70,0. It
meant that the students’ scores of the pretest in control group have the normality
distribution.
Based on the calculation in the pretest scores of the students’ speaking
skill in the control group, three students (12,5%) got the lowest score, it was 60,0;
one student (4,0%) got 61,0; one student (4,0%) got 62,0; five students (20,0%)
got 62,5; six students (24,0%) got 65,0; one student (4,0%) got 65,5; two students
(8,0%) got 66,5; one student (4,0%) got 67,0 ; two students (8,0%) got 67,5 and
two student (8,0%) got the highest score, it was 70,0. The students pretest score of
control group could be seen in Table below.
TABLE 10
THE FREQUENCY OF PRETEST SCORE IN CONTROL GROUP
Freq
uency
P ercent
V
alid
Percent
Cum
ulative
Percent
V 6 alid 0,0
3 1
2,0 1
2,5 12,5
6 1,0
1 4
,0 4, 2
16,7
6 2,0
1 4
,0 4, 2
20,8
6 2,5
5 2
0,0 2
0,8 41,7
6 5,0
6 2
4,0 2
5,0 66,7
6 5,5
1 4
,0 4, 2
70,8
6 6,5
2 8
,0 8, 3
79,2
6 7,0
1 4
,0 4, 2
83,3
6 7,5
2 8
,0 8, 3
91,7
7 0,0
2 8
,0 8, 3
100, 0
T otal
24 9
6,0 1
00,0
S issing ystem
1 4
,0
Total 25
1 00,0
Meanwhile, from the result of posttest, the lowest score was
70,0, the highest score was 77,5, the mean score 72,854 and the standard deviation
was 2,3796. The chart below showed the percentage of the posttest score.
HISTOGRAM 4
Percentage of posttest score in control group

24
post_cont
10
8
6
4
2
0
70.0
72.0
74.0
post_cont
76.0
78.0
Mean = 72.854
Std. Dev. =
2.3796
N = 24
From the histogram above, it could be seen there was six students who got
the lowest score, which was 70,0, there were fourteen students who got 72,0 to
76,0 and there were two students who got the highest score, which were 78,0. It
meant that the students’ scores of the posttest in control group have the normality
distribution.
Based on the calculation in the posttest scores of the students’ speaking
skill in the control group, six students (24,0%) got the lowest score, it was 70,0;
one student (4,0%) got 71,0; one student (4,0%) got 72,0; eight students (32,0%)
got 72,5;one students (4,0%) got 74,0; four students (16,0%) got 75,0; one student
(4,0%) got 76,5; and two student (8,0%) got the highest score, it was 77,5. The
students posttest score of control group could be seen in Table below.
TABLE 11
THE FREQUENCY OF POSTTEST SCORE IN CONTROL GROUP
Fre
quency
P ercent
V
alid
Percent
Cu mulative Percent
alid V
0,0 7
6 2
4,0 2
5,0 25,0
1,0 7
1 4
,0 4
,2 29,2
2,0 7
1 4
,0 4
,2 33,3
2,5 7
8 3
2,0 3
3,3 66,7
4,0
7 1
4 ,0
4 ,2
70,8
Fre
qu
en
cy

25
issing
5,0
6,5
7,5
otal
M ystem
Total
7
7
7
T
S
4 1
6,0 1
6,7 87,5
1 4
,0 4
,2 91,7
2 8
,0 8
,3 100,
0
24 9
6,0 1
00,0
1 4
,0
25 1
00,0
TABLE 12
THE PRETEST AND POSTTEST SCORES IN THE CONTROL
GROUP
Statistics
p
re_cont
post _cont
N Valid 2 4
24
Missing 1 1
Mean 6 72,8 4,417 54
Std. Error of Mean , ,485 5933 7
Median 6 72,5 5,000 00
Mode 6 5,0
72,5
Std. Deviation 2 2,37 ,9068 96
Variance 8 5,66 ,449 3
Range 1 0,0
7,5
Minimum 6 0,0
70,0
Maximum 7 0,0
77,5
Sum 1 174 546,0 8,5
4.1.2. The Analysis of Paired Sample T-Test
4.1.2.1. Analysis of Paired Sample T-test in Experimental Group

26
M
M
-
To find out whether or not there was significance in speaking ability
before and after the treatment of the experimental group, the writer compared the
result of the pre-test with those of pos-test in the experimental group by using
paired sample t-test.
The result of paired sample t-test was found that the mean difference
between pretest and posttest in experimental group was -8,2292, the standard
deviation was 5,3140 and the significant level was 0,000. Since significant level
was lower than alpha value 0,05, it indicates that the students in experimental
group gained speaking ability significantly. It can be seen in the table below.
TABLE 13
Paired Samples Statistics
ean
N Std.
Deviation
Std.
Error Mean
air 1 pr
e_exp
p
ost_exp
6 2 3,75 ,765
7,750 4 04 5
7 2 4,01 ,820
5,979 4 76 1
TABLE 14
Paired Samples Correlations
Cor
relation
S ig.
P pre_exp & ,065
,
air 1 post_exp 4 762
TABLE 15
Paired Samples Test
Paired Differences
f
ig.
(2-
taile
d)
ean
td.
Deviat
ion
td.
Error
Mean
95%
Confidence
Interval of the
Difference
L ower
U pper
p - - -
air re_exp 8,2292 ,3140 ,0847 10,4731 5,9853 7,586 3 000
27
P
M
1 post_ex p
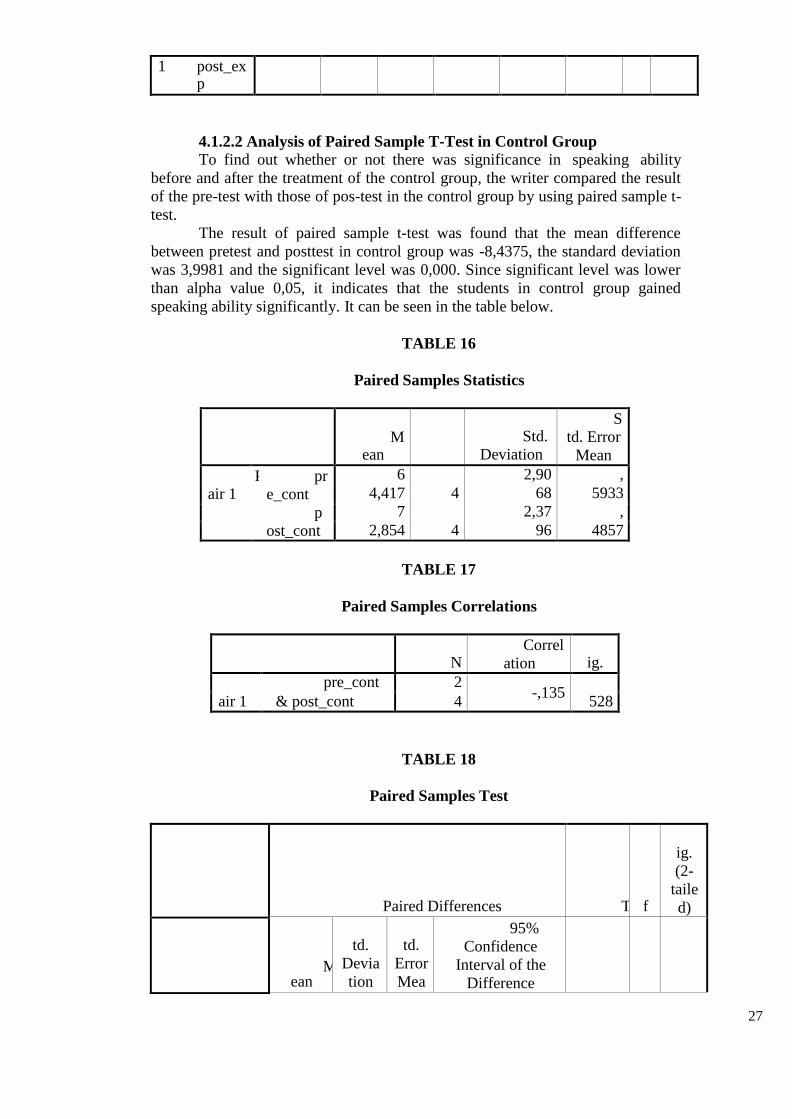
4.1.2.2 Analysis of Paired Sample T-Test in Control Group
To find out whether or not there was significance in speaking ability
before and after the treatment of the control group, the writer compared the result
of the pre-test with those of pos-test in the control group by using paired sample t-
test.
The result of paired sample t-test was found that the mean difference
between pretest and posttest in control group was -8,4375, the standard deviation
was 3,9981 and the significant level was 0,000. Since significant level was lower
than alpha value 0,05, it indicates that the students in control group gained
speaking ability significantly. It can be seen in the table below.
TABLE 16
Paired Samples Statistics
M ean
Std.
Deviation
S td. Error
Mean
air 1 pr
e_cont
p
ost_cont
6 2,90 ,
4,417 4 68 5933
7 2,37 ,
2,854 4 96 4857
TABLE 17
Paired Samples Correlations
N Correl
ation
ig. pre_cont 2
-,135
air 1 & post_cont 4 528
TABLE 18
Paired Samples Test
Paired Differences
T
f
ig.
(2-
taile
d)
ean
td.
Devia
tion
td.
Error
Mea
95%
Confidence
Interval of the
Difference

28
n
L ower
U pper
p air 1 re_con
post_con
-
- - -
8,4375 ,9981 8161 10,1258 6,7492 10,339 3 000
4.1.3 The Result of Normality Test
4.1.3.1 The Result of Normality Test in Experimental Group
The result of pretest score in experimental group based on
Kolmogrov_Smirnov showed that significance level (2-tailed) was 0,640 > 0,05.
It indicated that the data obtained was considered normal data.
The result of posttest score in experimental group based on
Kolmogrov_Smirnov showed that significance level (2-tailed) was 0,734 > 0,05.
It indicated that the data obtained was considered normal data. The data showed
in table below.
TABLE 19
One-Sample Kolmogorov-Smirnov Test
p
re_exp
p
ost_exp
N 2 2 4 4
Mean 6 7
Normal 7,750 5,979
Parameters(a,b) Std. 3 4
Deviation ,7504 ,0176
Most Absolute , ,
Extreme 152 140
Differences Positive , , 152 140
Negative - - ,101 ,106
Kolmogorov-Smirnov Z , , 743 686
Asymp. Sig. (2-tailed) , , 640 734
a Test distribution is Normal.
b Calculated from data.
4.1.3.2 The Result of Normality Test in Control Group
The result of pretest score in Control group based on
Kolmogrov_Smirnov showed that significance level (2-tailed) was 0,548 > 0,05.
It indicated that the data obtained was considered normal data.
The result of posttest score in control group based on
Kolmogrov_Smirnov showed that significance level (2-tailed) was 0,173> 0,05. It
indicated that the data obtained was considered normal data. The data showed in
table below.

29
TABLE 20
One-Sample Kolmogorov-Smirnov Test
p
re_cont
po
st_cont
N 2 4
24
Normal Mean 6 72
Parameters (a,b) 4,417 ,854
Std. 2 2,
Deviation ,9068 3796
Most Absolute
Extreme
Differences
,
163 ,2
26
Positive , ,2 162 26
Negative - - ,163 ,115
Kolmogorov-Smirnov Z , 1, 798 106
Asymp. Sig. (2-tailed) , ,1 548 73
Group
a Test distribution is Normal.
b Calculated from data.
4.1.4 The Result of Homogeneity
4.1.4.1 The Result of Homogeneity of Variance Test in Experimental
The result of homogeinity of variance test in experimental group
showed that p-value was 0,000 and F calculation was 53,806 > 0,05. It meant that
the data was homogenous. The data showed in table below.
TABLE 21
Test of Homogeneity of Variances
ss_score
L
evene
Statistic
d f1
d f2
S ig.
, 1
4 ,
155 6 695
TABLE 22
ANOVA
ss_score
S
um of
Squares
D f
Mea
n Square
F
S ig.
Betwee 8 1 812, 5 ,
30
n Groups Within
Groups
Total
12,630 6
94,740
1 507,370
4
6
4 7
630 15,1
03
3,806 000
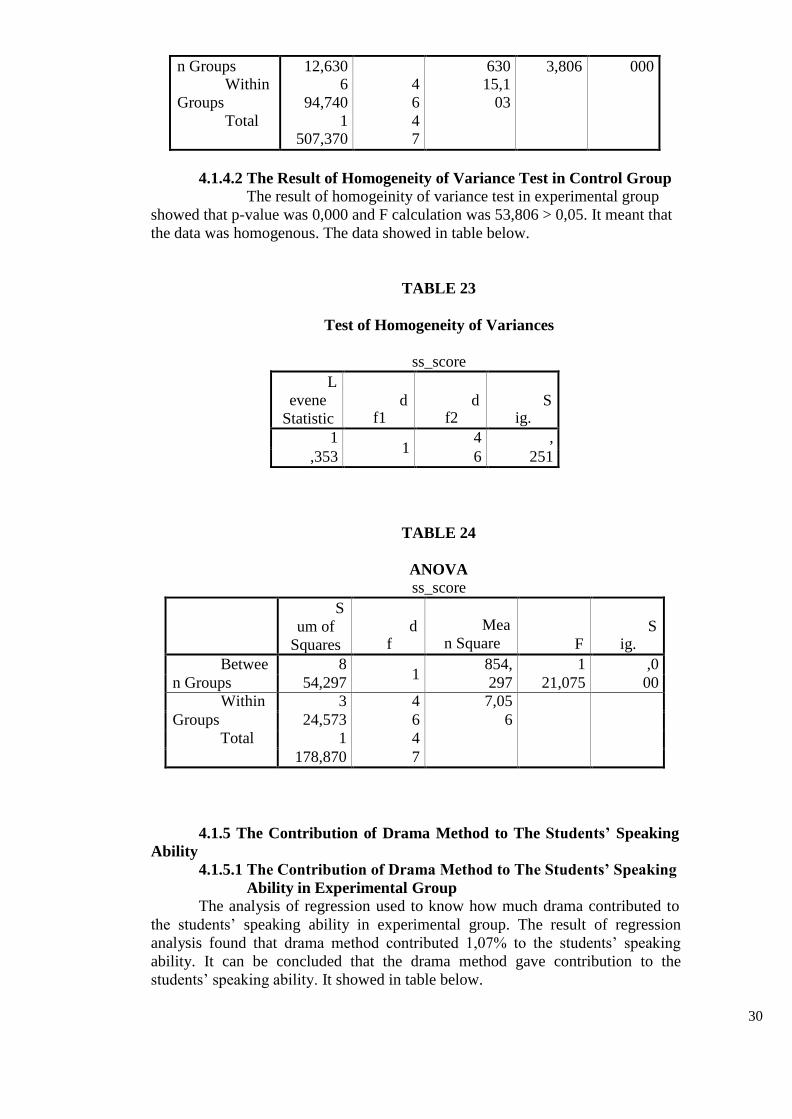
4.1.4.2 The Result of Homogeneity of Variance Test in Control Group
The result of homogeinity of variance test in experimental group
showed that p-value was 0,000 and F calculation was 53,806 > 0,05. It meant that
the data was homogenous. The data showed in table below.
TABLE 23
Test of Homogeneity of Variances
ss_score
L
evene
Statistic
d f1
d f2
S ig.
1 1
4 ,
,353 6 251
TABLE 24
ANOVA
ss_score
S
um of
Squares
d f
Mea
n Square
F
S ig.
Betwee 8 1
854, 1 ,0
n Groups 54,297 297 21,075 00
Within 3 4 7,05 Groups 24,573 6 6
Total 1 4
178,870 7
Ability
4.1.5 The Contribution of Drama Method to The Students’ Speaking
4.1.5.1 The Contribution of Drama Method to The Students’ Speaking
Ability in Experimental Group
The analysis of regression used to know how much drama contributed to
the students’ speaking ability in experimental group. The result of regression
analysis found that drama method contributed 1,07% to the students’ speaking
ability. It can be concluded that the drama method gave contribution to the
students’ speaking ability. It showed in table below.

31
1
M
R
TABLE 25
Variables Entered/Removed(b)
odel
Var
iables
Entered
Var
iables Removed
M ethod
ss_ speakingsc ore(a)
. E
nter
a All requested variables entered.
b Dependent Variable: ss_selfesteem
TABLE 26
Model Summary
odel
R Square
A
djusted R
Square
Std. Error of the
Estimate
1 , , ,0 6,4 327(a) 107 66 265
a Predictors: (Constant), ss_speakingscore
TABLE 27
ANOVAb
Model
Sum of
Squares
df
Mean Square
F
Sig.
1 Regression 108,737 1 108,737 2,633 ,119a
Residual 908,596 22 41,300
Total 1017,333 23
a. Predictors: (Constant), ss_speakingscore
b. Dependent Variable: ss_selfesteem
4.1.5.2 The Contribution of Drama Method to The Students’ Speaking
Ability in Control Group
The analysis of regression used to know how much drama contributed to
the students’ speaking ability in control group. The result of regression analysis
found that drama method contributed 0,05% to the students’ speaking ability. It
can be concluded that the drama method gave contribution to the students’
speaking ability. It showed in table below.
TABLE 28
Variables Entered/Removed(b)
M odel
Variable
s Entered
V
ariables
Remove
M ethod

32
M
d
1 ss_spesc ore(a)
. E
nter
a All requested variables entered. b Dependent Variable: ss_selfesteem
TABLE 29
Model Summary
odel
R
R
Square
Ad
justed R Square
Std.
Error of the Estimate
1 , ,0 - 6,17 073(a) 05 ,040 36
a Predictors: (Constant), ss_spescore
TABLE 30
ANOVAb
Model
Sum of
Squares
df
Mean Square
F
Sig.
1 Regression 4,477 1 4,477 ,117 ,735a
Residual 838,482 22 38,113
Total 842,958 23
a. Predictors: (Constant), ss_spescore
b. Dependent Variable: ss_selfesteem
Rater
4.1.6. The Reliability of Inter
4.1.6.1.The Reliability of
The first rater would be the writer and
the other one was as the second rater.
Before using the rubric, both raters
Inter Rater of Pretest and Posttest
in Experimental Group
To minimize the subjectivity in
scoring students’ speaking, two raters
who had the experience in handling
teaching and testing speaking to get
involved in giving scores were needed.
had discussed the content of the rubric. The correlation coefficient (r) between
two raters was calculated by means of
Product Moment Correlation. The
correlation of two raters was shown in
Table below.
TABLE 31
Descriptive Statistics
M ean
Std.
Deviation
N
7 6,03 4
ater1 1,688 24 8 7 6,34 4
ater2 2,042 12 8

33
TABLE 32
Correlations
rater1 rater2
rater1 Pearson Correlation 1 ,676**
Sig. (2-tailed) ,000
Sum of Squares and
Cross-products 1710,313 1214,625
Covariance 36,390 25,843
N 48 48
rater2 Pearson Correlation ,676** 1
Sig. (2-tailed) ,000
Sum of Squares and
Cross-products 1214,625 1889,917
Covariance 25,843 40,211
N 48 48
**. Correlation is significant at the 0.01 level
Variable result between two
raters shown the correlation
coefficient value with the alpha value
α = 0.01 or 1 % was 0.676 (r obtained).
If the r obtained exceeded that r table
(0.515), it means that the test
instrument was reliable.
4.1.6.2 The Reliability of
Inter Rater of Pretest and Posttest
in Control Group
Variable result between two
raters shown the correlation
coefficient value with the alpha value
α = 0.01 or 1 % was 0.575 (r obtained).
If the r obtained exceeded that r table
(0.515), it means that the test
instrument was reliable. It showed in
table below.
TABLE 33
Descriptive Statistics
M ean
Std.
Deviation
N
6 5,26 4
ater1 8,646 53 8 6 6,01 4
ater2 8,625 64 8

34
TABLE 34
Correlations
rater1 rater2
rater1 Pearson Correlation 1 ,575**
Sig. (2-tailed) ,000
Sum of Squares and
Cross-products 1302,979 855,625
Covariance 27,723 18,205
N 48 48
rater2 Pearson Correlation ,575** 1
Sig. (2-tailed) ,000
Sum of Squares and
Cross-products 855,625 1701,250
Covariance 18,205 36,197
N 48 48
**. Correlation is significant at the 0.01 level
4.1.7 The Reliability of Questionnaire
To know the result of reliable or not of questionnaire, the data were
analyzed by using computerized statistic system. Based on the following table
below showed that 0,747 > 0,367, it meant that the coefficient reliability was
gained higher than r table. So, the reliability was significant. The result can be
seen in table below.
TABLE 35
Case Processing Summary %
ases Vali
d
Excl
uded(a)
Tota l
1
4 00,0
, 0
1
4 00,0
a Listwise deletion based on all variables in the procedure.
TABLE 36
Reliability Statistics
Cronbach's Alpha Part 1 Value -,039a
Part 2
Total N of Items
Correlation Between Forms
Spearman-Brown Equal Length
Coefficient Unequal Length
Guttman Split-Half Coefficient
N of Items
Value
N of Items
13b
,007
12c
25
,597
,748
,748
,747
a. The value is negative due to a negative average covariance
among items. This violates reliability model assumptions. You
may want to check item codings.
b. The items are: item1, item2, item3, item4, item5, item6, item7,
item8, item9, item10, item11, item12, item13.
c. The items are: item14, item15, item16, item17, item18, item19,
item20, item21, item22, item23, item24, item25.

35
TABLE 37
Item-Total Statistics
Scale Mean if Item
Deleted
Scal e Variance
if Item
Deleted
Cor rected
Item-Total
Correlation
Squ ared
Multiple
Correlation
Cro
nbach's
Alpha if
Item
Deleted
i
tem1
i
tem2
i
tem3
i
tem4
i
tem5
i
tem6
i
tem7
i
tem8
i
tem9
i
tem10
i
tem11
i
tem12
i
tem13
i
tem14
i
tem15
i
tem16
i
tem17
i
tem18
i
tem19
i
tem20
i tem21
72,6 3
34,8 53
,09 8
. ,369
75,2 1
31,7 37
,36 7
. ,307
74,7 9
35,2 16
,00 2
. ,394
73,2 1
29,5 63
,52 4
. ,259
73,1 7
31,5 36
,32 7
. ,310
72,9 2
38,1 67
- ,213
. ,426
72,7 9
36,6 94
- ,066
. ,396
73,5 8
33,8 19
,10 5
. ,367
75,3 3
35,2 75
,06 3
. ,376
72,8 8
35,8 53
- ,030
. ,399
74,8 8
39,3 32
- ,271
. ,466
75,9 2
35,5 58
,24 3
. ,363
75,7 5
33,6 74
,22 5
. ,344
75,2 9
31,6 94
,38 2
. ,305
73,5 4
33,7 37
,08 4
. ,373
72,9 2
34,7 75
,03 3
. ,386
73,9 2
38,2 54
- ,221
. ,427
75,2 5
32,9 78
,28 5
. ,330
75,6 7
37,7 10
- ,170
. ,419
72,7 5
33,5 87
,52 9
. ,326
75,2 9
32,6 50
,26 7
. ,330

36
i 73,0 32,9 ,26 . ,332
tem22 4 11 8
i 72,9 33,8 ,13 . ,360
tem23 2 19 4
i 72,7 35,1 ,08 . ,371
tem24 1 72 4 i 72,6 37,7 -
. ,422 tem25 7 10 ,169
The writer used two-way ANOVA
those who were taught using
conventional method.
It was also gotten that self-
esteem was 0,201 > 0,05. It meant that
there was no a significant influence of
self-esteem on students’ speaking
ability. It can concluded that Ho was
received and Ha was rejected.
The result of analyzing the data,
interaction effect could be known
0,329 > 0,05, it meant that there was
no a significant interaction effect of
methods used and self-esteem on
students’ speaking ability. It can
concluded that Ho was received and
Ha was rejected.
TABLE 38
Tests of Between-Subjects Effects
Dependent Variable: Ss_scores
Source
Typ e III Sum of
Squares
D f
Mea
n Square
F
S ig.
Corrected 1270 2 45,3 3 ,
Model ,786(a) 8 85 ,645 002
Intercept 1922
15,624
1 192
215,624
1 5436,83
1
,
000
Speaking 314, 379
1 314, 379
2 5,248
, 000
selfesteem 366, 2 18,3 1 , 909 0 45 ,473 201
Speaking * selfesteem
108, 292
7 15,4
70 1
,242 ,
329
Error 236, 1 12,4
583 9 52
Corrected 1507 4 Total ,370 7
a R Squared = ,843 (Adjusted R Squared = ,612)
Study
4.2 Interpretation of the
The scores of the students’
conventional way. Each scores of
pretest and posttest in both increased.
It was assumed that the students’
speaking test were calculated. Based
on the findings of above, the
interpretations are presented. If seen
from the result of analysis the data, It
can be know that the students were
taught using drama method was better
than the students were taught using
ability in learning speaking before
being taught by using conventional
method was in enough level and after
being taught by using drama method
was in good level.
The result of teaching showed
that there was different achievement

37
on the experimental and control
groups, as we know that in control
group the writer didn’t give treatment.
Therefore, treatment was given to the
students in experimental group could
influence their ability in knowledge
about speaking.
Teachinng speaking through
drama method gave a significant
contribution to the students’ speaking
achievement. This study found that
teaching speaking through drama
method can improve students’
speaking achievement. Before this
method is used, the students are less
interested in speaking achievement
and difficult to understand how to
practice speaking skill well. After
using drama method for teaching
speaking, students are more interested
in speaking lessons and help students
in understanding easier.
Learning speaking, there
should be some factors stimulated
situation. Such as throungh drama
method, the students can learn well to
work as a team. The students can work
together to practice the drama how
should be well. If there is no a good
team work, the drama is impossible
run well based on the situation has.
The students also became
active in learning especially in
speaking skill, they can think and
prepare how to be a good actor or
actress in drama. In addition, the
students can develop their speaking by
themselves.
Although the improvement was
high, teaching speaking through drama
method still gave positive effects to
the students’ speaking achievement.
The small improvement can be caused
by some other things, for example: the
defferences of ability among the
students, the materials, and the
situation and condition in the class.
By doing through drama
method in the classroom, the teacher
not only can improve the students’
speaking achievement, but also can
improve the students’ relationship
between them by working
cooperatively. This method can be
used as the teaching method at school.
Moreover, the students can
develop self-esteem towards practice
the drama well. If it is shown from the
result of students’ response related to
attitude, this study claims that the
fairly correlation happened might be
due to the lack of speaking practice of
students or they did not read alot
althought they love speaking.
Based on the analyzing data on
the contribution of drama method to
the students’ speaking ability was
found that drama method gave
contribution 1,07%. It means that
drama method influence the students’
speaking ability.
The points above can be
concluded that drama method could
stimulated the students to be active
participants in English classes through
a series of its activities, increased
students’ achievement and self-esteem,
produced a live, interesting, and fun
English class and be activated at the
same. This drama also can be done
regularly to develop students’
speaking ability.
38
CHAPTER V
CONCLUSIONS AND
SUGGESTIONS
In this part, the writer
describes: (1) conclusions and (2)
suggestions.
1. Conclusion
Based on the findings and
interpretations in previous chapter, the
writer presents some conclusions.
They are as follows.
1. It can be seen from the
result of the study that there was
significant difference between the
mean scores in the post-test of
experiment group and control group.
Therefore, it was believed that
teaching speaking by using drama
method to the eleventh grade students
could be considered as one of the
effective method to be used.
2. Teaching speaking
throught drama method seems to have
positive effects on the students’ self-
esteem and speaking achievement. In
addition, the writer can say that drama
method is effective in improving
speaking achievement and self-esteem
toward speaking of eleventh grade
students.
3. Self-esteem toward
speaking achievement is not the only
factors to support students’ progress in
speaking achievement. It must be also
supported by others factors like
facilities. The role teacher, the
facilities, etc.
4. Supported by the
significant result of pretest is lower
than posttest, it is very useful for
students to assist and motivate them to
speak English in the class. Therefore,
they can speak better than before.
5. By conducting this
research, the researcher has more
knowledge in the field. The researcher
knew how to apply the speaking
lesson by using this method and also
has experience how to manage the
class.
2. Suggestion
From the conclusions above,
the writer would like to offer some
suggestion in other to develop the
teaching and learning of English in
EFL classroom.
1. Suggestions for The
Teacher of English
The teacher should be creative
in providing speaking materials. The
teacher have to have good material
and method to suit students’ need and
interest. Find effective method to take
students’ interest in following lesson
and think that English is fun.
2. Suggestion for The
Students
They are expected to give more
attention to the teacher’s explanation
and discuss to the teachers if they have
a problem in learning speaking. The
students should improve their interest,
concentration, imagination and active
in learning English especially
speaking by using drama method.
3. Suggestion for The
Institution
The school should provide the
facilities in supporting English
teaching and learning processes and
send to the teacher of English for
following workshops, training and
seminar related to English taeching
and learning activities.
4. Suggestion for The
Students
The students were expected to
be active asking to the teacher when
teaching and learning process. Beside
that the student should study hard and
practice more exercise in learning
English and the student also should
improve their interest in learning
English, especially in learning English
speaking.

39
REFERENCES
Alisyahbana, S. Takdir. 1990. The Teaching of English in Indonesia and Teaching
and Learning English World Wide. London: Clevedon Multilingual
Matters LTD.
Arikunto, Suharsimi. 2007. Penelitian Tindakan Kelas. Jakarta: Bhumi Aksara.
Broughton, Geoffrey; Brumfit, Christopher; Flavell, Roger; Hill, Peter and Pincas,
Anita. 1980. Teaching English as a Foreign Language: Second Edition.
New York: Routledge.
Brown, H. Douglas. 2003. Language Assesing Principle and Classroom Practice.
San Fransisco State University. Logman.Com.
Byrne D. 1986. Teaching Oral English. Longman Handbooks for English
Chauhan, Vani. 2004. Drama Techniques for Teaching English. The Internet
TESL. Journal, Vol.X, No. 10, October 2004
Costello, Patrick J.M. 2003. Action Research. London: Continuum.
Doughill, John (1987). Drama Activities for Language Learner. London: Mcmilan
Publisher.
Dowdy, Joanne Kilgour and Kaplan, Sarah (eds.). 2011. Teaching Drama in The
Classroom: A Toolbox for Teachers. Rotterdam: Sense Publishers.
Fraenkel, Jack R and Wallen, Norman E. 1990. How To Design and Evaluate
Research in Education. New York, NY: McGraw Hill Publishing
Company
Goodman, Norman.etc. 2001. Extending Self Esteem Theory and Research:
Sociological and Psychological Currents. Cambridge: Cambridge
University Press.
Harmer, Jeremy. 2007. The Practice of English Language Teaching: Fourth
Edition. Pearson Longman.
http. Pasca. UNHAS. AC.Id/ Journal /Files/ 5085c8e068d.pdf. 13
November 21.30 WIB.
http. Pasca. UNHAS. AC.Id/ Journal /Files/ 5085c8e068d.pdf. 13
November 21.30 WIB.
http: //www.quo.edu/english/ comferences.
http: //www.terry.uga.edu/~rg rover
http: brainyquote.com
http://books.google.co.id. Posted on March, 22 ,2013
Krik, Samuel. 1986. Educating Exceptional Children. Houghton Mifflin Company.
L.Oxford, Rebecca. 1990. Language Learning Strategies. Heinle and Heinle
Publisher, The University of Alabama.
Littlewood, William. 1984. Foreign and Second Language Learning. Cambridge:
Cambridge University Press.
Lubis, Yusnaini. 1988. Developing Communicative Proficiency in the English is
a second Language (EFL) Class. DIKTI: Jakarta.
McCarty, Michael. 1996. Discourse Analysis for Language Teacher. Cambridge:
Cambridge University Press.
Owens, Timothy J; Stryker, Sheldon; Goodman, Norman (eds.). 2011. Extending
Self-Esteem Theory and Research: Sociological and Psychological
Currents. Cambridge: Cambridge University Press.

40
Rohrberger, 1971. Reading and Writing about Literature. New York: Random
House.
Setiadi Linawati, dkk. 2008. Seri Pendalaman Materi Bahasa Inggris SMA dan
MA. Jakarta: Erlangga.
Seyler, Dorothy etc. 1981. Introduction to Literature Reading Analyzing and
Writing. New York: Random House
Sugiyono. 2009. Metode Penelitian Kuantitatif Kulalitatif & R&D. Bandung:
Alfabeta
Suhardjono. 2007. Penelitian Tindakan Kelas. Jakarta: Bhumi Aksara.
Thompson, Gill and Evans, Huw. Thinking Through: Linking Language Skills,
Thinking Skills and Drama. London: David Fulton Publishers. 2005.
Wessel, Charlyne, 1987. Drama. Oxford: Oxford University Press.
www. Angel Messenger.net