The effect of defects at the steel - concrete interface ...
35
The effect of defects at the steel - concrete interface, exposure regime and cement type on pitting corrosion in concrete Sandberg, Paul 1998 Link to publication Citation for published version (APA): Sandberg, P. (1998). The effect of defects at the steel - concrete interface, exposure regime and cement type on pitting corrosion in concrete. (Report TVBM; Vol. 3081). Division of Building Materials, LTH, Lund University. Total number of authors: 1 General rights Unless other specific re-use rights are stated the following general rights apply: Copyright and moral rights for the publications made accessible in the public portal are retained by the authors and/or other copyright owners and it is a condition of accessing publications that users recognise and abide by the legal requirements associated with these rights. • Users may download and print one copy of any publication from the public portal for the purpose of private study or research. • You may not further distribute the material or use it for any profit-making activity or commercial gain • You may freely distribute the URL identifying the publication in the public portal Read more about Creative commons licenses: https://creativecommons.org/licenses/ Take down policy If you believe that this document breaches copyright please contact us providing details, and we will remove access to the work immediately and investigate your claim.
Transcript of The effect of defects at the steel - concrete interface ...

LUND UNIVERSITY
PO Box 117221 00 Lund+46 46-222 00 00
The effect of defects at the steel - concrete interface, exposure regime and cement typeon pitting corrosion in concrete
Sandberg, Paul
1998
Link to publication
Citation for published version (APA):Sandberg, P. (1998). The effect of defects at the steel - concrete interface, exposure regime and cement type onpitting corrosion in concrete. (Report TVBM; Vol. 3081). Division of Building Materials, LTH, Lund University.
Total number of authors:1
General rightsUnless other specific re-use rights are stated the following general rights apply:Copyright and moral rights for the publications made accessible in the public portal are retained by the authorsand/or other copyright owners and it is a condition of accessing publications that users recognise and abide by thelegal requirements associated with these rights. • Users may download and print one copy of any publication from the public portal for the purpose of private studyor research. • You may not further distribute the material or use it for any profit-making activity or commercial gain • You may freely distribute the URL identifying the publication in the public portal
Read more about Creative commons licenses: https://creativecommons.org/licenses/Take down policyIf you believe that this document breaches copyright please contact us providing details, and we will removeaccess to the work immediately and investigate your claim.

LUND UNIVERSITY LUND INSTITUTE OF TECHNOLOGY
Division of Building Materials
The effect of defects at the steel- concrete interface, exposure regime and cement type
on pitting corrosion in concrete
.. : . " .
" '", "
': " " " .... ~ .c";': '; ::.:
":::'.::~:' " ," :.,0". ~ : : : : ..
: :: ',", .. ", ••••• ,. o"
o ", •••••••
Paul Sandberg
' .. '. ' ...... ' .. ' ... .
.. '
Report TVBM-3081
. ....
4
Lund, Sweden, 1998
LUND UNIVERSITY LUND INSTITUTE OF TECHNOLOGY
Division of Building Materials
The effect of defects at the steel- concrete interface, exposure regime and cement type
on pitting corrosion in concrete
Paul Sandberg
Report TVBM-3081 Lund, Sweden, 1998

ISRN LUTVDG/TVBM --98/3081--SE(1-18) ISSN 0348-7911 TVBM
Lund Institute of Technology Division of Building Materials Box 118 S-221 00 Lund, Sweden
Telephone: 46-46-2227415 Telefax: 46-46-2224427

PREFACE
This report is a compilation of results from studies of the effects of defects at the steel - concrete interface, the exposure regime, and the cement type, on the initiation of pitting corrosion in specially designed concrete corrosion cells. A compilation of all threshold levels calculated is available in Appendix A.
A standard corrosion cell has been used in this study, as developed by Hans Arup Consult and Henrik S0rensen, AEC Consulting Engineers, Denmark, in cooperation with the present author. All corrosion cells have been manufactured at AEC Consulting Engineers, Denmark using electrical components selected and customized by Hans Arup Consult and Tord Lundgren, Lund Institute of Technology.
The expo sure tests in this study have been carried out by the present author at Lund Institute of Technology, Division of Building Materials and at the Träslövsläge Marine Field Station, and by Henrik S0rensen at AEC Consulting Engineers. The datalogger system used for automatic registration of steel potentials and corrosion rates was developed by Tord Lundgren, Lund Institute of Technology.
The procedure for sampling concrete dust for the analysis of total chloride profiles was developed by Jens Frederiksen and Henrik S0rensen at AEC Consulting Engineers, Denmark. Total chloride profiles have been measured at Lund Institute of Technology, AEC Consulting Engineers and the Swedish National Testing and Research Institute, following a procedure for analysis of total chloride content by weight of binder in concrete as developed by Tang Luping, then at Chalmers Institute of Technology.
Visual studies of the corrosion attack on steel electrodes and of the microstructure of concrete at the steel - concrete interface were carried out by Henrik S0rensen at AEC Consulting Engineers and by the present author.
The analysis work has been planned and coordinated by the author and financed by Cementa AB and AEC Consulting Engineers AlS.
Lund in April, 1998.
Paul Sandberg

UNIVERSITY OF LUND LUND INSTITUTE OF TECHNOLOGY DIVISION OF BUILDING MATERIALS
Report TVBM-3081 Lund, 1998
The effects of defects at the steel-concrete interface, exposure regime and cement type on pitting corrosion in concrete
P. Sandberg Cementa AB, Box 300 22, S- 200 61 Malmö, Sweden and Division of Building Materials, Lund Institute ofTechnology, S-222 21 Lund, Sweden
Abstract The effects of defects at the steel-concrete interface, the exposure regime, and the cement type, on the initiation of pitting corrosion in specially designed concrete corrosion cells were investigated. Concrete/mortar corrosion cells with cast-in mild steel electrodes representing the reinforcement were exposed for wetting-drying cycles or submerged in NaCl solution. ParalIei field exposure testes were carried out in sea water. The microstructure of the steel-concrete interface was altered by introduction of a filter paper on the steel surface, by bending of the steel electrode and by compaction voids or cracks formed at or close to the steel surface.
The results indicated that corrosion in most cases was initiated in deformed parts of steel electrodes. Defects introduced at or close to the steel surface had a strong negative influence on the chloride threshold for concrete exposed to wetting and drying and for field exposed concrete exposed submerged or in the splash zone, but not for submerged laboratory exposed concrete.
The negative effect of filter paper and vo ids or cracks at the steel surface was stronger for slag cement concrete as compared to concrete with sulphate resisting Portland cement with O or 5 % silica fume in the binder.
The results support the idea that chioride induced pitting corrosion of steel in concrete is enforced mainly under conditions of variable exposure conditions and in the presence of defects at the steel surface. The results also indicate that reinforced slag cement concrete is more sensitive to the formation of, and the effect of, cracks and other defects at the steel - concrete interface as compared to concrete bas ed on sulfate resisting cement with O or 5 % silica fume in the binder.

1. INTRODUCTION
Chloride induced reinforcement corrosion is one of the most common durability problem associated with modem good quaiity reinforced concrete structures exposed to a marine environment or to de-icing salts. The time to corrosion initiation depends on i) how fast chioride ions penetrate the concrete cover to reach the reinforcement, and ii) the critical chloride concentration needed for depassivation of the steel reinforcement. This report is a compilation of results from studies of the effects of defects at the steelconcrete interface, the expo sure regime, and the cement type, on the initiation of pitting corrosion in specially designed concrete corrosion cells. Compilations of numerical data on the chloride thresholds found in field exposed reinforced concrete slabs and in field- and laboratory exposed corrosion cells can be found in /1,2/ and in Appendix A.
2. THE CHLORIDE THRESHOLD LEVEL
2.1 General
The chioride threshold level refers to the concentration of chiorides required to destroy the normal passivity of steel in concrete. The chloride threshold reflects the critical concentration of free chioride and hydroxide ions in the concrete pore solution at an emerging corrosion pit on the reinforcement, but it is for practical reasons /3/ often expressed as the total chioride content by weight of binder.
2.2 Definition of the chloride threshold
In this study the chioride threshold was defined as the mass ratio of measured total (bound + free) aggressive substance (chioride) and measured inhibiting substance (binder) necessary to maintain active corrosion in a pit. The corrosion process was considered active if the corrosion current was> 1 JlAlcm2.
2.3 Purpose ofstudy
Chloride threshold levels reported in the literature are confusing as they vary extensively depending on the experimental methods, the exposure conditions, the concrete quaiity and the cement type used 11,3/. The purpose of this study was to isolate and demonstrate the importance of defects at, or close to, the steel surface, on the mechanisms of corrosion initiation in chloride exposed concrete containing steel electrodes as model reinforcement. The effects of expo sure regime and cement type were also studied.
3. FACTORS AFFECTING THE IDENTIFICATION AND USE OF CHLORIDE THRESHOLD LEVELS
3.1 General
The chioride threshold level for mild steel in a given concrete quaiity seems to depend on both the micro structure /4/ and the micro climate 11-3/ at the concrete-steel interface.
2

3.2 The effect of micro structure at the concrete - steel interface
The chloride threshold level for mild steel exposed to alkaline chloride solutions reflecting typical concrete pore solutions are often lower than the corresponding threshold level for steel in concrete. The difference can be orders of magnitude /5(. The reasons for the improved chloride resistance for steel in concrete as compared to steel in alkaline solutions, are not fully understood. Experimental work by Yonezawa et al /4/, including variations in the bonding between the steel and the cement matrix, have indicated that the effect of physical adhesion between cement hydrates and iron oxides formed on the steel surface is important. It was concluded that the formation of voids at the steel-mortar interface is a necessary condition for active corrosion to start in water saturated concrete containing a moderate chloride content. Furthermore, observations ofa .protective effect of calcium hydroxide precipitated at the steel surface were reported. The protective effect of calcium hydroxide was attributed to the dis solution of calcium hydroxide crystals close to emerging pits, thereby preventing the pH drop required for the further propagation of the corrosion pit.
Marnmoliti et al /6/ on the other hand found that the tendency for pitting of steel exposed to alkaline solutions was controlled by the surface roughness of the steel and by the pH of the solution. At pH 13.3 continued pitting was not possible to initiate on any steel surface independently of the surface roughness. It was suggested that testing of steel in solutions is not representative for the inhomogeneous material concrete. Concrete is likely to exhibit local variations in the pH of the pore solution at the steel surface as opposed to well stirred solutions.
3.3 The effect of micro climate at the concrete - steel interface
Some evidence exists that the chloride threshold levels vary with the expo sure conditions, especially with the moisture state /2,7,8/. Very high threshold levels have been found for steel in concrete exposed fully submerged in the laboratory with no changes in the expo sure regime /2/. A varying moisture state at the depth of the reinforcement caused by wetting and drying of concrete has been suggested to result in a substantially lower threshold levell7,8,9/, which was confirmed by the findings in /2/. The results in /1,2/ confirmed that a more stable micro environment, as achieved by an increased cover size and/or a lower w/c ratio, or by a non-varying exposure condition, may result in a higher chloride threshold.
4. EXPERIMENTAL
4.1 Corrosion cells for testing the effect ofvarious defects at the steel-concrete interface
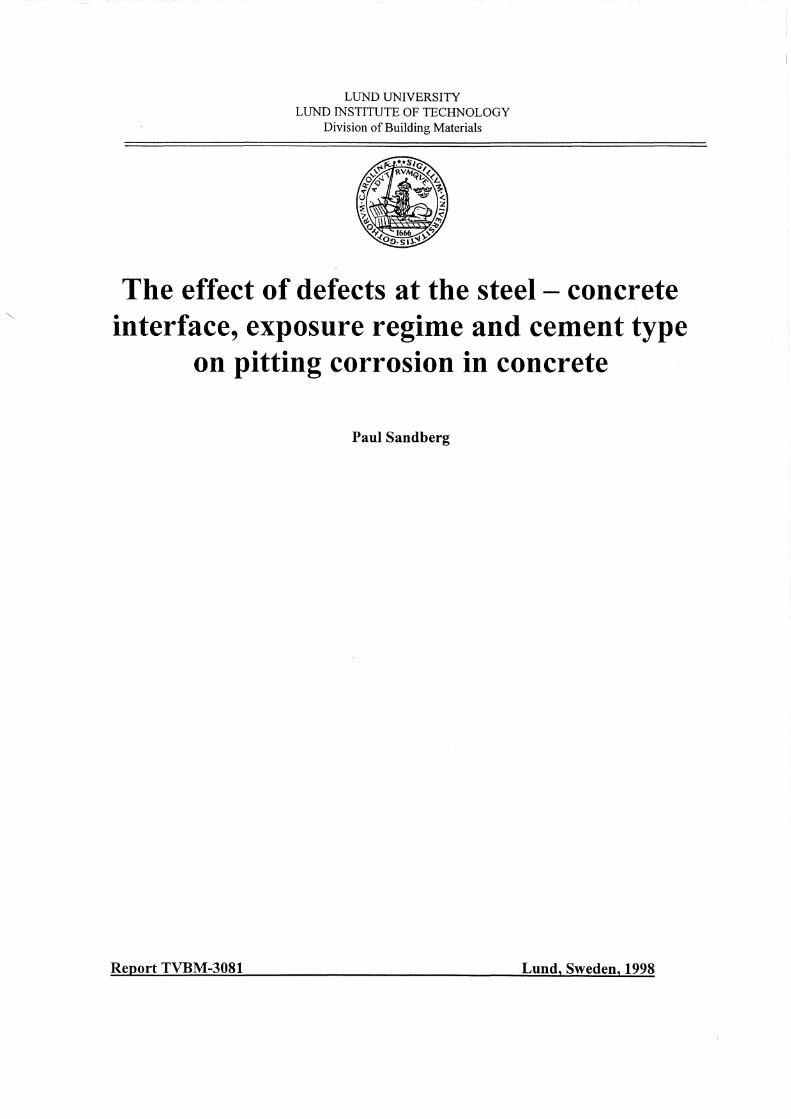
A standard corrosion cell for testing of chloride thresholds in concrete /11/ was developed by Hans Arup, formerly at the Danish Corrosion Centre, in co-operation with Henrik S0fensen at AEC, Denmark and the present author at Cementa, Sweden. The test unit consists of 20 U-shaped smooth 0 8 mm mild steel electrodes, 2 titanium mesh counter electrodes and a Mn02 reference electrode which were very accurately positioned into a cement based precast specimen holder as shown in Figure 1. The Mn02 reference electrode reads + 142 mV SCE. Some of the electrodes were connected to a potentiostat and kept under potentiostatic control according to Table 3-5.
3
Densit mortar
<D~=;:=:::' @C=:=~:::l
Q)~~? @C=:~~:::l
®C=:~~:::l
(!) Counhr electrodes
CD Reftrlnce tltdNlde
Epoxi coating .
c=:=~~@
C:::::~?®
~~?,®
~~?®
~=~® =::::;;~=® C=:=~:::l® ~=~,@
=~===®
CD (>1>l. box
(f) T est flectrodes
16 % ~aCI solution
Submerged expo sure
---r -------------,,---
Wetting 2 hrs daily Wetting '2 hrs weekly
Exposure to wetting and drying
Figure 1. Standard corrosion cell. All measures are given in millimetres [11].
The U-shaped steel electrodes have epoxy coated legs facing away from the exposed surface in order to prevent corrosion initiation on the legs. The Mn02 reference electrode and the titanium mesh counter electrode were cast into mortar bars before assembling the standard unit. The design minimises errors due to IR-drops in the test concrete.
The steel electrodes were embedded into the concrete or mortar to be tested. The placing and compacting of concrete were carried out carefullyas described in /12/. After demoulding and moist curing for 14 days the concrete surface to be exposed was cut open using a large water-cooled diamond saw to obtain a cover to the steel electrodes of nominally 10 mm. A chloride proof coating was applied to the test unit on all sides except the saw-cut face to be exposed.
Nine "dummy" concrete specimens were made from the cut off concrete plate. These specimens were handled in exactly the same manner as the test unit containing the embedded steel. All surfaces were coated except for the surface opponent to the exposed surface on the test unit. The test unit and the dummy concrete specimens were then stored in a saturated ca1cium hydroxide solution at room temperature for 2 weeks prior to the saline expo sure.
4

Steel-, counter- and reference electrodes were connected to a datalogger for monitoring the corrosion activity. A potentiostat was available for potentiostatic controi of steel electrodes before the corrosion initiation.
4.2 Introduction of artificially produced defects at the steel-concrete interface
A standard filter paper was applied on the surface on some steel electrodes according to Figure 2 and Table 3-5, with the purpose to produce artificiai defects at the steel-concrete interface, following the procedure in [3] by Yonezawa et al. The filter paper used was aSchieicher & Schuell, Filter Paper Circles no. 589-1, Black Ribbon, Ashless, 0110 mm, Ref. No. 300 010. The filter paper was mounted in 2 layers on the steel surface and fixed by a 0.40 mm nylon string. The filter paper was soaked in a 0.4 M KOH solution immediately before the casting of concrete or mortar on top of the filter paper coated steel electrodes. The KOH soaked filter paper was used with the aim to simulate a situation with the steel in contact with a simulated pore solution but without physical contact with cement hydrates.
4.3 Introduction of compaction voids at the steel-concrete interface
All concrete mixes were cast, compacted and cured in a similar way as recommended in /12/. A total of 34 electrodes were found to be affected by visible compaction voids or cracks, approximately 0.1-0.5 mm wide, at the steel surface. 17 or about 50 % of these electrodes were found in slag cement concrete.
4.4 Registration of corrosion activity
The corrosion activity in electrodes under potentiostatic controi was recorded by a datalogger on a hourly basis by measuring the electrical current needed to maintain the steel electrodes at their controlled potentials. The initiation of active corrosion was detected by an increase in the current to more than 100 ~A. After initiation the potentiostatic controi was removed and the steel electrode was allowed to corrode freely, at the same expo sure condition as before, with the potential recorded by the datalogger.
The corrosion activity in electrodes not under potentiostatic controi was recorded by a datalogger simply by recording the steel potentials. Corrosion initiation was indicated by a shift in the order of 200-500 m V to a more negative potential.
4.5 Evaluation of location and size of corrosion pits
At the end of exposure of a test cell, electrodes were removed from the cell and carefully examined visually in order to confirm the position and the approximate size of the corrosion pit. The evaluation was carried out as indicated in Figure 2.
5

Area covered by filter paper (if any) Degree of Description of corrosion pit corrosion
O None 1 Very small pit, 0-1 % of steel
surface, only surface corrosion 2 Small pit, 1-10 % of steel surface,
max 0.5 mm de~ 3 Corrosion in 10-50 % of steel
surface, max 1.0 mm de~ 4 Corrosion in 50-100 % of steel
8teel electrode surface, > 1.0 mm deep
Figure 2. Evaluation of location and size of corrosion pits
4.6 Evaluation of defects in the concrete microstructure elose to the steel surface
The concrete surrounding each electrode was examined for the existence of visible cracks or voids elose to the steel electrode. This was aided by a visual examination of the distribution of chiorides in the surrounding eonerete, by spraying freshly cut surfaces with a 0.1 M AgN03 solution. The formation of light grey AgCl precipitate at chioride rich cracks or voids provided a visual indication of chioride rich areas in concrete surrounding the steel electrodes.
4.7 Analysis of chloride- and binder profiles
Total chloride- and binder profi1es were analysed at the first corrosion initiation. Total chioride profiles were also analys ed after corrosion initiation in 25% and 50% of the steel electrodes and after 2 years of exposure. The total chloride- and binder profiles were analys ed on "dummy" concrete with no east in steel electrodes.
The concrete cover was abraded from the exposed surface and inwards in steps of 1 mm using a diamond tool according to the Nordie standard NT Build 443 /13/. The pulverized samples were analyzed for total chioride content according to AASHTO T 260-A, by potentiometric titration using a chioride ion selective electrode and a silver nitrate solution of 0.01 N.
After chloride titration, 5 mI of 1:2 diluted triethanolamine was added to the sample solution and the pH value was adjusted to pH > 12 using sodium hydroxide. The calcium content was determined by potentiometric titration using a calcium ion selective electrode and a 0.1 N EDTA solution /14/. Since the aggregate contained no acid soluble calcium, the binder content in each 1 mm fraction of concrete was ca1culated from the measured ca1cium content in each fraction. The result was presented as total chioride by weight of binder for each 1 mm fraction.
6

4.8 Calculation of chioride threshold
The location of the corrosion pit (at the steel electrode facing the exposed concrete surface ) was used to measure the exact distance from the exposed concrete surface to the steel surface at the pit. The measured total chloride profiles at various expo sure ages were then used to extrapolate the total chioride content at the depth of the corrosion pit at the time of corrosion initiation.
4.9 Types of binder used
Three different binder types, sulfate resisting Portland cement (SRPC), sulfate resisting Portland cement with 5 % silica fume, and slag cement with 50 % slag interground with Portland cement, were used as shown in Table 1.
Table 1. Details of cementing materials used
Material Sulfate resisting Slag cement Silica fume Portland cement 50 % slag (SF)
(SRPC) interground Fineness - % passing 45 ~m 85.9 100 100
20~m 51.3 72.0 10 ~m 33.1 45.3 5 ~m 19.5 33.8 1 ~m 3.8 8.2
Specific surface m2/kg Blaine 300 410 BET 23000
Compressive Strength 1 day 10.1 4.0 of standard 40 mm 7 days 35.6 29.7 mortar cubes, MPa 28 days 56.2 49.8 Chemical analysis % CaO 63.8 43.3 0.4
Si02 22.8 28.5 94.2* Al20 3 3.5 11.9 0.62 Fe203 4.7 1.1 0.95
MgO 0.80 9.0 0.65 S03 1.9 4.7 0.33 K20 0.55 0.55 0.5
Na20 0.06 0.26 0.2 Loss of ignition 0.55 O 1.8
Bouge potential C3S 51.5 compounds -% C2S 25.5
C3A 1.3 C4AF 14.3
*amorphous silica content
7

4.10 Concrete/mortar mix designs
Details of the concrete or mortar mixes are shown in Table 2.
Table 2. Details of concrete/mortar mixes used in corrosion cell tests
Mix Material Cover SRPC Slag Silica Sand Sand Aggr. Aggr. w/c Air No. cem. fume 0-2 mm 0-4 mm 0-8 mm 8-16 mm ratio conto
mm kg/m3 kg/m3 kg/m3 kg/m3 kg/m3 kg/m3 . kg/m3 * vol %
l Concrete 10 330 O O - 645 189 1058 0.50 1.0 2 Concrete 10 435 O O 760 - 970 - OA1 2.1 3 Concrete 10 420 O 16 750 - 970 - OA2 1.9 4 Concrete 10 O 435 O 755 - 965 - OAO lA 5 Mortar 4-14 555 O 29 1440 - O - OAO -
*w/c ratio defined as w/(C+SF). w = water, C = cement
4.11 Exposure conditions
Corrosion cells with plain sulfate resisting portland cement (SRPC),sulfate resisting portland cement with 5 % silica finne, or slag cement were exposed to 3 different exposure regimes as indicated below. Some of the steel electrodes were kept under potentiostatic control as indicated by the voltages in Tables 3-5. "Free pot." denotes that no potential control was applied. "Defects" denotes whether previously described artificial filter paper defects were introduced or not.
1) Submerged at + 5 DC or room temperature in a 16 % NaCl solution for 2 years. Table 3 and Figure 1.
Table 3. Configuration of steel electrodes in concrete/mortar corrosion cells exposed submerged in a 16 % N Cl l f t t t 5 DC' h l b ° a so u lOn a room emperature or a + In t e a oratory.
Steel potentials (m V rel. Mn02) Cell Mix free -4S0 -3S0 -2S0 -200 -ISO -100 -SO O Label No. pot. mV mV mV mV mV mV mV mV A-PCO.50 1° 2* 2 2 2 2 2 2 2 2 B-PCO.41 2 4 4 4 none none none 4 none none C-PCO.41 2 4 4 4 none none none 4 none none D-SFO.42 3 4 4 4 none none none 4 none none E-SLO.40 4 4 4 4 none none none 4 none none F-mortPC S 10 none 10 none none none none none none * Figure denotes number of electrodes. * * 2 electrodes with filter paper on the steel surface tested at each potential. °Cell A-PCO.50 was exposed for 4 years.
8
+SO Defects Exp. mV temp. 2 none +20°C 4 yes** +20 DC 4 yes** + 5 °c 4 yes** + 5 DC
4 yes** + 5 DC
none none + 5 DC

2) Cycles of2 hours wetting in a 16 % NaCl solution and 22 or 166 hours drying, at room temperature for a total expo sure time of 8 months, Table 4 and Figure 1.
Table 4. Configuration of steel electrodes in concrete corrosion cells exposed to a 16 % NaCl solution d b· d r . d dry. . h l b an su )jecte to cyc lC wettmg an mg m t e a oratory at room temperature.
Steel potentials (m V rel Mn02) 12 hrs wetting - 6Y2 days drying 12 hrs wetting - 12 hrs drying
Free potential -350 mV Free potential -350 mV Cell Mix Filter paper Filter paper Filter paper Filter paper
Label No. defects defects defects defects Yes No Yes No Yes No Yes No
K-PCO.41 2 5* 5 O O 5 4 O 1
L-SFO.42 3 5 5 O O 5 4 O 1
M-SLO.40 4 5 5 O O 5 4 O 1
* Figure denotes number of electrodes
3) Marine field expo sure for 2 years, submerged and in the splash zone of a floating pontoon at the Träslövsläge Marine Field Station on the Swedish west coast, Table 5 and Figure 3.
Table 5. Configuration of steel electrodes in concrete corrosion cells field exposed at the Träslövsläge Marine field Station.
Steel potentials (mV rel Mn02) Submerged Splash zone
Free potential -350 mV Free potential -350mV Cell Mix Filter paper Filter paper Filter paper Filter paper
Label No. defects defects defects defects Yes No Yes No Yes No Yes No
O-subPCO.41 2 8* 8 2 2 - - - -P-splaPCO.41 2 - - - - 8 8 2 2 R-subSFO.42 3 8 8 2 2 - - - -S-splaSFO.42 3 - - - - 8 8 2 2 T -subSLO.40 4 8 8 2 2 - - - -U-splaSLO.40 4 - - - - 8 8 2 2
* Figure denotes number of electrodes
A mortar corrosion cell with sulfate resisting portland cement and 5 % silica fume, w/c 0.4, was exposed submerged in the laboratory for 2 years at + 5 °c in a 16 % NaCl solution, Table 2. However, no corrosion was initiated although total chloride contents as high as 1.7 % were measured at the depth of the steel electrodes. All ca1culated threshold levels were given in /2/ and are shown in Appendix A.
9

?t-(
\ \ ~ -) j
.......... \ \'---
• ..l 4 ~ '----\
" '-r ~ '" ,-I \ ,-'---" v " x· -> \ -'
\O' . '-.J J ,\ // \, \ b I \. IJ "'\ c:J
--- '--"-..-j
'-J~
\.~. '--
'- \"--\. ,.
\ \
'" \
J J \...,. \ ./
~
J
d~/ ..... / Q)
.(/ ....... ro
Pontoon ] ro ~
CD ---- ----./'
j!J Harbor
J \ J
Concrete corrosion cells
Figure 3. Exposure conditions for corrosion cells at the Träslövsläge Marine Field Station.
S.RESULTS
5.1 General
All calculated chloride thresholds with a dis.cussion were presented in /2/. A compilation of data is available in Appendix A. Most of the results presented here focus on the effect of defects on the location and size of corrosion pits, and on the effects of expo sure regime and cement type.
5.2 Presentation of results on the effect of defects on the location and size of corrosion pits
All results are presented in Appendix B.
Each concrete mix and expo sure regime was evaluated separately, with the results presented as shown for slag cement concrete, w/c 0.40, exposed in the splash zone at the Träslövsläge Marine Field Station, in Figure 4.
The effect of defects was evaluated from the following indications:
A) The location of the corrosion pit, Figure 2. Bending of hot rolled black steel causes deformation and possibly cracking of the scale in deformed zones, especially at the inside of a bend.
10

B) The presenee of cOITosion pits in electrodes with artificial filter paper defects at the steel- concrete interface, relative to the presenee of pits in electrodes without filter paper defects.
C) The presenee of visible compaction vo ids or cracks at the steel - concrete interface.
Total of 20 AIA"trnrlA"
2 visible cracks i
outside
ö 6~+---~----+---~----+---~--~ ~ ~ F=t------'----+-----=-----+-----=---~ eJ!: ~ 8F=t------'----+-----=-----+---~--~
Total of 20 electrodes 2 visible cracks in "nn"rAltA~
at 2 cracks
Figure 4. Presentation ofresults on the effect of defects on the location and size of cOITosion pits.
5.3 Results from laboratory submerged exposure tests, concrete w/c 0.5 and 0.4
5.3.1 Plain SRPC concrete wie 0.50 exposedjor 4 years
14 U-bend steel electrodes of a total of 20 started to cOITode within 4 years of laboratory expo sure of SRPe concrete w/c 0.50, submerged at room temperature in 16 % Nael solution. The total chloride concentration at the depth of the cOITosion pits were 2.5 to 3.0 % el by weight of binder after 4 years of expo sure depending on the position of the corrosion pit. The visual examination revealed cOITosion initiation in deformed parts of electrodes, Figure 5, at the inside of the U-shaped electrodes in 11 electrodes of 14, or in 75 % of the cOIToding electrodes.
A potential more negative than -100 m V SeE was necessary to prevent COITosion initiation in U-bend steel electrodes.
11

... c o o 1=-'+------'--->__--=---1---=----__� ~.~~+------'--->----=---I---=------1 ~t:: C 8 ~+-----"--->----=---I----'------1
Figure 5. Evaluation of the location of corrosion pits in plain SRPC concrete exposed 4 years submerged in a 16 % NaCl solution at room temperature in the laboratory. No filter paper defects applied.
5.3.2 Concrete wie 0.4 exposed for 2 years
For all other concrete corrosion cells submerged at the laboratory, only 6 of a total of 80 steel electrodes started to corrode within 2 years of exposure. 4 of the 6 corroding electrodes had corrosion initiation in the deformed zone at the inside of the U-shaped electrodes.
No corrosion at all was initiated in SRPC concrete with 5 % silica fume or slag cement concrete when exposed submerged in the laboratory at + 5°C. On the other hand only 1.2 and 1.0 % Cl by weight of binder were measured in SRPC concrete with 5 % silica fume and slag cement concrete, respectively, at the depth of the steel electrodes. Only one electrode started to corrode in concrete exposed submerged in the laboratory at + 5°C, in plain SRPC concrete, at 1.8 % Cl by weight of binder.
5.4 Results from laboratory wetting and drying exposure tests, concrete w/c 0.4
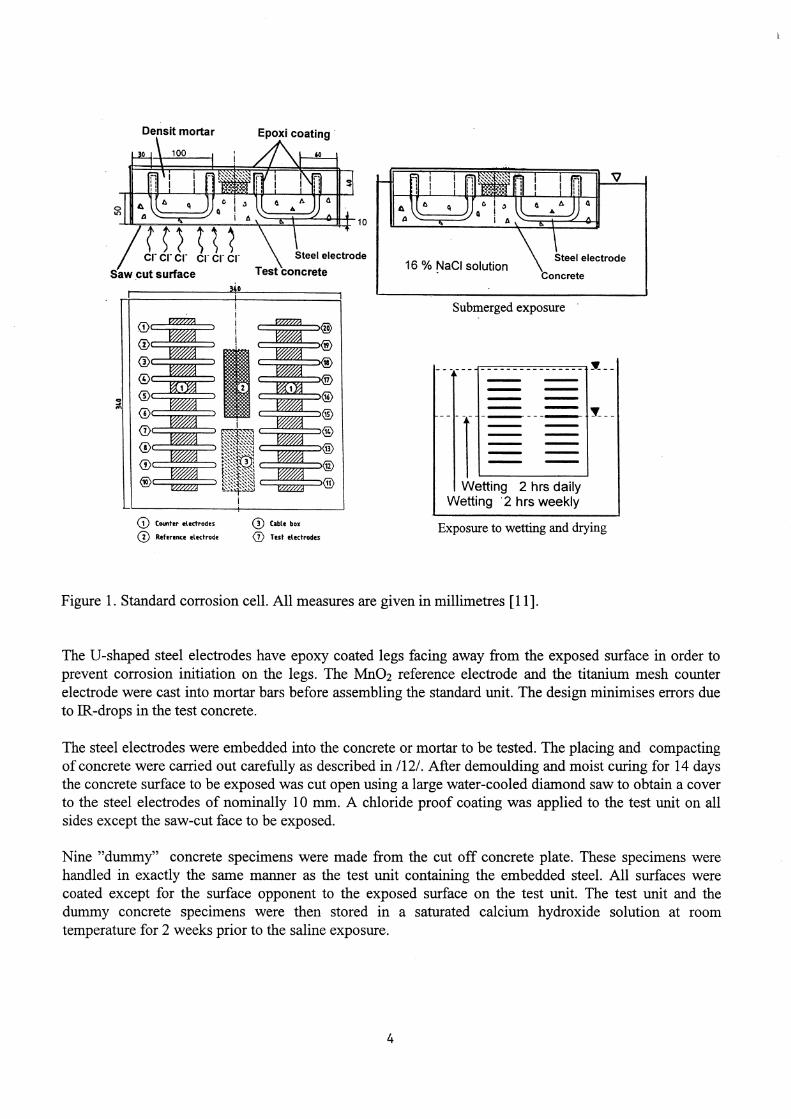
8 months of wetting and drying expo sure (at room temperature ) resulted in a substantial increase in the corrosion activity as compared to the 2 years submerged laboratory expo sure tests (at room temperature or at + 5°C). 6 of 8 electrodes with filter paper defects and / or compaction voids close to- the steel surface started to corrode in the slag cement concrete already after a few months of exposure. On the other hand 2 of 11 electrodes with filter paper defects and / or compaction voids close to the steel surface started to corrode in SRPC concrete with O or 5 % silica fume in the binder. The results for all electrodes in concrete w/c 0.4 exposed for wetting and drying in the laboratory are summarised in Figure 6.
12
~ :s g ~ o" u o -.. ot; .. CD CD.c CD
E j
z
Pitting on the inside of electrode
Pitting on the outside of electrode
Pitting both inside and
outside
o 5F~--------~-------r------~~----~ CD .-
f ~~~------~--------r_------~------~ ~t~~ ______ ~ ________ r_------~------~ c 8,
Figure 6. Evaluation of the location of corrosion pits in concrete w/c 0.4 exposed for wetting and drying for 8 months in a 16 % NaCl solution at room temperature in the laboratory.
5.5 Results from field expo sure tests
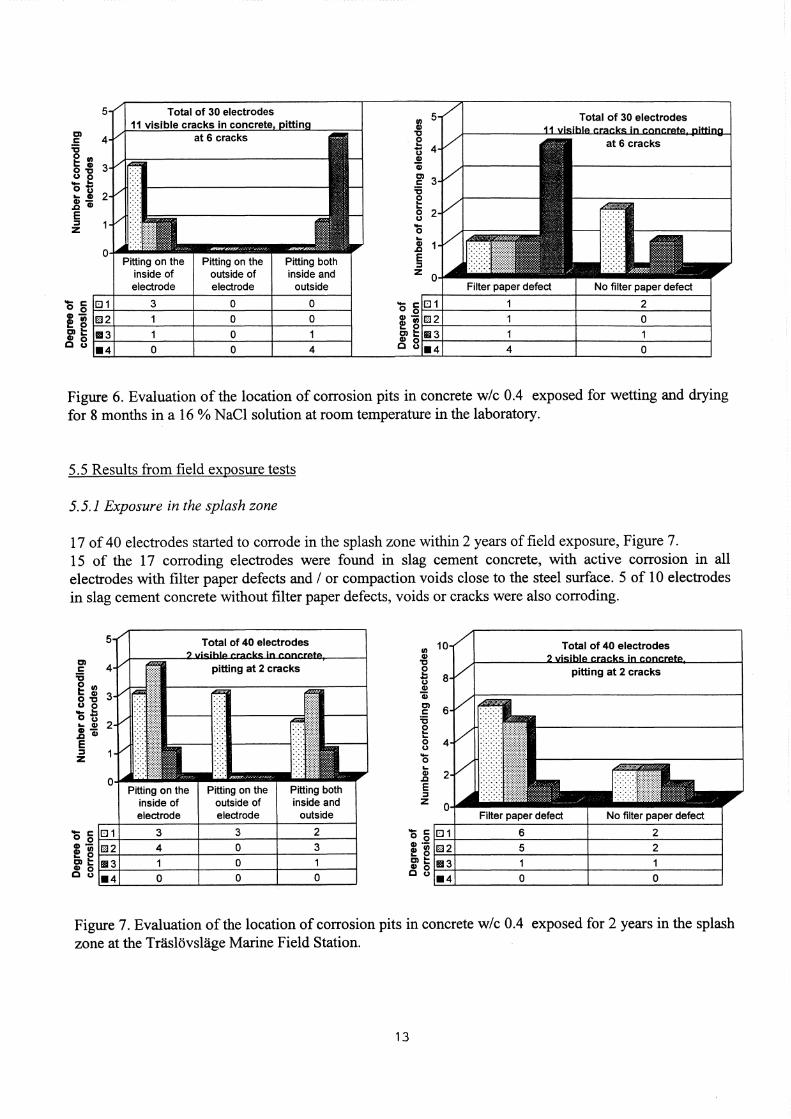
5.5.1 Exposure in the splash zone
17 of 40 electrodes started to corrode in the splash zone within 2 years of field exposure, Figure 7. 15 of the 17 corroding electrodes were found in slag cement concrete, with active corrosion in all electrodes with filter paper defects and / or compaction voids c10se to the steel surface. 5 of 10 electrodes in slag cement concrete without filter paper defects, voids or cracks were also corroding.
o g~4---~~--~----~---+----~--~ m~~4-----~---r----~---+----~--~ ~ t 1--'=4---~~---r----~---+-----'----~ c 8 r-
~ " 2 t; CD äi el c: :s 2 o u
.. CD .c E ::::I Z
Total of 40 electrodes
pitting at 2 cracks
- c: 00F-+--------=---------r_-------=-------__� ~.~~~--------=---------r_-------=-------__I elt ~ 8~1_------~--------r_------~------__I
Figure 7. Evaluation of the location of corrosion pits in concrete w/c 0.4 exposed for 2 years in the splash zone at the Träslövsläge Marine Field Station.
13
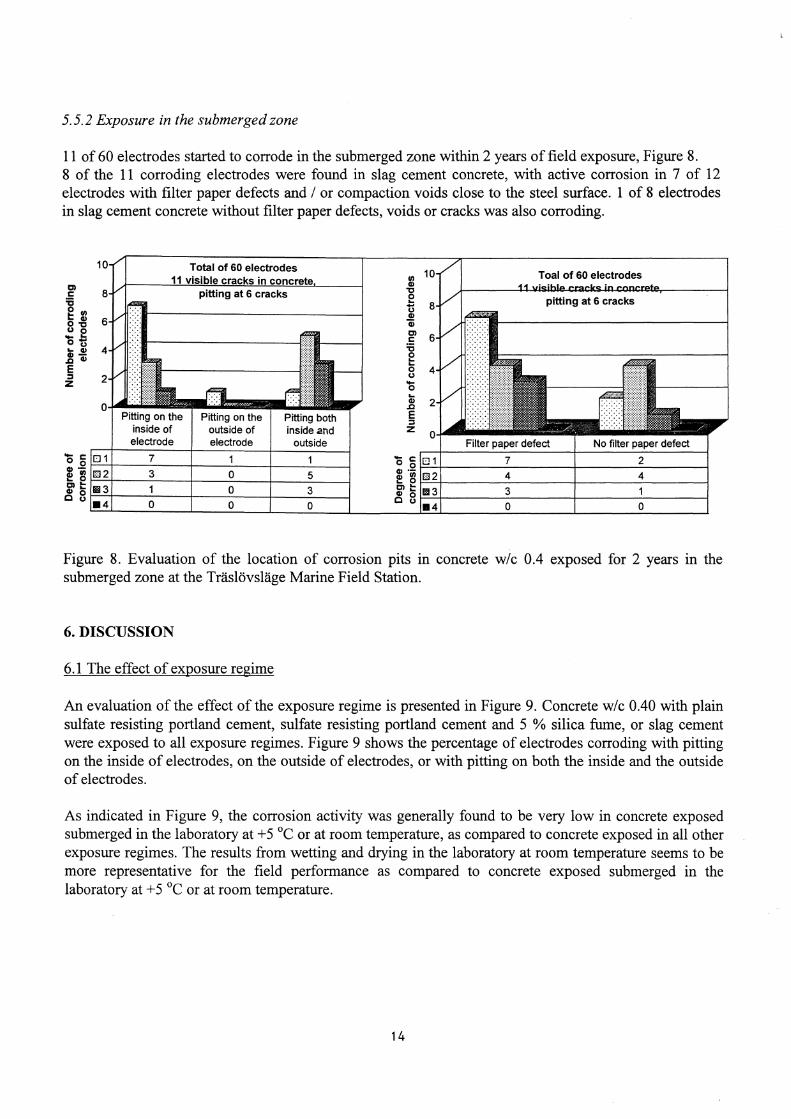
5.5.2 Exposure in the submerged zone
11 of 60 electrodes started to corrode in the submerged zone within 2 years of field exposure, Figure 8. 8 of the 11 corroding electrodes were found in slag cement concrete, with active corrosion in 7 of 12 electrodes with filter paper defects and / or compaction vo ids close to the steel surface. 1 of 8 electrodes in slag cement concrete without filter paper defects, voids or cracks was also corroding.
(Il Toal of 60 electrodes CI Gl
"C c: o '6 ... pitling at 6 cracks -g (Il U
Gl o Gl iii u"g CI -... c: ot; '6 ... Gl
Gl- o .c Gl ... ... E o ::J u Z -o ...
Gl .c E ::J Z
- c: - c: o o o o CD- Gl .-Gl (Il Gl (Il ... o ... o Clt; CI'" CD o Gl ... C U c 8
Figure 8. Evaluation of the location of corrosion pits in concrete w/c 0.4 exposed for 2 years in the submerged zone at the Träslövsläge Marine Field Station.
6. DISCUSSION
6.1 The effect of exposure regime
An evaluation of the effect of the exposure regime is presented in Figure 9. Concrete w/c 0.40 with plain sulfate resisting portland cement, sulfate resisting portland cement and 5 % silica fume, or slag cement were exposed to all expo sure regimes. Figure 9 shows the percentage of electrodes corroding with pitting on the inside of electrodes, on the outside of electrodes, or with pitting on both the inside and the outside of electrodes.
As indicated in Figure 9, the corrosion activity was generally found to be very low in concrete exposed submerged in the laboratory at +5 °c or at room temperature, as compared to concrete exposed in all other exposure regimes. The results from wetting and drying in the laboratory at room temperature seems to be more representative for the field performance as compared to concrete exposed submerged in the laboratory at +5 °c or at room temperature.
14

Figure 9. The effect of exposure regime on the corrosion activity for all concrete with w/c 0.40.
6.2 the effect of artificial filter paper defects and compaction vo ids or cracks
The incorporation of artificiai filter paper defects at the steel - concrete interface had a strong negative effect on the resistance to corrosion. except for electrodes in concrete exposed submerged in the laboratory, as shown in Figure 9.
34 of a total of 21 O exarnined electrodes in all concrete exposed exhibited evidence on visible compaction vo ids or cracks at the steel surface. 16 electrodes orapproximately 50 % of the electrodes with visible compaction voids or cracks at the steel surface also experienced pitting corrosion. However, only approximately 25 % of the e1ectrodes with visible compaction vo ids or cracks at the stee1 surface corroded in concrete exposed submerged in the laboratory.
The effect of microstructural defects in the concrete seems to be far more important in concrete exposed to moisture- and temperature variations, as compared to concrete submerged at a constant temperature in the laboratory. The visible compaction voids or cracks and the artificially produced filter paper defects at the steel surface had relatively little effect on the resistance to corrosion initiation in concrete submerged at a constant temperature in the laboratory. These findings support the idea that it is not the defects, but the effects of the defects on the moisture variations at the depth of the reinforcement, and the temperature variations, which control the chioride threshold. The positive effect of introducing silica fume seems to be related to the improvement of the homogeneity and the reduced permeability of the cover, which in tum reduces the moisture variations at the depth of the reinforcement. This effect can of course also be achieved by increasing the cover thickness or by lowering the w/c ratio.
15
6.3 The effect ofbending of steel
In all exposure tests, corrosion was initiated in the deformed parts at the inside of the U-bend steel electrodes in approximately 70 % of the corroding electrodes. The bending of hot rolled black steel is likely to cause cracking of the scale and roughening of the steel surface in the deformed zone, and especially so in the more narrow inside of the U-bend steel electrodes.
6.4 The effect of cement type and exposure temperature
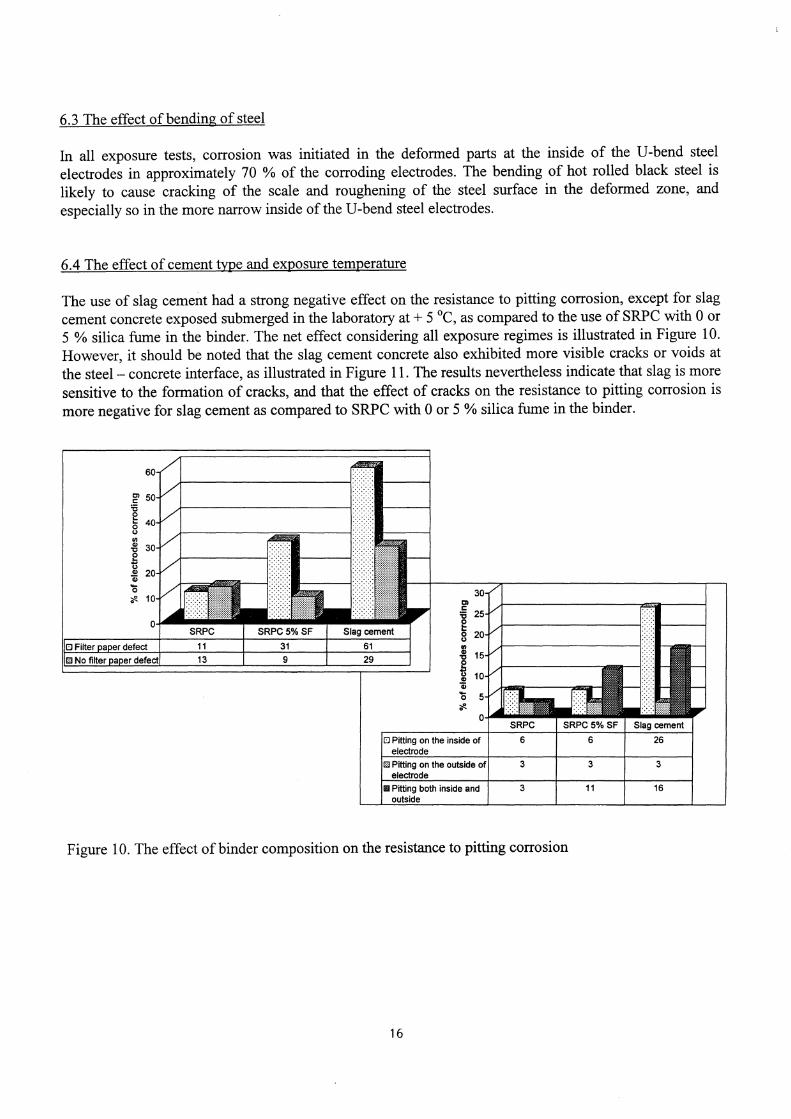
The use of slag cement had a strong negative effect on the resistance to pitting corrosion, except for slag cement concrete exposed submerged in the laboratory at + 5°C, as compared to the use of SRPC with O or 5 % silica fume in the binder. The net effect considering all exposure regimes is illustrated in Figure 10. However, it should be noted that the slag cement concrete also exhibited more visible cracks or voids at the steel - concrete interface, as illustrated in Figure 11. The results nevertheless indicate that slag is more sensitive to the formation of cracks, and that the effect of cracks on the resistance to pitting corrosion is more negative for slag cement as compared to SRPC with O or 5 % silica fume in the binder.
Figure 10. The effect ofbinder composition on the resistance to pitting corrosion
16

Figure 11. The effect of binder composition and compaction voids or cracks at the steel - concrete interface on the resistance to pitting corrosion
References
1. Sandberg, P. "Factors affecting the chloride threshold levels for uncracked reinforced concrete exposed in a marine environment - Part I: Field exposure tests of reinforced concrete". To be published in Adv. Cem Bas Mat.
2. Sandberg, P. "Factors affecting the chioride threshold levels for uncracked reinforced concrete exposed in a marine environment - Part II: Laboratory- and field exposure of corrosion cells". To be published in Adv. Cem Bas Mat.
3. Glass, G.K.; Buenfeld, N.R. "Chioride threshold levels for corrosion induced deterioration of steel in concrete". In Chioride Penetration into Concrete; Nilsson, L-O; Ollivier J.P., Eds.; RlLEM Publications, France, 1997, pp 429-440.
4. Yonezawa, T.; Ashworth, V.; Procter, R. P. M. "Pore solution composition and chloride effects on the corrosion ofsteel in concrete". Corrosion Engineering 1988,44, No. 7,489-499.
5. Page, C. L.; Treadaway, K. W. J. "Aspects of the electrochemistry of steel in concrete". Nature 1982,297, 109-115.
17

6. Mammoliti, L. T.; Brown, L. C.; Hansson, C. M.; Hope, B. B. "The influence of surface finish of reinforcing steel and pH of the test solution on the chloride threshold concentration for corrosion initiation in synthetic pore solutions". Cem. & Concrete Res. 1996,26, No. 4, 545-550.
7. Pettersson, K. "Service Life of Concrete Structures - In saline environment". CBI Report 3:96. Swedish Cement and Concrete Research Institute, Stockholm 1996.
8. Sandberg, P. "Critical evaluation of factors affecting chloride initiated reinforcement corrosion in concrete". Report TVBM-3068, Lund Institute of Technology, Building Materials, 1995.
9. Tuutti, K. "Chioride induced corrosion in marine concrete structures". In Durability of Concrete in Saline Environment; Sandberg, P., Ed.; Cementa and Aalborg Portland, Uppsala, Sweden, 1996, pp 81-93.
10. Tuutti, K. "Corrosion of steel in concrete". CBI Fo 4:1982. Swedish Cement and Concrete Research Institute, Stockholm 1982.
Il. Arup, H.; S0fensen, H. E. "A proposed technique for determining chioride thresholds". In Chloride Penetration into Concrete; Nilsson, L-O; Ollivier lP., Eds.; RILEM Publications, France, 1997, pp 460-469.
12. ACI Committee 309. "Guide for consolidation of concrete". ACI 309R-87. In ACI Manual of Concrete Practice; Detroit, Mich. 1990.
13. NT BUILD 443. In Concrete, hardened: Accelerated chioride penetration, part 6.4.4 Profile grinding.
14. Tang, L.; Sandberg, P. "Chloride penetration into concrete exposed under different conditions" In Durability of Building Materials and Components 7, II; Sjöström, c., Ed.; E & FN Spon, London, 1996; pp 453-461.
18

PPE DI Calculated chioride thresholds presented as total chioride content by
weight of binder

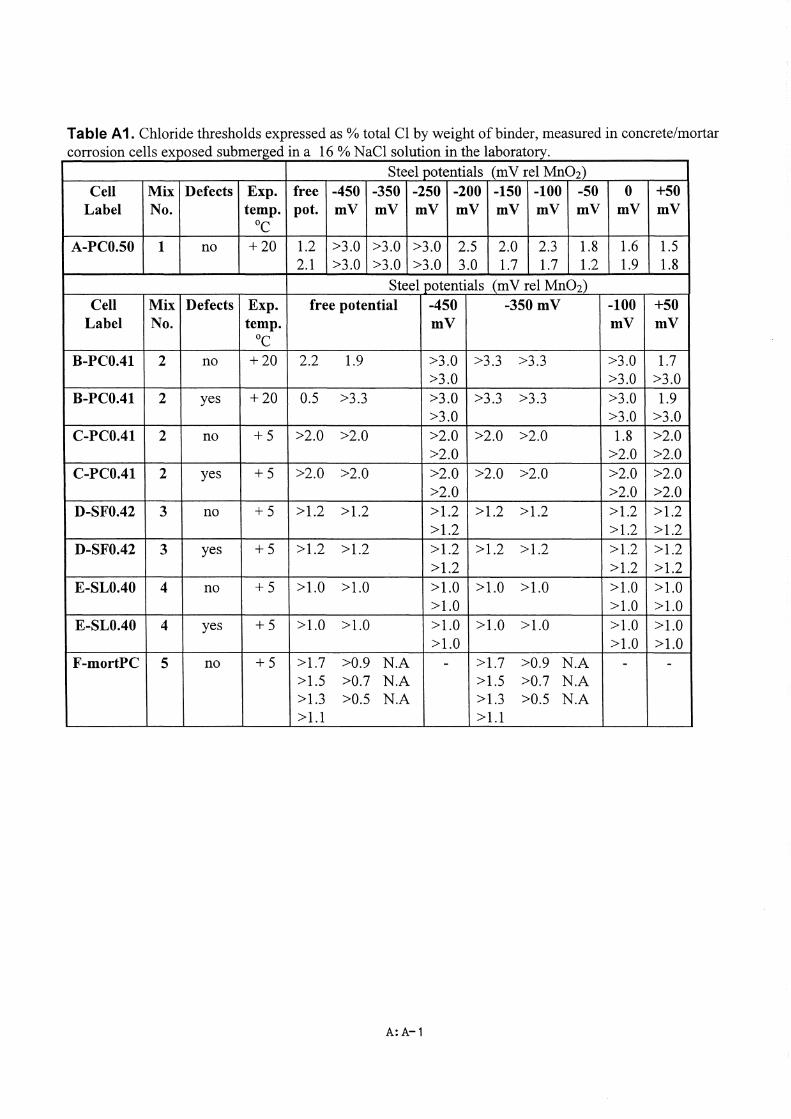
Table A1. Chloride thresholds expressed as % total Cl by weight of binder, measured in concrete/mortar 11 d b d . 16 O;( N Cl l t' . h l b corroslOn ce sexpose su merge ma o a so u lOn In t e a oratory.
Steel potentials (m V rel Mn02) Cell Mix Defects Exp. free -450 -350 -250 -200 -150 -100 -50 O +50
Label No. temp. pot. mV mV mV mV mV mV mV mV mV °c
A-PCO.50 1 no +20 1.2 >3.0 >3.0 >3.0 2.5 2.0 2.3 1.8 1.6 1.5 2.l >3.0 >3.0 >3.0 3.0 1.7 1.7 1.2 1.9 1.8
Steel potentials (m V rel Mn02) Cell Mix Defects Exp. free potential -450 -350 mV -100 +50
Label No. temp. mV mV mV °c
B-PCO.41 2 no +20 2.2 1.9 >3.0 >3.3 >3.3 >3.0 1.7 >3.0 >3.0 >3.0
B-PCO.41 2 yes +20 0.5 >3.3 >3.0 >3.3 >3.3 >3.0 1.9 >3.0 >3.0 >3.0
C-PCO.41 2 no +5 >2.0 >2.0 >2.0 >2.0 >2.0 1.8 >2.0 >2.0 >2.0 >2.0
C-PCO.41 2 yes +5 >2.0 >2.0 >2.0 >2.0 >2.0 >2.0 >2.0 >2.0 >2.0 >2.0
D-SFO.42 3 no +5 >1.2 >1.2 >1.2 >1.2 >1.2 >1.2 >1.2 >1.2 >1.2 >1.2
D-SFO.42 3 yes +5 >1.2 >1.2 >1.2 >1.2 >1.2 >1.2 >1.2 >1.2 >1.2 >1.2
E-SLO.40 4 no +5 >1.0 >1.0 >1.0 >1.0 >1.0 >1.0 >1.0 >1.0 >1.0 >1.0
E-SLO.40 4 yes +5 >1.0 >1.0 >1.0 >1.0 >1.0 >1.0 >1.0 >1.0 >1.0 >1.0
F-mortPC 5 no +5 >1.7 >0.9 N.A - >1.7 >0.9 N.A - ->1.5 >0.7 N.A >1.5 >0.7 N.A >1.3 >0.5 N.A >1.3 >0.5 N.A > 1.1 > 1.1
A:A-1

Table A2. Chloride thresholds expressed as % total Cl by weight of binder, measured in concrete corrosion cells exposed to cycles of2 hours wetting and 22 or 166 hours drying in a 16 % NaCl solution . th l b t t t t In e a ora ory a room empera ure.
Steel potentials (m V rel Mn02) 12 hrs wetting - 6Yz da s drying 12 hrs wetting - 12 hrs drying
Free potential -350 mV Free potential -350 mV Cell Mix Filter paper Filter paper Filter paper Filter paper
Label No. defects defects defects defects Yes No Yes No Yes No Yes No
K-PCO.41 2 >0.6 >0.6 >0.6 >0.6 - - 0.4 >0.6 >0.6 >0.6 - >0.6 >0.6 >0.6 >0.6 >0.6 >0.6 >0.6 >0.6 >0.6 >0.6 >0.6 >0.6
L-SFO.42 3 >0.6 >0.6 >0.6 >0.6 - - 0.5 >0.7 >0.7 >0.7 - >0.7 >0.6 >0.6 >0.6 >0.6 >0.7 >0.7 >0.7 >0.6 >0.6 >0.7 >0.7
M-SLO.40 4 nil nil nil nil - - nil nil nil >0.8 - >0.8 nil >1.0 nil >1.0 nil >0.8 nil nil nil nil nil
">" indicates that no corrosion was seen within the test period. The figure indicates the total chloride content at the depth of the steel electrode. "nil" indicates that corrosion was initiated within a week after the start of chloride expo sure.
A:A-2

Table A3. Chloride thresholds expressed as % total Cl by weight of binder, measured in concrete corrosion cells exposed at the Träslövsläge Marine Field Station
Steel potentials (mV rel Mn02) Submerged Splash zone
Free potential -350 mV Free potential -350 mV Cell Mix Filter paper Filter paper Filter paper Filter paper
Label No. defects defects defects defects Yes No Yes No Yes No Yes No
0- 2 0.7 >2.2 >2.2 >2.2 >2.2 >2.2 - - - - - -subPCO.41 1.6 >2.2 >2.2 >2.2 >2.2 >2.2
>2.2 >2.2 >2.2 >2.2 >2.2 >2.2 >2.2 >2.2
P- 2 - - - - - - 0.7 1.1 0.6 1.0 >1.8 >1.8 splaPCO.41 1.0 0.8 1.1 1.3 >1.8 >1.8
0.5 0.6 1.3 0.8 1.1 0.9 1.1 1.2
R- 3 0.3 >1.9 >1.9 0.8 1.4 >1.9 - - - - - -
subSFO.42 0.8 1.0 >1.9 >1.9 1.2 >1.9 0.7 0.9 1.3 1.0
>1.9 1.3 >1.9 >1.9 S- 3 - - - - - - >0.9 >0.9 >0.9 >0.9 >0.9 >0.9
splaSFO.42 0.9 >0.9 >0.9 >0.9 >0.9 >0.9
0.7 >0.9 >0.9 >0.9 >0.9 >0.9 >0.9 >0.9
T- 4 0.2 >0.7 >0.7 >0.7 0.2 >0.7 - - - - - -
subSLO.40 0.3 0.5 >0.7 >0.7 0.6 >0.7 >0.7 >0.7 0.4 >0.7 0.3 >0.7 0.6 >0.7
u- 4 - - - - - - 0.1 0.2 0.2 0.4 0.5 >0.6
splaSLO.40 0.3 >0.6 0.3 >0.6 0.5 >0.6
0.3 0.5 0.5 >0.6 0.4 0.5 0.5 >0.6
">" indicates that no corrosion was seen within the test period. The figure indicates the total chloride content at the depth of the steel electrode.
A:A-3


pp DI Compilation of results on the e/feets of defeets at the steel-eoncrete interfaee, the exposure regime, and the cement type, on the chioride
threshold


o c:: :c ~ .,
Gl 0"c u o ... .. 00 .. Gl Gl-.c Gl
E " z
... c:: o o Gl .-Gl ., .. o o:: Gl o c U
5
4
3
2
Lab SRPC 0.60 submerged
Pitting on the inside of electrode
Total of 20 electrodes
at 2 cracks
Pitting on the outside of electrode
A:B-1
Pitting both inside and
outside

- c o o CII .-CII II) .... o 01 .... CII .... c 8
Lab SRPC wel-dry
Pitling on the outside of electrode
Lab SRPC 5%SF wel-dry
Pitling both inside and
Total of 10 electrodes 1 visible crack in concrete, but no
at crack
Pitling both inside and
outside
C) S ~~------~----+-----~----~------~--~ CII-f ~ ~=+----~~----+-----~----~------~--~ ~ t I~=+ ____ ~~ ____ +-____ ~ ____ ~ ______ ~ __ ~ C 8 r
01 C '6 e II) .... CII 0"0 U o -.... ot; .... CII CIID.CII E ::I Z
- c o o I "ii o,g CII o c u
Lab slagcem wel-dry
7 visible cracks
Pitling on the inside of electrode
at 5
Pitling on the outside of electrode
Pitling both inside and
outside
Lab SRPC wel-dry
Lab SRPC 5% SF wel-dry
ö S ~~----------~--______ ~ __________ ~ ________ ~ CII-f ~ ~=+----------~--------~----------~--------~ ~ t f~+---------~----------+---------~~--------~ c 8
Lab slagcem wel-dry
Total of 10 electrodes
ö 5 ~ ~ ~~--------------------~--------------------~
g» t: c 8 ~~--------------------~--------------------~
A:B-2
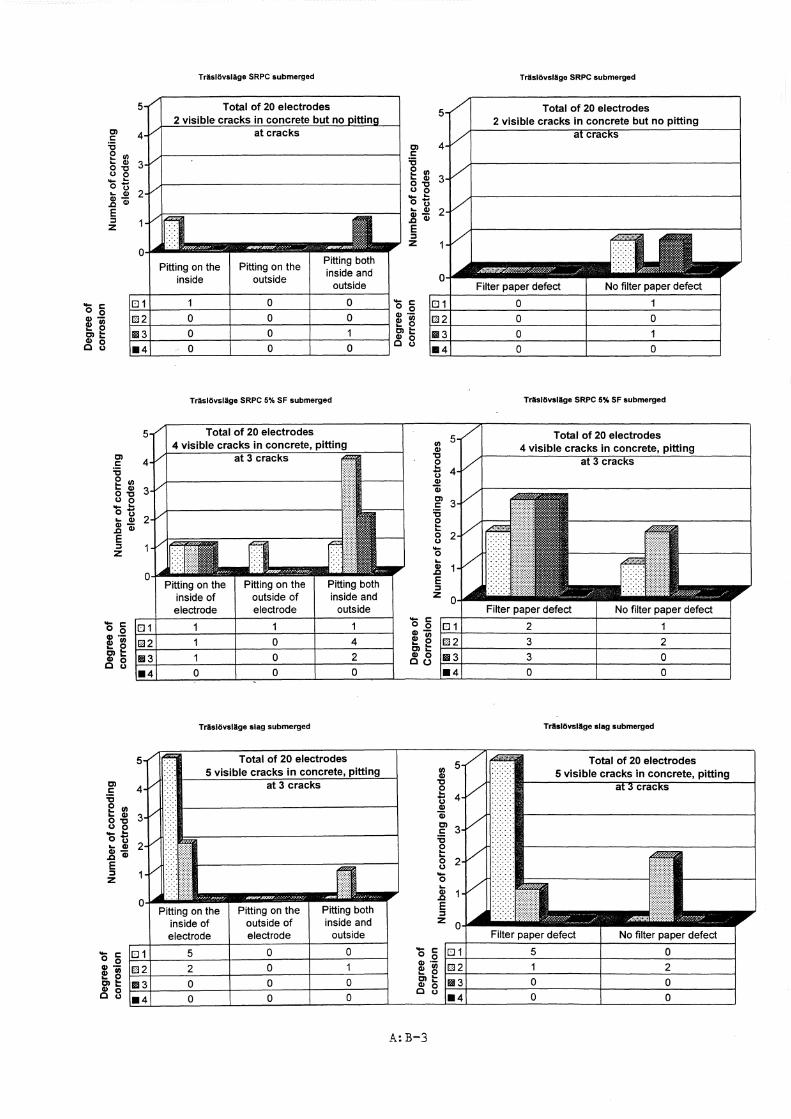
TrlIslövsläge SRPC submerged
Total of 20 electrodes cracks in concrete but no
at cracks
Pitting on the outside
Pitting both inside and
outside
... c o o ~~ ______ ~ ____ -+ ____________ -t ______ ~ ____ ~Ö ~
ale;; ~~------~-----+-------------t------~----~ ~ g G)
G) fl) ~ o Cl~ G) ~
o 8 ~~------~-----+-------------+------~----~~ 8
Cl c '5 ~ fl) ~ G) 0'0 u o ... ~ ot) ~ G) G).c G)
E :::I Z
... c o o G) .-G) fl) ~ ~ Cl~ G) o Ou
Cl c '5 g ~ 0'0 u o ... ~ ot) ~ G) G).c G)
E :::I Z
... c o o G) .-G) fl) ~ o Cl~ G) ~
o 8
5
TrlIslövsläge SRPC 5% SF submerged
Total of 20 electrodes 4 visible cracks in concrete, pitting
Pitting on the inside of electrode
Pitting on the outside of electrode
TrlIslövsläge slag submerged
5 visible cracks at
Pitting on the outside of electrode
Pitting both inside and
outside
Pitting both inside and
outside
ö g G)-
~ ~ Cll:: G) o 00
... c o o G) .-G) fl) ~ o Cl~ G) ~
o 8
A: B-3
TrlIslövsläge SRPC submerged
Total of 20 electrodes 2 visible cracks in concrete but no pitting
TrlIslövsläge SRPC 6% SF submerged
Total of 20 electrodes 4 visible cracks in concrete, pitting
TrlIslövsläge slag submerged
Total of 20 electrodes 5 visible cracks in eonerete, pitting

The concrete corrosion cell "Träslövsläge SRPC splash zone -P-spla PC0.41" (marked L 596-19) was lost into the sea in the winter of 1996-97.
O) C '6 e III '- Q) 0'0 U o -'-ot) '- Q) Q)-.Q Q)
E ::l Z
- c o o G1-Q) III '- o 0)'Q) '-08
O) C '6 g m 0'0 u o - '-Ot) '- Q) Q).Q Q)
E ::l Z
4
3
2
Träslövsläga SRPC 5%SF splash zona
Total of 20 electrodes No visible cracks in concrete
Pitting on the outside of electrode
Träslövsläge slag splash zone
2 visible cracks i
Pitting on the . inside of
electrode
at
Pitting on the outside of electrode
Pitting both inside and
outside
Pitting both inside and
outside
Ö g~~----~-----4----~~----t-----~--~ E ~~~----~-----4----~~----t-----~--~ ~ t~~----~-----4~--~~----t-----~--~
Träslövsläge SRPC 5% SF splash
Total of 20 electrodes No visible cracks in concrete
'ö S alUi '- e ~ o ~~--------~~--------+---------~--------~ o u
Träslövsläge slag splash zone
Total of 20 electrodes 2 visible cracks in
at 2
'ö 5 ~~ __________ ~ ________ +-________ ~ ________ ~
E ~ ~~--------~~--------+---------~--------~ ~ t I~~ __________ ~ ________ +-________ ~ ________ __ o 8 t-o 8
~L-~~~L-~~~ __ ~ __ ~ ____ ~l-____ ~ ____ ~ ____ ~~ __ ___
A:B-4