THE EFFECT OF CORPORATE GOVERNANCE ON WORKING CAPITAL...
69
THE EFFECT OF CORPORATE GOVERNANCE ON WORKING CAPITAL OF MANUFACTURING FIRMS LISTED AT THE NAIROBI SECURITIES EXCHANGE HENRY KURUGA KARANI A RESEARCH PROJECT SUBMITTED IN PARTIAL FULFILLMENT OF THE REQUIREMENTS FOR THE AWARD OF MASTERS DEGREE IN BUSINESS ADMINISTRATION (MBA), UNIVERSITY OF NAIROBI OCTOBER, 2013
Transcript of THE EFFECT OF CORPORATE GOVERNANCE ON WORKING CAPITAL...

THE EFFECT OF CORPORATE GOVERNANCE ON WORKING
CAPITAL OF MANUFACTURING FIRMS LISTED AT THE NAIROBI
SECURITIES EXCHANGE
HENRY KURUGA KARANI
A RESEARCH PROJECT SUBMITTED IN PARTIAL FULFILLMENT OF
THE REQUIREMENTS FOR THE AWARD OF MASTERS DEGREE IN
BUSINESS ADMINISTRATION (MBA), UNIVERSITY OF NAIROBI
OCTOBER, 2013
ii
DECLARATION
I declare that this is my original work and has not been presented for a degree in any other university.
Signature …………………………………….. Date ……………………………
H. Karani D61/63370/2011
SUPERVISOR
This project has been submitted for examination with my approval as the University Supervisor:
Signature …………………………………….. Date …………………………….
Mr C. Iraya
Lecturer, Department of Finance and Accounting, University of Nairobi

iii
ACKNOWLEDGEMENTS
My special and sincere thanks go to my Wife Carolyne and my son Lemuel who gave me the
moral support and had to sacrifice a lot to enable me complete this research project. I cannot
forget to thank my supervisor Mr. Cyrus Iraya and moderator Mrs. Nyamute, for their guidance,
support, suggestions, useful comments and constructive critique which were all instrumental to
the successful completion of this research project.
I also wish to appreciate the support and encouragement from my friends during the tough time
that I had to balance between the demands of a rigorous academic program and an equally
demanding work environment. My gratitude to God Almighty who renewed my strength at every
Single stage of this study.
God bless you all.

iv
DEDICATION
This research project is dedicated to my family for their inspiration, encouragement,
understanding and prayers towards the successful completion of this course. I also would wish to
thank the Almighty God who has given me the wisdom and knowledge to undertake this course.
v
ABSTRACT
Effective corporate governance practices in an organization ensure that its resources are managed
in a manner that will lead to a better performance. The management of working capital is such a
resource that effective corporate governance has an effect since when a business does not
manage its liquidity well; it will have cash shortages and as a result experience problems paying
its obligations when they fall due. Towards this end, the research sought to examine the effect of
corporate governance on the working capital management efficiency of manufacturing firms
listed at the Nairobi securities exchange.
This study adopted a co-relational research design. The firms that were analyzed after the
screening process finally became 15 of which their financial statements for the period 2008-2012
were studied. A regression model was determined to establish the relationship between various
working capital parameters and the corporate governance practices. The control variables that
were used included the firm size and sales growth.
The results of the study show that adoption of corporate governance practices plays an important
role in improving the efficiency of working capital management. By the study adopting a co-
relational design and not necessarily a causal relationship between the two, this finding may only
be generalized to firms similar to those that were included in this research. This study contributes
to the literature on the factors that improve the efficiency of working capital management, and in
particular on the association between several features of corporate governance and the efficiency
of working capital management. The findings may be useful for financial managers, investors,
financial management consultants, and other stakeholders.
vi
TABLE OF CONTENT
DECLARATION ............................................................................................................................ ii
ABSTRACT .................................................................................................................................... v
LIST OF TABLES……………………………………………………………………………………………………………………………….ix
LIST OF ABBREVIATIONS ......................................................................................................... x
CHAPTER ONE:INTRODUCTION .......................................................................................... 1
1.1 Background of the Study .......................................................................................................... 1
1.1.1 Corporate Governance .................................................................................................... 2
1.1.2 Working capital Management ........................................................................................ 3
1.1.3 Relationship between Corporate Governance and Working Capital Management ........ 4
1.1.4 Manufacturing Industry in Kenya................................................................................... 5
1.2 Research Problem ..................................................................................................................... 7
1.3 Research Objective ................................................................................................................... 9
1.4 Value of the Study……………………………………………………………………………….………………………………………..10
CHAPTER TWO: LITERATURE REVIEW .......................................................................... 12
2.1 Introduction ............................................................................................................................. 12
2.2 Theoretical Framework ........................................................................................................... 12
2.2.1 Matching Approach ...................................................................................................... 12
2.2.2 Aggressive Approach ................................................................................................... 13
2.2.3 Conservative Approach ................................................................................................ 15

vii
2.3 Empirical Review.................................................................................................................... 17
2.4 Summary of Literature Review ............................................................................................... 20
CHAPTER THREE: RESEARCH METHODOLOGY ......................................................... 23
3.1 Introduction ............................................................................................................................. 23
3.2 Research Design...................................................................................................................... 23
3.3 Population of the Study ........................................................................................................... 23
3.4 Data Collection ....................................................................................................................... 24
3.5 Data Analysis .......................................................................................................................... 24
CHAPTER FOUR:DATA ANALYSIS, RESULTS AND DISCUSSION ............................. 27
4.1 Introduction ............................................................................................................................. 27
4.2 Descriptive Statistics ............................................................................................................... 27
4.3 Inferential Analysis ................................................................................................................. 30
4.4.1 Corporate governance and accounts receivable management efficiency ..................... 30
4.4.2 Corporate Governance and Inventory Management ..................................................... 32
4.4.3 Corporate governance and accounts payable management .......................................... 35
CHAPTER FIVE: SUMMARY, CONCLUSIONS AND RECOMMENDATIONS….……38
5.1 Introduction…......……………………………………….......……………………………….38
5.2 Summary………………………...……………………..…………………………………….38
5.3 Conclusions and Recommendations…………………………......…………………………..39

viii
5.4 Limitation of the study……………….………………………………………………………40
5.5 Suggestions for further research…………………………………………………….……….41
REFERENCES..............................................................................................................................42
APPENDICES..........................................................................................................................................49
APPENDIX 1: MANUFACTURING FIRMS LISTED AT THE NSE ...................................... 49
APPENDIX II: CORRELATION…..………………………………………..…………………51
APPENDIX III: SOURCE DATA………..……………….……………………………………….…………………..54

ix
LIST OF TABLES
Table 4.1: Descriptive statistics of independent, dependent, and control variables ..................... 27
Table 4.2: Corporate governance and accounts receivable management ..................................... 31
Table 4.3: Model Summary for Account receivable with corporate governance ......................... 32
Table 4.4: Corporate Governance and Inventory Management .................................................... 34
Table 4.5: Model Summary for INV with Control Variables ....................................................... 34
Table 4.6: Corporate Governance and accounts payable Management ........................................ 36
Table 4.7: Model Summary for accounts payable with Control Variables................................... 36

x
LIST OF ABBREVIATIONS
AGOA: African Growth and Opportunity Act
CEO: Chief Executive Officer
COMESA: Common Market for Eastern and Southern Africa
EAC: East African Community
GDP: Gross Domestic Product
KAM: Kenya Association of Manufacturers.
NSE: Nairobi Securities Exchange
R & D: Research and Development

1
CHAPTER ONE
INTRODUCTION
1.1 Background of the Study
Within the context of globalization, almost all organizations around the world are currently
undergoing significant changes. One of the major dimensions of these changes within these
organizations is corporate governance. Corporate governance has indeed become the focus of
increased attention of not only directors, investors and stakeholders, but also regulators, who are
all watching more, and more carefully whether organizations are ―governed‖ efficiently,
effectively and ethically (Ganesan, 2007). In particular, corporate governance scholars have
come to the conclusion that companies across the world need to adopt commonly accepted
corporate governance standards to be able to attract foreign capital, to become internationally
more competitive and to deal with corporate governance problems in today‘s economy.
The observance of corporate governance tenets by a firm is believed to bring about different
types of benefits to a firm. Solomon et al. (2003) emphasize the importance of good corporate
governance and claim that corporate governance involves a set of relationships between a
company‘s management, its board, its shareholders and other stakeholders, with increasingly
accepted ―good‖ corporate governance practices. They point that by adopting good corporate
governance principles, co-operation will continue to play a crucial role in our economies with
high economic efficiency, our personal savings will be well managed with investor confidence
and our pensions will be secured with monitored performance. In much more economic terms,
Pistor (2006) and Meharey (2006) define good corporate governance as an economic function of

2
the firm, which knows how to maximize its residuals. What they mean by the firm‘s residuals is
wealth generation by the firm through real operations and distribution of wealth to shareholders
on a pro rata basis in the case of investor-owned firms. In contrast, bad corporate governance is
just the failure of a firm to meet one or both of these conditions. According to Fox and Heller,
(2006), managers should operate their firms in order to meet these good corporate governance
conditions (wealth generation by real operations and distribution of the wealth to shareholders)
that entirely depend on the structure of constraints and incentives in which they operate, and a
structure that depends on the prevailing legal system.
1.1.1 Corporate Governance
A number of definitions have been given to corporate governance. Mayer (1997) assert that
corporate governance is concerned with ways of bringing the interests of (investors and
managers) into line and ensuring that firms are run for the benefit of investors. It therefore
follows that corporate governance is concerned with the relationship between the internal
governance mechanisms of corporations and society‘s conception of the scope of corporate
accountability (Deakin and Hughes, 2007). It has also been defined by, Keasey et al. (2005) to
include ‗‗the structures, processes, cultures and systems that engender the successful operation of
the organizations‘‘. Corporate governance is also seen as the whole set of measures taken within
the social entity that is an enterprise to favour the economic agents to take part in the productive
process, in order to generate some organizational surplus, and to set up a fair distribution
between the partners, taking into consideration what they have brought to the organization
(Maati, 1999).

3
In the literature, Solomon et al. (2003) emphasize the importance of good corporate governance
and claim that corporate governance involves a set of relationships between a company‘s
management, its board, its shareholders and other stakeholders, with increasingly accepted
―good‖ corporate governance practices. By adopting good corporate governance principles, co-
operation will continue to play a crucial role in our economies with high economic efficiency,
our personal savings will be well managed with investor confidence and our pensions will be
secured with monitored performance.
1.1.2 Working capital Management
Working capital management involves planning and controlling current assets and current
liabilities in a manner that eliminates the risk of the inability of firm to pay its short term
obligations when they fall due and to avoid the excessive investment in these assets on the other
hand (Eljelly, 2004). This is because too much working capital reduces risk and return, while too
little working capital increases risk and return. Managers spend considerable time on day to day
problems that involve working capital decisions (Rehaman & Nasr, 2007). This is because
current assets are short term investment that is continually being converted to other forms of
assets. With regard to current liabilities, a firm is responsible to paying these debts on timely
basis. Taken together, decisions on current assets and liabilities become frequent, repetitive and
time consuming (Appuhami, 2008). Working capital management involves the decision on the
amount of current assets and the financing of these assets. Current assets involve those classes of
assets that can be converted to cash easily and normally within a period of one year and such
temporary investment that can be converted to cash upon need (Rehaman & Nasr, 2007).

4
Management of working capital is essential for most firms. The management of working capital,
in the context of this study, refers to the management of current assets and of current liabilities.
Working capital components include receivables, inventory, payables, and using cash efficiently
for day-to-day operations. The optimization of working capital balances helps minimize working
capital requirements, which in turn, increase firms‘ free cash flow (Ganesan, 2007). Inefficient
working capital management policy, induced by poor corporate governance, has a negative
impact on shareholders‘ wealth. Effective corporate governance serves as a check on the
management of the firm‘s resources, including working capital.
1.1.3 Relationship between Corporate Governance and Working Capital Management
Corporate governance plays an important role in controlling the management of working capital
by formulating sound policies. The role of CEO duality, board size, and audit committee in
working capital management cannot be ignored since the CEO duality and board size help in
maintaining an appropriate level of working capital in the organization (Gill and Shah, 2012).
CEO tenure also helps in improving working capital management. The dual-responsibility, CEOs
serve the interests of the management team and one way to protect the team‘s position is to hold
excessive corporate liquidity. In addition, the CEO together with the board of directors
formulates policies, including policy related to working capital management.Audit committee
represents another internal governance mechanism whose impact is to improve the quality of
financial management of a company and therefore encouraging the firm not to take unnecessary
risk in maintenance of their working capital level (Kyereboah-Coleman, 2007). Working capital
management falls under the area of financial management. Kyereboah-Coleman (2007) suggests
that audit committees should have a minimum size of three members to enhance independence.
An independent audit committee enhances the efficiency of working capital by auditing cash
5
accounts, accounts receivable, accounts payable, and inventory accounts, which in turn,
minimizes agency problems and agency costs. According to Yermack (1996) and Lipton and
Lorsch (1992), a small board of directors is more effective in the decision-making process than a
larger board of directors and the small board sizes should be encouraged to promote effective
communication and decision-making.
Inadequate policies regarding accounts receivable, accounts payable, and inventory management
have a negative impact on the cash conversion cycle. The policy to maintain high cash balances
may reflect management‘s own risk aversion and that may cause an agency problem because the
board of directors and the CEO may maintain balances that do not maximize shareholders‘
wealth (Gill and Shah, 2012). By managing working capital effectively, shareholders can get
maximum return on their invested capital. Weak corporate governance might have adverse
consequences for cash management, accounts receivable, inventory, accounts payable, and cash
conversion. In light of these considerations, the purpose of this study is to empirically document
the Effect of corporate governance on working capital management.
1.1.4 Manufacturing Industry in Kenya
Kenya manufacturing sector is the fourth biggest sector after agriculture, transport and
communication, and wholesale and retail trade. The sector, which is dominated by subsidiaries of
multi-national corporations, contributed approximately 18% of the Gross Domestic Product
(GDP) in 2012. Improved power supply, increased supply of agricultural products for agro
processing, favorable tax reforms and tax incentives, more vigorous export promotion and liberal
trade incentives to take advantage of the expanded market outlets through AGOA, COMESA and

6
East African Community (EAC) arrangements, have all resulted in a modest expansion in the
sector of 1.5 per cent in 2008 as compared to 1.2 per cent in 2007.
Although initially developed under the import substitution policy, Kenya‘s manufacturing sector
is now export based in line with the country‘s policy of emerging as a mid-sized economy in the
year 2030. The sector is loosely classified into 12 sub-categories based on the raw materials the
companies import and or the products they manufacture. The individual firm members are
organized under the membership of Kenya Association of Manufacturers (KAM) to give them a
platform for negotiating common position with the relevant government authorities.
Challenges facing the sector include shrinking demands for locally manufactured goods due to
rising poverty levels and reduced exports resulting from general economic slump after the recent
global recession. In addition, the high cost of inputs resulting from poor infrastructure has led to
high prices for final products leading to under-utilization of capacity. The erratic and high cost of
energy has also had a negative impact. Other challenges include security issues, arbitrary
charges levied by regulatory and local authorities and high cost of securing financial facilities
from the banks. However opportunity for growth exists with the rollout of common tariff under
the newly integrated EAC custom union, because Kenya‘s manufacturing sector is the largest in
the region. As at the end of 2012, there were Seventeen (17) manufacturing firms listed in the
Nairobi Securities Exchange with the price movement of 5 of them being used to determine the
daily average NSE index.

7
1.2 Research Problem
Corporate governance is seen as the process and structure used to direct and manage the business
affairs of the company towards enhancing business prosperity and corporate accountability with
the ultimate objective of realizing long-term shareholder value, whilst taking into account the
interest of other stakeholders. Claessens et al. (2002) maintain that better corporate frameworks
benefit firms through greater access to financing, lower cost of capital, better performance and
more favourable treatment of all stakeholders. Effective corporate governance practices in an
organization ensure also that its resources are managed in a manner that will lead to a better
performance. The management of working capital is such a resource that effective corporate
governance has an effect. When a business does not manage its liquidity well, it will have cash
shortages and as a result experience problems paying its obligations when they fall due. Indeed,
working capital starvation has generally been credited as a major cause, if not the main cause of
small business failure in many developed and developing countries (Rafuse, 2006). The
importance of an effective management of working capital is further necessitated by the present
unpredictable business environment.
Inefficient working capital management policy, induced by poor corporate governance, has a
negative impact on shareholders‘ wealth. Effective corporate governance serves as a check on
the management of the firm‘s resources. Although accounts receivable, inventory, and accounts
payable are important parts of working capital management, cash is one of the most vulnerable to
wanton behavior by management (Isshaq et al. 2009).For Borsch-Supan and Koke (2002),
understanding corporate governance is important not only because eliminating these agency
costs potentially increases productivity at firm level, but because macro level policy decisions
8
also boost economic growth, since policy makers are now more aware of the good corporate
governance.
The Kenyan manufacturing sector is considered as one of the key segments of the economy.
According to the Kenya Association of Manufacturers (KAM), the manufacturing sector
employs more than 1.5 million employees. In addition, the Kenyan vision 2030 blue print
identifies as one of the key pillars of the attainment of the objectives of the strategy the need for
the manufacturing sector to grow at the rate of 10% over a period of 20 years. This can only be
achieved if there is growth in the profits of the sector and this will be dependent upon the
management identifying all the variables that can influence profits of a firm including the
observance of good corporate governance. The board of directors and the CEO are responsible
for formulating policies regarding cash management, accounts receivable, inventory purchases
and maintenance, accounts payable, and all other policies in the organization. By managing
working capital effectively, shareholders can get maximum return on their invested capital.
Weak corporate governance therefore, might have adverse consequencesfor cash management,
accounts receivable, inventory, accounts payable, and cash conversion. There is need therefore to
establish the effect that corporate governance will have in the management of working capital.
There is enormous amount of research studies on corporate governance code and rules existing in
various countries. Research findings documented greater investor protection through strict
corporate governance provisions (La Porta et al. 2008). Gompers et al. (2003) developed a
corporate governance index for the US firms and found that the index is highly correlated with
better operating performance and higher market valuation. Drobetz and Gru¨ninger (2007) tested
9
the relationships between board size, CEO duality, and cashholdings by collecting data from
Switzerland. Gill and Mathur (2011) and Gill and Shah (2012) investigated the impact of CEO
duality and board size on cash holdings and corporate liquidity by collecting data from Canadian
firms.
In Kenya, Nganga (2009) studied the relationship between working capital and profitability of
listed companies at the NSE. The study found out that managers can create value if they adopt a
conservative approach towards working capital investment and working capital financing
policies. It was also found out that investors have a positive opinion on those firms that adopt an
aggressive approach to managing their short-term liabilities. Muthuva (2010) pointed that
effective management of working capital in a firm should aim at ensuring that the firm has the
ability to continue operating with sufficient cash flow for payment of both maturing short-term
debt and impending operational expenses. This process will require further that cash collection
from customers is made in time so that the firm has no difficulty in paying its current liabilities.
Therefore in the issue of corporate governance and its relationship with firms performance has
been investigated in depth as well as working capital. However, the effect of corporate
governance in the management of working capital in Kenya has not been investigated. This gap
therefore lead to the following research question: what is the effect of corporate governance on
the working capital of manufacturing firms listed at the Nairobi Securities Exchange?
1.3 Research Objective
To establish the effect of corporate governance on working capital of manufacturing firms listed
at the Nairobi Securities Exchange.

10
1.4 Value of the Study
The understanding of the effect that corporate governance has on working capital management is
of help to policy makers – governments and other stakeholders – to design targeted policies and
programs that will actively stimulate the growth and sustainability of the manufacturing firms in
the country, as well as helping those policy makers to support, encourage, and promote the
establishment of these firms. Regulatory bodies such as KAM, Capital Markets Authority and
the Kenya Revenue Authority can use the study findings to improve on the framework for
regulation.
The study findings are of benefit to management and staff of manufacturing firms who can gain
insight into how their institutions can effectively manage their working capital. This study offers
an understanding on the importance of maintaining an optimal working capital and postulating
the relationship that exist between the existing level of working capital and the profit level.
Several policies on the management of working capital that various manufacturing firms can
adopt are also addressed. This is because manufacturing firms need to adapt to the changing
needs of the current business set up and requirement of various suppliers and providers of
services. As a result, manufacturing firms in the country and other affiliated firms can derive
great benefit from the study.
This study creates a monograph which could be replicated in other sectors of the economy. Most
importantly, this research contributes to the literature on the relationship between working
capital management and profitability. It is hoped that the findings are valuable to the
academicians, who may find useful research gaps that may stimulate interest in further research
in future. Recommendations have been made on possible areas of future studies. This study is

11
further justified since it is of value to those interested in setting up manufacturing firms in the
country since they are be able to understand what to do right to succeed and what if done wrong
would bring the business down.

12
CHAPTER TWO: LITERATURE REVIEW
2.1 Introduction
This chapter reviews literature relating to corporate governance and a firms working capital
management. The literature review has been organized in the following sections. First section
covers the theories underlying the study, corporate governance and firm‘s working capital. The
second section covers the empirical studies on the subject area covered and summary of the
section.
2.2 Theoretical Framework
Firms usually come to the conclusion that there is a need for an appropriate mixture of debt finance with
regard to the length of time to maturity; some short term borrowing is desirable alongside some long-term
borrowing (Brigham and Ehrhardt, 2004). This is because there is always a minimum level of current
assets which is continuously required by a firm to carry on its business operations. This forms the
permanent or fixed working capital. The extra working capital needed to support the changing production
and sales activities is the variable or temporary working capital. Both are necessary to facilitate
production and sales through the operating cycle. The major factors to be considered in achieving the
right balance between the permanent and variable working capital include cost (interest rate, arrangement
fee etc.) and risk of not being able to renew borrowings, of the yield curve shifting or not being able to
meet sudden outflow if the maturity is bunched (Weinraub and Visscher, 1998).
2.2.1 Matching Approach
According to Gitman (2005), some firms follow the matching principle, in which the maturity
structure of finance matches the maturity period of the project or asset. Here, the fixed assets and
current assets which are needed on permanent basis are financed through long term sources,
while current assets whose financing needs vary throughout the year are financed by short term

13
borrowings. A firm that is taking the maturity approach is considered to be adopting a moderate
stance. Under such an approach, a rising level of total assets is financed principally through
increases in long-term finance applied to fixed assets and permanent current assets. The
fluctuating current assets such as those related to seasonal variations are financed with short-term
funds (Gitman, 2005).
The theory implies that excessive cash in corporate accounts is not necessarily in favor of the
firm.Unnecessary cash may be built up because of poor corporate governance. Tradeoff theory,
pecking order theory, and free cash flow theory usually explain the pattern of cash holdings.
Firms, according to tradeoff theory and by extension the matching approach, set their optimal
level of cashholdings by weighting the marginal costs and marginal benefits of holding cash
(Afza and Adnan, 2007). The benefits of cash holding are reduction in the likelihood of financial
distress; allowing the pursuance of investment policy when financial constraints are met; and
minimization of the costs of raising external funds or liquidating existing assets (Ferreira and
Vilela, 2004). According to Afza and Adnan (2007), maintaining an appropriate level of liquidity
within the organization is fundamental for smooth operations of a firm. The level of cash a firm
maintains is characterized by its policies regarding working capital requirements, cash flow
management, dividend payments, investment, and asset management.
2.2.2 Aggressive Approach
This approach is considered more risky because of the frequent need to refinance to support
permanent current assets as well as fluctuating current assets. Moyer et al. (2005) observe that if
a firm relied on overdraft for this, it will be vulnerable to a rapid withdrawal of that facility and if
stocks and cash are reduced to pay back the overdraft the firm may experience severe
14
disruptions, loss of sales and output, and additional costs because of a failure to maintain the
minimum required working capital to sustain optimum profitability. Thus, Bringham and
Ehrhardt (2004) posit that this working capital policy will be associated with higher return and
risk.
Audit committee represents another internal governance mechanism whose impactis to improve
the quality of financial management of a company and therefore encouraging the firm not to take
unnecessary risk in maintenance of their working capital level (Kyereboah-Coleman, 2007).
Working capital management falls under the area of financial management. Kyereboah-Coleman
(2007) suggests that audit committees should have a minimum size of three members to enhance
independence. An independent audit committee enhances the efficiency of working capital by
auditing cash accounts, accounts receivable, accounts payable, and inventory accounts, which in
turn, minimizes agency problems and agency costs.
According to Smith (1980), a firm may adopt an aggressive working capital management policy
with a low level of current assets as a percentage of total assets, or it may also be used for the
financing decisions of the firm in the form of high level of current liabilities as a percentage of
total liabilities. Working capital management is important because of its effects on the firms‘
profitability and risk, and consequently its value (Smith, 1980). The greater the investment in
current assets, the lower the risk, but also the lower the profitability obtained. However, contrary
to this, Carpenter and Johnson (1983) provided empirical evidence that there is no linear
relationship between the level of current assets and revenue systematic risk of the US firms;
however, some indications of a possible nonlinear relationship were found, which were not
highly statistically significant.
15
According to Jensen (1993), a lack of independent leadership creates difficulty forboards to
respond to failure in top management. He argues thatconcentration of decision management and
decision control in one individual hindersboards‘ effectiveness in monitoring top management.
However, when a CEO doubles as board chair, it affords the CEO the opportunity to carry out
decisions and projectswithout undue influence of bureaucratic structures (Kyereboah-Coleman,
2007).
2.2.3 Conservative Approach
Under the conservative approach, the firm finances its permanent assets and also a part of
temporary current assets with long term financing. When there are times in the course of the year
when surplus cash is available, this will be invested in short-term instruments. Most of the
managers feel much happier under the conservative approach because of the lower risk of being
unable to pay bills as they arise. The low-risk is to make sure that long term financing covers the
total investment of the assets. However, such a policy may not be to the best interest of the
owners of the firm. The short term funds invested in the short term securities is unlikely to earn
satisfactory return relative to the cost of the long term funds. In all likelihood, shareholders
would be better off if the firm reduced its long term financing, by returning cash to shareholders
or paying off some long term loans.
The holding and increasing of net working capital tie up money used for financing net working
capital. If net working capital increases, the firm must utilize and tie up more money, and this
decreases free cash flows. Production level growth necessitates increased levels of cash,
inventories, and accounts receivable (Michalski, 2008).Although having some cousin of cash and
inventory help firms‘ smoothing operations,building unnecessary working capital backfires.

16
Paying accounts payable after the duedate also hurts the firm because of the penalty charged by
suppliers. Building unnecessary working capital is also not in favor of the firm because it has a
negative impact on shareholders‘ wealth. Therefore, an optimal working capital management
policy is necessary for the firm.Corporate governance plays an important role in controlling the
management ofworking capital by formulating sound policies. The role of CEO duality, board
size, and audit committee in working capital management cannot be ignored. CEO duality and
board size help in maintaining an appropriate level of working capital in the organization (Gill
and Shah, 2012).
VanHorne and Wachowicz (2004) further observe that excessive levels of current assets as
advocated by the conservative working capital may have a negative effect on the firm‘s
profitability, whereas a low level of current assets may lead to a lower level of liquidity and
stock-outs, resulting in difficulties in maintaining smooth operations. More aggressive working
capital policies are associated with higher return and risk, while conservative working capital
policies are associated with lower risk and return (Weinraub and Visscher, 1998).
By managing working capital effectively, shareholders can get maximum return ontheir invested
capital. Weak corporate governance might have adverse consequences for cash management
(Harford et al. 2008), accounts receivable, inventory, accounts payable, and cash conversion. In
light of these considerations, the purpose of this study is to empirically document the impact of
corporate governance on working capital management efficiency.

17
2.3 Empirical Review
According to Jensen (1993), a lack of independent leadership creates difficulty for boards to
respond to failure in top management. He argues that concentration of decision management and
decision control in one individual hinders boards‘ effectiveness in monitoring top management.
However, when a CEO doubles as board chair, it affords the CEO the opportunity to carry out
decisions and projects without undue influence of bureaucratic structures (Kyereboah-Coleman,
2007). Therefore, CEO duality can improve the efficiency of working capital. Dittmar et al.
(2003) collected a sample of more than 11,000 firms from 45 countries and found that
corporations in countries where shareholders‘ rights are not well protected hold up to twice as
much cash as corporations in countries with good shareholder protection. They also found that
when shareholder protection is poor, factors that generally drive the need for cash holdings, such
as investment opportunities and asymmetric information, actually become less important. In
addition, the study found that firms hold larger cash balances when access to funds is easier.
Dittmar et al. (2007) explain that agency problems are important determinants of corporate cash
holdings. Therefore, strong corporate governance is necessary. They sampled 297 French firms
over the period 1998-2002 using tradeoff theory and pecking order theory. The author found that
growth companies hold higher cash levels than mature companies. Drobetz and Gru¨ninger
(2007) investigated the determinants of cash holdings for a comprehensive sample of 156 Swiss
non-financial firms between 1995 and 2004. They found a positive relationship between: CEO
duality and corporate cash holdings; and a non-significant relationship between board size and
corporate cash holdings. That is, CEO duality leads to significantly higher cash holdings and
larger board size has no impact on corporate cash holdings.

18
Narware (2004) in his empirical study on Indian National Fertilizer Limited, for 1990-91 to
1999-2000 signify that working capital management and profitability of the company disclosed
both negative and positive association. He also found evidence that increase in the profitability
of a company was less than the proportion to decrease in working capital. However, the study
done by Raheman and Nasr, (2007) on a sample of 94 Pakistani firms listed on Karachi Stock
Exchange for a period of 6 years from 1999 – 2004, demonstrate a strong negative relationship
exists between variables of the working capital management represented by liquidity and debt
with profitability of the firm.
Kuan et al. (2011) examined the association between corporate governance and cash policy of
family-controlled firms. The authors found that the impact of corporate governance, with its
separation of control rights and cash flow rights, director-ownership-in-pledge ratio and
proportion of independent directors on cash policy, differs between family-controlled and non-
family-controlled firms. The authors also found that the separation of seat control rights and cash
flow rights, as well as chair duality, significantly affects the cash policy within different levels of
cash holdings in firms.
According to Padachi (2006), high investment in inventories and receivables is associated with
lower profitability. He used return on total assets as a measure of profitability for a sample of 58
small manufacturing firms in Mauritius for the period 1998–2003. His findings reveal an
increasing trend in the short-term component of working capital financing. Similar to most recent
study by Christopher and Kamalavalli, (2009) which focus on 14 corporate hospitals in India for
19
the period 1996-97 to 2005-06. Their correlations and regression analysis signifying that
working capital component namely current ratio, cash turnover ratio, current assets to operating
income and leverage negatively influence profitability.
The holding and increasing of net working capital tie up money used for financing net working
capital. If net working capital increases, the firm must utilize and tie up more money, and this
decreases free cash flows. Production level growth necessitates increased levels of cash,
inventories, and accounts receivable (Michalski, 2008). Although having some cousin of cash
and inventory help firms‘ smoothing operations, building unnecessary working capital backfires.
Paying accounts payable after the due date also hurts the firm because of the penalty charged by
suppliers. Building unnecessary working capital is also not in favor of the firm because it has a
negative impact on shareholders‘ wealth. Therefore, an optimal working capital management
policy is necessary for the firm.
Lau and Block (2012) collected data from Standard and Poor 500 and the Edgar database to
investigate whether the presence of controlling founders and families had significant impact on
the level of cash holdings, and their implications on firm value. The authors found that founder
firms hold a significantly higher level of cash than family firms. In addition, they found a
positive interaction effect between founder management and cash holdings on firm value,
suggesting the presence of founders as managers helps to mitigate the agency costs of cash
holdings. Gill and Mathur (2011) collected data from Canadian service firms from 2009 to 2011
and found that sales growth positively impacts corporate liquidity.

20
On his part, Nazir (2009) analyzed the impact of aggressiveness of working capital investment
and financing policies in Pakistan for a sample of 204 non-financial firms listed at Karachi Stock
Exchange for the period of 1998-2005. They evaluated on firm returns i.e. return on assets and
Tobin‘s Q to represent market performance and indicates that firms adopting an aggressive
approach towards working capital financing policy give more value to the firms while inverse
relationship between the aggressiveness of working capital investment policies on firms
performance exist. These results are consistent with Afza and Nazir (2007) that using Tobin‘s Q
to represent stock market performance of Karachi Securities Exchange. According to Irene and
Lee (2007) who researched on the prevailing working capital management practices of some
well-performed Malaysian public firms listed on Bursa Malaysia, they examined the correlation
between profitability and the level of working capital of the sample firms and found out that
profitability and working capital are linearly related positively to a certain extent.
Gill and Shah (2012) sampled Canadian firms from 2009 to 2011 and found that CEO duality
and board size positively impact corporate cash holdings. The findings also suggest that CEO
duality and board size negatively impact net working capital. Valipour et al. (2012) took a
sample of 83 Iranian firms listed in the Tehran Security Exchange for the period of 2001-2010
and found a negative relationship between sales growth and cash conversion cycle. In summary,
the limited availability of literature review indicates that corporate governance influences the
efficiency of working capital management.
2.4 Summary of Literature Review
The importance of the corporate governance and its effect on management of working capital in
a firm has been expounded in detail both in the literature as well as from the empirical studies
done on the subject area. A firm‘s working capital is found to affect a firm‘s liquidity and

21
profitability and thus the objective of managing working capital is to ascertain that a firm has the
ability to continue operating with sufficient cash flow for payment of both maturing short-term
debt and impending operational expenses. Efficient working capital management involves
planning and controlling the current assets and current liabilities in a manner that eliminates the
risk of inability of a firm to meet due short term obligations and at the same time to avoid
excessive investment in these assets on the other hand. The level of managing the working
capital is affected by the corporate governance practices adopted by a firm.
A review of prior literature reveals that there exists a significant relation between corporate
governance and working capital management of a firm by using different variable selection for
analysis. In addition, it has been found out that different corporate governance practices have
different levels of working capital and they will always strife to maintain the level of working
capital in the short term. The risk behaviour preference of the firms‘ management was also found
to have an effect in the level of current assets and current liabilities that is held by a firm. For
risk averse managers, it was found out that such firms will hold a high proportion of current
assets compared to the current liabilities and vice versa for risk seeking managers. In effect
therefore, the level of risk preference characteristics of firm‘s managers will affect the level of
performance and profitability of the organization.
However, the studies have tended to examine a restricted subset of corporate governance
mechanisms such as director ownership, board size, and board composition. By examining both
internal and external factors, the present research will support Grandmont et al.’s (2004) claim
that financial performance depends on a full and comprehensive examination of corporate
governance practices, which reduces the endogeneity problem evident in some studies. Further,
the data will extend over five years from 2008 to 2006 and this will allow the researcher to

22
investigate dynamic aspects with regard to the changing information impacts of corporate
governance.

23
CHAPTER THREE: RESEARCH METHODOLOGY
3.1 Introduction
This chapter sets to explain the research design, the population of interest, the basis of sample
selection, the type of secondary data that was used, the sources of data, the techniques of analysis
to be used and the data analysis. A multivariate model is estimated using the SPSS.
3.2 Research Design
This study employed correlation research design. According to Albright et al. (2011) a
correlation research is a procedure in which subjects‘ score on two variables are simply
measured, without manipulation of any variable, to determine whether there is a relationship.
The study also adopted a cross-sectional study in which data was gathered just once over the
period 2008 to 2012 and as such, a causal study will be undertaken in a non-contrived setting
with no researcher interference. A cross sectional study was used to determine the
interrelationship between the variables under consideration among the different firms in the
study and this will permit the researcher to make statistical inference on the broader population
and generalize the findings to real life situations and thereby increase the external validity of the
study.
3.3 Population of the Study
The population of interest in this research was of composed of all manufacturing firms listed at
the NSE that have operated in Kenya between 2008 and 2012. As of 31st
Dec, 2012, there were
17 listed Manufacturing firms at the NSE with 13 of them in the Main Investment Market
Segment (MIMS) and 4 of them in the alternative investment market segment (AIMS) and this

24
constituted the requisite population (Appendix I). The reason as to why these markets were
chosen is primarily due to the availability and the reliability of the financial statements in that
they are subject to the mandatory audit by internationally recognized audit firms and also listed
firms have an incentive to manage their working capital efficiently and thus increase their share
prices. Most of the firms have their headquarters in Nairobi and its environs and it was
convenient in terms of time and accessibility to the researcher. Since the number of the firms is
limited, then the study was a census survey.
3.4 Data Collection
Data was collected from annual reports submitted to the NSE and Capital Markets Authority. All
the manufacturing firms that had continually operated between 2008 and 2012 were included to
ensure that the sampling frame is current and complete. From the financial statements, the
researcher collected information on level of account receivables, inventory, account payables,
sales, total assets and also establish the cash conversion cycle. From the notes to the accounts,
the CEO tenure and duality, board size and Audit committee composition was established.
3.5 Data Analysis
Multiple regression analysis was applied to the data to examine the effect of the corporate
governance tenets on the working capital management elements in manufacturing firms. The
regression models was run from the financial reports of the firms that had been in operation since
2008 and whose annual reports were available for the periods. The balance sheets, income
statements and their notes was studied to get the data for the variables mentioned in the model.
The regression was adapted from the one used by Gill and Biger (2012) when they did a similar
research on Canadian firms.

25
The equation specifically took the form;
Regression equation (A): AR = βо+ β1TNt+ β2BSt+ β3ACt+ β4FSt + β5GROWt + α
Regression equation (B): INV =βо+ β1TNt+ β2BSt+ β3ACt+ β4FSt + β5GROWt+ α
Regression equation (C): AP =βо+ β1TNt+ β2BSt+ β3ACt+ β4FSt + β5GROWt + α
Dependent Variable Measurement
Accounts receivables (ARt) (Accounts receivables/sales) × 365 days
Accounts Payable (APt) (Accounts payables/cost of goods sold) × 365 days
Inventory (INVt) (Inventory/cost of goods sold) × 365 days
Independent (explanatory) variables
CEO tenure (TNt ) Number of years serving as a CEO
Board size (BS,t ) Number of directors serving on board
Audit committee (AC,t ) Number of audit committee members

26
Control Variables
Sales growth (GROWt ) (Current year sales 2 previous year sales)/previous
year sales
Firm size (FSt ) Log of average assets

27
CHAPTER FOUR
DATA ANALYSIS, RESULTS AND DISCUSSION
4.1 Introduction
This chapter presents the results and findings of the study based on the research objectives. The
results are presented in the form of summary tables. In addition a regression analysis is used to
analyse the data to answer the research objective.
4.2 Descriptive Statistics
Table 4.1 below summarizes the descriptive statistics of the variables included in the regression
models as presented. It represents the variables of the 15 manufacturing firms operating in Kenya
in the financial results years 2008-2012.
Table 4.1: Descriptive statistics of independent, dependent, and control variables
Variable Mean Median SD
AR 0.445 0.414 0.2231
IT 1.235 0.628 0.582
AP 0.567 0.237 0.410
CCC 9.269 5.965 1.724
TN 1.476 .898 0.725
BS 1.667 1.257 0.584
AC 3.785 1.548 0.965
SG 0.345 0.124 0.102
FS 2.876 1.652 0.46

28
Source: Calculations based on Annual reports of firms from 2008-2012
Notes: SD – standard deviation; CD – CEO tenure; BS – board size; AC – audit committee; SG –
firm growth; AR – accounts receivables (in days); IT – inventory holding (in days); AP –
accounts payables (in days); CCC – cash conversion cycle (in days); FS – Firm Size;
The mean value of the account receivable is 44.5% of the working capital and the standard
deviation 22.3%. It means that value of the account receivable can deviate from the mean to
both sides by 22.3 %. The traditional measures of liquidity (cash conversion cycle) for the
manufacturing firms in Kenya is 9.269 with the standard deviation of 1.724.
To check the size of the firm and its relationship with working capital, natural logarithm of total
assets is used as a control variable. The mean value of log of total assets is 1.621917 while the
standard deviation is 1.02345. The cash conversion cycle is used as a proxy to check the
efficiency in managing working capital which influences the firms liquidity level is on average
2.876 while its standard deviation is 0.346.
From Appendix II, the bivariate correlation analysis shows that; Accounts receivable
management efficiency is positively correlated with the CEO tenure, audit committee, firm size
and sales growth. The accounts payable management efficiency is positively correlated with the
audit committee while the cash conversion cycle is positively correlated with CEO tenure, and
audit committee. The results also show that inventory management is positively correlated with
CEO tenure, board size and audit committee.
29
The results from the descriptive statistics above show that, generally, observance of corporate
governance tenets such as establishment of the audit committee, constituted of a board that has
the oversight role of the workings of the managers will help in the maintenance of optimal
working capital by a firm. Audit committee represents internal governance mechanism whose
impact is to improve the quality of financial management of a company including the working
capital level. Hence, a firm should consider increasing the role of the audit committee to
determination of optimal working capital. This finding is in line with that of Kyereboah-Coleman
(2007) who argued for a small board size to promote a faster and effective communication and
decision-making. They further pointed that audit committee should have a minimum size of three
members to enhance independent.
An independent audit committee enhances the efficiency of working capital by auditing cash
accounts, accounts receivable, accounts payable, and inventory accounts, which in turn,
minimizes agency problems and agency costs as suggested by Jensen (1993). The CEO tenure
had also a positive correlation with the level of working capital held. This could be because that
when a CEO serves longer in a firm, it serves as an added incentive to promote the interests of
shareholders due essentially to the fact that apart from job security, the CEO is afforded the
opportunity to witness the results of decisions taken. This is the same view that Kyereboah-
Coleman (2007) pointed out though it contradicts the conclusion made by Drobetz and
Gru¨ninger (2007) who found an insignificant relationship between board size and corporate cash
holdings.
30
4.3 Inferential Analysis
For inferential analysis the study used several regression models. These models were used to
identify important variables influencing the dependent variable. The regression analysis is used
to investigate the impact of corporate governance on the working capital position of the firm.
The determinants of working capital were estimated using pooled least squares and general least
squares method with cross section weights.
As pointed out by Raheman and Nasr (2007), when using pooled data and cross sections there
may be a problem of heteroskedasticity (changing variation after short period of time) and to
counter this problem, the general least square with cross section weights approach was adopted.
In the regression, the common intercept was calculated for all variables and assigned a weight.
Further as Gill and Beger (2012) noted, when using multiple regression analysis, there is a
possibility of endogeneity occurring whereby when certain variables are omitted, it leads to
measurement errors. To minimize endogeneity issues, the most important variables that impact
the working capital management efficiency (Account receivable, inventory, cash and account
payables) are used.
4.4.1 Corporate governance and accounts receivable management efficiency
The results show that there exist positive relationships between CEO duality and accounts
receivable; audit committee and accounts receivable and also the firm size and account
receivable. This means that CEO duality and audit committee of the firm improve the efficiency
of accounts receivable management, which in turn, helps reduce working capital requirements.
These results give credence to the findings of Saddour (2006) who found that internationalization
of the CEO and board composition enhances the level of management of the working capital.

31
From Table 4.2 below, the established multiple linear regression equation becomes:
AR = 34.835 + 15.052TN – 5.313 BS + 0.726AC + 9.961FS – 3.487GROW
The coefficient of intercept C has a value (34.835) and is significant. The coefficient of CEO
duality is high and also significant and this means that a unit increase in the CEO duality
increases the efficiency of account receivable management and highly significant at ά. = 5%, and
implies that the increase or decrease in the corporate governance, significantly affects the
efficiency of account receivable management.
Table 4.2: Corporate governance and accounts receivable management
Model Unstandardized
Coefficients
Standardized
Coefficients
t Sig. Collinearity
Statistics
B Std. Error Beta Tolerance VIF
1
(Constant) 34.835 40.878 0.940 0.350
TN 15.052 16.435 0.094 0.916 0.363 0.902 1.109
BS -5.313 5.324 -0.100 -0.998 0.321 0.934 1.071
AC 0.726 8.469 0.009 0.086 0.932 0.833 1.201
FS 9.961 13.902 0.075 0.717 0.476 0.854 1.171
GROW -3.487 0.693 -.516 -5.028 0.000 0.896 1.116
a. Dependent Variable: AR
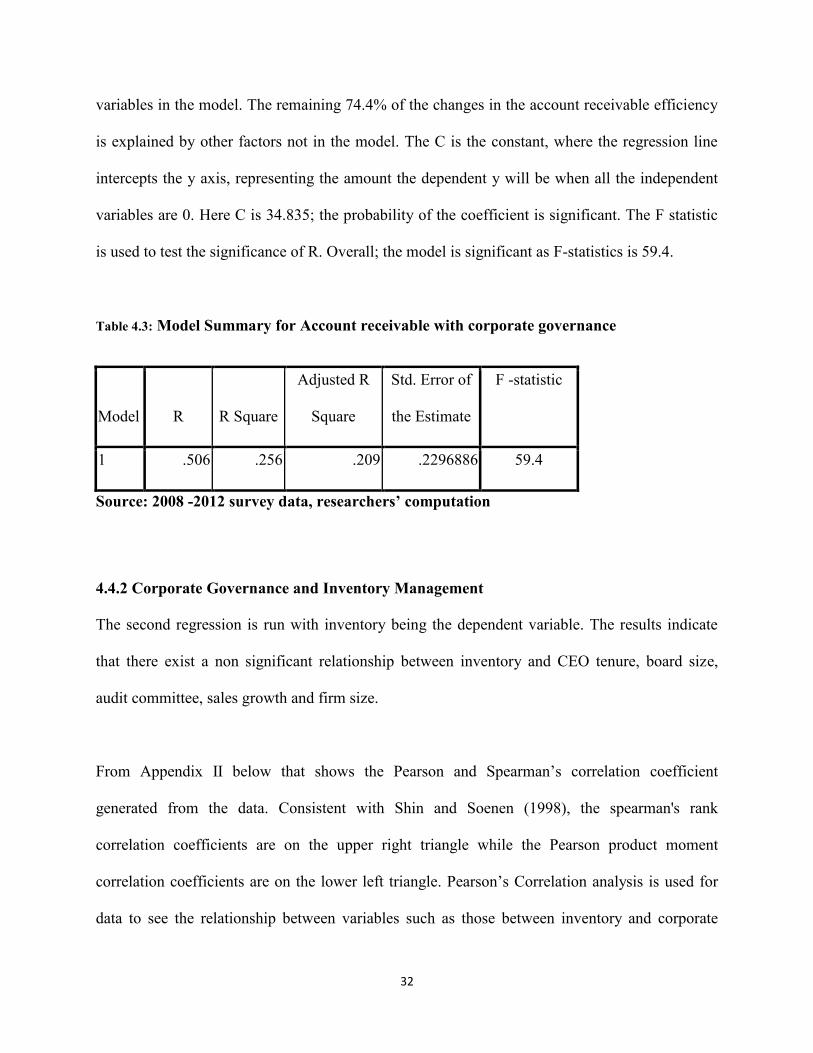
From table 4.3, the adjusted R2, also called the coefficient of multiple determinations, is the
percent of the variance in the dependent explained uniquely or jointly by the independent
variables and is 25.6%. This means that 25.6% of the changes in the account receivable
efficiency will be explained by the changes in the corporate governance variables and control
32
variables in the model. The remaining 74.4% of the changes in the account receivable efficiency
is explained by other factors not in the model. The C is the constant, where the regression line
intercepts the y axis, representing the amount the dependent y will be when all the independent
variables are 0. Here C is 34.835; the probability of the coefficient is significant. The F statistic
is used to test the significance of R. Overall; the model is significant as F-statistics is 59.4.
Table 4.3: Model Summary for Account receivable with corporate governance
Model R R Square
Adjusted R
Square
Std. Error of
the Estimate
F -statistic
1 .506 .256 .209 .2296886 59.4
Source: 2008 -2012 survey data, researchers’ computation
4.4.2 Corporate Governance and Inventory Management
The second regression is run with inventory being the dependent variable. The results indicate
that there exist a non significant relationship between inventory and CEO tenure, board size,
audit committee, sales growth and firm size.
From Appendix II below that shows the Pearson and Spearman‘s correlation coefficient
generated from the data. Consistent with Shin and Soenen (1998), the spearman's rank
correlation coefficients are on the upper right triangle while the Pearson product moment
correlation coefficients are on the lower left triangle. Pearson‘s Correlation analysis is used for
data to see the relationship between variables such as those between inventory and corporate

33
governance tenets. If the presence and practice of different corporate governance principles leads
to an efficient management of inventory, then one should expect a positive relationship. There is
a negative relationship between efficient management of inventory and the measures of corporate
governance specifically CEO tenure, firm size and sales growth of the firm. However, there
exists a positive relationship between size of the board and audit committee. This result will be
consistent with the results of Gill and Shah who found that CEO duality and board size positively
impact corporate cash holdings and also that CEO duality and board size negatively impact net
working capital.
The effect of corporate governance on efficient management of inventory is investigated for all
75 firm-year observations. From Table 4.4 below, the established multiple linear regression
equation becomes:
INV = 223.325 + 1.769TN +5.924BS + 10.772AC - 19.292FS – 4.689GROW
The coefficient of intercept C has a value (223.325) and is significant. The CEO tenure, Board
size and audit committee improve the efficiency of inventory management. This means that an
organization should endeavor to set up an audit committee such that the more the board size and
consequently the audit committee size the better managed the inventory of the firm. It is further
interpreted however that if the firm size increases or the growth increases, the level of inventory
management efficiency declines. This finding however is puzzling as it contradicts that made by
Gill and Biger (2012) found on American Manufacturing firms.

34
Table 4.4: Corporate Governance and Inventory Management
Model Unstandardized
Coefficients
Standardized
Coefficients
t Sig. Collinearity
Statistics
B Std. Error Beta Tolerance VIF
1
(Constant) 223.325 162.642 1.373 0.174
TN 1.769 26.498 0.007 0.067 0.947 0.902 1.109
BS 5.924 8.583 0.071 0.690 0.492 0.934 1.071
AC 10.772 13.654 0.086 0.789 0.433 0.833 1.201
FS -19.292 22.413 -0.093 -0.861 0.392 0.854 1.171
GROW -4.689 1.118 -0.441 -4.194 0.000 0.896 1.116
With an R2 of 13.2% is low and this model explains only 13.2% of the variability in the
independent variables
Table 4.5: Model Summary for INV with Control Variables
Model R R Square
Adjusted R
Square
Std. Error of
the Estimate F -statistic
1 .465 .216 .186 .1568003 31.603
Source: 2008 -2012 survey data, researchers’ computation
The adjusted R2, also called the coefficient of multiple determinations, is the percent of the
variance in the dependent explained uniquely or jointly by the independent variables and is

35
21.6%. The C is the constant, where the regression line intercepts the y axis, representing the
amount the inventory when all the independent variables are 0. The F-statistic also reflects the
highly significance of the model as its value is 31.603.
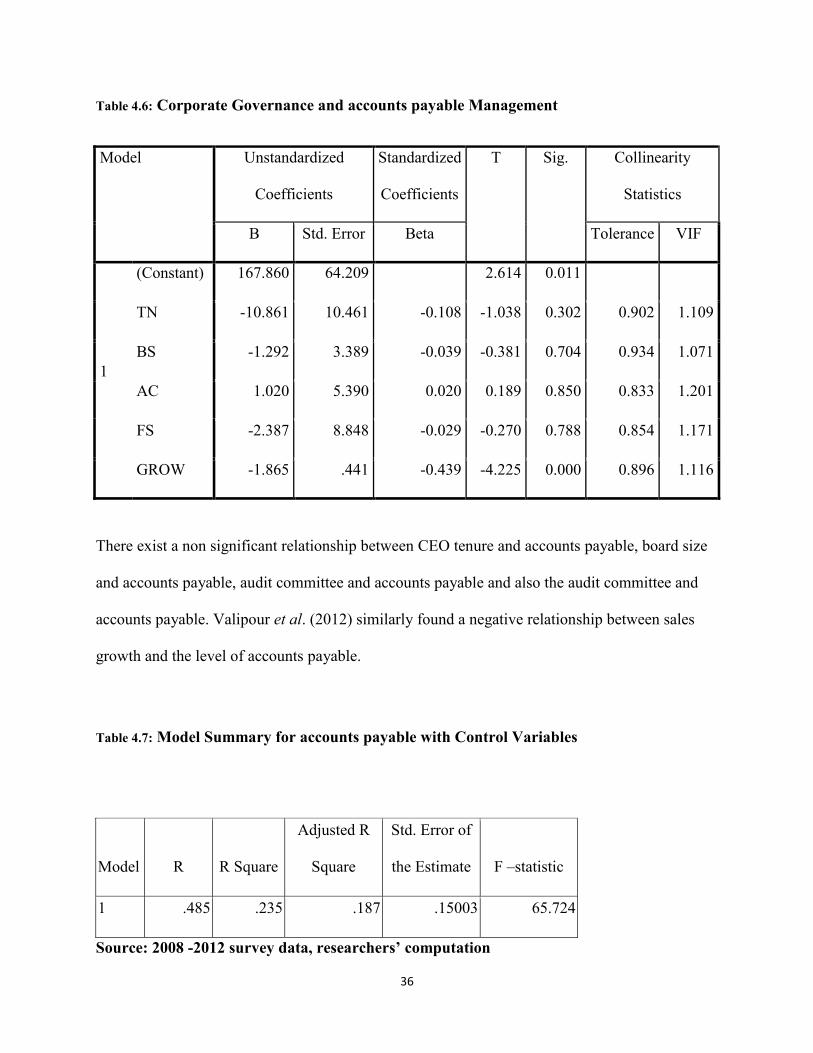
4.4.3 Corporate governance and accounts payable management
The third regression is run with accounts payable being the dependent variable. The results from
table 4.6 indicate that there exist a positive relationship between accounts payable and audit
committee only. Otherwise a negative relationship exists between CEO tenure, board size, firm
size and the growth of the firm. This result shows that as the corporate governance practices are
implemented by a firm, the level of accounts payable of the firm is minimized. This is a positive
result since the intentions of the firm is not to increase the level of accounts receivable to sub
optimal level since it is going to lead to the erosion of the firm credit rating.
From Table 4.6 below, the established multiple linear regression equation becomes:
INV = 167.860 – 10.861TN - 1.292BS + 1.02AC - 2.387FS – 1.865GROW
36
Table 4.6: Corporate Governance and accounts payable Management
Model Unstandardized
Coefficients
Standardized
Coefficients
T Sig. Collinearity
Statistics
B Std. Error Beta Tolerance VIF
1
(Constant) 167.860 64.209 2.614 0.011
TN -10.861 10.461 -0.108 -1.038 0.302 0.902 1.109
BS -1.292 3.389 -0.039 -0.381 0.704 0.934 1.071
AC 1.020 5.390 0.020 0.189 0.850 0.833 1.201
FS -2.387 8.848 -0.029 -0.270 0.788 0.854 1.171
GROW -1.865 .441 -0.439 -4.225 0.000 0.896 1.116
There exist a non significant relationship between CEO tenure and accounts payable, board size
and accounts payable, audit committee and accounts payable and also the audit committee and
accounts payable. Valipour et al. (2012) similarly found a negative relationship between sales
growth and the level of accounts payable.
Table 4.7: Model Summary for accounts payable with Control Variables
Model R R Square
Adjusted R
Square
Std. Error of
the Estimate F –statistic
1 .485 .235 .187 .15003 65.724
Source: 2008 -2012 survey data, researchers’ computation
37
The adjusted R2, also called the coefficient of multiple determinations, is the percent of the
variance in the dependent explained uniquely or jointly by the independent variables and is
18.7%. The F statistic is used to test the significance of R. Overall; the model is significant as F-
statistics is 65.724

38
CHAPTER FIVE
SUMMARY, CONCLUSIONS AND RECOMMENDATIONS
5.1 Introduction
This chapter presents a summary of the key findings of the study as well as the conclusions,
limitations of the study, and recommendations for further research.
5.2 Summary
The secondary data in this analysis covered a period of 5 years from 2008 to 2012. The
population of study was manufacturing firms listed at the NSE and was in operation during the
study period. After the screening process firms whose accounts were not available in all the years
of study or were not listed in the full were eliminated and from this screening process 2 firms
were eliminated leaving 15 to be studied in the research.
A test for multi collinearity was performed. All the variance inflation factor (VIF) coefficients
are less than 2 and tolerance coefficients are greater than 0.50. CEO tenure, board size, sales
growth, audit committee, and firm size explain 25.6% percent of the variance in accounts
receivable management efficiency of listed manufacturing firms in Kenya. CEO tenure, board
size, sales growth, audit committee, and firm size explain 6.70 percent of the variance in
inventory management efficiency of American manufacturing firms. The random and fixed
effects of independent variables on the dependent variables indicate that the efficiency of
working capital management differs from sector to sector and from year to year. The changes in
the measures of working capital management may be due to the changes in economic situations,

39
changes in the general level of interest rates that affect the opportunity cost of holding cash, and
changes in working capital management policies.
An independent audit committee enhances the efficiency of working capital by auditing cash
accounts, accounts receivable, accounts payable, and inventory accounts, which in turn,
minimizes agency problems and agency costs. The CEO tenure had also a positive correlation
with the level of working capital held and this could be due essentially to the fact that apart from
job security, the CEO is afforded the opportunity to witness the results of decisions taken
There is a negative relationship between efficient management of inventory and the measures of
corporate governance specifically CEO tenure, firm size and sales growth of the firm. However,
there exists a positive relationship between size of the board and audit committee. Further, there
existed a positive relationship between accounts payable and audit committee only. Otherwise a
negative relationship exists between CEO tenure, board size, firm size and the growth of the
firm. This result shows that as the corporate governance practices are implemented by a firm, the
level of accounts payable of the firm is minimized. This is a positive result since the intentions of
the firm is not to increase the level of accounts receivable to sub optimal level since it is going to
lead to the erosion of the firm credit rating.
5.3 Conclusions and Recommendation
The present study found that corporate governance improves the efficiency of working capital
management Kenyan manufacturing firms. Larger board size may not be in favor of Kenyan
manufacturing firms because it does not improve working capital management efficiency. The

40
positive correlation between corporate governance and inventory, account receivable and
payable means that foe efficient management of these working capital, there is need for the
establishment of an active audit committee and also the CEO tenure need to be enhanced to
achieve optimality of the working capital components. Further, the results suggest that managers
can create value for their shareholders by working positively with the audit committee and also
through establishment of the appropriate oversight over their actions.
Shareholders should also view the board of directors as a good corporate governance practice
and support the improvements and government controls to maintain the independence of the
board of directors. Outside directors should exist and they are useful tools for the independence
of the board. The members of the board of directors should realise that the structure of the board
is directly related to corporate performance and eventually the way working capital is managed
in the organization. There is need also for harmonization of corporate governance across all the
firms since some of the all the firms had different nature of corporate governance practices and
therefore leading to the difference in the management of performance of working capital
management.
5.4 Limitation of the study
This study is limited to the sample of Kenyan manufacturing firms. The findings of this study
could only be generalized to firms similar to those that were included in this research. In
addition, sample size is small. The scope of further research may be extended to other
components of working capital including cash, marketable securities, cash conversion cycle as
well as incorporation of more control variables.

41
There is also a potential inter relations between corporate governance practices and contextual
variables that were not taken into account. Recent studies have shown that certain corporate
governance practices are interconnected, and may be more effective in certain contexts. For
example, the results of Boujenoui and Zeghal (2006) tend to demonstrate that the ownership
structure, might possibly affect the governance mechanisms put in place by the companies.
Likewise, the corporate size might also affect the CEO tenure or board size. This relationship
was not considered in this study.
5.5 Suggestions for Further Research
Future research should investigate generalizations of the findings beyond the Kenyan firms.
Important control variables such as industry sectors from different countries, board composition,
etc. should also be used.
42
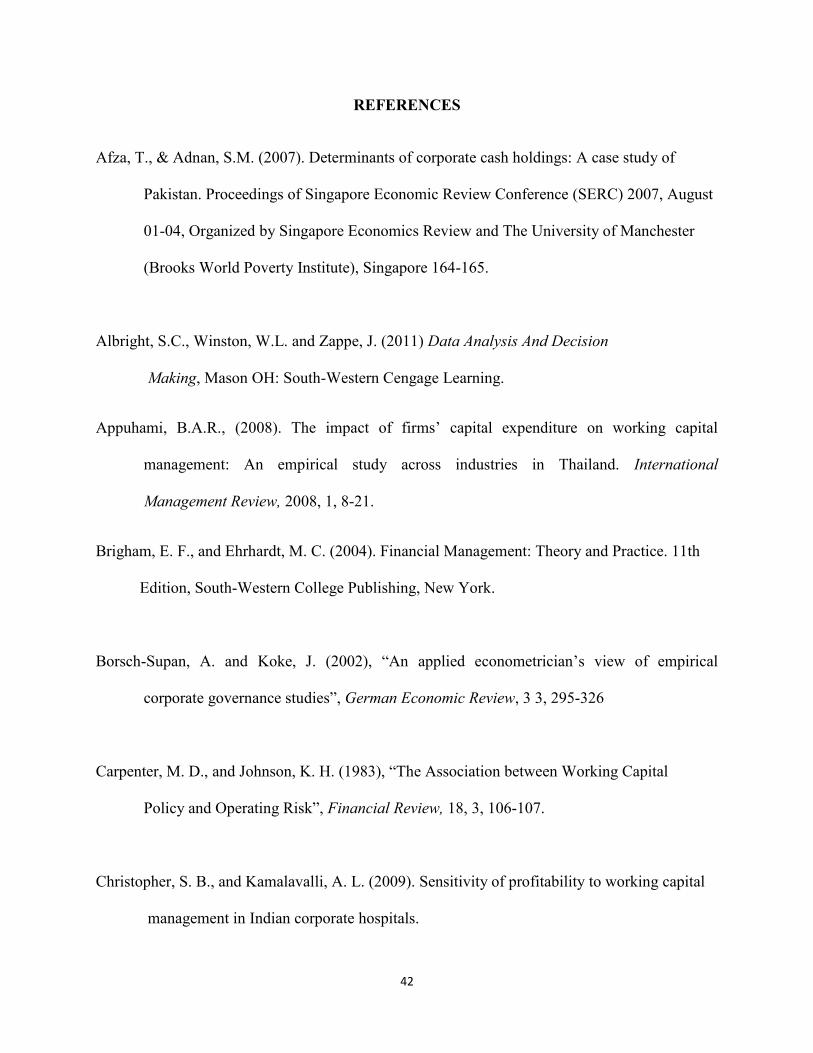
REFERENCES
Afza, T., & Adnan, S.M. (2007). Determinants of corporate cash holdings: A case study of
Pakistan. Proceedings of Singapore Economic Review Conference (SERC) 2007, August
01-04, Organized by Singapore Economics Review and The University of Manchester
(Brooks World Poverty Institute), Singapore 164-165.
Albright, S.C., Winston, W.L. and Zappe, J. (2011) Data Analysis And Decision
Making, Mason OH: South-Western Cengage Learning.
Appuhami, B.A.R., (2008). The impact of firms‘ capital expenditure on working capital
management: An empirical study across industries in Thailand. International
Management Review, 2008, 1, 8-21.
Brigham, E. F., and Ehrhardt, M. C. (2004). Financial Management: Theory and Practice. 11th
Edition, South-Western College Publishing, New York.
Borsch-Supan, A. and Koke, J. (2002), ―An applied econometrician‘s view of empirical
corporate governance studies‖, German Economic Review, 3 3, 295-326
Carpenter, M. D., and Johnson, K. H. (1983), ―The Association between Working Capital
Policy and Operating Risk‖, Financial Review, 18, 3, 106-107.
Christopher, S. B., and Kamalavalli, A. L. (2009). Sensitivity of profitability to working capital
management in Indian corporate hospitals.
43
Claessens, S., Djankor, S., Fan, J.P.H. and Lang, L.H.P. (2002), ‗‗Disentangling the incentive
and entrenchment effects of large shareholders‘‘, The Journal of Finance, 57 6, 2741-71
Dittmar, A., Mahrt-Smith, J. and Servaes, H. (2003), ―International corporate governance and
corporate cash holdings‖, Journal of Financial and Quantitative Analysis, 3, 1,
Drobetz, W. and Gru¨ninger, M.C. (2007), ―Corporate cash holdings: evidence from
Switzerland‖, Financial Markets Portfolio, 21, 293-324.
Eljelly, A. M. A. (2004). ―Liquidity-Profitability Tradeoff: An Empirical Investigation in an
Emerging Market‖, International Journal of Commerce and Management, 14, 2,
48-61.
Ferreira, M.A., & Vilela, A.S. (2004). Why do firms hold cash? Evidence from EMU countries.
European Financial Management, 10(2), 295-319.
Fox, M. and Heller, M. (2006), Corporate Governance Lessons from Transition Economy
Reforms, Princeton University Press, Princeton, NJ.
Ganesan, V. (2007), ―An analysis of working capital management efficiency in
telecommunication equipment industry‖, River Academic Journal, 3 2, 1-10.

44
Gill, A., & Biger, N. (2012). Factors that Affect Small Business Performance in Canada.
International Journal of Entrepreneurial Venturing, 4(2), 1742-5360.
Gill, A. & Mathur, N. (2011). Factors that influence financial leverage of Canadian firms.
Journal of Applied Finance and Banking, 1(2), 19-37.
Gill, A. and Shah, C. (2012), ―Determinants of corporate cash holdings: evidence from Canada‖,
International Journal of Economics and Finance, 4 No. 1, 70-9.
Gitman, L. A. (2005), Principles of Managerial Finance, 11th Edition, Addison Wesley
Publishers, New York.
Gompers, P. A., Ishii, J. L. and Metrick, A. (2003), `Corporate governance and equity
prices', The Quarterly Journal of Economics 118, 107-155.
Grandmont, R., Grant, G. & Silva, F. 2004. Beyond the Numbers—Corporate
Governance: Implications for Investors, The Materiality of Social, Environmental and
Governance Issues to Equity Pricing, Deutsche Bank, Geneva: UNEP, pp. 17-18.
Harford, J., Mansi, S.A., & Maxwell, W.F. 2008. Corporate governance and firm cash holdings
in the US. Journal of Financial Economics, 87(3): 535-555
45
Irene T.W.K & Lee S. F. (2007). An empirical exploration into optimal working capital
management on public listed companies in Malaysia, Proceedings of
the 3rd UNITEN International Business Conference (UIBMC),
16-18 December, Malaysia.
Isshaq, Z., Bokpin, G.A. and Onumah, J.M. (2009), ―Corporate governance, ownership structure,
cash holdings, and firm value on the Ghana Stock Exchange‖, The Journal of Risk
Finance, 10,5, 488-99.
Jensen, M.C. (1993), ―The modern industrial revolution, exit, and the failure of internal control
systems‖, Journal of Finance, 48, 3, 832-80.
Keasey, K., Thompson, S. and Wright, M. (2005), ‗‗Introduction: the corporate governance
problem: competing diagnoses and solutions‘‘, in Keasey, K., Thompson, S. and Wright,
M. (Eds), Corporate Governance: Economic and Financial Issues, Oxford University
Press, Oxford, pp. 1-17.
Kuan, T.H., Li, C.S. and Chu, S.H. (2011), ―Cash holdings and corporate governance
in family-controlled firms‖, Journal of Business Research, 64, 7, 757-64.
La Porta, R., Lopez-de-Silanes, F., Shleifer, A. and Vishny, R. (2007), ―Legal determinants of
external finance‖, Journal of Finance, 3, 1131-50.

46
Lipton, M. and Lorsch, J.W. (1992), ―A modest proposal for improved corporate governance‖,
Business Lawyer, 48 No. 1, 59-78.
Maati, J. (1999), Le Gouvernement d‘Entreprise, De Boeck Universite´ , Paris and Bruxelles.
Mathuva M. D. (2010), The Influence of Working Capital Management Components on
Corporate Profitability: A survey of Kenyan Listed Firms, Journal of Financial
Management, 15, 2, 24-35
Mayer, F. (1997), ‗‗Corporate governance, competition, and performance’’, in Deakin, S. and
Hughes, A. (Eds), Enterprise and Community: New Directions in Corporate Governance,
Blackwell Publishers, Oxford
Meharey, P.G. (2006), ―The common law and economic growth: Hayek might be right‖, in Fox,
M.and Heller, M. (Eds), Corporate Governance Lessons from Transition Economy
Reforms, Princeton University Press, Princeton, NJ, 84-110.
Michalski, G. (2008), ―Determinants of accounts receivable level: portfolio approach in firm‘s
trade credit policy‖, Acta Oeconomica Pragensia, 16. 5, 47-56.
Narware P. C. (2004). Working capital and profitability- an empirical analysis. The Management
Accountant, Vol, 39 (6), pp 120-127.
47
Nazir, M.S. (2009). Impact of working capital aggressiveness on firms‘ profitability. IABR &
TLC ConferenceProceedings, San Antonio, Texas, USA.
Nganga, S.C. (2009). Relationship between Working Capital and Profitability of listed
companies in the NSE. Unpublished MBA Management Project, University of Nairobi.
Padachi, Kesseven. (2006). Trends in working capital management and its impact on firms‘
performance: an analysis of Mauritian small manufacturing firms. International Review
of Business Research Papers, Vol. 2 (2), pp. 45 - 58.
Pistor, K. (2006), ―Patterns of legal change: shareholder and creditor rights in transition
economies‖, in Fox, M.B. and Heller, M.A. (Eds), Corporate Governance Lessons f
Rafuse, M. E.(2006). Working Capital Management: An Urgent need to Refocus. Journal of
Management Decisions, 34,2, 59-63.
Raheman, A., and Nasr, M. (2007), Working capital management and profitability: Case of
Pakistani Firms. International Review of Business Research Papers, 3 ,. 2, 275-296.
Shin H. and L. Soenen (1998) Efficiency of Working Capital and Corporate Profitability,
Journal Financial Practice and Education, Vol. 8, 37-45.
48
Smith, K., (1980). Profitability Versus Liquidity Tradeoffs in Working Capital Management and
Corporate Profitability: Readings on The Management of Working Capital, 549-562
Solomon, J.F., Lin, S.W., Norton, S.D. and Solomon, A. (2003), ―Corporate governance in
Taiwan: empirical evidence from Taiwanese company directors‖, Corporate
Governance: An International Review, 11, 3,. 235-48.
Van Horne, J. C., and Wachowicz J. M. (2000). Fundamentals of Financial Management. 11th
ed. Prentice Hall Inc.
Weinraub, H.J., and Visscher, S. (1998). Industry Practice Relating to Aggressive Conservative
Working Capital Policies, Journal of Financial and Strategic Decisions, 11, 2,Fall 1998.
Yermack, D. (1996), ―Higher market valuation of companies with a small board of directors‖,
Journal of Financial Economics, 40 , 2, 185-211.

49
APPENDIX I: MANUFACTURING FIRMS LISTED AT THE NSE
Manufacturing Firms in the Main Market Investment Segment (MIMS)
1. Athi River Mining co. Ltd
2. Bamburi Cement Ltd
3. B.O.C (K) Ltd
4. British American Tobacco Kenya Ltd
5. Carbacid Investment
6. Crown Berger Ltd
7. E.A. Cables Ltd
8. E.A. Portland Ltd
9. East African Breweries Ltd
10. Eveready E.A. Ltd
11. Mumias Sugar Co. Ltd
12. Sameer Africa Ltd
13. Unga Group Ltd
Manufacturing Firms in Alternative Investment Market (AIMS)
14. A. Baumann co. Ltd

50
15. Kapchorua Tea
16. Kenya Orchards Ltd
17. Williamson Tea Kenya

51
APPENDIX II: CORRELATION
Pearson Correlation : Corporate governance and Accounts Receivable management
AR TN BS AC FS GROW
AR
Pearson Correlation 1 -.039 -.121 -.026 -.022 -.483
Sig. (2-tailed) .723 .268 .816 .845 .000
N 75 75 75 75 75 75
TN
Pearson Correlation -.039 1 -.098 -.118 -.072 .264
Sig. (2-tailed) .723 .374 .282 .515 .015
N 75 75 75 75 75 75
BS
Pearson Correlation -.121 -.098 1 .241 .115 .045
Sig. (2-tailed) .268 .374 .026 .296 .686
N 75 75 75 75 75 75
AC
Pearson Correlation -.026 -.118 .241 1 .347 .050
Sig. (2-tailed) .816 .282 .026 .001 .651
N 75 75 75 75 75 75
FS
Pearson Correlation -.022 -.072 .115 .347 1 .159
Sig. (2-tailed) .845 .515 .296 .001 .147
N 75 75 75 75 75 75
GROW
Pearson Correlation -.483 .264 .045 .050 .159 1
Sig. (2-tailed) .000 .015 .686 .651 .147
N 75 75 75 75 75 75
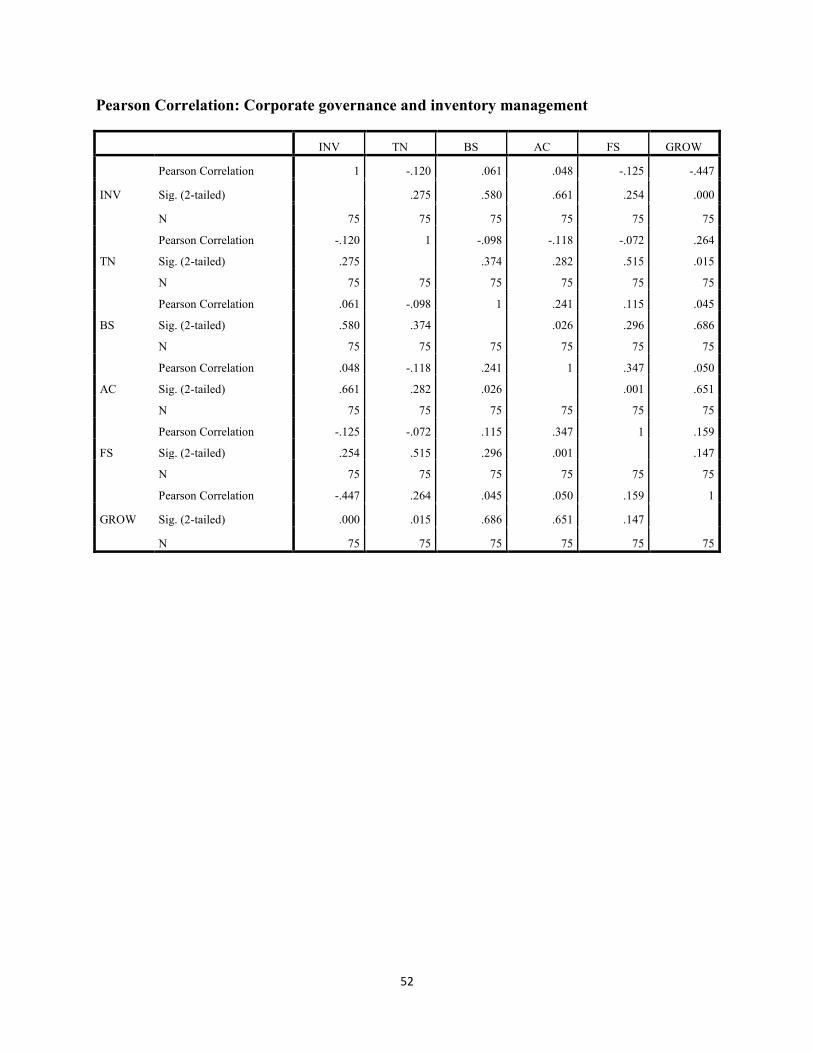
52
Pearson Correlation: Corporate governance and inventory management
INV TN BS AC FS GROW
INV
Pearson Correlation 1 -.120 .061 .048 -.125 -.447
Sig. (2-tailed) .275 .580 .661 .254 .000
N 75 75 75 75 75 75
TN
Pearson Correlation -.120 1 -.098 -.118 -.072 .264
Sig. (2-tailed) .275 .374 .282 .515 .015
N 75 75 75 75 75 75
BS
Pearson Correlation .061 -.098 1 .241 .115 .045
Sig. (2-tailed) .580 .374 .026 .296 .686
N 75 75 75 75 75 75
AC
Pearson Correlation .048 -.118 .241 1 .347 .050
Sig. (2-tailed) .661 .282 .026 .001 .651
N 75 75 75 75 75 75
FS
Pearson Correlation -.125 -.072 .115 .347 1 .159
Sig. (2-tailed) .254 .515 .296 .001 .147
N 75 75 75 75 75 75
GROW
Pearson Correlation -.447 .264 .045 .050 .159 1
Sig. (2-tailed) .000 .015 .686 .651 .147
N 75 75 75 75 75 75

53
Pearson Correlation: Corporate governance and accounts payable management
AP TN BS AC FS GROW
AP
Pearson Correlation 1 -.220 -.046 -.008 -.088 -.473
Sig. (2-tailed) .043 .674 .941 .423 .000
N 85 85 85 85 85 85
TN
Pearson Correlation -.220 1 -.098 -.118 -.072 .264
Sig. (2-tailed) .043 .374 .282 .515 .015
N 85 85 85 85 85 85
BS
Pearson Correlation -.046 -.098 1 .241 .115 .045
Sig. (2-tailed) .674 .374 .026 .296 .686
N 85 85 85 85 85 85
AC
Pearson Correlation -.008 -.118 .241 1 .347 .050
Sig. (2-tailed) .941 .282 .026 .001 .651
N 85 85 85 85 85 85
FS
Pearson Correlation -.088 -.072 .115 .347 1 .159
Sig. (2-tailed) .423 .515 .296 .001 .147
N 85 85 85 85 85 85
GROW
Pearson Correlation -.473 .264 .045 .050 .159 1
Sig. (2-tailed) .000 .015 .686 .651 .147
N 85 85 85 85 85 85

54
APPENDIX III: SOURCE DATA
AR INV AP TN BS AC SG FS EAST AFRICAN PORTLAND
2008 27.28
70.56
78.02 9 6 12.52% 6.66
2009 30.76
78.61
52.00 1 yr 9 6 12.45% 6.78
2010 26.07
72.34
78.04 1 yr 9 6 16.14% 6.78
2011 34.61
76.22
72.56 1 yr 9 6 8.11% 6.83
2012 24.46
77.27
88.38 1 yr 8 5 -19.64% 6.85
MUMIAS SUGAR COMPANY
2008 80.23
87.27
51.57 12 4 15.31% 6.85
2009 101.00
108.67
27.20 1 yr 12 3 -1.49% 6.94
2010 77.76
87.72
32.63 1 yr 12 4 32.45% 6.96
2011 89.28
71.45
42.04 12 5 1.14% 7.06
2012 107.65
96.62
55.31 12 4 -1.60% 7.14

55
EVEREADY
2008 38.88
50.19
109.25 12 3 -20.49% 5.62
2009 49.50
49.69
153.08 10 2 -7.30%
5.70
2010 54.40
67.47
201.99 8 4 -0.61% 5.76
2011 50.00
71.43
167.96 9 3 -15.92% 5.71
2012 46.92
80.81
204.01 1 yr 7 4 0.00% 5.76
SAMEER AFRICA
2008 76.44
37.14
157.81 1 yr 7 2 -12.76% 6.19
2009 48.26
20.66
132.31 7 2 8.30% 6.18
2010 89.42
45.29
96.16 1 yr 8 2 2.04% 6.15
2011 88.42
57.78
116.81 7 2 9.88% 6.19
2012 94.74
77.26
116.63 1 yr 7 4 7.77% 6.23
BAMBURI CEMENT
2008 28.17
82.32
101.34 10 4 24.22% 4
2009 26.81
64.38
75.65 10 4 9.20% 4.05
2010 28.34
62.12
46.29 1 yr 10 4 -6.40% 4.06
2011 26.59
46.57
41.06 1 yr 10 4 27.81% 4.06
2012 21.39
51.79
46.72 1 yr 10 3 4.48% 4.18

56
BRITISH AMERICAN TOBACCO
2008 58.75
120.42
92.43 12 11 9.18% 6.71
2009 47.01
108.11
93.05 2 yrs 11 10 7.89% 6.72
2010 42.77
87.45
102.59 2 yrs 12 9 22.04% 6.74
2011 30.03
88.30
102.03 10 10 48.74% 6.83
2012 28.33
114.32
108.99 11 9 -3.62% 6.86
ATHI-RIVER MINING
2008 62.87
84.04
83.37 10 3 19.01% 6.5
2009 80.93
100.60
109.01 10 3 11.37% 6.71
2010 109.36
116.26
106.68 1 yr 10 3 15.94% 6.92
2011 82.71
125.28
93.39 9 3 37.16% 7.01
2012 61.77
114.19
148.10 1 yr 13 4 39.35% 7.13
CROWN BERGER
2008 77.37
90.51
140.00 3 yrs 7 2 14.13% 6.02
2009 57.24
90.94
113.99 3 yrs 5 2 7.35% 6
2010 55.27
72.74
83.07 5 2 21.05% 6.03
2011 53.76
74.31
93.23 5 2 27.50% 6.1
2012 52.91
73.15
69.34 5 2 14.33% 6.09

57
EAST AFRICA CABLES
2008 177.90
184.21
- 3 yrs 9 3 -27.75% 6.61
2009 140.06
63.90
- 3 yrs 9 4 -32.66% 6.36
2010 142.97
1,914.09
- 3 yrs 9 4 186.39% 6.7
2011 517.24
774.30
- 9 4 50.23% 6.88
2012 79.14
361.52
- 9 4 -54.63% 6.9
UNGA GROUP
2008 4.98
1.32
- 1 yr 9 3 23.13% 6.38
2009 3.54
0.99
- 9 3 23.20% 5.89
2010 3.40
1.05
- 9 3 -1.02% 5.87
2011 1.05
3.95
- 7 3 14.66% 6.2
2012 0.37
3.94
- 7 3 20.90% 6.51
EABL
2008 46.20
198.12
143.32 14 3 25.42% 7.22
2009 44.14
193.08
148.45 1 yr 14 4 5.91% 7.25
2010 53.78
192.40
67.19 13 4 10.34% 7.28
2011 57.45
217.12
70.33 1 yr 14 4 18.25% 7.4
2012 53.84
195.22
101.35 1 yr 16 3 23.67% 7.44
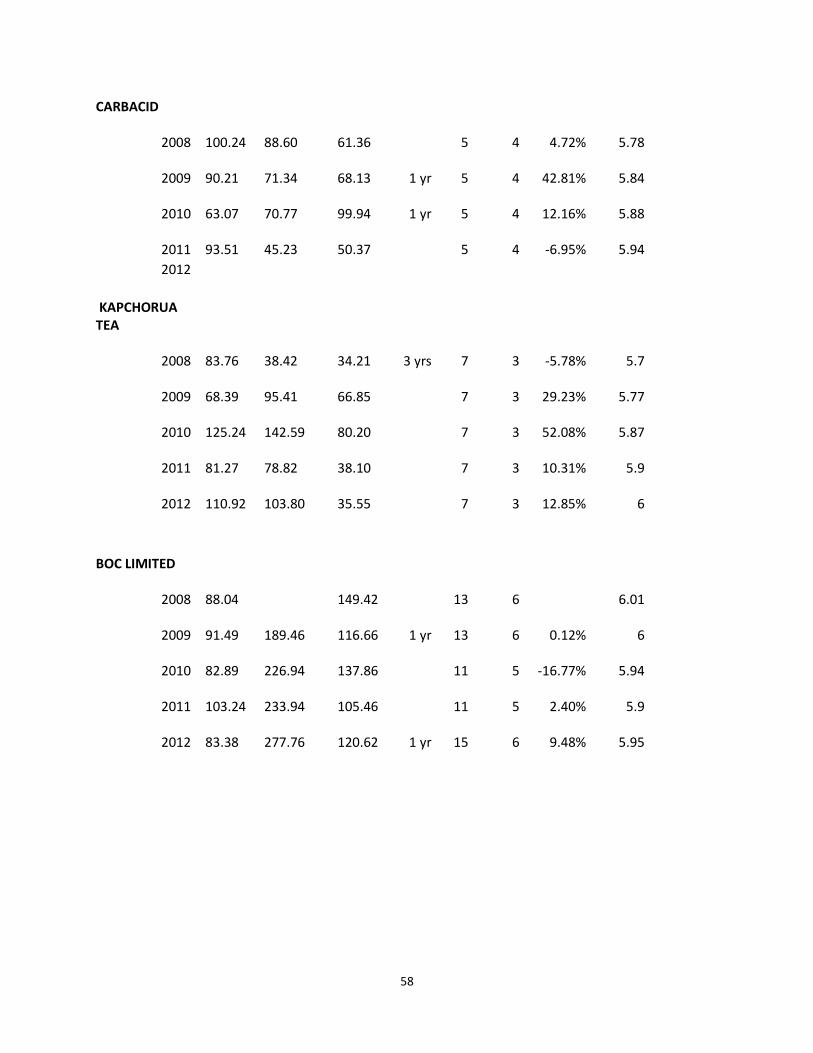
58
CARBACID
2008 100.24
88.60
61.36 5 4 4.72% 5.78
2009 90.21
71.34
68.13 1 yr 5 4 42.81% 5.84
2010 63.07
70.77
99.94 1 yr 5 4 12.16% 5.88
2011 93.51
45.23
50.37 5 4 -6.95% 5.94
2012
KAPCHORUA TEA
2008 83.76
38.42
34.21 3 yrs 7 3 -5.78% 5.7
2009 68.39
95.41
66.85 7 3 29.23% 5.77
2010 125.24
142.59
80.20 7 3 52.08% 5.87
2011 81.27
78.82
38.10 7 3 10.31% 5.9
2012 110.92
103.80
35.55 7 3 12.85% 6
BOC LIMITED
2008 88.04
149.42 13 6 6.01
2009 91.49
189.46
116.66 1 yr 13 6 0.12% 6
2010 82.89
226.94
137.86 11 5 -16.77% 5.94
2011 103.24
233.94
105.46 11 5 2.40% 5.9
2012 83.38
277.76
120.62 1 yr 15 6 9.48% 5.95

59
WILLIAMSON TEA
2008 40.32
37.54
16.19 3 yrs 8 6 -9.22% 6.01
2009 55.88
47.70
32.83 3 yrs 8 6 36.03% 6.01
2010 57.65
53.60
28.03 8 6 82.77% 6.14
2011 37.76
32.15
20.95 8 6 20.63% 6.21
2012 122.99
117.53
45.39 3 yrs 8 6 9.82% 6.56