the effect of consistent practice of yogic breathing exercises - cIRcle
98
THE EFFECT OF CONSISTENT PRACTICE OF YOGIC BREATHING EXERCISES ON THE HUMAN CARDIORESPIRATORY SYSTEM by Joshua Adam Alexander McKay B.Sc. University of Guelph, 2007 A THESIS SUBMITTED IN PARTIAL FULFILLMENT OF THE REQUIREMENTS FOR THE DEGREE OF MASTER OF SCIENCE in THE FACULTY OF GRADUATE STUDIES (Kinesiology) THE UNIVERSITY OF BRITISH COLUMBIA (Vancouver) April 2012 © Joshua Adam Alexander McKay, 2012
Transcript of the effect of consistent practice of yogic breathing exercises - cIRcle
THE EFFECT OF CONSISTENT PRACTICE OF YOGIC BREATHING EXERCISES ON THE HUMAN
CARDIORESPIRATORY SYSTEM
by
Joshua Adam Alexander McKay
B.Sc. University of Guelph, 2007
A THESIS SUBMITTED IN PARTIAL FULFILLMENT OF THE REQUIREMENTS FOR THE DEGREE OF
MASTER OF SCIENCE
in
THE FACULTY OF GRADUATE STUDIES
(Kinesiology)
THE UNIVERSITY OF BRITISH COLUMBIA
(Vancouver)
April 2012
© Joshua Adam Alexander McKay, 2012

ii
Abstract
Yogic breathing exercises (YBE) are complex breathing patterns that can include
hyperventilation, hypoventilation, and apnea. Some YBE can significantly alter blood
gases and result in hypoxic hypercapnia. The consequence of consistent practice of these
breathing exercises is unknown. Thus, the purpose of this Master’s thesis was to quantify
the cardiovascular, respiratory, and cerebrovascular effects of two common YBE:
bhastrika and chaturbhuj; and, to determine the effect of their consistent practice on
chemosensitivity. The first study was cross-sectional and compared experienced yogic
breathers (YB) with matched controls in the above categories. It determined three things.
First, bhastrika and chaturbhuj result in significant hypoxic hypercapnia. Second, the
increase in blood pressure during their practice was higher in experienced yogic
breathers. Third, experienced YB had reduced chemosensitivity compared to controls.
The second was a controlled, longitudinal training study where experimental subjects
practiced yogic breathing exercises for 6 weeks. This study had three major findings.
First, after 6 weeks of training, bhastrika and chaturbhuj produced hypercapnia and mild
hypoxia. Second, chaturbhuj resulted in cyclic oscillation of cardiovascular variables
including blood pressure, heart rate, stroke volume, and cerebral blood flow velocity with
inspiration and expiration. Third, post intervention there was no change in
chemosensitivity measures. The findings from these two studies demonstrate that YBE
significantly alter end-tidal gases, resulting in complex oscillations of cardiovascular and
cerebrovascular variables, and if practiced for the long term, may reduce
chemosensitivity.

iii
Preface Study 1 received ethical approval from the UBC Clinical Research Ethics Board (#H09-
03202). A version of Study 1 has been previously published in Abstract form as: J.A.A.
McKay, K. Stewart, J.S. Querido, G.E. Foster, M.S. Koehle, A.W. Sheel (2010). Long-
term practice of yogic breathing exercises may be associated with increased blood
pressure during breath-holds. Applied Physiology Nutrition and Metabolism. 35:S68. I
identified the research question, designed the study, analyzed the data, and wrote the
abstract for publication. Data collection was shared between K. Stewart and myself. M.S.
Koehle, G.E. Foster, and J.S. Querido assisted with study setup and data analysis. All
coauthors provided editorial feedback on the manuscript.
Study 2 received ethical approval from the UBC Clinical Research Ethics Board (#H10-
02374).
iv
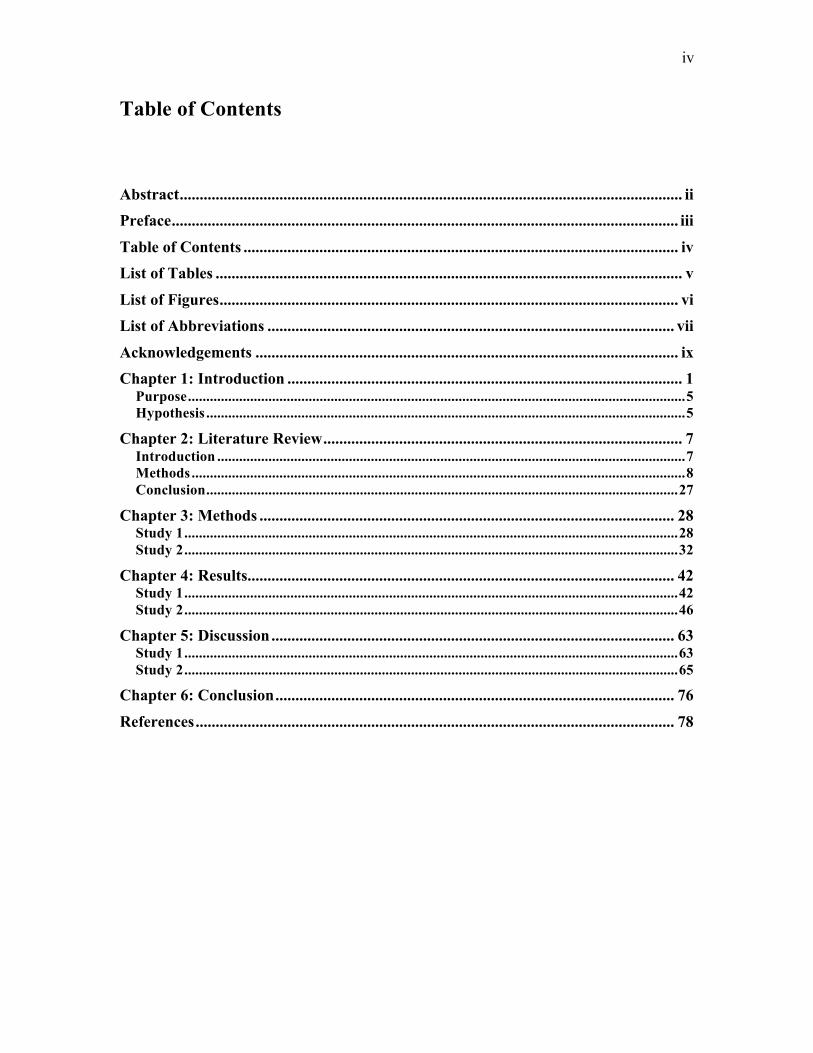
Table of Contents
Abstract .............................................................................................................................. ii Preface ............................................................................................................................... iii
Table of Contents ............................................................................................................. iv List of Tables ..................................................................................................................... v
List of Figures ................................................................................................................... vi List of Abbreviations ...................................................................................................... vii
Acknowledgements .......................................................................................................... ix Chapter 1: Introduction ................................................................................................... 1
Purpose ........................................................................................................................................ 5 Hypothesis ................................................................................................................................... 5
Chapter 2: Literature Review .......................................................................................... 7 Introduction ................................................................................................................................ 7 Methods ....................................................................................................................................... 8 Conclusion ................................................................................................................................. 27
Chapter 3: Methods ........................................................................................................ 28 Study 1 ....................................................................................................................................... 28 Study 2 ....................................................................................................................................... 32
Chapter 4: Results ........................................................................................................... 42 Study 1 ....................................................................................................................................... 42 Study 2 ....................................................................................................................................... 46
Chapter 5: Discussion ..................................................................................................... 63 Study 1 ....................................................................................................................................... 63 Study 2 ....................................................................................................................................... 65
Chapter 6: Conclusion .................................................................................................... 76
References ........................................................................................................................ 78

v
List of Tables Table 1. Characteristics of published YBE studies. ........................................................ 20 Table 2. Anthropometric and Spirometric data (means ± SD) at baseline and following
the intervention. ........................................................................................................ 47 Table 3. Cardiorespiratory variables (means ± SD) at rest and during Bhastrika. .......... 48 Table 4. Cardiorespiratory variables (means ± SD) at rest and during Chaturbhuj ........ 49

vi
List of Figures Figure 1. A visual representation of the study design.. ................................................... 34 Figure 2. Cardiorespiratory responses to bhastrika in an experienced YB.. ................... 43 Figure 3. Graphical illustration of the MAP response to bhastrika (A) and chaturbhuj (B)
in YB and CON.. ....................................................................................................... 44 Figure 4. Cardiorespiratory responses to chaturbhuj in an experienced YB. .................. 45 Figure 5. Cardiorespiratory responses to bhastrika ......................................................... 50 Figure 6. Cardiorespiratory responses to bhastrika ......................................................... 51 Figure 7. Cardiorespiratory responses to bhastrika ......................................................... 52 Figure 8. Cardiorespiratory responses to chaturbhuj ....................................................... 53 Figure 9. Cardiorespiratory responses to chaturbhuj ....................................................... 54 Figure 10. Cardiorespiratory responses to chaturbhuj ..................................................... 55 Figure 11. Baseline ventilation hypoxic Duffin re-breathe .............................................. 57 Figure 12. Baseline ventilation hyperoxic Duffin re-breathe .......................................... 58 Figure 13. Hypercapnic ventilatory threshold at baseline, week 5, and week 10 (means ±
SD). ........................................................................................................................... 59 Figure 14. Hypercapnic ventilatory sensitivity at baseline, week 5, and week 10 (means ±
SD). ........................................................................................................................... 60 Figure 15. Average MCAv (± SD) during the last 15 seconds of the Duffin re-breathe
tests. .......................................................................................................................... 61 Figure 16. Average MAP (± SD) response to bhastrika and chaturbhuj in weeks 5 and
10............................................................................................................................... 62 Figure 17. A model of the ventilatory response to hypoxia/hypercapnia and how the
practice of YBE may influence their feedback loops. .............................................. 69 Figure 18. Oscillations of SaO2, esophageal pressure (Peso), blood pressure, and
sympathetic nerve activity in response to sleep apnea in a single subject (Skatrud, 1999). ........................................................................................................................ 71

vii
List of Abbreviations BMI Body mass index bpm Breaths per minute or Beats per minute CBFV Cerebral blood flow velocity cm Centimeter (s) CO Cardiac output CO2 Carbon dioxide COPD Chronic obstructive pulmonary disease DBP Diastolic blood pressure DD Dyspnea related distress DI Dyspnea index EBT Eucapnic Butekyo breathing technique fb Breathing frequency FEV1 Forced expiratory volume in 1 second FYB Full yogic breath HCVR Hypercapnic ventilatory response HR Heart rate HVR Hypoxic ventilatory response kg Kilogram (s) L Litre (s) m Meter (s) MAP Mean arterial blood pressure MCAv Middle cerebral arterial blood velocity min Minute (s) mmHg Millimeters of mercury O2 Oxygen OSA Obstructive sleep apnea PaCO2 Arterial partial pressure of carbon dioxide PaO2 Arterial partial pressure of oxygen PCLE Pink city lung exerciser PEF Peak expiratory flow rate PETCO2 End-tidal partial pressure of carbon dioxide PETO2 End-tidal partial pressure of oxygen s Seconds SaO2 Oxyhaemoglobin saturation with pulse oximetry SBP Systolic blood pressure SD Standard deviation SV Stroke volume TCD Trans-cranial doppler TPR Total peripheral resistance VE Minute ventilation Vt Tidal volume

viii
YB Yogic breather (s) YBE Yogic breathing exercise (s)

ix
Acknowledgements
For their guidance and help throughout this project, I would like to thank my
committee: Dr. Bill Sheel, Dr. Michael Koehle, and Dr. Don McKenzie. Without my
fellow students, this project would have seemed impossible. Thank you to my lab mates
for help with everything from data collection to constructive and honest feedback. Thank
you to my subjects for committing to such a long study. Finally, thank you to Dr. Sheel
who pushed me to prove that this was a topic worth studying.

1
Chapter 1: Introduction
Control of breathing (pranayama) is one of the central teachings in classical yoga
(Hari Dass, 1999; Muktibodhananda, 2006). To focus the human mind, traditional yoga
texts instruct students to practice yogic breathing exercises (YBE). A single breath can
be partitioned into four parts: inspiration, internal breath-hold, expiration, and external
breath-hold. These four parts are combined, varied, and emphasized in different
combinations in all YBE (Saraswati, 2006). For example, in the YBE dirgha rechak: the
inspiration, internal breath-hold, and external breath-hold are the same as in a normal
breath, but the expiration is as long and slow as possible. In addition, YBE are designed
around four themes: hyperventilation, hypoventilation, breath-holds, and specific
respiratory muscle recruitment patterns. Arguably, the most important theme in YBE is
breath-holds (Muktibodhananda, 2006; Saraswati, 2006).
Recent research on YBE has shown that their practice can increase blood pressure
(McKay et al., 2010), and decrease the ventilatory response to low oxygen (hypoxic) and
high carbon dioxide (hypercapnic) environments (Spicuzza et al., 2000; Shannahoff-
Khalsa et al., 2004). However, there are significant gaps in the YBE literature. To date,
the majority of published studies on YBE are observational in nature and lack
quantification of type and amount (in days per week and hours per day) of YBE their
subjects practiced. Of the published YBE training studies, many do not include precise
interventions or control groups (Gokal et al., 2007; Donesky-Cuenco et al., 2009). For
example, Donesky-Cuenco et al. (2009) found that a 12 week yoga intervention
significantly increased 6 minute walk distance in chronic obstructive pulmonary disease

2
patients by 71.7 ± 21.8 feet. However, because the intervention included both YBE and
physical postures, there was no way to determine which part of the intervention was
associated with the change in walk distance. Furthermore, Gokal et al. (2007) followed
participants in a 1 week yoga retreat and claimed that the decreases in weight, blood
pressure, blood glucose, and blood cholesterol they reported were due to yoga and YBE
practice. However, they did not include a control group.
Much like experienced breath-hold divers, experienced yogic breathers (YB) can
endure extremely low levels of O2, and high levels of CO2. In a case study, Miyamura et
al. (2002) observed an experienced YB perform the YBE ujjayi at a breathing frequency
(fb) of 1 breath/minute for 1 hour. The subject’s end-tidal O2 (PETO2) and CO2 (PETCO2)
decreased to 62 mmHg, increased to 48 mmHg, respectively. Ujjayi is considered a
novice YBE in which students are instructed to breathe slowly and deeply through the
nose. During both the inspiration and expiration the glottis is slightly constricted so that
the breath can be heard passing along the back of the throat.
Experienced YB have also been shown to have lower hypercapnic ventilatory
sensitivity compared to control subjects. In the aforementioned case study, the
experienced YB hypercapnic ventilatory sensitivity was measured using the Read re-
breathing method and found to be 0.26 L/min/mmHg (Miyamura et al., 2002). This is
85% lower than the hypercapnic ventilatory sensitivity reported for control subjects in
another study (1.73 ± 0.84 L/min/mmHg) (Stanescu et al., 1981).
Stanescu et al. (1981) measured hypercapnic ventilatory sensitivity in 8
experienced YBE practitioners and 8 well matched controls. They found that
experienced YB were significantly less sensitive to CO2 than controls (0.70 ± 0.29

3
L/min/mmHg vs. 1.73 ± 0.84 L/min/mmHg, p < 0.05). Similarly, Spicuzza et al. (2000)
noted a reduction in hypercapnic ventilatory sensitivity and hypoxic ventilatory
sensitivity in a separate group of experienced yoga practitioners, however, specific
sensitivities were not provided in the research letter. These cross-sectional data suggest
that there may be a dose-response relationship among the total amount of YBE practiced,
and ventilatory sensitivity to hypoxia and hypercapnia. A well-controlled longitudinal
YBE training study may help to quantify the influence YBE have on hypoxic and
hypercapnic chemosenstivities.
During hypoxia and hypercapnia, the cardiovascular system operates in an
attempt to maintain homeostasis. The cardiovascular system responds to apnea by
reducing heart rate (bradycardia) and vasoconstricting the peripheral arteries (Grassi et
al., 1994; Daly, 1997). This response increases the amount of time before hypoxic
damage occurs by conserving oxygen for the brain and heart (Foster & Sheel, 2005). To
supply the brain with an adequate amount of oxygen in response to a hypoxic insult, there
is an increase in CBFV (Querido et al., 2008). CBFV also increases in response to
hypercapnia (Ivancev et al., 2007). However, in some pathological models, this response
is blunted. In obstructive sleep apnea (OSA) patients, the increase in CBFV in response
to hypercapnia is reduced (Foster et al., 2009).
OSA patients suffer repeated bouts of hypoxic hypercapnia throughout sleep due
to airway occlusion (Dempsey et al., 2010). During a normal inspiration, upper airway
dilators are activated to keep the upper airways open against rising inspiratory pressures.
During sleep in OSA patients, there is a reduction in muscular tone of the upper airway
dilators, specifically in the oropharynx. This results in a collapse of the airways when the

4
negative inspiratory pressure generated by the diaphragm, external intercostals, and other
recruited inspiratory muscles is greater than the tone keeping the airways open. When
this occurs, and in extreme cases it occurs 80 times an hour, despite repeated inspiratory
efforts, OSA patients become progressively hypoxic and hypercapnic (Dempsey et al.,
2010). In a healthy individual, hypoxic hypercapnia results in an increase in CBFV, but
in many OSA patients, this response is blunted (Placidi et al., 1998).
The reason the CBFV response is blunted in OSA patients is not fully understood.
Originally, it was thought that it was due to chronic intermittent exposure to hypoxic
hypercapnia, however, now there is evidence that the blunted CBFV response in OSA
patients is due to co-morbidities associated with the condition (Selim et al., 2008). This
theory is supported by research on breath-hold divers (Joulia et al., 2009). Breath-hold
divers are exposed to hypoxia and hypercapnia on a regular basis and their CBFV
response to hypercapnia is unchanged (Ivancev et al., 2007). However, comparisons
between pathological reductions in O2, and increases in CO2, and voluntary apnea are
difficult to make.
The literature lacks studies that have quantified the acute effects of YBE on
human physiology. The physiological changes that occur during specific YBE need to be
measured to determine if consistent practice of YBE correlates with measureable changes
in cardio-respiratory physiology. Further study in this research area is necessary to
further our understanding of the effects of YBE. The effect YBE may have on
cerebrovascular reactivity to hypoxia and hypercapnia has not yet been investigated. By
learning the cardiorespiratory and neurological effects of each YBE, it may be possible to

5
determine a prescription of YBE for a desired physiological effect such as reducing HR,
blood pressure, or increasing CBFV in OSA patients.
Purpose
The purpose of this Master’s thesis was four-fold. First, to measure the changes
in cardiovascular, cerebrovascular, and respiratory variables during the practice of two
YBE, bhastrika, and chaturbhuj. Second, to determine if long term practice of YBE
affected hypercapnic ventilatory threshold and sensitivity. Third, to determine if regular
practice of YBE for 6 weeks was a sufficient stimulus to decrease hypercapnic
ventilatory sensitivity and increase hypercapnic ventilatory threshold. Fourth, to
determine if the practice (either long term or 6 weeks) of YBE changed the response of
cardiovascular, cerebrovascular, and respiratory variables during the same YBE.
Hypothesis
The hypothesis was five-fold. First, it was hypothesized that during both
bhastrika, and chaturbhuj, PETO2 would decrease and PETCO2 would increase, resulting
in a hypoxic, hypercapnic stimulus. Second, it was hypothesized that subjects
experienced in YBE would have decreased hypercapnic ventilatory sensitivity and
increased hypercapnic ventilatory threshold when compared to controls. Third, it was
hypothesized that a 6 week intervention of 5 times weekly practice of YBE would result
in decreased hypercapnic ventilatory sensitivity and increased hypercapnic ventilatory
threshold – both measured by the Duffin re-breathing method – and increased breath-hold
time. Fourth, it was hypothesized that the CBFV response to hypercapnia would be

6
unchanged after the intervention. Fifth, based on data from Study 1 (Chapter 3, Figure
2), it was hypothesized that MAP would increase more in response to bhastrika and
chaturbhuj after the 6 week intervention.

7
Chapter 2: Literature Review
Introduction
For many years in India, and currently in the Western world, yogic breathing
exercises (YBE) have been used with varying success for the treatment of chronic
physiological and psychological disorders such as asthma, chronic obstructive pulmonary
disease and depression (Cooper et al., 2003; Brown & Gerbarg, 2005; Pomidori et al.,
2009). People practice YBE with different goals in mind; some for the purpose of
relaxation and spiritual gain, others with the hope that YBE will provide physiological or
psychological benefit. YBE are designed around four themes: hyperventilation,
hypoventilation, breath-holds, and specific respiratory muscle recruitment patterns.
Though comparatively little research has been done on the physiological effects of
specific YBE, there has been much research on the physiological effects of both
hypoventilation and apnea in other populations. Breath-hold divers, underwater hockey
players, and sleep apnea patients regularly experience repeated bouts of apnea and
hypoventilation. This review will use these, and other well-studied populations to
provide insight into the physiological adaptations that may occur with long-term practice
of YBE.
Breath-hold divers can withstand breath-holds to arterial oxygen (PaO2) levels as
low as 28 mmHg and arterial carbon dioxide (PaCO2) levels above 55 mmHg. In
comparison, most non-divers can only endure to a PaO2 of 45 mmHg and PaCO2 of 50
mmHg (Ferretti, 2001). Physiologically, this 17 mmHg difference in PaO2 corresponds
to two very different arterial oxyhaemoglobin saturations (SaO2: ~ 53%, and 81%
respectively) because of the shape of the oxygen-hemoglobin dissociation curve

8
(Severinghaus, 1979; West, 2005). In addition to extreme levels of mental fortitude,
enduring a breath hold until SaO2 falls below 60% requires many physiological changes
that this review will discuss.
The purpose of this review is fourfold. First, to provide a complete definition of
YBE. Second, to examine the physiological effects of YBE on the human
cardiorespiratory system and provide insight into their clinical effectiveness or absence
thereof. Third, to examine the effects of other repeated apnea models such as breath-hold
diving and obstructive sleep apnea on hypoxic (HVR) and hypercapnic (HCVR)
ventilatory response and threshold, blood pressure and heart rate regulation, and middle
cerebral artery blood velocity (MCAv). Finally, this review aims to provide a clear
direction for further research on YBE.
Methods
YBE research for this review was compiled from the MEDLINE database (1950 -
2010), the American Physiological Society (1948 – 2010), and the Journal of Alternative
and Complimentary Medicine (1998 – 2010). Searches were performed using both
MeSH (Medical Subject Headings) terms, and text keywords. MeSH terms included:
yoga, respiration, and breathing exercises. Keyword searches were combined with
Boolean operators and included the truncated keywords: yog*, breath*, and pranayam*.
Traditional information and theories were researched in English translations of Indian
texts where YBE are described (Muktibodhananda, 2006) and in more recent publications
(Hari Dass, 1981; Saraswati, 2006).
9
Defining yogic breathing exercises
The traditional name for YBE, pranayama, comes from the Sanskrit language and
can be broken down into three parts: prana, yama, and ayama. Prana is translated in the
yoga sutras as the “vital energy” that animates all things (Hari Dass, 1999). Yama means
“control” or “restraint,” and ayama means “expansion.” Together, pranayama means
“the control and expansion of vital energy” (Saraswati, 2006). The traditional purpose of
pranayama practice was not to simply increase breath hold time. The yoga sutras – the
original Indian text outlining the practices of yoga – explain that by developing control of
the breath, one develops control of the mind (Hari Dass, 1999). This section will explain
the foundations of YBE and provide their inclusive definition.
The full yogic breath (FYB)
The respiratory muscle recruitment pattern during a full yogic breath (FYB) is
important to understand because the majority of YBE use the FYB. The FYB is most
simply described as a full, deep inspiration followed by a full deep expiration. Though it
is not possible for someone to choose which part of the lung they ventilate, it may be
possible for them to choose the respiratory muscles activation pattern. For example, by
moving the chest up and keeping the abdomen in the same place during inspiration, the
majority of the inspiratory work would be done by the external intercostal muscles and
the sternocleidomastoid. When taught by a yoga instructor, the inspiratory portion of the
FYB is separated into three phases. First, subjects are instructed to activate the
diaphragm with the cue “Inhale into the bottom of the lungs by pushing the stomach out.”
Next, subjects are instructed to “Continue the inhale into the middle portion of the torso

10
by expanding the lower rib cage.” Finally, subjects are instructed to “Fill the top of the
lungs by expanding the chest up and out.” After a short pause, subjects expired with the
instructions “Relax the upper chest, then the ribcage, and finally pull the abdomen in
slightly.” A common analogy that was used when teaching the FYB was the filling and
emptying of a jar (lungs) with water (air). The jar always fills from the bottom to the top,
and always empties from the top to the bottom. The FYB is done through the nose.
Though students are taught to visualize a FYB cycle in this manner, we have yet to find
published data that confirms their ability to selectively ventilate the upper and lower
sections of the lung.
Three traditional YBE
This section will describe three common traditional YBE: chaturbhuj, bhastrika,
and ujjayi. Chaturbhuj is a hypoventilation breathing pattern that uses the FYB. During
which, the breath is divided into four equal parts: inspiration, breath-hold, expiration,
breath-hold. Each part is performed for equal amounts of time, resulting in an
inspiration:breath-hold:expiration:breath-hold ratio of 1:1:1:1. Preliminary data on the
cardiorespiratory and cerebrovascular changes that occur during chaturbhuj and
bhastrika from this lab are shown above (Figures 2, 3).
Bhastrika, translated as “breath of fire,” or “bellows breath,” is one of the most
common YBE used today (Muktibodhananda, 2006; Saraswati, 2006). It is important to
note that the term bhastrika is used in the published literature to describe more than one
YBE. For the purposes of this review, the term bhastrika will be used to describe a YBE
that is: one to two minutes of “abdominal hyperventilation” through the nose followed by

11
an inspiration to TLC and maximal breath-hold. The breathing pattern used in bhastrika
is different than the FYB described above. Bhastrika’s “abdominal hyperventilation”
breath is simply the first step of the FYB inspiration followed by a forceful exhale
through the nose.
Ujjayi is a beginner YBE that doesn’t require a specific inspiration:expiration
ratio or a FYB. Students are instructed to inspire through the nose and to expand the
stomach by activating the diaphragm. Additionally, during both the inspiration and
expiration, the glottis is closed slightly so that the breath can be heard passing along the
back of the throat. Ujjayi is a very common YBE that is most often used in asana (yoga
posture) classes to generate heat in the body. Though data on the effect of ujjayi on body
temperature has not been published, based on other research it seems possible to raise
body temperature while sitting still. Previously, three advanced Tibetan monks were able
to increase their body temperature (+ 8°C measured at the toe) during a Tibetan
meditation practice (Benson et al., 1982).
Defining YBE YBE have previously been defined as breathing practices where the time spent
expiring is twice the duration of the time spent inspiring (inspiratory:expiratory ratio of
1:2) (Singh et al., 1990; Cooper et al., 2003). This definition encompasses only a small
portion of the many different YBE. YBE are designed around four themes:
hyperventilation, hypoventilation, breath-holds, and specific respiratory muscle
recruitment patterns (Muktibodhananda, 2006; Saraswati, 2006). Additionally, each
breath can be subdivided into four parts: inspiration, internal breath-hold, expiration, and

12
external breath-hold. These four parts are combined, varied, and emphasized in different
combinations in all YBE (Saraswati, 2006). With the exception of ujjayi, which can be
practiced during yoga postures, YBE are done in a seated position.
Lessons learned from other models of apnea and timed breathing patterns This section will focus on apnea models and timed breathing exercises other than
YBE. It will also outline the cardiovascular and cerebrovascular responses to apnea in
underwater sportsmen. Examination of these models will provide insight into the
potential physiological effects of apnea-focused, and hypoventilatory YBE.
The Pink City Lung Exerciser (PCLE) and The Eucapnic Butekyo Breathing Technique (EBT)
Most of the research that examines the effect of breathing exercises on symptom
reduction in mild asthmatics focuses on inhaler devices that claim to mimic YBE, such as
the PCLE. The PCLE is a plastic mouthpiece with an adjustable aperture. There is a
one-way valve that opens at the onset of inspiration and closes at the onset of expiration,
halving the diameter of the tube during expiration.
Previous researchers found that after using the PCLE twice a day for 2 weeks,
mildly asthmatic patients increased the dose of histamine necessary to provoke a 20%
reduction in their forced expiratory volume in 1 second (FEV1), a reduction comparable
to a low-dose of inhaled cortical steroids (Singh et al., 1990). To specify, the asthmatics
in this study were not classified as sufferers of exercise-induced or allergenic asthma.
They all had FEV1 values greater than 60% of predicted, and the dose of histamine

13
required to decrease FEV1 by 20% was less than 4µmol. Following the PCLE
intervention, resting FEV1, peak expiratory flow rate, symptom score, and inhaler use
were not different between groups, but the authors suggest that this may be because the
subjects were only mildly asthmatic.
Another explanation focuses on the device itself. Halving the expiratory diameter
does not guarantee a doubling of the time spent expiring. In fact, Poiseuille’s law states
that flow through a tube is proportional to radius to the 4th power (West, 2005). It follows
then, that if the radius of the PCLE is halved, and expiratory pressure does not increase,
then the flow rate would be 16 times slower during expiration – not two times.
Additionally, if the intervention claims to reduce minute ventilation (VE) through
breathing frequency (fb), then both fb and tidal volume (Vt) need to be measured to
confirm that subjects are not compensating for the smaller airway diameter by breathing
deeper or more frequently.
A more recent PCLE 6-month intervention study used both the PCLE and the
EBT. This study found no difference in asthma outcome measures between the PCLE and
placebo group. However, they did notice a reduction of β2-agonist use in the EBT group
vs. both the placebo and PCLE groups respectively (Cooper et al., 2003). The PCLE
does not accurately recreate YBE for two reasons. First, breath-holds are arguably the
most important part of any YBE routine and practice with the PCLE does not include
apnea. Second, increasing expiratory duration is part of many YBE, however, expiratory
resistance rarely changes. More research needs to be done on the PCLE to first determine
the exact ratio of time spent inspiring to time spent expiring.

14
The EBT is a breathing technique very similar to YBE that includes slow, shallow
breathing and breath-holds. It was developed by Konstantin Buteyko to help reduce
asthma symptoms through a reduction in VE. He theorized that chronic hyperventilation
led to hypocapnia, which caused the airways to constrict in order to conserve CO2
(Bruton & Lewith, 2005). In a study by (Cooper et al., 2003), subjects were instructed to
use the EBT twice a day, and as a tool to relieve asthma symptoms instead of an inhaler.
Subjects recorded breath-hold time and practiced breathing exercises that reduced both
their fb and Vt. Additionally, subjects were instructed to tape their mouth shut at night to
reduce mouth breathing, avoid strenuous exercise, and to avoid highly processed foods.
All of these changes resulted in the reduced β2-agonist use noted above. In contrast, the
PCLE group used the device twice daily for 15 minutes with no significant difference in
any measure after the intervention (Cooper et al., 2003).
Cardiovascular and cerebrovascular responses to apnea
As the duration of apnea or hypoventilation increases, the human body becomes
increasingly hypoxic and hypercapnic. During these practices, the cardiovascular system
works to keep the human body in homeostasis. The purpose of all the cardiovascular
responses to apnea have the same purpose – to conserve oxygen for the brain and the
heart while increasing the amount of time before hypoxic damage occurs (Foster & Sheel,
2005). The two major cardiovascular changes that occur during apnea to accomplish this
goal are a reduced heart rate (bradycardia) and peripheral vasoconstriction, (Grassi et al.,
1994; Daly, 1997). Bradycardia preserves O2 stores by effectively decreasing the amount
of work done by the heart and therefore decreasing its oxygen uptake (VO2) (Foster &

15
Sheel, 2005). Cardiac output is the product of heart rate and blood pressure, and it
follows that peripheral vasoconstriction serves two purposes. First, it preserves
oxygenated blood and reduces whole body VO2 by reducing blood flow to the skeletal
muscles, skin, and visceral system. Second, it preserves cardiac output during
bradycardia. Both of these cardiovascular responses result in a larger pool of O2
available for the heart and brain, which would increase breath-hold time and the time
before tissue damage occurs.
During static apnea, the HR of trained breath-hold divers dropped an average of
25% (80 bpm to 60 bpm) during the first 2 and a half minutes of apnea (Lindholm et al.,
2006). Another study compared elite breath-hold divers with matched controls in their
cardiovascular response to maximal static apnea and found similar results. Elite divers’
HR dropped from 78 bpm at rest to 61 bpm after 2 minutes of static apnea and remained
unchanged until inspiration, whereas the HR of controls did not change. Additionally,
cerebral blood flow, measured at the carotid artery, increased almost 3-fold in the divers
(approximately 0.2 L/min to 0.6 L/min from rest to end apnea), and did not change in the
control group (Joulia et al., 2009). This study found that at the same apnea duration,
breath-hold divers had larger increases in cerebral blood flow with smaller decreases in
SaO2. No data on CO2 levels during apnea was presented (Joulia et al., 2009). Although
CO2 is thought to be the primary determinant of changes in cerebral blood flow
(Przybylowski et al., 2003), the vascular response to apnea, mental state, and sympathetic
nerve activity may also play a role in cerebrovascular regulation (Joulia et al., 2009).
In healthy subjects, hypercapnic re-breathing tests resulted in increased middle
cerebral artery blood velocity (MCAv) (52.52 ± 11.84 to 86.45 ± 16.02, P < 0.05)

16
(Ivancev et al., 2009). This response is preserved in breath-hold divers (Ivancev et al.,
2007). Interestingly, obstructive sleep apnea (OSA) patients who also endure hypoxia
and hypercapnia for extended periods of time, tend to have decreased cerebrovascular
reactivity – a smaller increase in cerebral blood velocity in response to hypoxia and
hypercapnia (Placidi et al., 1998; Foster et al., 2009). Though both groups endure
hypoxic hypercapnia, breath-hold divers endure a second stimulus when diving to depth;
they experience hyperoxic hypercapnia due to hydrostatic pressure. This environmental
difference may explain part of the difference in cerebrovascular reactivity. However,
more plausible is the difference in body mass index (BMI) between these groups. OSA is
highly correlated with obesity (BMI > 30), whereas breath-hold divers are typically not
obese (BMI 20 – 25) (Gold et al., 1993; Grassi et al., 1994; Delapille et al., 2001). A
recent study in rats demonstrated that obesity and hypertension were associated with
decreased lumen diameter in the middle cerebral artery (MCA) due to increased
cerebrovascular myogenic tone and inward remodeling (Osmond et al., 2009). In
humans, obesity, independent of hypertension was associated with decreased cerebral
blood velocity, and increased cerebrovascular resistance (Selim et al., 2008). There have
yet to be any studies examining cerebrovascular reactivity in experienced yogic breathers
(YB).
Physiological control of ventilation
The physiological effects of YBE cannot be explained without considering
ventilatory control. Originally, it was thought that ventilation was controlled by two
separate systems – the peripheral and central chemoreflexes – which responded

17
independently to oxygen (O2) and carbon dioxide (CO2) respectively. It is now evident
that the chemoreflex systems are mutually dependent (Duffin & Mahamed, 2003; Day &
Wilson, 2007). As a whole, the human chemoreflex system is made up of three parts:
sensors, effectors, and the central controller. The peripheral chemoreceptors are located
at the bifurcation of the carotid artery in the carotid body, and in the aortic arch. Their
primary job is to measure the amount of O2 in arterial blood. Animal denervation studies
have shown that the hypoxic ventilatory drive originates solely from the peripheral
chemoreceptors (Izumizaki et al., 2004). Recent work has shown that the carotid
peripheral chemoreceptors also contribute approximately one third of the total HCVR
while the central chemoreceptors contribute the other two thirds (Forster et al., 2008).
The peripheral chemoreceptors relay information through the 9th cranial nerve to the
respiratory centres in the medulla for integration (West, 2005).
The central chemoreceptors are surrounded by the brain extracellular fluid and are
anatomically located just below the ventral surface of the medulla in the brainstem,
adjacent to the cerebrospinal fluid (CSF). They are sensitive only to CO2. As blood
levels of CO2 rise, CO2 diffuses through the blood brain barrier and brain extracellular
fluid, into the CSF causing increased H+ concentration and decreased pH in the CSF.
The central chemoreceptors respond to decreased pH with increased firing (West, 2005).
There are two systems of “higher control,” the brainstem and the cortex. The
neurons in the brainstem are responsible for the involuntary, periodic nature of
inspiration and expiration. Based on information from the chemoreceptors, they can
increase or decrease their firing rate through the phrenic nerve to regulate ventilation. To
a point, signals from the cortex can override the brainstem to produce voluntary changes

18
in ventilation such as hyper/hypoventilation and prolonged apnea (West, 2005) (Ferretti,
2001). This is important in YBE because ventilation is voluntarily controlled.
Duffin and colleagues have extensively researched human ventilatory sensitivity
to PaCO2 and PaO2. Though complex and quite variable (up to 27% within subjects
(Koehle et al., 2005)), the relationship between PaCO2 and ventilation is linear past the
hypercapnic ventilatory threshold. This threshold is well defined in many review articles
(Duffin et al., 2000; Duffin & Mahamed, 2003). Briefly, the hypercapnic ventilatory
threshold is the PaCO2 above which, there is a measurable increase in ventilation. This
threshold is not static: in hypoxia it decreases, and in hyperoxia it increases (Duffin et al.,
2000). The same relationship occurs with hypercapnic ventilatory sensitivity.
Hypercapnic ventilatory sensitivity can be modified with apnea or intermittent
hypoxia (IH) (repeated bouts of exposure to low oxygen levels) training. Underwater
hockey players and breath-hold divers have reduced hypercapnic ventilatory sensitivities
when compared to above water athletes (55% and 77% vs. controls, respectively (Davis
et al., 1987; Delapille et al., 2001)). Lacking in the literature is measurement of the
hypercapnic ventilatory threshold in underwater sportsmen and YBE practitioners.
Intuitively, repeated exposure to hypoxia and hypercapnia should result in acclimation to
the stimuli, and a reduced physiological response. However, following one week of IH
exposure for 60 minutes at 12% O2 per day, the hypercapnic ventilatory threshold
decreases – subjects began to increase ventilation at lower levels of PaCO2 (Mahamed &
Duffin, 2001; Koehle et al., 2007).
Research has shown that there are two breaking points during a breath-hold: the
physiological break point, and termination of the breath-hold (Lin et al., 1974), which

19
may be psychological rather than physiologic. The physiological break point occurs
when the subject begins to make involuntary ventilatory movements and continuation of
the breath-hold requires increasing inhibitory input from the cortex. This process is
common in YBE that incorporate breath holds and it would be interesting to learn which
breaking point adapts more as breath-hold time increases.
The physiological effects of YBE and other breathing patterns
This section will examine the intervention studies that have used traditional YBE,
and other breathing exercises, as stimuli, and measured their effect on human physiology.
A summary of relevant studies is shown in Table 1. Though there are many studies that
have found YBE to be effective in the treatment of stress, depression, and other mental
disorders ((Shannahoff-Khalsa & Beckett, 1996; Naga Venkatesha Murthy et al., 1998;
Brown & Gerbarg, 2005), the remainder of this review will focus on the proposed
physiological benefits of YBE.

20
Table 1. Characteristics of published YBE studies
The FYB
People who practice YBE tend to have slower and deeper resting breathing
patterns than controls – matched for age, weight, and body surface area – because they
use the FYB muscle recruitment pattern (Spicuzza et al., 2000). Following one month of
respiratory training, the FYB has been shown to increase SaO2 at fb of 6 bpm, compared
to spontaneous breathing in chronic heart failure (CHF) patients. In this study, VE was
unchanged between spontaneous breathing and FYB at a fb of 6 bpm. The reason is
reduced deadspace; the dead space VE : Vt ratio decreased from 38.7±2.0 to 25.9±1.5, P <
0.05. The FYB effectively ventilated more of the lung while moving the same amount of
air. This was confirmed with alveolar ventilation data (Bernardi et al., 1998). These
effects are significant on both a statistical and practical level. The experimental group

21
also increased peak wattage achieved, and whole-body VO2 in a cycle ergometer exercise
test (Bernardi et al., 1998). This is promising for patients who are affected by respiratory
disorders such as chronic obstructive pulmonary disease (COPD) and asthma.
Another study (Pomidori et al., 2009) that looked at the effect of FYB in patients
who suffered from moderate to severe COPD supports the above CHF study (Bernardi et
al., 1998). The authors found that without changing minute ventilation, the FYB
increased resting SaO2 and reduced fb; confirming that the FYB produces a deep,
efficient, and slow breathing pattern. This group also noted an interesting correlation; the
patients who desaturated the most during the 6-minute walk distance test had the largest
increase in SaO2 during the FYB (r = 0.78). These data suggest that COPD patients who
experience the most arterial O2 desaturation and dyspnea during daily activities may
experience the largest benefit from using the FYB breathing pattern.
These findings are consistent with the literature on pursed lip breathing. Pursed
lip breathing is commonly used with COPD patients. Patients inspire through the nose,
and then expire slowly through pursed lips. Several studies have shown that this
breathing pattern results in increased SaO2, decreased fb, unchanged VE, and significant
dyspnea relief in some COPD patients with varying degrees of severity (Dechman &
Wilson, 2004). Positive effects of pursed lip breathing are thought to be due to decreased
fb, while the pursing of the lips just a method for the reduction (Thoman et al., 1966).
The patients who were unrelieved did not experience tracheobronchial collapse during
expiration whereas the relieved patients did (Ingram & Schilder, 1967). The pursed lip
breathing pattern most likely improves dyspnea by reducing airway constriction during
expiration because of decreased expiratory flow rate.

22
Interventions using both YBE & yoga postures
Another study on COPD patients found that a 12 week intervention of yoga
postures (stretching, twisting, balance and strengthening poses) and simple YBE –
inspiration:expiration ratio of 1:2 - had no effect on feelings of breathlessness (dyspnea
index (DI) and dyspnea related distress (DD)) (Donesky-Cuenco et al., 2009). DI and
DD were assessed using the questions “how short of breath are you right now?” and
“how bothersome or worrisome is your shortness of breath to you right now?”
respectively, and rated numerically using a modified Borg scale during cycle ergometer
exercise. Similar to the study by Pomidori et al., (2009) study, a significant change noted
in the treatment group was an increased distance covered in the 6-minute walk test
(Donesky-Cuenco et al., 2009). Whether the increase in physical capacity was due to the
YBE, the postures, or both, cannot be determined because the control group practiced
neither the YBE nor the postures. The authors postulate that the reason no changes were
seen in DI or DD may be because their intervention was too mild.
With a large study population of patients with diabetes, hypertension, obesity, and
dyslipidemia, (Gokal et al., 2007) reported that a one week long yoga retreat where
participants practiced YBE, postures, and meditation, resulted in statistically significant
positive changes in BMI, mean arterial pressure (MAP), blood glucose, and cholesterol
levels. Though positive, these results are not conclusive and need to be carefully
interpreted. A one-week yoga retreat is very much a short-term lifestyle change. Food is
sometimes provided, and participation in classes is voluntary. The ‘intervention’
experienced by each person would be unique. Also, lacking a control group, it was not
23
possible for the authors to determine which part of the intervention was responsible for
the positive outcome (Gokal et al., 2007).
Cardiorespiratory adaptations to traditional YBE
The limited research on the effects of YBE on arterial blood gasses suggest that
much like experienced breath-hold divers, experienced YBE practitioners can endure
extremely low levels of O2, and high levels of CO2. In a case study, (Miyamura et al.,
2002) observed an experienced YBE practitioner perform ujjayi at a fb of 1 breath/minute
continuously for 1 hour. End-tidal O2 (PETO2) and CO2 (PETCO2) reached extreme values
of 62 and 48 mmHg, respectively. Contrary to the diving response to hypoxia and
hypercapnia, the subjects HR increased from 69 to 75 bpm, perhaps due to the length of
the practice. The subjects HCVR was measured using the Read re-breathing method and
found to be quite low (0.26 l/min/mmHg). Similar results were found by (Stanescu et al.,
1981), who measured HCVR in 8 experienced YBE practitioners and 8 controls. He
found that experienced yogic breathers were significantly less sensitive to CO2 than
controls (0.70 ± 0.29 l/min/mmHg vs. 1.73 ± 0.84 l/min/mmHg, p < 0.05). The
difference in HCVR between Miyamura’s and Stanescu’s experienced practitioners is
most likely due to their experience levels. Although, Miyamura’s experiment was a case
study, the subject had reportedly been practicing YBE for 19 years, 2 to 2.5 hours per
day. Stanescu’s experienced practitioners were reported to have been practicing YBE for
4 to 12 years, but the duration per day was unclear, Stanescu reports “up to 2 hours per
day.” Similarly, (Spicuzza et al., 2000) noted a reduction in HCVR and HVR in
experienced yoga practitioners compared to controls, however, specific slopes were not
24
provided in the research letter. Though these data suggest that there may be a dose
response relationship between the length of time and amount of YBE practiced, and
hypercapnic chemosensitivity, studies examining the physiology of extreme YBE
practitioners such as the one in Miyamura’s study are rare; most likely due to the scarcity
of such advanced practitioners.
VO2 can change during YBE, though the direction and magnitude depend on the
specific YBE. In a recent study it was found that a 1:4:2 inspiration:breath-
hold:expiration ratio resulted in increased VO2 compared to both rest and meditation
(Danucalov et al., 2008). However, a major limitation of this study was that they did not
report Vt, fb, or VE data. Without that data, it is impossible to know the degree to which
subjects hyper-or-hypoventilated during the YBE.
Altitude is a hypobaric, hypoxic stimulus and acute exposure usually results in
increased ventilation (Bernardi et al., 2001). A study comparing yoga trainees to
matched controls examined the cardiorespiratory changes that accompanied simulated
altitude to 5000m (Bernardi et al., 2001). At 5000m and the same or lower VE, the yoga
trainees had higher SaO2 in three cases: spontaneous breathing, controlled breathing at 15
bpm, and during the FYB. Interestingly heart rate and blood pressure variability were
measured as indices of SNS activation. SNS activity increased at altitude, but the
response was blunted in the yoga trainees and during controlled breathing and the FYB in
both groups.
Another study (Pramanik et al., 2009) looked at the possible effects of
“bhastrika” on the parasympathetic nervous system (PNS) by measuring cardiovascular
variables during the YBE with and without ingestion of hyoscine-N-butyl bromide – a

25
proven parasympathetic blocking drug (Bittiner & Smith, 1986). It is important to note
that the YBE used in this study is different than the bhastrika described in section 3.2.
The YBE described in the cited study is a slow inhale of 4 seconds, followed by a slow
exhale of 6 seconds, resulting in a fb of 6 bpm. To refresh, bhastrika is a YBE that
begins with a 1 minute hyperventilation, followed by a maximal inhale to TLC, and then
a maximal breath-hold. They hypothesized that YBE decreased blood pressure through
increased PNS output. Under normal conditions, they found that 5 minutes of 6 bpm
breathing lowered MAP. After a dose of the PNS blocking drug, the same YBE was not
accompanied by a reduction in MAP (Pramanik et al., 2009). This data shows if you
remove PNS activity, MAP does not change in response to this YBE. It does not
however, prove that under normal conditions, this YBE reduces MAP through increased
PNS output. Sympathetic activity was not measured though it directly affects MAP
through arterial vasoconstriction (Mohrman David E., 2006). This would have been
beneficial as earlier research found that SNS activity is blunted during slow breathing
(Bernardi et al., 2001). Further study needs to examine both nervous systems to
determine the degree to which both play a role in blood pressure regulation in YBE.
(Shannahoff-Khalsa et al., 2004) conducted a case study on the hemodynamic
changes that occurred during an intermediate, 1 bpm YBE. The pattern was 20 seconds
of inspiration followed by a 20 second breath-hold, and then a 20 second expiration,
repeated for 31 minutes. They found that MAP, and HR cycled with the breath during
the YBE and the cycling pattern continued for 10 minutes post-test. This continuation
suggests that the pattern generators in the cardiorespiratory control centre of the
brainstem were altered by the 20:20:20 breath. Further research is needed to determine if

26
this adaptation is first, consistent between subjects, second, occurs at breathing
frequencies higher than 1 breath per minute, and third, if it would be beneficial for
patients with cardiac arrhythmias.
Recently, a case report was published describing spontaneous pneumothorax in an
otherwise healthy 29 year-year-old woman one day after performing kapal bhati YBE
(Johnson et al., 2004). This introductory YBE is a shallow, rapid, repeated breath
through the nose. The pattern begins with a forceful expiration from about half of TLC.
During the expiration, the abdomen is pulled in towards the spine. At the end of the
expiration, the abdomen is relaxed which results in an inhalation, back to about half of
TLC. The case report does not offer any hypotheses to the method of this pneumothorax.
Contra-indications for the practice of kapal bhati include: heart disease, high blood
pressure, vertigo, epilepsy, stroke, hernia, or gastric ulcer (Saraswati, 2006). This is the
only published case associating YBE with clinical problems.
Future directions
Primary to continued research on the effect of YBE on human physiology is
quantification of the stimulus. The physiological changes that occur during specific YBE
need to be measured to determine if consistent practice of YBE correlates with
measureable changes in cardio-respiratory physiology. Further study in this research area
is crucial to our understanding of the effects of YBE. By learning the exact
cardiovascular, respiratory, and neurological effects of each YBE, it may be possible to
determine a prescription of YBE for a desired physiological effect such as reducing
dyspnea, HR, blood pressure or increasing cerebrovascular reactivity in OSA patients.

27
Conclusion
Though the practice of YBE has been associated with decreased ventilatory
sensitivity to hypoxia (Spicuzza et al., 2000) and hypercapnia (Miyamura et al., 2002),
preliminary research using YBE in clinical populations has yet to meet with great
success. Due to limited research on the physiological changes that occur during specific
YBE, the reliance on small groups, cross-sectional study designs, and a lack of suitable
control groups, the effects of YBE on human physiology are still quite unclear. Further
study and refinement of the interventions may help to determine specific combinations of
YBE that are effective interventions for asthmatics, COPD sufferers, and OSA patients.
Additionally, to be able to prescribe these practices as alternatives or in addition to
conventional treatment, more research needs to focus on the physiological changes that
occur during specific YBE. To learn more about the mechanism by which YBE affect
human physiology, the stimulus of individual YBE must be quantified.

28
Chapter 3: Methods
In this Master’s thesis two separate studies were carried out. The first study was
observational and compared experienced YB with matched controls. The second study
was a 6 week YBE training study which compared experimental and control groups.
Study 1
Overview
All experimental procedures were approved by the Clinical Research Ethics
Board (#H09-03202) at the University of British Columbia. After signing the informed
consent form, baseline anthropometirc and spirometric measures were taken. Next,
subjects were tested during two YBE, bhastrika, and chaturbhuj, which are explained in
detail in Study 2, and during two Duffin re-breathe tests. To explain briefly, in bhastrika,
subjects hyperventilated through their nose for one minute, then inspired to total lung
capacity and held their breath as long as they could. In chaturbhuj, subjects inspired, then
held their breath, then expired, then held their breath out, each for the same amount of
time at a rate that they could maintain for 10 minutes. Following 15 minutes of rest, two
Duffin re-breathe tests were performed. The Duffin re-breathe tests are explained in
detail below.
Subject characteristics
Height (cm), body mass (kg) and age were determined in order to characterize all
subjects. These measurements were performed before any testing. Forced expiratory
volume in 1 second (FEV1) was determined using a stand-alone spirometer (Spirolab II;

29
Medical International Research, Roma, Italy). Nine male subjects (yogic breather (YB),
n=3; control, n=6) free from any history of cardiorespiratory disease consented to
participate in the study. Status as a YB required 1 year of 5 times weekly practice of
YBE that included breath-holds and low frequency breathing for a minimum of 20
minutes per session. All subjects were non-smokers, and free from all cardiorespiratory
diseases or ailments, control subjects were age and BMI matched and new to the practice
of YBE. Additional exclusion criteria included travel to altitude above 2300 m within 6
months of testing, experience in breath-hold sports and competitive swimming.
Cardiorespiratory measures
Arterial oxyhaemoglobin saturation (SaO2) was measured at the finger using
photoplethysmography (Model 3740; Ohmeda, Louisville, CO, USA). PETO2 and
PETCO2, were measured at the mouth and analyzed through calibrated O2 and CO2
analyzers (models S-3A/I and CD-3A, respectively; Applied Electrochemistry,
Pittsburgh, PA). Inspiratory flow data was collected using a heated pneumotach (Hans-
Rudolph HR800; Kansas City, MO, USA), connected to the inspired side of a mouth and
nasal breathing facemask (Mirage NV 16709; ResMed, San Diego, CA, USA).
Inspiratory flow signals were integrated to determine tidal volume (Vt) and fb, and then
multiplied together to obtain minute ventilation (VE).
Beat-by-beat systolic, diastolic, and mean blood pressure were obtained non-
invasively throughout testing using finger pulse photoplethysmography (Finometer;
FMS, Arnhem, Netherlands). Before testing with the blood pressure device, a return-to-
flow systolic calibration occured and the hydrostatic height sensor system was zeroed.

30
Beat-by-beat blood pressure was calibrated against an automated blood pressure
measurement (BPM-100; VSM Medtech Ltd, Vancouver, Canada) taken from the right
arm at the level of the heart every 3 min. During this time, heart rate was obtained from
electrocardiographic analysis.
Cerebral blood flow velocity
CBFV measurements were made using a Neurovision transcranial doppler system
(TCD) at the middle cerebral artery (Neurovision 500 M; Multigon Industries, Yonkers,
NY, USA). A probe was fixed to the zygomatic arch of the subject which directed
ultrasound waves at a frequency of 2 Mhz to a depth of 3.5-5.5 cm. CBFV was
determined approximately at the midpoint of the middle cerebral artery upstream from
the bifurcation to optimize the ultrasound waveform. The ultrasound probe was held in
place using a Marc 600 TCD fixation headframe to ensure the validity of the
measurements. For each subject, the same depth and gain of the Doppler signal were
used in all three testing sessions. Both peak CBFV and mean CBFV were taken and used
as indicies of cerebral blood flow. Mean CBFV was calculated using an algorithm which
averages CBFV over 3 second intervals.
Duffin re-breathe The re-breathe protocol used was based on the Read re-breathe (Read, 1967) as
modified by Duffin (Mohan & Duffin, 1997; Duffin & Mahamed, 2003). To start each
re-breathe, subjects hyperventilated room air through a three-way rebreathing valve
(Three-Way Y-Shape™ 4000; Hans-Rudolph, Shawnee, KS, USA) and were coached for

31
5 minutes to lower their PETCO2 to between 18 – 25 mmHg. Next, subjects were
switched to a plastic re-breathe bag containing 42 mmHg CO2 and either 50 mmHg or
200mmHg O2 (for the hypoxic and hyperoxic tests, respectively). Subjects were
instructed to take three deep breaths and then relax, and breathe however was
comfortable. This procedure slowly raised the subject’s PETCO2 while the re-breathe bag
was kept iso-oxic using a gas solenoid valve controlled by a specifically designed
computer program (LabVIEW 7.0, National Instruments, Austin, TX). The re-breathe
test was terminated when the subject’s PETCO2 reached 60 mmHg, when VE reached 100
L/min, when the researchers noted strong discomfort by the subject, or when the subject
wished to stop.
The same specifically designed software used to collect the data calculated
hypercapnic ventilatory threshold and sensitivity. For each subject, this software fitted a
straight line to the PETCO2 vs. time relationship and derived a predicted PETCO2 for each
breath. Next, predicted PETCO2 was plotted against VE. Average baseline ventilation,
hypercapnic ventilatory threshold, and sensitivity were determined from this plot.
Hypercapnic ventilatory threshold was the PETCO2 above which, there was a rise in VE
for a rise in PETCO2. Hypercapnic ventilatory sensitivity was the slope of the line after
the threshold. In some subjects, there were two distinct slopes and ventilatory thresholds.
When this occurred, the first slope was gradual, and the second was steep. The first slope
was taken as the hypercapnic ventilatory sensitivity, while the second slope and
threshold, if present, were not analyzed as per previously published instructions (Koehle
et al., 2007). Increases in ventilation following the first threhold are generally due to
increases in tidal volume, while increases after the second ventilatory threshold are

32
generally due to increasing breathing frequency (Duffin & Mahamed, 2003). I fitted and
analyzed all of the Duffin curves and was blinded to each subject’s group.
Data and statistical analysis All data were acquired using an analog-to-digital converter (Powerlab/16SP ML
795; ADInstruments, Colorado Springs, CO, USA) interfaced with a computer. Data
were sampled at 200 Hz and stored for subsequent analysis. In addition, a 16-bit analog-
to-digital converter (National Instruments, AT-MIO-16XE-50) was used to collect
ventilatory data during the Duffin re-breathe tests (Duffin et al., 2000). Hypercapnic
ventilatory threshold and sensitivity analysis was completed using the ventilatory data
collected by the 16-bit analog-to-digital converter in a specifically designed program
(National Instruments, LabVIEW) in accordance with previously published guidelines
(Duffin et al., 2000). Parameters were expressed as means ± SD. Differences in the
parameters were detected between subjects using independet sample t-tests.
Relationships among the parameters were derived by simple linear regression analysis.
Statistical significance was set at P < 0.05.
Study 2
Overview
All experimental procedures and protocols were approved (#H10-02374) by the
Clinical Research Ethics Board at the University of British Columbia which conforms to
the Declaration of Helsinki. Each subject’s first visit to the lab included signing of the

33
informed consent form, baseline anthropometric and spirometric measures, and a hypoxic
Duffin re-breathe test for the purpose of familiarization. In week 2, subjects returned to
the lab for baseline measurement of hypoxic and hypercapnic ventilatory sensitivitiy and
threshold, and breath-hold time. Weeks 3 and 4 were dedicated to training in
introductory YBE. Week 5 was in the lab and included all tests from week 2 and
additional measurement of cardiorespiratory variables during two YBE. In weeks 6 to 9,
subjects learned 3 intermediate YBE and were instructed to practice them 5 times
weekely, 20 minutes per time. Once per week subjects attended a YBE class, reported
their progress, and received further technical instruction. Subjects returned to the lab in
week 10 for the same testing protocol as week 5. Refer to Figure 1 for a detailed
explanation of the study design.
34
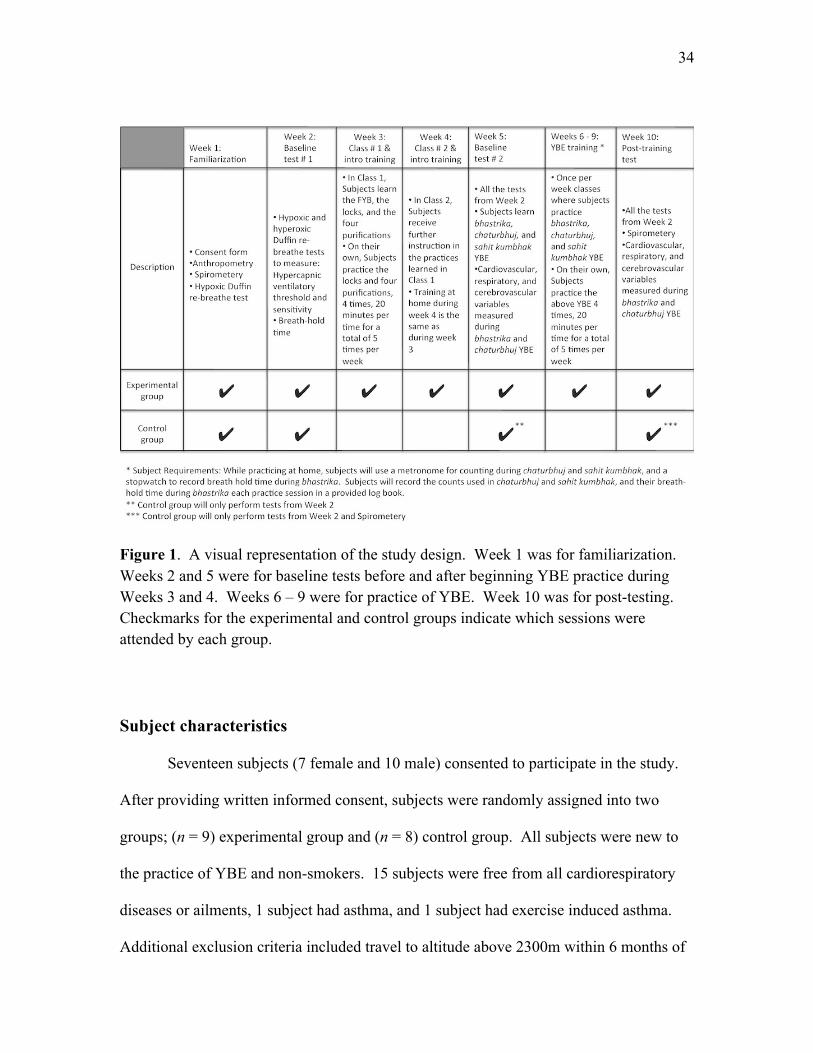
Figure 1. A visual representation of the study design. Week 1 was for familiarization. Weeks 2 and 5 were for baseline tests before and after beginning YBE practice during Weeks 3 and 4. Weeks 6 – 9 were for practice of YBE. Week 10 was for post-testing. Checkmarks for the experimental and control groups indicate which sessions were attended by each group.
Subject characteristics
Seventeen subjects (7 female and 10 male) consented to participate in the study.
After providing written informed consent, subjects were randomly assigned into two
groups; (n = 9) experimental group and (n = 8) control group. All subjects were new to
the practice of YBE and non-smokers. 15 subjects were free from all cardiorespiratory
diseases or ailments, 1 subject had asthma, and 1 subject had exercise induced asthma.
Additional exclusion criteria included travel to altitude above 2300m within 6 months of
35
the first visit to the research lab, experience in breath-hold sports and competitive
swimming. Height (cm), body mass (kg) and age were determined in order to
characterize all subjects. These measurements were be performed before any subsequent
testing. Forced expiratory volume in 1 second (FEV1) was determined using a stand-
alone spirometer (Spirolab II; Medical International Research, Roma, Italy).
Cardiorespiratory measures Cardiorespiratory measures were collected and analyzed in the same way as Study
1.
Cerebral blood flow velocity
CBFV measurements were made in the same manner as Study 1. However, to
ensure exact placement of the ultrasound probe in subsequent testing sessions, a trace was
made of each subjects head, ear, and crucial facial features in relation to the ultrasound
probe. This trace was made by holding a transparency to the left side of the subject’s
head and tracing the above features with a felt pen. Specific notes were made to ensure
correct position and aim of the probe.
Duffin re-breathe
The procedures used for the Duffin re-breathes were the same as those in Study 1.

36
Breath-holds
Following 10 minutes of baseline data collection, each subject performed three
maximal breath-holds. The breath-hold protocol we chose was based on a previously
published study (Schagatay et al., 1999) which separated repeated apneas with 2 minutes
of rest. Subjects were immediately stopped if they took an uncharacteristically large
inspiration or expiration before the breath-hold (Schagatay et al., 1999). Subjects were
cued as follows: “At the end of a normal breath out, inhale as deep as you can, and hold
in as long as you can.” Breath-hold time was calculated from the end of the final
inspiration to the beginning of the first expiration. The longest of the three attempts was
used in analysis. During both the normal breath-hold and the bhastrika breath-hold,
subjects were given no encouragement to continue the hold, or information on time. This
was done so that there was no external influence on breath-hold time.
Data and statistical analysis All data were acquired in the same manner as Study 1. Differences in all
parameters were detected between subjects, and between tests using 2x3 repeated
measures ANOVA and post hoc (Fisher’s least significant difference) tests.
Relationships among the parameters were derived by simple linear regression analysis.
Statistical significance was set at P < 0.05.

37
Yogic breathing exercises All YBE were taught by this author; an experienced and certified yoga teacher
(200-hour certification, 2007; Salt Spring Centre of Yoga, Salt Spring Island, BC). All
YBE instructions are from (Hari Dass, 1981; Muktibodhananda, 2006; Saraswati, 2006)
Beginner YBE Before the subjects were taught the three YBE that were practiced during weeks 6
to 9, they were taught three preliminary practices: the full yogic breath (FYB), the three
locks, and the four purifications.
The FYB
The FYB is most simply described as a full, deep breath. First, subjects were
instructed to activate the diaphragm with the cue “Inhale into the bottom of the lungs by
pushing the stomach out.” Next, subjects were instructed to “Continue the inhale into the
middle portion of the torso by expanding the lower rib cage.” Finally, subjects were
instructed to “Fill the top of the lungs by expanding the chest up and out.” After a short
pause, subjects expired with the instructions “Relax the upper chest, then the ribcage, and
finally pull the abdomen in slightly.” A common analogy that was used when teaching
the FYB was the filling and emptying of a jar (lungs) with water (air). The jar always
fills from the bottom to the top, and always empties from the top to the bottom. The FYB
was done through the nose.

38
The three locks
There are three locks that are incorporated into many YBE. First, the root lock is
a contraction of the pelvic floor that is applied and held during inspiration and relaxed
upon expiration. Second, the throat lock is engaged at the beginning of a breath-hold by
bringing the chin down towards the upper chest. The throat lock is released upon
expiration at the end of the breath-hold. Third, the stomach lock is engaged at the end of
an expiration by bringing the abdomen in towards the spine and up towards the chest.
The stomach lock is released upon inspiration.
The four purifications
The four purifications are a set of beginner YBE that develop common breathing
patterns that are used in intermediate YBE. In traditional teaching of YBE, the four
purifications and the three locks should be practiced regularly for a minimum of 3 months
before a student progresses to intermediate YBE (Hari Dass, 1981).
i. Nadi shodhan
This practice is also known as alternate nostril breathing. While closing the right
nostril with the right thumb, the subject inspires through the left nostril. Then, the left
nostril is closed with the right ring finger and the subject expires through the right nostril.
The next inspiration is through the right nostril. The subject then closes the right nostril
with their right thumb and expires through the left nostril. That constitutes one round.
This practice is done with the FYB.

39
ii. Kapal bhati
This is a shallow, rapid, repeated breath through the nose. The pattern begins
with a forceful expiration from about half of total lung capacity. During the expiration,
the abdomen is pulled in towards the spine. At the end of the expiration, the abdomen is
relaxed which results in an inhalation. That constitutes one round. Subjects were
instructed to keep their chest still during this practice.
iii. Agnisar dhauti
This practice is done while holding the breath out and is most simply described as
a repeated “stomach lock.” As the breath is held out, the abdomen is brought in towards
the spine and up towards the chest and then relaxed. This process is repeated for 10-15
seconds with the breath held out.
iv. Ashvini mudra
This practice is done while holding the breath in and is most simply described as a
repeated “root lock.” As the breath is held in, the pelvic floor is rapidly contracted and
relaxed. This process is repeated for 10-15 seconds.
Intermediate YBE
Bhastrika
Bhastrika, translated as “breath of fire,” or “bellows breath,” is one of the most
common YBE used today. Though bhastrika is taught differently among yogic systems,

40
the basic structure of the practice is the same; one to two minutes of abdominal
hyperventilation through the nose followed by an inspiration to total lung capacity and
maximal breath-hold. The breathing pattern used in bhastrika is different than the FYB
described above. Bhastrika’s abdominal hyperventilation breath is simply the first step
of the FYB inspiration (filling only the bottom of the jar) followed by a forceful exhale
through the nose where the abdomen is pulled in.
Chaturbhuj
Chaturbhuj is a hypoventilation breathing pattern, done through the nose, that
uses the FYB and no locks. Each breath is timed and divided into four equal parts:
inspiration, breath-hold, expiration, breath-hold. During this YBE, students started with a
count of 6 (minimum fb of 2-4 breaths per minute) for 10 consecutive minutes. Each
week when the students returned for class, they were encouraged to increase the count if
it was comfortable. Many experienced practitioners can tolerate a count of 15-20 (fb of
0.75 - 1 breath per minute) for the same duration. In week 5, all subjects performed
chaturbhuj for ten minutes at a count of 6 (fb = 2.5 bpm). In week 10, subjects were
instructed to perform chaturbhuj at the highest count (lowest fb) they could maintain for
10 minutes.
Sahit kumbhak
Sahit kumbhak is more complicated than bhastrika and chaturbhuj. It brings
together all of the elements that the students learned with the previous YBE. It is an
alternate nostril, hypoventilation breathing pattern that uses the FYB, apnea, and the three
41
locks. Each breath is timed and the inspiration:breath-hold:expiration ratio is 1:4:2.
Subjects began by closing the right nostril, and inspiring with a FYB through the left
nostril for 4 seconds. During the inspiration, the root lock was applied. Next, the breath
was held in for 16 seconds. At the beginning of the breath hold, the throat lock was
applied and held for the duration of the breath hold. At the end of the breath hold, the
subjects released both locks and began their expiration by closing the left nostril with
their ring finger, and expiring through the right nostril for 8 seconds. At the end of the
expiration, subjects applied the stomach lock for 1 second and then began the cycle again
with a 4 second inspiration through the right nostril. The same as in nadi shodhan, each
round starts with an inspiration through the left nostril and ends with an expiration
through the left nostril (two inspiration and two expirations per round).
Classes
Supervised YBE classes were held twice a week in a quiet classroom in the
Osborne building to accommodate the subjects’ schedules. Each subject was required to
attend one of the two classes per week.
Practice at home
In addition to attending one class per week, subjects were instructed to practice on
their own 4 times per week, 20 minutes each time. Additionally, subjects were asked to
measure breath-hold time during bhastrika and note the counts used during chaturbhuj
and sahit kumbhak each week.

42
Chapter 4: Results
Study 1
Experienced yogic breathers (YB) and control groups were matched for age
(control: 28.8 ± 6.2 years; YB: 30.3 ± 8.5 years), and BMI (control: 24.0 ± 1.5 Kg/m2;
YB: 22.6 ± 1.5 Kg/m2). YB had been practicing YBE for an average of 4.1 ± 2.5 years
for more than 20 minutes per day. Representative physiological changes during
bhastrika are shown below in Figure 1.
Note the increases in MAP (39.8 %) and MCAv (102 %) throughout the breath-
hold. Maximal breath-hold time during bhastrika was similar between YB and controls
(control: 84.8 ± 21.5 s; YB: 98.0 ± 21.4 s, P = 0.43). The levels of PETO2 (control: 76.3 ±
11.6 mmHg; YB: 78.7 ± 9.4 mmHg) and PETCO2 (control: 46.7 ± 5.0 mmHg; YB: 45.8 ±
2.7 mmHg) reached at end breath-hold were also similar between groups. However, peak
MAP tended to be greater in YB at end breath-hold (control: 108.6 ± 15.9 mmHg; YB:
23.5 ± 7.8 mmHg, P = 0.10) (Figure 2A).

43
Figure 2. Cardiorespiratory responses to bhastrika in an experienced YB.

44
Figure 3. Graphical illustration of the MAP response to bhastrika (A) and chaturbhuj (B) in YB and CON. Note the increased BP in YB throughout chaturbhuj. * P < 0.05 compared to control.

45
Figure 4. Cardiorespiratory responses to chaturbhuj in an experienced YB.

46
Representative physiological changes during chaturbhuj are shown in Figure 3.
MAP and MCAv cycled with the phases of respiration in the YB, both decreased with
inspiration and increased with expiration. During chaturbhuj, YB had lower fb (control:
2.7 ± 0.7 bpm; YB: 1.4 ± 0.2 bpm, P < 0.05) and higher tidal volume (control: 2.9 ± 0.9
L; YB: 4.1 ± 0.5 L, P < 0.05) resulting in slightly lower minute ventilation (control: 7.9 ±
3.3 L/min; YB: 5.9 ± 1.3 L/min, P = 0.11). During chaturbhuj mean PETO2 was lower in
YB (control: 94.3 ± 12.0 mmHg; YB: 77.5 ± 5.7 mmHg, P < 0.05) and PETCO2 seemed
greater, (control: 41.3 ± 8.7 mmHg; YB: 47.3 ± 1.9 mmHg, P = 0.15), but not
significantly different. MAP was similar at rest between groups (control: 85.6 ± 8.0
mmHg; YB: 98.4 ± 9.6 mmHg P = 0.13), however, during chaturbhuj, MAP was higher
in the YB (control: 87.6 ± 9.8 mmHg; YB: 110.0 ± 0.9 mmHg, P < 0.05) (Figure 2B).
The hypercapnic ventilatory threshold was the same between groups in both the
hypoxic and hyperoxic tests (hypoxic: control: 43.7 ± 4.4 mmHg; YB: 43.8 ± 1.2 mmHg
P = 0.80; hyperoxic: control: 48.1 ± 5.7 mmHg; YB: 47.9 ± 1.3 mmHg, P = 0.70).
Hypercapnic ventilatory sensitivity was lower in the YB only in hyperoxia (Hypoxic:
control: 6.6 ± 3.3 L/min/mmHg; YB: 5.3 ± 0.7 L/min/mmHg, P = 0.85; Hyperoxic:
control: 4.6 ± 1.2 L/min/mmHg; YB: 3.4 ± 0.4 L/min/mmHg, P < 0.05).
Study 2
Anthropometric and spirometeric measures were similar between groups at
baseline and did not change following the intervention (P > 0.05, Table 2). Eight out of
nine experimental subjects attended each instructional class, reported completing their
practice at home, and completed each testing session. One subject withdrew from the

47
study before the final testing session due to non-compliance with home practice during
the 4 weeks prior to testing. There was no change in spirometric measures following the
intervention. BMI was not different between groups. This was important because
obesity affects blood pressure and cerebrovascular reactivity to hypoxia. Independent of
co-morbidities, obesity is associated with increased cerebrovascular resistance, and
reduced CBFV both at rest, and in response to hypoxia (Selim et al., 2008; Dempsey et
al., 2010).
Table 2. Anthropometric and Spirometric data (means ± SD) at baseline and following the intervention.
Baseline 6 Weeks
Control Experimental Control Experimental
Age, yr 25.1 ± 3.1 23.9 ± 2.5 Height, cm 176.3 ± 10.7 173.6 ± 7.1 Weight, Kg 74.3 ± 15.8 70.1 ± 9.7 BMI, Kg/m2 23.7 ± 3.1 23.3 ± 2.9 FVC, L 5.1 ± 1.4 4.9 ± 1.1 4.8 ± 1.6 5.1 ± 0.7
PEF, L/s 9.1 ± 2.0 10.2 ± 2.4 8.8 ± 2.2 9.9 ± 2.4 FEV 1, L 4.2 ± 0.9 4.2 ± 1.0 4.1 ± 1.1 4.2 ± 0.5 FEV 1, % 83.2 ± 7.4 85.5 ± 4.4 87.8 ± 5.9 82.4 ± 2.6
Bhastrika can be broken down into two physiologically different parts. First, the
hyperventilation; and second, the breath-hold. As expected, the hyperventilation was
achieved primarily by an increase in Vt (rest: 0.81 ± 0.1 L; hyperventilation: 1.7 ± 0.52 L,
P < 0.05). During the hyperventilation, PETO2 increased an average of 25.5 ± 8.5 mmHg,
and PETCO2 decreased an average of 10.0 ± 3.5 mmHg. The change in PETO2 increased
SaO2 (rest: 95.8 ± 0.97 %; hyperventilation: 97.2 ± 0.75 %, P < 0.05). In the

48
hyperventilation portion of bhastrika, MCAv decreased, heart rate was slightly elevated,
and there was no change in MAP (Table 2).
At end breath-hold, bhastrika resulted in a decrease in PETO2 from 125.6 ± 8.5
mmHg to 90.8 ± 12.1 mmHg (9.3 mmHg lower than rest, P < 0.05). However, this
decrease did not cause a significant drop in SaO2. At end breath-hold, PETCO2 increased
from 27.4 ± 3.5 mmHg to 40.6 ± 2.7 mmHg (3.2 mmHg higher than rest, P < 0.05).
MCAv more than doubled from end hyperventilation to end breath-hold, and MAP and
HR were elevated significantly at end breath-hold (Table 3).
Table 3. Cardiorespiratory variables (means ± SD) at rest and during Bhastrika.
Rest Hyperventilation Breath-‐hold PETO2 (mmHg) 100.1 ± 7.4 125.6 ± 8.5* 90.8 ± 12.1*
PETCO2 (mmHg) 37.4 ± 3.6 27.4 ± 3.5* 40.6 ± 2.7*
Inspired VE (L/min) 11.4 ± 1.9 27.1 ± 7.8* SaO2 (%) 95.8 ± 0.97 97.2 ± 0.75* 93.3 ± 3.9 Vt (L) 0.81 ± 0.1 1.7 ± 0.52* fb (bpm) 14.2 ± 1.4 16.4 ± 3.1 MCAv (cm/s) 55.8 ± 26.3 40.2 ± 18.3* 87.4 ± 23.0*
SV (mL) 90.5 ± 21.4 88.2 ± 19.1 TPR (CGS) 1332 ± 247 1200 ± 502 CO (L/min) 5.8 ± 1.3 7.2 ± 2.6 SBP (mmHg) 110.1 ± 9.5 112.2 ± 15.1 124.0 ± 16.6*
DBP (mmHg) 71.1 ± 7.9 70.9 ± 10.9 83.2 ± 15.4*
MAP (mmHg) 83.0 ± 6.6 84.4 ± 11.6 96.7 ± 13.0*
HR (bpm) 65.3 ± 9.8 74.5 ± 9.5* 80.8 ± 15.1*
* Different compared to resting values (P < 0.05)
Chaturbhuj was performed for 10 minutes by each experimental subject. Though
fb was reduced (rest: 14.2 ± 1.4 bpm; chaturbhuj: 2.6 ± 0.16 bpm, , P < 0.05), mean
values from week 5 show that SaO2 did not change during chaturbhuj. PETCO2 increased

49
2.3 mmHg (P < 0.05), and HR increased 2.9 bpm (P < 0.05) (Table 4). However, these
mean values do no illustrate the cyclical changes shown in the individual traces
(bhastrika: Figures 5 – 7; chaturbhuj: Figures 8 – 10).
Table 4. Cardiorespiratory variables (means ± SD) at rest and during Chaturbhuj.
Rest Chaturbhuj PETO2 (mmHg) 100.1 ± 7.4 99.8 ± 5.3 PETCO2 (mmHg) 37.4 ± 3.6 39.7 ± 2.7*
Inspired VE (L/min) 11.4 ± 1.9 6.6 ± 1.4*
SaO2 (%) 95.8 ± 1.0 95.5 ± 1.2 Vt (L) 0.81 ± 0.1 2.6 ± 0.6*
fb (bpm) 14.2 ± 1.4 2.6 ± 0.16*
MCAv (cm/s) 55.8 ± 26.3 51.6 ± 25.4 SV (mL) 90.5 ± 21.4 85.1 ± 14.6 TPR (CGS) 1332 ± 247 1345 ± 226 CO (L/min) 5.8 ± 1.3 5.7 ± 1.1 SBP (mmHg) 110.1 ± 9.5 107.4 ± 13.2 DBP (mmHg) 71.1 ± 7.9 71.6 ± 9.2 MAP (mmHg) 83.0 ± 6.6 85.2 ± 10.8 HR (bpm) 65.3 ± 9.8 68.2 ± 8.0*
* Different compared to resting values (P < 0.05).

50
Figure 5. Cardiorespiratory, cerebrovascular, and blood pressure responses to bhastrika in an experimental subject. Notice the similar increases in MCAv and MAP during the breath-hold.

51
Figure 6. Cardiorespiratory, cerebrovascular, and blood pressure responses to bhastrika in an experimental subject. Notice the similar increases in MCAv and MAP during the breath-hold.
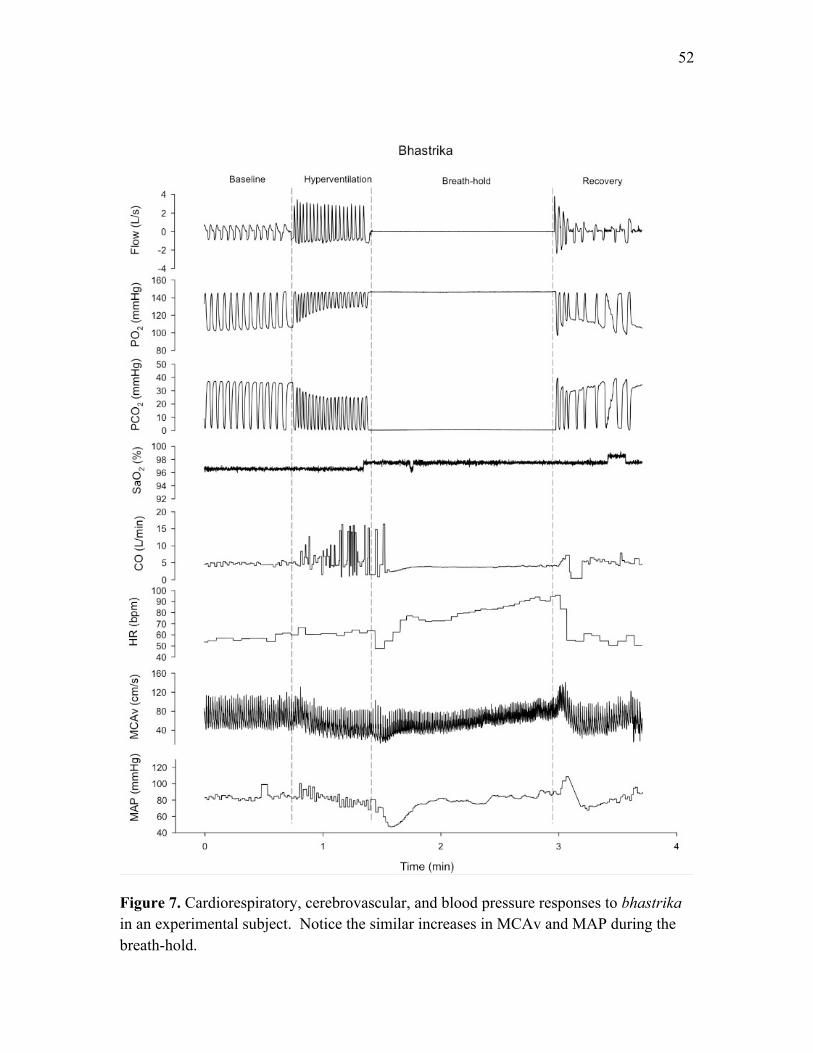
52
Figure 7. Cardiorespiratory, cerebrovascular, and blood pressure responses to bhastrika in an experimental subject. Notice the similar increases in MCAv and MAP during the breath-hold.

53
Figure 8. Cardiorespiratory, cerebrovascular, and blood pressure responses to chaturbhuj in an experimental subject. Note how SaO2, MCAv, SV, and MAP oscillate with ventilation.

54
Figure 9. Cardiorespiratory, cerebrovascular, and blood pressure responses to chaturbhuj in an experimental subject. Note how SaO2, MCAv, SV, and MAP oscillate with ventilation.
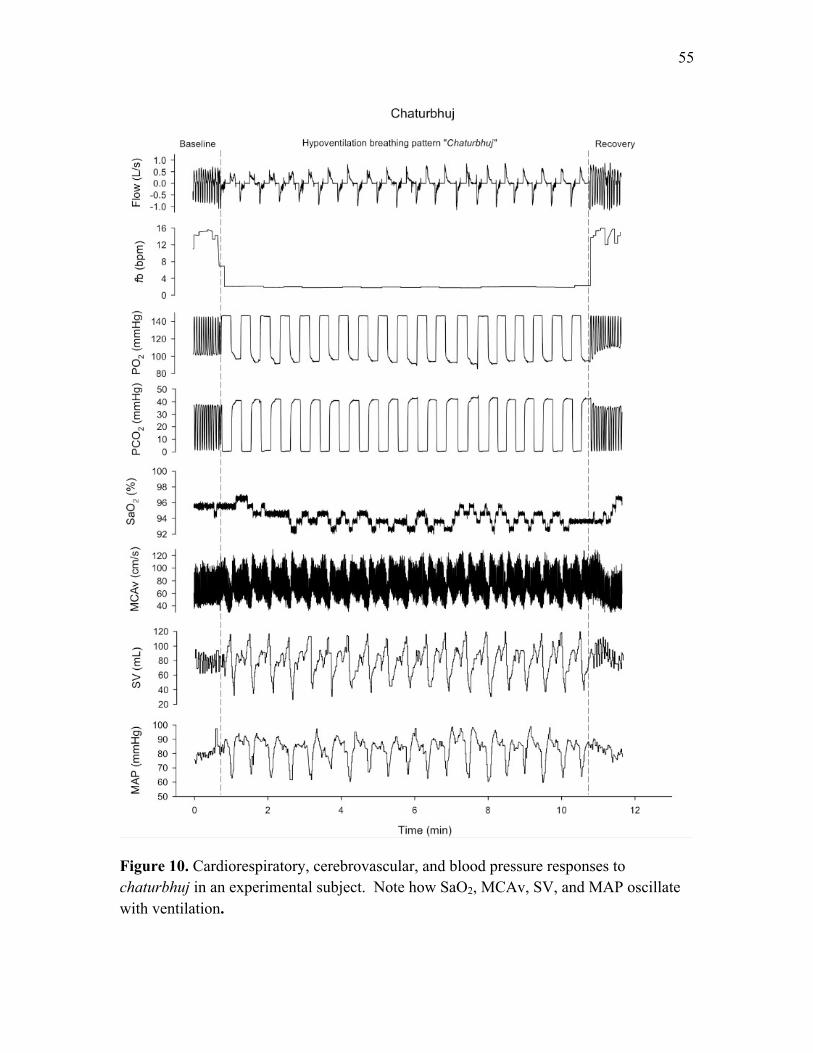
55
Figure 10. Cardiorespiratory, cerebrovascular, and blood pressure responses to chaturbhuj in an experimental subject. Note how SaO2, MCAv, SV, and MAP oscillate with ventilation.
56
Cardiorespiratory data were collected during bhastrika and chaturbhuj at two time
points. The first collection period was in week 5, after the subjects had practiced the
beginner YBE for two weeks. The second collection period was in week 10, after the
subjects had practiced the intermediate YBE for four weeks (Figure 1). In the bhastrika
hyperventilation, there were no changes in any cardiorespiratory variables from week 5 to
week 10. In the bhastrika breath-hold, there was no change in breath-hold time (Week 5:
90.6 ± 33.6 s; Week 10: 104.7 ± 9.4 s, P = 0.48), however, there was a change in SaO2 at
end breath-hold (Week 5: 91.4 ± 3.9 %; Week 10: 94.7 ± 3.1 %, P < 0.05). There were
no other differences to report between weeks 5 and 10 during bhastrika.
Baseline ventilation (L/min) during the Duffin re-breathe tests was measured
following the 5 minutes of hyperventilation and three equilibration breaths from the re-
breathing bag, and ended at each subject’s hypercapnic ventilatory threshold. In the
hypoxic Duffin re-breathe, there were no differences in baseline ventilation between time
points or between groups, however, there was a time*group interaction (P < 0.05, Figure
10). In the hyperoxic Duffin re-breathe there was a difference between time points (P <
0.05), and a time*group interaction (P < 0.05, Figure 12), however, there was no
difference between groups.

57
Figure 11. Mean baseline VE (L/min) ± SD for control and experimental groups at the beginning of the hypoxic Duffin re-breathe test. This data was averaged following the 5 minutes of hyperventilation and 3 equilibration breaths from the re-breathing bag, until the hypercapnic ventilatory threshold. Notice the trend in both figures of decreased VE with each successive test in the experimental group.

58
Figure 12. Mean baseline VE (L/min) ± SD for control and experimental groups at the beginning of the hyperoxic Duffin re-breathe test. This data was averaged following the 5 minutes of hyperventilation and 3 equilibration breaths from the re-breathing bag, until the hypercapnic ventilatory threshold. Notice the trend in both figures of decreased VE with each successive test in the experimental group.
The hypercapnic ventilatory threshold (Hypoxic: 40.7 ± 2.25 mmHg; Hyperoxic:
43.5 ± 2.23 mmHg, P < 0.01) and sensitivity (Hypoxic: 5.64 ± 2.33 L/min/mmHg;
Hyperoxic: 3.61 ± 1.46 L/min/mmHg, P < 0.01) were different between the hypoxic and
hyperoxic Duffin re-breathe tests (Figures 13,14). There was no difference in
hypercapnic ventilatory threshold or sensitivity between groups or between time points.

59
Figure 13. * Different from hypoxic test P < 0.05. Hypercapnic ventilatory threshold in hyperoxia was significantly lower than in hypoxia. There was no difference between groups or between time points.

60
Figure 14. * Different from hypoxic test P < 0.05. Hypercapnic ventilatory sensitivity in hyperoxia was significantly lower than in hypoxia. There was no difference between groups or between time points.
Normal breath-hold time between groups was the same at baseline (control: 58.8
± 17.3 s; experimental: 65.9 ± 14.9 s, P = 0.38) and in week 10 (control: 75.0 ± 14.3 s;
experimental: 81.3 ± 8.9 s, P = 0.54). Comparing the normal breath-hold with the
bhastrika breath-hold in week 5, we found that breath-hold time was not different
(normal: 71.0 ± 25.4 s; bhastrika: 84.6 ± 24.8 s, P = 0.07), however, PETCO2 at end
breath-hold was different (normal: 45.7 ± 3.9 mmHg; bhastrika: 40.6 ± 2.7 mmHg, P <
0.01). After 4 weeks of intermediate YBE practice, in week 10, breath-hold time was
longer in bhastrika (normal: 81.3 ± 8.9 s; bhastrika: 104.7 ± 9.4 s, P < 0.01), but there

61
was no difference in PETCO2 (normal: 43.0 ± 3.7 mmHg; bhastrika: 40.9 ± 6.2 mmHg, P
= 0.08).
There was no difference in the MAP or MCAv response when comparing the
bhastrika breath-hold to the normal breath-hold. There was no significant correlation
between change in breath-hold time and change in hypercapnic ventilatory sensitivity in
either oxygen environment (hypoxia: r = 0.26, P = 0.57; hyperoxia: r = 0.08, P = 0.87).
The response of MCAv to hypercapnia in both Duffin re-breathe environments was not
different between groups, and did not change following either part of the intervention
(Figure 15).
Figure 15. Average MCAv (cm/s) ± SD during the last 15 seconds of the Duffin re-breathe tests. There was no difference between tests, groups, or time points.

62
The MAP responses to bhastrika (week 5: 109.6 ± 4.8 mmHg; week 10: 96.7 ±
18.9 mmHg, P = 0.40) and chaturbhuj (week 5: 88.4 ± 8.2 mmHg; week 10: 83.4 ± 9.4
mmHg, P = 0.62) were not different following 4 weeks of intermediate YBE practice
(Figure 16).
Figure 16. * Different from rest P < 0.05. Average MAP (± SD) response to bhastrika and chaturbhuj in weeks 5 and 10. Notice in bhastrika that the MAP at end breath-hold is higher than at rest in week 5. There was no difference in the MAP response between weeks 5 and 10 in either bhastrika or chaturbhuj.

63
Chapter 5: Discussion
Study 1
In this study, experienced YB and inexperienced matched controls performed two
YBE and two Duffin re-breathe tests. The results support three major findings. First,
bhastrika produced a mild hypoxic and hypercapnic stimulus similarly in both YB and
controls, whereas chaturbhuj produced hypoxia and hypercapnia to a greater degree in
the YB. Second, contrary to published literature showing a decrease in MAP during a
hypoventilation YBE (Pramanik et al., 2009), it was demonstrated that MAP increases in
response to chaturbhuj, and this increase in MAP was higher in the YB compared with
controls. Finally, a decreased hypercapnic ventilatory sensitivity in hyperoxia in the YB
was observed. This is consistent with the idea that a central drive to breathe is decreased
following long-term practice of YBE.
During apnea, the peripheral chemoreflex is activated and the cardiovascular
system works to conserve oxygen for the brain and the heart. In addition to increasing
ventilation, the peripheral chemoreflex results in increased MAP due to sympathetic
activation (Dujic et al., 2008). In chaturbhuj, there was a trend for higher MAP in the
YB. Chaturbhuj is considered an intermediate difficulty YBE and is progressive in
nature. With practice, YB aim to decrease the fb used during chaturbhuj, resulting in a
more challenging YBE. The YB had lower PETO2 and higher PETCO2 than the control
group because they performed chaturbhuj with lower fb and consequently, lower VE.
During chaturbhuj, the result of a lower fb is more time spent per breath in both internal
and external apnea. More apnea results in increased PETCO2 and decreased PETO2, and
more severe hypercapnic hypoxia results in increased sympathetic outflow (Breskovic et

64
al., 2010). Though sympathetic nerve activity was not measured, this is a probable
explanation for the increased MAP during chaturbhuj.
This study showed no difference in peripheral chemosensitivity between groups.
This finding is in contrast with a previous that found decreased peripheral
chemosensitivity in YB compared to matched controls (Spicuzza et al., 2000). However,
differences between studies may be attributed to methodological assessment of
chemosensitivity. In this study two re-breathe conditions (PETO2 = 45 mmHg; hypoxic,
and PETO2 = 145 mmHg; hyperoxic) were employed to assess the peripheral and central
contribution to ventilation, whereas the cited study used a single hypoxic-normocapnic
re-breathe (Spicuzza et al., 2000). The hypoxic-normocapnic re-breathe only measures
peripheral chemosensitivity to O2, whereas the hypoxic Duffin re-breathe assesses
peripheral chemosensitivity with the contribution of both low O2 and high CO2. These
are two different responses and explain the difference between the results of this thesis
and the cited study. The hyperoxic re-breathe decreases the contribution of the peripheral
chemoreceptors, resulting in a centrally based ventilatory response (Duffin & Mahamed,
2003); whereas the hypoxic re-breathe test includes contribution from both
chemoreflexes. Hypercapnic ventilatory sensitivity in hyperoxia was lower in the YB,
indicating a decreased central chemoresponse. This result is consistent with previous
research examining YB (Spicuzza et al., 2000), and other populations that regularly
experience hypoxic hypercapnia (breath-hold divers (Dujic et al., 2008); sleep apnea
patients (Dempsey et al., 2010)).
In this study, it was hypothesized that YB would have reduced hypercapnic
chemosensitivity compared to matched controls. Specifically, reduced hypercapnic

65
ventilatory sensitivity and increased hypercapnic ventilatory threshold. The data
supported a reduced hypercapnic ventilatory sensitivity in YB, however, only in the
hyperoxic re-breathe. This was the first study to use the Duffin re-breathe and measure
hypercapnic ventilatory threshold in YB. Though there was no difference between
groups in hypercapnic ventilatory threshold, the sample size was very low.
The increased MAP response to chaturbhuj in the YB compared to controls was
not expected. Many studies report that YBE are beneficial for cardiovascular health and
reduce blood pressure (Bernardi et al., 2001; Pramanik et al., 2009; Pramanik et al.,
2010). However, these studies only include YBE that are variations on the full yogic
breath, or in other words: slow, deep breathing. Most intermediate YBE include
significant breath-holds and reductions in VE (Muktibodhananda, 2006). Bhastrika and
chaturbhuj are in this category and according to the data presented, it appears that they
significantly increase MAP during their practice.
Study 2
Summary
In this study, 17 subjects new to YBE were randomly assigned to control and
experimental groups. Experimental subjects were trained for 2 weeks in beginner YBE
and then for 4 weeks in intermediate YBE. This study supported five major findings.
First, it was confirmed that bhastrika and chaturbhuj both produce hypercapnia and mild
hypoxia. Second, performance of bhastrika results in significantly increased MAP and
MCAv. Third, performance of chaturbhuj results in cyclic oscillation of MAP, HR, SV,
and MCAv with the phases of respiration. Fourth, following the intervention, there was

66
no difference in normal breath-hold time between groups. Fifth, contrary to the
hypothesis, post-intervention, there were no differences between groups in
cardiovascular, cerebrovascular, or chemosensitivity measures.
Control of breathing and YBE
The physiological effects of YBE cannot be explained without considering
ventilatory control. Originally, it was thought that ventilation was controlled by two
separate systems – the peripheral and central chemoreflexes – which responded
independently to O2 and CO2 respectively. It is now evident that the chemoreflex systems
are mutually dependent (Duffin & Mahamed, 2003; Day & Wilson, 2007). As a whole,
the human chemoreflex system is made up of three parts: sensors, effectors, and the
central controller. The peripheral chemoreceptors are located at the bifurcation of the
carotid artery in the carotid body, and in the aortic arch. Their primary job is to measure
the amount of O2 in arterial blood. Animal denervation studies have shown that the
hypoxic ventilatory drive originates solely from the carotid chemoreceptors (Izumizaki et
al., 2004). Recent work has shown that the peripheral chemoreceptors also contribute
approximately one third of the total hypercapnic ventilatory response while the central
chemoreceptors contribute the other two thirds (Forster et al., 2008). The peripheral
chemoreceptors relay information through the 9th cranial nerve to the respiratory centres
in the medulla for integration (West, 2005).
The central chemoreceptors are surrounded by the brain extracellular fluid and are
anatomically located just below the ventral surface of the medulla in the brainstem,
adjacent to the cerebrospinal fluid (CSF). They are sensitive only to CO2 through

67
changes in H+ concentration. As blood levels of CO2 rise, CO2 diffuses through the blood
brain barrier and brain extracellular fluid, into the CSF causing increased H+
concentration and decreased pH in the CSF. The central chemoreceptors respond to
decreased pH with increased firing (West, 2005).
There are two systems of “higher control,” the brainstem and the cortex. The
neurons in the brainstem are responsible for the involuntary, periodic nature of
inspiration and expiration. Based on information from the chemoreceptors, they can
increase or decrease their firing rate through the phrenic nerve to regulate ventilation. To
a point, signals from the cortex can override the brainstem to produce voluntary changes
in ventilation such as hyper/hypoventilation and prolonged apnea (West, 2005) (Ferretti,
2001). Voluntary control is where YBE come in.
Bhastrika and chaturbhuj are involved breathing exercises that significantly affect
cardiorespiratory and cerebrovascular variables. Performance of Bhastrika produces
hypocapnia and hyperoxia and then hypercapnia and mild hypoxia. When performing
bhastrika regularly, the goal is to increase breath-hold time. In a breath-hold, there are
two breaking-points: the physiological breaking point, and termination of the breath-hold
(Lin et al., 1974), which may be more psychological than physiological. The
physiological breaking point occurs when the subject begins to make involuntary
ventilatory movements and is determined primarily by increasing CO2 (Hentsch &
Ulmer, 1984). From this point, continuation of the breath-hold requires increasing
inhibitory input from the cortex (Lin et al., 1974).
Breath-hold time in bhastrika was longer than in the normal breath-hold.
However, at and breath-hold, PETCO2 was lower in bhastrika. PETO2 was not different

68
between holds. Increased breath-hold time in bhastrika was expected due to prior
hyperventilation and blow-off of CO2. However, it was not expected that PETCO2 levels
would differ between the two breath-holds. If CO2 levels were the only variable to
influence the breath-hold breaking points, then we would expect to see equal PETCO2
levels at end breath-hold in both tests. In bhastrika, this would have resulted in a further
increased breath-hold time. However, there are more variables to consider (Figure 16).
Pulmonary stretch receptors may play a role in regulating breath-hold time and
with maximal inspirations, they are sure to be activated. Theoretically, increased
activation of pulmonary stretch receptors would result in increased output to central
command to end the breath-hold. However, increased lung volume provides more gas for
exchange and has a much larger affect on breath-hold time. This is why elite breath-hold
divers employ techniques like glossopharyngeal insufflation to further increase lung
volume past their inspiratory maximum (Chung et al., 2010). As lung volume increases,
so does breath-hold time (Andersson & Schagatay, 1998).

69
Figure 17. A model of the ventilatory response to hypoxia/hypercapnia and how the practice of YBE may influence their feedback loops. For the purposes of this figure, the YBE considered are those that increase PaCO2 and decrease PaO2. Good examples are bhastrika and chaturbhuj. As the rise in PaCO2 and fall in PaO2 are sensed by the central and peripheral chemoreceptors, the chemoreceptors increase their output to the brainstem. Approximately 2/3 of the hypercapnic drive to breathe comes from the central chemoreceptors, and 1/3 from the peripheral chemoreceptors. 100% of the hypoxic drive to breathe comes from the peripheral chemoreceptors. Normally, this increased drive to breathe results in firing of the phrenic nerve and an increase in ventilation. However, during a breath-hold or a hypoventilation YBE, central command overrides the drive to breathe and the breath-hold or pattern breath is continued, causing a further rise in PaCO2 and fall in PaO2. This pattern continues until the drive to breathe becomes greater than the inhibitory inputs from central command. At this point, the breath-hold or pattern breath is terminated and ventilation increases.
During the intermediate YBE training phase of the study (weeks 6 – 9), students
were instructed to reduce the fb used during Chaturbhuj each week if it was comfortable.

70
Mean data shown (Table 3) are from week 5. In week 5, every subject performed
chaturbhuj at 2.5 bpm. This is most likely why the changes in PETO2 and PETCO2 were
smaller than those seen in Study 1. In the available week 10 data, levels of PETO2 and
PETCO2 in subjects who reduced their fb are similar to the levels achieved by the
experienced YB in Study 1. To help compensate for the large decrease in fb during
chaturbhuj, Vt increased from resting values. However, this increase in Vt was not
sufficient to maintain VE at resting levels and the result was increased PETCO2.
Cardiovascular control and YBE
Performance of Chaturbhuj resulted in the cyclic oscillation of SV, HR, CO (not
shown), MCAv, and MAP with the phases of respiration (Figures 4, 7-10). Another
study (Shannahoff-Khalsa et al., 2004) examined the hemodynamic effects of a 1 breath
per minute YBE where each breath was broken up into three equal parts: 20 seconds of
inspiration, 20 second breath-hold, and 20 seconds of expiration. Similarly, the cited
study noted oscillations of MAP, HR, and SV in response to inspiration and expiration
during the YBE. The oscillation of MAP seen in this study, and the study by Shannahoff-
Khalsa et al. (2004), can be compared to MAP oscillations seen in sleep apnea patients
(Figure 18). However, this is a challenging comparison to make.
YBE are voluntary breathing exercises performed for a short duration while
awake. Sleep apnea is involuntary and can occur throughout sleep. When performed by
an experienced YB, hypoventilatory YBE result in hypoxic hypercapnia, though not to
the same degree as severe OSA (Dempsey et al., 2010). Patients with OSA often get
very little sleep and are plagued with chronic sympathetic activation, which can lead to
many problems, including cardiovascular disease (Dempsey et al., 2010). To this

71
author’s knowledge, resting sympathetic activation has not been measured in YB.
Training in YBE did not affect the response of MCAv to either Duffin re-breathe test.
This data supports the theory that reduced cerebrovascular reactivity in OSA patients is
not singularly due to hypoxic hypercapnia exposure. Though chaturbhuj shares a similar
cyclical MAP response with OSA, it seems unlikely that acute exposure to hypoxic
hypercapnia through voluntary breathing exercises would cause physiological problems
similar to OSA.
Figure 18. Oscillations of SaO2, esophageal pressure (Peso), blood pressure, and sympathetic nerve activity in response to sleep apnea in a single subject (Skatrud, 1999).

72
Chemosensitivity measures
The Duffin re-breathe was used instead of the Read re-breathe in order to quantify
both hypercapnic ventilatory threshold and sensitivity. The Duffin re-breathe adds a 5
minute hyperventilation prior to re-breathing from a bag. During the 5 minutes of
hyperventilation, the subject is coached to maintain their PETCO2 between 18 – 25
mmHg. This “blows off” CO2 in the blood and CO2 stored in tissues. By blowing off
CO2, after each subject takes their three deep breaths from the bag (which contains a
standard gas mixture), every subject starts the re-breathe test at the same level of O2 and
CO2. From this starting point, as PETCO2 rises, we can pin-point the level of PETCO2
from which VE starts to increase – the hypercapnic ventilatory threshold (Duffin &
Mahamed, 2003). This was an important value to collect because hypercapnic ventilatory
threshold has been shown to change in response to IH (Koehle et al., 2007), and has
never been studied in YB.
The purpose of doing two Duffin re-breathe tests (one hypoxic, and one
hyperoxic) was to assess the contribution to the drive to breathe from both and O2 and
CO2. In the hypoxic test, PETO2 was kept between 45 – 50 mmHg and resulted in a SaO2
of approximately 80 %. In this test, the drive to ventilate came from both low oxygen
levels and as the re-breathe progressed, rising carbon dioxide levels. In the hyperoxic
test, PETO2 was kept between 145 – 150 mmHg and resulted in a SaO2 of approximately
98 %. Thus, the drive to breathe in the hyperoxic test was solely from rising carbon
dioxide levels.

73
It is important to note the trend of decreasing baseline ventilation in each
subsequent testing session. The Duffin re-breathe is not a comfortable test, and some
subjects were anxious both before, and during testing. Perhaps baseline ventilation
decreased with subsequent testing sessions because the subjects became more
comfortable with the procedure each time they were tested. This points to a slight flaw in
the study design. If subjects performed four re-breathes for familiarization instead of just
one, perhaps they would have been more relaxed during each testing session.
Other YBE studies have shown decreased hypercapnic ventilatory sensitivity in
experienced YB (Stanescu et al., 1981; Spicuzza et al., 2000; Roggla et al., 2001;
Miyamura et al., 2002), however, this study showed no change following the
intervention. There are four possible main reasons that sensitivity did not change. First,
our stimulus may not have been severe enough. 6 weeks of training may not have been
long enough to see a change. The amount of time subjects were required to practice at
home was less than would be recommended for a serious student. YBE are supposed to
be practiced every day and our subjects practiced 5 days per week. If 5 days a week was
sufficient, perhaps 20 minutes per day did not create enough hypoxia and hypercapnia to
result in altered in chemosensitivity. If subjects were instructed to practice the YBE 7
days a week, and for a longer duration, subject enrollment and compliance would almost
certainly have been lower.
Second, though experimental subjects reported practicing the required amount at
home, there is no way to know if they did. One subject reported that she practiced the
whole time until she was scheduled for her final test, when she explained that in fact, she
hadn’t practiced at home from week 6 – 9.

74
Third, because our sample size was small, removing one subject has a large effect
on statistical analysis. Two experimental subjects and one control subject ascended to
altitude before their final test even though this was an exclusion criterion for participation
in the study. Since we have no way of knowing what their sensitivities would have been
had they not ascended to altitude, this may have had a significant effect. Exposure to
normobaric hypoxia has been shown to increase hypoxic ventilatory sensitivity upon
return to sea level (Ainslie et al., 2005) and in this situation, the exposure could have
‘washed’ any chemosensitivity changes that were due to the intervention.
Fourth, it has been documented that re-breathe tests are quite variable within
subjects (Macnutt et al., 2011), and with a small sample size, variability has an especially
big impact on statistical significance.
Exposure to lower body negative pressure during hypoxia results in an increased
hypoxic ventilatory response (Koehle et al., 2010). This is thought to be because the
carotid chemo and baroreceptors are anatomically so close together (Koehle et al., 2010).
Because of their location, their afferent inputs may interact as they converge into the
nucleus tractus solitaries, resulting in modulation of the signals. A future study may look
at the affect of lower body negative pressure on the MAP response to bhastrika and
chaturbhuj, and hypercapnic ventilatory sensitivity in experienced YB.
Limitations
Though 8 out of 9 experimental subjects finished the study, there were some
subject related events to note. One control subject had asthma, however, it was under
control. Only in patients who have had near-fatal asthma episodes have been shown to
have reduced chemosensitivity, therefore her asthma most likely did not affect her

75
outcome measures (Hida, 1999). A second control subject went to Kenya between weeks
5 and 10 where he was at altitude for three weeks. Altitude has been shown to have an
effect on chemosensitivity (Masuda et al., 1981), however his final test was postponed
until 4 weeks after he returned to sea level. One experimental subject had exercise-
induced asthma, but reported no ill-effects from the re-breathe test. Results did not differ
when these subjects were removed from statistical analysis.
Beginners in YBE are normally required to practice the three locks and the four
purifications every day for three months before they move onto any YBE with significant
breath-holds such as bhastrika, chaturbhuj, or sahit kumbhak. Also, it takes some time
before a student becomes comfortable with the intermediate YBE. During the beginning
stage, the student is focused on the mechanics of the YBE. With regular practice, the
YBE become second nature and the student can simply focus on the breath. However,
because the experimental subjects came in every week for an instructional class, this sped
up the process of getting them to perform the YBE correctly.
We could not quantify the physiological effects of sahit kumbhak due to the
experimental setup. The facemask prevented access to the nose, which is required in
sahit kumbhak. In the future, data could be collected for a modified sahit kumbhak where
each breath is through both nostrils. This would be worth studying as this YBE
employed a inspiration:breath-hold:expiration ratio (1:4:2) that was weighted towards
apnea.

76
Chapter 6: Conclusion
The overall goal of this thesis was to quantify the cardiorespiratory effects of two
YBE: bhastrika and chaturbhuj, and determine the effect of their practice on
chemosensitivity. Though we only studied two YBE in the laboratory, from these two
studies three things have become clear that can be applied to many YBE. First,
hyperventilatory YBE can produce hyperoxic hypocapnia, while hypoventilatory YBE
can produce hypoxic hypercapnia. YBE include complex patterns and in bhastrika, both
of these situations occur: hyperoxic hypocapnia in response to the hyperventilation, and
hypoxic hypercapnia in response to the breath-hold. In chaturbhuj there is hypoxic
hypercapnia due to significantly reduced Vt, and VE.
Second, in response to hypoxic hypercapnia produced by the breath-hold in
bhastrika and low VE in chaturbhuj, there was an increase in MAP. The increase in
MAP was more pronounced in YB (Study 1), and in trained subjects during bhastrika
(Study 2, week 10) because of more severe hypoxic hypercapnia, and most likely
increased sympathetic activation. In week 10, there was no difference in the MAP
response to chaturbhuj. Though it is impossible to know, this result may have been due
to the much smaller data set.
Third, performance of chaturbhuj results in cyclical oscillations of HR, MAP, SV,
and MCAv. This was a novel and significant finding. To this author’s knowledge, these
were the first two studies to examine the physiological effects of chaturbhuj. However,
more analysis is needed to determine how these oscillations affect cardiovascular control
in the long term.

77
In the future, a productive YBE training study should include a longer time
commitment from the experimental subjects. If subjects practiced bhastrika, chaturbhuj,
and sahit kumbhak for 30 minutes a day, 7 days a week, for two months, that would be a
more likely stimulus to reduce chemosensitivity. Additionally, it would be worth
examining the respiratory ratio of sahit kumbhak in an experienced YB to determine the
effect of its practice on end-tidal gases, and to see if there are cardiovascular oscillations
similar to those in chaturbhuj.

78
References
Ainslie PN, Kolb JC, Ide K & Poulin MJ. (2005). Effect of five nights of normobaric hypoxia on cardiovascular responses to acute isocapnic hypoxia in humans: relationship to ventilatory chemosensitivity. Ergonomics 48, 1523-1534.
Andersson J & Schagatay E. (1998). Effects of lung volume and involuntary breathing movements on the human diving response. Eur J Appl Physiol Occup Physiol 77, 19-24.
Benson H, Lehmann JW, Malhotra MS, Goldman RF, Hopkins J & Epstein MD. (1982). Body temperature changes during the practice of g Tum-mo yoga. Nature 295, 234-236.
Bernardi L, Passino C, Wilmerding V, Dallam GM, Parker DL, Robergs RA & Appenzeller O. (2001). Breathing patterns and cardiovascular autonomic modulation during hypoxia induced by simulated altitude. J Hypertens 19, 947-958.
Bernardi L, Spadacini G, Bellwon J, Hajric R, Roskamm H & Frey AW. (1998). Effect of breathing rate on oxygen saturation and exercise performance in chronic heart failure. Lancet 351, 1308-1311.
Bittiner SB & Smith SE. (1986). Beta-adrenoceptor antagonists increase sinus arrhythmia, a vagotonic effect. Br J Clin Pharmacol 22, 691-695.

79
Breskovic T, Valic Z, Lipp A, Heusser K, Ivancev V, Tank J, Dzamonja G, Jordan J, Shoemaker JK, Eterovic D & Dujic Z. (2010). Peripheral chemoreflex regulation of sympathetic vasomotor tone in apnea divers. Clin Auton Res 20, 57-63.
Brown RP & Gerbarg PL. (2005). Sudarshan Kriya Yogic breathing in the treatment of stress, anxiety, and depression. Part II--clinical applications and guidelines. J Altern Complement Med 11, 711-717.
Bruton A & Lewith GT. (2005). The Buteyko breathing technique for asthma: a review. Complement Ther Med 13, 41-46.
Chung SC, Seccombe LM, Jenkins CR, Frater CJ, Ridley LJ & Peters MJ. (2010). Glossopharyngeal insufflation causes lung injury in trained breath-hold divers. Respirology 15, 813-817.
Cooper S, Oborne J, Newton S, Harrison V, Thompson Coon J, Lewis S & Tattersfield A. (2003). Effect of two breathing exercises (Buteyko and pranayama) in asthma: a randomised controlled trial. Thorax 58, 674-679.
Daly M. (1997). Peripheral arterial chemoreceptors and respiratory-cardiovascular integration. Monogr Physiol Soc 46.
Danucalov MA, Simoes RS, Kozasa EH & Leite JR. (2008). Cardiorespiratory and metabolic changes during yoga sessions: the effects of respiratory exercises and meditation practices. Appl Psychophysiol Biofeedback 33, 77-81.

80
Davis FM, Graves MP, Guy HJ, Prisk GK & Tanner TE. (1987). Carbon dioxide response and breath-hold times in underwater hockey players. Undersea Biomed Res 14, 527-534.
Day TA & Wilson RJ. (2007). Brainstem PCO2 modulates phrenic responses to specific carotid body hypoxia in an in situ dual perfused rat preparation. J Physiol 578, 843-857.
Dechman G & Wilson CR. (2004). Evidence underlying breathing retraining in people with stable chronic obstructive pulmonary disease. Phys Ther 84, 1189-1197.
Delapille P, Verin E, Tourny-Chollet C & Pasquis P. (2001). Ventilatory responses to hypercapnia in divers and non-divers: effects of posture and immersion. Eur J Appl Physiol 86, 97-103.
Dempsey JA, Veasey SC, Morgan BJ & O'Donnell CP. (2010). Pathophysiology of sleep apnea. Physiol Rev 90, 47-112.
Donesky-Cuenco D, Nguyen HQ, Paul S & Carrieri-Kohlman V. (2009). Yoga therapy decreases dyspnea-related distress and improves functional performance in people with chronic obstructive pulmonary disease: a pilot study. J Altern Complement Med 15, 225-234.
81
Duffin J & Mahamed S. (2003). Adaptation in the respiratory control system. Can J Physiol Pharmacol 81, 765-773.
Duffin J, Mohan RM, Vasiliou P, Stephenson R & Mahamed S. (2000). A model of the chemoreflex control of breathing in humans: model parameters measurement. Respir Physiol 120, 13-26.
Dujic Z, Ivancev V, Heusser K, Dzamonja G, Palada I, Valic Z, Tank J, Obad A, Bakovic D, Diedrich A, Joyner MJ & Jordan J. (2008). Central chemoreflex sensitivity and sympathetic neural outflow in elite breath-hold divers. J Appl Physiol 104, 205-211.
Ferretti G. (2001). Extreme human breath-hold diving. Eur J Appl Physiol 84, 254-271.
Forster HV, Martino P, Hodges M, Krause K, Bonis J, Davis S & Pan L. (2008). The carotid chemoreceptors are a major determinant of ventilatory CO2 sensitivity and of PaCO2 during eupneic breathing. Adv Exp Med Biol 605, 322-326.
Foster GE, Brugniaux JV, Pialoux V, Duggan CT, Hanly PJ, Ahmed SB & Poulin MJ. (2009). Cardiovascular and cerebrovascular responses to acute hypoxia following exposure to intermittent hypoxia in healthy humans. J Physiol 587, 3287-3299.
Foster GE & Sheel AW. (2005). The human diving response, its function, and its control. Scand J Med Sci Sports 15, 3-12.

82
Gokal R, Shillito L & Maharaj SR. (2007). Positive impact of yoga and pranayam on obesity, hypertension, blood sugar, and cholesterol: a pilot assessment. J Altern Complement Med 13, 1056-1057.
Gold AR, Schwartz AR, Wise RA & Smith PL. (1993). Pulmonary function and respiratory chemosensitivity in moderately obese patients with sleep apnea. Chest 103, 1325-1329.
Grassi B, Ferretti G, Costa M, Ferrigno M, Panzacchi A, Lundgren CE, Marconi C & Cerretelli P. (1994). Ventilatory responses to hypercapnia and hypoxia in elite breath-hold divers. Respir Physiol 97, 323-332.
Hari Dass B. (1981). Ashtanga Yoga Primer. Sri Rama Publishing.
Hari Dass B. (1999). The Yoga Sutras of Patanjali - A Study Guide for Book I Samadhi Pada. Sri Rama Publishing.
Hentsch U & Ulmer HV. (1984). Trainability of underwater breath-holding time. Int J Sports Med 5, 343-347.
Hida W. (1999). Role of ventilatory drive in asthma and chronic obstructive pulmonary disease. Curr Opin Pulm Med 5, 339-343.

83
Ingram RH, Jr. & Schilder DP. (1967). Effect of pursed lips expiration on the pulmonary pressure-flow relationship in obstructive lung disease. Am Rev Respir Dis 96, 381-388.
Ivancev V, Bakovic D, Obad A, Breskovic T, Palada I, Joyner MJ & Dujic Z. (2009). Effects of indomethacin on cerebrovascular response to hypercapnea and hypocapnea in breath-hold diving and obstructive sleep apnea. Respir Physiol Neurobiol 166, 152-158.
Ivancev V, Palada I, Valic Z, Obad A, Bakovic D, Dietz NM, Joyner MJ & Dujic Z. (2007). Cerebrovascular reactivity to hypercapnia is unimpaired in breath-hold divers. J Physiol 582, 723-730.
Izumizaki M, Pokorski M & Homma I. (2004). Role of the carotid bodies in chemosensory ventilatory responses in the anesthetized mouse. J Appl Physiol 97, 1401-1407.
Johnson DB, Tierney MJ & Sadighi PJ. (2004). Kapalabhati pranayama: breath of fire or cause of pneumothorax? A case report. Chest 125, 1951-1952.
Joulia F, Lemaitre F, Fontanari P, Mille ML & Barthelemy P. (2009). Circulatory effects of apnoea in elite breath-hold divers. Acta Physiol (Oxf) 197, 75-82.

84
Koehle MS, Foster GE, McKenzie DC & Sheel AW. (2005). Repeated measurement of hypoxic ventilatory response as an intermittent hypoxic stimulus. Respir Physiol Neurobiol 145, 33-39.
Koehle MS, Giles LV, Walsh ML & White MD. (2010). The effects of lower body positive and negative pressure on the hypoxic ventilatory decline. Respir Physiol Neurobiol 172, 37-41.
Koehle MS, Sheel AW, Milsom WK & McKenzie DC. (2007). Two patterns of daily hypoxic exposure and their effects on measures of chemosensitivity in humans. J Appl Physiol 103, 1973-1978.
Lin YC, Lally DA, Moore TO & Hong SK. (1974). Physiological and conventional breath-hold breaking points. J Appl Physiol 37, 291-296.
Lindholm P, Nordh J & Gennser M. (2006). The heart rate of breath-hold divers during static apnea: effects of competitive stress. Undersea Hyperb Med 33, 119-124.
Macnutt MJ, De Souza MJ, Tomczak SE, Homer JL & Sheel AW. (2011). Resting and Exercise Ventilatory Chemosensitivity across the Menstrual Cycle. J Appl Physiol.
Mahamed S & Duffin J. (2001). Repeated hypoxic exposures change respiratory chemoreflex control in humans. J Physiol 534, 595-603.

85
Masuda Y, Yoshida A, Hayashi F, Sasaki K & Honda Y. (1981). The ventilatory responses to hypoxia and hypercapnia in the Ama. Jpn J Physiol 31, 187-197.
McKay JAA, Stewart K, Querido JS, Foster GE, Koehle MS & Sheel AW. (2010). Long-term practice of yogic breathing exercises may be associated with increased blood pressure during breath-holds. Appl Physiol Nutr Metab 35, S68.
Miyamura M, Nishimura K, Ishida K, Katayama K, Shimaoka M & Hiruta S. (2002). Is man able to breathe once a minute for an hour?: the effect of yoga respiration on blood gases. Jpn J Physiol 52, 313-316.
Mohan R & Duffin J. (1997). The effect of hypoxia on the ventilatory response to carbon dioxide in man. Respir Physiol 108, 101-115.
Mohrman David E. HLJ. (2006). Cardiovascular Physiology. McGraw-Hill.
Muktibodhananda S. (2006). Hatha Yoga Pradipika.
Naga Venkatesha Murthy PJ, Janakiramaiah N, Gangadhar BN & Subbakrishna DK. (1998). P300 amplitude and antidepressant response to Sudarshan Kriya Yoga (SKY). J Affect Disord 50, 45-48.

86
Osmond JM, Mintz JD, Dalton B & Stepp DW. (2009). Obesity increases blood pressure, cerebral vascular remodeling, and severity of stroke in the Zucker rat. Hypertension 53, 381-386.
Placidi F, Diomedi M, Cupini LM, Bernardi G & Silvestrini M. (1998). Impairment of daytime cerebrovascular reactivity in patients with obstructive sleep apnoea syndrome. J Sleep Res 7, 288-292.
Pomidori L, Campigotto F, Amatya TM, Bernardi L & Cogo A. (2009). Efficacy and tolerability of yoga breathing in patients with chronic obstructive pulmonary disease: a pilot study. J Cardiopulm Rehabil Prev 29, 133-137.
Pramanik T, Pudasaini B & Prajapati R. (2010). Immediate effect of a slow pace breathing exercise Bhramari pranayama on blood pressure and heart rate. Nepal Med Coll J 12, 154-157.
Pramanik T, Sharma HO, Mishra S, Mishra A, Prajapati R & Singh S. (2009). Immediate effect of slow pace bhastrika pranayama on blood pressure and heart rate. J Altern Complement Med 15, 293-295.
Przybylowski T, Bangash MF, Reichmuth K, Morgan BJ, Skatrud JB & Dempsey JA. (2003). Mechanisms of the cerebrovascular response to apnoea in humans. J Physiol 548, 323-332.
87
Querido JS, Godwin JB & Sheel AW. (2008). Intermittent hypoxia reduces cerebrovascular sensitivity to isocapnic hypoxia in humans. Respir Physiol Neurobiol 161, 1-9.
Read DJ. (1967). A clinical method for assessing the ventilatory response to carbon dioxide. Australas Ann Med 16, 20-32.
Roggla G, Kapiotis S & Roggla H. (2001). Yoga and chemoreflex sensitivity. Lancet 357, 807.
Saraswati SS. (2006). Asana Pranayama Mudra Bandha. Yoga Publications Trust.
Schagatay E, van Kampen M & Andersson J. (1999). Effects of repeated apneas on apneic time and diving response in non-divers. Undersea Hyperb Med 26, 143-149.
Selim M, Jones R, Novak P, Zhao P & Novak V. (2008). The effects of body mass index on cerebral blood flow velocity. Clin Auton Res 18, 331-338.
Severinghaus JW. (1979). Simple, accurate equations for human blood O2 dissociation computations. J Appl Physiol 46, 599-602.
88
Shannahoff-Khalsa DS & Beckett LR. (1996). Clinical case report: efficacy of yogic techniques in the treatment of obsessive compulsive disorders. Int J Neurosci 85, 1-17.
Shannahoff-Khalsa DS, Sramek BB, Kennel MB & Jamieson SW. (2004). Hemodynamic observations on a yogic breathing technique claimed to help eliminate and prevent heart attacks: a pilot study. J Altern Complement Med 10, 757-766.
Singh V, Wisniewski A, Britton J & Tattersfield A. (1990). Effect of yoga breathing exercises (pranayama) on airway reactivity in subjects with asthma. Lancet 335, 1381-1383.
Skatrud JB, Badr, M.S., Morgan B.J. (1999). Control of breathing during sleep and sleep disordered breathing. In: Control of Breathing in Health and Didease. Dekker.
Spicuzza L, Gabutti A, Porta C, Montano N & Bernardi L. (2000). Yoga and chemoreflex response to hypoxia and hypercapnia. Lancet 356, 1495-1496.
Stanescu DC, Nemery B, Veriter C & Marechal C. (1981). Pattern of breathing and ventilatory response to CO2 in subjects practicing hatha-yoga. J Appl Physiol 51, 1625-1629.
Thoman RL, Stoker GL & Ross JC. (1966). The efficacy of pursed-lips breathing in patients with chronic obstructive pulmonary disease. Am Rev Respir Dis 93, 100-106.

89
West JB. (2005). Respiratory Physiology The Essentials.