THE EFFECT OF CAPITAL STRUCTURE ON THE CORPORATE …chss.uonbi.ac.ke/sites/default/files/chss/Ken...
71
THE EFFECT OF CAPITAL STRUCTURE ON THE CORPORATE GOVERNANCE OF COMPANIES LISTED AT THE NAIROBI SECURITIES EXCHANGE BY KEN CHOMBA D63/75846/2012 RESEARCH PROJECT IN PARTIAL FULFILMENT OF THE REQUIREMENTS FOR THE AWARD OF THE DEGREE OF MASTERS OF SCIENCE IN FINANCE OF THE UNIVERSITY OF NAIROBI OCTOBER 2013
Transcript of THE EFFECT OF CAPITAL STRUCTURE ON THE CORPORATE …chss.uonbi.ac.ke/sites/default/files/chss/Ken...
THE EFFECT OF CAPITAL STRUCTURE ON THE CORPORATE GOVERNANCE OF COMPANIES LISTED AT THE
NAIROBI SECURITIES EXCHANGE
BY
KEN CHOMBA
D63/75846/2012
RESEARCH PROJECT IN PARTIAL FULFILMENT OF THE
REQUIREMENTS FOR THE AWARD OF THE DEGREE
OF MASTERS OF SCIENCE IN FINANCE OF THE
UNIVERSITY OF NAIROBI
OCTOBER 2013
ii
DECLARATION
This is my original work and has not been presented in any other university or college
for examination purpose.
Signature…………………… Date………………………………
Ken Chomba
Reg No: D63/75846/2012
Supervisor’s Declaration
This research project has been submitted for examination with my approval as the
University Supervisor.
Signature…………………… Date………………………………
Dr. Cyrus Iraya
Senior Lecturer,
Department of Finance and Accounting:
University Of Nairobi

iii
ACKNOWLEDGEMENT
I wish to thank The Almighty God for His grace and favor upon me all this while. I wish
to express my gratitude to my supervisor, Dr. Cyrus Irayafor his professional guidance
andmotivation that enabled me compile this project. I also extend gratitude to my
parents for their unending support throughout my education.
iv
DEDICATION
To my mother Mary; for her parental love, guidance and humble upbringing.
To my sister Irene; for her inspiration and encouragement to great achievement.
To my lecturers, fellow students and true friends; for their social and academic backing.

v
ABSTRACT
Corporate governance is concerned with the way that power is exercised over corporate entities. Capital structure refers to the combination of debt and equity capital that a firm uses to finance its long-term operations. The capital structure choice of the firms becomes important factor in corporate governance practices. The relation between capital structure and corporate governance becomes extremely important when considering its fundamental role in value generation and distribution. The objective of this study was to investigate the effect of capital structure on corporate governance of firms listed at the Nairobi security exchange. The study employed descriptive survey design with the population of the study being 51 companies listed on the NSE.The sample size for this study was made up of 35 listed companies excluding the financial, investment and insurance companies due to their peculiar nature of capital structure.The study used secondary data from annual reports of the quoted companies over a period of five years. The data was analyzed through the use of Statistical Package for Social Sciences (SPSS). Results from the study indicate that most firms in the NSE use more debt or long term liability as a source of financing than equity capital from shareholders. ANOVA statistics presented showed that the overall model was statistically significant as this was supported by an F statistic of 3.4 and a probability (p) value of 0.021. Regression of coefficients results showed that there was a positive relationship between corporate governance and capital structure, size of the firm, liquidity and firm opportunity whose beta coefficients are 0.072, 0.000, 0.215 and 0.933 respectively. Statistically significant variables in the study were capital structure, size of the firm and opportunity of the firm as they had p values of 0.000, 0.008 and 0.034 which is lower than the probability conventional of 0.05. These findings show thatcompanies in the NSE have good return on assets and have the ability to meet their short term obligations when they fall due. Further, most firms in the NSE use more debt or long term liability as a source of financing than equity capital from shareholders. This study adds on to theory because it tests the reverse relationship between capital structure and corporate governance.
Table of Contents DECLARATION ............................................................................................................. ii

vi
ACKNOWLEDGEMENT ............................................................................................. iii
DEDICATION ................................................................................................................ iv
ABSTRACT ..................................................................................................................... v
LIST OF TABLES ....................................................................................................... viii
LIST OF FIGURES ........................................................................................................ x
LIST OF ABBREVIATIONS ....................................................................................... xi
CHAPTER ONE:INTRODUCTION ............................................................................ 1
1.1 Background of the Study ..................................................................................... 1
1.1.1 Corporate Governance .................................................................................... 2
1.1.2 Capital Structure ............................................................................................. 3
1.1.3 Relationship between Capital Structure and Corporate Governance.............. 6
1.1.4 Nairobi Securities Exchange ........................................................................... 8
1.2 Research Problem ............................................................................................... 9
1.3 Objective of the study ....................................................................................... 11
1.4 Value of the study ............................................................................................. 11
CHAPTER TWO:LITERATURE REVIEW ……………………………………….13
2.1 Introduction ...................................................................................................... 13
2.2 Theoretical Review ........................................................................................... 13
2.2.1 Agency Theory ............................................................................................ 13
2.2.2 Pecking Order Theory ................................................................................... 15
2.2.3 Free Cash Flow Theory................................................................................. 15
2.3 Measures of Capital Structure and Corporate Governance .............................. 16
2.3.1 Measures of Capital Structure....................................................................... 17
2.3.2 Measures of Corporate Governance ............................................................. 18
2.4 Empirical Review ............................................................................................. 19

vii
2.5 Summary of Literature Review ........................................................................ 24
CHAPTER THREE:RESEARCH METHODOLOGY…………………………… 26
3.1 Introduction ...................................................................................................... 26
3.2 Research Design ............................................................................................... 26
3.3 Population ......................................................................................................... 27
3.4 Sampling Technique ......................................................................................... 27
3.5 Data Collection Method ................................................................................... 28
3.6 Data Processing and Analysis .......................................................................... 28
CHAPTER FOUR:DATA ANALYSIS, RESULTS AND DISCUSSION… ………31
4.1 Introduction ...................................................................................................... 31
4.2 Descriptive Statistics ........................................................................................ 31
4.3 Trend Analysis ................................................................................................. 32
4.3.1 Annual Trends in Corporate Governance ................................................. 32
4.3.2 Annual Trends in Capital Structure .......................................................... 33
4.3.3 Annual Trends in Size of the Firm ............................................................ 34
4.3.4 Annual Trends in Liquidity of Firms ........................................................ 35
4.3.5 Annual Trends in Firms Opportunity ........................................................ 36
4.4 Inferential Statistical Analysis .......................................................................... 37
4.4.1 Pearson’s Correlation ................................................................................ 37
4.4.2 Regression Analysis .................................................................................. 38
4.5 Discussion of Findings ..................................................................................... 41
CHAPTER FIVE:SUMMARY, CONCLUSION AND RECOMMENDATION S
......................................................................................................................................... 43
5.1 Introduction ...................................................................................................... 43
5.2 Summary of Findings ....................................................................................... 43
viii
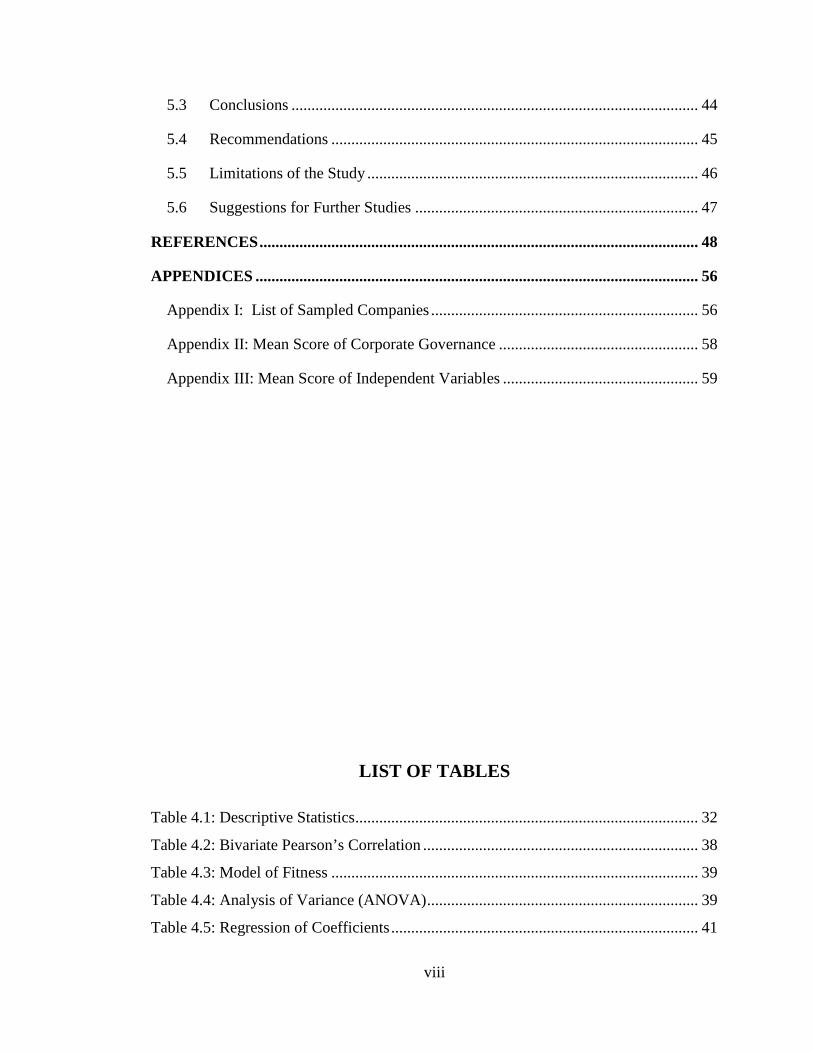
5.3 Conclusions ...................................................................................................... 44
5.4 Recommendations ............................................................................................ 45
5.5 Limitations of the Study ................................................................................... 46
5.6 Suggestions for Further Studies ....................................................................... 47
REFERENCES .............................................................................................................. 48
APPENDICES ............................................................................................................... 56
Appendix I: List of Sampled Companies ................................................................... 56
Appendix II: Mean Score of Corporate Governance .................................................. 58
Appendix III: Mean Score of Independent Variables ................................................. 59
LIST OF TABLES
Table 4.1: Descriptive Statistics ...................................................................................... 32
Table 4.2: Bivariate Pearson’s Correlation ..................................................................... 38
Table 4.3: Model of Fitness ............................................................................................ 39
Table 4.4: Analysis of Variance (ANOVA) .................................................................... 39
Table 4.5: Regression of Coefficients ............................................................................. 41

ix

x
LIST OF FIGURES
Figure 4.1: Trend Analysis in Corporate Governance .................................................... 33
Figure 4.2: Trend Analysis in Capital Structure ............................................................. 34
Figure 4.3: Trend Analysis in Size of the Firm ............................................................... 35
Figure 4.4: Trend Analysis in Firms Liquidity ............................................................... 36
Figure 4.5: Trend Analysis in Opportunity of the Firm .................................................. 37

xi
LIST OF ABBREVIATIONS
CDSC-Central Depository and Settlement Corporation
CMA-Capital Markets Authority
CMC - Cooper Motor Corporation
EAC-East Africa Community
ISS-Institutional Shareholder Services
KSE-Karachi Stock Exchange
LSE- Lahore Stock Exchange
NSE-Nairobi Security Exchange
ROE - Return on equity
SME’s - Small & Medium enterprises

1
CHAPTER ONE
INTRODUCTION
1.1 Background of the Study
The importance of capital structure in a growing organization is imminent. Moreover,
there is need to understand different sources of funds for organizations and what informs
the decision on their choice of capital structure. A company that uses very high leverage
may face high risk of debt as it is obligated to pay consistent interest to its lenders. This
limits payment of dividends to the shareholders (Onyuma, Mugo&Karuiya, 2012). Low
or non-payment of dividends discourages investors from investing in shares thus
reducing the shareholding capacity. High debt levels are also not optimal because they
may lead to losses. When a company incurs losses, then it also loses it tax shield. In
addition, high levels of debt lead to financial distress and bankruptcycosts. This may
erode the brand image and confidence that investors have on the company(Adelegan,
2009).
On the other hand, debt has a positive side to it. It creates leverage on the few resources
of the company. A company is therefore able to exploit growth opportunity projects
using debt and this has a positive impact on the maximization of shareholder wealth.
The improvement in shareholders wealth is the main objective of any profit making
organization(Suhaila and Mahmood, 2009). The advantages and disadvantages of
leverage imply that firms operating in a turbulent social and economic environment
needs to do a balancing act on the use of equity and debt. In other words, it is a key

2
concern for a profit maximizing firm to choose an optimal capital structure. However,
the means to choosing appropriate and acceptable capital structure by firm’s top
management is still highly debated and a lot of inconclusiveness exists. Currently, there
exists no conclusive research on how best to achieve an optimal capital structure and
one may argue that this debate will continue into the foreseeable future (Pindado and
Torre, 2004).
1.1.1 Corporate Governance
According to Rukaria (2010), corporate governance is about structures and institutions
by which rights and obligations among different participants in corporate world such as
the board, management, shareholder and other stakeholders are spelt to ensure equity
and fair play. Through strengthening of these structures, institutions are able to promote
corporate fairness, transparency and accountability. According to Tricker (2010)
corporate governance is a complex multi-faceted subject matter involving not only
legislation and regulation but also what is known as ‘best practice’, which is a matter of
corporate culture, mind-set and education. Corporate governance is concerned with the
way that power is exercised over corporate entities. All corporate entities need
governing; be they listed companies, wholly owned subsidiaries, family dominated
companies, joint ventures, not-for-profit entities and any other.
Corporate Governance is concerned with holding the balance between economic and
social goals and between individual and communal goals. The corporate governance
framework is there to encourage the efficient use of resources and likewise require
accountability for the stewardship of these resources. The proper governance of

3
companies will become as crucial to the world economy as the proper governance of
countries, clearly stated by James D. Wolfensohn, President of the World Bank
(Gatamah, 2004).The aim is to align as nearly as possible the interests of individuals,
corporations and society.
Corporate Governance is measured in various ways;financial efficiency, social
legitimacy or more generally goal attainment (Aguilera et al., 2008).In order to analyze
the impact that Corporate Governance has on different measures of corporate
performance, academics and commercial providers have either used individual variables
(such as board independence and ownership structure)or have attempted to construct
composite measures of corporate governance practices. Despite considerable efforts and
despite considerable sophistication of measures and methods, the results so far are
surprisingly ambiguous and contradictory (Bhaghat et al., 2008). In particular, it has
proven very difficult to show that even sophisticated professional measures of the
quality of a company’s corporate governance system produced by different commercial
providers are indeed able to predict future performance.
1.1.2 Capital Structure
Capital structure refers to the combination of debt and equity capital that a firm uses to
finance its long-term operations. Brealey and Myers (2003) define capital structure as
the firm’s mix of different securities used in financing its investments. They observe that
a firm can issue dozens of distinct securities in countless combinations, but it tries to
find the particular combination that maximizes its overall market value. Capital structure
refers to the mix of its financial resources available to a business (Myers, 2003). Akram

4
and Ahmad (2010) describe the capital structure of a firm as the components of its
sources of financing, broadly categorized as equity and debt. Equity is the finance that is
provided by owners of the business. The equity finance holders own a portion of the
firm denominated in shares and they are entitled to the profits of a business and are also
entitled to share in the risks of the business
The value of a firm depends upon its expected earnings stream and the rate used to
discount this stream. The rate used to discount earnings stream is the firms required rate
of return or the cost of capital. Capital structure decision can thus affect the value of the
firm either by changing the expected earnings or the cost of capital or both.
Capital structure refers to the mix of its financial resources available to a business
(Myers, 2003). Brockington (1990) describe the capital structure of a firm as the
components of its sources of financing, broadly categorized as equity and debt. Equity is
the finance that is provided by owners of the business. An optimal capital structure
would be obtained at the combination of debt and equity that maximizes the total value
of the firm (Value of equityplus value of debt) or minimizes the weightedaverage cost of
capital(Pandey, 2002).
There are various measures of capital structure, which can be classified as accounting
based measures. When choosing a measure of capital structure, it is useful to keep in
mind that the theoretical framework for the relationship between capital and
performance is based on market values of leverage. Since market values of leverage may
be difficult to obtain, accounting based measures are often applied as proxies. Rajan and
5
Zingales (1995) suggest that the choice of measure should be based on the objective of
the analysis. For instance, the ratio of total liabilities to total assets can be considered as
a proxy for what is left for shareholders after liquidation, but is not a good indication of
the firm’s risk of default in the near future. Also, since total liabilities include such
balance sheet items as accounts payable, which are used for transactions purposes rather
than for financing, it may overstate the amount of leverage. This measure can be
improved by subtracting accounts payable and other liabilities from total assets. There is
still one issue of concern since the measure contains liabilities that are not related to
financing, for example, pension liabilities, thereby underestimating the size of leverage.
The ratio of total debt to capital, where capital is defined as total debt plus equity, is
assumed to solve this problem and can be seen as the best accounting based proxy for
leverage (Rajan and Zingales, 1995). Total Debt / Equity is a measure of all of a
company's future obligations on the balance sheet relative to equity. However, the ratio
can be more discerning as to what is actually a borrowing, as opposed to other types of
obligations that might exist on the balance sheet under the liabilities section. For
example, often only the liabilities accounts that are actually labeled as "debt" on the
balance sheet are used in the numerator, instead of the broader category of "total
liabilities". In other words, actual borrowings like bank loans and interest-bearing debt
securities are used, as opposed to the broadly inclusive category of total liabilities
which, in addition to debt-labeled accounts, can include accrual accounts like unearned
revenue and contra accounts like allowance for bad debts.

6
1.1.3 Relationship between Capital Structure and Corporate Governance
The capital structure choice of the firms becomes important factor in corporate
governance practices. Financial policies of the firms are commonly the real problem of
the decision-making process. It could be a subject of debates among many interests of
organization.Meanwhile, the issue of corporate capital structure itself becomes one of
the central controversies in modern corporate finance theories. Debates are centered on
optimum capital structure: whether or not an optimum capital structure is relevant for
individual firm’s choice. Chevalier &Rokhim (2006) insist that well-defined target debt
ratio for individual firmis not relevant. Since asymmetry of information is present in the
capital market, firmsprefer to use retained earnings as their main source of funds in
investment than debt. Three famous theories currently dominate the debates of firm
capital structure, namely free cash-flow model, pecking-order model and agency theory
model(Chevalier &Rokhim, 2006).
According to free cash flow theory of capital structure innovated by Jensen (1986),
leverage itself can also act as a monitoring mechanism and thereby reduces the agency
problem (hence increasing firm value), by reducing the agency costs of free cash flow.
There are some consequences derived if firm is employing higher leverage level.
Managers of such firm will not be able to invest in non-profitable new projects, as doing
so the new projects might not be able to generate cash flows to the firm, hence managers
might fail in paying the fixed amount of interest on the debt or the principal when it’s
due. It also might cause in the inability to generate profit in a certain financial year that
may result in failing to pay dividends to firm shareholders. Agency theory is a concept
7
that explains why behavior or decisions vary when exhibited by members of a group.
Specifically, it describes the relationship between one party called the principal that
delegates work to another, called the agent. It explains their differences in behavior or
decisions by noting that the two parties often have different goals and independent of
their respective goals, may have different attitudes toward risk. The capital structure
may include debt covenant if leverage is a part of capital structure. The debt covenants
act as a corporate governance mechanism and may influence how the other corporate
governance mechanisms such as board characteristics are
structured(MurtishawandSathaye, 2006).
RehmanandRehman (2010) found that there is no relationship between corporate
governance and capital structure in the banking sector of Pakistan, their findings show
that all independent variables are positively related with capital structure but overall
there is an insignificant relationship between capital structure and corporate governance.
Kumar (2006) results show that the debt structure is non-linearly linked to the corporate
governance.
They find that firms with weaker corporate governance mechanisms, dispersed
shareholding pattern, they do not find any significant relationship between ownership of
directors and corporate with the capital structure.

8
1.1.4 NairobiSecurities Exchange
In Kenya dealing in shares and stock started in the 1920’s when the country was still
under the British colony. There was no formal market, no rules and no regulations to
govern stock broking activities. Trading took place on gentlemen agreement in which
standard commissions were charged with clients being obligated to honor their
contractual commitments of making good delivery and settling relevant costs. At that
time, stock broking was a sideline business conducted by accountants, auctioneers,
estate time agents and lawyers who met to exchange price over a cup of coffee. These
firms were engaged in other areas of specialization, therefore the need for association
did not rise.
In 1951 an Estate Agent by the name of Francis Drummond established the first
professional stock broking firm. They impressed upon Sir Ernest Vasey the idea of
setting up a stock exchange in 1953 and the London Officials accepted to recognize the
setting up of the Nairobi Stock Exchange (NSE) as an overseas stock exchange (Muga,
1974). The Nairobi Stock Exchange was constituted as a voluntary association of stock
brokers registered under the societies Act in 1954. The dealing in shares was then
confined to the resident European community, since Africans and Asians were not
permitted to trade in securities until after the attainment of independence in 1963.
The Nairobi stock exchange (NSE, 2011) was established in 1954 as a voluntary
association of stock brokers with the objective to facilitate mobilization of resources to
provide long term capital for financing investments. Through stringent listing
requirements the market promotes higher standards of accounting, resource management

9
and transparency in the management of business. The NSE is regulated by Capital
Markets Authority (CMA, 2011) which provides surveillance for regulatory compliance.
The exchange has continuously lobbied the government to create conducive policy
framework to facilitate growth of the economy and the private sector to enhance growth
of the stock market (Ngugi, 2005). The NSE is also supported by the Central Depository
and Settlement Corporation (CDSC) which provides clearing, delivery and settlement
services for securities traded at the Exchange. It oversees the conduct of Central
Depository Agents comprised of stockbrokers and investments banks which are
members of NSE and Custodians (CDSC, 2004). These regulatory frameworks are
aimed to sustain a robust stock market exchange that supports a cogent and efficient
allocation of capital allowing price discovery to take place freely based on the market
forces.
1.2 Research Problem
The relation between capital structure and corporate governance becomes extremely
important when considering its fundamental role in value generation and distribution
(Bhagat and Jefferis, 2002). Through its interaction with other instruments of corporate
governance, firm capital structure becomes capable of protecting an efficient value
creation process, by establishing the ways in which the generated value is later
distributed (Zingales, 1998); in other words the surplus created is influenced (Zingales,
2000). Capital structure has become an instrument of corporate governance, not only the
mix between debt and equity and therewell known consequences as far as taxes go must
be taken into consideration. The way in which cash flow is allocated (cash flow right)
10
and, even more importantly, now the right to make decisions and manage the firm
(voting rights) is dealt with must also be examined. For example, venture capitalists are
particularly sensitive to how capital structure and financing contracts are laid out, so that
optimal corporate governance can be guaranteed while incentives and checks for
management behavior are well established (Zingales,2000).
Firms listed in Nairobi securities exchange have increasingly used debt especially after
the pursuit of expansion policies by the government of Kenya since the year 2002 at the
same time corporate Governance has also received increased attention from both policy
makers and practitioners.The problem is - does use of debt affect the corporate
governance mechanism employed by firms? However some listed firms also show poor
corporate governance such as CMC motors which was delisted because of board wars.
Others have issued corporate bonds for example Safaricom,Consolidated bankand
Kengen. It may be important to investigate whether the trends in capital structure
influences the trends in corporate governance.
Studies conducted about capital structure and corporate governance has ended up with
mixed results.Rehman and Raoof (2010) investigated the relationship between corporate
governance and capital structure of randomly selected 19 banks of Pakistan from 2005-
2006 and found a positive relationship. Similar positive relation was reported by
Rajendran (2012) in his study ofSrilankan manufacturing firms. Contradictory findings
are reported by Saad (2010) who studied 126 Malaysian publically listed companies and
results showed a negative relationship. Due to such mixed findings, there is need for a
Kenyan specific study in order to establish which school of thought is supported by the

11
Kenyan phenomena.It is for this research gap that the study wished to address the
following research question: what are the effects of capital structure on corporate
governance of firms listed at the Nairobi security exchange?
1.3 Objective of the study
The objective of this study was to investigate the effect of capital structure on corporate
governance of firms listed at the Nairobi security exchange.
1.4 Value of the study
The choice of the financial policy is one of the most important decisions that a company
will ever take. It consists on determining the optimal capital structure of the companies.
This researchwill provide assistance in evaluating whether corporate governance of
firms listed at the Nairobi Securities Exchange is determined by capital structure.
This study is useful to the managers in guiding them towards making financing
decisions that are in line with Shareholders wealth maximization and will help
manager’s to know if their firms have been reducing their interest –bearing liabilities. It
will also help firms towards establishing their creditworthiness.Furthermore, the study
will help investors to increase their investment opportunities by creating
arbitrageopportunities.Academicians will use the research to add on their wealth of
knowledge and constitute a firm foundation for further research in the area of study. The
study will guide other researchers who may wish to do a similar study in the other East
Africa Community (EAC) member countries.

12

13
CHAPTER TWO
LITERATURE REVIEW
2.1 Introduction
This chapter discusses theories relevant to the study. Literature related to the study is
also reviewed with the aim of identifying literature gaps. The literature review guides
the relevance of the study findings
2.2 Theoretical Review
This section contains review of theories relevant to the study.
2.2.1 Agency Theory
This theory has its origins in the early 1930s whenBerle& Means (1932) explored the
corporate revolution. They revealed that at the early stage, corporations were managed
by the founders themselves. As corporations grew, the owners sought external sources
of financing. Hence, corporations issued equity. As a result, corporations became owned
by external shareholders, where the evolution of separation between owners (ownership)
and managers (control) commenced.
There are three types of separation of ownership and control. The first is majority
control. This is where some of the shareholders ownmajority of shares, and the

14
remainders are widely diffused and only hold a portion of the shares. Hence, only the
remainder shareholders are separated from control. The second is minority control,
where ownership is widely spread. As such, the greater part of ownership is practically
without control. The third is management control. There is no existence of large
minority shareholders which results directors or managers responsible in controlling the
corporation. The third type of separation of ownership and control is known as Quasi-
public Corporation, which it has been resulted as the increment of owners. This
happened because Quasi-public Corporationgets its supply of capital from a group of
investors, known as “investing public” (Berle& Means, 2002, p. 6). There are two types
of investors, which are either as an individual, they invest directly in purchasing the
corporation’s stocks or bonds, or invest indirectlyby investing in insurance companies,
banks and investment trusts, which will invest in corporate securities on behalf of the
investors.
Goergen andRenneboog (2001) argued that if there areinsufficient monitoring
mechanisms in a firm such as having a diffuse ownership structure (which is the
opposite of the ownership concentration structure), it may lead to high managerial
discretion which may increase the agency costs. As has been argued in the literature, the
level of monitoring is a function of such variables as institutional ownership, block
ownership by outsiders, the technology in place to monitor the managers (Bajaj, Chan
&Dasgupta, 1998) and forecasted profit gain derived from the monitoring (Demsetz&
Lehn, 2005).

15
2.2.2 Pecking Order Theory
Pecking Order Theory, states that capital structure is driven by firm's desire to finance
new investments, first internally, then with low-risk debt, and finally if all fails, with
equity. Therefore, the firms prefer internal financing to external financing (Myers and
Majluf, 1984). This theory is applicable for large firms as well as small firms. Since
smallfirms are opaque and have important adverse selection problems that are explained
by credit rationing; they bear high information costs (Psillaki, 1995). Since the quality
of small firms financial statements vary, small firms usually have higher levels
ofasymmetric information. Even though investors may prefer audited financial
statements, small firms may want to avoid these costs (Pettit and Singer, 1985).
Therefore, when issuing new capital, those costs are very high, but for internal funds,
costs can be considered as none. For debt, the costs are in an intermediate position
between equity and internal funds. As a result, firms prefer first internal financing
(retained earnings), then debt and they choose equity as a last resort (Pettit and Singer,
1985)
2.2.3 Free Cash Flow Theory
According to free cash flow theory of capital structure innovated by Jensen (1986),
leverage itself can also act as a monitoring mechanism and thereby reduces the agency
problem hence increasing firm value, by reducing the agency costs of free cash flow.
There are some consequences derived if firm is employing higher leverage level.
Managers of such firm will not be able to invest in non-profitable new projects, as doing
so the new projects might not be able to generate cash flows to the firm, hence managers

16
might fail in paying the fixed amount of interest on the debt or the principal when it’s
due. It also might cause in the inability to generate profit in a certain financial year that
may result in failing to pay dividends to firm shareholders.
Furthermore, in employing more leverage, managers are forced to distribute the cash
flows, including future cash flows to the debt holders as they are bonded in doing so at a
fixed amount and in a specified period of time. If managers fail in fulfilling this
obligation, debt holders might take the firm into bankruptcy case. This risk may further
motivate managers to decrease their consumption of perks and increase their efficiency
(Grossman and Hart, 1982). This statement has been supported by Jensen (1986) which
states that from the agency view, the higher the degree of moral hazard, the higher the
leverage of the firm should be as managers will have to pay for the fixed obligation
resulting from the debt. Hence, it will reduce managers’ perquisites. Extensive research
suggests that debt can act as a self-enforcing governance mechanism; that is, issuing
debt holds managers’ “feet to the fire” by forcing them to generate cash to meet interest
and principle obligations (Gillan, 2006).Measures of capital structure and corporate
governance
2.3 Measures of Capital Structure and Corporate Governance
The relation between capital structure and corporate governance becomes extremely
important when considering its fundamental role in value generation and distribution
(Bhagat and Jefferis, 2002). Capital structure has become an instrument of corporate
governance; not only the mix between debt and equity and their well-
knownconsequences as far as taxes go must be taken into consideration. Through its

17
interaction with other instruments of corporate governance, firm capital structure
becomes capable of protecting an efficient value creation process, by establishing the
ways in which the generated value is later distributed (Zingales, 1998); in other words
the surplus created is influenced (Zingales, 2000).
2.3.1 Measuresof CapitalStructure
Capital structure can be measured by the amount of debt. The debt to equity ratio gives
the proportion of company assets that are financed by debt versus equity. It is a common
measure of the long-term viability of a company's business and, along with current ratio,
a measure of its liquidity, or its ability to cover its expenses. As a result, debt to equity
calculations often only includes long-term debt rather than a company's total liabilities.
(Chevalier and Rokhim, 2006)
A high debt to equity ratio implies that the company has been aggressively financing its
activities through debt and therefore must pay interest on this financing. If the
company's assets generate a greater return than the interest payments, then the company
can generate greater earnings than it would without the debt. If not, however, and the
company's debt outweighs the return from its assets, then the debt cost may outweigh
the return on assets. Over the long-term, this would lead to bankruptcy. Investors should
take this into consideration when investing in a company with a high debt to equity
ratio, especially in times of rising interest rates. Debt to equity ratios vary across
industries. Capital intensive industries such as airplane manufacturers tend to have
higher debt to equity ratios typically greater than 2. Less capital intensive industries,

18
such as a software company, can have lower debt to equity ratios of under 5(Zingales,
2000).
2.3.2 Measures of Corporate Governance
To measure corporate governance quality, we employ the governance standards
provided by the Institutional Shareholder Services (ISS). The ISS governance standards
include 51 factors encompassing eight corporate governance categories: audit, board of
directors, charter/bylaws, director education, executive and director compensation,
ownership, progressive practices, and state of incorporation. The ISS governance
standards are the most all-inclusive data on corporate governance ever collected.
Boards of directors are a crucial part of the corporate structure. They are the link
between the people who provide capital (the shareholders) and the people who use that
capital to create value (the managers). This means that boards are the overlap between
the small, powerful group that runs the company and a huge, diffuse, and relatively
powerless group that simply wishes to see the company run well (Business Roundtable,
2005). The single major challenge addressed by corporate governance is how to grant
managers enormous discretionary power over the conduct of the business while holding
them accountable for the use of that power. A company’s owners may number in the
tens of thousands, diffused worldwide. So shareholders are granted the right to elect
representatives to oversee the management of the company on their behalf. Directors are
representatives of owners (or, in closely held companies, the owners themselves), whose
purpose under law is to safeguard the assets of the corporation (Monks and Minow,
2004)

19
2.4 Empirical Review
The term capital structure refers to the percentage of capital (money) at work in a
business by type. It is a mix of a company's long-term debt, specific short-term debt,
common equity and equity and it simply describes how a firm finances its overall
operations and growth by using different sources of funds. Broadly speaking, there are
two forms of capital: equity capital and debt capital. Each has its own benefits and
drawbacks and a substantial part of wise corporate management is attempting to find the
optimal capital structure in terms of risk/reward payoff for shareholders. There are
several strands of literature that are relevant to the proposed research.
Banjeree et al. (2004) did a study on the dynamics of capital structure. They used a
dynamic adjustment model and panel data methodology on a sample of UK and US
firms to specifically establish the determinants of a time-varying optimal capital
structure. They concluded that firms typically have capital structure that are not at the
target and that they adjust very slowly towards the target market. Lemmon et al (2001)
also did a study on debt capacity and tests of capital structure theories. Using empirical
models estimated by Shyam– Sunder/Myers and Frank /Goya to analyse capital
structure determinants in USA, they concluded that the pecking order appears to be good
description of the financial policies of majority of the firms.
Baner (2004) examined the capital structure of listed companies in Vise grad countries
(Czech Republic, Hungary, Poland and Slovak Republic) during the period from 2000 to
2001. The results are based on the database, which assembles financial reports of listed
firms. In his study, six potential determinants of capital structure are analyzed size,

20
profitability, tangibility, growth opportunities, non-debt tax shields and volatility.
According to his findings, leverage of listed firms in Vise grad countries is positively
correlated with size. Leverage is negatively correlated with profitability. This finding is
consistent with the pecking-order hypothesis rather than with static trade-off models.
Also, leverage is negatively correlated with tangibility and non-debt tax shields. There is
a negative relationship between leverage measured in market value and growth
opportunities.
Zeitun and Tian (2007) in his study on the Jordanian firms found a highly negative
relation between the firm performance by employing both market and accounting based
variables. Whereas the relation among capital structure variables and firm performance
varies across industries. The relation is insignificant between capital structure variables
and performance variables in the engineering sector firms. Accounting based variables
of capital structure were debt (short term, long term and total debt) to total assets and
total debt to total equity whereas accounting based measure for performance was ROA.
The accounting based measure ROE (return on equity) has an insignificant relation with
capital structure in all forms in Jordanian firms. Further, the market based measures for
performance was Tobin’s Q and price earnings ratio.
Shah and Khan (2007) on the Pakistani firms listed on three Stock Exchanges found a
negative and significant relation among leverage levels and performance. They
highlighted the existence of possible bias in their finding because many Pakistani firms
are family controlled businesses. They inflate production costs and draw the profits from
21
the firms other than dividend. The income statement shows negative profits. The lead to
a decline in equity levels and the ratio of debt increases in the overall ratio of financing.
Seppa (2008) found that the Estonian firms follow Peking Order hypothesis in deciding
about the optimal capital structure. Estonian firms first utilize internal funds to finance
opportunities then move towards external source of financing. Further, large size firms
also employ more external funds when internal funds are insufficient to finance
opportunities. Large firms obtain funds easily and with less collateral compared to small
firms. The choice of capital structure in Estonian firms is also largely influenced by
industry specific and country specific factors.
Ebaid (2009) in his study on the emerging market economy of Egypt find that the
selection of capital structure mix has a very weak relationship with performance. He
found that the relation among capital structure variables including short term, long term
and total debt to total assets has insignificant relationship with performance measured by
ROE (return on equity). Whereas, the relation of short term debt and total debt to total
assets is negative and statistically significant with the performance. A negative
insignificant relation exists for the long term debt with return on assets. Further, the
relation of the capital structure with performance measured by the gross profit margin is
also insignificant.
Abor and Biekpe (2007) explore the link between corporate governance and the capital
structure decision of SMEs. The results show negative association between capital
structure and board size. Positive relationships between capital structure and board
composition, board skills and CEO duality are, however, found. The control variables in
22
the model show signs which are consistent with standard capital structure theories. The
results generally suggest that SMEs pursue lower debt policy with larger board size.
Interestingly,SMEs with higher percentage of outside directors, highly qualified board
members and one-tier board system rather employ more debt. It is clear, from the study,
that corporate governance structures influence the financing decisions of Ghanaian
SMEs.
Ahmadpour, Golmohammadi&Ahmad (2012) did a study on Corporate Governance and
Capital Structure performance in Pakistani Textile sector. The purpose of the study was
toinvestigate whether there is any relationship between some specific features of
corporate governance andcapital structure of listed firms in Tehran Stock Exchange. The
ownership concentration, board independence, board size, institutional share ratio, CEO
duality and internal auditor were consideredas independent variables whereas, debt
ratio(as a criterion for capital structure) as dependent variable. The results indicated a
positive relationship between ownership Concentration, board size, internal auditor
andcapital structure but a negative relationship between institutional share ratioand
capital structure. In addition,no significant relationship was found between ‘Board
Independence, CEO duality’ and capital structure.
Musyoka(2009)examined the relationship between capital structure and corporate
governance of the firms listed at the Nairobi Securities Exchange. He examined how
corporate governance indicators such as board size, board composition, CEO duality and
CEO compensation among other factors impact on financing decisions of firms. A
census study of the firms that have been consistently listed at the Nairobi Stock
23
Exchange over the financial period 2003/2004 – 2007/2008 was done. Primary data was
collected from CEOs of the listed firms using a validated structured questionnaire. The
secondary data was collected from annual financial statements of the target firms.
Analysis was done within the randomeffects GLS regression framework. Findings of the
study indicate that firms with larger board sizes employ more debt irrespective of the
maturity period and also the independence of a board negatively and significantly
correlates with short-term debts. Again, when a CEO doubles as board chairperson, less
debt is employed. Thus, the study reaffirms the notion that the governance structure of a
firm affects its financing choices
Mang’unyi(2011)conducted a study on ownership structure and corporate governance
and its Effects on Performance and took a case of selected banks in Kenya. The study
revealed that there was no significant difference between type of ownership and
financial performance, and between banks ownership structure and corporate
governance practices .This study recommends that corporate entities should promote
corporate governance to send a positive signal to potential investors. The Central
Bankof Kenya (CBK) should continue enforcing and encouraging firms to adhere to
good corporate governance for financial institutions for efficiency and effectiveness.
Finally, regulatory agencies including the government should promote and socialize
corporate governance and its relationship to firm performance across industries
Wambua(2011) conducted a study on the effects of corporate governance on savings and
credit co-operatives (Sacco’s) financial performance in Kenya and found that good
corporate governance aims at increasing profitability and efficiency of organizations and

24
their enhanced ability to create wealth for shareholders, increased employment
opportunities with better terms for workers and benefits to stakeholders. Indicators of
Good Corporate Governance identified in the study include independent directors,
independence of committees, board size, split chairman/CEO roles and the board
meetings.He concluded that better corporate governance is correlated with better
operating performance and market valuation. Corporate governance mechanisms assure
investors in corporations that they will receive adequate returns on their investments
evidence suggests that corporate governance has a positive influence over corporate
performance.
Mainaand Sakwa(2012) conducted a study onunderstanding financial distress among
listed firms in Nairobi stock exchange and took a quantitative approach using the z-
score multi-discriminate financial analysis model. The results clearlyindicated that the
financial health of the listed companies needed to be improved. In addition a disjoint
was noted in thecorrelation between what is expected of the listed companies in terms of
financial performance and the benefits to beaccrued from CMA surveillance on them.
2.5 Summary of Literature Review
Studies conducted about capital structure and corporate governance has ended up with
mixed results. Rehman and Raoof (2010) investigated the relationship between
corporate governance and capital structure of randomly selected 19 banks of Pakistan
from 2005-2006 and found a positive relationship. Similar positive relation was reported
by Rajendran (2012) in his study of Sri-Lanka manufacturing firms. Local studies such
as Musyoka (2009); Mang’unyi(2011); Wambua(2011); Maina and Sakwa

25
(2012)focused on the effect of corporate governance structure on capital structure and
ignored the fact that capital structure may also influence the corporate governance
mechanisms employed. Contradictory findings are reported by Saad (2010) who studied
126 Malaysian publically listed companies and results showed a negative relationship.
Due to such mixed findings, there is need for a Kenyan specific study in order to
establish which school of thought is supported by the Kenyan phenomena.

26
CHAPTER THREE
RESEARCH METHODOLOGY
3.1 Introduction
This chapter contains review of literature of research design, population, sample and
data analysis. Research methodology is the architecture or the layout of the research
framework. According to Polit and Hungler (2003) methodology refers to ways of
obtaining, organizing and analyzing data.
3.2 Research Design
Research design is an outline of research study which indicates that what the researcher will
do from writing the hypothesis and its operational implications to the final analysis of
data. A research design is the arrangement of conditions for data collection and analysis
of data in a manner that aim to combine relevance to research purpose with economy in
research procedure (Kothari, 2004). Research design can be thought of as the logic or
master plan of a research that throws light on how the study is to be conducted. It shows
how all of the major parts of the research study– the samples or groups, measures,
treatments or programs, etc.–work together in an attempt to address the research
questions. Research design is similar to an architectural outline.

27
This study employed descriptive survey design. Descriptive survey is conducted to
describe the present situation, what people currently believe, what people are doing at
the moment and so forth (Baumgartner, Strong and Hensley, 2002). According to
Kothari (2004), descriptive survey design includes surveys and fact finding enquiries of
different kinds. The major purpose of descriptive research design is description of the
state of affairs as it exists at present (Kothari, 2004).
3.3 Population
Burns and Grove (2003) and Mugenda and Mugenda (2003) describe population as all
the elements that meet the criteria for inclusion in a study. Population is therefore the
entire group of individuals, events or objects having a common observable
characteristic. The population of the study consisted of 51 companies listed on the NSE.
3.4 Sampling Technique
According to Polit and Beck (2003), a sample is a proportion of population to be
researched, while Kothari (2004) defines a sample as the selected respondent
representing the population. Purposive sampling technique will be used to select the
sample firms. The sample size for this study was made up of 35 listed companies
excluding the financial companies, Investment and Insurance companies due to their
peculiar nature of capital structure. The study relied on Secondary data sourced from
annual audited financial statement of the firms listed on Nairobi Securities Exchange.

28
3.5 Data Collection Method
This study used secondary data from annual reports of the quoted companies over a
period of five years i.e. 2007-2011.
3.6 Data Processing and Analysis
The data was analyzed through coding in a spreadsheet where the researcher used
descriptive statistics to present the performance of independent variables in tables. A
regression was run to determine the coefficients of the independent variables in relation
to the dependent variable. Theuse the Statistical Package for Social Sciences (SPSS)
helped the researcher to establish the impact of the independent variable to the
dependent variable. The results of the findings were presented in the form of tables and
charts for easy interpretation and understanding.
The multivariate model was as follows;
Y =β0 + β1X1 + β2X2 + β3X3 +β4X4 + µ
Where;
Y = Corporate Governance Practices
X1 = Capital Structure
X2= Size of the Firm
29
X3= Liquidity of the Firm
X4= GrowthOpportunity of the Firm
In the model, β0 = the constant term while the coefficient βii= 1….4was used to measure
the sensitivity of the dependent variable (Y) to unit change in the predictor variables.µis
the error term which captures the unexplained variations in the model.
The choice of these variables was informed by the fact that corporate governance
practices may vary across firms with different sizes, that is, bigger firms may have better
corporate governance practicescompared to smaller firms. Liquidity of the firm may
influence the corporate governance practices of a company, that is, the higher the
liquidity the better the corporate governance practices.The higher the growth
opportunities of the firm the higher the expected corporate governance practices.
In its complete form, the model is;
Corporate governance= a+b1D/E +b2 size of firm+ b3liquidity of firm+b4growth
opportunity + e
Corporate governance was measured by the board size,the ratio of executive to non-
executive directors(board independence), board committees, board meetings, CEO
Duality. A mean score of corporate governance constructed using the 5 indicatorswas
used.
30
Capital structure was measured by total debt to Equity ratio to be obtained from
financial statements.
Size of the firm was measured by the log of total assets
Liquidity of firm was measured by the liquidity ratio obtained from the division of
current assets to current liabilities
The growth opportunity of the firm was measured by Book Value over Market value.
The sign of the regression coefficient indicatedthe relationship to be either positive or
negative. The strength of the relationship was measured by the reported p values. A p
value of less than 0.05 indicated that a relationship was strong or significant.

31
CHAPTER FOUR
DATA ANALYSIS, RESULTS AND DISCUSSION
4.1 Introduction
This chapter discusses analysis of data and findings.The data has been analyzed using
descriptive statistics to generate frequencies and inferential statistics.
4.2 Descriptive Statistics
This section provides results on measures of central tendency of the variables; capital
structure, size of firm, liquidity, opportunity and corporate governance being measured
in the study.
4.2.1 Measures of Central Tendency
Results in Table 4.1 show that the firms in Nairobi Stock Exchange which were used in
the study had a mean of 5.421 capital structures with a standard deviation of 5.800
which means that there is a possibility of extreme figures. The size of the firms had a
mean of 15.4 with a standard deviation of 1.394. The mean presented by liquidity and
opportunity in market growth of the firms in NSE indicated a mean of 1.568 and 1.544
with a standard deviation of0.5963 and 1.2033 respectively. Corporate governance
measure showed a mean of 21.582 and a standard deviation of 2.945.The results above
indicate that most firms in Kenya use debt more than equity capital to finance its assets.

32
Table 4.1: Descriptive Statistics
Variable Minimum Maximum Mean Std. Deviation
Capital structure 0.1 18.7 5.421 5.8008
Size of firm 13.2 18.59 15.4 1.3946
Liquidity 0.4 2.8 1.568 0.5963
Opportunity 0.3 5 1.544 1.2033
Corporate Governance 17 30 21.582 2.9457
Source: Researcher 2013
4.3 Trend Analysis
This section provides graphical representation of the movement and changes of the
variablesunder study over the years 2007 to 2011.
4.3.1 Annual Trends in Corporate Governance
Figure 4.1 present an increase in corporate governance from year 2007 to 2008 with a
slight decrease in 2009 followed by a constant in years 2011 and 2012. This indicates
that there was a renewed interest in corporate governance from year 2007 hence the rise
in trend from that year.The results also show that the governance of companies is well
endowed.

33
Figure 4.1: Trend Analysis in Corporate Governance
Source: Researcher 2013
4.3.2 Annual Trends in Capital Structure
Results in figure 4.2 show a steady increase in the capital structure of firms in the
Nairobi’s Stock Exchange from years 2007 to year 2011. The rise in capital structure
through the years indicates that companies used more debt as a source of financing its
assets than equity capital.

34
Figure 4.2: Trend Analysis in Capital Structure
Source: Researcher 2013
4.3.3 Annual Trends in Size of the Firm
The trend in size of the firm presented by figure 4.3 indicate that there has been a steady
increase in companies’ total assets from year 2007 and a slight decrease in the same in
year 2011.This shows that companies represented in the NSE have enough assets to
settle liabilities that they will occur in future.

35
Figure 4.3: Trend Analysis in Size of the Firm
Source: Researcher 2013
4.3.4 Annual Trends in Liquidity of Firms
The trend in liquidity presented by figure 4.4 indicates that there was a slight decrease in
the same in year 2008. This was later followed by a slight increase throughout the years
until 2011. Increase in liquidity represents an increase in capital thus the above results
show that the companies in 2007 and 2008 did not fall in financial difficulties and had
enough capital which could be converted to investments.

36
Figure 4.4: Trend Analysis in Firms Liquidity
Source: Researcher 2013
4.3.5 Annual Trends in Firms Opportunity
The trend in firm opportunity recorded a decrease in years 2008 and a slight decrease
from year 2008 up to 2010. The trend however,recorded a very slight increase in the
same in year 2011.This changes and shift of the opportunity of the firm is as a result of
changes in the price to book value of stocks which are normal in markets.

37
Figure 4.5: Trend Analysis in Opportunity of the Firm
Source: Researcher 2013
4.4 Inferential Statistical Analysis
Inferential analysis conducted generated correlation results, model of fitness, and
analysis of the variance and regression coefficients.
4.4.1 Pearson’s Correlation
Table 4.2 presents Pearson’s Bivariate Correlation which shows that capital structure
had a strong positive correlation of (0.102) and a probability value of (0.055). This
shows that capital structure was statistically significant in explaining corporate
governance. Size of firm had a weak positive correlation and a statistical significant
value of 0.009. This showed that the size of the firm determined corporate governance
of companies in the NSE.Liquidity had a strong positive correlation of 0.092 and an
insignificant probability value of 0.603. The opportunity of the firm hada
moderatecorrelation of 0.259 and an insignificant probability value of 0.139.On an
38
overall basis it can be concluded that the variables of the study had moderate to strong
correlations.
Table 4.2: Bivariate Pearson’s Correlation
Variable Pearson
Correlation
Corporate
governance
Capital
structure
Size of
firm Liquidity Opportunity
Corporate
governance
Pearson
Correlation
Sig. (2-tailed)
Capital
structure
Pearson
Correlation 0.102 1
Sig. (2-tailed) 0.055
Size of firm Pearson
Correlation 0.443 0.272 1
Sig. (2-tailed) 0.009 0.119
Liquidity Pearson
Correlation 0.092 0.006 0.03 1
Sig. (2-tailed) 0.603 0.974 0.866
Growth Pearson
Correlation 0.259 -0.432 -0.141 0.09 1
Sig. (2-tailed) 0.139 0.011 0.427 0.611
Source: Researcher 2013
4.4.2 Regression Analysis
Table 4.3 below shows the fitness of the regression model in explaining the variables
under study. The results indicate that the variables; capital structure, liquidity, size of the

39
firm, opportunity of the firm were satisfactory in explaining corporate governance. This
conclusion is supported by the R square of 0.319. This further means that the
independent variables can 31.9 % explain the independent variable (corporate
governance).
Table 4.3: Model of Fitness
Indicator Coefficient
R 565
R Square 0.319
Std. Error of the Estimate 2.5926
Source: Researcher 2013
ANOVA statistics presented on Table 4.4 indicate that the overall model was
statistically significant.This was supported by an F statistic of 3.4 and a probability (p)
value of 0.021. The reported p value was less than the conventionalprobability of 0.05
significance level thus its significance in the study.
Table 4.4: Analysis of Variance (ANOVA)
Indicator Sum of Squares df Mean Square F Sig.
Regression 91.424 4 22.856 3.4 0.021
Residual 194.925 29 6.722
Total 286.349 33
40
Source: Researcher 2013
Regression of coefficients results in Table 4.5 shows that there is a positive relationship
between corporate governance and capital structure, size of the firm, liquidity and firm
opportunity whose beta coefficients are 0.072, 0.000, 0.215 and 0.933 respectively.
Statistically significant variables in the study were capital structure, size of the firm and
opportunity of the firm as they had p values of 0.000, 0.008 and 0.034 which is lower
than the probability conventional of 0.05. These results indicate that the level of
corporate governance is determined by capital structure, liquidity and growth
opportunity of the company. This further means that an increase in unit change of
capital structure, liquidity and growth of the company results to a unit change in
corporate governance of the company.
41
Table 4.5: Regression of Coefficients
Variable Beta Std. Error T Sig.
Constant 18.661 1.524 12.246 0.000
Capitalstructure 0.072 0.089 0.809 0.000
Sizeoffirm 0.000 0.000 2.862 0.008
Liquidity 0.215 0.761 0.282 0.780
Opportunity 0.933 0.418 2.230 0.034
Source: Researcher 2013
4.5 Discussion of Findings
Results from the study indicate that capital structure is an important element in
determining corporate governance. The finding support Bhagat and Jefferis (2002)
findings that capital structure has become an instrument of corporate governance; not
only the mix between debt and equity and their well-known consequences as far as taxes
go must be taken into consideration.
Further,Ebaid (2009) study was on the emerging market economy of Egyptfound that
the selection of capital structure mix has a very weak relationship with the performance.
He found that the relation among capital structure has insignificant relationship with
performance measured which does not agree with the findings of the study that capital
structure is an important element in determining performance of a company. In addition,
from the results the rise in capital structure through the years indicates that companies
use more debt as a source of financing. These results disagree with those of Zeitun and

42
Tian (2007) whose study was on the Jordanian firms found the relation between capital
structure and debt(short term and long term as insignificant).
The results further show thatthere exists a positive relationship between capital structure
and board composition, board skills and CEO duality which sum up to corporate
governance in a company. These results support studies by Abor and Biekpe (2007) who
explore the link between corporate governance and the capital structure decision of
SMEs.The results generally suggest that SMEs pursue lower debt policy with larger
board size. Interestingly,SMEs with higher percentage of outside directors, highly
qualified board members and one-tier board system rather employ more debt. It is clear,
from the study, that corporate governance structures influence the financing decisions of
Ghanaian SMEs.
From the results it is possiblethat most firms in Kenya use debt more than equity capital
to finance its assets.This findings support the study of Musyoka (2009) whose findings
indicated that firms with larger board sizes employ more debt. The results in the
liquidity mean show that companies in Kenya, listed in the stock exchange market have
the ability to meet their short term obligations when they fall due, this is represented by
mean greater than one.
43
CHAPTER FIVE
SUMMARY, CONCLUSION AND RECOMMENDATIONS
5.1 Introduction
This chapter contains summary key findings of the study based on the results from the
data analysis and the objectives of the study. The chapter also includes conclusions,
recommendations and area of further studies.
5.2 Summary of Findings
The rise in trend of corporate governance over the years shows that there was a renewed
interest in corporate governance from year 2007 hence the rise in trend from that year.
The results from the study indicate that there is a significant and positive relationship
between corporate governance and capital structure.The rise in capital structure
indicated by the trend analysis through the years shows that companies used more debt
as a source of financing its assets than equity capital. Pearson’s correlation indicated that
capital structure had a strong positive relationship to corporate governance meaning that
an increase in capital structure also led to an increase in corporate governance.
The results also indicate that most firms in Kenya use debt more than equity capital to
finance its assets. The results in the liquidity mean show that companies in Kenya, listed
in the stock exchange market have the ability to meet their short term obligations when

44
they fall due, this is represented by mean greater than one. .Increase in liquidity
represents an increase in capital thus the trend results show that the companies in 2007
and 2008 did not fall in financial difficulties and had enough capital which could be
converted to investments.
Trend changes and shift of the opportunity of the firm was as a result of changes in the
price to book value of stocks which are normal in markets.Analysis of varianceindicate
that the variables; capital structure, liquidity, size of the firm, opportunity of the firm
were satisfactory in explaining corporate governance. Pearson’s Bivariate correlation
established a positive relationship between corporate governance and capital structure,
size of the firm, liquidity and firm opportunity with capital structure, size of the firm and
opportunity of the firm as the statistically significant variables in the study.
5.3 Conclusions
The findings of the study were that companies in Kenya’s Nairobi stock exchange are
liquid meaning that they have the ability to meet their short term obligations when they
fall due. This, from the results is represented by a mean which is greater than 1. In
addition, higher liquidity represents a company’s higher margin of safety that the
company has to meet its short term liabilities. Conclusions can be made on the rise in
liquidity trend through the years as that companies in the NSE have enough capital to
sustain their business. The businesses are highly liquid meaning that the assets can be
quickly turned into cash for investment or for meeting financial obligations which may
arise in future or which fall due.

45
From the results it also adequate to conclude that most firms in the NSE use more debt
or long term liability as a source of financing than equity capital from shareholders.
Debt is used as an asset financing source than equity capital because in most cases
equity capital requires some ownership of the company where giving up a certain right
of the company to someone else is not really welcomed by many business owners.
Decisions in the company will have to be made through consulting which may take
longer period of time in addressing pressing matters.
Descriptive results on the opportunity of the firm paves way to the conclusion that the
companies in the Nairobi Stock Exchange have good return on assets and that the latter
is well stated. However in this case investors are advised to be observant of the
company’s shares as one with a perfect price to book value (greater than 1) has a chance
that the asset will fade in its value leaving the investors with poor returns on the
same.The size of the firm indicates the ownership or value of the company in terms of
its current assets and noncurrent assets. Firms in the NSE present an increased trend
throughout years 2007-2008 which means that they have enough assets which can be
converted into cash. From the trend analysis the increase in growth of corporate
governance in companies in Kenya indicates a good structural level upon which
companies make corporate decisions.
5.4 Recommendations
The study provides recommendations to investors who end up making decisions after
looking at the opportunity of the firm, which is calculated as price value divided by
book value of shares. A greater price to book value that is a value greater than one

46
indicates good returns to investors. However in this case investors are advised to be
observant of the companies’ shares as one with a perfect price to book value (greater
than 1) has a chance that the asset will future fadein its value leaving the investors with
poor returns on the same.
Companies using debt as a source of financing may experience some disadvantage and
advantages over the same. High debt levels are not optimal as at times they may lead to
losses, financial distress of the company and bankruptcy. Debt financing is also
advantageous in its own way as it tends to create leverage on the few resources of the
company and there is also a sense of autonomy in ownership of the company, that is
ownership of the company, is not shared by the shareholders. Companies as well are
able to foresee growth opportunities and to an extend maximization of shareholders
wealth using debt
5.5 Limitations of the Study
The study did not focus on all firms listed in the NSE, as it excluded banks and
insurance sectors due to their peculiar nature of their capital structure. Determining the
corporate governance did not incorporate other variables such as efficiency and social
legitimacy.The objective of this study concentrated on the relationship was between
capital structure and corporate performance, thus it did not tackle the immediate effect
on any changes in corporate governance structure.

47
5.6 Suggestions for Further Studies
The study concentrated on other firms in the stock exchange with exception of the
investment, insurance and financial institution companies. It is with this selection that
the study creates a gap that needs to address the determinants of corporate governance in
this other industries not analyzed in this study.Further studies can concentrate on other
variables that constitute corporate governance such financial efficiency and social
legitimacy in companies in Kenya. A Study could also be done on particular economic
sectors to analyze the effects of capital structure on corporate governance.Further
studies could also include how culture affects corporate governance.

48
REFERENCES
Abor, J. &Biekpe, N. (2007). Corporate governance, ownership structure and performance of
SMEs in Ghana: implications for financing opportunities, Corporate Governance, 7 (3).
Abor, J. (2005). The effect of capital structure on profitability: an empirical analysis of listed
firms in Ghana, Journal of Risk Finance,6, 438-4
Adelegan, O.J, (2009). Can a Regional Approach Accelerate Stock Market Development?
Empirical Evidence from Sub-Saharan Africa, IMF Working Paper 08/281(Washington:
International Monetary Fund).
Aguilera, R. V.,Filatotchev, I., Gospel, H. & Jackson, G. (2008).An Organizational Approach
to Comparative Corporate Governance: Costs, Contingencies, andComplementarities’,
Organization Science, 19, 475–492.
Ahmadpour,A.,Golmohammadi,H.A.,S.Jafari. (2012).Journal of Corporate Governance and
Capital Structure:Evidence from Tehran Stock Exchange, 11(3).
Akram, B. & Ahmad, A. (2010).The Effect of Corporate Governance and Ownership Structure
on Capital Structure of Iranian Listed Companies7th International Conference on
Enterprise Systems, Accounting and Logistics, Rhodes Island, Greece

49
Bajaj, M. Chan, Y., &Dasgupta, S. (1998).The relationship between ownership, financing
decisions and firm performance: A signaling model’, International Economic Review,
39 (3) 723-44.
Baner, P. (2004).Capital structure of listed companies in visegrad countries. Research Seminar
Paper Presented at Seminar for Comparative Economics, LMU, Munich
Banjeree, S., Heshmati, A. &Wihlborg, C. (2004). The dynamics of capital structure, Research
in Banking and Finance, 4, 275–97.
Baumgartner, T.A., Strong, C.H., & Hensley, L.D. (2002).Conducting and reading research in
health and human performance(3rded). New York, NY: McGraw- Hill.
Berle, A. & Means, G. (1932).The Modern Corporation and private property. McMillan, New
York.
Bhagat, S.,&Jefferis, R.(2002).The econometrics of corporate governance studies,
Massachusetts Institute of Technology
Brealey, R.A., & Myers, S.C. (2003).Principles of corporate finance. Boston: McGraw-Hill
Irwin
Burns, N. & Grove, .K. (2003).Understanding nursing research. Retrieved from:
http://books.google.com/

50
Business Roundtable (2005).Principles of Corporate Governance, A White Paper
by,www.businessroundtable.org/, Last Access at January, 8, 2007
CDSC.(2004). Legal and Regulatory Framework. Retrieved August 1st, 2011, from Central
Depository Clearing System: http://www.cdsckenya.com/legal-framework/legal-and-
regulatory-framework/
Chevalier, A., Prasetyantoko, A., &Rokhim, R. (2006), ‘Foreign Ownership and Corporate
Governance Practices in Indonesia’, Paper presented in Globalization, Public policy and
Multi-Jurisdiction Governance: The Need for a Common Approach, Paris, France,
Accessed 26. August 2008 http://www.dauphine.fr/globalisation/prasetyantoko.pdf.
CMA.(2011). Establishment of the Capital Markets Authority. Retrieved August 1st, 2011,
from Capital Markets Authority:
http://www.cma.or.ke/index.php?option=com_content&task=view&id=16&Itemid=36
Contingencies, and Complementarities, Organization Science, 19, (3) 475–492.
Demsetz, H., & Lehn, K.(2005).'The structure of corporate ownership: Causes
andconsequences', The Journal of Political Economy, 93 (6) 1155-77.
Ebaid, I. E. (2009), “The impact of capital-structure choice on firm performance: empirical
evidence from Egypt”, The Journal of Risk Finance, 10 (5)477-487.
Gillan, S. (2006). Recent Developments in Corporate Governance: An Overview, Journal of
Corporate Finance, 12 (3), 381-402.

51
Goergen, M. &Renneboog, L. (2001).Investment policy, internal financing andownership
concentration in the UK, Journal of Corporate Finance, 7, (3) 257-84
Grossman, S., & Hart, D.(1982).Corporate financial structure and managerial incentives,
National Bureau of Economic Research (NBER) WorkingPaper No. R0398,107-40
Jensen, M. C. &Meckling,W. (1976).Theory of the Firm, Managerial Behavior, agency Costs
and ownership Structure.Journal of Financial Economics, (3)305- 360.
Jensen, M. C. (1986).Agency Costs of Free Cash Flow, Corporate Finance and Takeovers.
American Economic Review (76) 323-339.
Kothari, C. R. (2004). Research Methodology.Methods and Techniques.2nd Edition.New age
International (P) Limited,publisher.
Kumar,S.(2004). Capital Structure and CorporateGovernance.Xavier Institute of Management
Bhubaneswar, India 75.10.13.Laboratory http://ies.lbl.gov/iespubs/59773Rev.pdf
Lemmon, N., Michael L., & Jaime F. Z, (2001).Looking under the Lamppost: An Empirical
Examination of the Determinants of Capital Structure, Working paper, University of
Utah
Majluf, N. S. (1984). Corporate Financing and Investment Decisions When Firms Have
Information.Those Investors Do Not Have. Journal of financial Economics, 13, 187-
221.

52
Mang’unyi, E. (2011). Ownership Structure and Corporate Governance and Its Effects on
Performance: A Case of Selected Banks in Kenya. International Journal of Business
Administration,3
Muga, D.N. (1974). The Nairobi Stock Exchange; it's History, Organization and Role in the
Kenyan Economy. Unpublished MBA Dissertation University of Nairobi
Mugenda, O. M.,&Mugenda, A. G. (2003). Research methods,Quantitative and Qualitative
approaches. African Centrefor Technology Studies (ACTS).
Murtishaw, S., &Sathaye,J. (2006).Quantifying the Effect of the Principal-Agent Problem on
US Residential Energy Use.LBNL-59773. Berkeley, Calif.: Lawrence Berkeley National
Musyoka, S. (2009).Relationship between capital structure and corporate governance of the
firms listed at the Nairobi Stock
Exchange.http://erepository.uonbi.ac.ke:8080/xmlui/handle/123456789/13009
Myers, S. &Majluf, N.(1984). Corporate Financing and Investment Decisions When Firms
Have Information that Investors Do Not Have, Journal of Financial Economics13, 187-
221.
Myers, S.C. (2003). The Capital Structure Puzzle. Journal of Finance, 39 (3) 575-592.
Ngugi, R. (2005). Growth of Nairobi Stock Exchange primary market. KIPPRA discussion
paper No. 47. Nairobi: KIPPRA.

53
NSE, (2011).Regulatory Framework. Retrieved August 1st, 2011, from Nairobi Stock
Exchange:http://www.nse.co.ke/regulatory-framework/category/42-nairobi-stock-
exchange-nse.html of linkage, Revue International PME, 8 (3-4) 67-90.
Pandey, I.M. (2002). Capital structure and market power interaction: Evidence from
Malaysia.Working paper, Indian Institute of Management, Ahmedabad.
Pettit, R. & Singer, R. (1985), Small business finance: a research agenda, Financial
Management, 14 (3) 47-60.
Pindado, J. & Torre.C. (2004).Why is ownership endogenous? Applied Economics Letters, 11,
901-904.
Polit, D. F. & Beck, C.T. (2003) Nursing Research.Principles and methods.7th edition.
Lippincott Williams & Wilkins, Philadelphia.
Psillaki M., (1995). TheDeterminants of Capital Structure of the SME’s: Evidence from French
and Greek firms.Athens University of Economics and Business. Athens, Greece
Rajan, R. &Zingales.L. (1995). What do we know about capital structure? Some evidence from
International data.Journal of Finance 50, 1421-1460.
Rajendran, K. (2012).Corporate Governance Practices and Its Impact on firmPerformance:
Special Reference to Listed Banking Institutionsin Sri Lanka.Journal of Management
and Business Research, 12 (1).
54
Rehman, M. A. U., Rehman, R. U., &Raoof, A. (2010). Does corporate governance lead to a
change in the capital structure? American Journal of Social and Management Sciences
Saad, N.M. (2010).Corporate Governance Compliance and the Effects to Capital Structure in
Malaysia International Journal of Economics and Finance, 2(1)
Seppa, R. (2008). Capital structure decisions: research in Estonian non-financial companies,
Baltic Journal of Management, 3 (1) 55-70.
Shah, A. & Khan, S. (2007), Determinants of Capital Structure: Evidence from Pakistani Panel
Data, International Review of Business Research Papers, 3 (4)265-282.
Suhaila, M.K., Mansour, W. & WanMahmood, W., (2009). Capital structure and firm
characteristics: Some evidence from Malaysian companies, Euro-Mediterranean
Economics and Finance Review (EMEFIR), University of Cergy and ISC Paris, 4 (2)
105-119
Wambua, K.P. (2011).The effects of corporate governance on savings and credit co-operatives
(Sacco’s) financial performance in Kenya.Unpublished thesis university of Nairobi.
Zeitun, R. &Tian, G. G. (2007). Capital Structure and Firm Performance: Evidence from
Jordan, Journal of Australia Accounting Business and Finance. 1 (4) 148-168
Zingales L. (1998).Corporate Governance, in The New Palgrave Dictionary of Economics and
the Law’, MacMillan, London.

55
Zingales L. (2000). In Search of New foundations, Journal of Finance, l (4).
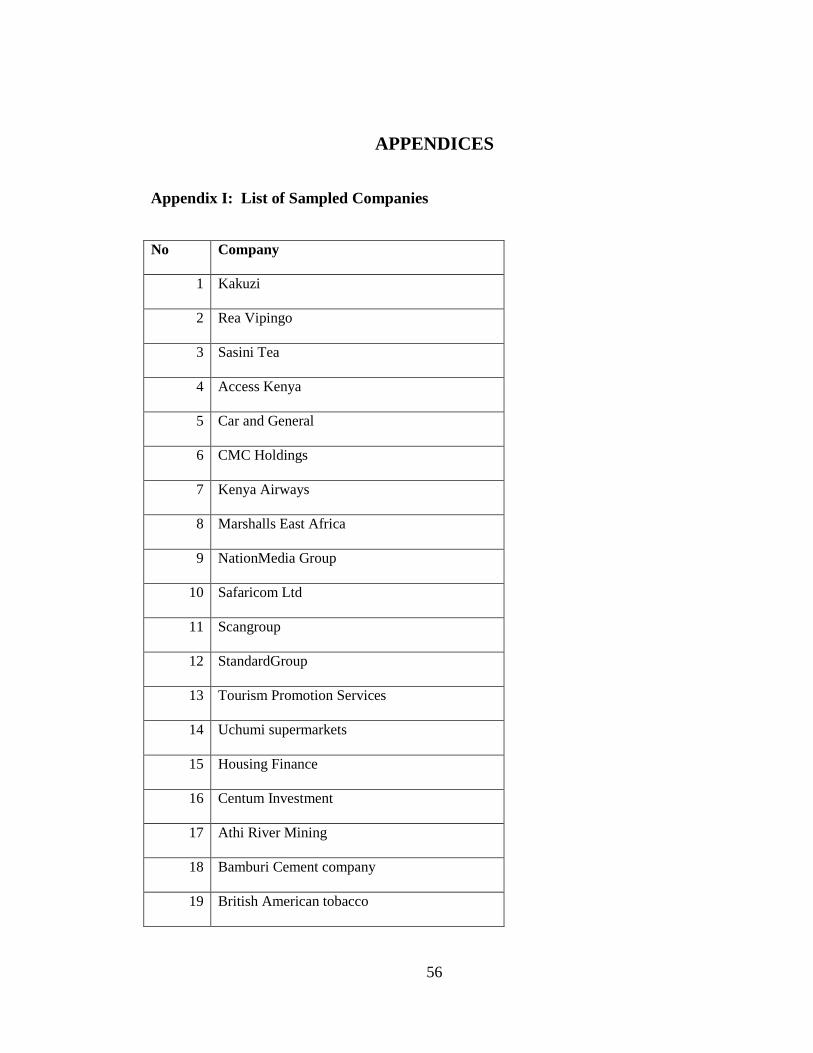
56
APPENDICES
Appendix I: List of Sampled Companies
No Company
1 Kakuzi
2 Rea Vipingo
3 Sasini Tea
4 Access Kenya
5 Car and General
6 CMC Holdings
7 Kenya Airways
8 Marshalls East Africa
9 NationMedia Group
10 Safaricom Ltd
11 Scangroup
12 StandardGroup
13 Tourism Promotion Services
14 Uchumi supermarkets
15 Housing Finance
16 Centum Investment
17 Athi River Mining
18 Bamburi Cement company
19 British American tobacco
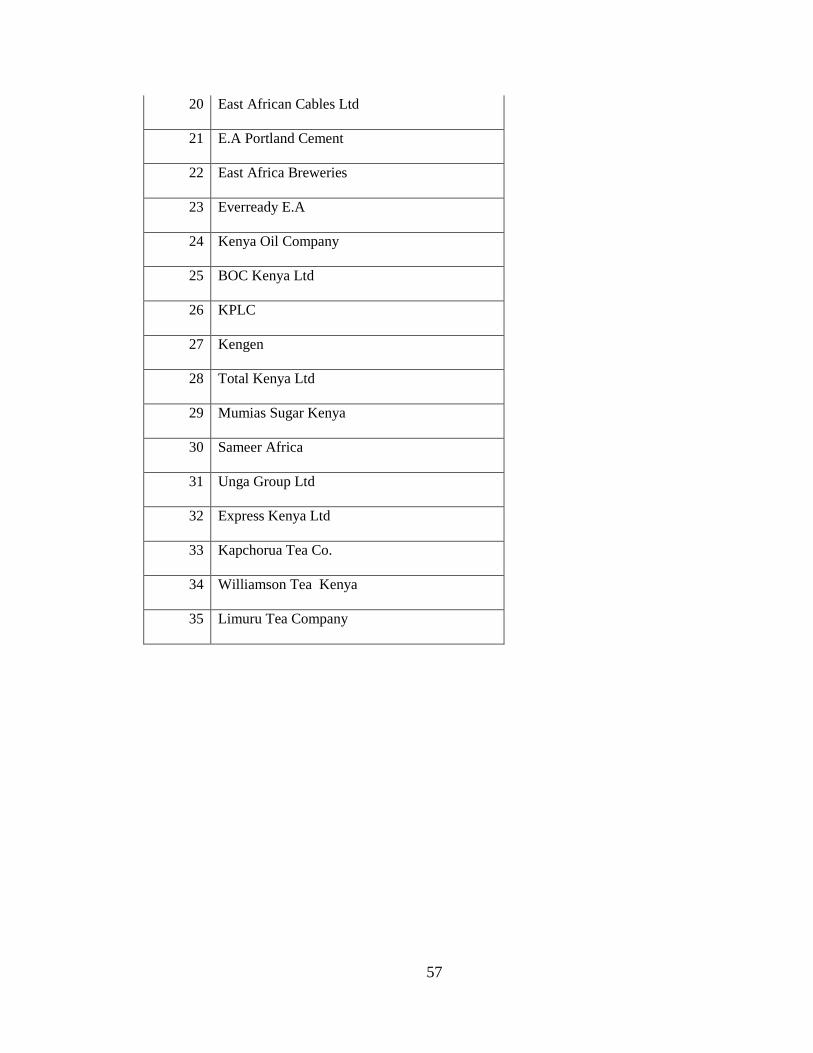
57
20 East African Cables Ltd
21 E.A Portland Cement
22 East Africa Breweries
23 Everready E.A
24 Kenya Oil Company
25 BOC Kenya Ltd
26 KPLC
27 Kengen
28 Total Kenya Ltd
29 Mumias Sugar Kenya
30 Sameer Africa
31 Unga Group Ltd
32 Express Kenya Ltd
33 Kapchorua Tea Co.
34 Williamson Tea Kenya
35 Limuru Tea Company

58
Appendix II: Mean Score of Corporate Governance
Company
Overall Board size;
period 2007-2011
Mean of Board
Independence: period 2007-
2011
Mean of Board
committee: period
2007-2011
Mean of CEO Duality: period; 2007-2011
Average Corporate
Governance for period; 2007-2011
Kakuzi 6 4 4 1 18
Rea Vipingo 5 3 4 1 17
Sasini Tea 9 3 4 1 20
Access Kenya 8 3 4 1 19
Car and General 7 3 4 1 17
CMC Holdings 8 4 4.4 1 21
Kenya Airways 11 5 4 1 26
Marshalls East Africa 8 5 4 1 23
NationMedia Group 17 6 4 1 30
Safaricom Ltd 11 5 4 1 24
Scangroup 8 4.8 4 1 20
StandardGroup 6 6 4 1 21
Tourism Promotion Services 11 4 4 1 24
Uchumi supermarkets 6 5 4.8 1 19
Housing Finance 7 5 4.8 1 23
Centum Investment 10 5.8 4.2 1 24
Athi River Mining 7 3.2 4.2 1 19
Bamburi Cement company 8 3 4.2 1 21
British American tobacco 10 3 4.2 1 20
East African Cables Ltd 7 4.6 4.4 1 21

59
E.A Portland Cement 9 4.6 4.2 1 22
East Africa Breweries 12 6 4.2 1 27
Everready E.A 8 4.6 4.4 1 22
Kenya Oil Company 7 4.4 4 1 20
BOC Kenya Ltd 9 5.4 4.4 1 23
KPLC 10 5.6 4.2 1 25
Kengen 13 5 4.2 1 26
Total Kenya Ltd 8 5 4.6 1 23
Mumias Sugar Kenya 12 5.8 4.2 1 26
Sameer Africa 7 4 4.6 1 20
Unga Group Ltd 8 3 5.2 1 22
Express Kenya Ltd 4 3 5.4 1 17
Kapchorua Tea Co. 6 3 5.2 1 18
Williamson Tea Kenya 7 3 4.6 1 21
Limuru Tea Company 3 3.5 4.6 1 12.1
Appendix III: Mean Score of Independent Variables
Variable Mean Std. Deviation
Capital Structure
2011 6.926 8.0668
2010 6.217 7.13
2009 4.737 5.007
2008 4.529 5.0937
2007 4.249 5.6132
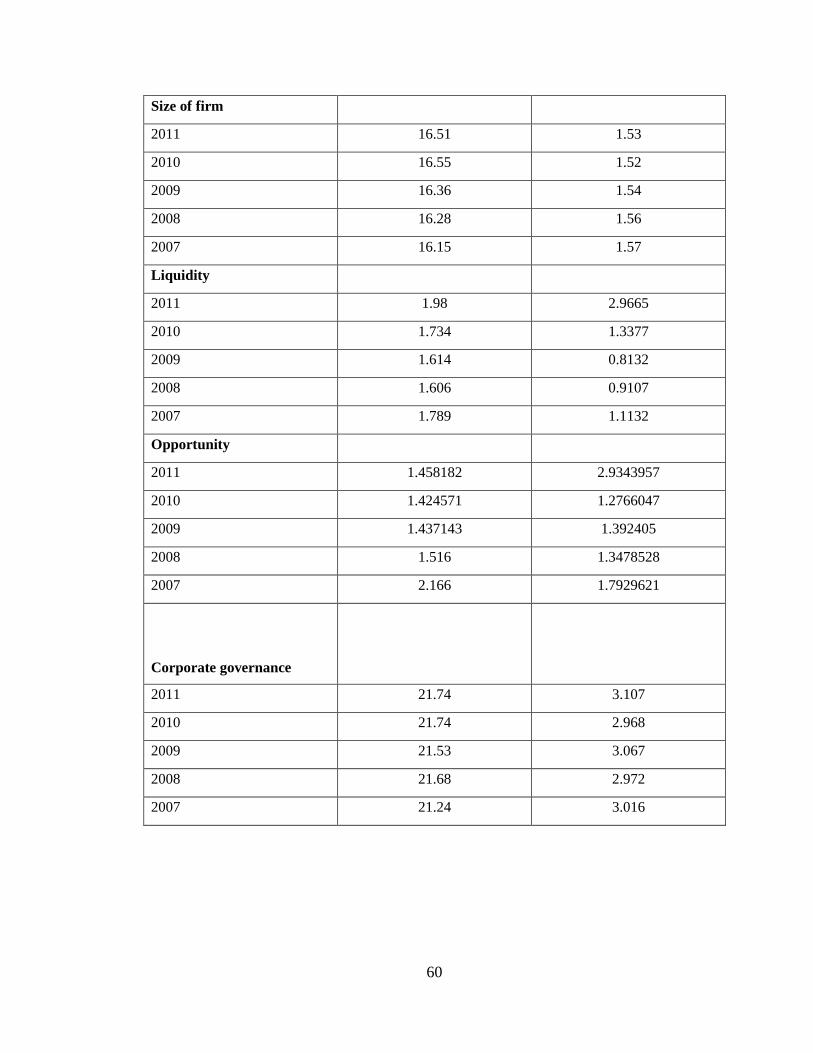
60
Size of firm
2011 16.51 1.53
2010 16.55 1.52
2009 16.36 1.54
2008 16.28 1.56
2007 16.15 1.57
Liquidity
2011 1.98 2.9665
2010 1.734 1.3377
2009 1.614 0.8132
2008 1.606 0.9107
2007 1.789 1.1132
Opportunity
2011 1.458182 2.9343957
2010 1.424571 1.2766047
2009 1.437143 1.392405
2008 1.516 1.3478528
2007 2.166 1.7929621
Corporate governance
2011 21.74 3.107
2010 21.74 2.968
2009 21.53 3.067
2008 21.68 2.972
2007 21.24 3.016