The Effect of Calcium and Nonphytate Phosphorus on Chicken ...
136
University of Arkansas, Fayeeville ScholarWorks@UARK eses and Dissertations 12-2013 e Effect of Calcium and Nonphytate Phosphorus on Chicken Genetic Line, Egg Production, Shell Quality, Bone Homeostasis, and Progeny Bone Quality Phiphob Sodsee University of Arkansas, Fayeeville Follow this and additional works at: hp://scholarworks.uark.edu/etd Part of the Other Animal Sciences Commons , and the Poultry or Avian Science Commons is Dissertation is brought to you for free and open access by ScholarWorks@UARK. It has been accepted for inclusion in eses and Dissertations by an authorized administrator of ScholarWorks@UARK. For more information, please contact [email protected], [email protected]. Recommended Citation Sodsee, Phiphob, "e Effect of Calcium and Nonphytate Phosphorus on Chicken Genetic Line, Egg Production, Shell Quality, Bone Homeostasis, and Progeny Bone Quality" (2013). eses and Dissertations. 987. hp://scholarworks.uark.edu/etd/987
Transcript of The Effect of Calcium and Nonphytate Phosphorus on Chicken ...

University of Arkansas, FayettevilleScholarWorks@UARK
Theses and Dissertations
12-2013
The Effect of Calcium and NonphytatePhosphorus on Chicken Genetic Line, EggProduction, Shell Quality, Bone Homeostasis, andProgeny Bone QualityPhiphob SodseeUniversity of Arkansas, Fayetteville
Follow this and additional works at: http://scholarworks.uark.edu/etd
Part of the Other Animal Sciences Commons, and the Poultry or Avian Science Commons
This Dissertation is brought to you for free and open access by ScholarWorks@UARK. It has been accepted for inclusion in Theses and Dissertations byan authorized administrator of ScholarWorks@UARK. For more information, please contact [email protected], [email protected].
Recommended CitationSodsee, Phiphob, "The Effect of Calcium and Nonphytate Phosphorus on Chicken Genetic Line, Egg Production, Shell Quality, BoneHomeostasis, and Progeny Bone Quality" (2013). Theses and Dissertations. 987.http://scholarworks.uark.edu/etd/987

The Effect of Calcium and Nonphytate Phosphorus on Chicken Genetic Line, Egg Production, Shell Quality, Bone Homeostasis, and Progeny Bone Quality

The Effect of Calcium and Nonphytate Phosphorus on Chicken Genetic Line, Egg Production, Shell Quality, Bone Homeostasis, and Progeny Bone Quality
A dissertation submitted in partial fulfillment of the requirements for the degree of
Doctor of Philosophy in Poultry Science
By
Phiphob Sodsee
Chulalongkorn University Doctor of Veterinary Medicine, 1999
Chulalongkorn University Master of Science in Animal Physiology, 2003
December, 2013
University of Arkansas
This dissertation is approved for recommendation to the Graduate Council
_________________________________ Dr. Craig Coon Dissertation Director _________________________________ Dr. Charles Maxwell Committee Member
_________________________________ Dr. David Kreider Committee Member
_________________________________ Dr. Narayan Rath Committee Member

ABSTRACT
The study consisted of two parts to determine effects of dietary calcium (Ca) and
nonphytate phosphorus (NPP) level on four pure genetic lines of broiler breeders. The first part
was concentrated on body composition, egg production and shell quality changes according to
diet and genetic line. The second part was the study of bone homeostasis variables combining
hematology, bone histology and body composition changes according to diet and genetic line. In
the study, pullets (246 from each of pure genetic line A, B, C and D) were individually caged
and light stimulated at 21 weeks of age. The study duration was from 21 to 50 weeks of egg
production. Hens from each line were fed one of six diets varying in calcium and nonphytate
phosphorus (NPP): 1) 2.25% Ca with 0.25% NPP; 2) 2.50% Ca with 0.25% NPP; 3) 2.75% Ca
with 0.25% NPP; 4) 3.0% Ca with 0.25% NPP; 5) 3.25% Ca with 0.25% NPP; and 6) 3.25% Ca
with 0.40% NPP. Daily allotted feed intake was increased for every 8 percent increase in egg
production going from 5% to peak. Egg production and egg quality variables were recorded
throughout the experimental period. Chicks hatched from breeder hens from each treatment (line
x diet) were fed a commercial broiler starter diet for 14 days. At 14 days of age plasma was
collected from the chicks for bone specific alkaline phosphatase (BSAP), fibroblast growth
factor 23 (FGF23), and tartrate resistant acid phosphatase (TRAP) determination. The breeder
study was terminated at 50 weeks of age and blood samples were collected from 1000 hrs to
1300 hrs to evaluate bone homeostasis variables the same as the chicks. Tibia bones from hens
were collected for histological TRAP staining. Chicks and hens were scanned with dual energy
x-ray absorptiometry (DXA) (GE® Lunar Prodigy) for body composition. Statistical analysis
was two-way ANOVA with interaction from two main factors (line and diet) and MANOVA for

repeated measures procedure. The results showed, genetic line had effect on both egg production
and shell quality (P<0.001). There was no significant difference in egg production and shell
quality for breeder hens fed either 0.25% or 0.4% nonphytate phosphorus (nonphytate
phosphorus daily intake ranging from 0.34 to 0.55g with peak feed) with 3.25% calcium in the
diet. For bone homeostasis parameter, TRAP was correlated to neither body mineral mass nor
egg shell quality but may be useful for evaluating bone structure status. BSAP from each genetic
line may be used as an indicator or biomarker to determine potential shell quality and body
mineral mass for breeder hens and the progeny chick. Finally, plasma FGF23 concentration were
related to dietary calcium levels and linked to phosphorus excretion in the excreta.
Key words: calcium, nonphytate phosphorus, shell quality, DXA, bone homeostasis variables.

TABLE OF CONTENTS
I. CHAPTER 1 ............................................................................................................................ 2
A. INTRODUCTION ................................................................................................................... 2
II. CHAPTER 2 ............................................................................................................................ 6
A. LITERATURE REVIEW ........................................................................................................ 6
B. ANATOMY AND PHYSIOLOGICAL FUNCTION OF LAYER REPRODUCTIVE SYSTEM ......................................................................................................................................... 6
Ovary ....................................................................................................................................... 6
Oviduct .................................................................................................................................... 7
C. EGG PRODUCTION PROCESS AND TIMING ................................................................. 10
Egg Yolk Formation .............................................................................................................. 10
Egg White Formation ............................................................................................................ 11
Egg Shell Formation .............................................................................................................. 12
D. CALCIUM AND PHOSPHORUS RELATED TO EGG SHELL AND BONE QUALITY 13
Egg Shell and Economical Important .................................................................................... 13
The Relationship of Feeding Management and Egg Shell and Bone Quality ....................... 14
The Relationship of Dietary Calcium/Phosphorus and Egg Shell and Bone Quality ........... 16
E. BONE: HORMONAL CONTROL AND HOMEOSTASIS BIOMARKER........................ 18
Parathyroid, 1, 25(OH) 2 D, and Fibroblast Growth Factor 23 .............................................. 18
Osteoclast and TRAP Enzyme .............................................................................................. 21
Bone Specific Alkaline Phosphatase (BSAP) ....................................................................... 24
III. CHAPTER 3 ...................................................................................................................... 27
A. BODY COMPOSITION, EGG PRODUCTION AND SHELL QUALITY OF EGGS FROM FOUR BREEDER GENETIC LINES FED DIETS VARYING IN CALCIUM AND NONPHYTATE PHOSPHORUS CONTENT ............................................................................. 27
B. ABSTRACT .......................................................................................................................... 27
C. INTRODUCTION ................................................................................................................. 29
D. MATERIALS AND METHODS .......................................................................................... 31
Animal and Handling............................................................................................................. 31
Feed and Feeding ................................................................................................................... 31

Data and Sample Collection .................................................................................................. 32
Sample Analysis .................................................................................................................... 34
Statistical Analysis ................................................................................................................ 37
E. RESULT ................................................................................................................................ 37
Main Effect in Breeder .......................................................................................................... 37
Main Effect in Progeny.......................................................................................................... 39
Age of Egg Production .......................................................................................................... 40
F. DISCUSSION ........................................................................................................................ 42
Dietary Calcium and Nonphytate Phosphorus ....................................................................... 42
Genetic Line .......................................................................................................................... 44
Age of Egg Production .......................................................................................................... 45
IV. CHAPETER 4 .................................................................................................................... 73
A. BONE HOMEOSTASIS VARIABLES FROM FOUR BREEDER GENETIC LINES FED DIETS VARYING IN CALCIUM AND NONPHYTATE PHOSPHORUS CONTENT ........... 73
B. ABSTRACT .......................................................................................................................... 73
C. INTRODUCTION ................................................................................................................. 75
D. MATERIALS AND METHODS .......................................................................................... 77
Animal and Handling............................................................................................................. 78
Feed and Feeding ................................................................................................................... 78
Data and Sample Collection .................................................................................................. 79
Sample Analysis .................................................................................................................... 81
Statistical Analysis ................................................................................................................ 85
E. RESULT ................................................................................................................................ 86
F. DISCUSSION ........................................................................................................................ 88
V. REFERENCES .................................................................................................................... 120
VI. APPENDIX .......................................................................................................................... 129

1
CHAPTER 1
INTRODUCTION
2
I. CHAPTER 1
A. INTRODUCTION
Calcium and phosphorus are two of the most important macro mineral that are very
important in laying hen and are required to have in the diet in order to maintain the normal
physiological function of the body. In the egg laying animal, calcium forms a significant
component of the shell and phosphorous playing an important role in skeletal calcium deposition.
Excess or deficiency of either will negatively affect both shell and bone quality. Maintaining of
bone homeostasis is one of the most important mechanisms in laying animals that determine the
survival of both the animals themself and the offspring in the egg.
In mammals, the main functions of bones are to maintain blood calcium levels and
provide body support. In avian, egg shell quality is very important for the successful
development of the chick embryo as it provides protection from damage, and infection;
therefore, it is an additional important function of bone to provide adequate blood calcium,
especially when the dietary calcium source is not available (Nys et al., 2004). These functions of
bone are accomplished by continuous tissue renewal, called remodeling, occurring throughout
life by the balance between osteoclastic bone resorption and osteoblastic bone formation.
Several bone homeostasis enzymes and hormones that are related to the function of
osteoblast and osteoclast have been used to determine bone homeostasis status. Among several
indicators, bone specific alkaline phosphatase (BSAP), plasma tartrate resistant acid phosphatase
(TRAP) and Fibroblast growth factor 23 (FGF23) are of the interest in medical research area as a
diagnostic or prognosis tools in bone homeostasis disorders.
3
In addition to the use of enzymes and hormones to indicate bone homeostasis, body
composition is one of the vital variables that can directly indicate bone homeostasis status.
Presently, with the advance technology of dual energy x-ray absorptiometry (DXA), body
composition changes of broilers or broiler breeders could be easily evaluated. The advantage of
DXA is being a non-invasive technique that the same bird can be studied over an extended
period of time without detriment to its health or performance. Salas et al., (2012) successfully
established the equations for body composition prediction and demonstrated that it is a reliable
alternative for measuring body composition with very high degree of correlation for total body
mass, body mineral content, fat mass and lean mass. The amount of time needed per scan is short
compared to the time invested. In addition to body composition, England et al., (2012)
established the equations for DXA on determined egg quality as it is an accurate and
nondestructive method to predict total egg weight, shell weight, shell calcium content, shell
thickness, albumen weight and yolk weight.
Regarding the diet, according to NRC (1994), the recommended level of calcium in the
diet is 3.25% calcium and 0.25% nonphytate phosphorus in laying breeder. Regardless of
recommendations, the levels used in commercial flocks are generally higher, especially for
nonphytate phosphorus. Several studies had been published with the values in the diet ranging
between 2.4 to 5.5 % for calcium and 0.15 to 0.47 % for nonphytate phosphorus (Keshavarz and
Nakajima, 1993; Bar et al., 2002; Ahmadi and Rodehutscord, 2012).
Dietary nonphytate phosphorus higher than 0.4% has been reported as not having
addition value to egg production, shell quality and bone quality (Scott et al., 1999; Keshavarz,
4
2003a). Some reports showed negative effects on either egg production or egg shell quality or
both (Boorman and Gunaratne, 2001; Keshavarz, 2000; Ekmay and Coon, 2011). Keshavarz,
(2003a) and Ahmadi and Rodehutscord, (2012) suggested 0.2% to 0.22% nonphytate phosphorus
as the optimum values. Leske and Coon, (2002) reported the relationship of retainable
phosphorus content and nonphytate phosphorus in excreta and suggested that 0.25% of dietary
nonphytate phosphorus was the physiological threshold.
Therefore, the ultimate objective of this study was to find the optimum level of calcium
according to the lower suggested level of nonphytate phosphorus compare to the levels used in
industry by using bone homeostasis variables, body composition, egg composition and egg shell
quality variables.

5
CHAPTER 2
LITERATURE REVIEW

6
II. CHAPTER 2
A. LITERATURE REVIEW
B. ANATOMY AND PHYSIOLOGICAL FUNCTION OF LAYER REPRODUCTIVE SYSTEM
It is very important to know the anatomy and its physiological function of domestic fowl
reproductive organ in order to understand normal egg production and nutritional effect on egg
production. In general the reproductive systems in avian species are seasonal breeders whose
physiological mechanisms regulating gametogenesis are synchronized by environmental
stimulation (Lofts and Murton, 1973). However, in some domesticated species these variability
cycles by the effect of environment has been lost. The major reproductive organs are described
below.
Ovary
In almost all domestic avian species, only left side of reproductive organ are fully
developed. At the right ovary, during the embryonic development, the primary sex cords evolve
normally to form the medulla. However, the germinal epithelium of the ovary from this side fails
to proliferate to form the cortex and the primodial germ cells, starts to regress, and finally
disappears after 21 day of post hatching. Therefore, the left ovary is the only dominant and
functional sex organ in domestic fowl. The ovary is attached to the sublumbar region of body
wall by a short mesovarium ligament under the aorta and posterior vena cava and in front of the
cranial part of kidney. It is enclosed by the connective tissue which engulfs the whole ovary

7
including the left adrenal gland (King, 1975). Ovary receives nutrient supply from the blood via
ovarian artery which can originate from the left renolumbar artery (Lofts and Murton, 1973),
gonado-renal artery or aorta (Gilbert, 1971a).
The ovary is composed of two major components: medulla and cortex, separated by a
dense connective tissue. The medulla contains blood vessels, nerve cell and smooth muscle. The
cortex, which covers almost entire medulla, contains follicles. Each follicle contains an oocyte, a
variable amount of yolk, a layer of granulosa cells, and follicular thecal cells. With the approach
of the maturation period some parts of developed follicles become visible to the naked eyes by
the deposition of yolk. In the older aged fowl, the hierarchical structure of the developing
follicles will be ovulated at approximately 24 to 28 hour interval: the largest follicle will be the
next to be ovulated, the second largest will be ovulated a day later, and so on (Currie, 1988).
Oviduct
Similar to the ovary, only the left oviduct is fully developed. However, the remnant of the
right oviduct could be seen in some adult birds as a cyst or tubule form (Winter, 1958). The
oviduct is the tubular organ that extent from the ovary to the opening at cloaca. In sexual inactive
birds its length could be about 14 to 19 cm long; however, in sexually active bird it could be
straightened out to a length of 80 cm long (Aitken , (1971). The wall of the oviduct, inside-out, is
composed of a mucosal layer, inner connective tissue layer, circular muscle layer, outer
connective tissue layer, longitudinal muscle layer and serosa (King, 1975). The mucosa layer can
subdivided into epithelium and laminapropia which are used to differentiate among the region of
the oviduct (Burke, 1984). The muscular layers gradually increase in thickness caudally and are
8
especially abundant over the anterior vagina (Solomon, 1983). The oviduct is attached to the
abdominal wall by dorsal ligament and ventral ligament which contain smooth muscle fibers and
from the muscular cord attached posteriorly to the vagina (King, 1975). In general, the oviduct in
domestic fowl can be divided to five distinctive regions: infundibulum, magnum, isthmus, shell
gland (uterus) and vagina.
Infundibulum is the opening of the oviduct that line adjacently to the ovary. It is about
eight centimeters long. Its major function is to capture the ovulated oocyte and its yolk so it
could be very motile when the time of ovulation approaches (Burke, 1984). Infundibulum
composes of the funnel-shaped anterior segment and it continues to the relatively narrower in its
posterior segment. Not only it is the site for ovum enters the oviduct but it is also the site of
fertilization (Aitken, 1971). Histological structure of the epithelial cell in this part changes
periodically from dominate ciliated cell type at the opening to dominate secretary cell type at the
posterior part. In addition, the spiral folds inside the lumen which extend throughout the oviduct
changes from the very short, blunt, and less complicate at the opening to the taller and more
complicate at the ending part. These cell morphology and structure changes correspond with the
increasing of the secretory function when the duct begins to change to the next section, magnum.
Magnum is the longest part of the oviduct (about 33 cm). It is very important for albumin
production and secretion. Magnum can be distinguished from infundibulum by its dull white
color, larger outside diameter and thicker wall. Those characteristics are the results from the
massive increase on the glandular tissue and the thickening of the epithelial fold; however, the
fold is not as complicate as the epithelium of infundibulum. The opening of the secretory glands
can be found at all point of its surface and the release of albumin from these glands is probably
affected by mechanical stimulation (Asmundson and Baker, 1940; Solomon, 1983). The diameter

9
of the duct will gradually decrease by the end of this region. The very end of this section can be
distinguished from the next part, isthmus, by the thin translucent line (approximately 1
millimeter in diameter) which can be seen only from outside and it is the site that its gland tissue
is entirely absent (Aitken, 1971).
Isthmus, about 10 cm long and located next after the translucent line, is considered a shell
membrane construction part. The epithelium’s characteristic is similar to the magnum but have
relatively smaller secretory granules and less secretory cells. The epithelial lining characteristic
is conserved with the apical ciliated-non secretory cell and the basal non-ciliated secretory cell
similar to the magnum section.
Shell gland, uterus, is posteriorly next to the isthmus and capable of secreting all of shell
components including shell pigment. Its length is about 10 cm long. This part can be separated
into two regions according to epithelial morphology. The first short region, tubular shell gland, is
characterized by the diameter that is similar to the isthmus; however, the epithelial characteristics
represent the uterine gland. The second region is characterized by a permanent pouch structure.
Calcium binding protein similar to intestinal mucosa was isolated from this part (Bar and
Hurwitz, 1973). The epithelium folds in this area are longer and more complex than the isthmus;
however, the excretory gland tissue is less voluminous so that the folds are narrower. When this
part is distended by an egg, these folds are bent until they lie parallel to its surface. Thus the area
of mucosal contact with the egg is greatly expanded. With the muscular movement during the
shell formation process, the repeated contact with the mucosal surface and fold ensures the even
dispersal of the secretion all over shell surface (Aitken, 1971).
10
Vagina is the last posterior end of female reproductive organ. It is a relatively short S-
shape tube which its mucosa forms longitudinal folds. The folds are the narrowest due to the
absent of secretory glands except near the utero-vaginal junction (Aitken, 1971). The vagina
plays no role in egg shell formation; however, this part is important for the process of
fertilization as a sperm storage site (Donovan et al., 1969).
C. EGG PRODUCTION PROCESS AND TIMING
Egg Yolk Formation
Yolk deposition process occurs relatively slow in the developing follicles and none of the
material of the yolk is directly originated from the ovary. Synthesis of the yolk lipoprotein occurs
in the liver and under normal circumstances the main precursors are the break-down products of
dietary carbohydrates. Nevertheless, some dietary lipid may be used and in adverse dietary
conditions there may be mobilization of lipid from the adipose tissue (Gilbert and Pearson,
1983). It is generally accepted that the synthesis of yolk protein and lipoprotein are from liver
and are under the influence of estrogen stimulation (McIndoe, 1971). After synthesized, these
yolk materials are transported to the ovary and accumulated in developing follicles. Gilbert
(1980) separates the process of yolk development into three stages. In the first stage that may
last for several months is characterized by a slow deposition of material consisting mainly
neutral fat. This is followed by the second stage that may occur over a period of about 60 days,
the size of follicle increases from about 1 mm to 6 mm (Burke, 1984). And the last stage of
seven or eight days when some individual follicles undergo the rapid growth phase, the main
11
mass of egg yolk material is laid down and follicle weight increase almost linearly before only
one of the follicles is ovulated.
Egg White Formation
It has been well established that the major portions of protein in egg white, in contrary
with egg yolk, are produced from the mucosal cell of oviduct (Williams, 1962). However, except
ovotransferrin that may be originated from the blood (Gilbert, 1971b). Most of the proteins
required for albumin formation are completely discharged and newly formed in the magnum
during the intervals between the passages of successive eggs downs the oviduct (Wyburn et al.,
1970). The development of the structural organization of albumen is described below.
Right after the ovulation, ovum and yolk are engulfed by the funnel part of infundibulum
and it will take about 15 minutes in this part. Then the series of albumin layer is deposited in the
ovum starting from the caudal region of the infundibulum. As the egg passes along the magnum,
the inner white and the middle thick white are added. This portion of albumen is accounted as the
major part in the whole egg (Conrad and Phillips, 1938). Egg will spend time in passing through
the magnum for two to three hours. For the next one or one and a half hour, the egg will pass
through the isthmus when protein-permeable shell membrane is formed and a small amount of
water is added (Gilbert, 1980). Consequently, for the first five to six hours in the shell gland, the
total mass of albumen is increased by the addition of water, some salts and glucose through the
process call ‘Plumping’ (Solomon, 1983). This process causes the visible distinction between
middle thick layer albumen and outer thin layers albumen (Asmundson and Burmester, 1936).
12
Egg Shell Formation
The formation of the first shell structure, shell membrane, starts in the isthmus, then, the
egg moves to the shell gland in which the egg will stay for shell formation for approximately 13
to 15 hours after the plumping process as previously described. Calcium absorption from the
blood and secretion in the uterine fluid occurs by active transport via a calcium-ATPase pump
and a Ca2+/Na exchanger. A calcium- binding protein, calbindin, is present in the uterine cells
and this protein is identical to a vitamin D-dependent protein found in the intestine. The function
of calbindin may be involved in calcium transport or may be protecting the cells from high levels
of intracellular calcium (Nys et al., 1989). Levels of calbindin increased in uterine cells at sexual
maturity in response to estrogen stimulation of oviduct development and are not depending on
vitamin D (Nys et al., 2004). Calcium secretion and levels of calbindin mRNA varies during the
ovulatory cycle and increase during shell formation. Shell deposition only occurs when the
presence of a yolk in the uterus and is synchronized with the ovulation. This suggests that
hormonal factors linked to ovulation and follicular maturation regulate calbindin synthesis.
After enzyme carbonic anhydrase convert CO2 and H2O to carbonate (bicarbonate ions),
it is secreted into the lumen by sub-epithelial tubular glands. Then the interaction between
carbonate and calcium forms calcium carbonate which is the major egg shell component
(approximately 98%). There are very strong evidences that calcium used to form the shell is
derived from the blood because there is no calcium stored in the oviduct (Simkiss and Taylor,
1971).

13
D. CALCIUM AND PHOSPHORUS RELATED TO EGG SHELL AND BONE QUALITY
Egg Shell and Economical Important
Eggshell damage is one of the major economic losses to the commercial egg industry
(Nys et al., 2004). The cost of egg handling from hen to carton was estimated to be about $0.08
per hen (Diamon V, 2013). Roland, (1988) estimated that the lost from cracked eggs in the
processing plant was about 4.0%. Estimates of average of total eggs cracked or lost prior to
reaching their final destination ranged from 13% to 20%, with a dollar loss calculated to be
between $1.32 to $2.00 per bird. Therefore, if there is a crack on eggs during the handling
process, it means the cost of handling has been added up. Mechanical damage was reported to be
the most obvious cause for egg shell crack, either by the birds themselves or as a result of poor
management practices, such as infrequent collection of eggs, rough handling and poor design or
maintenance of the cage floor (Gerber, 2006). Egg shell strength ultimately affects the soundness
of the shell. Weaker shelled eggs have more prone of cracks and breakages and subsequently
leading to microbial contamination. Several factors affect eggshell quality: genetics of the hen,
nutrition, such as the availability of dietary calcium and levels of other minerals (i.e. phosphorus
and chloride), management of feed intake, disease challenge and equipment insult. The egg shell
is also important for successful development of the chick embryo as it provides protection from
damage, infection and desiccation, and provides a source of calcium for skeletal development.
Nys et al. (2004) reported that the mineralization process, which involves both shell matrix
proteins and calcium salt crystals, affects shell strength.

14
The Relationship of Feeding Management and Egg Shell and Bone Quality
For mineralization process, an adequate supply of calcium is essential for proper shell
formation. In the general layer diet, 2.71 gram of calcium and 0.21 gram of nonphytate
phosphorus (NPP) is recommended in white-egg layers with 100 gram of daily feed intake, or
10% higher in brown-egg layers according to higher body weight and possibly higher egg mass
(NRC, 1994). Calcium and phosphorus recommendation is higher in breeder type layers at 3.25 g
Calcium and 0.25 g of nonphytate phosphorus at 100 g daily feed intake. According to egg
production cycle, shell forming generally occurs during the night time period. Squires (2003)
reported that plasma calcium level rises from 100 µg mI-1 before the onset of lay to 200-270 µg
mI-1 throughout egg production.
The source of calcium, especially in commercial layer type hen, partly came from diet
when feed will be made available 24 hrs. There is an observation that feed intake of the hen will
increases during two hours before the onset of darkness, and hens will readily pick out large
particles of oyster shell or limestone pellets, and store these in the gizzard, where soluble
components will be released by the HCI (Squires, 2003). However, in broiler breeder hens,
feeding amounts are generally restricted and are typically fed once in the morning so that there
were no available calcium sources from the diet during the dark period. With the limited calcium
absorbed from the intestine and rapid short-term demand for calcification process, the calcium
required are fulfilled by calcium stored mostly in medullary bone and sometime in cortical bone
under the influence of parathyroid hormone (Fisher, 1983).
In order to provide an additional source of calcium beside the bone source during the egg
production cycle, feed management strategies had been utilized. Novo et al. (1997) studied the

15
extra supplement of limestone before the dark period and found that 4 gram per hen per day at
16:30 hour helped to improve egg shell specific gravity in hen 46 weeks of age; however, the
effect disappeared at 65 week of age. In addition to extra calcium source before dark period, the
regulation of passage rate of calcium through the digestive tract had been used to alleviate
calcium shortage from the gastrointestinal tract. Some research studies showed that the increase
of the particle size of the calcium source slowed the release of calcium into the digestive system
from the gizzard (Zhang and Coon, 1997). Slower release lead to the availability of calcium for
shell formation later in the day and then the need for bone calcium would be diminished. Early
studies in laying hens showed egg shell quality improvement when a coarse particle calcium
source was utilized (Guinotte and Nys, 1991; Fleming et al., 1998). In contrast, Keshavarz et al.
(1993) reported that solubility between 47% and 88% related to two source of calcium
(limestone and oyster shell) used in laying hen diet had no significant effect on egg shell quality;
however, there was the confounded effect between source and particle in this particular study.
Scheideler (1998) reported the improvement of egg shell quality by the large particle size
calcium source either from limestone or oyster shell. Lichovnikova (2007) studied both the effect
of midnight feeding and the effect of particle size (by mixing different particle size of limestone
and other calcium source) and found that mid night feeding (90 g during the light period and 30 g
during the dark period) had no effect on shell quality but improve calcium retention and found
that the higher ratio of large particle size limestone improved egg shell weight, egg shell
thickness and egg shell strength. Recently, Ekmay and Coon (2010) tested large particle
limestone (3489.7 micron, 38.5% solubility) and small particle limestone (185.5 micron, 28.8%
solubility) and found that the larger particle limestone increased both shell and bone qualities in

16
pure line breeder hens. A coarse particle size of calcium improves shell quality by increasing the
period when calcium is available from the diet.
The Relationship of Dietary Calcium/Phosphorus and Egg Shell and Bone Quality
Calcium and phosphorous are essential macro minerals. Both an excess and a deficiency
will negatively affect both shell and bone quality. Mainly, calcium forms a significant
component of the shell and phosphorous plays an important role in skeletal formation. Calcium
deficiency will also affect shell quality and tends to deplete the calcium content of the bone,
which can lead to brittle bones and fractures or Cage Layer Fatigue. There are several studies
reported the relationship of dietary calcium and phosphorus related to egg shell and bone quality.
Keshavarz et al. (1993) reported that the increased of calcium level from 3 to 4 % had no effect
on shell quality (with NPP level at 0.4%). Keshavarz and Nakajima (1993) reported the increase
of dietary calcium (3.5 to 5.5%) did not have any beneficial effects on shell quality at the
constant level of 0.4% nonphytate phosphorus. In addition the same authors indicated that at the
constant level of calcium with a step-down nonphytate phosphorus phase feeding regimen (from
0.3 and 0.2 % at the week after 52 weeks of age) had no effect on shell quality and the increased
of dietary calcium in each phase reduced percentage retention of calcium whereas absolute
retention of calcium remained constant. Scott et al. (1999) showed similar results as Keshavarz
and Nakajima (1993) indicating that at the constant level of dietary calcium (3.7 and 4.0%) there
was no significant improvement in egg production at the higher level of nonphytate phosphorus.
Keshavarz (2000) tested the graded level of nonphytate phosphorus (0.15 to 0.35%) with a
constant level of calcium (3.8%) and found that specific gravity was greater in hens fed less

17
nonphytate phosphorus and phytase supplementation had an adverse effect on specific gravity.
Keshavarz (2003a) reported that at the constant level of 0.4% nonphytate phosphorus, the
increase level of dietary calcium from 3.34 to 4.92 % had no effect on egg production and shell
quality and found that nonphytate phosphorus at 0.2% was adequate while 0.1% was deficient
for egg production performance. Keshavarz (2003b) reported that genetic lines affected the
responses of dietary nonphytate phosphorus levels and phytase enzyme supplementation.
Çelebi and Bölükbasi (2005) reported that the increase of nonphytate phosphorus from
0.15 to 0.45% in diet of late production hens negatively affected plasma calcium. Narvaez-
Solarte et al (2006) tested the effect of calcium level (2.6 to 4.2%) on a fixed 0.35% nonphytate
phosphorus diet and found a quadratic response with shell quality (peak shell weight was at
3.56% calcium). Safaa et al (2008) demonstrated the increase in calcium intake from 4.08 to 4.64
g/hen per day (with constant calcium: calcium ration) significantly improved egg production and
shell quality in aged hens (increase egg production from 71.2 to 74.9%; egg mass form 49.0 to
51.4 g; feed to egg conversion ratio from 2.43 to 2.30 kg of feed/kg of egg; increase shell weight
from 9.98 to 10.20; shell thickness from 0.342 to 0.351 mm) and suggested the higher
requirement of calcium in aged hens. Pelicia et al. (2009) tested four levels of calcium and four
levels of nonphytate phosphorus in the diet using factorial arrangement found that increasing
dietary calcium improved shell quality and reported an without effect of nonphytate phosphorus.
In addition same author reported the positive influence of dietary calcium on plasma calcium
concentration and calcium in excreta without any effect of nonphytate phosphorus. Ahmadi and
Rodehutscord (2012) reported meta-analysis data collected from 14 trials using a full quadratic
model fund that in corn-soybean meal-based diets containing 0.22% of nonphytate phosphorus
without supplemental phytase resulted in highest egg production, egg mass and feed efficiency in

18
layers. In summary, most of the trials reached a similar conclusion that the high level of
nonphytate phosphorus had negative impact on egg production and had a negative impact on egg
shell quality with mixed results of improvement with increases level of dietary phosphorus. Age
and genetic line seemed to contribute to differences in the response.
E. BONE: HORMONAL CONTROL AND HOMEOSTASIS BIOMARKER
Parathyroid, 1, 25(OH) 2 D, and Fibroblast Growth Factor 23
Calcium (Ca) is one of the most efficiently regulated plasma constituents in birds.
Growing chickens about one week of age can correct a change of plasma calcium within a few
minutes (Dacke et al., 1993a). Parathyroid hormone (PTH) is a peptide hormone that is produced
in the parathyroid gland and acts on certain cell through parathyroid hormone receptor on the cell
surface. Bone and kidney are the primary target organs for parathyroid hormone. It has been
recognized that birds are very sensitive to parathyroid hormone. Candlish and Taylor (1970)
reported the response time after injection of bovine parathyroid hormone in egg-laying hens and
found that it was as early as 8 minutes after administration. Haussler (1986) reported that
parathyroid hormone had the effect on the spreading of osteoclasts on bone surfaces in bone
culture slices. Further studies have been found that parathyroid hormone receptors are only
located on the surfaces of osteoblasts and there was no direct effect on osteoclast (Stilborn and
Waldroup, 1990; Stipanuk, 2006).

19
Mechanism of action of parathyroid hormone starts when parathyroid hormone binds
with the specific receptor on mature osteoblasts which stimulates osteoblasts to increase their
expression of RANKL (receptor activator of NF-kB ligand). Monocytic osteoclast precursor cells
have the receptor RANK. Once the RANK on the monocytic cell interacts with the RANKL of
the osteoblast, the signal transduction induces the promotion of osteoclast differentiation and
activation into mature active bone-resorbing osteoclast (Stipanuk, 2006). After activation,
osteoclasts form ruffled borders bounded by filamentous-rich on bone surface within 20 minutes
after hormone administration. These changes were marked as a characteristic of 'active'
bone-resorbing cells found during shell calcification (Pandalai and Gay, 1990).
In kidney, the increase of plasma parathyroid hormone concentrations is detected by renal
parathyroid hormone receptors, causing the kidneys to rapidly increase the rate of renal calcium
reabsorption and decrease the rate of phosphate reabsorption. In addition, parathyroid hormone
also increase the activity of renal 25-hydroxy VitaminD 1α-hydroxylase that converts the
biologically inactive vitamin D metabolite (25-(OH) D) into the active hormonal form, 1,25-
(OH)2D. The active metabolite 1,25-(OH)2D acts through an intracellular receptor protein call
vitamin D receptor (VDR) which regulate gene expression in nucleus of target cell and
membrane-associated vitamin D responsive elements which responsible for non-genomic effects.
In the small intestine, 1,25-(OH)2D up-regulates calmodulin, calbindin, calcium ATPase, and
transient receptor potential channel vanilloid 6 (TRPV6) to increase active calcium absorption
(Crenshaw et al., 2011) and its action depends on adequate formation of 1,25-(OH)2D and an
intact vitamin D receptor (Lips, 2006). In bone tissue, 1,25-(OH)2D acts through VDR in
osteoblasts resulting in the increase of the production of RANKL in the similar mechanism to
parathyroid hormone and ultimately promote bone resorption by osteclastic cells. However, the

20
higher concentrations of 1,25-(OH)2D are necessary for this bone resorptive effect to be
observed. Suda et al. (1997) reported that lower concentration of 1,25-(OH)2D apparently inhibit
parathyroid hormone-induced RANKL expression leading to the promotion of bone formation.
Recently, the discovery of phosphorus regulating hormone, fibroblast growth factor 23
(FGF 23), has expanded a huge knowledge of phosphorus regulatory mechanism. An elaborated
detail on of the review can be found in several reports (Saito and Fukumoto, 2009; Hori et al.,
2011; Crenshaw et al., 2011). In brief, FGF23 was identified in 2000 as the last member of FGF
family and is secreted by osteocytes and osteoblasts. The circulating FGF23 is regulated by
serum phosphorus (Mirams et al., 2004; Saito et al., 2005) and the administration of 1,25-
(OH)2D increases the expression of FGF23 mRNA in bone (Kolek et al., 2005). FGF23 acts on
the kidney to increase phosphate excretion and decrease the activity of the 25-hydroxy VitaminD
1α-hydroxylase (CYP27B1) and hence decrease intestinal calcium and phosphorus absorption
(Shimada et al., 2004). Recent discovery indicated that circulating FGF23 increases phosphate
excretion by reducing the expression of proximal renal tubular brush border membrane sodium-
phosphate cotransporters (NaPi2a and NaPi2c), which their normal function is to reabsorb
phosphorus from proximal renal tubular (Shimada et al., 2005; Segawa et al., 2009). The reaction
between FGF23 and 1,25-(OH)2D suggests a kidney-intestine-bone axis that mediates phosphate
homeostasis (Kolek et al., 2005). It has been shown that excess and deficient actions of FGF23
con result in hypophosphatemic, rickets or osteomalacia, and hyperphosphatemic tumoral
calcinosis, respectively (Saito and Fukumoto, 2009).

21
Some recent reports indicated a more complicated mechanism of action for FGF 23.
Beside the interaction loop between FGF23 and 1,25-(OH)2D, Silver and Naveh-Many (2009)
reported both 1,25-(OH)2D and FGF23 can inhibit parathyroid hormone gene expression and
secretion. In Vitamin D Receptor (VDR)-null mice (KO-mice), Shimada et al., (2005) reported
that the injection of FGF23 can reduce plasma phosphate concentration and the increase of
dietary calcium supplementation significantly increased circulatory levels of FGF23, and,
conversely, dietary phosphate supplementation failed to induce FGF23 expression. This
suggested that FGF23 work independently of 1,25-(OH)2D / VDR system. Calcium can increase
the production of FGF 23 from bone independently of VDR-mediate mechanism, and the effect
of phosphorus on the increase of FGF 23 is a VDR-mediated mechanism. Taken together, FGF23
works, at least in part, in a VDR-independent manner, and FGF23 production is also regulated by
multiple mechanisms involving both VDR-independent (for calcium) and VDR-dependent (for
phosphorus) pathways.
Osteoclast and TRAP Enzyme
Extensive reviews of osteoclast have been described by Dacke (1993) and Vaananen et
al. (2000). In summary, osteoclasts are multinucleated cells responsible for bone resorption.
They are extremely large cells containing multinuclear, abundant mitochondria, lysosomes, free
ribosomes and extensive Golgi complexes (Dacke et al., 1993b). They have developed efficient
machinery for dissolving crystalline hydroxyapatite and degrading organic bone matrix rich in
collagen fibers. When initiating bone resorption, osteoclasts become polarized, and three distinct
membrane domains appear: a ruffled border, a sealing zone and a functional secretory domain

22
(Vaananen et al., 2000). In the relationship to egg cycle, Miller (1977), using egg laying
Japanese quails at different points in the egg-laying cycle, observed ruffled borders in actively
resorbing medullary bone osteoclasts, while inactive osteoclasts, although still adhering to the
bone surface, were not polarised and failed to display specialised membrane areas.
The clear zone and ruffled border are sometime referred to the resorptive apparatus of the
cell. There were the observations of extensive vesicle transport of hydrochloric acid and
proteases to the ruffled border to an area between the ruffled border and the bone surface
(Vaananen et al., 2000). The low pH in the resorption apparatus is achieved by the action of
ATP-consuming vacuolar proton pumps which is produced by cytoplasmic carbonic anhydrase
II. In the extracellular compartment, crystalline hydroxyapatite is dissolved by acid, and a
mixture of proteases degrades the organic matrix. The degradation products of collagen and other
matrix components are endocytosed and transported through transcytotic vesicular pathway
where they are liberated into the extracellular space (Nesbitt and Horton, 1997). Recent report by
Halleen et al. (1999) indicated that tartrate-resistant acid phosphatase (TRAP), a widely used
osteoclast marker, which localized in the transcytotic vesicles of resorbing osteoclasts played the
important role of further destruction of matrix-degradation products in the transcytotic vesicles.
Addition information from Hollberg et al. (2002) demonstrated that TRAP-deficient osteoclast in
mice lead to the accumulation of vesicles in the cytoplasm.
Dacke et al. (1993b) described that there are at least six different acid phosphatase
isoenzymes. However, the most distinguished form is the form that is not inhibited by D-tartrate
(Yam et al., 1971)) and it is referred to as tartrate-resistant acid phosphatase. TRAP has been
used as a relatively specific marker for osteoclasts (Minkin, 1982; Sawyer et al., 2003).
However, high amounts of tartrate-resistant acid phosphatase are not only expressed in
23
osteoclasts but it is also expressed in activated macrophages, such as alveolar macrophages of
the lung (Yaziji et al., 1995). Originally, TRAP was discovered in leukocyte extracts of patients
with hairy cell leukemia. It was first named as type-5 acid phosphatase according to its fast
electrophoretic mobility toward the cathode on acidic acrylamide gels (Li et al., 1970). However,
later, it could be separated electrophoretically into two distinct bands: 5a and 5b. The different of
these forms is, 5a contains sialic acid and 5b does not. In addition their pH optimum was
different, being approximately 4.9 for 5a and 5.5–6.0 for 5b and further electrophoretic studies
suggested that TRAP 5b would be derived from osteoclasts and TRAP 5a from some other
unidentified source (Lam et al., 1978). By comparing TRAP 5a and TRAP 5b to other bone
resorptive markers, Halleen et al. (2000) demonstrated that only TRAP 5b is a specific and
sensitive marker for bone osteoclast and could be used as a bone resorptive marker.
Minkin (1982) tested bone resorption in the relation of the release of TRAP concentration
in new born mouse calvaria culture by using either parathyroid hormone or 1,25(OH)2D3 and
found that there was a significant increase in both tartrate-resistant and tartrate-sensitive acid
phosphatase activity in the medium relative to cultured controls. In addition, there were
relationships among histochemical observation of osteoclastic-TRAP positive cell and the TRAP
concentration obtained from biochemical assays and polyacrylamide gel electrophoresis and
concluded that Tartrate-resistant acid phosphatases of bone may be suitable biochemical probes
for osteoclast function suggesting that the release of tartrate-resistant acid phosphatase was from
osteoclasts. Rissanen et al. (2008) tested the secretion of tartrate-resistant acid phosphatase 5b
(TRACP 5b) from human CD34+ osteoclast precursor cells and found that TRACP 5b correlated
strongly with osteoclast number and TRACP 5b is a reliable marker of osteoclast number.
Karsdal et al. (2005) reported the use of chemicals to inhibit the acidification process (chloride
24
channels blocker (NS5818/NS3696) and proton pump blocker (bafilomycin)) of osteoclast cell
found that it prolonged osteoclast lifespan and number resulting in a 150 to 300% increase in
osteoclasts compared to controls. However, in those animals bone resorption activity was
inhibited but there was the increase of TRAP. This indicated that TRAP may represent osteoclast
number but not represent bone absorption in the case of acidification defect of osteoclast.
Bone Specific Alkaline Phosphatase (BSAP)
Alkaline phosphatases (ALP) are glycoproteins that are coded by at least four gene loci.
It can roughly be categorized by its tissue of the origin (tissue-nonspecific (liver, bone, and
kidney), intestinal, and placental-ALP) (Garnero and Delmas, 1993). In human, ALP produced in
liver, bone, and kidney exhibit similar biochemical and immunologic properties; however, they
showed slight physical differences. Weiss et al. (1986) reported that they differ from each other
on the basis of electrophoretic mobility, and heat and urea stability due to posttranslational
modifications, such as glycosylation and sialylation. Bone specific alkaline phosphatase (BSAP)
is a tetrameric glycoprotein localized in the plasma membrane of osteoblasts. Studied in WISH
cell line (ATCC-CCL 25), originally derived from normal amniotic tissue, this enzyme is
released into the circulation as a dimer by phospholipase cleavage of a membrane anchoring
phosphatidylinositol-glycan moiety that is attached to the carboxyl-terminus of the protein
(Howard et al., 1987). It has been proposed that the activity of alkaline phosphatase is required to
generate the inorganic phosphate needed for hydroxyapatite crystallization by utilizing ATP and
inorganic pyrophosphate. Hessle et al. (2002) demonstrated that the primary function of alkaline
phosphatase in mineralizing tissues is to act in concert with plasma cell membrane glycoprotein-
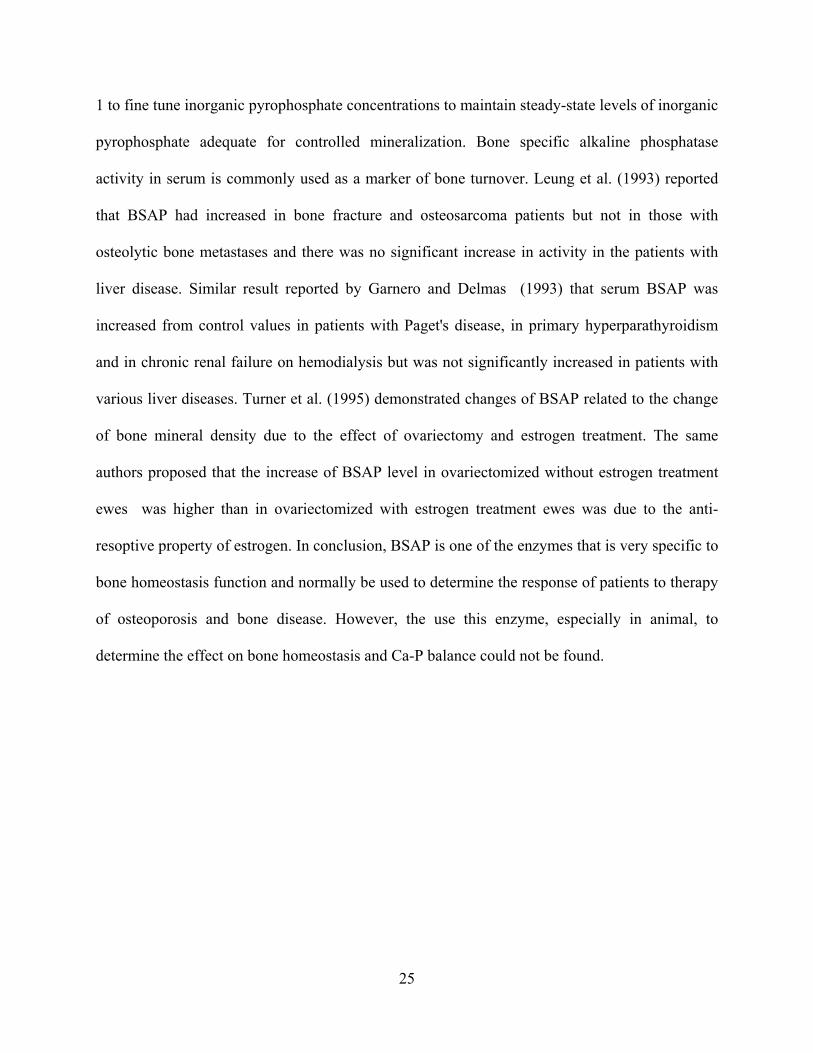
25
1 to fine tune inorganic pyrophosphate concentrations to maintain steady-state levels of inorganic
pyrophosphate adequate for controlled mineralization. Bone specific alkaline phosphatase
activity in serum is commonly used as a marker of bone turnover. Leung et al. (1993) reported
that BSAP had increased in bone fracture and osteosarcoma patients but not in those with
osteolytic bone metastases and there was no significant increase in activity in the patients with
liver disease. Similar result reported by Garnero and Delmas (1993) that serum BSAP was
increased from control values in patients with Paget's disease, in primary hyperparathyroidism
and in chronic renal failure on hemodialysis but was not significantly increased in patients with
various liver diseases. Turner et al. (1995) demonstrated changes of BSAP related to the change
of bone mineral density due to the effect of ovariectomy and estrogen treatment. The same
authors proposed that the increase of BSAP level in ovariectomized without estrogen treatment
ewes was higher than in ovariectomized with estrogen treatment ewes was due to the anti-
resoptive property of estrogen. In conclusion, BSAP is one of the enzymes that is very specific to
bone homeostasis function and normally be used to determine the response of patients to therapy
of osteoporosis and bone disease. However, the use this enzyme, especially in animal, to
determine the effect on bone homeostasis and Ca-P balance could not be found.

26
CHAPTER 3
BODY COMPOSITION, EGG PRODUCTION AND SHELL QUALITY OF EGGS FROM FOUR
BREEDER GENETIC LINES FED DIETS VARYING IN CALCIUM AND NONPHYTATE
PHOSPHORUS CONTENT

27
III. CHAPTER 3
A. BODY COMPOSITION, EGG PRODUCTION AND SHELL QUALITY OF EGGS FROM FOUR BREEDER GENETIC LINES FED DIETS VARYING IN CALCIUM AND NONPHYTATE PHOSPHORUS CONTENT
B. ABSTRACT
The effect of calcium (Ca) and nonphytate phosphorus (NPP) level in four breeder
genetic lines from 21 through 50 weeks of age was determined. Pullets (246 hens from each of
purelines A, B, C and D) were individually caged and light stimulated at 21 weeks of age. Hens
from each line were fed with one of six diets varying in calcium and NPP: 1) 2.25% Ca with
0.25% NPP, 2) 2.50% Ca with 0.25% NPP, 3) 2.75% Ca with 0.25% NPP, 4) 3.0% Ca with
0.25% NPP, 5) 3.25% Ca with 0.25% NPP, and 6) 3.25% Ca with 0.40% NPP. Daily allotted
feed intake was increased for every 8 percent increase in egg production going from 5% to peak.
At peak feed intake the breeders consumed a minimum of 3.08 g calcium and 0.34g nonphytate
phosphorus and the maximum intake of 4.45g calcium and 0.55g nonphytate phosphorus. Egg
production and feed intake were recorded daily. Eggs were weighed 2 consecutive days a week.
Body weight, body composition and egg quality variables were measured monthly. Body
composition was determined for 4 hens from each treatment (line x diet) using dual energy x-ray
absorptiometry (DXA). Statistical analysis was done using two-way ANOVA with interaction
from main factors (line and diet). Results showed that genetic line had a significant effect on all
tested variables except calcium and phosphorus digestibility. Level of calcium and nonphytate
phosphorus in the feed had no effect on egg production, age at first egg, mortality, or egg weight.
However, hens fed diets 5 and 6 had significantly better egg shell quality compared to those fed
28
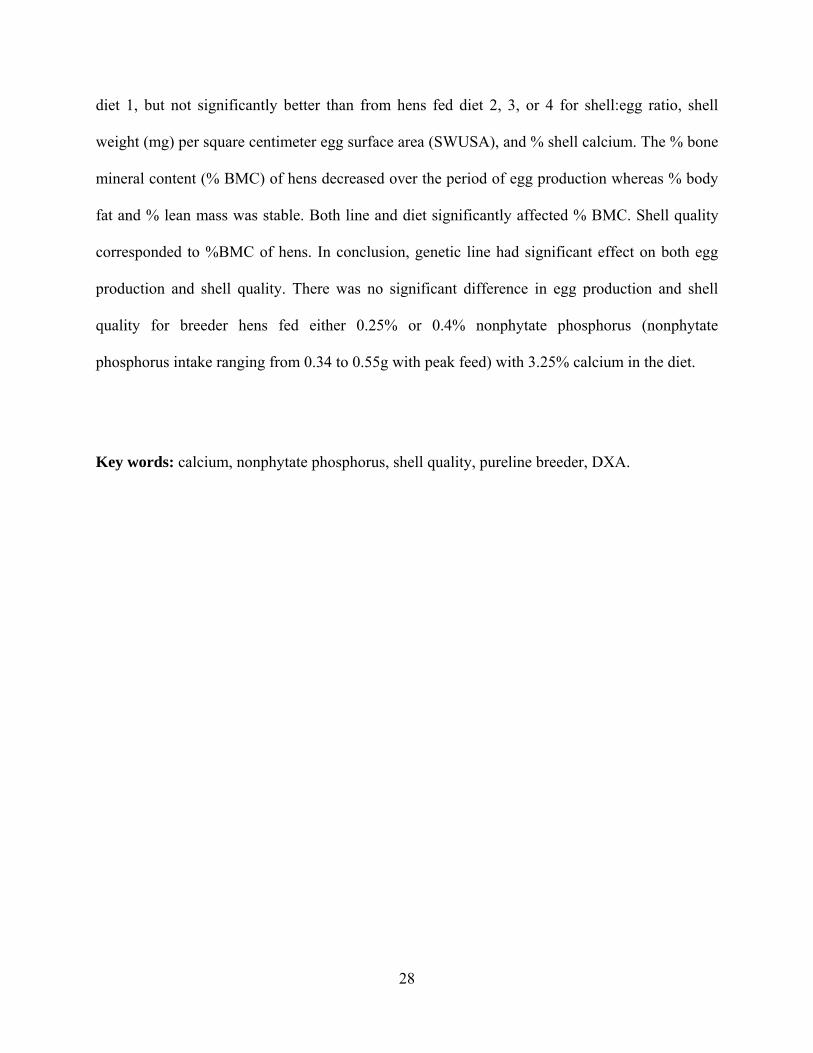
diet 1, but not significantly better than from hens fed diet 2, 3, or 4 for shell:egg ratio, shell
weight (mg) per square centimeter egg surface area (SWUSA), and % shell calcium. The % bone
mineral content (% BMC) of hens decreased over the period of egg production whereas % body
fat and % lean mass was stable. Both line and diet significantly affected % BMC. Shell quality
corresponded to %BMC of hens. In conclusion, genetic line had significant effect on both egg
production and shell quality. There was no significant difference in egg production and shell
quality for breeder hens fed either 0.25% or 0.4% nonphytate phosphorus (nonphytate
phosphorus intake ranging from 0.34 to 0.55g with peak feed) with 3.25% calcium in the diet.
Key words: calcium, nonphytate phosphorus, shell quality, pureline breeder, DXA.

29
C. INTRODUCTION
Calcium and phosphorus are two of the most important macro mineral that are very
important in laying hen and are required to have in the diet in order to maintain the normal
physiological function of the body. In egg laying animal, calcium forms a significant component
of the shell and phosphorous plays an important role in skeletal calcium deposition. Either excess
or deficiency will negatively affect both shell and bone quality. Calcium deficiency can decrease
shell quality and tends to deplete the calcium content of the bone, which can lead to brittle bones
and fractures or Cage Layer Fatigue.
According to NRC (1994), recommendation level of calcium in the diet is 2 % at 18 week
until first egg in immature leghorn-type chicken with the 0.32% nonphytate phosphorus. The
recommendation is lower in brown-egg-laying strain at about 1.8% calcium and 0.35%
nonphytate phosphorus at the same age. The requirement for laying period is recommended for
breeder is at 3.25 % calcium and 0.25 % nonphytate phosphorus and for white-egg-layer is
2.71% calcium and 0.21% nonphytate phosphorus. However, regardless of the recommendations,
the levels used in commercial flocks are generally higher, especially for nonphytate phosphorus.
Several studies have been published with the values in the diet ranging between 2.4 to 5.5 % for
calcium and 0.15 to 0.47 % for nonphytate phosphorus (Keshavarz and Nakajima, 1993; Bar et
al., 2002; Ahmadi and Rodehutscord, 2012).
Dietary nonphytate phosphorus higher than 0.4% has been reported as not having any
addition value to egg production, shell quality and bone quality (Scott et al., 1999; Keshavarz,
2003a). Some reports observed negative effect on either egg production or egg shell quality or

30
both (Boorman and Gunaratne, 2001; Keshavarz, 2000; Ekmay and Coon, 2011). Keshavarz
(2003a) indicated that the nonphytate phosphorus level at 0.2 % was adequate to maintain egg
production and egg shell quality. Ahmadi and Rodehutscord (2012) recommended 0.22 % of
nonphytate phosphorus in a corn soybean diet without supplementation of phytase. Leske and
Coon (2002) reported the relationship of retainable phosphorus content and nonphytate
phosphorus in excreta and suggested that when chickens receive phosphorus levels that are
higher than the physiological threshold, there is a possibility that the additional phosphorus may
be eliminated most likely through the kidney. Finally the authors indicated that 0.25 % dietary
nonphytate phosphorus was the physiological threshold.
With the advance technology of dual energy x-ray absorptiometry (DXA), body
composition changes of broilers or broiler breeders and egg composition and egg shell quality
could be evaluated with high correlation to its biological value, while the conventional methods
are very time consuming and often more subject to errors (Salas et al., 2012; England et al.,
2012). Therefore the objective of this study was to evaluate body composition, egg production
and egg shell quality in four breeder genetic lines fed graded levels of dietary calcium on 0.25 %
of nonphytate phosphorus compare to the commercially recommended levels from 21 to 50
weeks of egg production.

31
D. MATERIALS AND METHODS
All procedures relating to the use of live animal in these experiments were approved by
the University of Arkansas Institutional Animal Care & Use Committee (13002 approval
number).
Animal and Handling
Nine hundreds and eighty four hens from four pure genetic lines (246 hens each from line
A, B, C, and D) were brought to experimental farm at the age of 20 week old. Each hen was
assigned a unique individual identification number and was raised individually in battery cage
with a separate feeder and water nipple. All birds were kept in an environmentally controlled
house. Light schedule began with 12 hours per day at week 21 of age and increased 1 hour for
the next two weeks until it reached 14 hours per day. After that period the light duration
increased to 15 and 16 hours per day at 20% and 50% egg production, respectively. Temperature
was targeted to maintain at 22 °C throughout the experimental period.
Feed and Feeding
The large batches of basal diet were formulated to meet or exceed nutrient requirement as
recommended by breeder company except calcium (Ca) and nonphytate phosphorus (NPP). The
various levels of calcium in each diet were achieved by the substitution of limestone with sand

32
(same batch for entire experimental duration). Dietary treatments in this experiment consisted of
1) 2.25% Ca with 0.25% NPP; 2) 2.50% Ca with 0.25% NPP; 3) 2.75% Ca with 0.25% NPP; 4)
3.0% Ca with 0.25% NPP; 5) 3.25% Ca with 0.25% NPP; and 6) 3.25% Ca with 0.40% NPP.
Feed composition and calculated nutrient content is shown in Table 1. Daily allotted feed intake
was restricted and increased for every 8 percent increase in egg production going from 5% to
peak. Residual feed (left over) was weighed and cleared from feeding tray once a week, if any
was present. Hens had free access for water all the time.
Data and Sample Collection
The experimental period started from week 21 through week 50. Egg number and feed
intake were recorded daily. Individual egg weight from every hen was recorded two days a week.
Monthly, hens’ body weights were monitored; egg quality variables were collected for three
consecutive days, and the same four hens from each treatment (Lines x Diets) were scanned
monthly using dual energy x-ray absorptiometry (DXA) (GE Lunar Prodigy, GE®, USA) for
body composition evaluation.
Calcium and phosphorus digestibility test were performed on every new batch of
treatment diets delivered to the experimental farm. Fourteen hens from each treatment group
were fed a diet supplemented with two percent acid insoluble ash (AIA, Celite®, World Minerals
Inc., USA) for at least three days. On the last day of the digestibility trial, eight hens per
treatment were selected for fecal collection based on the least fecal contamination from broken
egg, feather and feed residual. Feces from each hen was individually collected and freeze-dried

33
to determine calcium and phosphorus digestibility. In digestibility tested hens, an additional two
percent of the daily dietary allowances were increased to compensate the amount of acid
insoluble ash added in the diet. The digestibility values (%) were calculated using formula
below:
Ca/P Digestibility = [1 − (Dietary AIA / Excreta AIA) × (Excreta Ca -P/ Dietary Ca- P)] * 100
At the end of the experimental period, 20 hens from each treatment (Diet x Genetic lines)
were randomly selected for wing venous blood collection using heparinized blood collecting tube
and euthanized by CO2. Blood samples were then centrifuged for plasma and stored at -80 °C to
determine plasma bone-homeostasis hormone and enzyme [fibroblast growth factor 23 (FGF23),
bone specific alkaline phosphatase (BSAP), and tartrate-resistant acid phosphatase (TRAP)].
Tibia bones from each hen were collected and kept in 10% buffer formalin for TRAP staining
(osteoclastic cell marker). Mortality rate was daily recorded. Dead hens were weighed and
examined by routine necropsy procedures.
For progeny trial, during the 27, 37, and 47 weeks of egg production, eggs were
individually weighted and collected for 6-day duration for hatchability test and progeny bone
ash. At week 47 of hatchability test, live hatched chicks from each treatment (line x diet) were
separated according to breeder treatments and raised in battery cages (10 chicks per cage) with 7
replications per treatment. All chicks were fed with a commercial starter diet for 14 days. On day
9, calcium and phosphorus digestibility test were performed by using acid insoluble ash (AIA,
Celite®, World Minerals Inc., USA) as an indigestible marker. Chicks were fed the Celite® diet
34
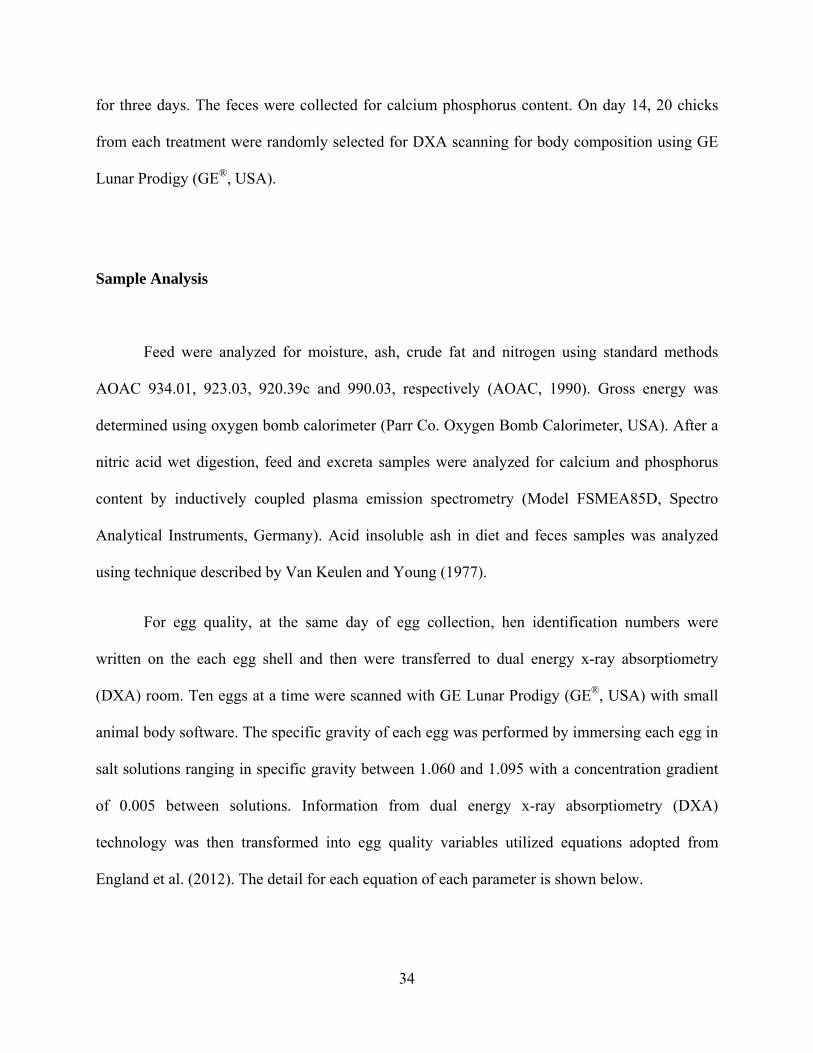
for three days. The feces were collected for calcium phosphorus content. On day 14, 20 chicks
from each treatment were randomly selected for DXA scanning for body composition using GE
Lunar Prodigy (GE®, USA).
Sample Analysis
Feed were analyzed for moisture, ash, crude fat and nitrogen using standard methods
AOAC 934.01, 923.03, 920.39c and 990.03, respectively (AOAC, 1990). Gross energy was
determined using oxygen bomb calorimeter (Parr Co. Oxygen Bomb Calorimeter, USA). After a
nitric acid wet digestion, feed and excreta samples were analyzed for calcium and phosphorus
content by inductively coupled plasma emission spectrometry (Model FSMEA85D, Spectro
Analytical Instruments, Germany). Acid insoluble ash in diet and feces samples was analyzed
using technique described by Van Keulen and Young (1977).
For egg quality, at the same day of egg collection, hen identification numbers were
written on the each egg shell and then were transferred to dual energy x-ray absorptiometry
(DXA) room. Ten eggs at a time were scanned with GE Lunar Prodigy (GE®, USA) with small
animal body software. The specific gravity of each egg was performed by immersing each egg in
salt solutions ranging in specific gravity between 1.060 and 1.095 with a concentration gradient
of 0.005 between solutions. Information from dual energy x-ray absorptiometry (DXA)
technology was then transformed into egg quality variables utilized equations adopted from
England et al. (2012). The detail for each equation of each parameter is shown below.

35
Total egg weight (g) = 10.3359+1.1169*BMC+0.4369*Tissue+0.2660*Tissue %
Fat+0.3554*Lean
Shell weight (g) = -0.4152+0.0295*Lean-0.0261*Tissue % Fat+1.0244*BMC
Shell Calcium (g) = 0.2297+0.4150*BMC-0.0171*Tissue+0.02240*Lean
Shell thickness (mm) = 0.1125-0.0005*Lean-0.0058*Tissue %Fat+0.0423*BMC
Albumen weight (g) = -12.5673+0.7040*Egg wgt-0.2293*Tissue %Fat-1.6164*BMC
Yolk weight (g) = 10.6746+0.2573*Egg wgt+18.8852*BMD g/cm +0.2826*Tissue %Fat
Where:
BMC = DXA body mineral concentration (g) from report printout by the Lunar Prodigy DXA
machine
BMD = DXA body mineral density (g/cm2) from report printout by the Lunar Prodigy DXA
machine
Tissue = DXA body mass (g) from report printout by the Lunar Prodigy DXA machine
Lean = DXA lean mass (g) from report printout by the Lunar Prodigy DXA machine
Tissue % Fat = Fat (g) per tissue (g) *100 from report printout by the Lunar Prodigy DXA
machine
To verify DXA-egg quality calculation equation from England et al. (2012), 18,132 scale
egg weights were compared with the same number of DXA calculated egg weight. The

36
correlation coefficient was greater than 99%. Body composition variables using DXA technology
utilized equations adopted from Salas et al. (2012). The detail for each equation of each
parameter is shown below:
Mineral (g) = Exp(1.12791987829434 + 0.781746850268085*LN(DXA BMC))
Fat mass (g) =Exp(0.652934780452235 + 0.866573940974689*LN(DXA Fat))
Lean mass (g) = Exp((-0.189754159479226) + 1.0185610251232*LN(DXA Lean))
Total mass (g) =Exp (0.098819119341294 + 0.984343048335571*LN (DXA Fat+ DXA Lean))
Tibia bone ash (%) =0.70314492300898 +0.01804692089203* DXA BMC -
0.0112228545231* DXA Area -0.0005611186595* DXA Lean
Where:
LN = natural logrithm
Exp = returns e raised to the power of a given number
BW = body weight
BMC = DXA body mineral concentration (g) from report printout by the Lunar Prodigy DXA
machine
Fat = DXA fat mass (g) from report printout by the Lunar Prodigy DXA machine
Lean = DXA lean mass (g) from report printout by the Lunar Prodigy DXA machine
Area (cm2) = DXA Area, ie. the area of footprint of the subject, not the volume from report
printout by the Lunar Prodigy DXA machine
37
Statistical Analysis
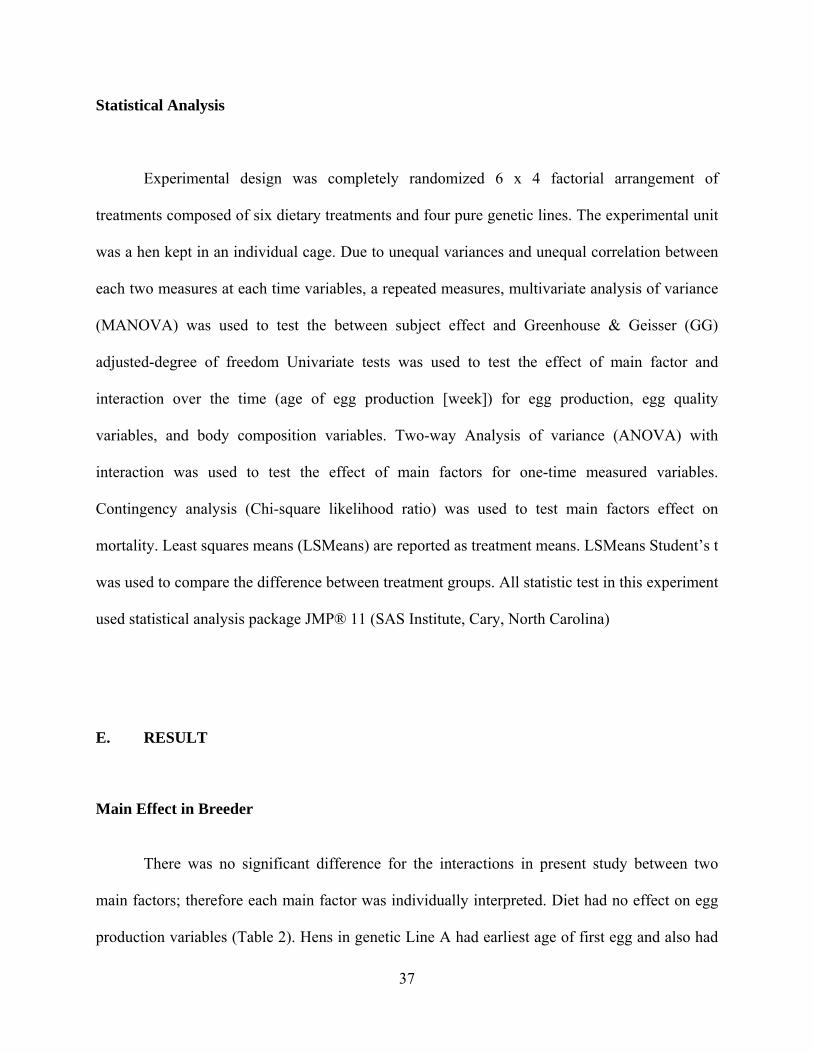
Experimental design was completely randomized 6 x 4 factorial arrangement of
treatments composed of six dietary treatments and four pure genetic lines. The experimental unit
was a hen kept in an individual cage. Due to unequal variances and unequal correlation between
each two measures at each time variables, a repeated measures, multivariate analysis of variance
(MANOVA) was used to test the between subject effect and Greenhouse & Geisser (GG)
adjusted-degree of freedom Univariate tests was used to test the effect of main factor and
interaction over the time (age of egg production [week]) for egg production, egg quality
variables, and body composition variables. Two-way Analysis of variance (ANOVA) with
interaction was used to test the effect of main factors for one-time measured variables.
Contingency analysis (Chi-square likelihood ratio) was used to test main factors effect on
mortality. Least squares means (LSMeans) are reported as treatment means. LSMeans Student’s t
was used to compare the difference between treatment groups. All statistic test in this experiment
used statistical analysis package JMP® 11 (SAS Institute, Cary, North Carolina)
E. RESULT
Main Effect in Breeder
There was no significant difference for the interactions in present study between two
main factors; therefore each main factor was individually interpreted. Diet had no effect on egg
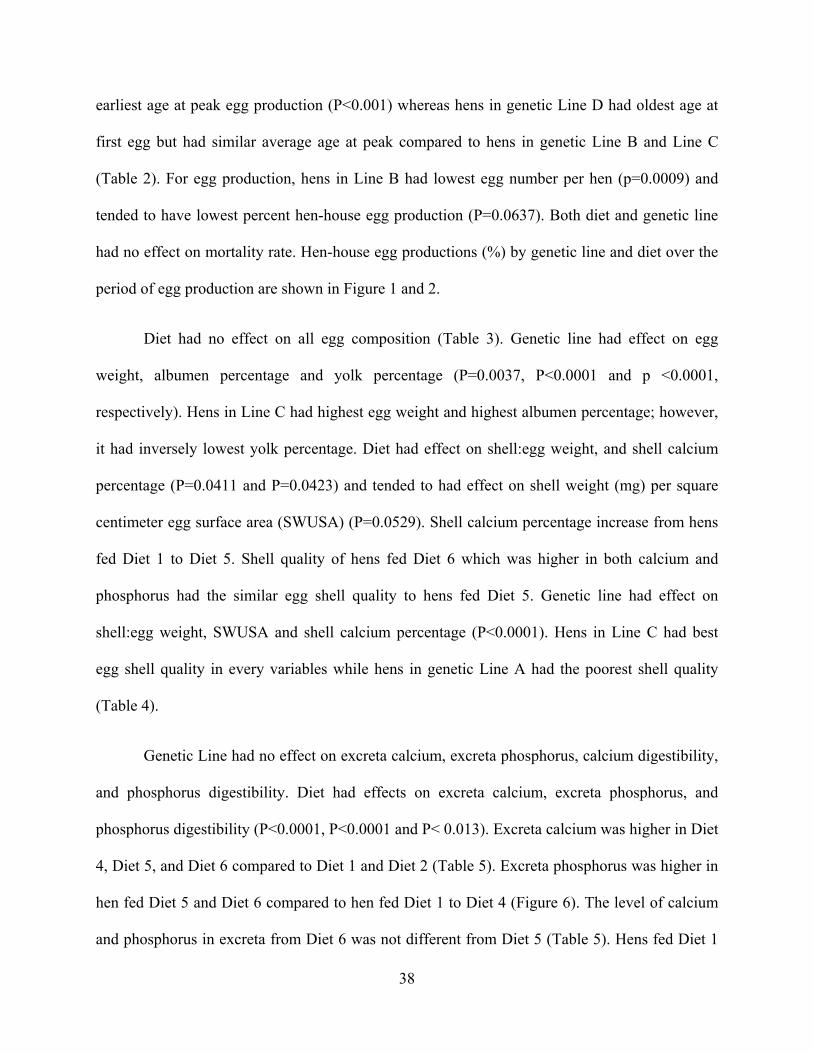
production variables (Table 2). Hens in genetic Line A had earliest age of first egg and also had
38
earliest age at peak egg production (P<0.001) whereas hens in genetic Line D had oldest age at
first egg but had similar average age at peak compared to hens in genetic Line B and Line C
(Table 2). For egg production, hens in Line B had lowest egg number per hen (p=0.0009) and
tended to have lowest percent hen-house egg production (P=0.0637). Both diet and genetic line
had no effect on mortality rate. Hen-house egg productions (%) by genetic line and diet over the
period of egg production are shown in Figure 1 and 2.
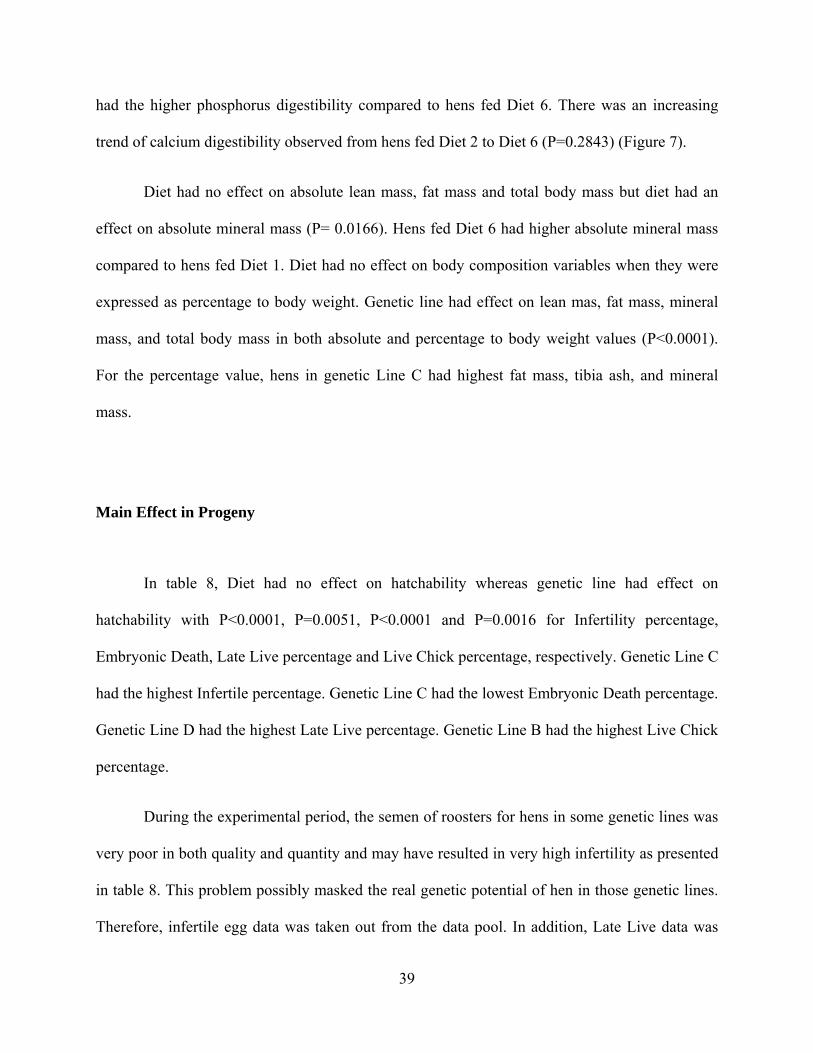
Diet had no effect on all egg composition (Table 3). Genetic line had effect on egg
weight, albumen percentage and yolk percentage (P=0.0037, P<0.0001 and p <0.0001,
respectively). Hens in Line C had highest egg weight and highest albumen percentage; however,
it had inversely lowest yolk percentage. Diet had effect on shell:egg weight, and shell calcium
percentage (P=0.0411 and P=0.0423) and tended to had effect on shell weight (mg) per square
centimeter egg surface area (SWUSA) (P=0.0529). Shell calcium percentage increase from hens
fed Diet 1 to Diet 5. Shell quality of hens fed Diet 6 which was higher in both calcium and
phosphorus had the similar egg shell quality to hens fed Diet 5. Genetic line had effect on
shell:egg weight, SWUSA and shell calcium percentage (P<0.0001). Hens in Line C had best
egg shell quality in every variables while hens in genetic Line A had the poorest shell quality
(Table 4).
Genetic Line had no effect on excreta calcium, excreta phosphorus, calcium digestibility,
and phosphorus digestibility. Diet had effects on excreta calcium, excreta phosphorus, and
phosphorus digestibility (P<0.0001, P<0.0001 and P< 0.013). Excreta calcium was higher in Diet
4, Diet 5, and Diet 6 compared to Diet 1 and Diet 2 (Table 5). Excreta phosphorus was higher in
hen fed Diet 5 and Diet 6 compared to hen fed Diet 1 to Diet 4 (Figure 6). The level of calcium
and phosphorus in excreta from Diet 6 was not different from Diet 5 (Table 5). Hens fed Diet 1
39
had the higher phosphorus digestibility compared to hens fed Diet 6. There was an increasing
trend of calcium digestibility observed from hens fed Diet 2 to Diet 6 (P=0.2843) (Figure 7).
Diet had no effect on absolute lean mass, fat mass and total body mass but diet had an
effect on absolute mineral mass (P= 0.0166). Hens fed Diet 6 had higher absolute mineral mass
compared to hens fed Diet 1. Diet had no effect on body composition variables when they were
expressed as percentage to body weight. Genetic line had effect on lean mas, fat mass, mineral
mass, and total body mass in both absolute and percentage to body weight values (P<0.0001).
For the percentage value, hens in genetic Line C had highest fat mass, tibia ash, and mineral
mass.
Main Effect in Progeny
In table 8, Diet had no effect on hatchability whereas genetic line had effect on
hatchability with P<0.0001, P=0.0051, P<0.0001 and P=0.0016 for Infertility percentage,
Embryonic Death, Late Live percentage and Live Chick percentage, respectively. Genetic Line C
had the highest Infertile percentage. Genetic Line C had the lowest Embryonic Death percentage.
Genetic Line D had the highest Late Live percentage. Genetic Line B had the highest Live Chick
percentage.
During the experimental period, the semen of roosters for hens in some genetic lines was
very poor in both quality and quantity and may have resulted in very high infertility as presented
in table 8. This problem possibly masked the real genetic potential of hen in those genetic lines.
Therefore, infertile egg data was taken out from the data pool. In addition, Late Live data was

40
combined with Live Chicks data in order to overcome the problem of different incubation time
needed for each genetic line which each line could not be set differently during the experiment
period. As an option on considering hatchability, after the infertile percentage was taken out
from data pool and Late live percentage were combine with Live chick, Table 9 shows the
Embryonic death and Live chick information. Eggs from hens in genetic Line B had the highest
hatchability, whereas eggs from hen in genetic Line A had the lowest hatchability (P=0.04). Diet
and genetic line had no effect on day-0 chick body weight (Table 9).
Diet had no effect on body composition (Table 10). Genetic line had an effect on total
body mass, lean mass, fat mass and mineral mass (P<0.0001). Chicks from genetic Line B had
the highest total body mass, and fat mass whereas chicks from genetic Line C had the highest
body mineral mass and chick from genetic Line A had the highest lean mass.
Diet had no effect on excreta calcium, excreta phosphorus, calcium digestibility and
phosphorus digestibility in 14-day-old chicks (Table 11). Genetic line had effect on excreta
calcium, excreta phosphorus, calcium digestibility and phosphorus digestibility (P<0.0001).
Genetic Line A and Line D had the highest excreta calcium whereas genetic Line C had the
lowest excreta calcium. Genetic Line D had the highest excreta phosphorus. Genetic line C had
highest both calcium and phosphorus digestibility.
Age of Egg Production
According to the statistical analysis result using MANOVA- repeated measures indicated
that age of egg production affected egg quality (Table 4) and body composition (Table 6 and

41
Table 7) (p<0.00001), egg quality over the period of time was shown in Figure 3 and Figure 4;
body composition over the period of time was shown in Figure 8, Figure 9.
Absolute egg albumen and shell calcium weight increased by the age of egg production
corresponded with egg weight and both reached their maximum weight at week 46 and then
started to decline (Figure 3). Absolute yolk weight also increased along the age of egg
production and along with increase of egg weight without reaching its maximum at the end of 50
weeks of age. When expressed as a percentage of egg weight, albumen increased from week 26
and reached its maximum at week 34 and maintained its percentage until week 46. After week
46, albumen percentage gradually decline toward the end of experiment. A similar pattern was
observed for yolk percentage but it was in the opposite direction (Figure 4). Shell calcium
percentage decline almost linearly over the period of egg production. Shell quality characteristics
are shown in Figure 5. Beside absolute shell calcium weight that increased from the beginning,
shell thickness, shell calcium percentage and egg specific gravity decrease over the time.
For body composition, absolute lean mass increased along with the increase of total body
mass (body weight). Fat mass and mineral mass increased from week 22 to 26 and generally was
stable from week 26 to 46 and then started to decline toward the end of the experiment. For the
percentage values, lean mass and fat mass were in at a steady level in proportion to body weight.
For mineral percentage, mineral mass steady decreased after the week 26 afterward whereas
percentage tibia ash was maintained constantly through the duration of experimental period.

42
F. DISCUSSION
Dietary Calcium and Nonphytate Phosphorus
In the present study, the 0.25 % stepping increase of dietary calcium levels from 2.25 to
3.25 % with 0.25 % nonphytate phosphorus had no effect on egg production and egg quality but
positively affected every egg shell qualities. Similarly, Bar et al. (2002) reported that the effect
of increasing of dietary calcium from 2.4 to 5.0 % significantly improved shell weight per
surface area. Narvaez-Solarte et al. (2006) tested the effect of calcium level (2.6 to 4.2%) on a
fixed 0.35% nonphytate phosphorus diet and found a quadratic respond with shell quality (peak
shell weight was at 3.56% calcium). Safaa et al. (2008) demonstrated that the increase in
calcium intake from 4.08 to 4.64 g/hen per day (with constant calcium: phosphorus ration)
significantly improved egg production and shell quality in aged hens.
In contrast, several studies have reported that increasing dietary calcium level had no
effect on shell quality. Keshavarz et al. (1993), reported the increase of calcium level from 3 to 4
% had no effect on shell quality (with a nonphytate phosphorus level at 0.4%). Keshavarz and
Nakajima (1993) also reported that the increase of dietary calcium (3.5 to 5.5%) did not have any
beneficial effects on shell quality at the constant level of 0.4% nonphytate phosphorus.
Keshavarz (2003a) reported that at the constant level of 0.4% nonphytate phosphorus, the
increase level of dietary calcium from 3.34 to 4.92 % had no effect on egg production and shell
quality.

43
In addition, the increase of nonphytate phosphorus in current study from 0.25% to 0.4%
had no effect on egg production, egg shell quality, mineral mass and tibia ash. Boorman and
Gunaratne (2001) reported that feeding a high amount of nonphytate phosphorus (1.187 %
nonphytate phosphorus) laying hens slightly decreased shell weight (g/egg) and shell output
(g/bird/day). Keshavarz (2000) tested the graded level of nonphytate phosphorus (0.15 to 0.35%)
with the constant level of calcium (3.8%) and found that specific gravity was greater in hens fed
less nonphytate phosphorus and phytase enzyme supplementation had an adverse effect on
specific gravity. Ekmay and Coon (2011) reported the effect of increase nonphytate phosphorus
from 0.2% to 0.4% that linearly increased calcium in excreta and linearly decreased calcium
retention. Therefore, it could be concluded that nonphytate phosphorus lower than 0.35% was
adequate for egg production while a higher level can cause adverse effects.
Keshavarz and Nakajima (1993) reported that increased dietary calcium decreased
percentage of calcium retention while the absolute amount of calcium retention remained
constant. Similarly, Summers et al. (1976) reported that increased dietary calcium decreased
percent retention compare to the amount of intake. In contrast, the result from present study
indicated that graded level of calcium tended to increase calcium digestibility.
Although, Summers et al. (1976) reported that changing the level of dietary calcium and
phosphorus had little effect on the retention of phosphorus, the present experiment observed that
the increase of calcium in the diet significantly decrease phosphorus digestibility. The reduction
in phosphorus digestibility could be explained by the increase of phosphorus in the excreta due
to the effect of the increase of dietary calcium in the current study. Shimada et al. (2005) found
that high calcium in the diet can increase fibroblast growth factor 23 (FGF23) which is the

44
hormone that increases phosphate excretion through the kidney and with a final result of
increasing total phosphate excreta.
Pastore et al. (2012) studied the effect of three levels of calcium and three level of Ca:
phosphorus ratio and observed that 3.9, 4.2 and 4.5% calcium in the diet had no effect on egg
production, egg shell quality and bone quality. In contrast, this current study found that by
increase calcium in the diet increased both egg shell quality and bone quality which could be due
to the trend of the increase of calcium digestibility.
The reason of having different result on calcium and phosphorus digestibility and shell
quality responses between present study and other reports, in part could be due to level of dietary
phosphorus which was lower than the previously reported paper (0.25% in present study VS
0.40% in Keshavarz and Nakajima (1993) and 0.57% in Summers et al. (1976). Stipanuk (2006)
stated that the present of phosphorus make the availability of calcium decrease. This statement is
confirmed in the present study which observed that in the groups fed the same dietary calcium
level when the level of nonphytate phosphorus increased, the calcium digestibility decreased
from 49.63% to 42.85% in Diet 5 and Diet 6, respectively.
Genetic Line
Almost all of variables measured in this experiment, except calcium and phosphorus
digestibility, were affected by genetic line. Genetic line C seemed to be the ideal line for egg
production breeder because of its significantly higher egg production percentage and its higher

45
egg shell quality whereas genetic line B and D would probably be more suited for meat type
breeder as these lines had significantly higher lean mass trait.
Buss and Guyer (1984) studied the relationship between genetic line of thick and thin
eggshell and concluded that skeletal was not a limiting factor determining shell thickness as there
was not differences among specific gravity, ash weight, total calcium, percent calcium and 45Ca
content between those two genetic lines. However, in present study, there was the clear positive
relationship between mineral mass and shell quality that related to the genetic line as shown in
Figure 12. Moreover, not only is that trait positively related to egg shell characteristic, it is also
related through its progeny body mineral characteristic.
Age of Egg Production
In the past egg shell strength is determined by shell thickness (calcium carbonate content)
and shell matrix organization. A number of techniques and instruments have been developed to
measure eggshell strength. Specific gravity is an indirect non-destructive method that is widely
accepted. Generally, specific gravity is used to indicate the quantity of shell relative to other
components of the egg. However people often accept it as a value to indicate eggshell
“thickness” (Hunton, 2005).
In present study, egg shell thickness increased at the beginning of egg production period
and reached its peak on week 34 before it slowly decreased toward the end of experiment.
Similarly, Garlich et al. (1984) reported that shell thickness in laying hen started to increase from
the beginning of egg production and was greatest at 31 weeks of age and declined throughout the

46
first year. This difference on hen age could be explained by the different between laying genetic
line and the broiler breeder genetic line in this experiment. For specific gravity, however, it
started highest at the beginning of egg production and decline almost immediately throughout the
egg production period (Figure 5). Therefore, specific gravity may not be suitable used to describe
shell thickness. Instead, the present study revealed that the pattern on the decrease of egg specific
gravity is almost parallel with the decrease of calcium percentage to egg weight. This indicates
that shell specific gravity may very well represent shell calcium percentage to egg weight.
Moreover, the steady proportion of calcium per shell weight reveal that although calcium per egg
weight or per surface were changed along with the age of egg production, calcium content per
unit shell weight never changed.
As noted before in this study, albumen percentage decreases with age of production
whereas yolk percentage increased after week 34 of egg production. Similar result has been
reported. Applegate et al. (1998) reported that albumen percentage was reduced from 58.8 % to
54.9 % while yolk percentage increased from 28.4% to 33.3% in ducks from age 26 to 42 weeks.
Ahn et al. (1997) reported an egg white solid decrease from 12.72% to 11.57% whereas yolk
solid increase from 50.69% to 51.55% and yolk: white ratio increased from 36.58% to 40.82% in
hen age from 28 to 97 weeks.
For bone ash, Yosefi et al. (2003) reported that when the age of laying hen increased,
tibia ash was significantly increased (age between 32-64 weeks). In contrast, the present study
observed that tibia ash was maintained almost constant over the period from 26 to 50 weeks of
age. The reason of this different could be due to the genetic line of laying hens in that experiment
and also the feeding program of laying hen which normally feed is provided for 24 hours. The
result of body composition study over period of time revealed that tibia ash may not be a good

47
indicator to represent body mineral content in the breeder hen. Instead, body mineral mass
percentage from DXA is the best parameter that should be used to describe body mineral status
as it also correlated with the change of shell calcium per egg weight (Figure 10).
In conclusion, graded level of calcium from 2.25 to 3.25 % with 0.25 % nonphytate
phosphorus had no beneficial effect on egg production or egg chemical composition but it did
improved egg shell quality. The optimum level for best egg shell quality was at the 3.25%
calcium. For nonphytate phosphorus, feeding a dietary level of 0.4% did not show any beneficial
effects on any parameter evaluated. In contrast, it tended to decreases calcium digestibility and
significantly decreased phosphorus digestibility.

48
Table 1 Breeder dietary composition of 6 dietary treatments varying in calcium (Ca) and nonphytate phosphorus (NPP) levels
Treatment Diet 1 Diet 2 Diet 3 Diet 4 Diet 5 Diet 6
Ingredients (%) Corn 68.40 68.40 68.40 68.40 68.40 64.70 Soybean Meal 21.67 21.67 21.67 21.67 21.67 22.99 Limestone 4.80 5.45 6.10 6.75 7.40 6.77 Phosphate 0.86 0.86 0.86 0.86 0.86 1.82 Fat, Poultry 0.56 0.56 0.56 0.56 0.56 2.62 SalCurb, Liquid 0.32 0.32 0.32 0.32 0.32 0.32 NaCl 0.23 0.23 0.23 0.23 0.23 0.17 Alimet 0.19 0.19 0.19 0.19 0.19 0.20 Choline Cl-70% 0.10 0.10 0.10 0.10 0.10 0.10 S-Carb 0.10 0.10 0.10 0.10 0.10 0.10 Mineral premix2/ 0.07 0.07 0.07 0.07 0.07 0.07 Vitamin premix3/ 0.07 0.07 0.07 0.07 0.07 0.07 HyD 0.05 0.05 0.05 0.05 0.05 0.05 Sand 2.60 1.95 1.30 0.65 0.00 0.00 Total 100 100 100 100 100 100 Nutrient (calculated) ME (kcal/kg) 2921.13 2921.13 2921.13 2921.13 2921.13 2921.13 CP (%) 15.371 15.371 15.371 15.371 15.371 15.344 Crude Fat (%) 2.761 2.761 2.761 2.761 2.761 4.620 Calcium (%) 2.25 2.50 2.75 3.00 3.25 3.25 NPP (%) 0.25 0.25 0.25 0.25 0.25 0.40
1/ Diet 1 = 2.25Ca: 0.25NPP, Diet 2 = 2.50Ca: 0.25NPP, Diet 3 = 2.75Ca: 0.25NPP, Diet 4 = 3.00Ca: 0.25NPP, Diet 5 = 3.25Ca: 0.25NPP, Diet 6 = 3.25Ca: 0.40NPP
2/ Mineral mixes provided per kilogram of complete diet: Cu, 18 mg; I, 1.1 mg; Fe, 80 mg; Mn, 150 mg; Zn, 125 mg; Se, 0.25 mg.
3/ Vitamin mix provided per kilogram of complete diet: vitamin A, 10,000 IU; vitamin D3, 3,000 IU; vitamin E, 100 IU; vitamin K3, 3 mg; vitamin B12, 0.03 mg; riboflavin, 8 mg; niacin, 60 mg; pantothenic acid, 18 mg; folic acid, 1 mg; pyridoxine HCl, 6 mg; thiamine HCl, 3 mg; biotin, 0.2 mg

49
Table 2 Production performance parameters (Means) from four pure genetic line breeder hens fed various levels of calcium (Ca) and nonphytate phosphorus (NPP) from age 22 to 50 weeks
Age of first egg (wk)
Age at peak (wk)
Egg production (Egg / hen)
Hen House Egg
production (%)
Mortality3/ (% of Total)
Diet1/ 1 26.82 31.13 100.97 49.74 1.75 2 26.85 29.79 101.73 50.11 2.06 3 26.92 31.25 99.99 49.26 1.96 4 26.86 30.79 102.56 50.52 1.75 5 26.90 30.92 96.14 47.36 2.89 6 27.18 31.08 102.02 50.26 1.65 SEM N/A 0.425 2.716 2.018 N/A Line A 25.90 28.78B 101.96A 50.23AB 3.82 B 27.07 31.42A 93.27B 45.94B 3.51 C 26.95 31.00A 105.65A 52.04A 2.48 D 27.77 32.11A 101.40A 49.95AB 2.27 SEM N/A 0.342 2.217 1.647 N/A Statistical analysis (p-value)/ Between subjects Diet N/A 0.1949 0.58862/ 0.8962 0.34313/ Line N/A <.0001 0.00092/ 0.0637 0.08753/ Diet x Line N/A 0.1617 0.48102/ 0.9712 N/A Within Subjects (over time) Age (Week) N/A N/A <.00012/ N/A N/A Age (Week) x Diet N/A N/A 0.51292/ N/A N/A Age (Week) x Line N/A N/A <.00012/ N/A N/A Age (Week) x Diet x Line N/A N/A 0.57662/ N/A N/A
1/ Diet 1 = 2.25Ca: 0.25NPP, Diet 2 = 2.50Ca: 0.25NPP, Diet 3 = 2.75Ca: 0.25NPP, Diet 4 = 3.00Ca: 0.25NPP, Diet 5 = 3.25Ca: 0.25NPP, Diet 6 = 3.25Ca: 0.40NPP
2/ Repeated measures analysis using MANOVA and Greenhouse & Geisser (GG) adjusted-degree of freedom Univariate tests
3/ Contingency Analysis (Chi-square likelihood ratio; Prob>ChiSquare)
A-B Means within a column that do not share a letter are significantly different (p=<0.05)
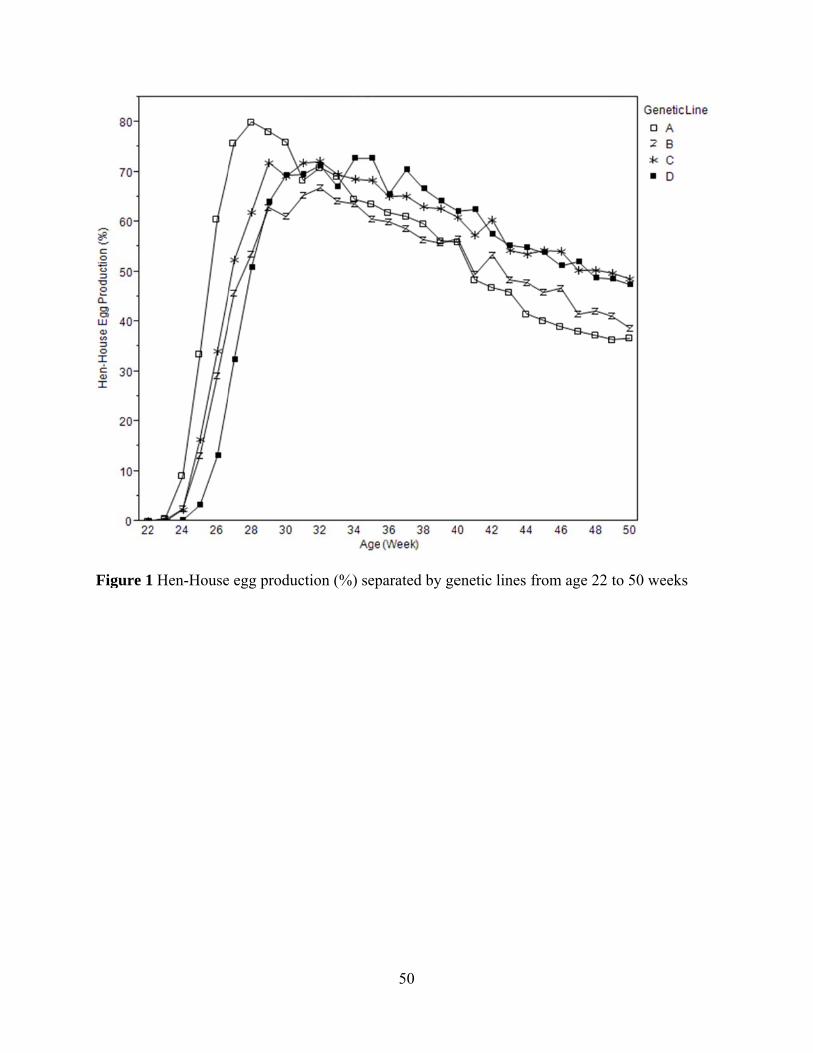
Figure 1
Hen-Housee egg producction (%) sep
50
parated by geenetic lines ffrom age 22 to 50 weeks
s

Figure 22.25Ca: 0.25NPP
2 Hen-house0.25NPP, D
P, Diet 5 = 3.
e egg producDiet 2 = 2.5
25Ca: 0.25N
ction (%) se50Ca: 0.25NNPP, Diet 6 =
51
eparated by dNPP, Diet 3
= 3.25Ca: 0.
diet from ag= 2.75Ca:
.40NPP).
ge 22 to 50 0.25NPP, D
weeks (DieDiet 4 = 3.0
et 1 = 00Ca:

52
Table 3 Egg quality parameters (Means) from four pure genetic line breeder hens fed various level of calcium (Ca) and nonphytate phosphorus (NPP) from age 22 to 50 weeks
Egg weight (g)
Albumen (%)
Yolk (%)
Yolk : Albumen
Diet1/ 1 58.30 58.35 33.16 0.571 2 57.67 58.36 33.03 0.569 3 58.23 58.43 32.97 0.566 4 57.80 58.32 33.07 0.570 5 57.33 58.40 32.93 0.566 6 58.48 58.58 32.80 0.562 SEM 0.333 0.053 0.060 0.002 Line A 57.34B 57.38D 34.36A 0.602A B 57.85AB 58.91B 32.33C 0.551C C 58.73A 59.27A 31.79D 0.538D D 57.95AB 58.07C 33.49B 0.578B SEM 0.272 0.043 0.049 0.001 Statistical analysis (p-value) 2/ Between subjects Diet 0.1954 0.4553 0.0636 0.1398 Line 0.0037 <.0001 <.0001 <.0001 Diet x Line 0.8128 0.7626 0.8535 0.9126 Within Subjects Age (Week) <.0001 <.0001 <.0001 <.0001Age (Week) x Diet 0.3457 0.2737 0.4982 0.3868 Age (Week) x Line <.0001 <.0001 <.0001 <.0001 Age (Week) x Diet x Line 0.7798 0.6279 0.3231 0.4736
1/ Diet 1 = 2.25Ca: 0.25NPP, Diet 2 = 2.50Ca: 0.25NPP, Diet 3 = 2.75Ca: 0.25NPP, Diet 4 = 3.00Ca: 0.25NPP, Diet 5 = 3.25Ca: 0.25NPP, Diet 6 = 3.25Ca: 0.40NPP
2/ Repeated measures analysis using MANOVA and Greenhouse & Geisser (GG) adjusted-degree of freedom Univariate tests A-B Means within a column that do not share a letter are significantly different (p=<0.05)

53
Table 4 Shell quality parameters (Means) from four pure genetic line breeder hens fed various level of calcium (Ca) and nonphytate phosphorus (NPP) from age 22 to 50 weeks
Shell : egg weight
SWUSA (mg/m2) 2/
Shell Calcium (%)
Diet1/ 1 0.0883B 72.95 3.28B 2 0.0892AB 73.50 3.32AB 3 0.0896AB 74.02 3.33AB 4 0.0899AB 74.09 3.34AB 5 0.0906A 74.46 3.37A 6 0.0905A 74.85 3.37A SEM 0.0004 0.351 0.017 Line A 0.084D 69.01D 3.13D B 0.091B 75.31B 3.39B C 0.095A 78.74A 3.53A D 0.088C 72.84C 3.29C SEM 0.0004 0.287 0.014 Statistical analysis (p-value) 3/ Between subjects Diet 0.0411 0.0529 0.0423 Line <.0001 <.0001 <.0001 Diet x Line 0.9417 0.9483 0.9290 Within Subjects Age (Week) <.0001 <.0001 <.0001 Age (Week) x Diet 0.9369 0.9113 0.9038 Age (Week) x Line <.0001 <.0001 <.0001 Age (Week) x Diet x Line 0.7086 0.4965 0.6762
1/ Diet 1 = 2.25Ca: 0.25NPP, Diet 2 = 2.50Ca: 0.25NPP, Diet 3 = 2.75Ca: 0.25NPP, Diet 4 = 3.00Ca: 0.25NPP, Diet 5 = 3.25Ca: 0.25NPP, Diet 6 = 3.25Ca: 0.40NPP
2/ SWUSA = shell weight (mg) per square centimeter egg surface area
3/ Repeated measures analysis using MANOVA and Greenhouse & Geisser (GG) adjusted-degree of freedom Univariate tests
A-B Means within a column that do not share a letter are significantly different (p=<0.05)
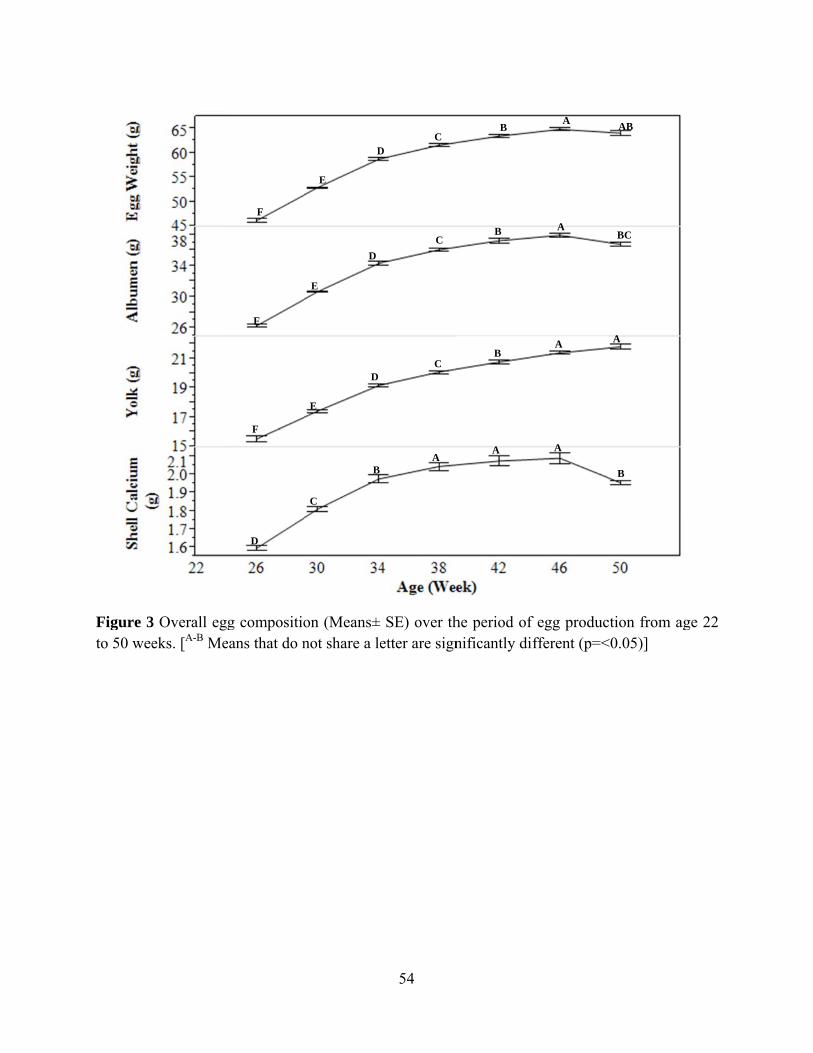
Figure 3to 50 wee
3 Overall eggeks. [A-B Me
g compositioans that do n
D
F
F
F
on (Means±not share a le
C
D
E
D
E
B
D
E
54
SE) over thetter are sign
A
D C
C
C
he period of nificantly di
A
B
B
B
f egg producfferent (p=<
A
A
A
A
ction from ag<0.05)]
BC
AB
B
A
ge 22

Figure 4period ofsignifican
4 Overall Egf egg produntly differen
g compositiouction from nt (p=<0.05)]
D
A
A
on (Means±age 22 to 5]
BC
A
B
AB B
55
SE) express50 weeks. [A
A AB
B B
CD BC
sed as perceA-B Means th
A
B
DE
entage of egghat do not s
AB
B
E
g weight oveshare a lette
CD
A
F
er the er are

Figure 522 to 50
5 Overall sheweeks. [A-B M
ells characteMeans that d
A
A
A
eristic (Meando not share
A
B
AB
56
ns± SE) ovea letter are s
A A
CB
CDBC
er the periodsignificantly
A A
C D
D DE
d of egg prody different (p
A
D
E
duction fromp=<0.05)]
B
D
F
m age
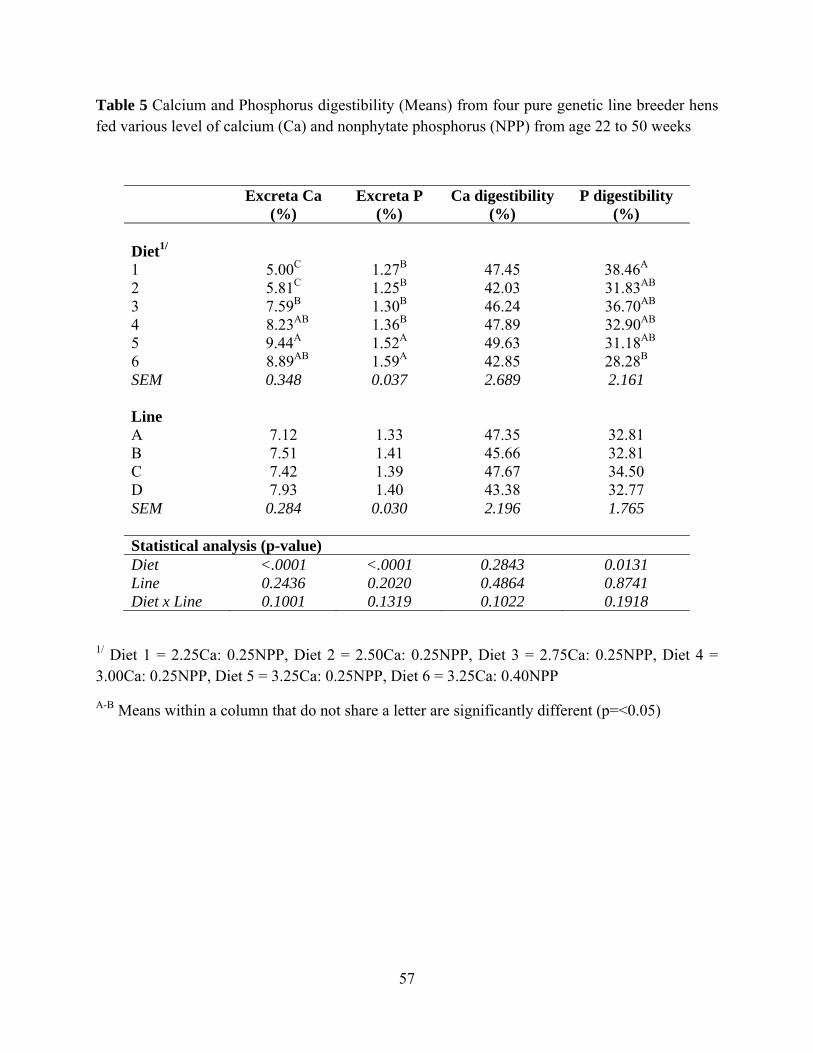
57
Table 5 Calcium and Phosphorus digestibility (Means) from four pure genetic line breeder hens fed various level of calcium (Ca) and nonphytate phosphorus (NPP) from age 22 to 50 weeks
Excreta Ca (%)
Excreta P (%)
Ca digestibility (%)
P digestibility (%)
Diet1/ 1 5.00C 1.27B 47.45 38.46A 2 5.81C 1.25B 42.03 31.83AB 3 7.59B 1.30B 46.24 36.70AB 4 8.23AB 1.36B 47.89 32.90AB 5 9.44A 1.52A 49.63 31.18AB 6 8.89AB 1.59A 42.85 28.28B SEM 0.348 0.037 2.689 2.161 Line A 7.12 1.33 47.35 32.81 B 7.51 1.41 45.66 32.81 C 7.42 1.39 47.67 34.50 D 7.93 1.40 43.38 32.77 SEM 0.284 0.030 2.196 1.765 Statistical analysis (p-value) Diet <.0001 <.0001 0.2843 0.0131 Line 0.2436 0.2020 0.4864 0.8741 Diet x Line 0.1001 0.1319 0.1022 0.1918
1/ Diet 1 = 2.25Ca: 0.25NPP, Diet 2 = 2.50Ca: 0.25NPP, Diet 3 = 2.75Ca: 0.25NPP, Diet 4 = 3.00Ca: 0.25NPP, Diet 5 = 3.25Ca: 0.25NPP, Diet 6 = 3.25Ca: 0.40NPP
A-B Means within a column that do not share a letter are significantly different (p=<0.05)

Figure 6genetic lfrom age2.75Ca: 0.40NPP
6 Bar graph ine breeder e 22 to 50 w0.25NPP, D
P). [A-B Bar d
B
C
(Means ± Shens fed va
weeks; (DieDiet 4 = 3.0diagram that
BB
B
C
SE) of Calciarious level et 1 = 2.25C00Ca: 0.25Ndo not share
A
B
A
AB
58
ium and Phof calcium
Ca: 0.25NPPNPP, Diet 5 e a letter are
A
AB
osphorus in(Ca) and no
P, Diet 2 = = 3.25Ca: significantly
n excreta (%onphytate ph2.50Ca: 0.20.25NPP, D
y different (p
%) from four hosphorus (N25NPP, DietDiet 6 = 3.2p=<0.05)]
r pure NPP) t 3 = 25Ca:

Figure 7genetic lfrom age2.75Ca: 0.40NPP
7 Bar graph ine breeder e 22 to 50 w0.25NPP, D
P). [A-B Bar d
A
A
(Means ± Shens fed va
weeks; (DieDiet 4 = 3.0diagram that
AB
AB
E) of Calciuarious level et 1 = 2.25C00Ca: 0.25Ndo not share
ABAB
59
um and Phoof calcium
Ca: 0.25NPPNPP, Diet 5 e a letter are
B
sphorus dige(Ca) and no
P, Diet 2 = = 3.25Ca: significantly
estibility (%onphytate ph2.50Ca: 0.20.25NPP, D
y different (p
%) from fourhosphorus (N25NPP, DietDiet 6 = 3.2p=<0.05)]
r pure NPP) t 3 = 25Ca:
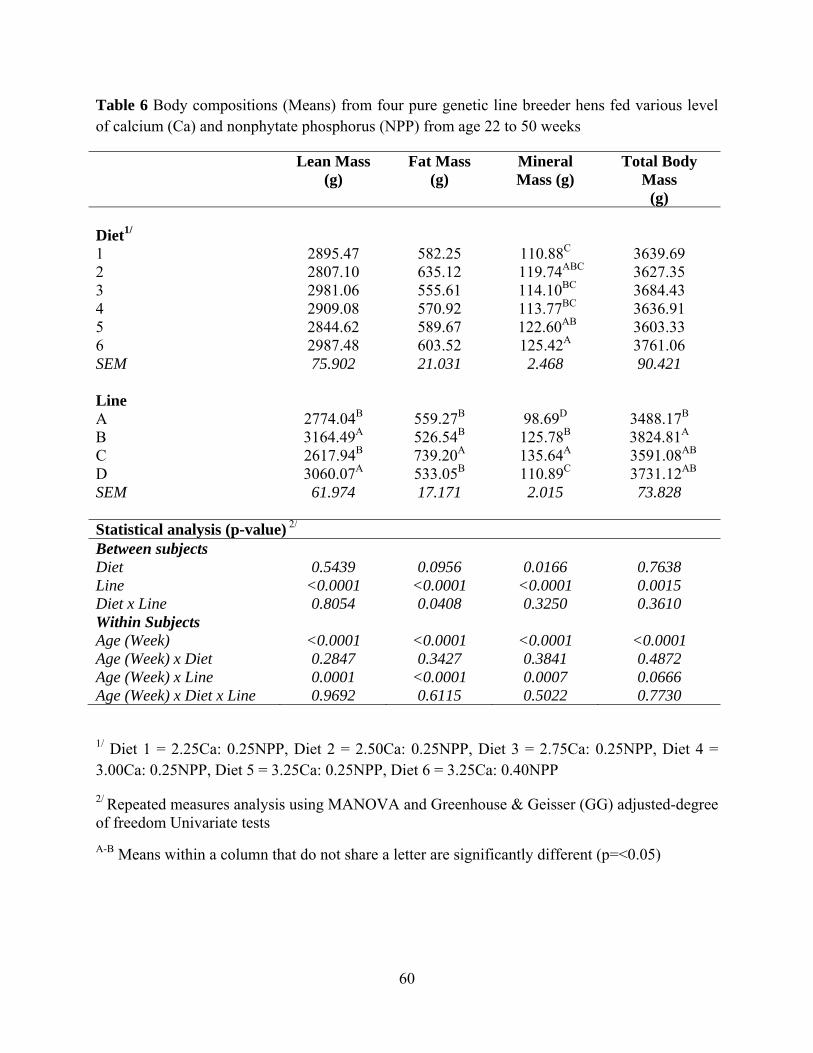
60
Table 6 Body compositions (Means) from four pure genetic line breeder hens fed various level of calcium (Ca) and nonphytate phosphorus (NPP) from age 22 to 50 weeks
Lean Mass (g)
Fat Mass (g)
Mineral Mass (g)
Total Body Mass
(g) Diet1/ 1 2895.47 582.25 110.88C 3639.69 2 2807.10 635.12 119.74ABC 3627.35 3 2981.06 555.61 114.10BC 3684.43 4 2909.08 570.92 113.77BC 3636.91 5 2844.62 589.67 122.60AB 3603.33 6 2987.48 603.52 125.42A 3761.06 SEM 75.902 21.031 2.468 90.421 Line A 2774.04B 559.27B 98.69D 3488.17B B 3164.49A 526.54B 125.78B 3824.81A C 2617.94B 739.20A 135.64A 3591.08AB D 3060.07A 533.05B 110.89C 3731.12AB SEM 61.974 17.171 2.015 73.828 Statistical analysis (p-value) 2/ Between subjects Diet 0.5439 0.0956 0.0166 0.7638 Line <0.0001 <0.0001 <0.0001 0.0015 Diet x Line 0.8054 0.0408 0.3250 0.3610 Within Subjects Age (Week) <0.0001 <0.0001 <0.0001 <0.0001 Age (Week) x Diet 0.2847 0.3427 0.3841 0.4872 Age (Week) x Line 0.0001 <0.0001 0.0007 0.0666 Age (Week) x Diet x Line 0.9692 0.6115 0.5022 0.7730
1/ Diet 1 = 2.25Ca: 0.25NPP, Diet 2 = 2.50Ca: 0.25NPP, Diet 3 = 2.75Ca: 0.25NPP, Diet 4 = 3.00Ca: 0.25NPP, Diet 5 = 3.25Ca: 0.25NPP, Diet 6 = 3.25Ca: 0.40NPP
2/ Repeated measures analysis using MANOVA and Greenhouse & Geisser (GG) adjusted-degree of freedom Univariate tests A-B Means within a column that do not share a letter are significantly different (p=<0.05)

61
Table 7 Body compositions (Means) from four pure genetic line breeder hens fed various levels of calcium (Ca) and nonphytate phosphorus (NPP) from age 22 to 50 weeks
Lean Mass (%)
Fat Mass (%)
Mineral Mass (%)
Tibia Ash (%)
Diet1/ 1 79.49 16.04 3.10 57.81 2 77.26 17.60 3.35 58.71 3 80.69 15.23 3.15 57.83 4 79.63 15.95 3.19 57.47 5 78.89 16.41 3.44 59.06 6 79.45 16.04 3.37 58.92 SEM 0.565 0.392 0.080 0.364 Line A 79.59B 15.99B 2.88C 56.69C B 82.42A 13.99C 3.34B 58.78B C 72.96C 20.56A 3.82A 59.98A D 81.98A 14.30C 3.03C 57.76BC SEM 0.461 0.320 0.065 0.297 Statistical analysis (p-value) 2/ Between subjects Diet 0.1459 0.1523 0.1151 0.1278 Line <.0001 <.0001 <.0001 <.0001 Diet x Line 0.3450 0.3479 0.8238 0.4432 Within Subjects Age (Week) <.0001 <.0001 <.0001 <.0001 Age (Week) x Diet 0.3730 0.3966 0.5018 0.2888 Age (Week) x Line <.0001 <.0001 0.1690 <.0001 Age (Week) x Diet x Line 0.8910 0.8888 0.7958 0.8330
1/ Diet 1 = 2.25Ca: 0.25NPP, Diet 2 = 2.50Ca: 0.25NPP, Diet 3 = 2.75Ca: 0.25NPP, Diet 4 = 3.00Ca: 0.25NPP, Diet 5 = 3.25Ca: 0.25NPP, Diet 6 = 3.25Ca: 0.40NPP
2/ Repeated measures analysis using MANOVA and Greenhouse & Geisser (GG) adjusted-degree of freedom Univariate tests
A-B Means within a column that do not share a letter are significantly different (p=<0.05)
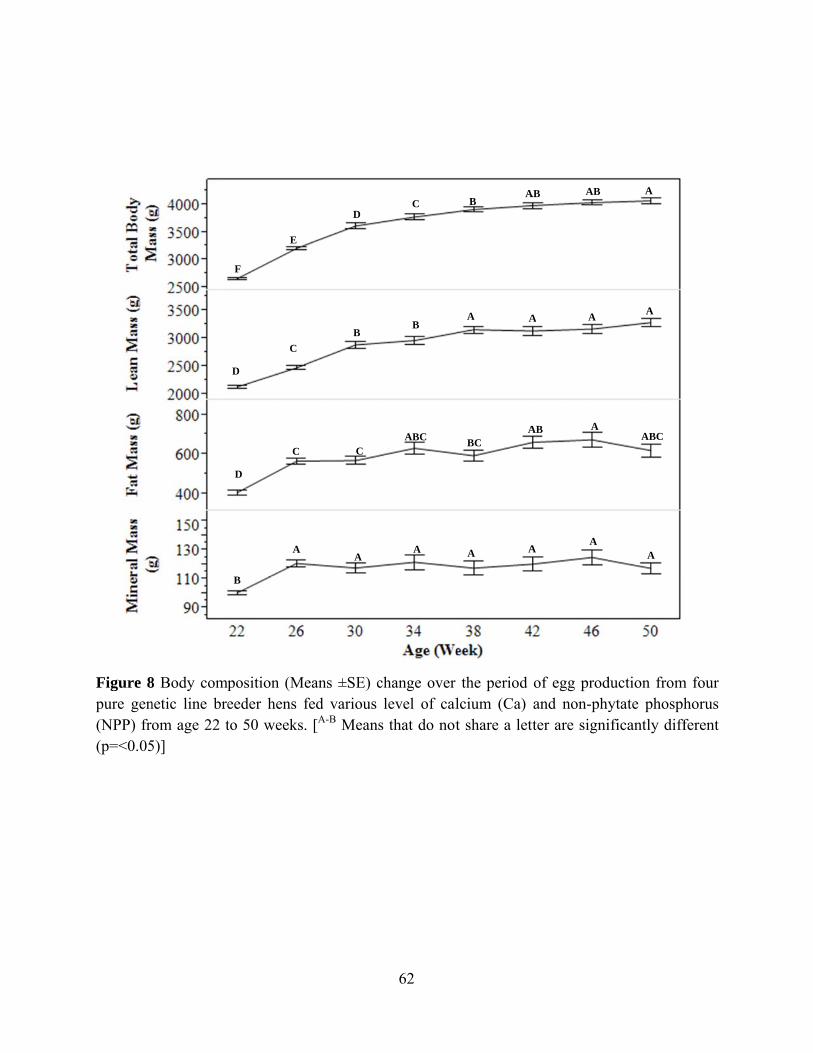
Figure 8pure gen(NPP) fro(p=<0.05
8 Body compnetic line breom age 22 t
5)]
position (Meeder hens fto 50 weeks
B
A
F
E
D
C
D
C
eans ±SE) cfed various . [A-B Means
A
D
C
B
62
change over level of cal
s that do not
A
C
ABC
B
the period lcium (Ca) t share a lett
A A
B A
BC A
A A
of egg prodand non-phyter are signi
A A
AB AB
AB A
A A
duction fromytate phosphificantly diff
A
A
ABC
A
m four horus ferent

Figure 9genetic lfrom age(p=<0.05
9 Body comine breeder e 22 to 50 5)]
A
mpositions (Mhens fed vaweeks. [A-B
A A
B A
Means ±SE)arious level B Means tha
B
A
63
over the peof calcium at do not s
B
A
eriod of egg(Ca) and no
share a lette
BC B
A A
g productiononphytate pher are signif
BC BC
A A
n from four hosphorus (Nficantly diff
C
A
pure NPP) ferent

Figure 1±SE) frosignifican
0 Bar diagram four genently differen
am compare etic lines agent (p=<0.05)]
C
D
body minere 22 to 50 w]
B
B
64
ral mass (%)weeks. [A-B B
) and calciumBar diagram
A
A
m per egg wethat do not
eight (%) (Mshare a lette
C
C
Means er are
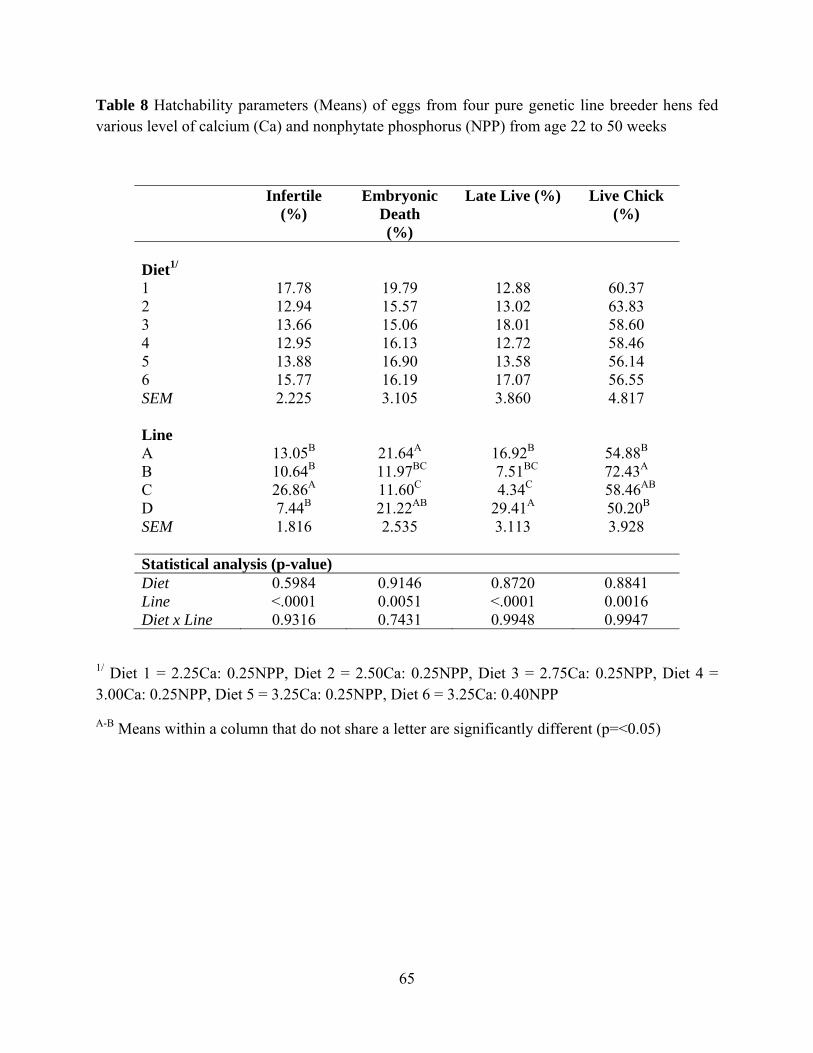
65
Table 8 Hatchability parameters (Means) of eggs from four pure genetic line breeder hens fed various level of calcium (Ca) and nonphytate phosphorus (NPP) from age 22 to 50 weeks
Infertile (%)
Embryonic Death (%)
Late Live (%) Live Chick (%)
Diet1/ 1 17.78 19.79 12.88 60.37 2 12.94 15.57 13.02 63.83 3 13.66 15.06 18.01 58.60 4 12.95 16.13 12.72 58.46 5 13.88 16.90 13.58 56.14 6 15.77 16.19 17.07 56.55 SEM 2.225 3.105 3.860 4.817 Line A 13.05B 21.64A 16.92B 54.88B B 10.64B 11.97BC 7.51BC 72.43A C 26.86A 11.60C 4.34C 58.46AB D 7.44B 21.22AB 29.41A 50.20B SEM 1.816 2.535 3.113 3.928 Statistical analysis (p-value) Diet 0.5984 0.9146 0.8720 0.8841 Line <.0001 0.0051 <.0001 0.0016 Diet x Line 0.9316 0.7431 0.9948 0.9947
1/ Diet 1 = 2.25Ca: 0.25NPP, Diet 2 = 2.50Ca: 0.25NPP, Diet 3 = 2.75Ca: 0.25NPP, Diet 4 = 3.00Ca: 0.25NPP, Diet 5 = 3.25Ca: 0.25NPP, Diet 6 = 3.25Ca: 0.40NPP
A-B Means within a column that do not share a letter are significantly different (p=<0.05)
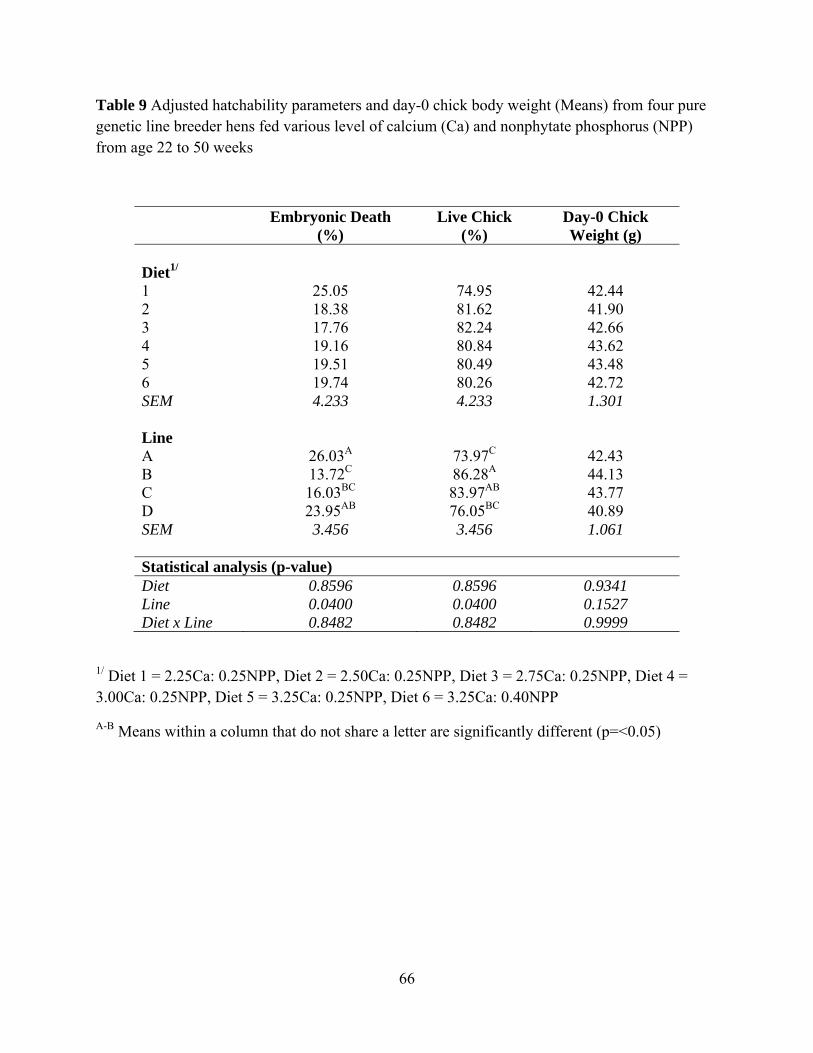
66
Table 9 Adjusted hatchability parameters and day-0 chick body weight (Means) from four pure genetic line breeder hens fed various level of calcium (Ca) and nonphytate phosphorus (NPP) from age 22 to 50 weeks
Embryonic Death (%)
Live Chick (%)
Day-0 Chick Weight (g)
Diet1/ 1 25.05 74.95 42.44 2 18.38 81.62 41.90 3 17.76 82.24 42.66 4 19.16 80.84 43.62 5 19.51 80.49 43.48 6 19.74 80.26 42.72 SEM 4.233 4.233 1.301 Line A 26.03A 73.97C 42.43 B 13.72C 86.28A 44.13 C 16.03BC 83.97AB 43.77 D 23.95AB 76.05BC 40.89 SEM 3.456 3.456 1.061 Statistical analysis (p-value) Diet 0.8596 0.8596 0.9341 Line 0.0400 0.0400 0.1527 Diet x Line 0.8482 0.8482 0.9999
1/ Diet 1 = 2.25Ca: 0.25NPP, Diet 2 = 2.50Ca: 0.25NPP, Diet 3 = 2.75Ca: 0.25NPP, Diet 4 = 3.00Ca: 0.25NPP, Diet 5 = 3.25Ca: 0.25NPP, Diet 6 = 3.25Ca: 0.40NPP
A-B Means within a column that do not share a letter are significantly different (p=<0.05)

67
Table 10 Body compositions (Means) of 14-day-old chicks fed with commercial starter diet from four pure genetic line breeder hens fed various level of calcium (Ca) and nonphytate phosphorus (NPP) from age 22 to 50 weeks
Total body mass (g)
Lean Mass (%)
Fat Mass (%)
Mineral Mass (%)
Diet1/ 1 326.27 86.56 6.56 2.54 2 318.24 86.40 6.70 2.61 3 334.36 86.87 6.22 2.61 4 331.89 87.02 6.04 2.53 5 334.16 86.89 6.24 2.54 6 329.29 86.81 6.27 2.55 SEM 5.272 0.200 0.259 0.032 Line A 329.96B 87.92A 4.97C 2.45C B 366.35A 85.26D 8.45A 2.59B C 327.42B 86.69C 6.40B 2.72A D 292.42C 87.15B 5.54C 2.49BC SEM 4.302 0.176 0.211 0.032 Statistical analysis (p-value) Diet 0.3122 0.1392 0.5044 0.3274 Line <.0001 <.0001 <.0001 <.0001 Diet x Line 0.8931 0.0706 0.1084 0.6082
1/ Diet 1 = 2.25Ca: 0.25NPP, Diet 2 = 2.50Ca: 0.25NPP, Diet 3 = 2.75Ca: 0.25NPP, Diet 4 = 3.00Ca: 0.25NPP, Diet 5 = 3.25Ca: 0.25NPP, Diet 6 = 3.25Ca: 0.40NPP
A-B Means within a column that do not share a letter are significantly different (p=<0.05)

Figure 1commerc(Ca) and0.25NPP5 = 3.25Csignifican
11 Bar diagcial starter dd nonphytateP, Diet 2 = 2.Ca: 0.25NPPntly differen
gram show bdiet from foue phosphoru.50Ca: 0.25NP, Diet 6 = 3nt (p=<0.05)]
body compour pure gen
us (NPP) froNPP, Diet 3 3.25Ca: 0.40]
68
osition (Meanetic line breom age 22 to= 2.75Ca: 0
0NPP). [A-B B
ans±SE) in eeder hens fo 50 weeks
0.25NPP, DieBar diagram
C
AB
A
C
D
14-day-old fed various . (Breeder Det 4 = 3.00C
m that do not
B A
B A
C
B
D
A
chicks fed level of cal
Diet 1 = 2.2Ca: 0.25NPP,
share a lette
C
C
B
C
BC
with lcium 25Ca: , Diet er are

69
Table 11 Calcium and Phosphorus digestibility (Means) in 14-day-old chicks fed with commercial starter diet from four pure genetic line breeder hens fed various level of calcium (Ca) and nonphytate phosphorus (NPP) from age 22 to 50 weeks
Excreta Ca (%)
Excreta P (%)
Ca digestibility (%)
P digestibility (%)
Diet1/ 1 2.70 1.30 31.82 42.44 2 2.61 1.22 32.34 44.51 3 2.50 1.19 34.47 45.38 4 2.62 1.25 33.53 44.60 5 2.77 1.33 32.48 43.55 6 2.75 1.41 28.88 36.17 SEM 0.097 0.054 1.760 1.632 Line A 3.22A 1.41B 22.10C 34.28C B 2.18B 1.19C 40.69B 50.93B C 1.87C 1.00D 48.83A 58.64A D 3.35A 1.53A 17.37C 27.25D SEM 0.047 0.020 1.437 1.332 Statistical analysis (p-value) Diet 0.2254 <.1511 0.3384 0.1112 Line <.0001 <.0001 <.0001 <.0001 Diet x Line 0.1587 <.1201 0.1337 0.1203
1/ Diet 1 = 2.25Ca: 0.25NPP, Diet 2 = 2.50Ca: 0.25NPP, Diet 3 = 2.75Ca: 0.25NPP, Diet 4 = 3.00Ca: 0.25NPP, Diet 5 = 3.25Ca: 0.25NPP, Diet 6 = 3.25Ca: 0.40NPP
A-B Means within a column that do not share a letter are significantly different (p=<0.05)

Figure 1chicks feof calciu2.25Ca: 0.25NPPshare a le
12 Bar diaged with commum (Ca) and
0.25NPP, DP, Diet 5 = 3etter are sign
ram show cmercial startnonphytate
Diet 2 = 2.53.25Ca: 0.25nificantly dif
calcium andter diet from phosphorus
50Ca: 0.25N5NPP, Diet 6fferent (p=<0
70
d phosphorusfour pure ge (NPP) from
NPP, Diet 3 6 = 3.25Ca: 0.05)]
A
s excretion enetic line b
m age 22 to = 2.75Ca: 0.40NPP).
B
A
C
B
(Means± SEbreeder hens 50 weeks. (0.25NPP, D[A-B Bar dia
C
D
E) in 14-dafed various Breeder Die
Diet 4 = 3.0agram that d
A
A
ay-old level
et 1 = 00Ca: do not

Figure 1chicks feof calcium2.25Ca: 00.25NPPshare a le
3 Bar diagraed with commm (Ca) and n0.25NPP, Di
P, Diet 5 = 3.etter are sign
am show calmercial startnonphytate piet 2 = 2.50C25Ca: 0.25N
nificantly dif
cium and pher diet from phosphorus (Ca: 0.25NPPNPP, Diet 6 =fferent (p=<0
71
hosphorus exfour pure ge(NPP) from
P, Diet 3 = 2.= 3.25Ca: 0.0.05)]
C
C
xcretion (Meenetic line bage 22 to 50.75Ca: 0.25N.40NPP). [A-
B
B
eans±SE) in reeder hens 0 weeks. (BrNPP, Diet 4 -B Bar diagra
A
A
14-day-old fed various
reeder Diet 1= 3.00Ca:
am that do n
C
D
level 1 =
not

72
CHAPTER 4
BONE HOMEOSTASIS VARIABLES FROM FOUR BREEDER GENETIC LINES FED DIETS
VARYING IN CALCIUM AND NONPHYTATE PHOSPHORUS CONTENT

73
IV. CHAPETER 4
A. BONE HOMEOSTASIS VARIABLES FROM FOUR BREEDER GENETIC LINES FED DIETS VARYING IN CALCIUM AND NONPHYTATE PHOSPHORUS CONTENT
B. ABSTRACT
The effect of dietary calcium (Ca) and nonphytate phosphorus (NPP) level on four pure
genetic lines of broiler breeders was studied from 21 to 50 weeks of age. Pullets (246 from each
of pure genetic line A, B, C and D) were individually caged and light stimulated at 21 weeks of
age. Hens from each line were fed one of six diets varying in calcium and nonphytate
phosphorus (NPP): 1) 2.25% Ca with 0.25% NPP; 2) 2.50% Ca with 0.25% NPP; 3) 2.75% Ca
with 0.25% NPP; 4) 3.0% Ca with 0.25% NPP; 5) 3.25% Ca with 0.25% NPP; and 6) 3.25% Ca
with 0.40% NPP. Daily allotted feed intake was increased for every 8 percent increase in egg
production going from 5% to peak. Egg production and egg quality variables were recorded
throughout the experimental period. Chicks hatched from breeder hens from each treatment (line
x diet) were fed a commercial broiler starter diet for 14 days. At 14 days of age plasma was
collected from the chicks for bone specific alkaline phosphatase (BSAP), fibroblast growth
factor 23 (FGF23), and tartrate resistant acid phosphatase (TRAP) determination. The breeder
study was terminated at 50 weeks of age and blood samples were collected from 1000 hrs to
1300 hrs to evaluate bone homeostasis variables the same as the chicks. Tibia bones from hens
were collected for histological TRAP staining. Chicks and hens were scanned with dual energy
x-ray absorptiometry (DXA) (GE® Lunar Prodigy) for body composition. Statistical analysis
was two-way ANOVA with interaction from two main factors (line and diet) and MANOVA for

74
repeated measures procedure. The results showed that there was no significant difference in hen
plasma BSAP, FGF 23, TRAP and bone osteoclastic histological score due to genetic line or diet.
The level of plasma BSAP corresponded to shell quality and body mineral content by genetic
line whereas plasma FGF 23 levels was positively correlated to dietary calcium levels. Bone
TRAP score in breeders was statistically correlated to plasma TRAP activity (correlation
coefficient =4.75). In 14-day-old progeny, there was no significant difference in BSAP, FGF23
and TRAP due to diet fed to the breeder. However, regarding the genetic lines, plasma BSAP
was correlated with body mineral mass in both breeder hen and chick and also to shell quality. In
conclusion, TRAP was correlated to neither body mineral mass nor egg shell quality but may be
useful for evaluating bone structure status. BSAP from each genetic line may be used as an
indicator or biomarker to determine potential shell quality and body mineral mass for breeder
hens and the progeny chick. Finally, plasma FGF23 concentration related to dietary calcium
levels and linked to phosphorus excretion in the excreta.
Key words: calcium, nonphytate phosphorus, bone specific alkaline phosphatase, fibroblast
growth factor 23, tartrate resistant acid phosphatase

75
C. INTRODUCTION
Bone homeostasis is one of the most important mechanisms in laying animal that will
determine the survival of both the animals themself and offspring in the egg. In the mammal, the
main functions of bones are to maintain blood calcium levels and provide body support. In the
avian species, because egg shell quality is very important for the successful development of the
chick embryo as it provides protection from damage and infection, therefore, there is an
additional important function of bone to provide adequate blood calcium, especially when the
dietary calcium source is not available (Nys et al. (2004). These functions of bone are
accomplished by continuous tissue renewal, called remodeling, occurring throughout life by the
balance between osteoclastic bone resorption and osteoblastic bone formation. Several bone
homeostasis enzymes and hormone that are related to the function of osteoblast and osteoclast
have been used to determine bone homeostasis status. Among several indicators, bone specific
alkaline phosphatase (BSAP), plasma tartrate resistant acid phosphatase (TRAP) and Fibroblast
growth factor 23 (FGF23) are of the interest in medical research area as a diagnostic or prognosis
tools in bone homeostasis disorders.
Alkaline phosphatases (ALP) are glycoproteins that can be categorized by its tissue of the
origin (Garnero and Delmas, 1993). BSAP is one of the alkaline phosphatase that has been used
extensively for bone homeostasis disorder in human. It is a tetrameric glycoprotein localized in
the plasma membrane of osteoblasts. The major function of BSAP is to generate the inorganic
phosphate needed for hydroxyapatite crystallization by utilizing ATP and inorganic
pyrophosphate (Hessle et al., 2002). Bone specific alkaline phosphatase activity in serum is
commonly used as a marker of bone turnover. Leung et al. (1993) reported that BSAP increased

76
in bone fracture and osteosarcoma patients, in patients with Paget's disease, in primary
hyperparathyroidism and in chronic renal failure on hemodialysis (Garnero and Delmas, 1993).
Turner et al. (1995) demonstrated that change of BSAP is related to the change of Bone mineral
density.
TRAP is an enzyme localized in the transcytotic vesicles of resorbing osteoclasts. It plays
the important role of further destruction of matrix-degradation products in the transcytotic
vesicles (Halleen et al., 1999). TRAP-deficient osteoclast leads to the accumulation of vesicles in
the cytoplasm (Hollberg et al., 2002). TRAP has been used as a relatively specific marker for
osteoclasts (Minkin, 1982; Sawyer et al., 2003). Minkin (1982) suggested that Tartrate-resistant
acid phosphatases of bone may be a suitable biochemical probes for osteoclast function and
suggest that the release of tartrate-resistant acid phosphatase is from osteoclasts and can be used
as a diagnostic indicator for breast cancer and prostate cancer bone metastasis (Lyubimova et al.,
2004).
FGF23 was recently identified as a member of FGF family and is secreted by osteocytes
and osteoblasts. It appears to be involved in bone metabolism by regulating phosphorus and
vitamin D metabolism. Kolek et al. (2005) demonstrated that the administration of 1,25-(OH)2D
increases the expression of FGF23 mRNA in bone. FGF23 increases phosphate excretion and
decreases the activity of the 25-hydroxy VitaminD 1α-hydroxylase so that it decreased intestinal
calcium and phosphorus absorption (Shimada et al., 2004).
Presently, with the advance technology of dual energy x-ray absorptiometry (DXA), body
composition changes of broilers or broiler breeders can be easily evaluated. The advantage of
DXA being a non-invasive technique is that the same bird can be studied over an extended
77
period of time without any detriment to its health or performance. Salas et al. (2012) successfully
established the equations for body composition prediction and demonstrated that it is a reliable
alternative for measuring body composition with very high degree of correlation with total body
mass, body mineral content, fat mass and lean mass. The amount of time needed per scan is short
compared to the time invested. Beside body composition, England et al. (2012) established the
equations for DXA to determined egg quality as an accurate and nondestructive method to
predict total egg weight, shell weight, shell calcium content, shell thickness, albumen weight and
yolk weight. Therefore, the objective of this experiment was to evaluate bone homeostasis
variables in blood (BSAP, TRAP and FGF23) related to body mineral content and egg shell
quality using DXA technology in breeder hen and progeny from four pure breeders genetic lines
fed diets varying in calcium and nonphytate phosphorus.
D. MATERIALS AND METHODS
All procedures relating to the use of live animal in these experiments were approved by
the University of Arkansas Institutional Animal Care & Use Committee (13002 approval
number).

78
Animal and Handling
Nine hundreds and eighty four hens from four pure genetic lines (246 hens each from line
A, B, C, and D) were brought to experimental farm at the age of 20 week old. Each hen was
assigned a unique individual identification number and was raised individually in battery cage
with a separate feeder and water nipple. All birds were kept in an environmentally controlled
house. Light schedule began with 12 hours per day at week 21 of age and increased 1 hour for
the next two weeks until it reached 14 hours per day. After that period the light duration
increased to 15 and 16 hours per day at 20% and 50% egg production, respectively. Temperature
was targeted to maintain at 22 °C throughout the experimental period.
Feed and Feeding
The large batches of basal diet were formulated to meet or exceed nutrient requirement as
recommended by breeder company except calcium (Ca) and nonphytate phosphorus (NPP). The
various levels of calcium in each diet were achieved by the substitution of limestone with sand
(same batch for entire experimental duration). Dietary treatments in this experiment consisted of
1) 2.25% Ca with 0.25% NPP; 2) 2.50% Ca with 0.25% NPP; 3) 2.75% Ca with 0.25% NPP; 4)
3.0% Ca with 0.25% NPP; 5) 3.25% Ca with 0.25% NPP; and 6) 3.25% Ca with 0.40% NPP.
Feed composition and calculated nutrient content is shown in Table 1. Daily allotted feed intake
was restricted and increased for every 8 percent increase in egg production going from 5% to
peak. Residual feed (left over) was weighed and cleared from feeding tray once a week, if any
was present. Hens had free access for water all the time.
79
Data and Sample Collection
The experimental period started from week 21 through week 50. Egg number and feed
intake were recorded daily. Individual egg weight from every hen was recorded two days a week.
Monthly, hens’ body weights were monitored; egg quality variables were collected for three
consecutive days, and the same four hens from each treatment (Lines x Diets) were scanned
monthly using dual energy x-ray absorptiometry (DXA) (GE Lunar Prodigy, GE®, USA) for
body composition evaluation.
Calcium and phosphorus digestibility test were performed on every new batch of
treatment diets delivered to the experimental farm. Fourteen hens from each treatment group
were fed a diet supplemented with two percent acid insoluble ash (AIA, Celite®, World Minerals
Inc., USA) for at least three days. On the last day of the digestibility trial, eight hens per
treatment were selected for fecal collection based on the least fecal contamination from broken
egg, feather and feed residual. Feces from each hen was individually collected and freeze-dried
to determine calcium and phosphorus digestibility. In digestibility tested hens, an additional two
percent of the daily dietary allowances were increased to compensate the amount of acid
insoluble ash added in the diet. The digestibility values (%) were calculated using formula
below:
Ca/P Digestibility = [1 − (Dietary AIA / Excreta AIA) × (Excreta Ca -P/ Dietary Ca- P)] * 100

80
At the end of experimental period, 20 hens from each treatment (Diet x Genetic lines)
were randomly selected for wing vein blood collection using heparinized blood collecting tube
and euthanized by CO2. Blood samples were then centrifuged for plasma and stored at -80 °C to
determine plasma bone-homeostasis hormone and enzyme (fibroblast growth factor 23 (FGF23),
bone specific alkaline phosphatase (BSAP), and tartrate-resistant acid phosphatase (TRAP)).
Tibia bones from each hen were collected and kept in 10% buffer formalin for TRAP staining
(osteoclastic cell marker). Mortality rate was daily recorded. Death hens were weighed and
examined by routine necropsy procedures.
For progeny trial, during the 27, 37, and 47 weeks of egg production, eggs were
individually weighted and collected for 6-day duration for hatchability test and progeny bone
ash. At week 47 of hatchability test, live hatched chicks from each treatment (line x diet) were
separated according to breeder treatments and raised in battery cages (10 chicks per cage) with 7
replications per treatment. All chicks were fed with commercial starter diet for 14 days. On day
9, calcium and phosphorus digestibility test were performed by using acid insoluble ash (AIA,
Celite®, World Minerals Inc., USA) as an indigestible marker. Chicks were fed with Celite®
diet for three days. The feces were collected for calcium phosphorus content. On day 14, 10
chicks per treatment were randomly selected for blood collection. Plasma samples were
separated and kept at -80 °C and analyzed for calcium, phosphorus, FGF23, BSAP, and TRAP.
Twenty separated chicks from each treatment were randomly selected for DXA scanning for
body composition using GE Lunar Prodigy (GE®, USA).

81
Sample Analysis
Feed were analyzed for moisture, ash, crude fat and nitrogen using standard methods
AOAC 934.01, 923.03, 920.39c and 990.03, respectively (AOAC, 1990). Gross energy was
determined using oxygen bomb calorimeter (Parr Co. Oxygen Bomb Calorimeter, USA). After a
nitric acid wet digestion, feed and excreta samples were analyzed for calcium and phosphorus
content by inductively coupled plasma emission spectrometry (Model FSMEA85D, Spectro
Analytical Instruments, Germany). Acid insoluble ash in diet and feces samples was analyzed
using technique described by Van Keulen and Young (1977).
For egg quality, at the same day of egg collection, hen identification numbers were
written on the each egg shell and then were transferred to dual energy x-ray absorptiometry
(DXA) room. Ten eggs at a time were scanned with GE Lunar Prodigy (GE®, USA) with small
animal body software. The specific gravity of each egg was performed by immersing each egg in
salt solutions ranging in specific gravity between 1.060 and 1.095 with a concentration gradient
of 0.005 between solutions. Information from dual energy x-ray absorptiometry (DXA)
technology then were transformed into egg quality variables utilized equations adopted from
England (2012). The detail for each equation of each parameter is showed below.
Total egg weight (g) = 10.3359+1.1169*BMC+0.4369*Tissue+0.2660*Tissue %
Fat+0.3554*Lean
Shell weight (g) = -0.4152+0.0295*Lean-0.0261*Tissue % Fat+1.0244*BMC
Shell Calcium (g) = 0.2297+0.4150*BMC-0.0171*Tissue+0.02240*Lean

82
Shell thickness (mm) = 0.1125-0.0005*Lean-0.0058*Tissue %Fat+0.0423*BMC
Albumen weight (g) = -12.5673+0.7040*Egg wgt-0.2293*Tissue %Fat-1.6164*BMC
Yolk weight (g) = 10.6746+0.2573*Egg wgt+18.8852*BMD g/cm +0.2826*Tissue %Fat
Where:
BMC = DXA body mineral concentration (g) from report printout by the Lunar Prodigy DXA
machine
BMD = DXA body mineral density (g/cm2) from report printout by the Lunar Prodigy DXA
machine
Tissue = DXA body mass (g) from report printout by the Lunar Prodigy DXA machine
Lean = DXA lean mass (g) from report printout by the Lunar Prodigy DXA machine
Tissue % Fat = Fat (g) per tissue (g) *100 from report printout by the Lunar Prodigy DXA
machine
To verify DXA-egg quality calculation equation from England et al. (2012), 18,132 scale
egg weights were compared with the same number of DXA calculated egg weight. The
correlation coefficient was greater than 99%. Body composition variables using DXA technology
utilized equations adopted from Salas et al. (2012). The detail for each equation of each
parameter is shown below:

83
Mineral (g) = Exp(1.12791987829434 + 0.781746850268085*LN(DXA BMC))
Fat mass (g) = Exp(0.652934780452235 + 0.866573940974689*LN(DXA Fat))
Lean mass (g) = Exp((-0.189754159479226) + 1.0185610251232*LN(DXA Lean))
Total mass (g) =Exp (0.098819119341294 + 0.984343048335571*LN (DXA Fat+ DXA Lean))
Tibia bone ash (%) = 0.70314492300898 +0.01804692089203* DXA BMC -
0.0112228545231* DXA Area -0.0005611186595* DXA Lean
Where:
LN = natural logrithm
Exp = returns e raised to the power of a given number
BW = body weight
BMC = DXA body mineral concentration (g) from report printout by the Lunar Prodigy DXA
machine
Fat = DXA fat mass (g) from report printout by the Lunar Prodigy DXA machine
Lean = DXA lean mass (g) from report printout by the Lunar Prodigy DXA machine
Area (cm2) = DXA Area, ie. the area of footprint of the subject, not the volume from report
printout by the Lunar Prodigy DXA machine
84
For plasma chemical analysis, chicken fibroblast growth factor 23 and chicken bone
specific alkaline phosphatase were analyzed using a quantitative competitive immunoassay test
kit (Neobiolab, USA). Plasma tartrate resistant acid phosphatase was analyzed using a micro
titer-plat spectrophotometer absorptiometry technique described by (Lau et al. , (1987). In brief,
50 µL of five-fold diluted plasma sample (using distilled water) was incubated at 37 °C for 1
hour. Add 50 µL of pH 5.5 reaction mixture (100 mmol of p-nitrophenyl phosphate (PNPP), 200
mmol of sodium citrate, 200 mmol of sodium chloride, and 80 mmol of sodium L-(+)-tartrate per
liter) and incubate at 37 °C for 1 hour. The reaction was stopped by adding 50 µL of 1 mol/L of
NaOH. Absorbance of the mixture at 410 nm vs. a reference wavelength at 490 nm was
compared to standard (serial dilution of p-nitrophenol). One unit of TRAP activity was defined
as the amount of enzyme required to hydrolyze 1 µmol of PNPP per minute at 37 °C in the
presence of 40 mmol of sodium L-(+)-tratrate per liter at pH 5.5.
Plasma calcium and inorganic phosphorus was analyzed using colorimetric assays kit
(Biovision, USA). Tartrate resistant acid phosphatase in bone histology sections was analyzed
using a TRAP stain technique adopted from (ASBMR, (2012). In brief, 1 inch of the middle
shaft of right tibia bones were collected from hens and were fixed using 10% neutral buffered
formalin for 1 week (gentle shake in 4 °C). Decalcify bone samples using 14% EDTA solution
(4,550 ml of distilled water, 450 ml of Ammonium Hydroxide (EMD, AX1303-75), and 700 g
EDTA (Sigma, ED-5kg)) at least for 2 weeks or until the bone was soft enough for tissue section
process (change EDTA solution daily during first week, every other day for the second week).
Process decalcified bone using standard paraffin embedding technique and cutting tissue slide at
5 µm thickness. Follow the TRAP staining protocol as described by Boyce (2013). Osteoclastic
85
histological score was evaluated using reference criteria in Figure 1. The final score was the
average value of four readings from four bone sections per hen.
Statistical Analysis
Experimental design was completely randomized 6 x 4 factorial arrangement of
treatments composed of six dietary treatments and four pure genetic lines. The experimental unit
was a hen kept in an individual cage. Due to unequal variances and unequal correlation between
each two measures at each time variables, a repeated measures, multivariate analysis of variance
(MANOVA) was used to test the between subject effect and Greenhouse & Geisser (GG)
adjusted-degree of freedom Univariate tests was used to test the effect of main factor and
interaction over the time (age of egg production [week]) for egg production, egg quality
variables, and body composition variables. Two-way Analysis of variance (ANOVA) with
interaction was used to test the effect of main factors for one-time measured variables.
Contingency analysis (Chi-square likelihood ratio) was used to test main factors effect on
mortality. Least squares means (LSMeans) are reported as treatment means. LSMeans Student’s t
was used to compare the difference between treatment groups. All statistic test in this experiment
used statistical analysis package JMP® 11 (SAS Institute, Cary, North Carolina)
86
E. RESULT
Diet had effect on shell:egg weight, and shell calcium percentage (P=0.0411 and
P=0.0423) and tended to had effect on shell weight (mg) per square centimeter egg surface area
(SWUSA) (P=0.0529) (Table 2). Shell calcium percentage increase from hens fed Diet 1 to Diet
5. Shell quality of hens fed Diet 6 which was higher in both calcium and phosphorus had the
similar egg shell quality to hens fed Diet 5. Genetic line had effect on shell:egg weight, SWUSA
and shell calcium percentage (P<0.0001). Hens in Line C had best egg shell quality in every
variables while hens in genetic Line A had the poorest shell quality (Table 2). For digestibility,
Genetic Line had no effect on excreta calcium and excreta phosphorus. Diet had effects on both
excreta calcium and excreta phosphorus (P<0.0001). Excreta calcium was higher in Diet 4, Diet
5, and Diet 6 compared to Diet 1 and Diet 2 (Table 3). Excreta phosphorus was higher in hen fed
Diet 5 and Diet 6 compared to hen fed Diet 1 to Diet 4 (Figure 2). The level of calcium and
phosphorus in excreta from Diet 6 was not different from Diet 5 (Table 3).
Diet had an effect on absolute mineral mass (P= 0.0166). Hens fed Diet 6 had higher
absolute mineral mass compared to hens fed Diet 1. Genetic line had an effect on total body
mass, absolute mineral mass, mineral mass percentage and Tibia ash percentage (P<0.0001).
Genetic Line C had highest tibia ash, and absolute mineral mass (Table4).
Diet had no effect on plasma calcium and phosphorus. Genetic line had effect on plasma
calcium both in breeder and progeny chick (Table 5). Genetic line D had the higher plasma
calcium (P<0.0001) in breeder and had higher in progeny chick but not different from genetic
Line A (P=0.0011) (Figure 4). Genetic line had no effect on plasma phosphorus in breeder. For
bone homeostasis marker, diet had no effect on plasma BSAP (P=0.6755). Genetic line tended to

87
have an effect on BSAP (P=0.2375) with the highest level was on genetic line C. There was no
different on the level of plasma TRAP and bone osteoclastic histological score (P=0.5822 and
P=0.5402, respectively) due to the dietary treatments (Table 6). However, diet had an effect on
plasma FGF23 in breeder (P=0.0418). The level of plasma FGF23 was highest in Diet 1 and was
lowest in Diet 2 and tended to increase from Diet 3 to Diet 5. Genetic Line had an effect on
plasma TRAP (P<0.0001) and tended to had an effect on bone osteoclastic histological score
(P=0.0652) (Figure 6).
In progeny trial, day-0 chick tibia ash and body composition is shown in Table 7 and in
Figure 9 and Figure 10. Diet had no effect on day-0 chick tibia ash percentage, total body mass
and body mineral mass percentage. However, genetic line affected on day-0 chick tibia ash
percentage, total body mass and body mineral mass percentage (P<0.0001). Chicks from genetic
line A and C had lowest day-0 chick tibia ash. Chicks from genetic Line C had highest body
mineral mass whereas chicks from genetic Line B had highest total body mass (Figure 10). Diet
had no effect on excreta calcium, excreta phosphorus, calcium digestibility and phosphorus
digestibility (Table 8). Genetic line had effect on excreta calcium, excreta phosphorus, calcium
digestibility and phosphorus digestibility (P<0.0001). Genetic Line A and Line D had the highest
excreta calcium whereas genetic Line C had the lowest excreta calcium (Figure 11). Genetic
Line D had the highest excreta phosphorus.
For plasma BSAP (Table 9), there was no dietary effect observed (P=0.6100); however,
Genetic line tended to have an effect on plasma BSAP (P=0.0915). Chicks from genetic Line C
tended to have highest BSAP. Diet had no effect on plasma TRAP and plasma FGF23. However,
genetic line affected both plasma TRAP (P<0.0001) and plasma FGF23 (P=0.0371). Plasma
88
TRAP was higher in chicks from genetic Line A and Line D. Similarly, plasma FGF23 was also
higher in chicks from genetic Line A and Line D (Figure 13 and Figure 14).
F. DISCUSSION
The increase of dietary calcium from 2.25 to 3.25 with 0.25 % nonphytate phosphorus
gradually increased egg shell quality. The similar shell quality of Diet 5 and 6 indicated that
0.4% dietary NNP did not improve egg shell quality. Similar observation has been reported by
Narvaez-Solarte et al. (2006) that the increase of dietary calcium from 2.6 to 4.2% improved
shell quality in the quadratic respond with the peak shell weight at 3.56% calcium; however in
those reports the authors use 0.35% nonphytate phosphorus in the diet.
There are relationships observed between body mineral content and egg shell quality
according to genetic line. Hens from genetic Line C had the highest absolute mineral mass (g),
mineral mass percentage and tibia ash percentage. At the same time, hens from genetic Line C
also had the best egg shell quality. Whereas hens from genetic Line A that had the lowest score
in all body mineral content variables, it also had lowest egg shell quality (Figure 3). In addition
to those observations, the level of plasma BSAP from each genetic line also resembled both body
mineral content variables and egg shell quality variables. Several studies have been published
concerning the functions and the importance of ALP and BSAP. Howard et al. (1987) stated that
the activity of alkaline phosphatase is required to generate the inorganic phosphate that is needed
for hydroxyapatite crystallization by utilizing ATP and inorganic pyrophosphate which is an
important process for bone mineralization. Hessle et al. (2002) demonstrated that alkaline
89
phosphatase primary function in mineralizing tissues is to act in coordinate with plasma cell
membrane glycoprotein-1 to fine tune inorganic pyrophosphate concentrations to maintain
steady-state levels of inorganic pyrophosphate adequate for controlled mineralization. (Leung et
al. , (1993) reported that BSAP had increase in bone fracture and osteosarcoma patients but not
in those with osteolytic bone metastases and there was no significant increase in activity in the
patients with liver disease. Garnero and Delmas (1993) reported that serum BSAP was increased
from control values in patients with Paget's disease, in primary hyperparathyroidism and in
chronic renal failure on hemodialysis but did not significantly increased in patients with various
liver diseases.
Hurwitz and Griminger (1961) suggested that the increase of plasma alkaline phosphatase
was related to bone resorption rather than bone formation and found that plasma alkaline
phosphatase is an indicator of parathyroid activity. Carlberg (1999) reported that during the
active period of eggshell calcification, there was a seven-fold increase in the percentage of active
osteoclasts while there was also a two-fold increase in active osteoblast. With recent discovery, it
is now clear that the action of both parathyroid hormone (PTH) and Vitamin D is not involve in
directly activating bone osteoclast to initiate bone resorption (Stipanuk, 2006). In contrast,
parathyroid hormone and active from of Vitamin D binds with the specific receptor on mature
osteoblasts which stimulates osteoblasts to increase their expression of RANKL (receptor
activator of NF-kB ligand). Monocytic osteoclast precursor cells have the receptor RANK. Once
the RANK on the monocytic cell interacts with the RANKL of the osteoblast, there is signal
transduction induces the promotion of osteoclast differentiation and activation into mature active
bone-resorbing osteoclast (Stipanuk, 2006). This information supports the observation that was
reported by Van de Velde et al. (1984) that, in chickens, when bone resorption was low, bone
90
formation was also low and when bone resorption was high, bone formation was also high as the
bone decalcification and bone calcification must have to be kept in balance. Therefore, this could
support the idea that plasma BSAP is not only the indicator of bone formation to reflect the rate
of bone resorption but also could be used as an indication of basal bone homeostasis rate in
normal subject. As the result, in present experiment, the level of BSAP could indicate the ability
of bone homeostasis in certain genetic lines as it was high, for instance, in genetic Line C so that
it can maintain its high body mineral content and support better egg shell quality. In contrast,
BSAP was lower in the line that had poor body mineral concentration and poor egg shell quality.
In the aspect of the effect of the dietary calcium and BSAP, there was a report indicated that the
increase of dietary calcium from 3.2 to 4.5 % resulted in the decrease of alkaline phosphatase
enzyme in plasma of laying hen (Rama Rao et al., 2003). However, in the present experiment
there was no significant change according to the increase of dietary calcium. The reason may be
either due to the lower level of dietary calcium used in the present study or the differences
between the nature of ALP and BSAP.
In the present study, the level of plasma TRAP corresponded very well with the
osteoclastic histological score by using TRAP staining as showed in Figure 6. Similarly, Minkin
(1982) reported the close relationships between histochemical observation of osteoclastic-TRAP
positive cell and the TRAP concentration obtained from biochemical assays and polyacrylamide
gel electrophoresis. Rissanen et al. (2008) tested the secretion of tartrate-resistant acid
phosphatase 5b (TRACP 5b) from human CD34+ osteoclast precursor cells and concluded that
TRACP 5b correlated strongly with osteoclast number and TRACP 5b is a reliable marker of
osteoclast number. In the clinical evaluation, Lyubimova et al. (2004) reported the use of TRAP
as a diagnostic indicator for breast cancer and prostate cancer bone metastasis and found higher

91
than 70% sensitivity and specificity. The results from the present study indicated that plasma
TRAP can be used as the maker for osteoclast population of chicken bone and may be used to
indicate bone structure status as it is explain in bone osteoclastic histological scoring system.
However, there was no correlation of plasma TRAP that can relate to other bone homeostasis
parameter especially in this normal physiological status.
FGF23 was identified in about year 2000 as the last member of FGF family and is
secreted by osteocytes and osteoblasts. The circulating FGF23 is regulated by serum Pi (Mirams
et al., 2004; Saito et al., 2005) and the administration of 1,25-(OH)2D increases the expression of
FGF23 mRNA in bone (Kolek et al., 2005). FGF23 acts on the kidney to increase phosphate
excretion and decrease the activity of the 25-hydroxy VitaminD 1α-hydroxylase (CYP27B1) and
hence decrease intestinal calcium and phosphorus absorption (Shimada et al., 2004). Recent
discovery indicated that circulating FGF23 increases phosphate excretion by reducing the
expression of proximal renal tubular brush border membrane sodium-phosphate cotransporters
(NaPi2a and NaPi2c), which reduces their normal function to reabsorb phosphorus from
proximal renal tubular (Shimada et al., 2005; Segawa et al., 2009). The reaction between FGF23
and 1,25-(OH)2D suggests a kidney-intestine-bone axis that mediates phosphate homeostasis
(Kolek et al., 2005). There is a link of plasma FGF23 related to dietary treatments observed in
the present experiment.
In this digestibility trial, the increase of calcium in excreta when the level of dietary
calcium increased was as expected as it has been previously reported in several publications
(Summers et al., 1976; Keshavarz and Nakajima, 1993; Pastore et al., 2012). The increase of
excreta phosphorus without extra dietary phosphorus supply observed in this experiment could
be explained by the increased of plasma FGF23. Shimada et al. (2005) reported that the increase

92
of dietary calcium significantly increase plasma FGF23 both in the control mice and the vitamin
D receptor-null mice. The authors concluded that action of calcium that increase plasma FGF23
is a vitamin D independent process. As showed in current study, the level of FGF23 gradually
increased when dietary calcium was increased from Diet 2 to Diet 5. Moreover, in this current
study, we found that the increase of dietary phosphorus level, with the same dietary calcium
level, from diet 5 to 6, Diet 6 had higher excreta phosphorus whereas it had lower FGF-23. This
indicated that it is not only FGF-23 itself that is the driving force of phosphorus excretion and it
demonstrated the more complicated calcium and phosphorus homeostasis mechanism. In
addition, this demonstrated that phosphorus may not be the most influence factor in the
controlling of FGF-23 released from its sources; instead both of calcium and phosphorus or
maybe its ratio that plays this crucial role. To support that idea, the pattern of FGF23
concentration along dietary treatment was compared with the dietary calcium and phosphorus
ratio in Figure 8. The levels of plasma FGF23 increase and decrease correspond with the the
increase and decrease of calcium and phosphorus ration in the diet. This observation of the
increase of excreta phosphorus supported the conclusion of Shimada et al. (2005) on the effect of
dietary calcium on FGF23 secretion.
The excreta calcium and phosphorus in progeny chicks increased quadratically to the
increase of calcium in breeder diets (Figure 11) and seems to have an inverse relationship to
plasma FGF23 (Figure 14).
Ekmay and Coon (2010) reported that breeder genetic line C (same genetic line with
present experiment) which had the highest tibia bone ash showed marginally the lowest egg
specific gravity and showed the lowest Day-0 chick tibia ash percentage compared to other
genetic lines. Similarly, the present experiment found that tibia ash and body mineral mass were

93
highest in the same breeder genetic Line C and its day-0 chick tibia ash percentage was also the
lowest compare to the other lines; however, the present experiment found the opposite egg shell
quality variables on this genetic line were the highest and that also corresponded with its higher
body mineral percentage as previously discussed (Figure 3). Besides, in 14-day chicks mineral
mass percentage from genetic Line C was also the highest and it also corresponded to its breeder
genetic line mineral mass. In addition, plasma BSAP that was highest in plasma of breeder hen in
Line C was also the highest in plasma of chicks in genetic Line C (Figure 15). The relationship
of breeder mineral mass, egg shell quality and progeny mineral mass is showed in Figure 16.
This could confirm our previous statement that plasma BSAP could be use an indicator for bone
homeostasis ability trait of a genetic line which could be used to determine or predict egg quality
and progeny mineral content.
The same result of the lowest day-0 chick bone ash in genetic Line C could be one of its
genetic traits. This may infer that day-0 chick bone ash may not be an accurate parameter to
determine broiler bone quality; instead bone character in the older chicks may be better
indicators.
In conclusion, plasma BSAP could be a potential marker related to body mineral mass.
Moreover, it not only could relate to egg shell quality but also to progeny mineral mass. Plasma
TRAP was not a good indicator to explain bone homeostasis; however, it could be used to
indicate bone status at it correlated with the osteoclastic histological score which bone structure
is a part of score determination. Whereas BSAP and TRAP were more related to genetic trait,
plasma FGF23 was the hormone that are more related to dietary calcium and phosphorus. The
present experiment confirmed that phosphorus is not only a factor that can activate the release of

94
FGF23. In contrast, the level of calcium in the diet can also increase plasma FGF23 resulting in
the increase of phosphorus in the excreta.

95
Table 1 Breeder dietary composition of 6 dietary treatments varying in calcium (Ca) and nonphytate phosphorus (NPP) levels
Treatment Diet 1 Diet 2 Diet 3 Diet 4 Diet 5 Diet 6
Ingredients (%) Corn 68.40 68.40 68.40 68.40 68.40 64.70 Soybean Meal 21.67 21.67 21.67 21.67 21.67 22.99 Limestone 4.80 5.45 6.10 6.75 7.40 6.77 Phosphate 0.86 0.86 0.86 0.86 0.86 1.82 Fat, Poultry 0.56 0.56 0.56 0.56 0.56 2.62 SalCurb, Liquid 0.32 0.32 0.32 0.32 0.32 0.32 NaCl 0.23 0.23 0.23 0.23 0.23 0.17 Alimet 0.19 0.19 0.19 0.19 0.19 0.20 Choline Cl-70% 0.10 0.10 0.10 0.10 0.10 0.10 S-Carb 0.10 0.10 0.10 0.10 0.10 0.10 Mineral premix2/ 0.07 0.07 0.07 0.07 0.07 0.07 Vitamin premix3/ 0.07 0.07 0.07 0.07 0.07 0.07 HyD 0.05 0.05 0.05 0.05 0.05 0.05 Sand 2.60 1.95 1.30 0.65 0.00 0.00 Total 100 100 100 100 100 100 Nutrient (calculated) ME (kcal/kg) 2921.13 2921.13 2921.13 2921.13 2921.13 2921.13 CP (%) 15.371 15.371 15.371 15.371 15.371 15.344 Crude Fat (%) 2.761 2.761 2.761 2.761 2.761 4.620 Calcium (%) 2.25 2.50 2.75 3.00 3.25 3.25 NPP (%) 0.25 0.25 0.25 0.25 0.25 0.40
1/ Diet 1 = 2.25Ca: 0.25NPP, Diet 2 = 2.50Ca: 0.25NPP, Diet 3 = 2.75Ca: 0.25NPP, Diet 4 = 3.00Ca: 0.25NPP, Diet 5 = 3.25Ca: 0.25NPP, Diet 6 = 3.25Ca: 0.40NPP
2/ Mineral mixes provided per kilogram of complete diet: Cu, 18 mg; I, 1.1 mg; Fe, 80 mg; Mn, 150 mg; Zn, 125 mg; Se, 0.25 mg.
3/ Vitamin mix provided per kilogram of complete diet: vitamin A, 10,000 IU; vitamin D3, 3,000 IU; vitamin E, 100 IU; vitamin K3, 3 mg; vitamin B12, 0.03 mg; riboflavin, 8 mg; niacin, 60 mg; pantothenic acid, 18 mg; folic acid, 1 mg; pyridoxine HCl, 6 mg; thiamine HCl, 3 mg; biotin, 0.2 mg

Score 1: None or No TRAP
Score 3: Similar toTRAP po
Score 5: Similar toTRAP po
some plate oP positive os
o score 2 buositive osteo
o score4 butositive cells
of medullarysteoclast
ut show someclast
t has higher i
y bone
e small
intensity of
96
ScoreBig pNo TR
ScoreBig csurrou
Figurusing(TRA
e 2: pieces of medRAP positiv
e 4: ells of TRAPund medulla
re 1 Osteoclg tartrate resiAP) staining
dullary boneve osteoclast
P positive osary bone
astic histoloistant acid ph[positive cel
e t
steoclast
ogical score bhosphatase ll = pink, red
by
d]
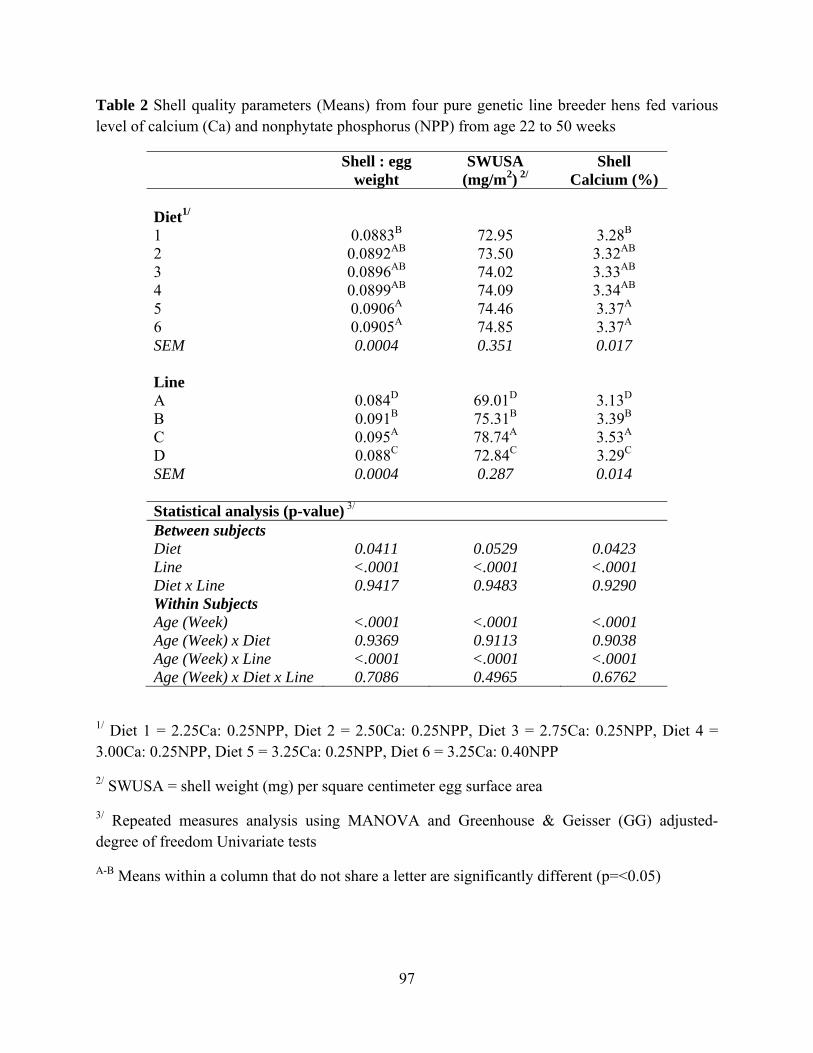
97
Table 2 Shell quality parameters (Means) from four pure genetic line breeder hens fed various level of calcium (Ca) and nonphytate phosphorus (NPP) from age 22 to 50 weeks
Shell : egg weight
SWUSA (mg/m2) 2/
Shell Calcium (%)
Diet1/ 1 0.0883B 72.95 3.28B 2 0.0892AB 73.50 3.32AB 3 0.0896AB 74.02 3.33AB 4 0.0899AB 74.09 3.34AB 5 0.0906A 74.46 3.37A 6 0.0905A 74.85 3.37A SEM 0.0004 0.351 0.017 Line A 0.084D 69.01D 3.13D B 0.091B 75.31B 3.39B C 0.095A 78.74A 3.53A D 0.088C 72.84C 3.29C SEM 0.0004 0.287 0.014 Statistical analysis (p-value) 3/ Between subjects Diet 0.0411 0.0529 0.0423 Line <.0001 <.0001 <.0001 Diet x Line 0.9417 0.9483 0.9290 Within Subjects Age (Week) <.0001 <.0001 <.0001 Age (Week) x Diet 0.9369 0.9113 0.9038 Age (Week) x Line <.0001 <.0001 <.0001 Age (Week) x Diet x Line 0.7086 0.4965 0.6762
1/ Diet 1 = 2.25Ca: 0.25NPP, Diet 2 = 2.50Ca: 0.25NPP, Diet 3 = 2.75Ca: 0.25NPP, Diet 4 = 3.00Ca: 0.25NPP, Diet 5 = 3.25Ca: 0.25NPP, Diet 6 = 3.25Ca: 0.40NPP
2/ SWUSA = shell weight (mg) per square centimeter egg surface area
3/ Repeated measures analysis using MANOVA and Greenhouse & Geisser (GG) adjusted-degree of freedom Univariate tests
A-B Means within a column that do not share a letter are significantly different (p=<0.05)

98
Table 3 Calcium and phosphorus digestibility (Means) from four pure genetic line breeder hens fed various level of calcium (Ca) and nonphytate phosphorus (NPP) from age 22 to 50 weeks
Excreta Ca (%)
Excreta P (%)
Ca digestibility (%)
P digestibility (%)
Diet1/ 1 5.00C 1.27B 47.45 38.46A 2 5.81C 1.25B 42.03 31.83AB 3 7.59B 1.30B 46.24 36.70AB 4 8.23AB 1.36B 47.89 32.90AB 5 9.44A 1.52A 49.63 31.18AB 6 8.89AB 1.59A 42.85 28.28B SEM 0.348 0.037 2.689 2.161 Line A 7.12 1.33 47.35 32.81 B 7.51 1.41 45.66 32.81 C 7.42 1.39 47.67 34.50 D 7.93 1.40 43.38 32.77 SEM 0.284 0.030 2.196 1.765 Statistical analysis (p-value) Diet <.0001 <.0001 0.2843 0.0131 Line 0.2436 0.2020 0.4864 0.8741 Diet x Line 0.1001 0.1319 0.1022 0.1918
1/ Diet 1 = 2.25Ca: 0.25NPP, Diet 2 = 2.50Ca: 0.25NPP, Diet 3 = 2.75Ca: 0.25NPP, Diet 4 = 3.00Ca: 0.25NPP, Diet 5 = 3.25Ca: 0.25NPP, Diet 6 = 3.25Ca: 0.40NPP
A-B Means within a column that do not share a letter are significantly different (p=<0.05)

Figure 2genetic lfrom age2.75Ca: 0.40NPP
2 Bar graph ine breeder e 22 to 50 w0.25NPP, D
P). [A-B Bar d
B
C
(Means ± Shens fed va
weeks; (DieDiet 4 = 3.0diagram that
BB
B
C
SE) of Calciarious level et 1 = 2.25C00Ca: 0.25Ndo not share
A
B
A
AB
99
ium and Phof calcium
Ca: 0.25NPPNPP, Diet 5 e a letter are
A
AB
osphorus in(Ca) and no
P, Diet 2 = = 3.25Ca: significantly
n excreta (%onphytate ph2.50Ca: 0.20.25NPP, D
y different (p
%) from four hosphorus (N25NPP, DietDiet 6 = 3.2p=<0.05)]
r pure NPP) t 3 = 25Ca:

100
Table 4 Body mineral content (Means) from four pure genetic line breeder hens fed various level of calcium (Ca) and nonphytate phosphorus (NPP) from age 22 to 50 weeks
Total Body Mass
(g)
Mineral Mass (g)
Mineral Mass (%)
Tibia Ash (%)
Diet1/ 1 3639.69 110.88C 3.10 57.81 2 3627.35 119.74ABC 3.35 58.71 3 3684.43 114.10BC 3.15 57.83 4 3636.91 113.77BC 3.19 57.47 5 3603.33 122.60AB 3.44 59.06 6 3761.06 125.42A 3.37 58.92 SEM 90.421 2.468 0.080 0.364 Line A 3488.17B 98.69D 2.88C 56.69C B 3824.81A 125.78B 3.34B 58.78B C 3591.08AB 135.64A 3.82A 59.98A D 3731.12AB 110.89C 3.03C 57.76BC SEM 73.828 2.015 0.065 0.297 Statistical analysis (p-value) 2/ Between subjects Diet 0.7638 0.0166 0.1151 0.1278 Line 0.0015 <0.0001 <.0001 <.0001 Diet x Line 0.3610 0.3250 0.8238 0.4432 Within Subjects Age (Week) <0.0001 <0.0001 <.0001 <.0001 Age (Week) x Diet 0.4872 0.3841 0.5018 0.2888 Age (Week) x Line 0.0666 0.0007 0.1690 <.0001 Age (Week) x Diet x Line 0.7730 0.5022 0.7958 0.8330
1/ Diet 1 = 2.25Ca: 0.25NPP, Diet 2 = 2.50Ca: 0.25NPP, Diet 3 = 2.75Ca: 0.25NPP, Diet 4 = 3.00Ca: 0.25NPP, Diet 5 = 3.25Ca: 0.25NPP, Diet 6 = 3.25Ca: 0.40NPP
2/ Repeated measures analysis using MANOVA and Greenhouse & Geisser (GG) adjusted-degree of freedom Univariate tests A-B Means within a column that do not share a letter are significantly different (p=<0.05)

Figure 3(Means±letter are
3 Bar diagr±SE) from fo
significantly
ram comparour genetic y different (p
C
D
re body minline age 22 p=<0.05)]
B
B
101
neral mass to 50 week
(%) and caks. [A-B Bar
A
A
alcium per diagram tha
egg weightat do not sh
C
C
t (%) hare a

102
Table 5 Plasma calcium and phosphorus (Means) in breeder and progeny (Means) from four pure genetic line breeder hens fed various level of calcium (Ca) and nonphytate phosphorus (NPP) from age 22 to 50 weeks
Breeder plasma Ca (mg/dl)
Breeder plasma P (nmol/µl)
Progeny plasma Ca (mg/dl)
Diet1/ 1 23.95 0.094 7.11 2 23.73 0.096 7.40 3 25.72 0.094 7.93 4 26.07 0.094 6.77 5 24.24 0.099 7.80 6 23.75 0.108 7.68 SEM 1.200 0.008 0.533 Line A 21.53B 0.104 7.51AB B 24.77B 0.093 6.45B C 21.63B 0.097 6.93B D 30.38A 0.096 8.90A SEM 0.980 0.006 0.435 Statistical analysis (p-value) Diet 0.5909 0.7719 0.6230 Line <.0001 0.6114 0.0011 Diet x Line 0.5838 0.3868 0.5024
1/ Diet 1 = 2.25Ca: 0.25NPP, Diet 2 = 2.50Ca: 0.25NPP, Diet 3 = 2.75Ca: 0.25NPP, Diet 4 = 3.00Ca: 0.25NPP, Diet 5 = 3.25Ca: 0.25NPP, Diet 6 = 3.25Ca: 0.40NPP
A-B Means within a column that do not share a letter are significantly different (p=<0.05)

Figure 4(Means ±nonphytaDiet 3 = 3.25Ca: 0(p=<0.05
4 Bar diagram±SE) from foate phosphor2.75Ca: 0.250.40NPP). [A
5)].
m compare pour pure genrus (NPP). (B5NPP, Diet 4A-B Bar diagr
plasma calciunetic line breBreeder Diet4 = 3.00Ca: ram that do n
103
um and phoseder hens fet 1 = 2.25Ca0.25NPP, Dnot share a l
AB
B
sphorus in bred various lea: 0.25NPP, DDiet 5 = 3.25Cletter are sign
B
B
reeder and pvel of calciuDiet 2 = 2.5Ca: 0.25NPPnificantly di
B
B
progeny chicum (Ca) and 0Ca: 0.25NPP, Diet 6 = ifferent
A
A
cks
PP,

104
Table 6 Bone homeostasis markers (Means) from four pure genetic line breeder hens fed various level of calcium (Ca) and nonphytate phosphorus (NPP) from age 22 to 50 weeks
BSAP (pg./ml)
TRAP (U) 2/
Bone Osteoclast
Score
FGF23 (pg./ml)
Diet1/ 1 4278.74 16.69 3.11 1862.92A 2 4039.42 16.92 3.32 1079.39B 3 2827.03 17.29 3.39 1331.32AB 4 4195.65 15.83 2.99 1435.29AB 5 4051.76 17.45 3.64 1524.08AB 6 4494.49 17.78 3.54 1369.14AB SEM 732.084 1.765 0.169 163.906 Line A 3644.62 32.53A 3.82 1246.16 B 4299.13 8.38B 2.51 1586.68 C 4519.64 13.07B 3.45 1430.22 D 3461.34 13.99B 3.55 1471.69 SEM 594.409 1.443 0.139 133.634 Statistical analysis (p-value) Diet 0.6755 0.5822 0.5402 0.0418 Line 0.2375 <.0001 0.0652 0.2748 Diet x Line 0.7978 0.7435 0.7065 0.9519
1/ Diet 1 = 2.25Ca: 0.25NPP, Diet 2 = 2.50Ca: 0.25NPP, Diet 3 = 2.75Ca: 0.25NPP, Diet 4 = 3.00Ca: 0.25NPP, Diet 5 = 3.25Ca: 0.25NPP, Diet 6 = 3.25Ca: 0.40NPP
2/ One unit of TRAP activity is defined as the amount of enzyme required to hydrolyze 1 µmol of PNPP per minute at 37 °C in the presence of 40 mmol of sodium L-(+)-tratrate per liter at pH 5.5. A-B Means within a column that do not share a letter are significantly different (p=<0.05)
Abbreviation: BSAP= Bone specific Alkaline phosphatase, TRAP= Tartrate Resistant Acid Phosphatase, Bone Osteoclast Score= osteoclastic histological score by using TRAP staining, FGF23= Fibroblast Growth Factor 23

Figure 5genetic l(Breeder 4 = 3.00C
5 Bar diagrine breeder Diet 1 = 2.2
Ca: 0.25NPP
am of bonehens fed va
25Ca: 0.25NP, Diet 5 = 3
e specific alarious level NPP, Diet 2 =.25Ca: 0.25N
105
lkaline phosof calcium (= 2.50Ca: 0.NPP, Diet 6
sphatase (B(Ca) and no.25NPP, Die= 3.25Ca: 0
AP; Means onphytate phet 3 = 2.75C0.40NPP)
±SE) four hosphorus (N
Ca: 0.25NPP,
pure NPP). , Diet
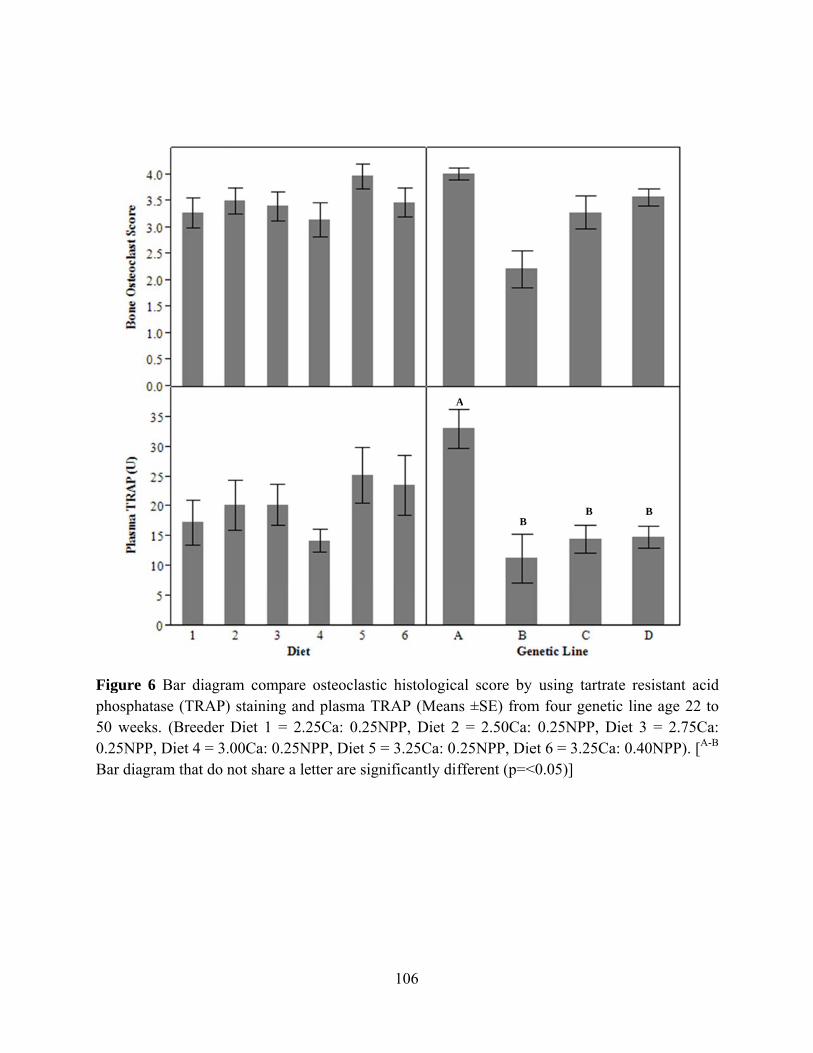
Figure 6phosphat50 week0.25NPPBar diagr
6 Bar diagratase (TRAP)s. (Breeder
P, Diet 4 = 3.ram that do n
am compare) staining anDiet 1 = 2.
.00Ca: 0.25Nnot share a l
e osteoclastind plasma T.25Ca: 0.25NNPP, Diet 5 etter are sign
106
c histologicRAP (MeanNPP, Diet 2= 3.25Ca: 0nificantly di
A
cal score by ns ±SE) from2 = 2.50Ca: .25NPP, Diefferent (p=<
B
A
using tartram four genet
0.25NPP, Det 6 = 3.25C<0.05)]
B
ate resistanttic line age Diet 3 = 2.7a: 0.40NPP)
B
t acid 22 to
75Ca: ). [A-B

Figure 7line breeDiet 1 =3.00Ca: 0do not sh
7 Bar diagramder hens fed
= 2.25Ca: 0.0.25NPP, D
hare a letter a
A
m show Fibrd various lev25NPP, Dieiet 5 = 3.25Care significan
B
AB
roblast growvel of calciuet 2 = 2.50CCa: 0.25NPPntly differen
AB AB
107
wth factor 23um (Ca) and Ca: 0.25NPPP, Diet 6 = 3nt (p=<0.05)
AB
3 (FGF23; Mnonphytate
P, Diet 3 = 3.25Ca: 0.40].
Means ±SE) phosphorus2.75Ca: 0.2
0NPP). [A-B
four pure ges (NPP). (Br25NPP, DietBar diagram
enetic eeder t 4 =
m that

Figure 8treatment
8 Bar diagrat group.
am compare Fibroblast g
108
growth factoor 23 (FGF223) and Ca:PP ratio in di
ietary

109
Table 7 Tibia ash in day-0 chicks and body mineral content (Means) in 14-day-old chicks fed with commercial starter diet from four pure genetic line breeder hens fed various level of calcium (Ca) and nonphytate phosphorus (NPP) from age 22 to 50 weeks
Day-0-Tibia Ash (%)
Total body Mass
(g)
Mineral Mass (%)
Diet1/ 1 30.50 326.27 2.54 2 30.21 318.24 2.61 3 30.37 334.36 2.61 4 30.31 331.89 2.53 5 30.07 334.16 2.54 6 30.23 329.29 2.55 SEM 0.269 5.272 0.032 Line A 29.91B 329.96B 2.45C B 30.96A 366.35A 2.59B C 29.55B 327.42B 2.72A D 30.71A 292.42C 2.49BC SEM 0.221 4.302 0.032 Statistical analysis (p-value) Diet 0.9333 0.3122 0.3274 Line <.0001 <.0001 <.0001 Diet x Line N/A2/ 0.8931 0.6082
1/ Diet 1 = 2.25Ca: 0.25NPP, Diet 2 = 2.50Ca: 0.25NPP, Diet 3 = 2.75Ca: 0.25NPP, Diet 4 = 3.00Ca: 0.25NPP, Diet 5 = 3.25Ca: 0.25NPP, Diet 6 = 3.25Ca: 0.40NPP
2/ Missing data
A-B Means within a column that do not share a letter are significantly different (p=<0.05)

Figure 9breeder h1 = 2.25C0.25NPPshare a le
9 Bar diagramhens fed variCa: 0.25NPP
P, Diet 5 = 3etter are sign
m show tibiious level ofP, Diet 2 = 3.25Ca: 0.25nificantly dif
ia ash (Meanf calcium (C2.50Ca: 0.2
5NPP, Diet 6fferent (p=<0
110
ns ±SD) of dCa) and nonp5NPP, Diet 6 = 3.25Ca: 0.05)].
B
day-0 chicksphytate phos3 = 2.75Ca0.40NPP),
B A
s from four sphorus (NPPa: 0.25NPP, [A-B Bar dia
B
pure geneticP). (BreederDiet 4 = 3.0
agram that d
A
c line r Diet 00Ca: do not

Figure 1pure gen(NPP). (0.25NPPBar diagr
10 Bar diagranetic line br(Breeder DieP, Diet 4 = 3.ram that do n
am show boeeder hens et 1 = 2.25.00Ca: 0.25Nnot share a l
dy mineral cfed various
5Ca: 0.25NPNPP, Diet 5 etter are sign
111
content (Mealevel of ca
PP, Diet 2 = 3.25Ca: 0nificantly di
B
C
ans ±SE) of alcium (Ca) = 2.50Ca: 0.25NPP, Diefferent (p=<
A
B
f 14-day-old and nonphy
0.25NPP, Det 6 = 3.25C<0.05)].
B
A
chicks fromytate phosph
Diet 3 = 2.7a: 0.40NPP)
C
BC
m four horus 75Ca: ). [A-B

112
Table 8 Calcium and Phosphorus excretion (Means) in 14-day-old chicks fed with commercial starter diet from four pure genetic line breeder hens fed various level of calcium (Ca) and nonphytate phosphorus (NPP) from age 22 to 50 weeks
Excreta Ca (%)
Excreta P (%)
Diet1/ 1 2.70 1.30 2 2.61 1.22 3 2.50 1.19 4 2.62 1.25 5 2.77 1.33 6 2.75 1.41 SEM 0.097 0.054 Line A 3.22A 1.41B B 2.18B 1.19C C 1.87C 1.00D D 3.35A 1.53A SEM 0.047 0.020 Statistical analysis (p-value) Diet 0.2254 <.1511 Line <.0001 <.0001 Diet x Line 0.1587 <.1201
1/ Diet 1 = 2.25Ca: 0.25NPP, Diet 2 = 2.50Ca: 0.25NPP, Diet 3 = 2.75Ca: 0.25NPP, Diet 4 = 3.00Ca: 0.25NPP, Diet 5 = 3.25Ca: 0.25NPP, Diet 6 = 3.25Ca: 0.40NPP
A-B Means within a column that do not share a letter are significantly different (p=<0.05)

Figure 1chicks feof calciu2.25Ca: 0.25NPPshare a le
11 Bar diaged with commum (Ca) and
0.25NPP, DP, Diet 5 = 3etter are sign
ram show cmercial startnonphytate
Diet 2 = 2.53.25Ca: 0.25nificantly dif
calcium andter diet from phosphorus
50Ca: 0.25N5NPP, Diet 6fferent (p=<0
113
d phosphorusfour pure ge (NPP) from
NPP, Diet 3 6 = 3.25Ca: 0.05)]
A
s excretion enetic line b
m age 22 to = 2.75Ca: 0.40NPP).
B
A
C
B
(Means± SEbreeder hens 50 weeks. (0.25NPP, D[A-B Bar dia
C
D
E) in 14-dafed various Breeder Die
Diet 4 = 3.0agram that d
A
A
ay-old level
et 1 = 00Ca: do not

114
Table 9 Bone homeostasis markers (Means) in 14-day-old chicks from four pure genetic line breeder hens fed various level of calcium (Ca) and nonphytate phosphorus (NPP) from age 22 to 50 weeks
BSAP (pg./ml)
TRAP (U)
FGF23 (pg./ml)
Diet1/ 1 208.20 6.24 826.27 2 233.34 6.40 861.26 3 198.31 6.25 880.00 4 226.39 6.34 963.46 5 172.48 6.06 874.57 6 207.06 7.01 746.67 SEM 25.417 0.258 69.514 Line A 205.90 6.82A 920.73A B 220.19 5.39B 751.78B C 238.25 5.94B 803.44AB D 166.19 7.38A 958.88A SEM 23.773 0.213 56.722 Statistical analysis (p-value) Diet 0.6100 0.2716 0.4087 Line 0.0915 <.0001 0.0371 Diet x Line 0.1659 0.4181 0.4194
1/ Diet 1 = 2.25Ca: 0.25NPP, Diet 2 = 2.50Ca: 0.25NPP, Diet 3 = 2.75Ca: 0.25NPP, Diet 4 = 3.00Ca: 0.25NPP, Diet 5 = 3.25Ca: 0.25NPP, Diet 6 = 3.25Ca: 0.40NPP
A-B Means within a column that do not share a letter are significantly different (p=<0.05)
Abbreviation: BSAP= Bone specific Alkaline phosphatase, TRAP= Tartrate Resistant Acid Phosphatase, FGF23= Fibroblast Growth Factor 23.
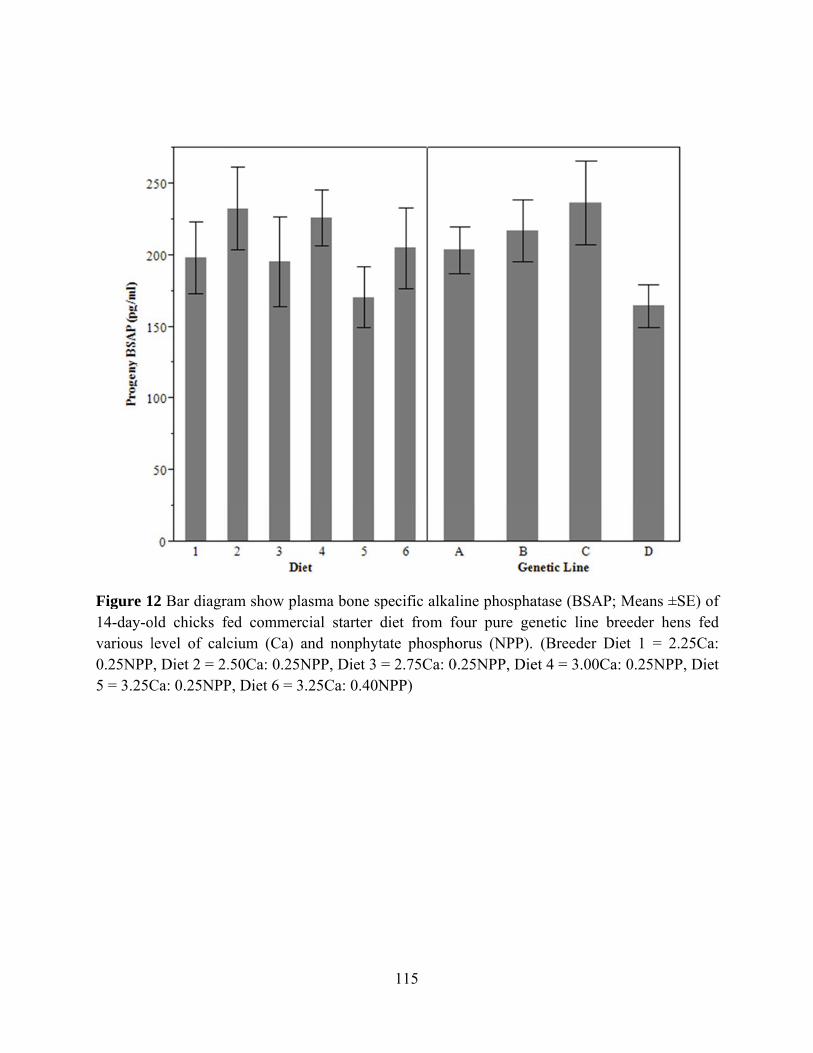
Figure 114-day-ovarious l0.25NPP5 = 3.25C
12 Bar diagraold chicks felevel of calc
P, Diet 2 = 2.Ca: 0.25NPP
am show plafed commerccium (Ca) a.50Ca: 0.25NP, Diet 6 = 3
asma bone spcial starter and nonphytNPP, Diet 3 .25Ca: 0.40N
115
pecific alkaldiet from fotate phospho= 2.75Ca: 0NPP)
line phosphafour pure georus (NPP).
0.25NPP, Die
atase (BSAPenetic line b (Breeder Det 4 = 3.00C
P; Means ±Sbreeder henDiet 1 = 2.2Ca: 0.25NPP,
SE) of ns fed 25Ca: , Diet
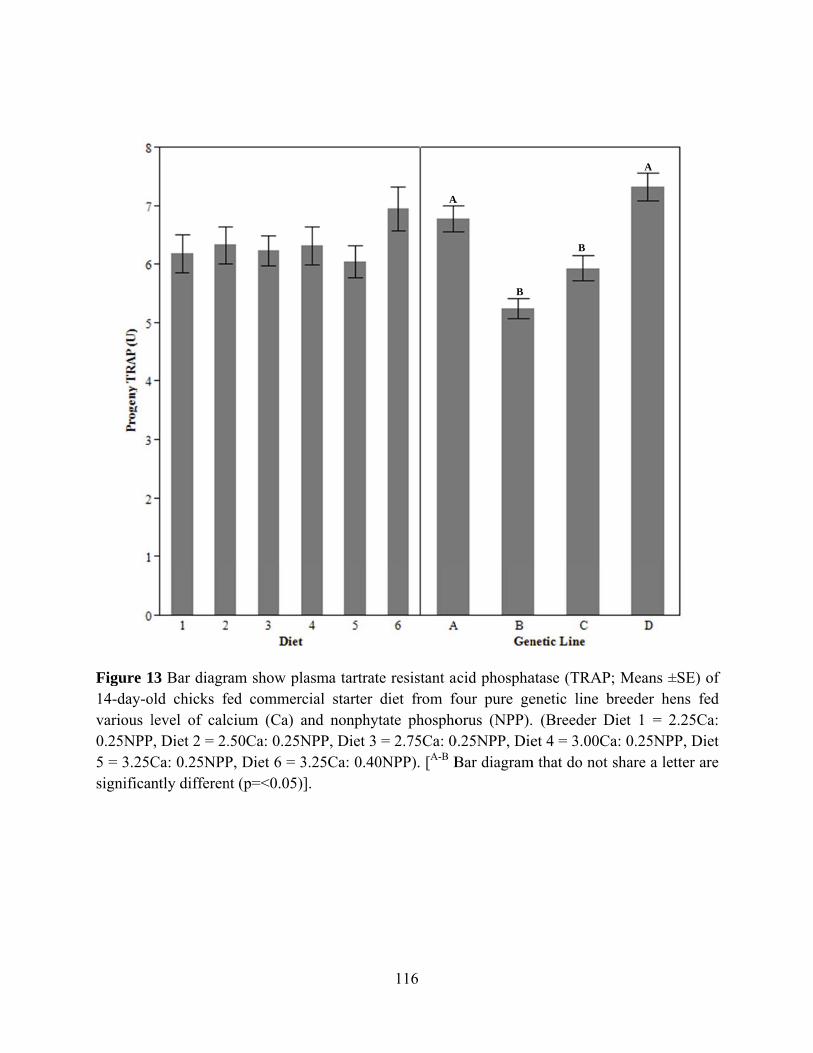
Figure 114-day-ovarious l0.25NPP5 = 3.25Csignifican
13 Bar diagrold chicks felevel of calc
P, Diet 2 = 2.Ca: 0.25NPPntly differen
am show plafed commerccium (Ca) a.50Ca: 0.25NP, Diet 6 = 3nt (p=<0.05)]
asma tartratecial starter and nonphytNPP, Diet 3 3.25Ca: 0.40].
116
e resistant adiet from fotate phospho= 2.75Ca: 0
0NPP). [A-B B
A
acid phosphafour pure georus (NPP).
0.25NPP, DieBar diagram
B
A
atase (TRAPenetic line b (Breeder Det 4 = 3.00C
m that do not
B
P; Means ±Sbreeder henDiet 1 = 2.2Ca: 0.25NPP,
share a lette
A
SE) of ns fed 25Ca: , Diet er are

Figure 1day-old clevel of Diet 2 =3.25Ca: significan
14 Bar diagrchicks fed ccalcium (Ca
= 2.50Ca: 0.0.25NPP, Dntly differen
ram show plommercial s
a) and nonph25NPP, Die
Diet 6 = 3.25nt (p=<0.05)]
lasma fibrobstarter diet fhytate phospet 3 = 2.75C5Ca: 0.40NP].
117
blast growthfrom four puphorus (NPPCa: 0.25NPPPP). [A-B Ba
h factor 23 (ure genetic lP). (BreederP, Diet 4 = ar diagram t
B
A
(FGF23; Meline breeder r Diet 1 = 2
3.00Ca: 0.2that do not s
AB
eans ±SE) ohens fed va
2.25Ca: 0.2525NPP, Dietshare a lette
A
of 14-arious NPP, t 5 = er are
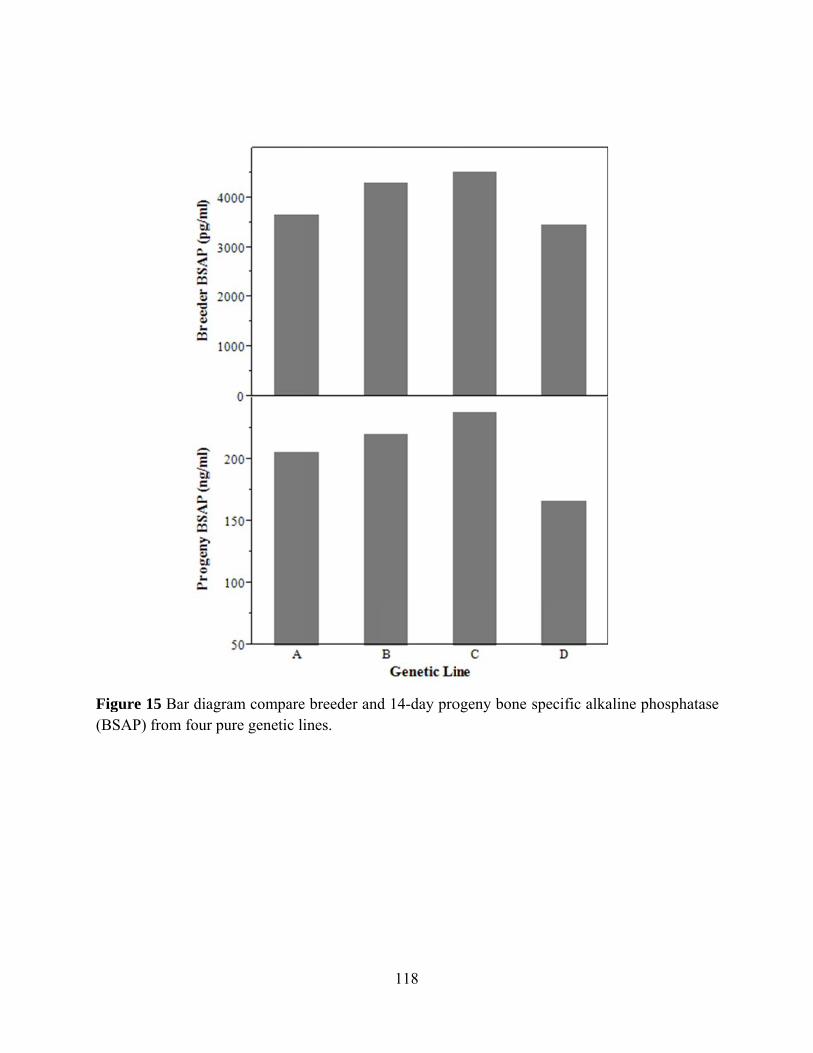
Figure 1(BSAP) f
15 Bar diagrafrom four pu
am compareure genetic li
e breeder andines.
118
d 14-day proogeny bone sspecific alka
aline phosphhatase

Figure 1day chick
16 Bar diagrak mineral ma
am of Breedass (Means)
C
B
C
D
der mineral mfrom four p
B
A
B
B
119
mass, % sheure genetic l
ell calcium, dlines.
A
B
A
A
day-0 chick
BC
A
C
C
tibia ash annd 14-
120
V. REFERENCES
Ahmadi H and Rodehutscord M. 2012. A meta-analysis of responses to dietary nonphytate phosphorus and phytase in laying hens. Poultry Science 91(8):2072-8.
Ahn DU, Kim SM, Shu H. 1997. Effect of egg size and strain and age of hens on the solids content of chicken eggs. Poult Sci 76(6):914-9.
Aitken RNC. 1971. The oviduct. Bell DJ and Freeman BM, editors. In: Physiology and biochemistry of the domestic fowl. 1st ed. New York: Academic Press, INC. 1237 p.
Applegate TJ, Harper D, Lilburn MS. 1998. Effect of hen production age on egg composition and embryo development in commercial pekin ducks. Poult Sci 77(11):1608-12.
ASBMR. 2012. Pre-meeing workshop on techniques in bond and muscle biology, tartrate resistant acid phosphatase (TRAP) stain. 24.
Asmundson VS and Baker GA. 1940. Percentage shell as a function of shell thickness, egg volume, and egg shape. Poult Sci 19:227-32.
Asmundson VS and Burmester BR. 1936. The secretory activity of the parts of the hen's oviduct. J Exp Zool 72(2):225-46.
Bar A, Razaphkovsky V, Vax E. 2002. Re-evaluation of calcium and phosphorus requirements in aged laying hens. Br Poult Sci 43:261-9.
Bar A and Hurwitz S. 1973. Uterine calcium-binding protein in the laying fowl. Comparative Biochemistry and Physiology Part A: Physiology 45(2):579,580, IN13, 581-586.
Boorman KN and Gunaratne SP. 2001. Dietary phosphorus supply, egg-shell deposition and plasma inorganic phosphorus in laying hens. Br Poult Sci 42(1):81-91.
Boyce B. 2013 TRAP stain for paraffin sections,center for musculoskeletal research, university of rochester medical center. <http://www.urmc.rochester.edu/musculoskeletal-research/core-services/histology/documents/TRAP_Stain_forParaffin_Sections.pdf;>. Accessed 2013 .
Burke WH. 1984. Avian reproduction. Dukes HH and Swenson MJ, editors. In: Dukes' physiology of domestic animals. Ithaca, N.Y. : Comstock Pub. Associates, 1984. 847 p.
Buss EG and Guyer RB. 1984. Bone parameters of thick and thin eggshell lines of chickens. Comparative Biochemistry and Physiology Part A: Physiology 78(3):449-52.

121
Candlish J and Taylor T. 1970. The response-time to the parathyroid hormone in the laying fowl. J Endocrinol 48(1):143-4.
Carlberg C. 1999. Lipid soluble vitamins in gene regulation. Biofactors 10(2-3):91-7.
Çelebi S and Bölükbasi SC. 2005. The influence of dietary phosphorus level on plasma calcium and phosphorus, eggshell calcium and phosphorus. International Journal of Poultry Science 4(7):497-9.
Conrad RM and Phillips RE. 1938. The formation of the chalazae and inner thin white in the hen's egg. Poult Sci 17:143-146.
Crenshaw T, Rortvedt L, Hassen Z. 2011. A novel pathway for vitamin D mediated phosphate homeostasis: Implications for skeleton growth and mineralization. J Anim Sci .
Currie WB. 1988. Reproduction in the chicken. In: Structure and function of domestic animal. Boston: Butterworths. 376 p.
Dacke CG, Ancill AK, Whitaker G, Bascal Z. 1993a. Calcitrophic peptides and rapid calcium fluxes into chick bone. Sharp PJ, editor. In: Avian endocrinology. Bristol: Society for Endocrinology. 239 p.
Dacke C, Arkle S, Cook D, Wormstone I, Jones S, Zaidi M, Bascal Z. 1993b. Medullary bone and avian calcium regulation. J Exp Biol 184(1):63-88.
Diamon V. 2013 Innovations in eggshell quality evaluation. <http://www.thepoultrysite.com/poultrynews/28508/innovations-in-eggshell-quality-evaluation>. Accessed 2013 11/05.
Donovan EW, Boone MA, Turk DE. 1969. The travel and residence of spermatozoa in the oviduct of the gallus domesticus. Poult Sci 48(1):176-81.
Ekmay R and Coon C. 2011. An examination of the P requirements of broiler breeders for performance, progeny quality and P balance 2. ca particle size. International Journal of Poultry Science 10(10):760-5.
Ekmay R and Coon C. 2010. The effect of limestone particle size on the performance of three broiler breeder purelines. International Journal of Poultry Science 9(11):1038-42.
England J, Salas C, Ekmay R, Coon C, Murali N, Kumar-Phillips G, Rath N, Marcy J, Slavik M, Kwari I. 2012. Dual energy X-ray absorptiometry analysis of broiler breeder eggs for prediction of egg components and evaluation of egg shell quality. International Journal of Poultry Science 11(5):316-25.
Fisher C. 1983. Egg production. Rook JAF and Thomas PC, editors. In: Nutritional physiology of farm animals. New York: Longman Inc. 623 p.
122
Fleming R, McCormack H, Whitehead C. 1998. Bone structure and strength at different ages in laying hens and effects of dietary particulate limestone, vitamin K and ascorbic acid. Br Poult Sci 39(3):434-40.
Garlich J, Brake J, Parkhurst C, Thaxton J, Morgan G. 1984. Physiological profile of caged layers during one production year, molt, and postmolt: Egg production, egg shell quality, liver, femur, and blood parameters. Poultry Science 63(2):339-43.
Garnero P and Delmas PD. 1993. Assessment of the serum levels of bone alkaline phosphatase with a new immunoradiometric assay in patients with metabolic bone disease. Journal of Clinical Endocrinology & Metabolism 77(4):1046-53.
Gerber N. 2006. Factors affecting egg quaslity in the commercial laying hen: A review. Egg Producers Federations of New Zealand (Lnc)/Poultry Industry Association of New Zealand 96D Carlton Gore Road, New Market 1023.
Gilbert AB. 1971a. The ovary. Bell DJ and Freeman BM, editors. In: Physiology and biochemistry of the domestic fowl. 1st ed. New York: Academic Press, INC. 1163 p.
Gilbert AB. 1971b. Egg albumen and its formation. Bell DJ and Freeman BM, editors. In: Physiology and biochemistry of the domestic fowl. 1st ed. New York: Academic Press, INC. 1291 p.
Gilbert AB and Pearson RA. 1983. Egg formation in poultry. Rook JAF and Thomas PC, editors. In: Nutritional physiology of farm animal. 1st ed. New York: Longman Inc. 243 p.
Gilbert AB. 1980. Poultry. Hafez ESE, editor. In: Reproduction in farm animals. 4th ed. -- ed. Philadelphia : Lea & Febiger, 1980. 423 p.
Guinotte F and Nys Y. 1991. Effects of particle size and origin of calcium sources on eggshell quality and bone mineralization in egg laying hens. Poult Sci 70(3):583-92.
Halleen JM, Alatalo SL, Suominen H, Cheng S, Janckila AJ, Väänänen HK. 2000. Tartrate‐resistant acid phosphatase 5b: A novel serum marker of bone resorption. Journal of Bone and Mineral Research 15(7):1337-45.
Halleen JM, Räisänen S, Salo JJ, Reddy SV, Roodman GD, Hentunen TA, Lehenkari PP, Kaija H, Vihko P, Väänänen HK. 1999. Intracellular fragmentation of bone resorption products by reactive oxygen species generated by osteoclastic tartrate-resistant acid phosphatase. J Biol Chem 274(33):22907-10.
Haussler MR. 1986. Vitamin D receptors: Nature and function. Annu Rev Nutr 6:527-62.
Hessle L, Johnson KA, Anderson HC, Narisawa S, Sali A, Goding JW, Terkeltaub R, Millán JL. 2002. Tissue-nonspecific alkaline phosphatase and plasma cell membrane glycoprotein-1
123
are central antagonistic regulators of bone mineralization. Proceedings of the National Academy of Sciences 99(14):9445-9.
Hollberg K, Hultenby K, Hayman AR, Cox TM, Andersson G. 2002. Osteoclasts from mice deficient in tartrate-resistant acid phosphatase have altered ruffled borders and disturbed intracellular vesicular transport. Exp Cell Res 279(2):227-38.
Hori M, Shimizu Y, Fukumoto S. 2011. Minireview: Fibroblast growth factor 23 in phosphate homeostasis and bone metabolism. Endocrinology 152(1):4-10.
Howard AD, Berger J, Gerber L, Familletti P, Udenfriend S. 1987. Characterization of the phosphatidylinositol-glycan membrane anchor of human placental alkaline phosphatase. Proceedings of the National Academy of Sciences 84(17):6055-9.
Hunton P. 2005. Research on eggshell structure and quality: An historical overview. Revista Brasileira De Ciência Avícola 7(2):67-71.
Hurwitz S and Griminger P. 1961. The response of plasma alkaline phosphatase, parathyroids and blood and bone minerals to calcium intake in the fowl. J Nutr 73:177-85.
Karsdal MA, Henriksen K, Sørensen MG, Gram J, Schaller S, Dziegiel MH, Heegaard A, Christophersen P, Martin TJ, Christiansen C. 2005. Acidification of the osteoclastic resorption compartment provides insight into the coupling of bone formation to bone resorption. The American Journal of Pathology 166(2):467-76.
Keshavarz K. 2003a. A comparison between cholecalciferol and 25-OH-cholecalciferol on performance and eggshell quality of hens fed different levels of calcium and phosphorus. Poultry Science 82(9):1415-22.
Keshavarz K. 2003b. The effect of different levels of nonphytate phosphorus with and without phytase on the performance of four strains of laying hens. Poultry Science 82(1):71-91.
Keshavarz K. 2000. Nonphytate phosphorus requirement of laying hens with and without phytase on a phase feeding program. Poultry Science 79(5):748-63.
Keshavarz K and Nakajima S. 1993. Re-evaluation of calcium and phosphorus requirements of laying hens for optimum performance and eggshell quality. Poultry Science 72(1):144-53.
Keshavarz K, Scott ML, Blanchard J. 1993. The effect of solubility and particle size of calcium sources on shell quality and bone mineralization. The Journal of Applied Poultry Research 2(3):259-67.
King AS. 1975. Aves urogenital system. Getty R, editor. In: Sisson and grossman's the anatomy of the domestic animals. Philadelphia: Saunders. 1919-1964 p.

124
Kolek OI, Hines ER, Jones MD, LeSueur LK, Lipko MA, Kiela PR, Collins JF, Haussler MR, Ghishan FK. 2005. 1α, 25-dihydroxyvitamin D3 upregulates FGF23 gene expression in bone: The final link in a renal-gastrointestinal-skeletal axis that controls phosphate transport. American Journal of Physiology-Gastrointestinal and Liver Physiology 289(6):G1036-42.
Lam W, Eastlund DT, Li C, Yam LT. 1978. Biochemical properties of tartrate-resistant acid phosphatase in serum of adults and children. Clin Chem 24(7):1105-8.
Lau K, Onishi T, Wergedal J, Singer F, Baylink D. 1987. Characterization and assay of tartrate-resistant acid phosphatase activity in serum: Potential use to assess bone resorption. Clin Chem 33(4):458-62.
Leske K and Coon C. 2002. The development of feedstuff retainable phosphorus values for broilers. Poult Sci 81(11):1681-93.
Leung K, Fung K, Sher A, Li C, Lee K. 1993. Plasma bone-specific alkaline phosphatase as an indicator of osteoblastic activity. Journal of Bone & Joint Surgery, British Volume 75-B(2):288-92.
Li C, Yam L, Lam K. 1970. Acid phosphatase isoenzyme in human leukocytes in normal and pathologic conditions. Journal of Histochemistry & Cytochemistry 18(7):473-81.
Lichovnikova M. 2007. The effect of dietary calcium source, concentration and particle size on calcium retention, eggshell quality and overall calcium requirement in laying hens. Br Poult Sci 48(1):71-5.
Lips P. 2006. Vitamin D physiology. Prog Biophys Mol Biol 92(1):4-8.
Lofts B and Murton R, K. 1973. Reproduction in birds. Farber D, S. and King J, R., editors. In: Avian biology. 1st ed. New York: Academic Press, INC. 1 p.
Lyubimova N, Pashkov M, Tyulyandin S, Goldberg V, Kushlinskii N. 2004. Tartrate-resistant acid phosphatase as a marker of bone metastases in patients with breast cancer and prostate cancer. Bull Exp Biol Med 138(1):77-9.
McIndoe WM. 1971. Yolk synthesis. Bell DJ and Freeman BM, editors. In: Physiology and biochemistry of the domestic fowl. 1st ed. New York: Academic Press, INC. 1209 p.
Miller SC. 1977. Osteoclast cell-surface changes during the egg-laying cycle in japanese quail. J Cell Biol 75(1):104-18.
Minkin C. 1982. Bone acid phosphatase: Tartrate-resistant acid phosphatase as a marker of osteoclast function. Calcif Tissue Int 34(1):285-90.
125
Mirams M, Robinson BG, Mason RS, Nelson AE. 2004. Bone as a source of FGF23: Regulation by phosphate? Bone 35(5):1192-9.
Narvaez-Solarte W, Rostagno HS, Soares PR, Uribe-Velasquez LF, Silva MA. 2006. Nutritional requirement of calcium in white laying hens from 46 to 62 wk of age. International Journal of Poultry Science 5(2):181-4.
Nesbitt SA and Horton MA. 1997. Trafficking of matrix collagens through bone-resorbing osteoclasts. Science 276(5310):266-9.
Novo RP, Gama LT, Soares MC. 1997. Effects of oviposition time, hen age, and extra dietary calcium on egg characteristics and hatchability. The Journal of Applied Poultry Research 6(3):335-43.
NRC, editor. 1994. Nutrient requirement of poultry. 9th ed. Washington, DC: National Academy Press. 173 p.
Nys Y, Mayel-Afshar S, Bouillon R, Van Baelen H, Lawson DEM. 1989. Increases in calbindin D 28K mRNA in the uterus of the domestic fowl induced by sexual maturity and shell formation. Gen Comp Endocrinol 76(2):322-9.
Nys Y, Gautron J, Garcia-Ruiz JM, Hincke MT. 2004. Avian eggshell mineralization: Biochemical and functional characterization of matrix proteins. Comptes Rendus Palevol 3(6–7):549-62.
Pandalai S and Gay CV. 1990. Effects of parathyroid hormone, calcitonin, and dibutyryl‐cyclic AMP on osteoclast area in cultured chick tibia. Journal of Bone and Mineral Research 5(7):701-5.
Pastore SM, Gomes PC, Rostagno HS, Albino LFT, Calderano AA, Vellasco CR, Viana GdS, Almeida RLd. 2012. Calcium levels and calcium: Available phosphorus ratios in diets for white egg layers from 42 to 58 weeks of age. Revista Brasileira De Zootecnia 41(12):2424-32.
Pelicia K, Garcia E, Faitarone A, Silva A, Berto D, Molino A, Vercese F. 2009. Calcium and available phosphorus levels for laying hens in second production cycle. Revista Brasileira De Ciência Avícola 11(1):39-49.
Rama Rao SV, Panda AK, Raju MVLN, Shyam Sunder G, Praharaj NK. 2003. Requirement of calcium for commercial broilers and white leghorn layers at low dietary phosphorus levels. Anim Feed Sci Technol 106(1–4):199-208.
Rissanen JP, Suominen MI, Peng Z, Halleen JM. 2008. Secreted tartrate-resistant acid phosphatase 5b is a marker of osteoclast number in human osteoclast cultures and the rat ovariectomy model. Calcif Tissue Int 82(2):108-15.
126
Roland DA. 1988. Research note: Egg shell problems: Estimates of incidence and economic impact. Poultry Science 67(12):1801-3.
Safaa HM, Serrano MP, Valencia DG, Frikha M, Jiménez-Moreno E, Mateos GG. 2008. Productive performance and egg quality of brown egg-laying hens in the late phase of production as influenced by level and source of calcium in the diet. Poultry Science 87(10):2043-51.
Saito H, Maeda A, Ohtomo S, Hirata M, Kusano K, Kato S, Ogata E, Segawa H, Miyamoto K, Fukushima N. 2005. Circulating FGF-23 is regulated by 1a,25-dihydroxyvitamin D3 and phosphorus in vivo. Journal of Biological Chemistry 280(4):2543-9.
Saito T and Fukumoto S. 2009. Fibroblast growth factor 23 (FGF23) and disorders of phosphate metabolism. Int J Pediatr Endocrinol 2009:496514.
Salas C, Ekmay R, England J, Cerrate S, Coon C. 2012. Determination of chicken body composition measured by dual energy X-ray absorptiometry. International Journal of Poultry Science 11(7):462-8.
Sawyer A, Lott P, Titrud J, McDonald J. 2003. Quantification of tartrate resistant acid phosphatase distribution in mouse tibiae using image analysis. Biotechnic & Histochemistry 78(5):271-8.
Scheideler SE. 1998. Eggshell calcium effects on egg quality and ca digestibility in first- or third-cycle laying hens. The Journal of Applied Poultry Research 7(1):69-74.
Scott T, Kampen R, Silversides F. 1999. The effect of phosphorus, phytase enzyme, and calcium on the performance of layers fed corn-based diets. Poultry Science 78(12):1742-9.
Segawa H, Onitsuka A, Furutani J, Kaneko I, Aranami F, Matsumoto N, Tomoe Y, Kuwahata M, Ito M, Matsumoto M, and others. 2009. Npt2a and Npt2c in mice play distinct and synergistic roles in inorganic phosphate metabolism and skeletal development. American Journal of Physiology - Renal Physiology 297(3):F671-8.
Shimada T, Hasegawa H, Yamazaki Y, Muto T, Hino R, Takeuchi Y, Fujita T, Nakahara K, Fukumoto S, Yamashita T. 2004. FGF-23 is a potent regulator of vitamin D metabolism and phosphate homeostasis. J Bone Miner Res 19(3):429-35.
Shimada T, Yamazaki Y, Takahashi M, Hasegawa H, Urakawa I, Oshima T, Ono K, Kakitani M, Tomizuka K, Fujita T, and others. 2005. Vitamin D receptor-independent FGF23 actions in regulating phosphate and vitamin D metabolism. American Journal of Physiology - Renal Physiology 289(5):F1088-95.
Silver J and Naveh-Many T. 2009. Phosphate and the parathyroid. Kidney Int 75(9):898-905.

127
Simkiss K and Taylor TG. 1971. Shell formation. Bell DJ and Freeman BM, editors. In: Physiology and biochemistry of the domestic fowl. 1st ed. New York: Academic Press, INC. 1331 p.
Solomon SE. 1983. Oviduct. Freeman BM, editor. In: Physiology and biochemistry of the domestic fowl. 1st ed. New York: Academic Press, INC. 379 p.
Squires EJ. 2003. Endocrine effects on animal products. In: Applied animal endocrinology. Wallingford, Oxon; Cambridge, MA: CABI Pub. 136 p.
Stilborn HL and Waldroup PW. 1990. An evaluation of low-energy feedstuffs in diets for laying hens. Anim Feed Sci Technol 27(4):327-39.
Stipanuk MH,. 2006. Biochemical and physiological aspects of human nutrition. Philadelphia, Pa.; Edinburgh: Elsevier Saunders.
Suda T, Nakamura I, Jimi E, Takahashi N. Regulation of osteoclast function. - Journal of Bone and Mineral Research (6):869.
Summers JD, Grandhi R, Leeson S. 1976. Calcium and phosphorus requirements of the laying hen. Poultry Science 55(1):402-13.
Turner AS, Alvis M, Myers W, Stevens ML, Lundy MW. 1995. Changes in bone mineral density and bone-specific alkaline phosphatase in ovariectomized ewes. Bone 17(4, Supplement):S395-402.
Vaananen HK, Zhao H, Mulari M, Halleen JM. 2000. The cell biology of osteoclast function. Journal of Cell Science 113(3):377-81.
Van de Velde J, Vermeiden J, Touw J, Veldhuijzen J. 1984. Changes in activity of chicken medullary bone cell populations in relation to the egg-laying cycle. Metabolic Bone Disease and Related Research 5(4):191-3.
Van Keulen J and Young B. 1977. Evaluation of acid-insoluble ash as a natural marker in ruminant digestibility studies. J Anim Sci 44(2):282-7.
Weiss MJ, Henthorn PS, Lafferty MA, Slaughter C, Raducha M, Harris H. 1986. Isolation and characterization of a cDNA encoding a human liver/bone/kidney-type alkaline phosphatase. Proceedings of the National Academy of Sciences 83(19):7182-6.
Williams J. 1962. A comparison of conalbumin and transferrin in the domestic fowl. Biochem J 83:355-64.
Winter H. 1958. PERSISTENT RIGHT OVIDUCTS IN FOWLS INCLUDING AN ACCOUNT OF THE HISTOLOGY OF THE FOWL'S NORMAL OVIDUCT. Aust Vet J 34(5):140-7.

128
Wyburn GM, Johnston HS, Draper MH, Davidson MF. 1970. The fine structure of the infundibulum and magnum of the oviduct of gallus domesticus. Experimental Physiology 55(3):213-32.
Yam L, Li C, Lam K. 1971. Tartrate-resistant acid phosphatase isoenzyme in the reticulum cells of leukemic reticuloendotheliosis. N Engl J Med 284(7):357-60.
Yaziji H, Janckila AJ, Lear SC, Martin AW, Yam LT. 1995. Immunohistochemical detection of tartrate-resistant acid phosphatase in non-hematopoietic human tissues. Am J Clin Pathol 104(4):397-402.
Yosefi S, Braw-Tal R, Bar A. 2003. Intestinal and eggshell calbindin, and bone ash of laying hens as influenced by age and molting. Comparative Biochemistry and Physiology Part A: Molecular & Integrative Physiology 136(3):673-82.
Zhang B and Coon C. 1997. The relationship of calcium intake, source, size, solubility in vitro and in vivo, and gizzard limestone retention in laying hens. Poultry Science 76(12):1702-6.

129
VI. APPENDIX