The effect of boundary conditions on the polymerization ... · The Effect of Boundary Conditions on...
154
The Effect of Boundary Conditions on the Polymerization Shrinkage Vectors of Light-Cured Dental Resin Composites vorgelegt von Dalia Adel Mahmoud Kaisarly 2014
Transcript of The effect of boundary conditions on the polymerization ... · The Effect of Boundary Conditions on...

The Effect of Boundary Conditions on the
Polymerization Shrinkage Vectors of Light-Cured
Dental Resin Composites
vorgelegt von
Dalia Adel Mahmoud Kaisarly
2014

Aus der Poliklinik für Zahnerhaltung und Parodontologie
der Ludwig-Maximilians-Universität München
Direktor: Prof. Dr. Reinhard Hickel
The Effect of Boundary Conditions on the Polymerization Shrinkage
Vectors of Light-Cured Dental Resin Composites
Dissertation
zum Erwerb des Doktorgrades der Zahnheilkunde an der
Medizinischen Fakultät der
Ludwig-Maximilians-Universität zu München
vorgelegt von
Dalia Adel Mahmoud Kaisarly
aus
Kairo, Ägypten
2014

Mit Genehmigung der Medizinischen Fakultät der
Universität München
Berichterstatter: Prof. Dr. Karl-Heinz Kunzelmann
Mitberichterstatter: Priv. Doz. Dr. Andreas Fottner
Priv. Doz. Dr. Jan-Frederik Güth
Mitbetreuung durch den promovierten
Mitarbeiter:
---
Dekan: Prof. Dr. med. Dr. h.c. M. Reiser, FACR, FRCR
Tag der mündlichen Prüfung:
17.12.2014

TO MY FAMILY

Acknowledgement
I would like to express my deepest thanks to Prof Dr Karl-Heinz Kunzelmann for giving me
the opportunity to conduct this unique research under his meticulous and devoted
supervision in the field of medical image registration and to use the exclusive software for
performing this research. He gave me the flexibility in taking my own path and encouraged
me to pursue my ideas.
Furthermore, I would like to thank Prof Dr Reinhard Hickel, director of the Department of
Restorative Dentistry, Periodontology and Pedodontics, Ludwig-Maximilians-University
Munich, Munich, Germany for hosting me as a guest researcher.
I would also like to thank Prof Dr Peter Rösch from the Faculty of Computer Science,
University of Applied Sciences, Augsburg, Germany, for his support and for giving me more
insights into the medical image registration processes.
Special thanks go to both Mrs Evi Köbele for the valuable Micro-CT support and SEM
images, and Mrs Gisela Dachs for the SEM images and materials’ photos in addition to their
never ending kind assistance.
More thanks go to Mr Thomas Obermeier for his continuing technical support and Mr Jian
Jin for his help especially in the starting phase of my work, also Mr Stefan Spindler for
preparing the non-adhesive cavity model and to Dr Michael Wiseman for helping me with
the statistical analysis.
I am very grateful for having found friends in my colleagues at the Tribolabor: Dr Indra
Nyamaa, Dr Yu-Chih Chiang, Antonia Chouliara, Dr Jury Malyk, Dr Guangyun Lai, Xiaohui
Xu, Chen Quan, Liya Zhao and Dr Nataliya Deyneka Dupriez.
I would also like to thank Prof Dr Sayed Saniour, chief of the Department of Biomaterials
and my colleagues at the Department of Biomaterials at the Faculty of Oral and Dental
Medicine, Cairo University, Cairo, Egypt, for accepting my research vacation with the
purpose of performing research at the Faculty of Dentistry at the LMU Munich, Germany.
I owe deep thanks and gratitude to all people who contributed to the success of my work,
even those I failed to mention here. Finally, I would like to thank my whole family,
especially my dear mother and my late father, for supporting me and believing in me; without
their endless help this project would never have been completed.
i
Contents 1 General Introduction and Literature Review .............................................................................. 1
1.1 Historical background of dental resin composites ............................................................. 1
1.2 Composition of dental resin composites ............................................................................ 1
1.2.1 Polymer matrix ........................................................................................................... 1
1.2.2 Fillers .......................................................................................................................... 4
1.2.3 Coupling agent ........................................................................................................... 5
1.2.4 Initiator-accelerator system ........................................................................................ 6
1.2.5 Polymerization kinetics .............................................................................................. 7
1.3 Polymerization shrinkage ................................................................................................... 8
1.4 Methods for measuring polymerization shrinkage stress ................................................... 9
1.5 Methods for measuring polymerization shrinkage ........................................................... 13
1.5.1 Volumetric shrinkage measurement ......................................................................... 13
1.5.2 Linear shrinkage measurement ................................................................................. 15
1.5.3 Cuspal deflection measurement ................................................................................ 18
1.5.4 Measurement of adverse effects of polymerization shrinkage ................................. 19
1.5.5 Finite element analysis (FEA) .................................................................................. 20
1.5.6 Methods employing micro-CT data for the evaluation of polymerization shrinkage
20
2 Aim of the study ....................................................................................................................... 28
Hypothesis .................................................................................................................................... 29
3 Shrinkage Vectors in Different Cavity Configurations ............................................................ 30
3.1 Abstract ............................................................................................................................ 30
3.2 Introduction ...................................................................................................................... 31
3.3 Aim of the study ............................................................................................................... 33
3.4 Materials and Methods ..................................................................................................... 33
3.4.1 Specimen preparation ............................................................................................... 33
3.4.2 Preparation of the experimental traceable resin composite ...................................... 33
3.4.3 X-ray micro-computed tomography measurements ................................................. 34
3.4.4 Data processing ........................................................................................................ 37
3.4.5 Scanning electron microscopy.................................................................................. 38
3.5 Results .............................................................................................................................. 40
3.5.1 Qualitative presentation of polymerization shrinkage: Visualization of shrinkage
vectors in the displacement vector fields and SEM.................................................................. 40
3.5.2 Quantitative presentation of polymerization shrinkage: values of shrinkage vectors
and statistical analysis .............................................................................................................. 46
3.6 Discussion ........................................................................................................................ 50
Conclusions .............................................................................................................................. 59
4 Composite Shrinkage Vectors in Ceramic Cavities with Different Boundary Conditions ...... 60
ii
4.1 Abstract ............................................................................................................................ 60
4.2 Introduction ...................................................................................................................... 61
4.3 Aim of the study ............................................................................................................... 62
4.4 Materials and Methods ..................................................................................................... 62
4.4.1 Specimen preparation ............................................................................................... 63
4.4.2 Statistical analysis .................................................................................................... 64
4.5 Results .............................................................................................................................. 65
4.5.1 Qualitative presentation of polymerization shrinkage: Visualization of shrinkage
vectors in displacement vector fields and SEM ....................................................................... 65
4.5.2 Quantitative presentation of polymerization shrinkage: values of shrinkage vectors
and statistical analysis .............................................................................................................. 69
4.6 Discussion ........................................................................................................................ 72
Conclusions .............................................................................................................................. 75
5 Composite Shrinkage Vector Patterns In Non-Adhesive Teflon Cavities ............................... 76
5.1 Abstract ............................................................................................................................ 76
5.2 Introduction ...................................................................................................................... 77
5.3 Aim of the study ............................................................................................................... 78
5.4 Materials and Methods ..................................................................................................... 78
5.4.1 Specimen preparation ............................................................................................... 78
5.5 Results .............................................................................................................................. 80
5.5.1 Qualitative presentation of polymerization shrinkage: Visualization of shrinkage
vectors in the displacement vector field ................................................................................... 80
5.5.2 Quantitative presentation of polymerization shrinkage: values of shrinkage vectors
and statistical analysis .............................................................................................................. 81
5.6 Discussion ........................................................................................................................ 83
Conclusions .............................................................................................................................. 87
6 Shrinkage Vectors in an Experimental Cavity with Enamel Floor .......................................... 88
6.1 Abstract ............................................................................................................................ 88
6.2 Introduction ...................................................................................................................... 89
6.3 Aim of the study ............................................................................................................... 90
6.4 Materials and Methods ..................................................................................................... 90
6.4.1 Specimen preparation ............................................................................................... 90
6.4.2 Statistical analysis .................................................................................................... 91
6.4.3 Scanning electron microscopy.................................................................................. 91
6.5 Results .............................................................................................................................. 93
6.5.1 Qualitative presentation of polymerization shrinkage: Visualization of shrinkage
vectors in the displacement vector field and SEM ................................................................... 93
6.5.2 Quantitative presentation of polymerization shrinkage: values of shrinkage vectors
and statistical analysis .............................................................................................................. 97
6.6 Discussion ...................................................................................................................... 101
iii
Conclusions ............................................................................................................................ 105
7 Summary ................................................................................................................................ 106
Conclusions ................................................................................................................................ 109
Recommendations for future research ........................................................................................ 109
8 Zusammenfassung .................................................................................................................. 110
5 List of tables ........................................................................................................................... 113
6 List of figures ......................................................................................................................... 114
7 Annex ..................................................................................................................................... 121
7.1 Materials and equipments ............................................................................................... 121
7.2 Protocol for the silanization of the traceable glass beads ............................................... 124
8 References .............................................................................................................................. 127

1
1 General Introduction and Literature Review
1.1 Historical background of dental resin composites
Dental resin composites are composed of at least two different materials, an organic resin
matrix and inorganic fillers. They were first introduced by Raphael L. Bowen in 1962 with
the synthesis of a Bis-GMA monomer formulation filled with finely ground quartz (Bowen,
1962; 1963). Composites were preceded by unfilled acrylic resin and epoxy resins as direct
restorative materials for the use in the anterior regions (Bowen, 1956). At about the same
time, Michael G. Buonocore worked on acid etching and dentin conditioning targeting to
bond unfilled acrylic resin to tooth structure (Buonocore, 1955; Buonocore et al., 1956).
From this point onward, research on resin composites and bonding materials and techniques
has been continuously conducted to improve the performance and longevity of these
restorations.
1.2 Composition of dental resin composites
A resin composite is composed of four major components: organic polymer matrix,
inorganic filler particles, coupling agent, and the initiator-accelerator system.
1.2.1 Polymer matrix
The organic polymer matrix in most commercial composites is a cross-linked matrix of
dimethacrylate monomers typically selected from Bis-GMA (bisphenol A-glycidyl-
dimethacrylate), BisEMA (ethoxylated bisphenol A-dimethacrylate) and/or UDMA
(urethane dimethacrylate). Bis-GMA is one of the most frequently used monomers, only in
small amounts, as it has an affinity for water absorption that leads to swelling and
discoloration. UDMA has the advantage of being less viscous than Bis-GMA, so it can be
used undiluted, and having no hydroxyl groups (OH-groups), therefore, exhibiting less water
sorption (Sakaguchi and Powers, 2012; Scientific Documentation Tetric EvoCeram® Bulk
Fill, 2013). TEGDMA (triethylene glycol dimethacrylate), a low-viscosity reactive diluent,
is used to lower the viscosity of the resin and enable sufficient filler incorporation (Figure
1). Although it increases conversion, the modulus is decreased and finally polymerization
shrinkage and stress are increased (Cramer et al., 2011).
2
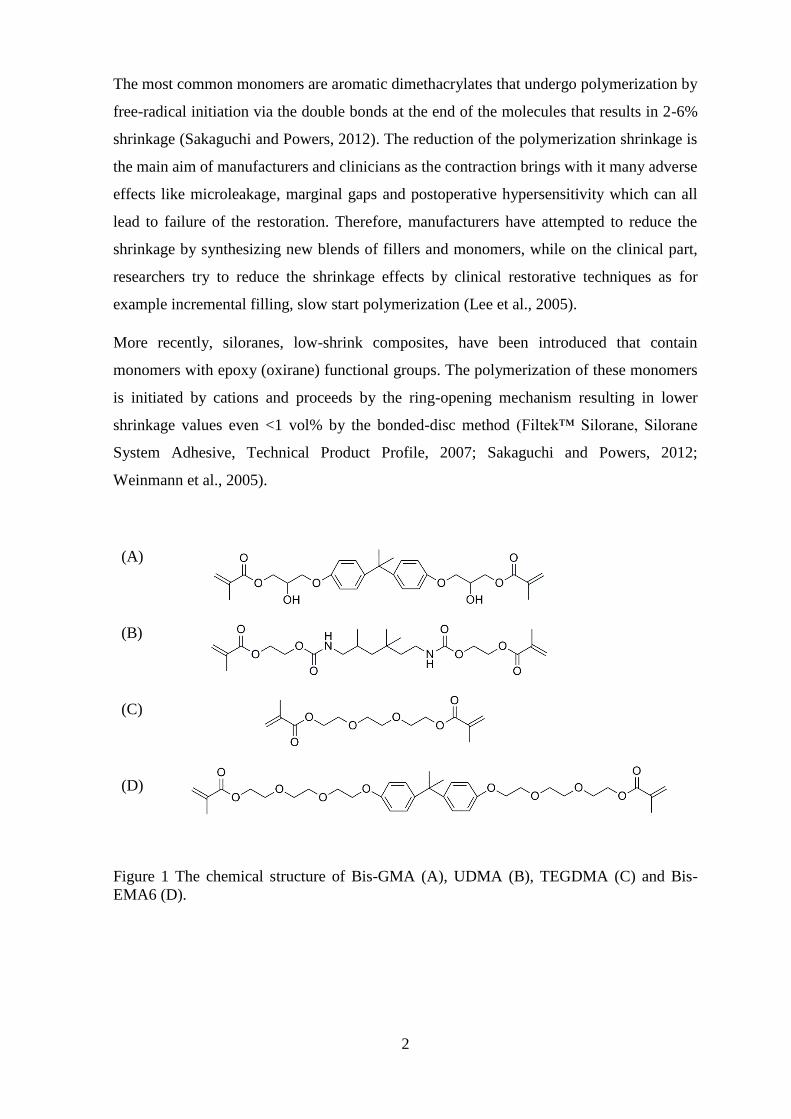
The most common monomers are aromatic dimethacrylates that undergo polymerization by
free-radical initiation via the double bonds at the end of the molecules that results in 2-6%
shrinkage (Sakaguchi and Powers, 2012). The reduction of the polymerization shrinkage is
the main aim of manufacturers and clinicians as the contraction brings with it many adverse
effects like microleakage, marginal gaps and postoperative hypersensitivity which can all
lead to failure of the restoration. Therefore, manufacturers have attempted to reduce the
shrinkage by synthesizing new blends of fillers and monomers, while on the clinical part,
researchers try to reduce the shrinkage effects by clinical restorative techniques as for
example incremental filling, slow start polymerization (Lee et al., 2005).
More recently, siloranes, low-shrink composites, have been introduced that contain
monomers with epoxy (oxirane) functional groups. The polymerization of these monomers
is initiated by cations and proceeds by the ring-opening mechanism resulting in lower
shrinkage values even <1 vol% by the bonded-disc method (Filtek™ Silorane, Silorane
System Adhesive, Technical Product Profile, 2007; Sakaguchi and Powers, 2012;
Weinmann et al., 2005).
(A)
(B)
(C)
(D)
Figure 1 The chemical structure of Bis-GMA (A), UDMA (B), TEGDMA (C) and Bis-
EMA6 (D).

3
Table 1 Classification of composites according to the functional group determining
their cure (Kunzelmann, 2008)
Matrix according
to the functional
group
Chemical system Properties of
composites with
this matrix
Examples
Pure
methacrylates
Classical dental
matrix, e.g. Bis-
GMA, UDMA,
TEGDMA
Polarity of the
matrix varies
depending on the
composition
High strength
Tetric
Ceram/Vivadent,
Charisma/Kulzer,
P60/3M , Z100/3M,
250/3M, TPH-
Spektrum/Dentsply,
Pertac II/Espe
Classical ormocers,
differ from classical
monomers in the non-
reactive part (Si-O-
network)
Hydrophobic
Low elution of
monomers
Definite/Degussa
Acid modified
methacrylates
Compared with the
classical dental matrix
it has more
hydrophilic monomer
components e.g. polar
side groups
(COOH=compomers)
More hydrophilic
than the pure
methacrylate
matrix
Dyract AP/Dentsply,
Compoglass
F/Vivadent,
Hytac/Espe
Ormocers with
carboxylic function
Low elution of
monomers
Admira/Voco
Ring opening
epoxides
oxirane Low shrinkage
High strength
Not available
commercially
Silorane (siloxane
with oxirane function)
Low shrinkage
High strength
hydrophobic
P90 Silorane/3M
ESPE

4
1.2.2 Fillers
Fillers constitute the major portion of the composite by weight. They are added to the resin
matrix to reduce polymerization shrinkage and stress, to reinforce the resin matrix, and to
provide an appropriate degree of translucency. The fillers consist of inorganic material such
as finely ground quartz or glass, sol-gel derived ceramics, microfine silica, or nanoparticles.
Most glasses contain heavy-metal oxides such as barium, zinc, yttrium fluoride, or
ytterbiumtrifluoride for radiopacity. Fillers are usually silanized to bond to the organic
matrix and transfer the stresses to the fillers. However, some researchers kept fillers
nonbonded for stress reduction (Condon and Ferracane, 1998).
Composites are classified according to the filler system. Fillers influence the materials’
properties through even minute addition of separate components. Therefore, mixtures of
large and small fillers are used in order to incorporate as many fillers as possible. Small
fillers are located in the spaces between larger ones. Some fillers are added for radioopacity,
for example ytterbium fluoride, Table 2 (Kunzelmann, 2008).
Table 2 Kunzelmann’s classification of composites according to filler system
(Kunzelmann, 2008)
Filler system Examples
SiO2 Isosit, Vivadent
SiO2 Durafill, Kulzer; Silux Plus, 3M
Quartz + SiO2 Pertac II, Espe
Compact glasses + SiO2 TPH Spektrum, Dentsply; Charisma,
Kulzer, etc.
Compact glasses + SiO2 + spherical,
sintered mixed oxides
Tetric Ceram, Vivadent
Porous glasses + compact glasses + SiO2 Solitaire, Kulzer; Solitaire 2 , Kulzer
Fibres + compact glasses + SiO2 Alert, Jeneric Pentron
Ion-releasing fillers + compact glasses +
SiO2
Ariston, Vivadent
Compact glasses + SiO2 + spherical,
sintered mixed oxides + prepolymerized
fillers with [compact glasses + SiO2 +
spherical, sintered mixed oxides]
Tetric EvoCeram, Vivadent
Multimodal, spherical fillers prepared
according to the sol-gel-method
Palcifique Estelite, Tokuyama Dental; P60,
3M; Z100, 3M; Z250, 3M
Nanofiller-primary-particle + calcinied
nanofiller agglomerates
Filtek Supreme (XT), 3M-Espe
Nanofiller-primary-particle + compact
glasses
Grandio, Voco
5
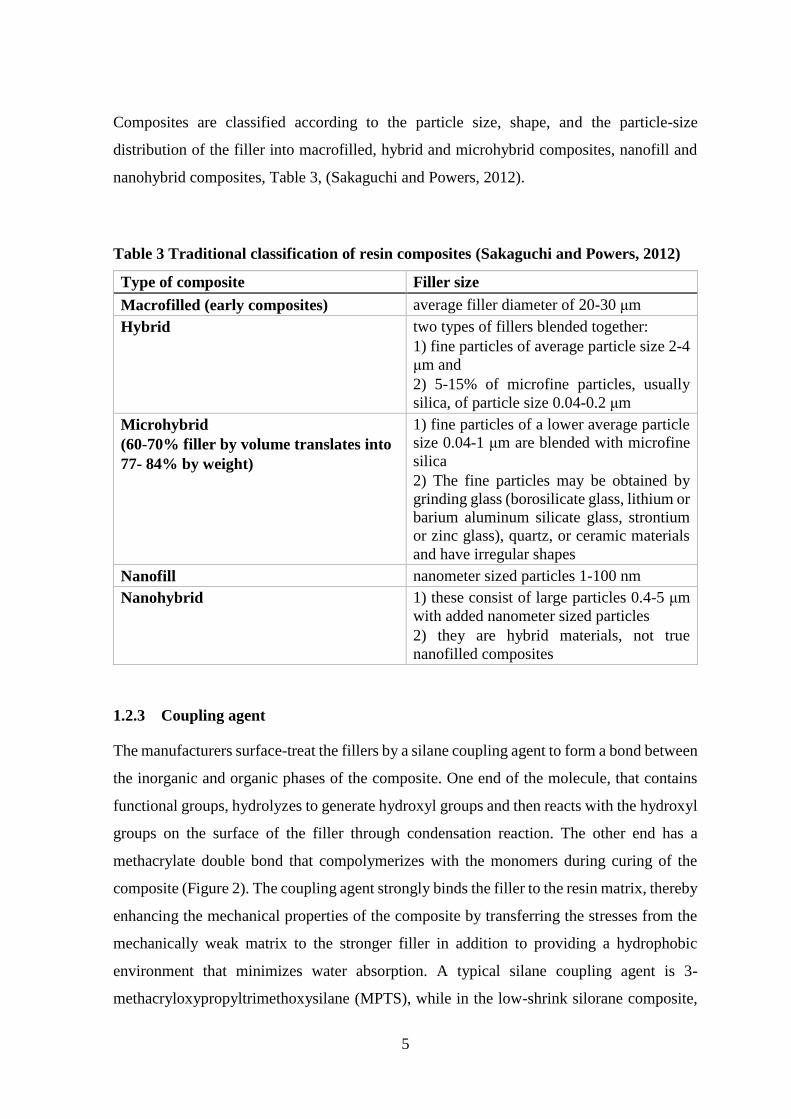
Composites are classified according to the particle size, shape, and the particle-size
distribution of the filler into macrofilled, hybrid and microhybrid composites, nanofill and
nanohybrid composites, Table 3, (Sakaguchi and Powers, 2012).
Table 3 Traditional classification of resin composites (Sakaguchi and Powers, 2012)
Type of composite Filler size
Macrofilled (early composites) average filler diameter of 20-30 μm
Hybrid two types of fillers blended together:
1) fine particles of average particle size 2-4
μm and
2) 5-15% of microfine particles, usually
silica, of particle size 0.04-0.2 μm
Microhybrid
(60-70% filler by volume translates into
77- 84% by weight)
1) fine particles of a lower average particle
size 0.04-1 μm are blended with microfine
silica
2) The fine particles may be obtained by
grinding glass (borosilicate glass, lithium or
barium aluminum silicate glass, strontium
or zinc glass), quartz, or ceramic materials
and have irregular shapes
Nanofill nanometer sized particles 1-100 nm
Nanohybrid 1) these consist of large particles 0.4-5 μm
with added nanometer sized particles
2) they are hybrid materials, not true
nanofilled composites
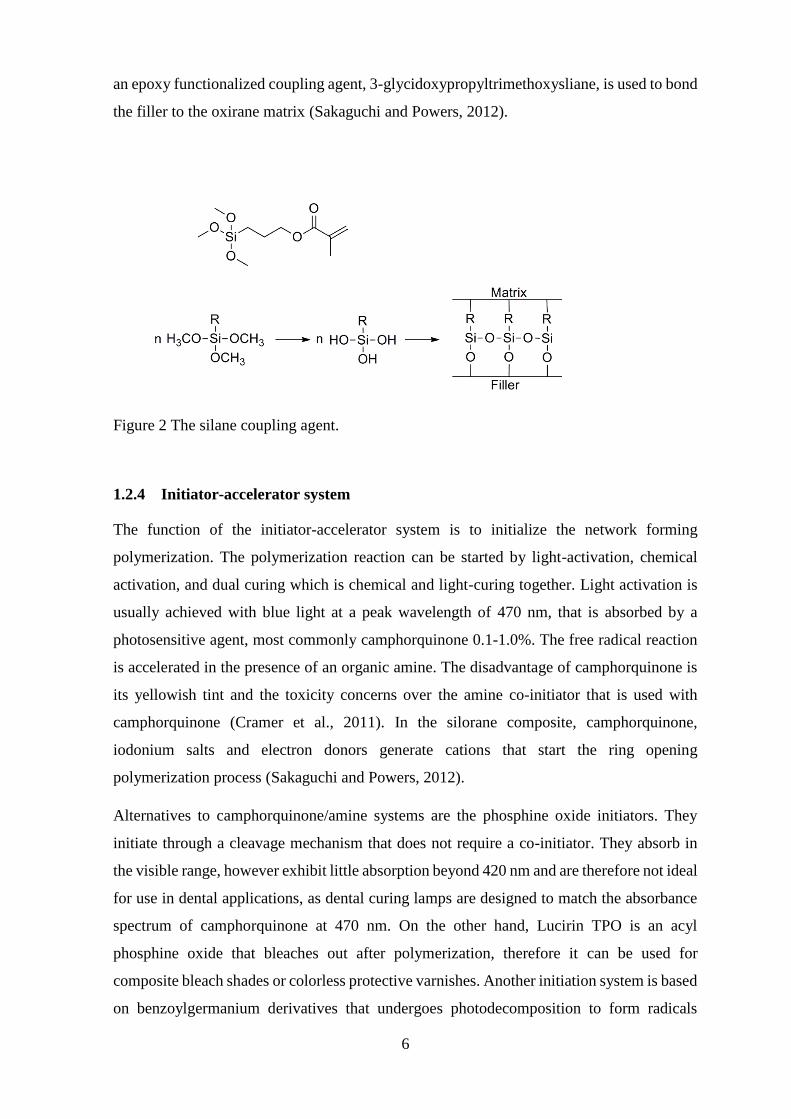
1.2.3 Coupling agent
The manufacturers surface-treat the fillers by a silane coupling agent to form a bond between
the inorganic and organic phases of the composite. One end of the molecule, that contains
functional groups, hydrolyzes to generate hydroxyl groups and then reacts with the hydroxyl
groups on the surface of the filler through condensation reaction. The other end has a
methacrylate double bond that compolymerizes with the monomers during curing of the
composite (Figure 2). The coupling agent strongly binds the filler to the resin matrix, thereby
enhancing the mechanical properties of the composite by transferring the stresses from the
mechanically weak matrix to the stronger filler in addition to providing a hydrophobic
environment that minimizes water absorption. A typical silane coupling agent is 3-
methacryloxypropyltrimethoxysilane (MPTS), while in the low-shrink silorane composite,
6
an epoxy functionalized coupling agent, 3-glycidoxypropyltrimethoxysliane, is used to bond
the filler to the oxirane matrix (Sakaguchi and Powers, 2012).
Figure 2 The silane coupling agent.
1.2.4 Initiator-accelerator system
The function of the initiator-accelerator system is to initialize the network forming
polymerization. The polymerization reaction can be started by light-activation, chemical
activation, and dual curing which is chemical and light-curing together. Light activation is
usually achieved with blue light at a peak wavelength of 470 nm, that is absorbed by a
photosensitive agent, most commonly camphorquinone 0.1-1.0%. The free radical reaction
is accelerated in the presence of an organic amine. The disadvantage of camphorquinone is
its yellowish tint and the toxicity concerns over the amine co-initiator that is used with
camphorquinone (Cramer et al., 2011). In the silorane composite, camphorquinone,
iodonium salts and electron donors generate cations that start the ring opening
polymerization process (Sakaguchi and Powers, 2012).
Alternatives to camphorquinone/amine systems are the phosphine oxide initiators. They
initiate through a cleavage mechanism that does not require a co-initiator. They absorb in
the visible range, however exhibit little absorption beyond 420 nm and are therefore not ideal
for use in dental applications, as dental curing lamps are designed to match the absorbance
spectrum of camphorquinone at 470 nm. On the other hand, Lucirin TPO is an acyl
phosphine oxide that bleaches out after polymerization, therefore it can be used for
composite bleach shades or colorless protective varnishes. Another initiation system is based
on benzoylgermanium derivatives that undergoes photodecomposition to form radicals

7
without the need for a co-initiator. Recently introduced bulk fill composites are intended for
use in increments up to 4 mm, which is achieved by a combination of camphorquinone,
phosphine oxide and a germanium based photoinitiator as Ivocerin. It allows curing in large
increments with ans absorption maximum in the blue light range around 370-460 nm. It is
more reactive than camphorquinone or Lucirin TPO resulting in more rapid polymerization
with greater depth of cure (Cramer et al., 2011; Scientific Documentation Tetric EvoCeram®
Bulk Fill, 2013).
1.2.5 Polymerization kinetics
The free monomer molecules are loosely bonded by weak van der Waals force and upon
polymerization, the monomers are tightly linked by covalent bonds in a polymer with a
smaller distance between the molecules leading to polymerization shrinkage.
Polymerization contraction strain is time-dependent and proceeds in two stages: pre-gelation
and post-gelation, or rigid contraction (Bausch et al., 1982). Two macroscopic demarcations
occur during polymerization: the gel point conversion at which an incipient gel is formed.
The second macroscale demarcation is the vitrification point which represents the conversion
at which the polymer becomes glassy, accompanied by an increase in modulus. These
polymer networks are extremely heterogenous which grow from microgels arising near sites
of initiation (Cramer et al., 2011). Plastic flow occurs during the initial phase and internal
stresses within the material undergo stress-relaxation, while stress development occurs
beyond the gel point and its magnitude depends on the elastic modulus (Braem et al., 1987).
Hardness is taken as an indirect measure for the degree of cure, and is measured in a
longitudinally sectioned specimen from the top of restoration until the bottom, with
decreasing hardness values denoting decreasing degree of conversion with increased
thickness and distance from the light source (Cho et al., 2011; Onose et al., 1985). Over 20
years ago, the question about anisotropy of the cure pattern was raised with possible variation
of shrinkage patterns within the material, relative to the initiating light source, with respect
to material thickness and surface area. In cases where material specimens are imperfectly
cured, the measured shrinkage will be correspondingly reduced (Onose et al., 1985; Watts
et al., 1984; Watts and Cash, 1991).
Recent studies investigated light beam profiles and their effect on the polymerization of the
composites. Irradiance values calculated by conventional methods assume power uniformity
within the light beam but do not describe the distribution of the irradiance delivered. Beam
profilers investigated the optically active emitting area, the mean irradiance, the irradiance
8
distribution and the top hat factor with differences among various light curing units. This
could propose improper curing of deeper parts of a restoration due to beam inhomogeneity
(Price et al., 2010e; Price et al., 2011).
1.3 Polymerization shrinkage
Since the use of resin composites as restorative materials, a lot of research has been
conducted in the field of polymerization and its effects as shrinkage and stress. In vivo tests
focused on indirect evaluation of gap formation by resin replica technique (Opdam et al.,
1998; Qualtrough et al., 1991; Roulet et al., 1991). In vitro test methods investigate the resin
composite in form of a material sample or applied within a cavity prepared in human teeth
(Chiang et al., 2010) or other material such as resin composite or ceramic block (Cho et al.,
2011; Li et al., 2011).
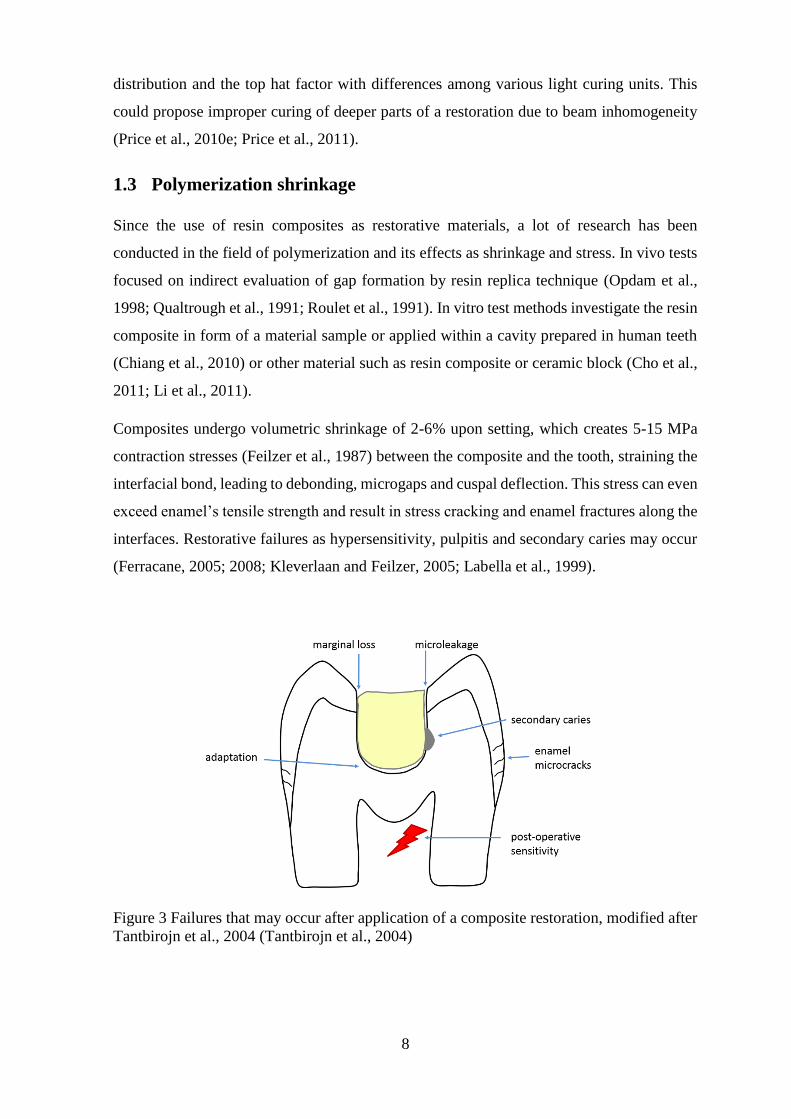
Composites undergo volumetric shrinkage of 2-6% upon setting, which creates 5-15 MPa
contraction stresses (Feilzer et al., 1987) between the composite and the tooth, straining the
interfacial bond, leading to debonding, microgaps and cuspal deflection. This stress can even
exceed enamel’s tensile strength and result in stress cracking and enamel fractures along the
interfaces. Restorative failures as hypersensitivity, pulpitis and secondary caries may occur
(Ferracane, 2005; 2008; Kleverlaan and Feilzer, 2005; Labella et al., 1999).
Figure 3 Failures that may occur after application of a composite restoration, modified after
Tantbirojn et al., 2004 (Tantbirojn et al., 2004)
9
The greater the volumetric shrinkage is, the greater is the shrinkage stress for a comparable
elastic modulus. The development of shrinkage stress depends on the volumetric shrinkage
strain and the stiffness of the composite at the time of shrinkage; even low-shrinkage
composites might exhibit high stress when having a high elastic modulus. A 2 mm
incremental application of composite and polymerizing each increment independently is
usually advised to ensure a full depth of cure and to reduce the net effect of polymerization
shrinkage. Net shrinkage stress is assumed to be less because a smaller volume of composite
is allowed to shrink before successive additions. (Sakaguchi and Powers, 2012). On the other
hand, Versluis et al., 1996 showed that the incremental application combined with a well-
established bond to the tooth increased the deformation of the restored tooth and in turn the
stress level within the tooth-restoration complex (Versluis et al., 1996).
Feilzer et al., 1987, showed that the stress development in a bonded composite restoration
depends on the restoration geometry, in that the pregelation flow of the material is inhibited
when the ratio of the bonded surface exceeds a certain limit; the magnitude of stress can be
estimated through the C-factor (configuration factor) which is the ratio of bonded to
unbonded areas. The higher the C-factor, the greater the stress level. This observation is
related to the description of shrinkage as a vector, having both magnitude and direction
(Feilzer et al., 1987). Other studies criticized that the C-factor does not take into account the
volume of the applied composite and Braga et al., 2006, related shrinkage stress to
microleakage in restorations of larger size (Braga et al., 2006; Watts and Satterthwaite,
2008).
1.4 Methods for measuring polymerization shrinkage stress
Early shrinkage stress measurements were performed by Bowen (Bowen, 1967; Bowen et
al., 1983) and Hegdahl (Hegdahl and Gjerdet, 1977) using a Universal Testing (Instron)
machine (UTM), while a servo-hydraulic UTM was used by the ACTA group of Davidson,
Feilzer, de Gee and Alster who achieved major insights and developments, including the
effect of C-factor on the stress magnitudes and eliminating the effect of system compliance.
Unfortunately this approach was expensive and complex, in addition to the basic limitation
of eliminating compliance for load measurement systems as they imply finite compliance.
(Alster et al., 1997; Davidson and de Gee, 1984; Davidson and Feilzer, 1997; Feilzer et al.,
1988; 1989; 1990; Watts et al., 2003). An apparatus with a controlled compliance to measure
contraction stress was developed by Sakaguchi et al., 2004, in which the composite specimen

10
was located between a glass plate and a steel rod that measured the developed force upon
curing (Sakaguchi et al., 2004a).
Polymerization shrinkage stress was also determined by a tensilometer (Davidson and de
Gee, 1984; Davidson et al., 1984; Feilzer et al., 1987) and strain gauges (Sakaguchi et al.,
1992). A stress-strain-analyzer testing machine was developed by Dullin, 1998, during
his master’s thesis under the supervision of Kunzelmann and Stockhausen (Dullin, 1998)
and used for the shrinkage stress measurement with and without compliance (Chen et al.,
2001; Chen et al., 2003).
Figure 4 stress-strain analyzer machine designed by Dullin, modified after Chen et al., 2001
(Chen et al., 2001; Chen et al., 2003; Dullin, 1998).
Photo-elastic and Moire methods are based on optical fringes (Ernst et al., 2004; Kinomoto
and Torii, 1998; Kinomoto et al., 1999; 2000; Oliveira et al., 2012; Rullmann et al., 2012).
Another method is the finite element modeling (FEA) which consists of a computer based
model that determines the type and location of stresses in the model structures (Ausiello et
al., 2002; Rodrigues et al., 2012). Shrinkage strain-rate and stress was measured during
polymerization with a tensometer which is based on the cantilever beam deflection theory
(Lu et al., 2004a; b; Sun et al., 2009b).
The “ring-slitting method” was used to evaluate residual shrinkage stresses in composite.
Ring-shaped specimens were cured and slit for the evaluation of the gap distance due to

11
stress release and gap measurements were evaluated with an image analyzer program (Park
and Ferracane, 2005; Park and Ferracane, 2006).
The Bioman shrinkage-stress instrument was designed and constructed at the University
of Manchester to overcome the difficulties encountered with the servo-hydraulic UTM and
its function is based on the fixed beam compliance (Watts et al., 2003; Watts and
Satterthwaite, 2008).
Figure 5 The Bioman shrinkage-stress instrument, modified after Watts et al., 2003 (Watts
et al., 2003).
Variations in final stress values are found in the literature which can be attributed to the
various testing techniques and system compliances. In order to obtain data that can be related
to the clinical situation, the instrument compliance should preferably be similar to that of the
prepared tooth (Schneider et al., 2010).
Polymerization shrinkage stresses are also evaluated by FEA. Among the advantages of FEA
are the rapidity of work and the ability to vary the conditions ranging from perfect to
unfavourable. None or only a few teeth specimen are needed as one tooth is enough for
generating a tooth model which can then be manipulated to host different conditions. A
detailed stress analysis is possible which makes it attractive for use. Nevertheless, FEA
models need direct experimental validation and they do not consider that biological systems
12
have a high degree of variability between specimens (Morin et al., 1988). In the early 70s of
the last century, stresses in biological structures were analyzed (Brekelmans et al., 1972), in
human teeth (Thresher and Saito, 1973), restored molar (Farah et al., 1973), then in teeth
under different loading conditions (Takahashi et al., 1980).
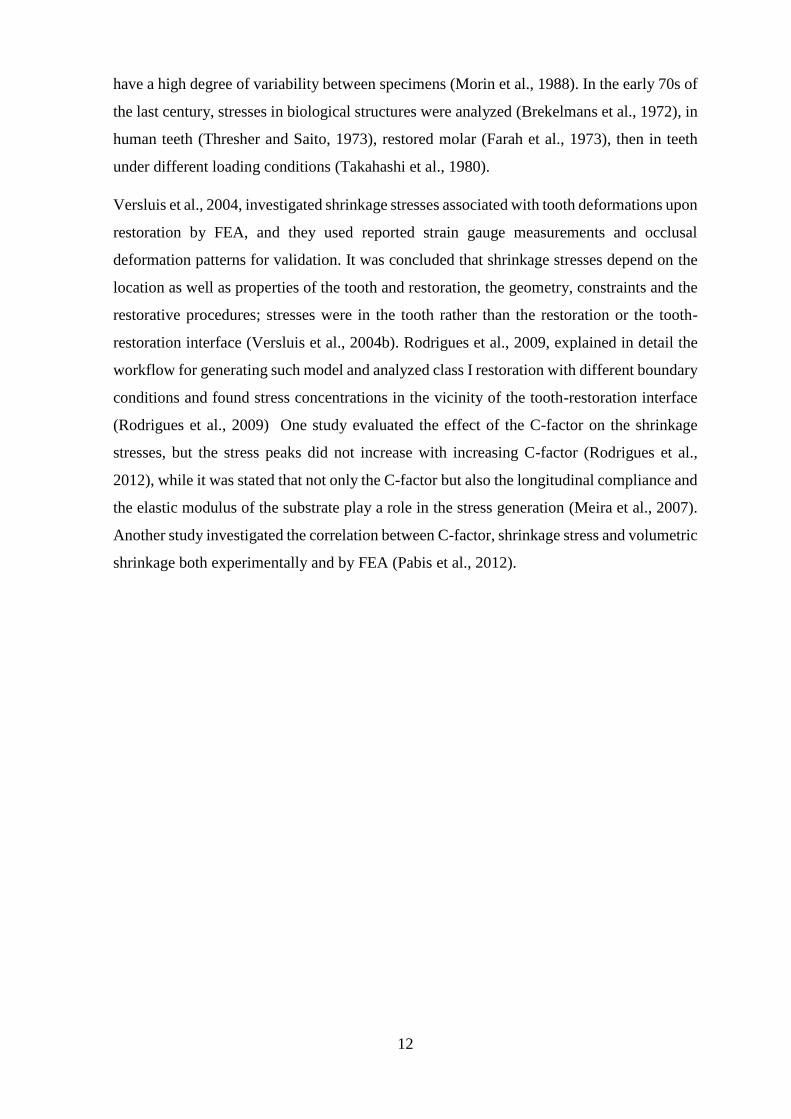
Versluis et al., 2004, investigated shrinkage stresses associated with tooth deformations upon
restoration by FEA, and they used reported strain gauge measurements and occlusal
deformation patterns for validation. It was concluded that shrinkage stresses depend on the
location as well as properties of the tooth and restoration, the geometry, constraints and the
restorative procedures; stresses were in the tooth rather than the restoration or the tooth-
restoration interface (Versluis et al., 2004b). Rodrigues et al., 2009, explained in detail the
workflow for generating such model and analyzed class I restoration with different boundary
conditions and found stress concentrations in the vicinity of the tooth-restoration interface
(Rodrigues et al., 2009) One study evaluated the effect of the C-factor on the shrinkage
stresses, but the stress peaks did not increase with increasing C-factor (Rodrigues et al.,
2012), while it was stated that not only the C-factor but also the longitudinal compliance and
the elastic modulus of the substrate play a role in the stress generation (Meira et al., 2007).
Another study investigated the correlation between C-factor, shrinkage stress and volumetric
shrinkage both experimentally and by FEA (Pabis et al., 2012).

13
1.5 Methods for measuring polymerization shrinkage
Various devices have been used for measuring polymerization shrinkage in terms of
volumetric and linear shrinkage, cuspal displacements, indirect techniques as microleakage,
finite element analysis and through the use of micro-CT-data sets (Figure 6).
Figure 6 Overview of the methods for measuring the polymerization shrinkage strain.
1.5.1 Volumetric shrinkage measurement
Volumetric shrinkage can be measured in a mercury dilatometer by determining the linear
height changes of a column of fluid connected to a reservoir surrounding the sample. The
capillary tube is read like a thermometer (Bekkedahl, 1949; Rodriguez et al., 2006; Smith
and Schoonover, 1953). The disadvantages of this method are the potential for errors due to
Methods for measuring
polymerization shrinkage
1) volumetric shrinkage measurement
dilatometer
Archimedes method
2) linear shrinkage measurement
bonded-disc method
strain gauges
3) cuspal deflection measurement
4) measurement of shrinkage effects
dye penetration for micro- &
nanoleakage
quantitative marginal gap
analysis5) finite element analysis
6) methods employing micro-CT-data for the
evaluation of polymerization
shrinkage
volumetricevaluation
computation of shrinkage vectors

14
small temperature changes by composite polymerization which can affect the liquid volume;
tedious specimen preparation is needed and flowables cannot be measured (de Gee et al.,
1981; Kullmann, 1989; Penn, 1986). Access of the light source and opacity of the mercury
were difficulties with light-cured dental materials (Watts and Cash, 1991). Due to the
potential for environmental mercury contamination and toxic mercury vapors, water filled
dilatometers were used for polymerization shrinkage measurement. However, the most
critical factor for the successful application was maintaining a constant temperature
environment for the dilatometer during shrinkage test (Lai and Johnson, 1993; Rees and
Jacobsen, 1989). The heat from the light source in addition to the heat of the exothermic
polymerization reaction contribute to an unavoidable increase in temperature upon curing.
Yamamoto et al., 2007, measured the polymerization shrinkage of flowables in a water-filled
dilatometer and with speckle contrast measurement. The flowable composite was condensed
into a glass tube, irradiated, and the laser-speckle field was recorded in a digital frame
(Yamamoto et al., 2007). The water-filled dilatometer is also indicated for shrinkage
measurement of other types of composites, not only flowables.
Measuring the density change of composites before and after polymerization can be done
by a gas pycnometer that determines the volume of samples before and after polymerization
without contact, and the difference in volume is calculated (Cook et al., 1999) or by
measuring the specific gravity differences between cured and uncured composite test
specimens using a modified version of ASTM method D792 "Specific Gravity and Density
of Plastics by Displacement" (Puckett and Smith, 1992). Buoyancy (density in water)
measurements were used to evaluate the volumetric polymerization shrinkage of composites
in real time by measuring the buoyancy change of the specimen in distilled water (Lee et al.,
2005). The Archimedes method measures the actual shrinkage in volume according to the
buoyant force principle (Weinmann et al., 2005). The Archimedes method was recently
developed into a German Standard (DIN 13907/2005) (Filtek LS, Technical Product Profile,
2007; Soltesz et al., 1986; Watts and Marouf, 2000). When testing hydrophilic materials,
e.g. compomer or flowables, water sorption is a disadvantage with the Archimedes method
that can be overcome by the use of an alternative medium to water, such as oil or mercury.
Naoum et al., 2012, measured polymerization shrinkage with an electromagnetic balance
that recorded changes in the composite buoyancy during polymerization which permitted
real time volumetric shrinkage measurements at small intervals (Naoum et al., 2012).
Volumetric shrinkage was obtained by video imaging using AcuVol (Bisco Inc.,

15
Schaumburg IL, USA) and sample imaging by a digital video-camera (Labella et al., 1999;
Sharp et al., 2003).
It was stated that the volumetric shrinkage is approximately equal to three times the linear
shrinkage provided the shrinkage occurs identically in all directions as derived from the
formula:
γp= 13-(1-αp)
3=3αp-3αp2+αp
3 (γp, volume shrinkage; αp, linear shrinkage strain), where αp is
very small (Lee et al., 2005; Lee et al., 2012). Isotropic shrinkage is shrinkage equal in all
directions, which is hardly the case in a restorative material applied into a tooth cavity, as it
is confined by the cavity’s boundaries and boundary conditions.
1.5.2 Linear shrinkage measurement
Early measurements of linear shrinkage were determined on a cylinder of material using a
dilatometer, and the % shrinkage =∆L
Lx100 where ΔL = change in length and L = uncured
length (Lee et al., 1969).
Figure 7 Measurement of the linear polymerization shrinkage of a composite cylinder.
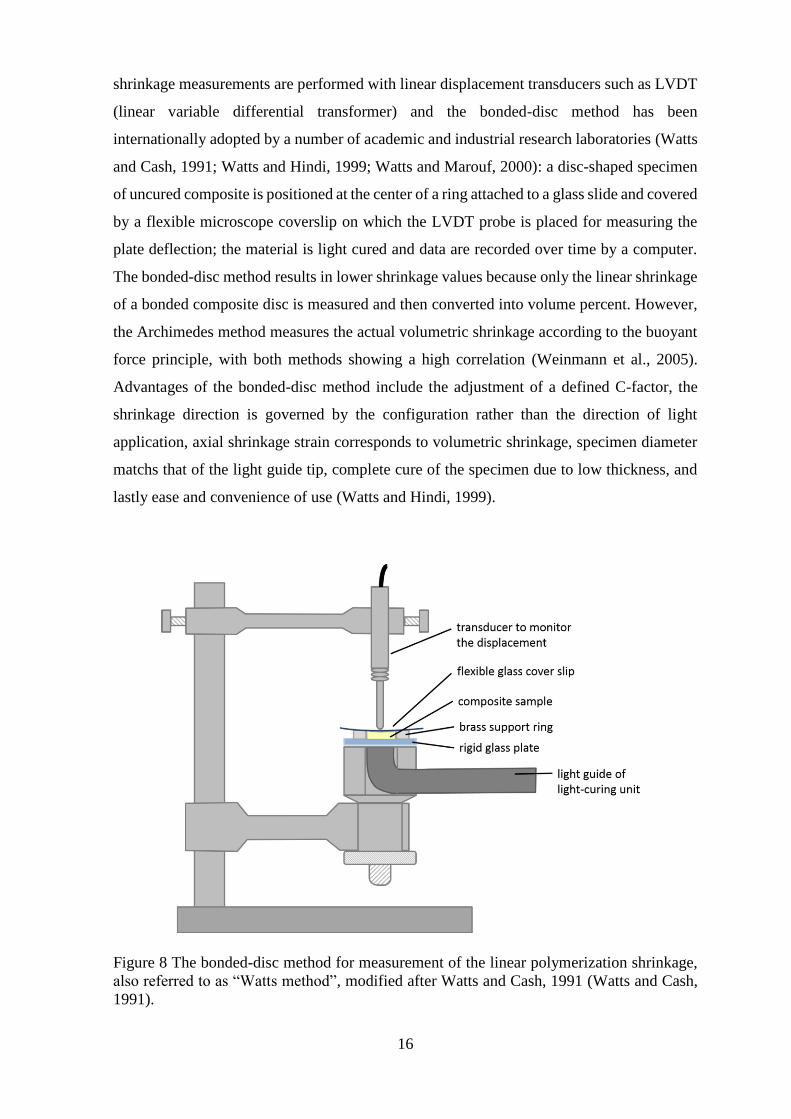
The most common measurement for polymerization shrinkage is the bonded-disc method
by Watts and Cash, also referred to as the “Watts method” (Watts and Cash, 1991). Earlier
precursor was described by Wilson (Wilson, 1978) and Bausch (Bausch et al., 1982). Linear
16
shrinkage measurements are performed with linear displacement transducers such as LVDT
(linear variable differential transformer) and the bonded-disc method has been
internationally adopted by a number of academic and industrial research laboratories (Watts
and Cash, 1991; Watts and Hindi, 1999; Watts and Marouf, 2000): a disc-shaped specimen
of uncured composite is positioned at the center of a ring attached to a glass slide and covered
by a flexible microscope coverslip on which the LVDT probe is placed for measuring the
plate deflection; the material is light cured and data are recorded over time by a computer.
The bonded-disc method results in lower shrinkage values because only the linear shrinkage
of a bonded composite disc is measured and then converted into volume percent. However,
the Archimedes method measures the actual volumetric shrinkage according to the buoyant
force principle, with both methods showing a high correlation (Weinmann et al., 2005).
Advantages of the bonded-disc method include the adjustment of a defined C-factor, the
shrinkage direction is governed by the configuration rather than the direction of light
application, axial shrinkage strain corresponds to volumetric shrinkage, specimen diameter
matchs that of the light guide tip, complete cure of the specimen due to low thickness, and
lastly ease and convenience of use (Watts and Hindi, 1999).
Figure 8 The bonded-disc method for measurement of the linear polymerization shrinkage,
also referred to as “Watts method”, modified after Watts and Cash, 1991 (Watts and Cash,
1991).
17
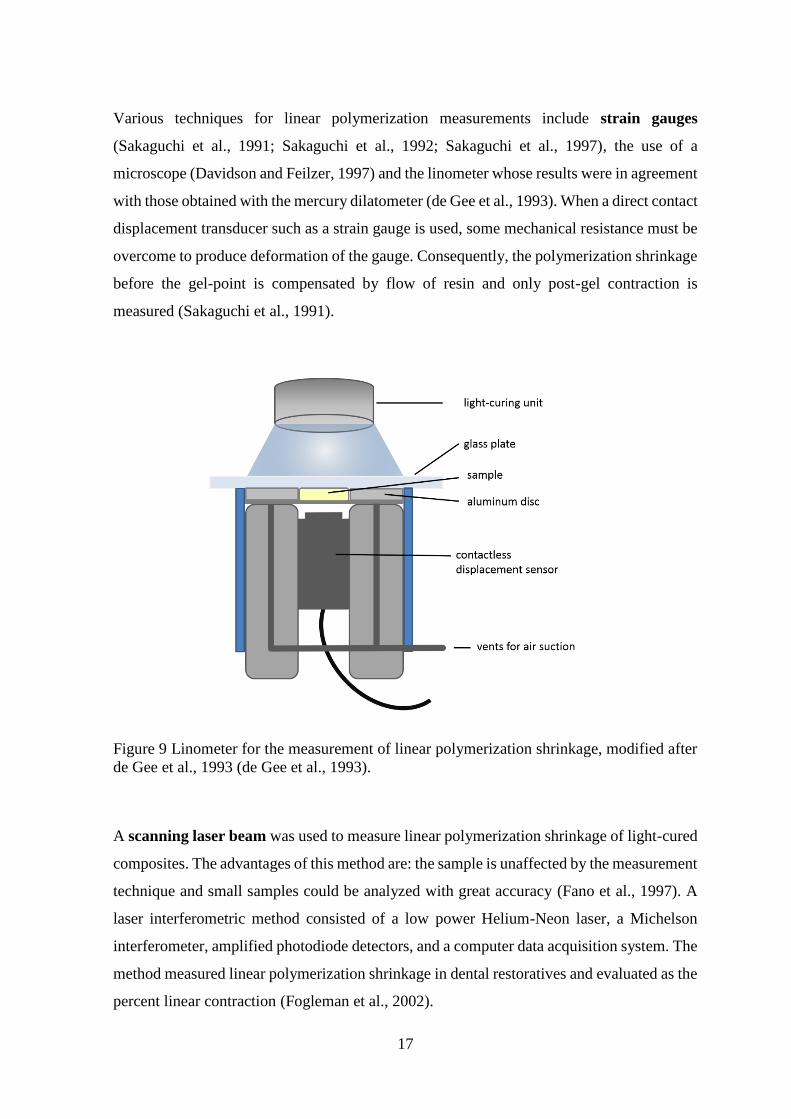
Various techniques for linear polymerization measurements include strain gauges
(Sakaguchi et al., 1991; Sakaguchi et al., 1992; Sakaguchi et al., 1997), the use of a
microscope (Davidson and Feilzer, 1997) and the linometer whose results were in agreement
with those obtained with the mercury dilatometer (de Gee et al., 1993). When a direct contact
displacement transducer such as a strain gauge is used, some mechanical resistance must be
overcome to produce deformation of the gauge. Consequently, the polymerization shrinkage
before the gel-point is compensated by flow of resin and only post-gel contraction is
measured (Sakaguchi et al., 1991).
Figure 9 Linometer for the measurement of linear polymerization shrinkage, modified after
de Gee et al., 1993 (de Gee et al., 1993).
A scanning laser beam was used to measure linear polymerization shrinkage of light-cured
composites. The advantages of this method are: the sample is unaffected by the measurement
technique and small samples could be analyzed with great accuracy (Fano et al., 1997). A
laser interferometric method consisted of a low power Helium-Neon laser, a Michelson
interferometer, amplified photodiode detectors, and a computer data acquisition system. The
method measured linear polymerization shrinkage in dental restoratives and evaluated as the
percent linear contraction (Fogleman et al., 2002).
18
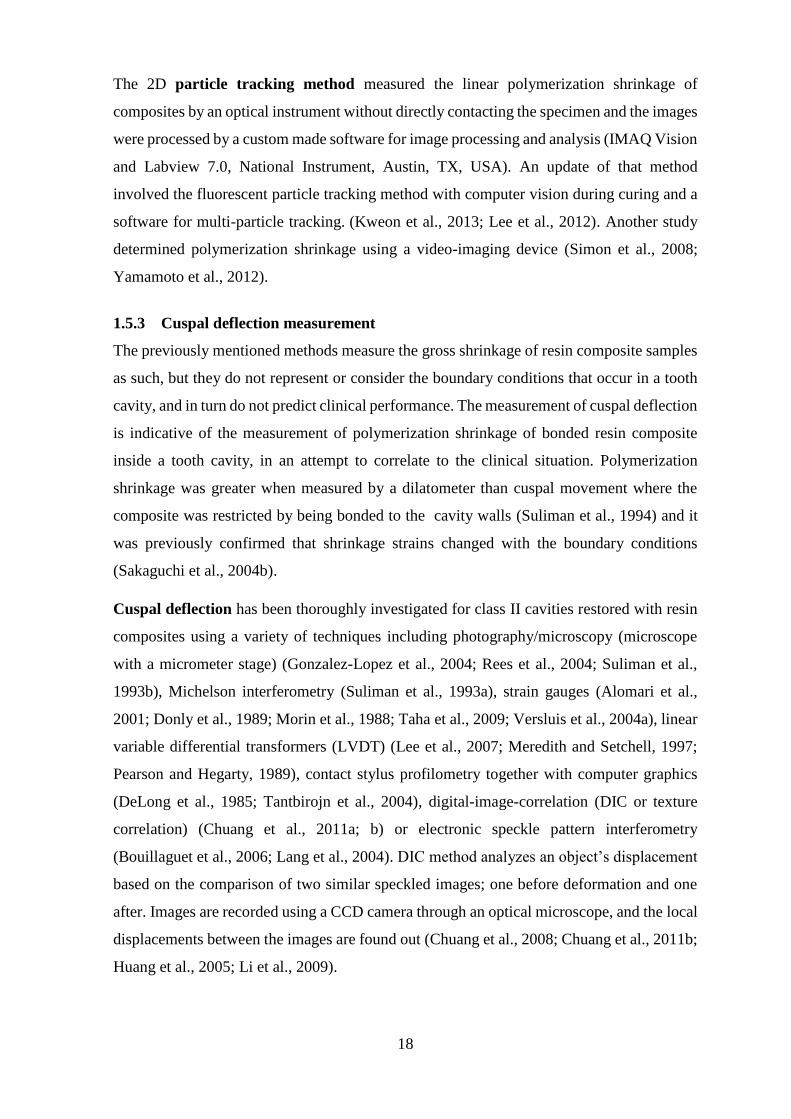
The 2D particle tracking method measured the linear polymerization shrinkage of
composites by an optical instrument without directly contacting the specimen and the images
were processed by a custom made software for image processing and analysis (IMAQ Vision
and Labview 7.0, National Instrument, Austin, TX, USA). An update of that method
involved the fluorescent particle tracking method with computer vision during curing and a
software for multi-particle tracking. (Kweon et al., 2013; Lee et al., 2012). Another study
determined polymerization shrinkage using a video-imaging device (Simon et al., 2008;
Yamamoto et al., 2012).
1.5.3 Cuspal deflection measurement
The previously mentioned methods measure the gross shrinkage of resin composite samples
as such, but they do not represent or consider the boundary conditions that occur in a tooth
cavity, and in turn do not predict clinical performance. The measurement of cuspal deflection
is indicative of the measurement of polymerization shrinkage of bonded resin composite
inside a tooth cavity, in an attempt to correlate to the clinical situation. Polymerization
shrinkage was greater when measured by a dilatometer than cuspal movement where the
composite was restricted by being bonded to the cavity walls (Suliman et al., 1994) and it
was previously confirmed that shrinkage strains changed with the boundary conditions
(Sakaguchi et al., 2004b).
Cuspal deflection has been thoroughly investigated for class II cavities restored with resin
composites using a variety of techniques including photography/microscopy (microscope
with a micrometer stage) (Gonzalez-Lopez et al., 2004; Rees et al., 2004; Suliman et al.,
1993b), Michelson interferometry (Suliman et al., 1993a), strain gauges (Alomari et al.,
2001; Donly et al., 1989; Morin et al., 1988; Taha et al., 2009; Versluis et al., 2004a), linear
variable differential transformers (LVDT) (Lee et al., 2007; Meredith and Setchell, 1997;
Pearson and Hegarty, 1989), contact stylus profilometry together with computer graphics
(DeLong et al., 1985; Tantbirojn et al., 2004), digital-image-correlation (DIC or texture
correlation) (Chuang et al., 2011a; b) or electronic speckle pattern interferometry
(Bouillaguet et al., 2006; Lang et al., 2004). DIC method analyzes an object’s displacement
based on the comparison of two similar speckled images; one before deformation and one
after. Images are recorded using a CCD camera through an optical microscope, and the local
displacements between the images are found out (Chuang et al., 2008; Chuang et al., 2011b;
Huang et al., 2005; Li et al., 2009).
19
The measured cuspal deflections averaged 15 µm up to 50 µm, but varied according to the
technique used. Absence of standardization of tooth size, cavity preparation and restoration
technique renders comparison of results difficult, since contraction of cusps depends on the
remaining tooth structure. Some studies combined cuspal deflection with microleakage
analysis (Moorthy et al., 2012) or shrinkage stress determination (Kwon et al., 2012).
The methods used are not standardized among the various testing labs. For this reason
comparisons of the results should be done with caution. One group of researchers have
performed various investigations with standardized cavity configurations that allow the
comparison of the results among their studies (Abbas et al., 2003; Cara et al., 2007; Fleming
et al., 2005; Fleming et al., 2007a; Fleming et al., 2007b; Moorthy et al., 2012; Palin et al.,
2005). Another difficulty of the interpretation of the results is when partial debonding of the
restoration happens, because it would decrease the cuspal movement, while the bond has
failed, thus, giving misleading results.
1.5.4 Measurement of adverse effects of polymerization shrinkage
A traditional method of determining the adverse effects of polymerization shrinkage includes
in vitro assessments of interfacial adaptation based on dye penetration, or quantitative
marginal gap analysis by the replica technique and SEM (Lutz et al., 1977; Qvist and Qvist,
1985; Roulet et al., 1991; van Dijken et al., 1985). Bond strength tests are also used to
evaluate the composite-dentin-bonding-agent-complex. There are various tests like the
shear, the tensile bond strength test, as well as the micro-shear and microtensile bond
strength tests (Armstrong et al., 2010; Braga et al., 2010). Data from labs worldwide using
various tests on the same material achieve different results, even microtests could not
eliminate the high degree of variations among results (Scherrer et al., 2010). Other in vitro
phenomena are used to evaluate the effects of polymerization shrinkage such as
microleakage, nanoleakage, structure and mechanical properties of the bonding interface.
These can also be related to bond strength values, but they do not necessarily correlate with
results of microleakge tests or gap formation at the cavity margin, whereas nanoleakage tests
and morphological and chemical characteristics of the bonding interface could be indicative
of future dentin bond durability (Tagami et al., 2010).
However, the clinical reliability of these tests were considerably questioned. It was
suggested to develop more appropriate bond test and analysis of in vitro phenomena (Tagami
et al., 2010), while others suggested to use an interfacial fracture mechanics approach for the
analysis of the dentin-adhesive bond for better agreement of test results (Scherrer et al.,

20
2010). In this regards, it was reported that the use of hydrophilic DBAs the dye penetration
method bore some difficulties in differentiating between the stained bonding agent and true
gaps. Furthermore, the accuracy of the replica technique was found to depend largely on the
quality of both the impression and replica for the margin analysis. In addition, it gives
information on the length but not the depth of defect, same applies to SEM (Chiang et al.,
2009).
1.5.5 Finite element analysis (FEA)
Polymerization shrinkage is also analyzed by methods like the finite element analysis. A
well known study is presented by Versluis et al., 1998, in which they questioned that
composites shrink toward the light. They proposed a cylindrical cavity with different
boundary conditions that were simulated by FEA and which stated that the shrinkage
direction of light cured dental composites depends on the boundary conditions, specially the
bonding between the restoration and the tooth rather than the light source (Versluis et al.,
1998). In an attempt to predict shrinkage stresses volumetric shrinkage was measured and
related to the C-factor; the stress peak correlated with the volumetric shrinkage but not with
the C-factor (Pabis et al., 2012).
1.5.6 Methods employing micro-CT data for the evaluation of polymerization
shrinkage
The microcomputed tomography is a cone beam tomography producing 3-dimensional
images of high resolution up to 6 µm. The micro-CT scans have been extensively used for
bone density investigation (Bouxsein et al., 2010; Wagner et al., 2011), mineral content
assessment in caries research (Clementino-Luedemann et al., 2006; Clementino-Luedemann
and Kunzelmann, 2006; Huang et al., 2007; Schwass et al., 2009; Zou et al., 2009), and tooth
modeling in finite element analysis (Magne, 2007).
Data acquisition for the evaluation of polymerization shrinkage has been performed by
different researchers and could be divided into two distinct parts: on one hand the assessment
of volumetric changes and resulting gap analysis or detachment of the restorative material
from the cavity interface, and on the other hand the shrinkage vector calculations by the use
of particle tracing before and after polymerization.
1.5.6.1 Volumetric evaluation of polymerization shrinkage
Non-destructive investigation of the marginal adaptation and the adhesive interface were
performed (De Santis et al., 2005; Kakaboura et al., 2007; Meleo et al., 2012), in addition to

21
the evaluation of the internal adaptation of adhesive restorations (Kwon and Park, 2012).
The research group at the ADA Foundation in Gaithersburg, USA, published studies on
volume loss of resin composites (Sun and Lin-Gibson, 2008; Sun et al., 2009a; Zeiger et al.,
2009) and volume loss in association with direct non-destructive microleakage investigation
(Sun et al., 2009a; Sun et al., 2009b). The disadvantage of this method is that gaps are
detectable at x 2.5 voxel size which is a rather insensitive method. Currently a typical micro-
CT resolves 6-8 µm which corresponds to a detectable gap size of 25-30 µm.
1.5.6.2 Methods utilizing the shrinkage vectors methods
The visualization of polymerization shrinkage in form of shrinkage vectors is a technique
that has been introduced and improved by the research group at the Tokyo University, Japan
(Cho et al., 2011; Inai et al., 2002). The basic concept of this technique has been adopted
and furtherly developed by the research group at the Ludwig-Maximilians-Universität
(LMU) in Munich, Germany (Chiang et al., 2009; Chiang et al., 2010; Rösch et al., 2009).
Medical image registration
The use of radiological images has increased in medical research and healthcare. Generally,
image registration can be used for combining images of one subject, therefore compensating
for example for motion between scans. This is performed by registration algorithms that
automatically register images by a rigid body transformation. On the other hand, non-rigid
registration algorithms compensate for tissue deformation or align images from different
subjects (Fischer and Modersitzki, 2008; Hill et al., 2001).
Medical image registration methods are important in brain tumor studies for tumor
visualization and observation (Bauer et al., 2013). In dentistry, Kunzelmann, 1996, was one
of the first to visualize 3D data for wear analysis and quantification of filling materials in
vitro and in vivo (Kunzelmann, 1996). Swennen et al., 2007, have applied the rigid
registration method for detailed visualization of the interocclusal relationship in the course
of 3D virtual planning of orthognathic surgery. They designed a 3D splint with the double
CT scan procedure to obtain an anatomic 3D virtual augmented model of the skull with
detailed dental surface (Swennen et al., 2007). Sandholzer et al., 2013, used quantitative
micro-CT data for studying the 3D shrinkage and shape preservation of human teeth upon
heating which is relevant information for forensic investigators (Sandholzer et al., 2013).

22
Methods for acquiring polymerization shrinkage vectors
Shrinkage vectors represent the magnitude and direction in which shrinkage occurs (Watts
and Cash, 1991). The Tokyo-group invented the filler-tracing-method for visualization of
polymerization shrinkage by obtaining real polymerization shrinkage vectors. They
embedded radioopaque zirconia fillers into a resin composite, scanned the restoration before
and after light-curing, identified the fillers manually in both scans and calculated the
movement 2-dimensionally (Inai et al., 2002).
The first automated process was conducted by the Munich-group in which micro-CT
datasets were combined with the images registration approach to determine and visualize the
direction and amount of polymerization shrinkage vectors 2-dimensionally then 3-
dimensionally. Radiolucent glass fillers were embedded into a flowable resin-composite to
avoid reconstruction artifacts in the micro-CT, then scanned with a micro-CT before and
after light-curing, and traced.
In the 2D-study the displacement vector field was calculated with an elastic registration
algorithm using vector-spline regularization combined with B-spline based elastic
registration (Arganda-Carreras et al., 2006; Chiang et al., 2008; Chiang et al., 2009; Kybic
and Unser, 2003; Sorzano et al., 2005). The basic idea of the elastic registration is the
application of a grid to both pre-and-post-polymerization scan images, where the regular
grid is applied to the pre-polymerization situation, and the deformed grid to the post-
polymerization. The grid itself is elastic and its deformation costs energy; with larger
deformations requiring more energy. One of the images is the elastically deformed version
of the other. The main goal of elastic registration is fitting the grid to the new position by
using the least possible energy, where the points of grid deformation are identical to the
tracer markers. To register two images, it was assumed that one the images, the source image,
is an elastically deformed version of the other, the target image; elastic fields can be
expressed in terms of B-splines. Image registration can be carried out using landmark-based
or landmark-independent registration algorithms, the latter being superior when the image
exhibits major deformations or when the information is unevenly distributed. The grid is fit
to the tracer markers that constitute landmarks that are identical to the points where the grid
is deformed and being fit to new position based on tracer markers by elastic registration.
However, tracer markers are not evenly distributed in every 2D section of the 3D scan and
the missing deformations are assumed. Consequently, the elastic registration based on B-
splines regularization is highly dependent on its parameter values and in case of improper

23
assumptions might lead to incorrect results. For visualization purposes, the shrinkage vectors
were displayed as glyphs (Chiang et al., 2008; Chiang et al., 2009).
(A)
(B)
Figure 10 The image processing of the 2D shrinkage vector evaluation: (A) the original
source image of the uncured resin composite with the deformation grid. (B) The
displacement field obtained from the elastic registration is superimposed to the output
source-target image of the registered target image. The vector field displays the deformation
due to the mass movement of the polymerization shrinkage and the dotted line marks the
deformed shape after light-curing of the composite (Chiang et al., 2009). Reuse of the images
is with written permission by Dr Yu-Chih Chiang (2014).
Moreover, they analyzed 3D shrinkage vectors using the same experimental flowable
composite, but implementing a different method of image registration based on a block-
matching algorithm. It consisted of a three-step approach: first, the subimage selection from
the micro-CT scans with the software InsightSNAP (www.itksnap.org), second, the sphere
segmentation, which is the identification and separation of glass spheres from the rest of the
restoration in the uncured image, depending on the grey value, and third, the registration of
the individual spheres through local rigid registration (the block-matching) to determine the
segmented spheres’ displacement during the polymerization process. They visualized the
deformation 3-dimensionally field using VTK (www.vtk.org) and vector lengths were
obtained (Chiang et al., 2009; Chiang et al., 2010; Rösch et al., 2009).

24
Figure 11 The 3D deformation field by Chiang et al., 2009 (Chiang et al., 2009). Reuse of
the images is with written permission by Dr Yu-Chih Chiang (2014).
The results of the Munich-group in the 2D investigation were in agreement with those of
the 3D analysis. The composite was applied in a cylindrical class I cavity. In the unbonded
group, composite adhered to one side and pulled from the other wall, thereby forming a
compensatory gap. In the bonded group, cavities with equal enamel thickness at both
margins the displacement vectors showed upward shrinkage, with small vectors near the
enamel and a translucent area was detected at the bottom. In the bonded group with unequal
enamel margins the main orientation of the displacement vector field was toward the bottom
of the cavity and to the side with greater amount of enamel with a compensatory mass
movement at the top of the restoration. In a further study, they applied the composite in a
trapezoidal class I cavity with dentin walls only to study the effect of different self-etch
bonding systems on the polymerization shrinkage direction. The displacement vector fields
and vector lengths varied depending on the bonding agent used. With ClearFil SE Bond and
OptiBond the vectors moved downward, while with Xeno V it was the opposite (Chiang et
al., 2009; Chiang et al., 2010).
In the second study of the Tokyo-group, they imported the micro-CT-scan data of the
composite restorations before and after polymerization into a custom made software, the 3D-
BON software (Ratoc Systems Engineering, Tokyo, Japan) and used a cluster-labeling
algorithm to extract the fillers and perform the pairing procedure as has been introduced
earlier by the Munich-group (Chiang et al., 2008; Cho et al., 2011; Rösch et al., 2009).
Images were reconstructed from the data by a 3D data visualization tool Avizo 6.2
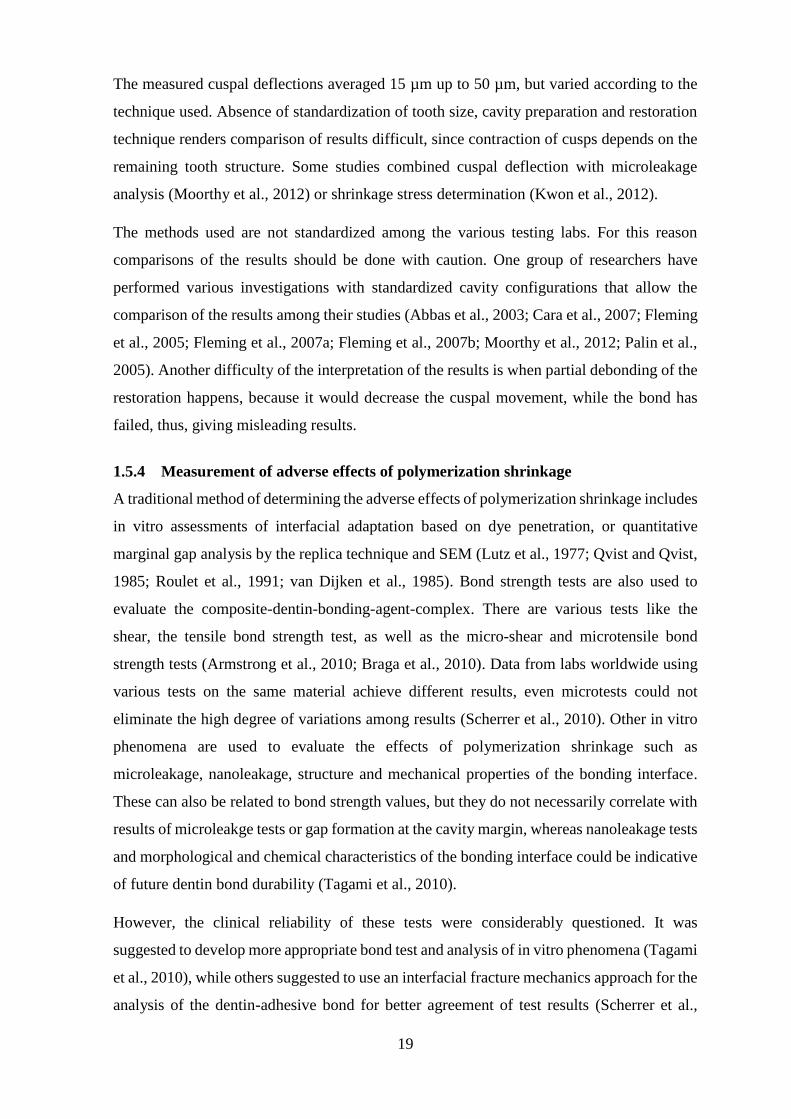
25
(Visualization Sciences Group, Burlington, MA). The movement distance of each filler after
polymerization was obtained 3-dimensionally. However, the analysis of filler movement was
limited to the axial direction, i.e. in relation to the light source, by dividing filler movement
data into 165 regions within the restoration. In the bonded condition, their findings showed
downward shrinkage at the superficial part (1 mm), and an upward shrinkage, toward light,
in the deeper part of the restoration, whereas the unbonded restorative material completely
shrunk upward, toward light, (Cho et al., 2011). One drawback of this method is the
radioopacity of the zirconium dioxide fillers introducing reconstruction artifacts in the
micro-CT.
Figure 12 The 3D image obtained by superimposing micro-CT scans from the composite
before and after polymerization. The three slices are representative of the 165 slices that
were analyzed for the filler movement in the axial direction by Cho et al., 2011 (Cho et al.,
2011). Reuse of the images is with written permission by Elsevier/RightsLink (2014).

26
Figure 13 The 3D vector field image represents the filler movement direction in the bonded
group by Cho et al., 2011 (Cho et al., 2011). Reuse of the images is with written permission
by Elsevier/RightsLink (2014).
Polymerization shrinkage is generally related to the material’s properties, the light source
and the boundary conditions. Flowable resin composites have a lower modulus of elasticity
and exhibit greater amounts of volumetric shrinkage, thus, facilitating the visualization of
shrinkage vectors. A more flexible material generates less shrinkage stresses at the tooth-
restoration-interface than a stiffer one as the pre-gelation flow compensates for the
shrinkage. Moreover, the polymerization is affected by aspects related to the light source.
The power output varies among light-curing units, the distance between the light-guide and
the restoration should be as small as possible so that more photons reach the full depth of
the restoration (Price et al., 2010b; Price et al., 2010e; Price et al., 2011). Also, the direction
of light application might have an influence on the shrinkage. In the presented studies the
light was applied perpendicular to the long axis of the tooth, while Versluis et al., 1998, have
added a 45 degree angulation which resulted in only small changes of the shrinkage direction
in their FEA evaluation (Versluis et al., 1998).
The available data on the shrinkage vectors give insight into the shrinkage direction of light-
cured composites using micro-CT data sets. Only few aspects of boundary conditions were

27
reported such as bonded and unbonded restorations, the use of various self-etch adhesives
and the effect of unequal enamel margins on the shrinkage direction (Chiang et al., 2009;
Chiang et al., 2010; Cho et al., 2011). Yet, further investigations are needed to clarify the
effect of the boundary conditions on the shrinkage vectors.
28
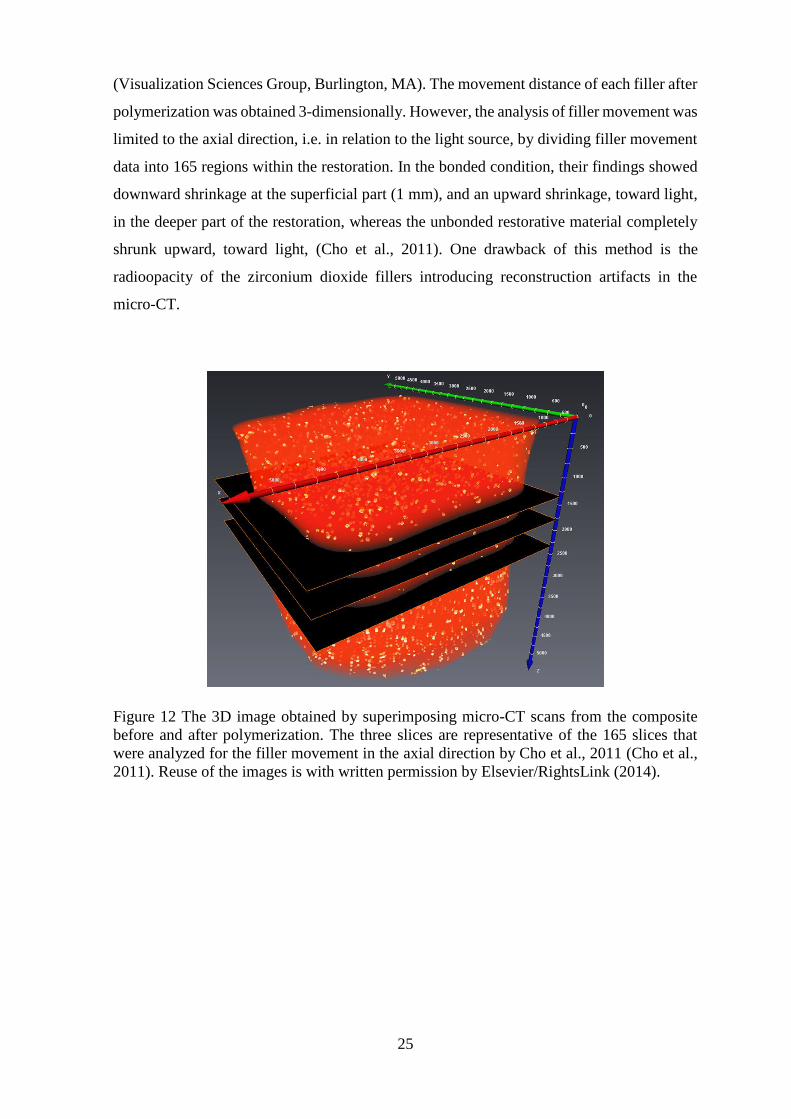
2 Aim of the study
The 3D evaluation method of shrinkage vectors in light-cured composites was proposed by
Rösch et al., 2009, and employed by Chiang et al., 2009, 2010 (Chiang et al., 2009; Chiang
et al., 2010; Rösch et al., 2009). It is an accurate tool for the quantification of polymerization
shrinkage vectors and it displays the internal movements within the restoration that could
not be seen otherwise. Therefore, the aim of this study was to investigate the effect of
boundary conditions on the polymerization shrinkage of a light-initiated resin composite in
form of displacement vector fields. Polymerization shrinkage was visualized 3-
dimensionally and shrinkage vectors were also analyzed in the axial direction. Boundary
conditions consisted of the cavity configuration, the bonding condition and the bonding
substrate (Figure 14).
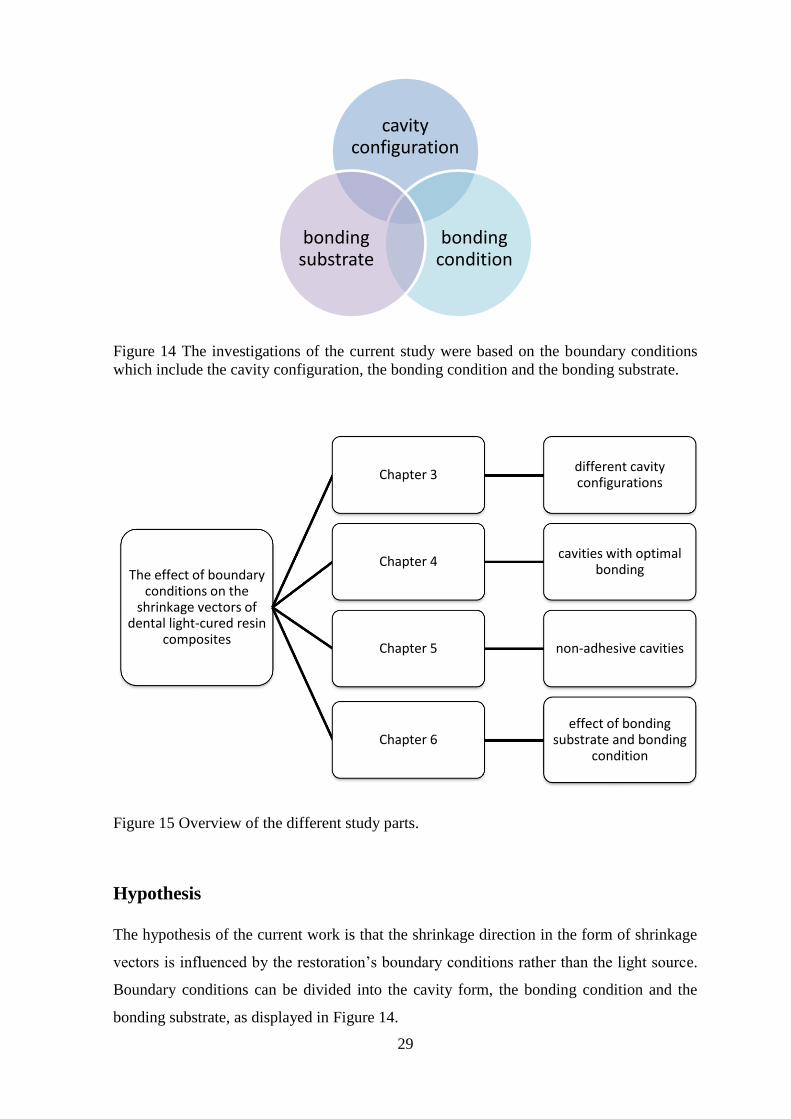
Each chapter addressed a certain topic related to the boundary conditions. In Chapter 3 the
specific aim was to study the effect of different cavity configurations on the shrinkage
vectors which is of clinical relevance. The prepared cavities could be standardized, while
human teeth could not. For this reason, Chapter 4 was proposed to study the shrinkage
vectors with the least possible influence by the substrate in etched and silanized ceramic
cavities with and without a dentin bonding agent. In contrast, Chapter 5 aimed at evaluating
the effect of a nonbonded boundary condition on the shrinkage in a non-adhesive Teflon
mold. Here, only the cavity configuration played a role, independent of the adhesion.
“Bonding to enamel is stronger than bonding to dentin”. How does this statement translate
into the shrinkage behavior of composites upon light-curing? To find out, the effect of the
tooth’s coronal bonding substrates, enamel and dentin, was studied by using an experimental
cavity model where enamel was located at the cavity floor in opposition to the traditional
cavity with enamel at the cavity margins, Chapter 6. Additionally, the effect of a self-etch
versus a total-etch adhesive was analyzed. Figure 15 summarizes the specific objectives of
the current study.
29
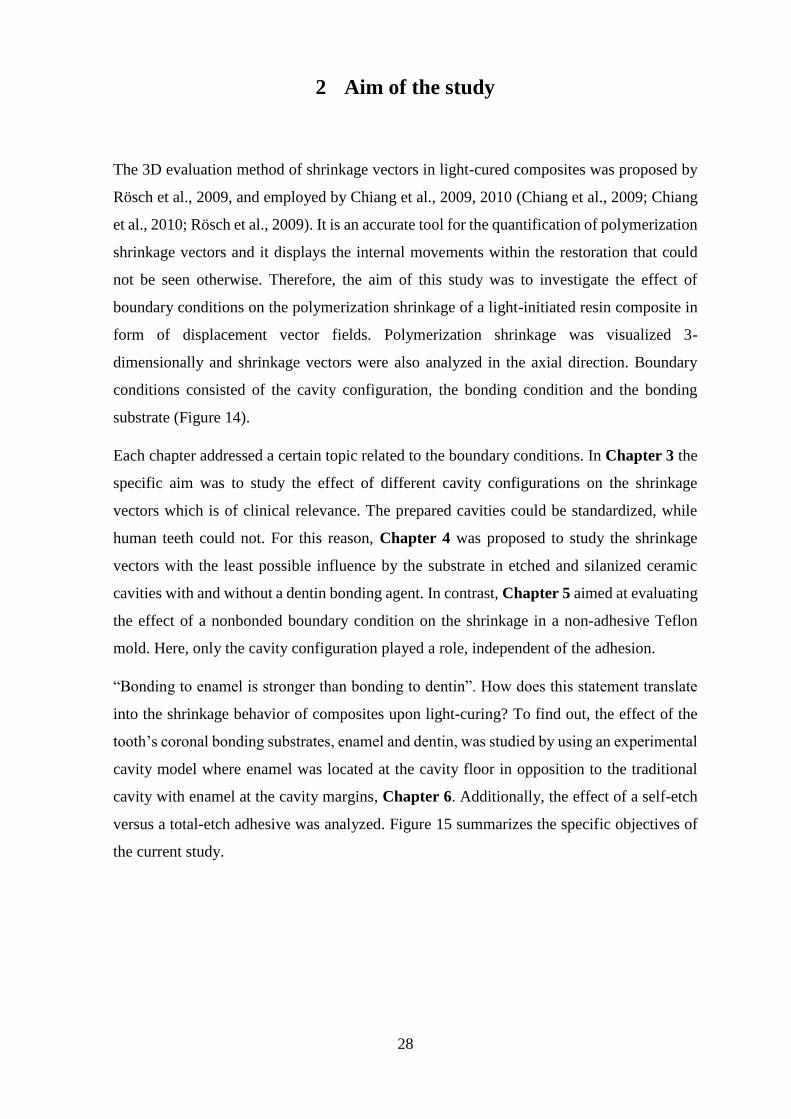
Figure 14 The investigations of the current study were based on the boundary conditions
which include the cavity configuration, the bonding condition and the bonding substrate.
Figure 15 Overview of the different study parts.
Hypothesis
The hypothesis of the current work is that the shrinkage direction in the form of shrinkage
vectors is influenced by the restoration’s boundary conditions rather than the light source.
Boundary conditions can be divided into the cavity form, the bonding condition and the
bonding substrate, as displayed in Figure 14.
cavity configuration
bonding condition
bonding substrate
The effect of boundary conditions on the
shrinkage vectors of dental light-cured resin
composites
Chapter 3different cavity configurations
Chapter 4cavities with optimal
bonding
Chapter 5 non-adhesive cavities
Chapter 6effect of bonding
substrate and bonding condition
30
3 Shrinkage Vectors in Different Cavity Configurations
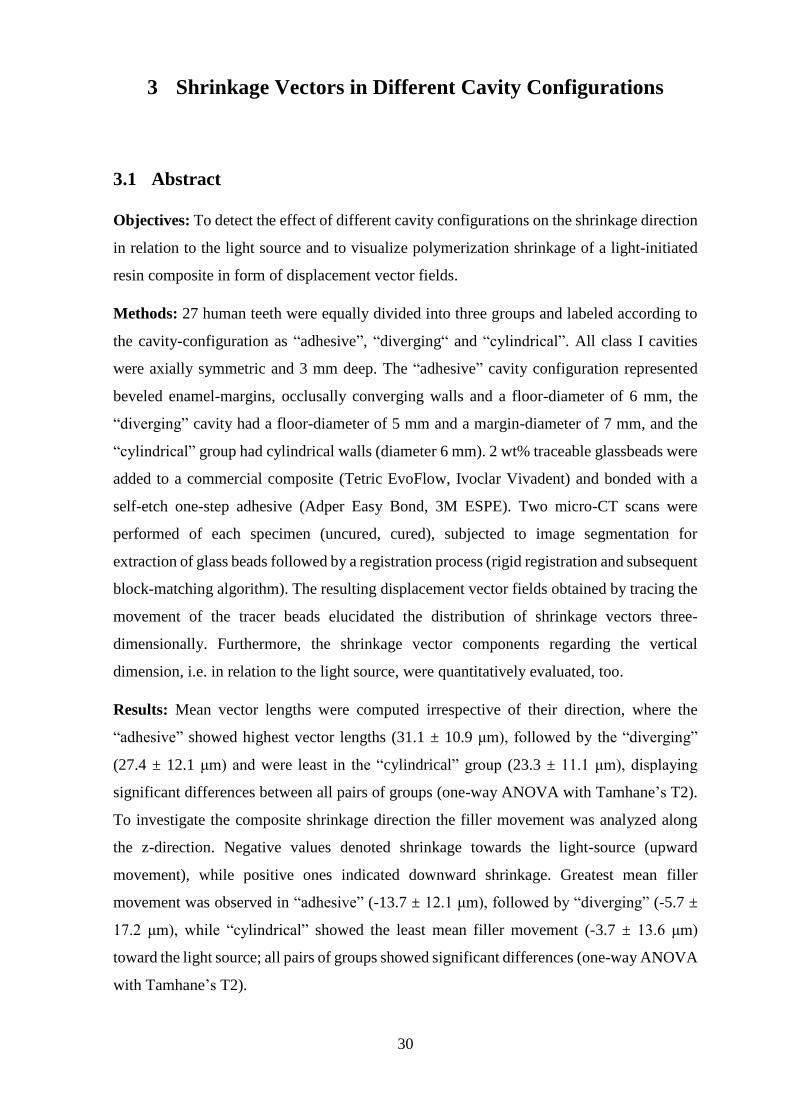
3.1 Abstract
Objectives: To detect the effect of different cavity configurations on the shrinkage direction
in relation to the light source and to visualize polymerization shrinkage of a light-initiated
resin composite in form of displacement vector fields.
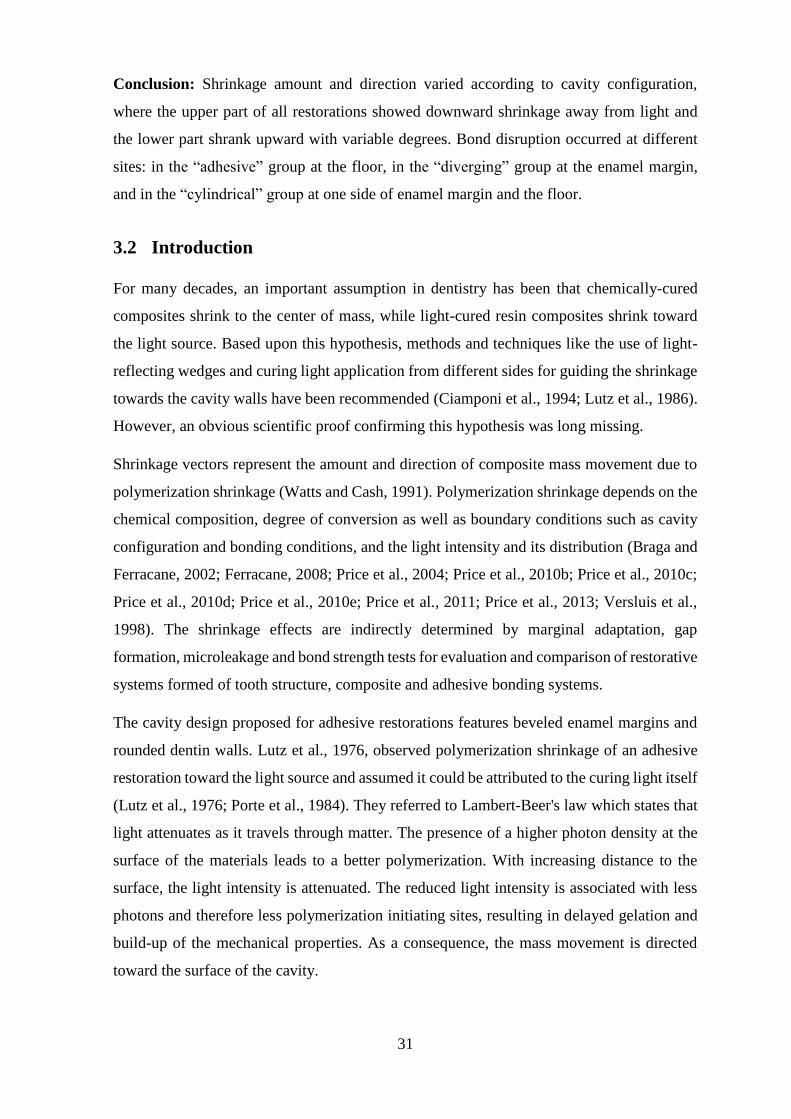
Methods: 27 human teeth were equally divided into three groups and labeled according to
the cavity-configuration as “adhesive”, “diverging“ and “cylindrical”. All class I cavities
were axially symmetric and 3 mm deep. The “adhesive” cavity configuration represented
beveled enamel-margins, occlusally converging walls and a floor-diameter of 6 mm, the
“diverging” cavity had a floor-diameter of 5 mm and a margin-diameter of 7 mm, and the
“cylindrical” group had cylindrical walls (diameter 6 mm). 2 wt% traceable glassbeads were
added to a commercial composite (Tetric EvoFlow, Ivoclar Vivadent) and bonded with a
self-etch one-step adhesive (Adper Easy Bond, 3M ESPE). Two micro-CT scans were
performed of each specimen (uncured, cured), subjected to image segmentation for
extraction of glass beads followed by a registration process (rigid registration and subsequent
block-matching algorithm). The resulting displacement vector fields obtained by tracing the
movement of the tracer beads elucidated the distribution of shrinkage vectors three-
dimensionally. Furthermore, the shrinkage vector components regarding the vertical
dimension, i.e. in relation to the light source, were quantitatively evaluated, too.
Results: Mean vector lengths were computed irrespective of their direction, where the
“adhesive” showed highest vector lengths (31.1 ± 10.9 μm), followed by the “diverging”
(27.4 ± 12.1 μm) and were least in the “cylindrical” group (23.3 ± 11.1 μm), displaying
significant differences between all pairs of groups (one-way ANOVA with Tamhane’s T2).
To investigate the composite shrinkage direction the filler movement was analyzed along
the z-direction. Negative values denoted shrinkage towards the light-source (upward
movement), while positive ones indicated downward shrinkage. Greatest mean filler
movement was observed in “adhesive” (-13.7 ± 12.1 μm), followed by “diverging” (-5.7 ±
17.2 μm), while “cylindrical” showed the least mean filler movement (-3.7 ± 13.6 μm)
toward the light source; all pairs of groups showed significant differences (one-way ANOVA
with Tamhane’s T2).
31
Conclusion: Shrinkage amount and direction varied according to cavity configuration,
where the upper part of all restorations showed downward shrinkage away from light and
the lower part shrank upward with variable degrees. Bond disruption occurred at different
sites: in the “adhesive” group at the floor, in the “diverging” group at the enamel margin,
and in the “cylindrical” group at one side of enamel margin and the floor.
3.2 Introduction
For many decades, an important assumption in dentistry has been that chemically-cured
composites shrink to the center of mass, while light-cured resin composites shrink toward
the light source. Based upon this hypothesis, methods and techniques like the use of light-
reflecting wedges and curing light application from different sides for guiding the shrinkage
towards the cavity walls have been recommended (Ciamponi et al., 1994; Lutz et al., 1986).
However, an obvious scientific proof confirming this hypothesis was long missing.
Shrinkage vectors represent the amount and direction of composite mass movement due to
polymerization shrinkage (Watts and Cash, 1991). Polymerization shrinkage depends on the
chemical composition, degree of conversion as well as boundary conditions such as cavity
configuration and bonding conditions, and the light intensity and its distribution (Braga and
Ferracane, 2002; Ferracane, 2008; Price et al., 2004; Price et al., 2010b; Price et al., 2010c;
Price et al., 2010d; Price et al., 2010e; Price et al., 2011; Price et al., 2013; Versluis et al.,
1998). The shrinkage effects are indirectly determined by marginal adaptation, gap
formation, microleakage and bond strength tests for evaluation and comparison of restorative
systems formed of tooth structure, composite and adhesive bonding systems.
The cavity design proposed for adhesive restorations features beveled enamel margins and
rounded dentin walls. Lutz et al., 1976, observed polymerization shrinkage of an adhesive
restoration toward the light source and assumed it could be attributed to the curing light itself
(Lutz et al., 1976; Porte et al., 1984). They referred to Lambert-Beer's law which states that
light attenuates as it travels through matter. The presence of a higher photon density at the
surface of the materials leads to a better polymerization. With increasing distance to the
surface, the light intensity is attenuated. The reduced light intensity is associated with less
photons and therefore less polymerization initiating sites, resulting in delayed gelation and
build-up of the mechanical properties. As a consequence, the mass movement is directed
toward the surface of the cavity.

32
Versluis et al., 1998, conducted a finite element analysis (FEA) and claimed that shrinkage
was not necessarily toward the light source, but was rather affected by the bonding of the
restoration and free surfaces, in other words, by the boundary conditions (Versluis et al.,
1998). FEA is a good predictor but FEA is only as accurate as the parameters and
assumptions based upon. Shrinkage usually is simulated in FEA with a heat transfer
approach. The volume which represents the composite material is cooled in the simulation
to cause a contraction. The consequences of this contraction are assumed to be similar to the
consequences of curing contractions. This approach does not include light attenuation as a
function of the distance to the light source. In addition, the boundary conditions usually are
assumed to be constant during the loading phase. Only recently the analysis of crack
propagation was added to the finite element models for contraction stress analysis but for a
different topic (Yamamoto et al., 2009). Even with refined FEA models the outcome always
has to be validated with adequate experiments.
The first real visualization of polymerization shrinkage was demonstrated by Inai et al.,
2002, who embedded radioopaque zirconia fillers into a resin composite and scanned the
restoration before and after light-curing. The fillers in both scans were identified manually
and the movement was calculated 2-dimensionally (Inai et al., 2002). Chiang et al., (2009)
were the first to investigate the polymerization shrinkage direction with an automated
process first 2-dimensionally and later even 3-dimensionally, based on a block-matching
algorithm. They used radiolucent glass fillers which were embedded into a flowable resin-
composite, scanned with a micro-CT before and after light-curing, and then the movement
of each individual particle was traced. The shrinkage vectors were displayed as glyphs
(Chiang et al., 2009; Chiang et al., 2010). The radiolucent glass fillers are advantageous, as
they do not result in reconstruction artefacts. Due to the high radiopacity the zirconia fillers
cause extensive scattering which affects the reconstruction negatively.
Do composites shrink toward the light? Is the shrinkage direction influenced by the
attenuation of light as it travels through matter or does the beveling hinder the composite
from moving downward? The boundary conditions depend on several variables as for
example the shape of the cavity (= cavity configuration), the bonding conditions and the
bonding substrates. In order to clarify whether the adhesive cavity design influences the
shrinkage direction, two other cavity configurations were proposed. The “diverging” cavity
(cone trunk shaped) represented no configurational influence if composite would shrink
towards light, while the “cylindrical” cavity could have frictional effects upon composite
shrinkage, but is neutral regarding any possible movement in axial direction.

33
3.3 Aim of the study
The aim of this study was to analyze the effect of different cavity configurations on the
shrinkage direction in relation to the light-source, to visualize the polymerization shrinkage
of a light-initiated resin composite qualitatively in the form of displacement vector fields 3-
dimensionally and to analyze the axial filler movement quantitatively.
3.4 Materials and Methods
The experimental composite and the self-etch adhesive listed in Table 4 were used for the
restorative procedure. The extracted teeth were collected and stored in sodium azide in the
dark. The experimental procedures were approved by the ethics committee of the medical
faculty of the Ludwig Maximilians University, Munich, Germany.
3.4.1 Specimen preparation
27 human teeth were divided into three groups which will be labeled in the following text as
"adhesive", "diverging" and “cylindrical” cavities. All samples were 3 mm deep class I
cavities. Outside the cavity without contact to the cavity margin the occlusal cups of the teeth
were slightly flattened for easier perpendicular light application.
The "adhesive cavity" design, as proposed by Lutz, displayed narrow beveled occlusal
margins as indicated for the adhesive restorations and the dentin walls of the cavity were
rounded (Lutz et al., 1976). The "diverging" cavity had occlusally diverging walls, with the
outer cavity margin 7 mm in diameter and the cavity floor 5 mm in diameter. This cavity
design was included to allow for unimpeded upward movement of the composite in case it
would shrink toward the light source. The "cylindrical" cavity was prepared according to
Chiang with parallel walls, being neutral to any direction of shrinkage (Chiang et al., 2009;
Chiang et al., 2010; Versluis et al., 1998).
The teeth were embedded in an acrylic resin (Technovit 4000, Heraeus Kulzer, Germany)
and fixed to the sample holder with composite to prevent any movement during the scanning
procedure.
3.4.2 Preparation of the experimental traceable resin composite
A flowable resin composite (Tetric EvoFlow, Ivoclar Vivadent, Schaan Liechtenstein), was
mixed with 2 wt% silanized radiolucent glass fillers with an average particle size of 40-70
µm (Sigmund Lindner GmbH, Warmensteinach, Germany). Silanization of the glass fillers

34
was performed to ensure a durable bond between the fillers and the resin matrix (Liu et al.,
2001).
Adper Easy Bond, 3M ESPE, a self-etch one step bonding agent was applied for 20 s, air
thinned for 5 s and light cured for 20 s using the light-curing unit Elipar FreeLight2, 3M
ESPE (power output 1200 mW/cm2 according to the manufacturer, checked for constant
light intensity once/week with a dental radiometer). The composite was applied into the
prepared cavity and remained uncured. There was no specific reason for the selection of
Tetric EvoFlow or Adper Easy Bond. The flowable was used to ensure a good marginal
adaptation. The depth of cure at 3 mm was confirmed by Lindberg et al., 2004 (Lindberg et
al., 2004). We used a modified commercial composite instead of a self-mixed model
composite to ensure a constant quality and allow the comparison of the results of studies by
Chiang et al. (Chiang et al., 2009; Chiang et al., 2010). In addition to that Tetric EvoFlow
has by accident the perfect radioopacity for the segmentation of the glass beads.
3.4.3 X-ray micro-computed tomography measurements
A high resolution micro-computed tomography apparatus (Micro-CT 40, Scanco Medical
AG, Switzerland) was used for scanning the samples (Figure 16). The settings for the micro-
CT were: acceleration voltage 70 kVp and cathode current 114 μA. The samples were
scanned with high (83 μm3) resolution using an integration time of 600 ms. A few drops of
water were added to the sample holder to prevent dehydration and subsequent cracking of
the tooth during tooth scanning. The sample holder was covered with a radiolucent and dark
cap to avoid premature polymerization of the uncured resin composite material during the
scanning procedure, and placed inside the micro-CT machine for the first micro-CT scan.
Then the composite was light-cured for 40 s and the sample was scanned again using the
same parameters as before (Figure 17). During the whole process the sample remained in the
sample holder to avoid a gross displacement of the tooth to facilitate and speed up the
subsequent registration of the datasets. After the raw micro-CT scans were reconstructed and
saved a 16-bit datasets of the attenuation coefficient per voxel. Each dataset was
approximately 3.9 GB large. Details of the workflow are presented in the scheme below
(Figure 18).

35
Figure 16 The high resolution micro-computed tomography, µCT 40, Scanco Medical AG,
Switzerland, was used for the 3D scanning procedure of the restorations.
(A)
(B)
(C)
Figure 17 The prepared and filled tooth in the sample holder in the micro-CT (A), covered
with a radiolucent and dark cap to avoid premature polymerization during the first scan (B).
Light curing (20 s) of the composite was performed while the sample remained in the micro-
CT machine (C).
36
Figure 18 Scheme of the workflow for obtaining the digital 3D-data sets from the micro-CT.

37
3.4.4 Data processing
The basic idea was to identify each individual embedded glass sphere and follow the position
change of the glass spheres due to polymerization shrinkage in both scans. Data processing
was performed in different steps consisting of a rigid registration, followed by sphere
segmentation and registration of each individual sphere based on a block-matching
algorithm, as shown in Figure 19 (Chiang et al., 2008; Chiang et al., 2009; Chiang et al.,
2010; Rösch et al., 2009).
3.4.4.1 Rigid registration
Rigid registration was first performed to perfectly match the pre- and post-polymerization
scans via the outer tooth contours of each sample. The enamel shell and the dentino-enamel
junction served as references which ensured the exact matching of both scans.
Implementation was based on the Insight Toolkit, ITK (www.itk.org).
3.4.4.2 Sphere segmentation and sphere registration
This step was performed to detect the change in position of each glass filler that occurred
due to the polymerization shrinkage. Data were prepared for calculations using Fiji
(http://fiji.sc/Fiji).
Sphere segmentation was performed for the extraction of glass fillers based on the
greyvalues of the micro-CT scans. Glass beads have a characteristic diameter of 40-70 µm
and they can be identified via the tensor of inertia. Only those glass fillers were registered
that have been distinctly identified. Each identified spherical structure (glass filler) was
labeled and traced in both scans of each sample, where non-spherical structures were
discarded.
Sphere registration involved the identification of fillers and the location of each filler in both
corresponding scans was calculated.
Starting with the larger glass fillers of the pre-polymerization scans, the search proceeds in
the neighboring areas of the post-polymerization scans as the larger glass fillers are assumed
to be located in close proximity. This gives a clue about the change in position of the glass
fillers due to the contraction movement. Thus, if glass fillers overlap in the pre- and post-
polymerization scans, they are assumed to form a “pair”. Taking the orientation of the larger
glass filler, smaller ones are searched for by the same method on the basis of the tensor of
inertia of each glass filler. The center of each glass filler is determined in the pre-
polymerization scan and its corresponding center in the post-polymerization scan. The
38
Euclidian distance of both centers constitutes the shrinkage vector. These calculations are
based on the block-matching algorithm.
3.4.4.3 Visualization of shrinkage vectors
The displacement vector fields were visualized using VTK (www.vtk.org), where each
vector was represented graphically in form of a glyph pointing in the direction of shrinkage.
All vectors together formed the displacement vector field. For better visibility of the
displacement vector fields, the vectors were scaled by the factor 5. The displacement vector
fields were analyzed visually for shrinkage patterns.
3.4.4.4 Values of shrinkage vectors
The output of the registration process was in form of a text file that contained the location
of each identified filler, defined by the xyz-coordinates, in the pre-polymerization scan as
well as in the post-polymerization scan. Absolute values of the displacement vectors were
calculated as the Euclidean distance of the centers of gravity of each segmented individual
sphere before and after curing:
v = √(xpostpolym − xprepolym)2 + (ypostpolym − yprepolym)2 + (zpostpolym − zprepolym)2
Analysis of shrinkage in relation to the light source was performed by examining only the z-
component of vectors denoting the filler movement along the z-axis:
vz−component = zpostpolym − zprepolym
3.4.4.5 Statistical analysis
The mean vector lengths were computed and subjected to one-way ANOVA with post-hoc
pairwise comparisons using Tamhane’s T2 (using IBM SPSS Statistics 20).
3.4.5 Scanning electron microscopy
One sample per group was critically point dried, sectioned longitudinally and examined for
internal adaptation with a scanning electron microscope (ZEISS GEMINI® FESEM,
SUPRA™ 55VP, Carl Zeiss SMT AG, Oberkochen, Germany) at x200 magnification (Figure
66).
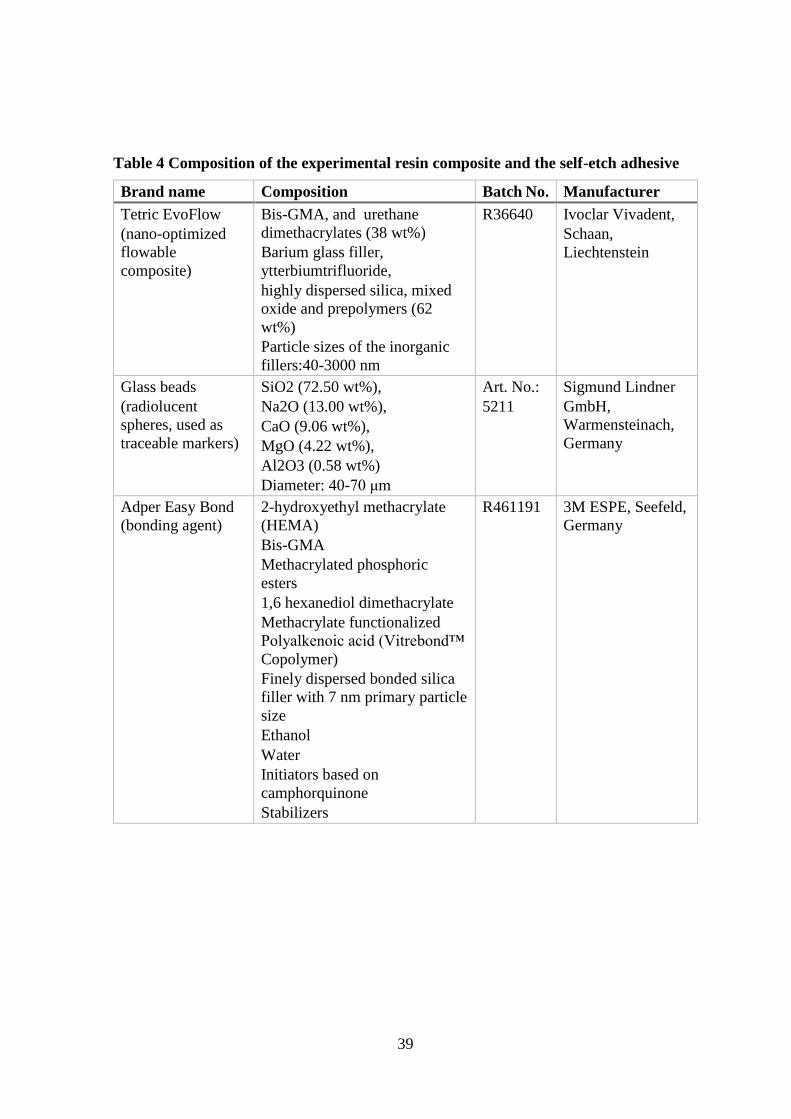
39
Table 4 Composition of the experimental resin composite and the self-etch adhesive
Brand name Composition Batch No. Manufacturer
Tetric EvoFlow
(nano-optimized
flowable
composite)
Bis-GMA, and urethane
dimethacrylates (38 wt%)
Barium glass filler,
ytterbiumtrifluoride,
highly dispersed silica, mixed
oxide and prepolymers (62
wt%)
Particle sizes of the inorganic
fillers:40-3000 nm
R36640 Ivoclar Vivadent,
Schaan,
Liechtenstein
Glass beads
(radiolucent
spheres, used as
traceable markers)
SiO2 (72.50 wt%),
Na2O (13.00 wt%),
CaO (9.06 wt%),
MgO (4.22 wt%),
Al2O3 (0.58 wt%)
Diameter: 40-70 μm
Art. No.:
5211
Sigmund Lindner
GmbH,
Warmensteinach,
Germany
Adper Easy Bond
(bonding agent)
2-hydroxyethyl methacrylate
(HEMA)
Bis-GMA
Methacrylated phosphoric
esters
1,6 hexanediol dimethacrylate
Methacrylate functionalized
Polyalkenoic acid (Vitrebond™
Copolymer)
Finely dispersed bonded silica
filler with 7 nm primary particle
size
Ethanol
Water
Initiators based on
camphorquinone
Stabilizers
R461191 3M ESPE, Seefeld,
Germany
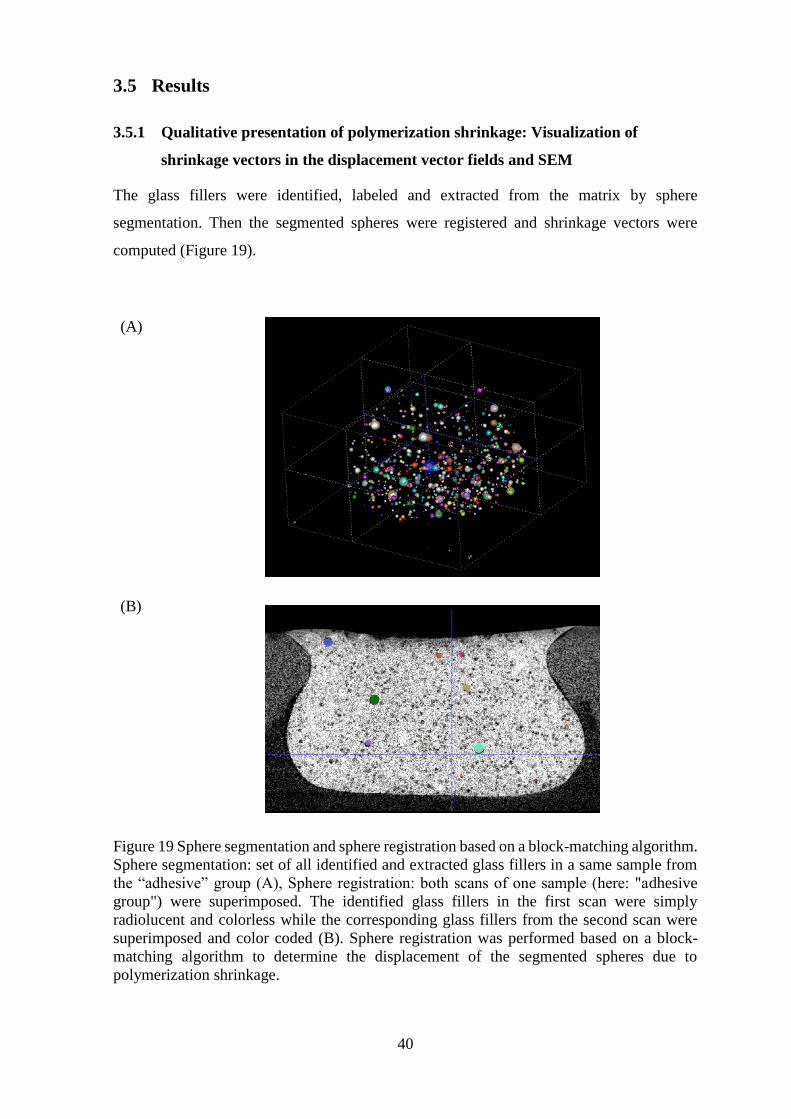
40
3.5 Results
3.5.1 Qualitative presentation of polymerization shrinkage: Visualization of
shrinkage vectors in the displacement vector fields and SEM
The glass fillers were identified, labeled and extracted from the matrix by sphere
segmentation. Then the segmented spheres were registered and shrinkage vectors were
computed (Figure 19).
(A)
(B)
Figure 19 Sphere segmentation and sphere registration based on a block-matching algorithm.
Sphere segmentation: set of all identified and extracted glass fillers in a same sample from
the “adhesive” group (A), Sphere registration: both scans of one sample (here: "adhesive
group") were superimposed. The identified glass fillers in the first scan were simply
radiolucent and colorless while the corresponding glass fillers from the second scan were
superimposed and color coded (B). Sphere registration was performed based on a block-
matching algorithm to determine the displacement of the segmented spheres due to
polymerization shrinkage.

41
3.5.1.1 The displacement vector field in the "adhesive cavity"
The displacement vector field in the “adhesive” cavity showed for all samples an extensive
upward movement in the lower part of the restoration with predominantly large vectors,
while the upper part exhibited fewer shrinkage vectors with a minimal downward shrinkage
(Figure 20). The SEM-images of the arbitrarily selected sample showed a defective and
cracked bond at the floor, while an intact bond at the enamel margin was seen (Figure 21).
3.5.1.2 The displacement vector field in the “diverging cavity”
In the “diverging cavity”, the displacement vector field showed in the upper part of the
restoration large shrinkage vectors with great downward shrinkage, while the lower part of
the restoration had many small vectors with an upward shrinkage (Figure 22). The SEM-
images displayed a detached bond at the enamel margin, and an intact bond at the bottom
(Figure 23).
3.5.1.3 The displacement vector field in the “cylindrical” cavity
All teeth in the „cylindrical” cavity group showed a considerable amount of shrinkage
vectors in the lower third of the cavity point upwards. The average length of these vectors
was 16.7 µm. In contrast to this uniform appearance of the lower part of the cavity, the upper
part of the cavity had only a few(er) vectors pointing downwards in the upper third of the
cavity for six teeth. The average length of these vectors was 24.5 µm. Three teeth exhibited
more shrinkage vectors in the upper third of the cavity pointing downwards with an average
size of 34.4 µm. The density of the identified vectors was the same in both groups. The
fillers’ density in the lower third was greater than in the upper third. Three teeth revealed a
greater number of shrinkage vectors leading downward in the upper part of the restoration
(Figure 24).
SEM images showed an intact bond at the enamel margin at one side only and a defective
bond at the floor. The atypical shrinkage pattern differed that the upper part showed great
downward shrinkage in addition to the great upward shrinkage at the lower part (Figure 25).
The thickness of the adhesive layer varied in the different cavity forms at different locations:
in the adhesive form, it was thickest below the enamel margin, while in the diverging, it was
thickest at the enamel margin. None of these variations in thickness was observed in the
“cylindrical” cavity.
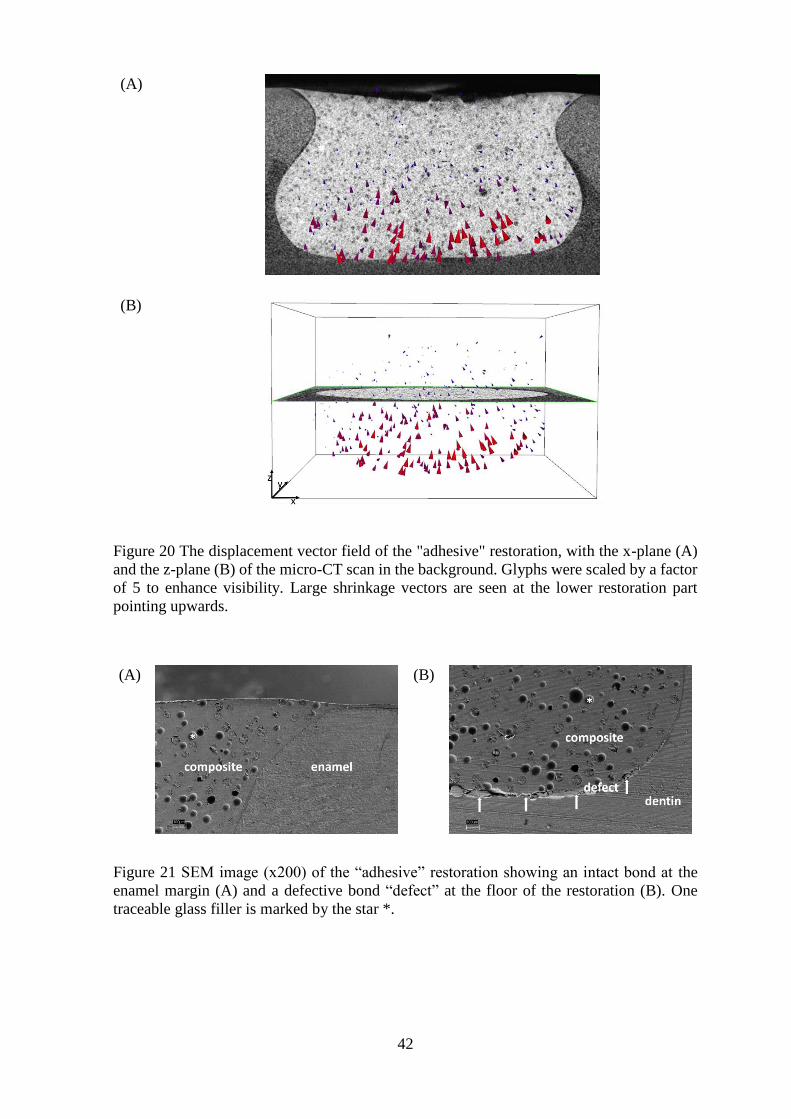
42
(A)
(B)
Figure 20 The displacement vector field of the "adhesive" restoration, with the x-plane (A)
and the z-plane (B) of the micro-CT scan in the background. Glyphs were scaled by a factor
of 5 to enhance visibility. Large shrinkage vectors are seen at the lower restoration part
pointing upwards.
(A)
(B)
Figure 21 SEM image (x200) of the “adhesive” restoration showing an intact bond at the
enamel margin (A) and a defective bond “defect” at the floor of the restoration (B). One
traceable glass filler is marked by the star *.

43
(A)
(B)
Figure 22 The displacement vector field of the “diverging” restoration, with the x-plane (A)
and z-plane (B) of the micro-CT scan in the background. Glyphs were scaled by a factor of
5 to enhance visibility. Large shrinkage vectors point downward near the free surface, and
small shrinkage vectors point upward from the restoration floor.
(A)
(B)
Figure 23 SEM image (x200) of the “diverging" restoration, displaying a defective bond at
the enamel margin (A) and an intact bond at the floor of the restoration (B). One traceable
glass filler is marked by the star *.

44
(A)
(B)
(C)
(D)
Figure 24 The displacement vector field in the “cylindrical” group with a predominant
shrinkage pattern with the x-plane (A) and z-plane (B) of the micro-CT scan in the
background showed more vectors in the lower part, while the atypical shrinkage pattern in
the “cylindrical” cavity additionally displayed large vectors in the upper restoration part. The
x-plane (C) and z-plane (D) of the micro-CT scan displayed in the background. Glyphs were
scaled by a factor of 5 to enhance visibility.

45
(A)
(B)
Figure 25 SEM image (x200) of the “cylindrical” restoration showing an intact bond at the
enamel margin at one side (A) and a defective bond at the floor of the restoration (B). One
traceable glass filler is marked by the star *.
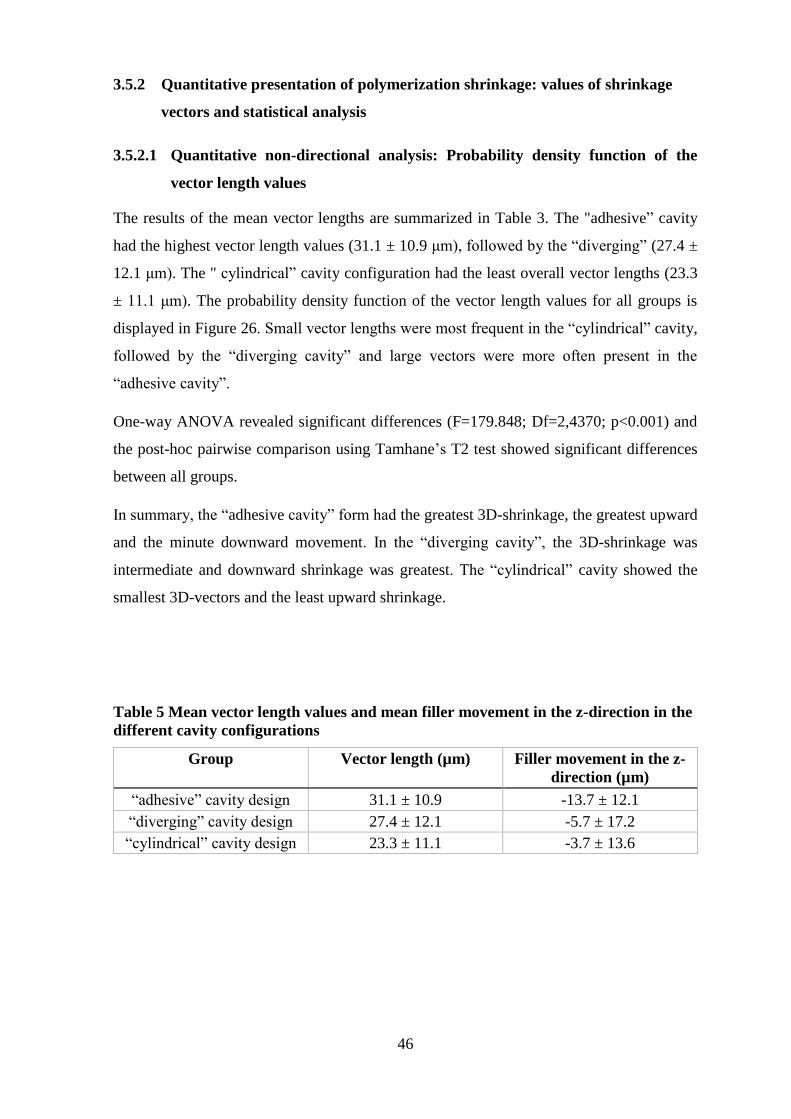
46
3.5.2 Quantitative presentation of polymerization shrinkage: values of shrinkage
vectors and statistical analysis
3.5.2.1 Quantitative non-directional analysis: Probability density function of the
vector length values
The results of the mean vector lengths are summarized in Table 3. The "adhesive” cavity
had the highest vector length values (31.1 ± 10.9 μm), followed by the “diverging” (27.4 ±
12.1 μm). The " cylindrical” cavity configuration had the least overall vector lengths (23.3
± 11.1 μm). The probability density function of the vector length values for all groups is
displayed in Figure 26. Small vector lengths were most frequent in the “cylindrical” cavity,
followed by the “diverging cavity” and large vectors were more often present in the
“adhesive cavity”.
One-way ANOVA revealed significant differences (F=179.848; Df=2,4370; p<0.001) and
the post-hoc pairwise comparison using Tamhane’s T2 test showed significant differences
between all groups.
In summary, the “adhesive cavity” form had the greatest 3D-shrinkage, the greatest upward
and the minute downward movement. In the “diverging cavity”, the 3D-shrinkage was
intermediate and downward shrinkage was greatest. The “cylindrical” cavity showed the
smallest 3D-vectors and the least upward shrinkage.
Table 5 Mean vector length values and mean filler movement in the z-direction in the
different cavity configurations
Group Vector length (µm) Filler movement in the z-
direction (µm)
“adhesive” cavity design 31.1 ± 10.9 -13.7 ± 12.1
“diverging” cavity design 27.4 ± 12.1 -5.7 ± 17.2
“cylindrical” cavity design 23.3 ± 11.1 -3.7 ± 13.6
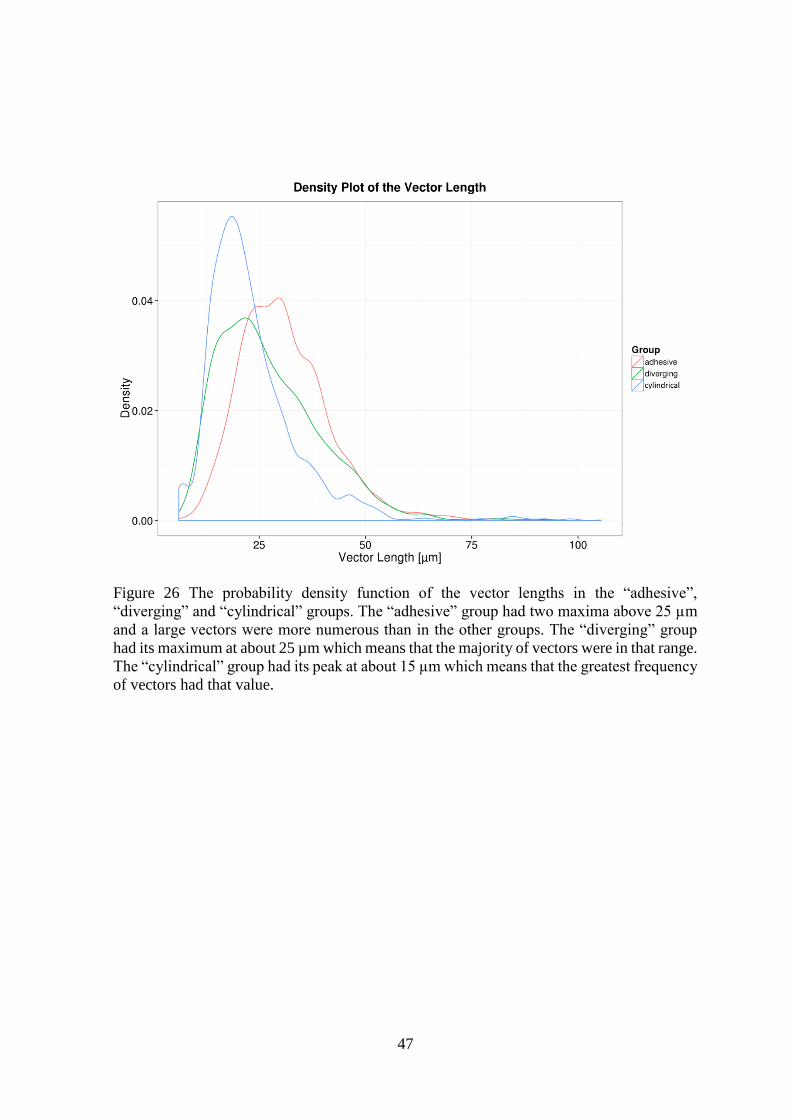
47
Figure 26 The probability density function of the vector lengths in the “adhesive”,
“diverging” and “cylindrical” groups. The “adhesive” group had two maxima above 25 µm
and a large vectors were more numerous than in the other groups. The “diverging” group
had its maximum at about 25 µm which means that the majority of vectors were in that range.
The “cylindrical” group had its peak at about 15 µm which means that the greatest frequency
of vectors had that value.

48
3.5.2.2 Quantitative directional analysis: Probability density function of the z-
component of the vectors (Filler Movement in z-direction):
The z-component of the vectors denoting the filler movement was analyzed to investigate
whether the composite shrinks towards light or not. Negative values denoted shrinkage
towards the light-source (upward movement), while positive ones exhibited downward
shrinkage away from light. Greatest mean filler movement towards the light were in the
“adhesive cavity” form (-13.7 ± 12.1 μm), followed by the “diverging” cavity (-5.7 ± 17.2
μm), while the „cylindrical” cavity showed the least mean filler movement (-3.7 ± 13.6 μm)
toward the light source (Figure 27).
The relative likelyhood for the z-component to take on a given value can be described with
the probability density function. The area below the curve describes the probability of a z-
component having a value in the interval which limits the area to the left and to the right.
Considering the interval from negative infinity to zero (equivalent to movement towards the
light) the “adhesive cavity” has a higher probability of movement towards the light than by
the “parallel cavity”. The “diverging cavity” showed least upward filler movement in z-
direction, while its probability of downwards movement was the greatest.
Levene’s test proved equality of variances of the three cavity configurations. The subsequent
ANOVA revealed significant differences between the three groups (F=216.839; Df=2,4380;
p<0.001). The pairwise comparison with Tamhane’sT2 showed statistically significant
differences between all groups.

49
Figure 27 The probability density function of the filler movements in the z-direction in the
“adhesive”, “diverging” and “cylindrical” groups. The “adhesive” group showed many
peaks which related to the presence of many vectors of that value. The curve is shifted in the
negative range that relates to the upward shrinkage movement at the cavity floor. The
“diverging” group had a shallower curve with two maxima; the first is in the range of -20
µm that relates to the upward shrinkage at the cavity floor, while the second maximum is
located at about 15 µm which can be related to the downward shrinkage seen at the free
surface. The curve of the “cylindrical” cavity also has two peaks, but they are close to each
other near the zero value. The first peak can be attributed to the upward movement at the
lower cavity part and the second peak is related to the downward movement at the free
surface.

50
3.6 Discussion
The computation of polymerization shrinkage vectors of dental resin composites is a
relatively recent method. The first attempts were in the form of 2-dimensional shrinkage
analysis (Chiang et al., 2009; Inai et al., 2002), then 3-dimensional investigations were
developed (Chiang et al., 2009; Chiang et al., 2010; Cho et al., 2011). The evaluation
methods have fundamental differences because each is based on a specific mathematical
principle.
The 2D displacement vector field calculations of Chiang et al., 2009, were based on an elastic
registration algorithm using B-spline regularization (Arganda-Carreras et al., 2006; Chiang
et al., 2008; Chiang et al., 2009; Kybic and Unser, 2003; Sorzano et al., 2005). Yet, B-splines
regularizations restrict possible deformations, whereas tracing separate fillers in the current
study did not have implicit constraints or marginal conditions regarding possible
deformations.
Cho et al., 2011, used a cluster-labeling algorithm to extract the fillers and perform the
pairing procedure. They obtained the 3D movement distance of each filler after
polymerization, but their analysis of filler movement was limited to the axial direction in
relation to the light source (Cho et al., 2011).
The 3-dimensional shrinkage analysis of Chiang et al., 2009, 2010, was based on a block-
matching method that was previously described in detail (Chiang et al., 2009; Chiang et al.,
2010; Rösch et al., 2009). The current study implemented the same method of image
registration performed through sphere segmentation and subsequent registration. Sphere
segmentation is the identification and separation of glass spheres from the rest of the
restoration in the uncured image which depends on the grayvalue of the micro-CT scan. The
scan resolution was limited to 83 µm3, but it was sufficient for the shrinkage analysis.
Registration of the individual spheres was performed by a local rigid registration, the block-
matching, to determine the segmented spheres’ displacement during the polymerization
process. Accordingly, each identifiable filler pair before and after curing was represented by
a displacement vector which presented the actual movement and was the method’s main
advantage.
The flowable composite was chosen because the glass fillers were easily added to it.
Additionally, it exhibits a greater degree of shrinkage and greater shrinkage vector values
are easier to visualize. The use of glass fillers was advantageous as they were silanized for
proper chemical bonding and movement with the resinous mass upon polymerization, as
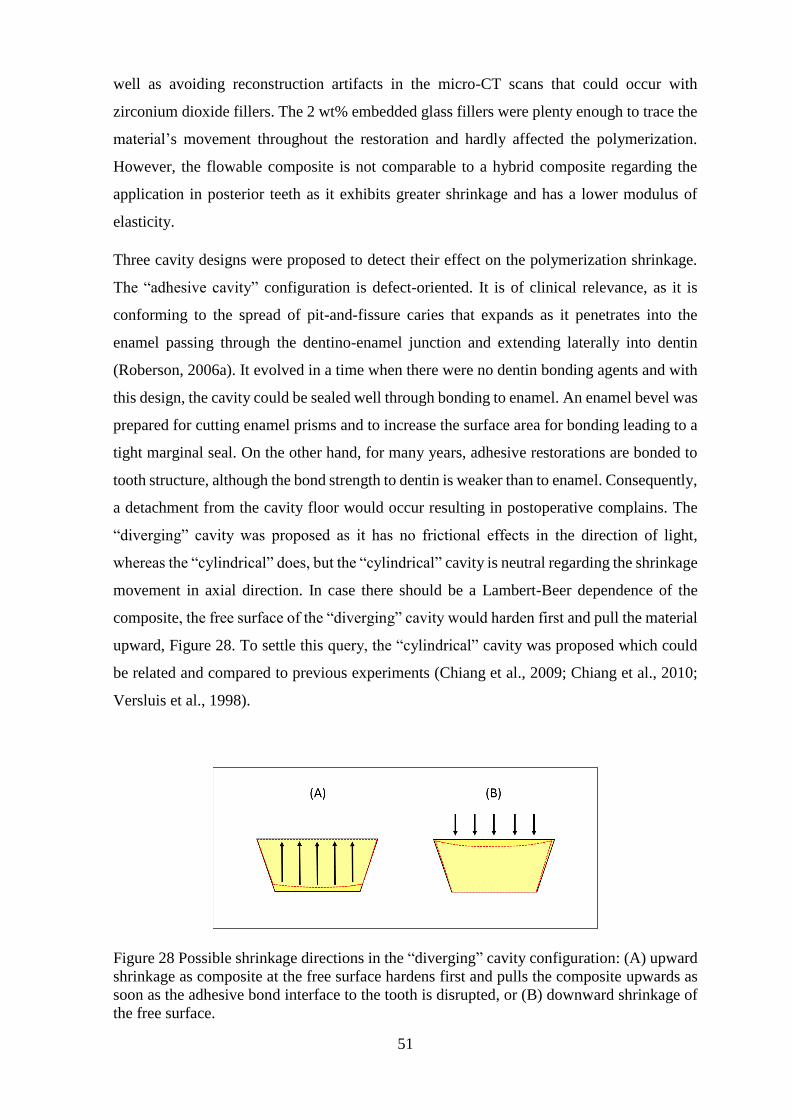
51
well as avoiding reconstruction artifacts in the micro-CT scans that could occur with
zirconium dioxide fillers. The 2 wt% embedded glass fillers were plenty enough to trace the
material’s movement throughout the restoration and hardly affected the polymerization.
However, the flowable composite is not comparable to a hybrid composite regarding the
application in posterior teeth as it exhibits greater shrinkage and has a lower modulus of
elasticity.
Three cavity designs were proposed to detect their effect on the polymerization shrinkage.
The “adhesive cavity” configuration is defect-oriented. It is of clinical relevance, as it is
conforming to the spread of pit-and-fissure caries that expands as it penetrates into the
enamel passing through the dentino-enamel junction and extending laterally into dentin
(Roberson, 2006a). It evolved in a time when there were no dentin bonding agents and with
this design, the cavity could be sealed well through bonding to enamel. An enamel bevel was
prepared for cutting enamel prisms and to increase the surface area for bonding leading to a
tight marginal seal. On the other hand, for many years, adhesive restorations are bonded to
tooth structure, although the bond strength to dentin is weaker than to enamel. Consequently,
a detachment from the cavity floor would occur resulting in postoperative complains. The
“diverging” cavity was proposed as it has no frictional effects in the direction of light,
whereas the “cylindrical” does, but the “cylindrical” cavity is neutral regarding the shrinkage
movement in axial direction. In case there should be a Lambert-Beer dependence of the
composite, the free surface of the “diverging” cavity would harden first and pull the material
upward, Figure 28. To settle this query, the “cylindrical” cavity was proposed which could
be related and compared to previous experiments (Chiang et al., 2009; Chiang et al., 2010;
Versluis et al., 1998).
Figure 28 Possible shrinkage directions in the “diverging” cavity configuration: (A) upward
shrinkage as composite at the free surface hardens first and pulls the composite upwards as
soon as the adhesive bond interface to the tooth is disrupted, or (B) downward shrinkage of
the free surface.

52
It was attempted to choose teeth of similar size and to prepare cavities of alike volumes even
though their configuration differed according to each group. However, the “adhesive” group
had a mean restoration volume of 72 mm3, whereas the volume of the “diverging” group was
smallest with only 52 mm3 and the cylindrical was 58 mm3. Largest vectors were found in
the “adhesive” group, followed by the “diverging” and smallest in the “cylindrical” group,
also the axial movement was in this sequence. It can be assumed that the direction of
shrinkage vectors is not directly related to the volume of the restoration, but rather to the
cavity configuration.
The “free shrinkage” is the case when composites are allowed to shrink freely and they will
tend to shrink toward the center. This applies only in case there is no contact to a surface.
Once the composite contacts a surface, the shrinkage will be directed toward this surface,
Figure 29. Whenever composites are bonded, their contraction movement is governed by
their boundary conditions such as the cavity configuration, the C-factor, the bonding
condition and the bonding substrate. Accordingly, this shrinkage is termed the “effective
shrinkage” (Asmussen and Jorgensen, 1972; Hansen, 1982a).
Figure 29 The shrinkage of a floating specimen having no contact with any surface exhibits
“free shrinkage” (A), but a specimen in contact with a surface shrinks towards it (B).
All cavity forms showed downward shrinkage, away from the light source, in the upper parts,
though to different extents. A fictional zero-line is where downward and upward shrinkage
meet and constitutes a range of almost no axial shrinkage. It was located close to the surface
in the “adhesive form”, almost in the middle in the “cylindrical restoration” and at the
junction between middle and lower one third in the “diverging cavity”. Similar observations
were made by FEA in the case presented with perfect bond to enamel and no bond to dentin
(Versluis et al., 1998) and in the bonded restoration showing downward shrinkage in the
53
upper 1 mm, while the remaining fillers shrank upward (Cho et al., 2011). A resin composite
has the tendency to shrink toward the center which is limited by a strong bond to the tooth
structure. The fictional zero-line can be formed due to the antagonistic movements. The
strong bond of the composite to the enamel bevel in the “adhesive” cavity hindered the
downward movement, while the large free surface in the “diverging” cavity moved
downward and broke the bond with the enamel margin which in turn allowed for even more
downward shrinkage that pushed the fictional zero-line to a lower level. Greater
discrepancies existed between the boundary conditions of the free surface, the enamel
margin and the dentin floor, whereas the bonding conditions and subsequent variations of
bond strength values at the cavity walls were more balanced and less prone to great
variations. Consequently, axial movements were stronger related to the bonding conditions
than movements at the cavity walls.
The main reason for the downward shrinkage can be the large unbonded surface of the
restoration. Shrinkage occurs even after the post-gel point due to elastic deformations and in
the “diverging” cavity the downward shrinkage was greatest. Beam profile analysis showed
that the light intensity is not homogenous throughout the diameter of the light guide which
could affect the degree of cure (Price et al., 2011).
In a future study, the polymerization profile analysis and the beam profile analysis could
highlight unknown issues in the polymerization process. Many curing lights produce a non-
uniform light output that affects microhardness which is a measure for the degree of
conversion. Inhomogeneity of light output causes inhomogenous polymerization across the
composite restoration. Laser beam analyzers determine the homogeneity within a light beam
which characterizes the degree of spatial and spectral uniformity of curing light power
distribution. Practical tips for proper curing include placing the light guide tip perpendicular
and closest possible to the restoration to optimize light transmission in depth (Leprince et
al., 2013; Naoum et al., 2012; Price et al., 2010a; Price et al., 2011; Price et al., 2013). In the
current study, the composite was cured at the closest possible distance to ensure best
polymerization.
The light source in relation to the different cavity configurations was presented in Figure 30.
A cross-sectional view of the “adhesive cavity” elucidated that light could not directly reach
the resin composite below the enamel margin in proximity of the dentin walls. This could
have affected the polymerization process and might have left the composite less cured there.
Stronger bonding to enamel, anchoring through the enamel bevel and more profoundly cured

54
composite near the surface might be the reasons for the greater shrinkage in the lower cavity
part.
Figure 30 The light source in relation to the “adhesive” (A), “diverging” (B) and
“cylindrical” (C) cavity configurations. In the “adhesive” cavity, light did not directly reach
the resin composite below the enamel margin. In the “diverging” and “cylindrical” cavities,
there was no configurational impedance to the curing-light.
The degree of cure of the composite below the enamel bevel can be related to the enamel
translucency and in part to the dentin translucency. The translucency of enamel can be
expressed as as transmission coefficient tc that is dependent on the light wavelength. Tc of
enamel is higher at longer wavelengths of light in the visible range and decreases with
decreasing wavelengths due to increase in the light scattering as indicated by the Rayleigh
scattering equation. Dehydration also reduces the translucency values due to an increased
difference in refractive indices between enamel prisms and surrounding medium when water
is replaced by air (Brodbelt et al., 1981).
In the current study teeth were dry while manipulation for the bonding procedure and
composite application. Few drops of water were added to the sample holder to avoid tooth
cracking during the scanning procedure, but did not touch the occlusal surface not to interfere
with the filling material. Upon air drying enamel, the relative translucency of enamel
decreases to about 80% after only 10 s (Brodbelt et al., 1981), while the scanning procedure
lasted 1.5 h. Resultingly, the enamel translucency of the scanned specimen was for sure
decreased than in the normal hydrated state, which could explain a possible lesser degree of
cure in the undercut area below the bevel. On the other hand, the translucency parameters of

55
only few high translucent composites are similar to those of enamel and dentin of the same
thickness (Yu et al., 2009), meaning that the translucency parameters of tooth structure is
usually greater than that of composites. Hence, the undercut area has no impaired access to
the curing-light.
Light emission is not homogenously distributed throughout the light beam as there is a light
focus that differs from one curing light to another. The light focus of the used curing light,
Elipar FreeLight2, 3M ESPE, in relation to the cylindrical cavity is presented in Figure 31.
It shows more intense light in the center and less intense light at the peripheries.
Figure 31 The light focus of Elipar FreeLight2, 3M ESPE, in relation to the “cylindrical”
cavity.
The direction of the light curing has been very important in the 70s and 80s of the last
century, when curing lamps were less intense, but today, there are enough photons within
the cavity. Despite of the light attenuation there are sufficient photons at a depth of 2 mm
for photo initiators to start the polymerization reaction (Kramer et al., 2008; Lindberg et al.,
2004). For this reason, the direction of light application was not investigated in the current
study, though the light was applied perpendicular to the tooth long axis. Until today, this
might be critical with increments greater than 2 mm where some studies show the decrease
of hardness with increased depth which can be explained by a changed network density.
Clinically, Tetric EvoFlow should not be used in increments greater than 2 mm, although
the depth of cure of 3 mm was previously confirmed (Lindberg et al., 2004). Further
investigations are needed with bulk-fill materials in deeper cavities and with incrementally
applied composites.

56
The enamel bevel in the “adhesive” cavity was prepared so that enamel prisms were almost
cut perpendicular yielding higher bond strength values (Swanson et al., 2008). The bonded
surface area to enamel was greater in the “adhesive” cavity due to the bevel than in the
“diverging”, therefore, restricting the movement in the upper part of the “adhesive” cavity.
Additionally, the margins in the “diverging” cavity were furthest away from the mass center
of the restoration followed by a decrease of bond strength in their periphery (de la Macorra
and Cabrera, 2012).
The course of enamel prisms and the direction of cutting are of great importance for marginal
integrity. In the “diverging” cavity a defective bond to the enamel margin was observed
which was an unusual finding considering that bonding to enamel is stronger than bonding
to dentin. However, the direction of cutting the enamel prisms was almost parallel and
according to Ikeda et al., could lead to contraction gaps and/or enamel microcracks (Ikeda
et al., 2002; Lutz and Phillips, 1983; Phillips et al., 1983). On the other hand, cutting
perpendicular to enamel prisms leads to higher bond strength values (Ikeda et al., 2002)
which is in accordance with the statement that margin beveling has a greater effect in
minimizing microleakage due to increased bond strength than the type of the adhesive.
Therefore, a bevel should be cut as the shrinkage direction is exclusively governed by the
bonding (Swanson et al., 2008).
The shrinkage pattern of the “adhesive“ cavity resembled that of the „cylindrical” in the
“predominant mode” where the filling was attached at the enamel margins and separated
from the floor. The “atypical pattern” showed detachment from enamel at one side resulting
in less stress at the floor. If composite detached from one site, then the unbonded surface
area is increased which in turn decreases the polymerization shrinkage stresses of the
remaining bonded surface area. In the “adhesive” and „cylindrical” cavities a defect was
observed that could be either adhesive failure or cohesive failure in composite at the cavity
floor due to upward movement.
Axial shrinkage constituted only part of the overall shrinkage and should not be taken as the
sole measure. In the “adhesive” cavity, numerous vectors were located at the rounded area
between floor and walls reflecting deformation in the area of undercut where light was not
directly accessible and its intensity was more attenuated than in other areas. The
displacement vector field of the „cylindrical” cavity differed from results obtained by Chiang
et al., 2009, 2010, while it was in agreement with that obtained by Cho et al., 2011. Shrinkage
patterns might be associated with volumetric changes or distribution within each cavity
form; greater shrinkage occurred at the area of greater volume in each group.

57
The “cylindrical” cavity form had no volumetric variation within the cavity, nonetheless
detachment happened at one enamel margin which was assumably the point of first
detachment (Chiang et al., 2009; Chiang et al., 2010). Earlier, it was observed that
contraction due to polymerization is not equal in all directions; in initial stages of setting,
the material would adhere to cavity walls and shrinkage occurs exclusively at the free surface
until stresses in the material exceed the adhesion. Then the material looses its grip on the
cavity wall and a crescent-shaped gap is produced (Asmussen and Jorgensen, 1972). Zeiger
et al., 2009, have measured the volumetric polymerization shrinkage and associated leakage
in two cavities of equal volume but with different dimensions. They have claimed that
neither overall shrinkage nor its spatial distribution are affected by cavity geometry or C-
factor (Zeiger et al., 2009). In this study, however, a clear difference in shrinkage direction
and vector lengths between the three cavity forms was obvious. Cavities with different C-
factors should be investigated in the future.
Flattening of the occlusal surface for obtaining the closest distance for light curing did bear
some problems: when removing too much enamel, some dentin was exposed at the cusp tips,
and the cavity margins were not fully located in enamel. Acquiring adequate cavity depth
caused pulp exposure. In an attempt to avoid these problems, grinding of the occlusal table
and removing as little as possible enamel maintained some fissures into which some bonding
agent or resin composite material would flow into, possibly interlocking at the surface and
affecting the shrinkage direction. The occlusal surface was flattened to ensure the exact
location of the focus of the light source. Cusp tips were flattened but the enamel at the cavity
margins has not been prepared.
Figure 32 Cusp tips were flattened to allow for light-curing as close as possible to the
restoration. Cavity margins were mostly located in enamel.

58
The thickness of enamel at the cavity margins and cavity walls was not perfectly uniform
neither within one sample, nor throughout all samples. Nevertheless, a specific shrinkage
pattern for each group could be identified and related to the cavity form. The sample size
was sufficiently large (n=9) to report this observation as the resultant shrinkage pattern or in
other words, the displacement vector field. Previous observations reported that thick enamel
margins promote better adhesion, while thin enamel margins favour detachment and gap
formation (Chiang et al., 2009; Chiang et al., 2010). However, this finding was not
confirmed in our study. Nevertheless, it might be related to differences in the bonding agents
used, or the discrepancies in thickness of enamel margins themselves.
A radiolucent area between the tooth and restoration was observed in some samples of the
adhesive and diverging groups which could either be a gap or the adhesive layer in greater
thickness. It was seen in both pre- and post-polymerization scans and consequently assumed
to be the adhesive, confirmed by SEM. Its thickness varied in the different cavity forms at
different locations: in the “adhesive” form, it was thickest below the enamel margin, while
in the “diverging”, it was thickest at the enamel margin. In the “adhesive” cavity, it might
be explained by an impaired escape of excessive adhesive with an increased tendency
towards pooling of the adhesive upon air thinning in comparison with the „cylindrical” and
“diverging” cavity forms which have a greater occlusal access and therefore, greater way of
escape. Furthermore, shrinkage is greatly determined by the bonding condition (Versluis et
al., 1998) which needs more investigations.
To sum up, this investigation could display that the proposed cavity configurations exhibited
various displacement vector fields. Also the direction of the shrinkage vectors varied
according to the cavity configuration. More research is needed to find out how to best apply
composite to avoid the formation of gaps at the cavity floor or the margins.

59
Conclusions
Within the limitations of this study, the following can be concluded:
1. The shrinkage amount and direction varied according to the cavity configuration,
with greatest shrinkage vectors in the “adhesive” cavity, followed by the “diverging”
and it was least in the “cylindrical”.
2. Lutz was right in his observation that shrinkage occurred upward in the “adhesive”
cavity which was confirmed by the quantitative directional shrinkage analysis.
3. The “diverging” cavity showed large downward movement at the free surface, and
in the “cylindrical” cavity, upward and downward shrinkage were seen in the lower
and upper restoration parts.
4. Detachment occurred at the areas of greatest shrinkage in each cavity configuration;
in the “adhesive” at the cavity floor, in the “diverging” at the cavity margin, in the
“parallel” at both floor and one margin.
5. The enamel bevel in the “adhesive” cavity had a strong influence on the shrinkage
direction: bevel at great angulation to the long axis of the tooth; enamel prisms should
be cut perpendicular to yield higher bond strength values.
6. More investigations on the effect of the light source on the shrinkage vectors are
needed.
7. The claim that composites shrink toward the light source is disproved.

60
4 Composite Shrinkage Vectors in Ceramic Cavities with
Different Boundary Conditions
4.1 Abstract
Objectives: Ceramic serves as a homogenous substrate for a cavity model and provides for
optimal bonding conditions which stands in contrast to the heterogeneity of enamel and
dentin. The objective of this study was to visualize the polymerization shrinkage of a
composite in form of displacement vector fields and to detect the shrinkage direction and
patterns, in relation to the light source in a silanized ceramic-cavity with different boundary
conditions.
Methods: 18 ceramic specimens (IPS Empress CAD, Ivoclar Vivadent) were prepared with
a cylindrical cavity (diameter 6 mm, depth 3 mm) and divided into two groups according to
the surface treatment into “ceramic+HF+silane” group and “ceramic+HF+silane+DBA”
group. In “ceramic+HF+silane”, the cavity was etched (hydrofluoric-acid 5%), silanized
(ESPE Sil, 3M ESPE) and filled with a composite (Tetric EvoFlow, Ivoclar Vivadent) to
which 2 wt% traceable glass beads were added. In “ceramic+HF+silane+DBA”, in addition
a layer of dentin bonding agent (OptiBond FL, Kerr) was applied before the composite
application. Two micro-CT scans were performed of each specimen (uncured, cured),
subjected to image segmentation and registration based on a block-matching algorithm. The
displacement vector field exhibited the distribution of shrinkage vectors three-dimensionally
and shrinkage vectors were analyzed in the axial dimension and for any shrinkage patterns.
Results: In “ceramic+HF+silane”, two shrinkage patterns were identified: in “Pattern-1”
shrinkage vectors in the upper one third of the restoration were directed downward, then
deviated to one side; “Pattern-2” displayed vectors in the upper one third moving downward,
then represented a horizontal swirling in the whole lower two thirds of the restoration.
Shrinkage vectors were significantly greater in the “ceramic+HF+silane+DBA” (41.6 ± 18.9
μm) than in the “ceramic+HF+silane” (30.5 ± 14.4 μm). Both groups showed downward
movement away from the light, which was greater in the bonding (19.2 ± 16.0 μm) than the
silane group (8.4 ± 15.6 μm), with statistically significant difference by the Independent
Samples T-test.

61
Conclusion: Displacement vector fields in both groups stated the obvious movement away
from the light source, possibly due to the strong bond with silanized ceramic. Identification
of two patterns in “ceramic+HF+silane” presented that shrinkage could happen differently
even under similar conditions, while the layer of bonding agent produced a more uniform
shrinkage pattern. Boundary conditions seem to play an important role in polymerization
shrinkage.
4.2 Introduction
The crown of human teeth is composed of an enamel shell covering the underlying dentin.
Any defect such as caries, will track its way through enamel into dentin and consequently, a
restoration will have an interface with both tissues (Roberson, 2006a). Bonding to enamel is
stronger and less technique sensitive than bonding to dentin which is due to the
compositional differences between the two substrates (Roberson, 2006b) and it can be
assumed that bonding to substrates with different qualities and bond strengths affects the
direction of polymerization shrinkage.
Versluis et al., 1998, have investigated this topic in a finite element analysis (FEA). They
analyzed the effect of boundary conditions on the polymerization shrinkage direction by
changing the bonding conditions in their model, a cylindrical cavity with two substrates
representing enamel and dentin. Three conditions were simulated: without any bond, with
bond to enamel only and perfect bonding to both enamel and dentin, each condition resulting
in a different shrinkage pattern. In the unbounded condition composite shrank to the center;
with enamel bond only it shrank downward at the upper restoration part and upward at the
lower part, and when bonded to enamel and dentin, it shrank all the way downward, away
from the light source. They concluded that shrinkage is not necessarily directed toward the
light source, but it is affected by bonding of the restoration and the presence of free surfaces
(Versluis et al., 1998).
Chiang et al., 2009, 2010, were the first to visualize the polymerization shrinkage vectors
three-dimensionally and to show how the shrinkage direction was affected by the presence
of enamel and dentin as different bonding substrates. They used two micro-CT scans of
uncured and cured composite in human teeth, subjected them to image registration based on
a block-matching algorithm for the calculation of 3D shrinkage vectors (Rösch et al., 2009).
The influence of enamel on the shrinkage direction was seen: in cavities, with margins of
equal enamel thickness, composite detached from the cavity floor and shrank toward the
light source. On the other hand, in cavities with margins of unequal enamel thickness
62
composite shrank toward the thicker enamel margin, while it detached from the opposite side
of the cavity (Chiang et al., 2009; Chiang et al., 2010).
Previous studies have substituted human teeth by an artificial material to avoid the
inhomogeneity of substrate and the variations of size and properties among teeth. A glass
model cavity was used to assess the shrinkage stress in dental composites (Li et al., 2011),
while in another study, a block made of resin composite with a standardized cavity served
as the bonding substrate for the evaluation of resin composite polymerization by micro-CT
imaging (Cho et al., 2011). The inner surface of glass ceramic restorations such as inlay,
onlays, veneers and crowns are indicated for etching by 5-10% hydrofluoric acid and
subsequent silanization for obtaining an optimal bond between the restoration and the tooth
structure (IPS Empress CAD,Technical Product Profile, 2007). Silane, though not an
adhesive, improves adhesion by promoting a chemical bond between the inorganic ceramic
material and the organic resin matrix of the composite.
The specific physical properties of enamel and dentin have an impact on the bond quality
and consequently might influence the shrinkage direction. In the Chapter 3 human teeth were
used for the shrinkage investigations. It was observed that the direction of cutting the enamel
prisms influenced the bond quality and subsequent gap formation. Also the thickness of
enamel at the cavity margins varied and might affect the resultant shrinkage direction.
Ceramic can provide for an optimanl bond with a dental resin composite. Therefore,
selecting an alternative substrate serving as a model cavity system could be a good option
when trying to understand the effect of boundary conditions on the shrinkage direction.
4.3 Aim of the study
The aim of this study was to investigate the polymerization shrinkage of a model light
initiated resin composite with the least possible influence by the substrate. Therefore,
bonding to ceramic instead of enamel and dentin was investigated, to detect the shrinkage
direction in relation to the light source in etched and silanized ceramic cavities with and
without a bonding agent and to visualize the shrinkage in form of displacement vector fields.
The bonding agent served as a stress breaker and to evaluate if the mean vector length values
were influenced by the layer of bonding agent.
4.4 Materials and Methods
The experimental resin composite, Table 4, p.39, and the materials listed in Table 6, p.64,
were used in this study.

63
4.4.1 Specimen preparation
A total of 18 ceramic specimens were cut from ceramic blocks (IPS Empress CAD, Ivoclar
Vivadent) and cylindrical cavities with parallel walls (diameter 6 mm, depth 3 mm, n=9)
were prepared (Chiang et al., 2009; Chiang et al., 2010; Versluis et al., 1998). The outer
surface of the ceramic was trimmed to fit into the micro-CT sample holder and flowable
composite was applied and light-cured all around to obtain a reference mark that simulates
enamel. This procedure was important for the process of rigid registration (overlay of both
scans) at a later step; identification of different substrates depends on the corresponding
greyvalue. The specimen was fixed into the sample holder with composite to avoid its
movement during scanning.
(A)
(B)
Figure 33 The ceramic block (A) was cut into three slices into which a cylindrical cavity was
prepared. The outer margin was trimmed to fit into the micro-CT sample holder and flowable
composite was added as a reference landmark for the rigid registration (B).
Figure 34 Schematic drawing of the ceramic model.
Specimens were divided into two groups: in the “ceramic+HF+silane” group, the cavity was
etched by 5% hydrofluoric acid (VITA CERAMICS ETCH, Vita Zahnfabrik) for 1 min,
thoroughly rinsed with water for 1 min, air dried, and silane coupling agent (ESPE Sil, 3M
ESPE) was applied and air dried for 5 min. In the “ceramic+HF+silane+DBA” group,

64
additionally, a layer of dentin bonding agent (OptiBond FL, Kerr) was applied, air thinned
for 5 s and light-cured for 20 s using Elipar FreeLight2, 3M ESPE prior to the application of
the experimental composite (power output 1200mW/cm2 according to the manufacturer,
checked for constant light intensity once/week with a dental radiometer). OptiBond FL forms
a thick film of adhesive and has good mechanical properties, thus, a good bond is expected.
From this point onward the methodology was following the same protocol as described in
Chapter 3. It included the preparation of the experimental composite, the micro-CT
measurements, the data processing, polymerization shrinkage evaluation and the SEM
analysis.
4.4.2 Statistical analysis
Mean vector lengths were computed and subjected to the Independent Samples T-test (using
IBM SPSS Statistics 20).
Table 6 Composition of the ceramic block, hydrofluoric acid, silane coupling agent
and the total-etch adhesive
Brand name Composition Batch No. Manufacturer
IPS Empress CAD,
A3
Ceramic block for
CEREC and Inlab
SiO2
Additional contents: Al2O3,
K2O, Na2O, CaO, and other
oxides, pigments
Ref#
602522
N57913
N52287
Ivoclar Vivadent,
Schaan,
Liechtenstein
VITA CERAMICS
ETCH
(In-lab ceramic
etchant)
Hydrofluoric acid 5% 14060 VITA
Zahnfabrik, Bad
Saeckingen,
Germany
ESPETM Sil (Silane
Coupling Agent)
3-methacryloxy-propyl-
trimethoxy-silane (3-MPTS)
424203 3M ESPE AG,
Seefeld,
Germany
OptiBond FL
(Prime/Adhesive)
(Total-etch
Adhesive)
Adhesive:
HydroxyEthylMethAcrylate
(HEMA) 15-20%
Disodium Hexafluorosilicate
1-2%
Methacrylate Ester Monomers
and inert fillers
Primer:
HydroxyEthylMethAcrylate
(HEMA) 25-30%
Ethyl Alcohol 20-25%
4462783
(Prime)
4462763
(Adhesive)
Kerr, Italy
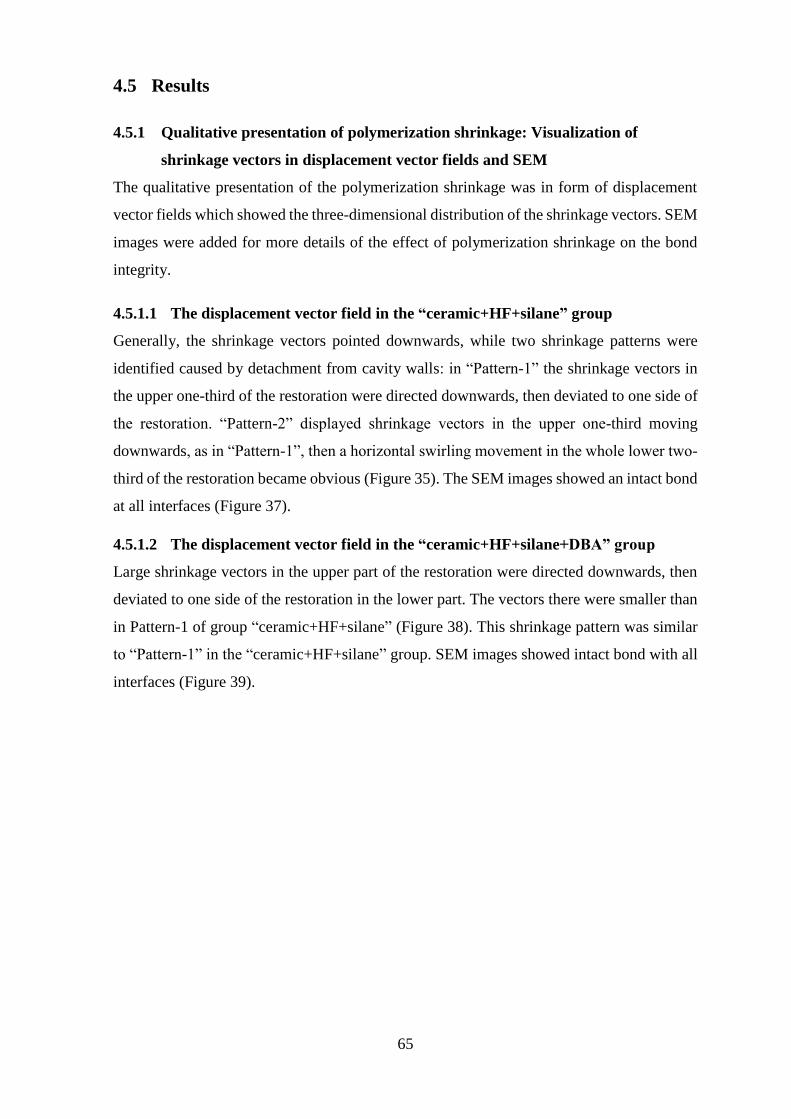
65
4.5 Results
4.5.1 Qualitative presentation of polymerization shrinkage: Visualization of
shrinkage vectors in displacement vector fields and SEM
The qualitative presentation of the polymerization shrinkage was in form of displacement
vector fields which showed the three-dimensional distribution of the shrinkage vectors. SEM
images were added for more details of the effect of polymerization shrinkage on the bond
integrity.
4.5.1.1 The displacement vector field in the “ceramic+HF+silane” group
Generally, the shrinkage vectors pointed downwards, while two shrinkage patterns were
identified caused by detachment from cavity walls: in “Pattern-1” the shrinkage vectors in
the upper one-third of the restoration were directed downwards, then deviated to one side of
the restoration. “Pattern-2” displayed shrinkage vectors in the upper one-third moving
downwards, as in “Pattern-1”, then a horizontal swirling movement in the whole lower two-
third of the restoration became obvious (Figure 35). The SEM images showed an intact bond
at all interfaces (Figure 37).
4.5.1.2 The displacement vector field in the “ceramic+HF+silane+DBA” group
Large shrinkage vectors in the upper part of the restoration were directed downwards, then
deviated to one side of the restoration in the lower part. The vectors there were smaller than
in Pattern-1 of group “ceramic+HF+silane” (Figure 38). This shrinkage pattern was similar
to “Pattern-1” in the “ceramic+HF+silane” group. SEM images showed intact bond with all
interfaces (Figure 39).
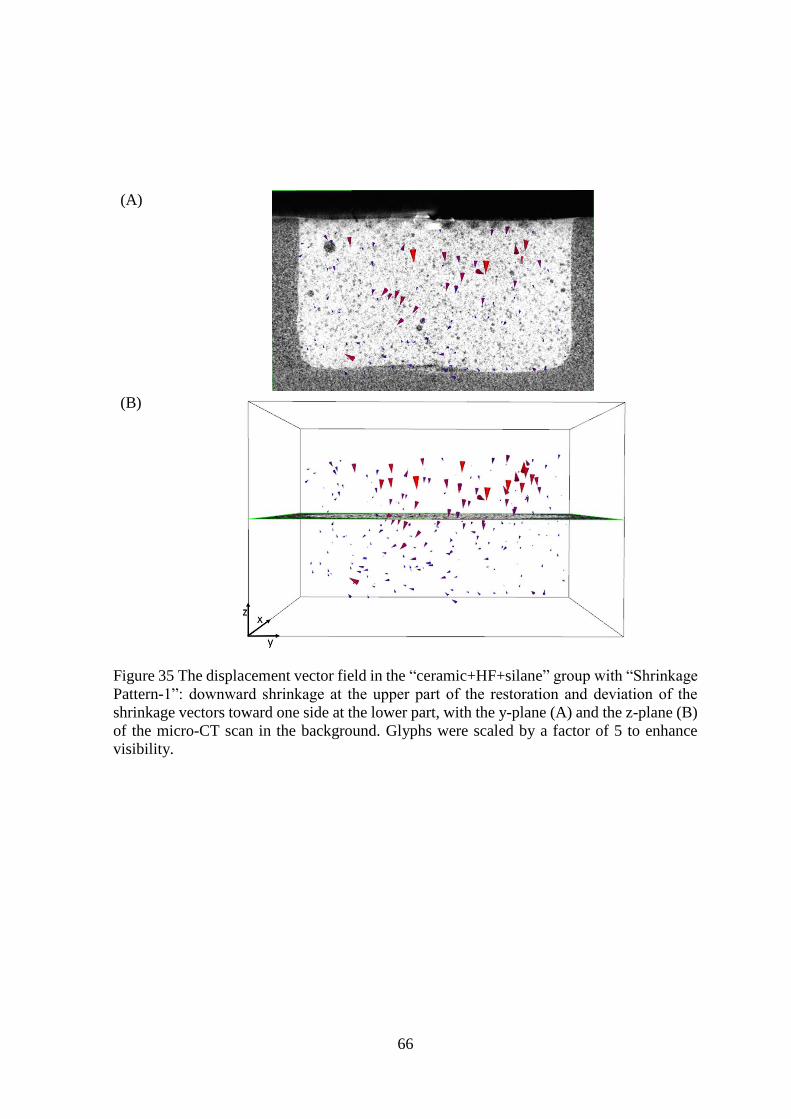
66
(A)
(B)
Figure 35 The displacement vector field in the “ceramic+HF+silane” group with “Shrinkage
Pattern-1”: downward shrinkage at the upper part of the restoration and deviation of the
shrinkage vectors toward one side at the lower part, with the y-plane (A) and the z-plane (B)
of the micro-CT scan in the background. Glyphs were scaled by a factor of 5 to enhance
visibility.
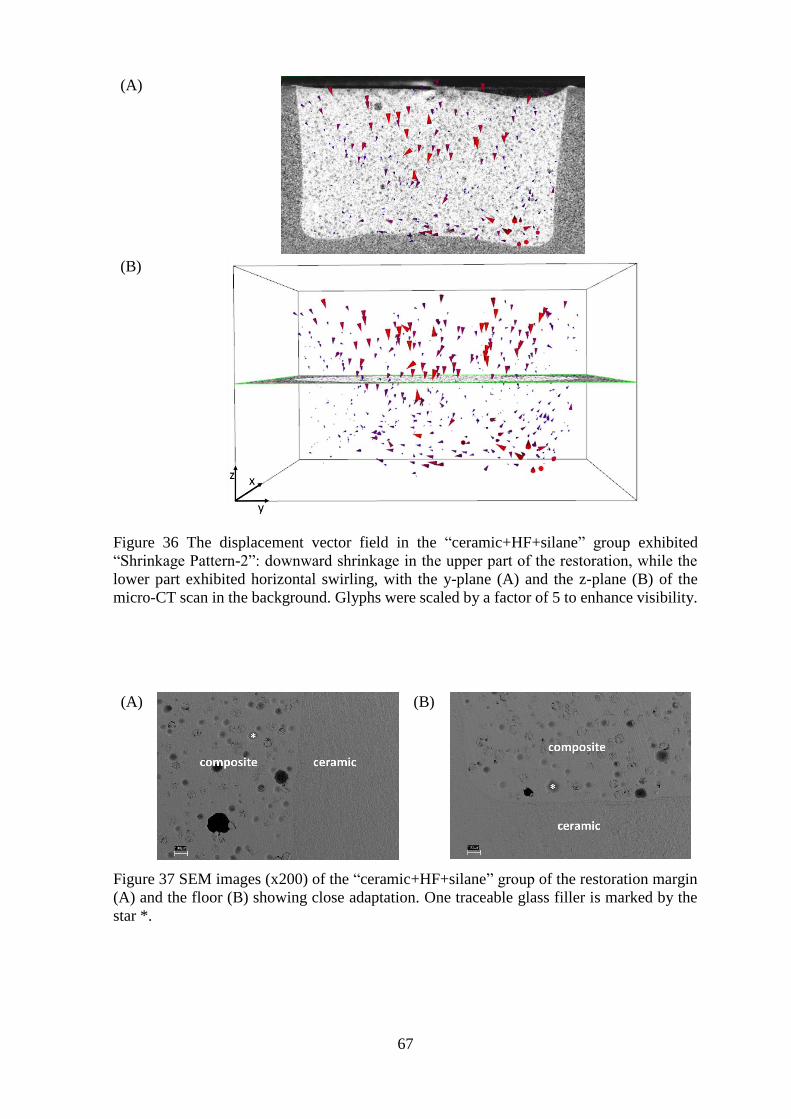
67
(A)
(B)
Figure 36 The displacement vector field in the “ceramic+HF+silane” group exhibited
“Shrinkage Pattern-2”: downward shrinkage in the upper part of the restoration, while the
lower part exhibited horizontal swirling, with the y-plane (A) and the z-plane (B) of the
micro-CT scan in the background. Glyphs were scaled by a factor of 5 to enhance visibility.
(A)
(B)
Figure 37 SEM images (x200) of the “ceramic+HF+silane” group of the restoration margin
(A) and the floor (B) showing close adaptation. One traceable glass filler is marked by the
star *.

68
(A)
(B)
Figure 38 The displacement vector field in the “ceramic+HF+silane+DBA” group with
downward shrinkage at the upper part of the restoration and deviation of the shrinkage
vectors toward one side at the lower part, same as “Shrinkage Pattern-1” in the
“ceramic+HF+silane” group, with the y-plane (A) and the z-plane (B) of the micro-CT scan
in the background. Glyphs were scaled by a factor of 5 to enhance visibility.
(A)
(B)
Figure 39 SEM images (x200) of the “ceramic+HF+silane+DBA” group of the restoration
margin (A) and floor (B) showing close adaptation. One traceable glass filler is marked by
the star *.
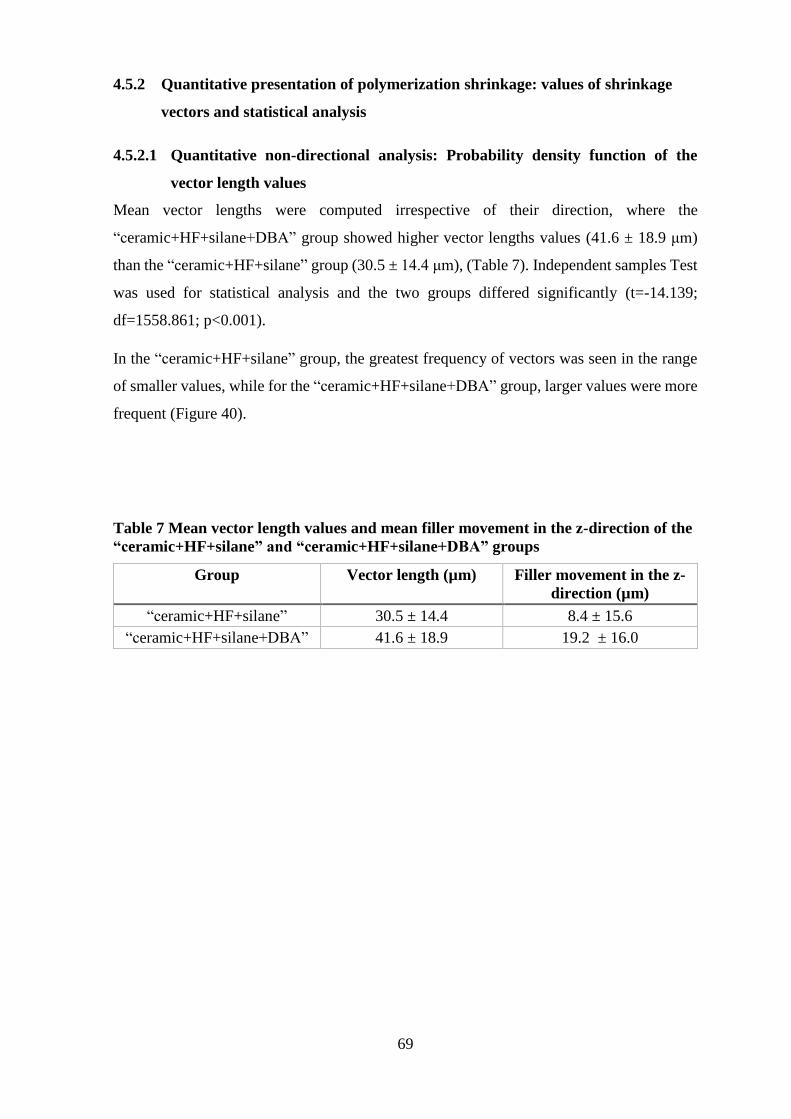
69
4.5.2 Quantitative presentation of polymerization shrinkage: values of shrinkage
vectors and statistical analysis
4.5.2.1 Quantitative non-directional analysis: Probability density function of the
vector length values
Mean vector lengths were computed irrespective of their direction, where the
“ceramic+HF+silane+DBA” group showed higher vector lengths values (41.6 ± 18.9 μm)
than the “ceramic+HF+silane” group (30.5 ± 14.4 μm), (Table 7). Independent samples Test
was used for statistical analysis and the two groups differed significantly (t=-14.139;
df=1558.861; p<0.001).
In the “ceramic+HF+silane” group, the greatest frequency of vectors was seen in the range
of smaller values, while for the “ceramic+HF+silane+DBA” group, larger values were more
frequent (Figure 40).
Table 7 Mean vector length values and mean filler movement in the z-direction of the
“ceramic+HF+silane” and “ceramic+HF+silane+DBA” groups
Group Vector length (µm) Filler movement in the z-
direction (µm)
“ceramic+HF+silane” 30.5 ± 14.4 8.4 ± 15.6
“ceramic+HF+silane+DBA” 41.6 ± 18.9 19.2 ± 16.0

70
Figure 40 The probability density function of the vector lengths in the groups
“ceramic+HF+silane” and “ceramic+HF+silane+DBA” shows the frequency of vector
length values in the groups. In the “ceramic+HF+silane” group the maximum was located at
about 20 µm which can be related to the smaller vectors located majorly in the lower part of
the restoration and near the cavity walls. Yet, a considerable amount of vectors was in the
range below 50 µm which can be associated with the larger vectors directing downwards in
the upper part of the cavity. In the “ceramic+HF+silane+DBA” group the distribution of
vector lengths values was over a larger range than in the first group. The first maximum at
20 µm could be related to small vectors of the lower third of the restoration near the cavity
floor. The second maximum had most vectors at about 45 µm that were attributed to the
large downward movement at the free surface.
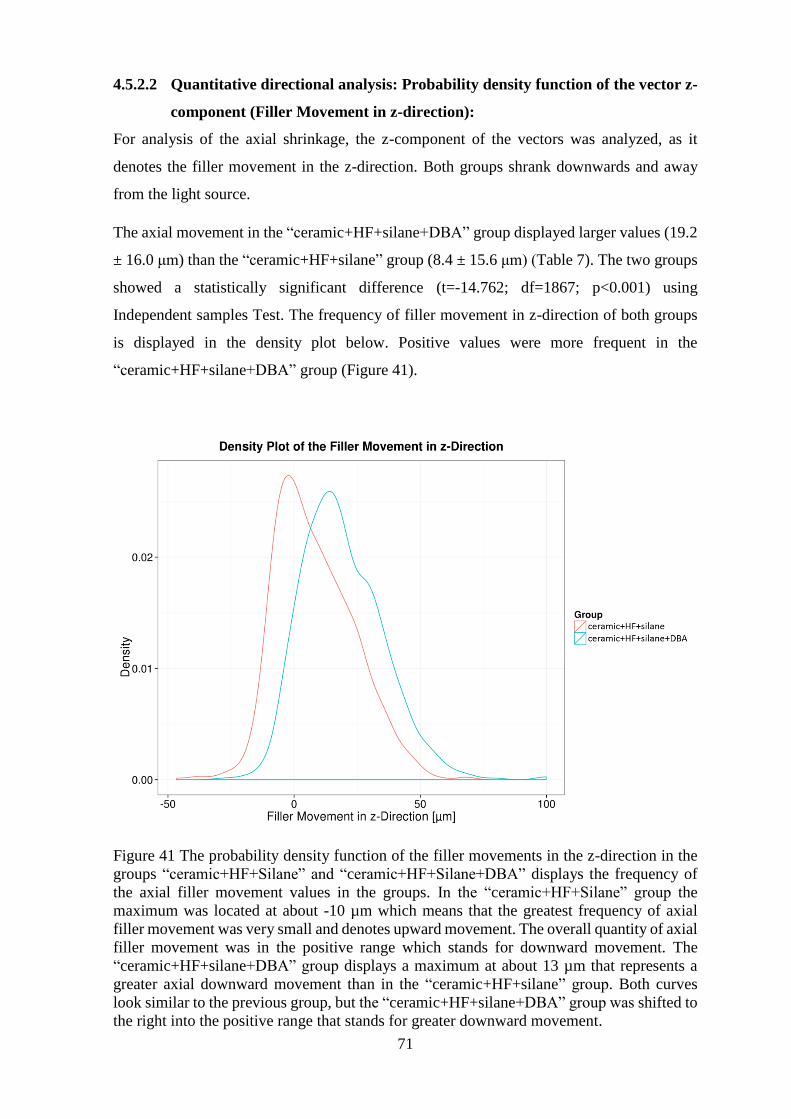
71
4.5.2.2 Quantitative directional analysis: Probability density function of the vector z-
component (Filler Movement in z-direction):
For analysis of the axial shrinkage, the z-component of the vectors was analyzed, as it
denotes the filler movement in the z-direction. Both groups shrank downwards and away
from the light source.
The axial movement in the “ceramic+HF+silane+DBA” group displayed larger values (19.2
± 16.0 μm) than the “ceramic+HF+silane” group (8.4 ± 15.6 μm) (Table 7). The two groups
showed a statistically significant difference (t=-14.762; df=1867; p<0.001) using
Independent samples Test. The frequency of filler movement in z-direction of both groups
is displayed in the density plot below. Positive values were more frequent in the
“ceramic+HF+silane+DBA” group (Figure 41).
Figure 41 The probability density function of the filler movements in the z-direction in the
groups “ceramic+HF+Silane” and “ceramic+HF+Silane+DBA” displays the frequency of
the axial filler movement values in the groups. In the “ceramic+HF+Silane” group the
maximum was located at about -10 µm which means that the greatest frequency of axial
filler movement was very small and denotes upward movement. The overall quantity of axial
filler movement was in the positive range which stands for downward movement. The
“ceramic+HF+silane+DBA” group displays a maximum at about 13 µm that represents a
greater axial downward movement than in the “ceramic+HF+silane” group. Both curves
look similar to the previous group, but the “ceramic+HF+silane+DBA” group was shifted to
the right into the positive range that stands for greater downward movement.
72
4.6 Discussion
The ceramic material was chosen as a model cavity system for several reasons. It has a
similar compliance to that of the natural tooth (Li et al., 2011) and it offers a homogenous
substrate, thereby overcoming the difference in bonding between enamel and dentin.
Moreover, silanes are very effective in promoting adhesion for silica-based materials, thus,
provide optimal adhesion (Lung and Matinlinna, 2012). Although the cavity in a ceramic
model does not represent the clinical situation, it was proposed to overcome the limitations
encountered when human teeth are used as they are formed of enamel and dentin at the crown
portion.
The obvious downward shrinkage movement away from the light source, was possibly due
to the strong bond with silanized ceramic, and the free surface allowed the composite to bend
downward. Similar observations were made by other studies as well. Cho et al., 2002,
measured earlier the free surface depression by a profilometer and the interfacial gap by a
scanning electron microscope in order to relate the shrinkage direction to the interfacial bond
quality. They found that smaller interfacial gaps related to a greater free surface depression
concluding that the establishment of a good bond could direct the shrinkage close to the
bonded surface (Cho et al., 2002). Suh and Wang, 2001, investigated the direction of
shrinkage through changes of the surface contours for different bonding configurations in a
glass model. In the case where composite in a class I cavity was bonded, a great downward
shrinkage was obvious at the free surface, similar in appearance to our results (Suh and
Wang, 2001). Although their results were related to the outer surface only, they confirmed
the findings of the current study. The advantage of the present method was the actual tracing
of the internal movement of the embedded glass fillers, thereby, presenting the actual
shrinkage vectors.
Hydrofluoric acid etching and silanisation provided optimal bonding conditions that cannot
be obtained in natural teeth due to the compositional differences and surface properties of
the bonding substrates. Nevertheless, even hydrofluoric acid etching and silane could not
resist the contraction forces of the low modulus flowable, as the curing contraction caused
disruption of the adhesion to the cavity walls and floor. This was seen by small vectors in
the displacement vector fields near the cavity floor and walls. Furthermore, it was also shown
in the density plot of the filler movement in the z-direction that was denoted by the negative
values which were attributed to the upward movement. Unfortunately, it was not possible to
identify the disruption in the micro-CT scans due to limitations of the resolution (83 µm3),

73
and in the SEM images no detachments were seen in the cut-planes. Nonetheless, they could
be situated at other locations within the cavity.
If detachment happened in a perfect cavity regarding the design and the adhesion, it is likely
to occur in bulk-filled cavities in teeth as well. Nevertheless, bulk-fill materials differ in their
composition and properties from a traditional composite. There are various bulk-fill
composite systems and to ensure sufficient cure at full depth (4 mm), either an increased
amount of initiator or a more reactive initiator is added. High polymerization shrinkage
stresses that develop could be decreased in some bulk-fill materials by adding a
polymerization modulator. Some manufacturers of the bulk-fill composites claim that the
modified methacrylate-resin has a slow polymerization rate through the use of a
polymerization modulator, which can possibly render a more favorable polymerization
shrinkage (Cramer et al., 2011; Moorthy et al., 2012). At the time the current study has been
started, there were no bulk-fill materials available. Still, these experiments can be repeated
with bulk-fill composites in order to visualize their shrinkage patterns. On the other hand,
the results can be compared to previous studies from Chiang et al., 2009, and Versluis et al.,
1998 because the same experimental composite and cavity dimensions were used (Chiang et
al., 2009; Chiang et al., 2010; Versluis et al., 1998)
The occurrence of two shrinkage patterns in the “Ceramic+HF+silane” group could be
attributed to different methods or types of detachments from the cavity walls: in “Pattern-1”
the shrinkage in lateral direction was greater at one side which is possibly the site of least
resistance; here, the composite must have predominantly detached in the form of a large
patch. On the other hand, in “Pattern-2” the horizontal swirling was probably caused by
mainly detaching at many separate small sites or spots at the cavity bottom and lower part
of walls. The SEM images did not display any bond discontinuity in neither shrinkage
patterns, where the cut-planes were arbitrarily selected. The gap or detachment might have
been at any other location within the restoration. The variation of shrinkage patterns could
be in part related to the inhomogeneity of the curing light, as stated by the beam profile
analysis (Price et al., 2011), although for all experiments, the same light-curing unit has been
used. Another reason could be the distraction of the light by the embedded glass beads.
Likewise, it is difficult to explain why two shrinkage patterns have formed within the
“Ceramic+HF+silane” group. On the other hand, it points out the advantage of using micro-
CT scans and the current shrinkage vector evaluation method. Such fine differences in results
could not be explored with FEA because it is based on idealized conditions and does not
include the possible variations of outcome.
74
Previous studies used micro-CT scans of uncured and cured composite for volumetric
shrinkage and leakage analysis. They showed that debonding or leakage occurred in the form
of a large area or patch that showed at its peripheries many separate small spots that passed
into the non-detached areas (Sun et al., 2009a; Sun et al., 2009b; Zeiger et al., 2009).
Although they calculated the volumetric shrinkage by subtracting the pre-cure from the after-
cure volume and detected the sites of potential leakage, they neither calculated shrinkage
vectors nor visualized internal movements or displacement vector fields.
The layer of the bonding agent produced a more uniform and reproducible shrinkage pattern
in the “ceramic+HF+silane+DBA” group because all displacement vector fields exhibited
only “Pattern-1” and no swirl could be detected. The presence of the bonding agent rendered
greater vector length values and allowed greater axial movement in comparison to the
“ceramic+HF+silane” group which might lead to a decrease in the shrinkage stresses. A
previous study concluded that an unfilled adhesive applied in thick layers (Kemp-Scholte
and Davidson, 1990) or an intermediate layer of flowable under composite could reduce
stress significantly (Cara et al., 2007). Results from a FEA study on the adhesive layer
properties showed that its thickness and rigidity are important factors regarding the
mechanical behavior on the restored tooth playing an important role in attenuation of the
polymerization and occlusal loading stresses (Ausiello et al., 2002). Another study pointed
out that with increasing adhesive layer thickness contraction stresses and microleakage
decreased (Choi et al., 2000). However, the adhesive layer could neither be identified in the
micro-CT scans nor in the SEM images, assuming that it was very thin and its role of
reducing stresses unknown.
The displacement vector fields in “Pattern-1” in the “ceramic+HF+silane” group and
“ceramic+HF+silane+DBA” group are in agreement with the FEA results reported by
Versluis et al., 1998, for the situation with perfect bond to both enamel and dentin. They
provided more information on pre-gel and post-gel shrinkage separately which could not be
seen in our evaluation due to 1.5 h scanning time per scan (Versluis et al., 1998). These
findings were opposed by Chiang’s findings where in a heterogenous cavity the shrinkage
was governed by the presence of enamel and dentin and their bonding properties (Chiang et
al., 2009; Chiang et al., 2010). Thus, in a heterogenous cavity, as in human teeth, shrinkage
is directed toward the part providing better bonding and being present in greater quantity,
while in a homogenous cavity, the adhesive is more important, that is to say, it is the decisive
factor. Boundary conditions, in this case, the bonding substrate and adhesion or the bond
quality to it, seem to play an important role in the behavior of polymerization shrinkage.

75
Conclusions
Within the limitations of this study, the following can be concluded:
1. The ceramic model did provide optimal bonding conditions that could not be
obtained with natural teeth due to their heterogeneity.
2. The shrinkage movement was directed downwards and away from the light source
which was attributed to the strong bond with the etched and silanized ceramic cavity
model.
3. Nevertheless, detachment happened either in form of a large area when composite
deviated towards one side or in the form of many small patches when swirling of
shrinkage vectors was detected at the lower restoration part.
4. SEM images could not show any detachments or defects at the restoration-ceramic-
interface.
5. The direction of shrinkage vectors mainly relates to the bonding condition which
depends to a large extent on the bonding substrate itself.

76
5 Composite Shrinkage Vector Patterns In Non-Adhesive
Teflon Cavities
5.1 Abstract
Objectives: Shrinkage vectors of self-cured composites are supposed to be directed toward
the center of the mass, while light-cured composites are believed to shrink toward the light
source. The aim of this study is to visualize the polymerization shrinkage of a light-initiated
flowable resin composite in form of displacement vector fields and to detect the shrinkage
direction in a non-adhesive cavity in relation to the light-source. This bonding condition was
chosen to investigate the effect of cavity geometry without adhesion on the shrinkage
direction.
Methods: A cylindrical cavity (diameter 6 mm, depth 3 mm, n=9) was prepared into a Teflon
block and filled with a model resin composite (Tetric EvoFlow, Ivoclar Vivadent) to which
2 wt% traceable glassbeads were added. Two micro-CT scans were performed of each
specimen (uncured, cured), subjected to image segmentation for extraction of glass beads
and followed by registration based on a block-matching algorithm. The displacement vector
fields exhibited the distribution of shrinkage vectors three-dimensionally. Additionally,
shrinkage vectors were analyzed in the vertical dimension.
Results: The mean vector lengths (23.5 ± 5.3 μm) were computed irrespective of their
direction. To analyze the shrinkage direction in relation to the light-source, the filler
movement was investigated in the z-direction only, where negative values denoted an
upward movement towards the light-source and positive ones meant downward shrinkage.
The mean filler movement (-0.5 ± 10.9 μm) moved minimally upward. The displacement
vector field clearly showed shrinkage to the center, while the lateral movement was slightly
deviated toward one side.
Conclusion: The composite shrank centrally, although it was a light-cured type, concluding
that this pattern was related to the fact that it was unbonded. Shrinkage in lateral direction
was greater at one side, which is possibly the site of least resistance to adaptation and first
detachment due to shrinkage. Shrinkage pattern is related to bonding conditions and not type
of activation.

77
5.2 Introduction
The general belief in dentistry is that self-cured resin-based composites shrink toward the
center of the mass, while light-cured composites shrink toward the light source. Studies on
the boundary conditions influencing the shrinkage direction of composite restorations have
questioned this (Chiang et al., 2009; Cho et al., 2011; Suh and Wang, 2001; Versluis et al.,
1998).
Chiang et al., 2009, 2010, found out that the thickness of enamel margins did influence the
shrinkage direction of composite: it detached from thin enamel margins and moved toward
the thicker ones (Chiang et al., 2009; Chiang et al., 2010; Rösch et al., 2009). In the previous
chapter, the shrinkage vectors were analyzed in a ceramic cavity with optimal adhesion to
eliminate any inhomogeneity of the bonding substrate, as it is the case in human teeth due to
the presence of enamel and dentin. Asmussen and Jorgensen, referred to the shrinkage inside
a cavity as the “effective shrinkage” while shrinkage per se is the “net shrinkage” or the “free
shrinkage” (Hansen, 1982a; b). The “effective shrinkage” is related to the cavity boundary
which implies that the composite adapts to the cavity walls even without the use of a bonding
agent (Asmussen and Jorgensen, 1972). Cavity boundaries are related to the cavity outlines
on one hand and the bonding substrates with associated bonding conditions on the other
hand.
The unbonded condition of composite inside a prepared cavity can be presented in different
ways: when human teeth are used, the composite is directly applied without prior surface
treatment of the cavity nor the application of an adhesive (Chiang et al., 2010; Takahashi et
al., 2010). If the cavity is prepared in an artificial model such as composite or glass, then
either no bonding agent is applied or a layer Vaseline is used as a separating agent (Cho et
al., 2011).
An excellent non-adhesive substrate is Teflon (polytetrafluoroethylene). Teflon is slippery,
thus, rendering it the non-adhesive property, in addition, it has high temperature resistance,
little reaction to most chemicals, and reduced stress cracking and corrosion. Therefore,
Teflon has important applications in cookware, and in the chemical and steel industries, just
to mention some (Toefco Engineered Coating Systems, 2013).
In dentistry, Teflon is not being used in dental applications, neither by the dentist, nor by the
dental lab technician, although in research, it is commonly used as an adjunctive material in
form of Teflon tape where non-bonded contact is desirable (Cheetham et al., 2014;
Dionysopoulos et al., 2013; Lee et al., 2012; Tornavoi et al., 2013), as well as Teflon molds
78
for the fabrication of specimen discs of composites (Badole et al., 2013; de Melo Monteiro
et al., 2011; Guven et al., 2013; Miletic et al., 2011; Mungara et al., 2013). Teflon is also
used in machines as a Teflon spacer (Davidson et al., 1984) or as a pedestal in the AcuVol
machine for volumetric polymerization shrinkage measurements (Labella et al., 1999). In
the periodontal and bone research Teflon is now used as coating, scaffold material or
membrane, in addition to its use in bacterial research (Cheng et al., 2013; Hayashi et al.,
2013; Kapferer et al., 2013; Lopes et al., 2013; Schweikl et al., 2013; Suzuki et al., 2014).
Cavities prepared in Teflon blocks were used for testing bulk-fill composites for their
temperature changes (Chang et al., 2013). Recent studies employed Teflon molds for gap
analysis (Pereira et al., 2008; Takahashi et al., 2010), volumetric analysis (de Melo Monteiro
et al., 2011) and image analysis of composites to detect discrepancies due to shrinkage
(Miletic et al., 2011). The unbonded situation in a non-adhesive Teflon cavity is just one of
many possibilities of a non-adhesive situation.
5.3 Aim of the study
The aim of this study was to visualize the polymerization shrinkage vectors of a light-cured
composite three-dimensionally and axially when applied in a non-adhesive Teflon mold in
order to observe the effect of a nonbonded boundary condition on the shrinkage pattern.
5.4 Materials and Methods
The composition of the experimental composite was listed in Table 4, p.39.
5.4.1 Specimen preparation
A Teflon cylinder (diameter 11 mm, height 15 mm) was cut from a block of Teflon, into
which a cylindrical cavity (diameter 6 mm, depth 3 mm, n=9) was prepared (Chiang et al.,
2009; Chiang et al., 2010; Versluis et al., 1998). Flowable composite was applied to the outer
surface of the Teflon cylinder and light cured all around to obtain a reference mark that
simulates enamel (Figure 42). This procedure was significant for the process of rigid
registration (overlay of both micro-CT-scans) at a later step. Identification of different
substrates depends on the corresponding greyvalue. The specimen was fixed into the sample
holder with composite to avoid its movement during scanning. The experimental composite
was applied into the prepared cavity of the Teflon model without the use of any adhesive.
Attachment to cavity walls was through secondary van der Waals forces only.

79
When the pilot studies have been conducted, one composite sample (n=1) was scanned on a
flat Teflon disc with the aim of visualizing shrinkage vectors upon polymerization when in
contact with just one surface.
The steps for the preparation of the experimental composite, the micro-CT measurements,
the data processing and the polymerization shrinkage evaluation were described in Chapter
3. After the first scan of uncured material, the composite was light-cured for 40 s
perpendicular to the long axis of the tooth.
Figure 42 The Teflon cylinder serving as a cavity model. Flowable composite was applied
to the outer contour simulating enamel in order to serve as a reference point for the rigid
registration.
Figure 43 Schematic drawing of the Teflon model.
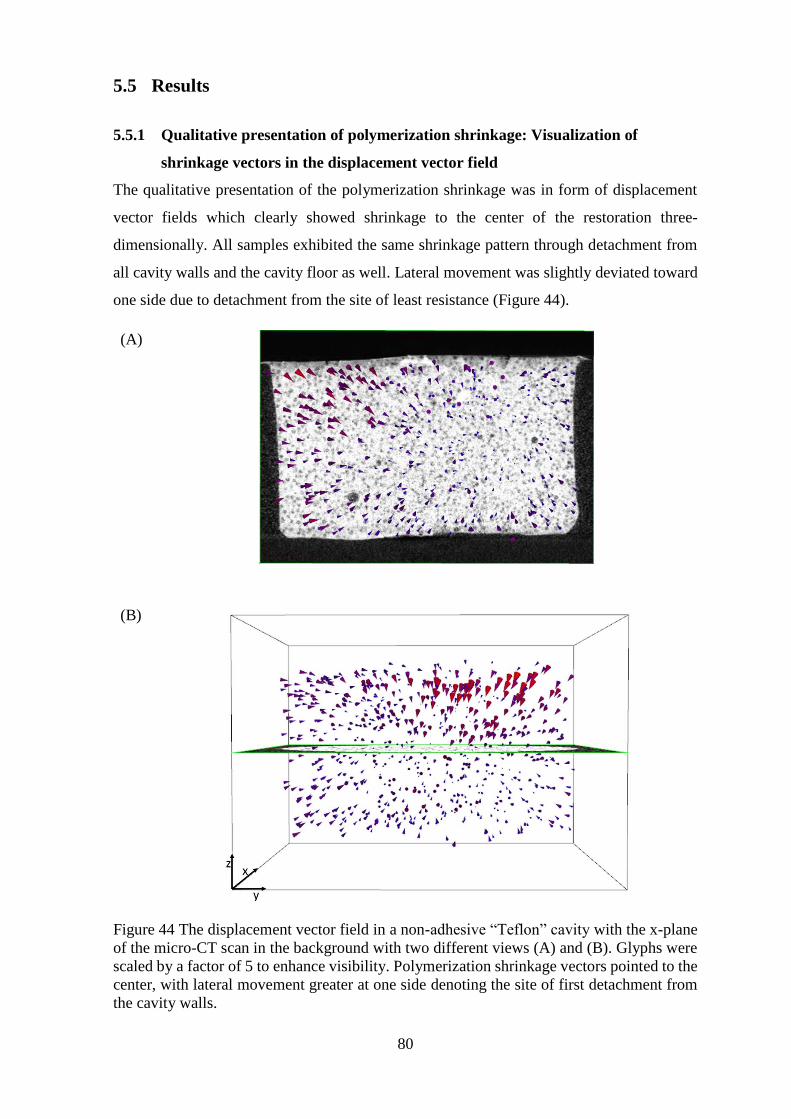
80
5.5 Results
5.5.1 Qualitative presentation of polymerization shrinkage: Visualization of
shrinkage vectors in the displacement vector field
The qualitative presentation of the polymerization shrinkage was in form of displacement
vector fields which clearly showed shrinkage to the center of the restoration three-
dimensionally. All samples exhibited the same shrinkage pattern through detachment from
all cavity walls and the cavity floor as well. Lateral movement was slightly deviated toward
one side due to detachment from the site of least resistance (Figure 44).
(A)
(B)
Figure 44 The displacement vector field in a non-adhesive “Teflon” cavity with the x-plane
of the micro-CT scan in the background with two different views (A) and (B). Glyphs were
scaled by a factor of 5 to enhance visibility. Polymerization shrinkage vectors pointed to the
center, with lateral movement greater at one side denoting the site of first detachment from
the cavity walls.
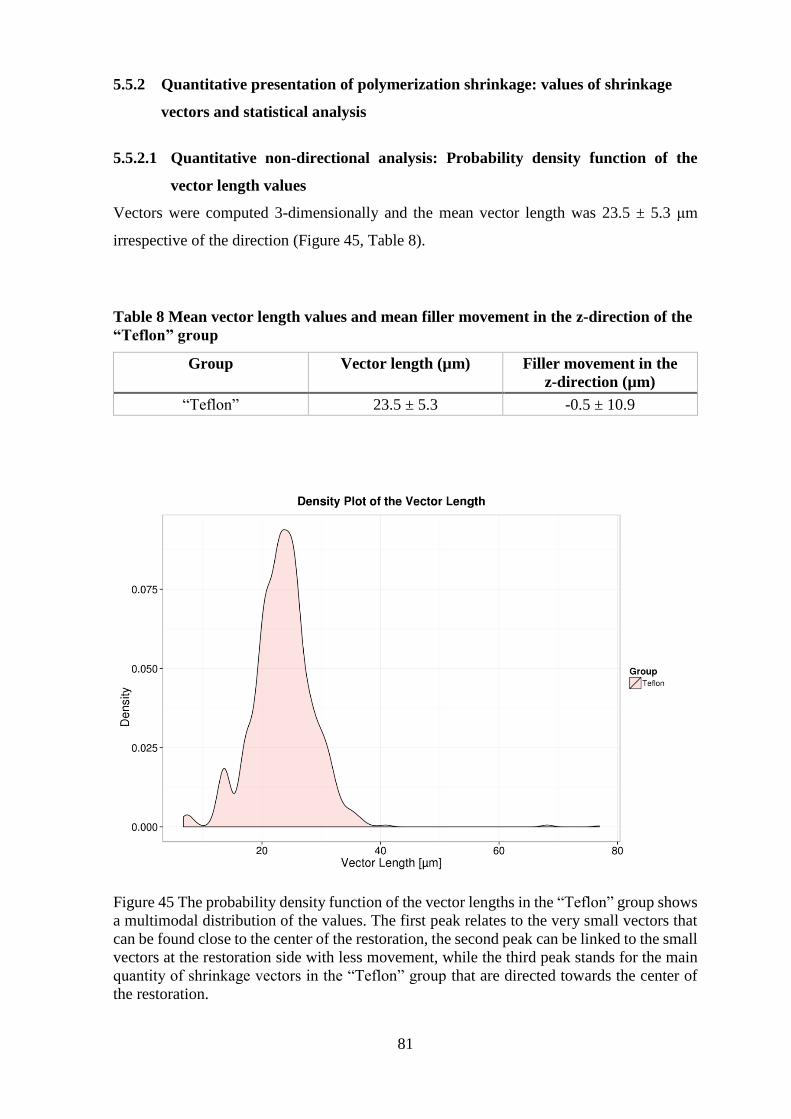
81
5.5.2 Quantitative presentation of polymerization shrinkage: values of shrinkage
vectors and statistical analysis
5.5.2.1 Quantitative non-directional analysis: Probability density function of the
vector length values
Vectors were computed 3-dimensionally and the mean vector length was 23.5 ± 5.3 μm
irrespective of the direction (Figure 45, Table 8).
Table 8 Mean vector length values and mean filler movement in the z-direction of the
“Teflon” group
Group Vector length (µm) Filler movement in the
z-direction (µm)
“Teflon” 23.5 ± 5.3 -0.5 ± 10.9
Figure 45 The probability density function of the vector lengths in the “Teflon” group shows
a multimodal distribution of the values. The first peak relates to the very small vectors that
can be found close to the center of the restoration, the second peak can be linked to the small
vectors at the restoration side with less movement, while the third peak stands for the main
quantity of shrinkage vectors in the “Teflon” group that are directed towards the center of
the restoration.

82
5.5.2.2 Quantitative directional analysis: Probability density function of the vector z-
component (Filler Movement in the z-direction):
The mean filler movement in the z-direction was -0.5 ± 10.9 μm which related to minimal
upward movement toward the light source (Figure 46, Table 8).
Figure 46 The probability density function of the filler movements in the z-direction in the
“Teflon” group shows a multimodal distribution with 4 peaks (grey color). The areas below
the separate peaks are joined into one area (pink color). The first and second peaks conform
to upward shrinkage movement that was found at the cavity floor and the lower restoration
part. The third peak constitutes the large quantity of small axial movement with slight
downward shrinkage which can be related to the middle part of the restoration where the
glass beads moved mainly in horizontal direction toward the restoration center. The last peak
can be linked to the downward movement of glass beads at the free surface of the restoration.
83
5.6 Discussion
The Teflon block did provide a satisfactory model for the cavity without problems neither
with the composite application, nor the micro-CT scanning procedure, nor in the evaluation
phase. As an inherently non-adhesive substrate it is superior to the use of a separating agent
as seen in other studies (Cho et al., 2011). The limitation of this cavity model with regards
clinical application is the fact that Teflon as a bonding substrate is not comparable to the
natural tooth structure, but it was the purpose of this study to obtain the ultimate nonbonded
condition.
The three-dimensional shrinkage toward the center of the restoration stands in contrast to the
longlasting belief that light-cured composites shrink toward the light. Shrinkage in the lateral
direction was greater at one side, which was possibly the site of least resistance to adaptation
and first detachment due to shrinkage; this finding is in agreement with (Asmussen and
Jorgensen, 1972). Resin composites can adapt to cavity walls due to weak secondary forces
even if no bonding agent is applied. Therefore, it was concluded that this specific three-
dimensional shrinkage pattern was related to the unbonded boundary condition rather than
the type of activation. Similar findings were previously reported when a nonbonded
composite was investigated for its surface depression and marginal gaps (Suh and Wang,
2001).
An earlier study employing micro-CT scans for the volumetric analysis of polymerization
shrinkage showed volume loss at one side of the cylindrical cavity, although data on the
internal contraction behaviour were not available (Sun et al., 2009b). Interestingly, their
observation can be related to the lateral movement by the shrinkage vectors. Our results also
coincided with the FEA simulation regarding the unbonded condition (Versluis et al., 1998),
which confirmed the presence of uniform boundary conditions in our case. On the other
hand, our results varied from those reported by Chiang et al., 2010, in their unbonded
condition in teeth where shrinkage vectors pointed toward one side of the cavity (Chiang et
al., 2009; Chiang et al., 2010) and the unbonded condition in a composite model reported by
Cho et al., that showed upward movement of the shrinkage vectors (Cho et al., 2011).
The mean axial movement was almost zero micrometer due to negation of upward and
downward movements. The downward contraction can be explained by the composite’s free
surface and the upward shrinkage by the detachment from the non-adhesive interface with
Teflon. This shrinkage pattern is in clear contrast to that seen in the ceramic cavities that
were perfectly bonded and showed downward movement toward the floor due to the strong

84
bond by the silane coupling agent. The axial movement was similar to that observed in the
“cylindrical cavity” in the Chapter 3, though in the Teflon group a greater horizontal
movement was detected due to lack of bonding to the cavity walls. Cho’s unbonded
condition in a composite mold differed from our results in the Teflon mold by displaying
only upward movement and no movement toward the center. On the other hand, their bonded
condition was in agreement with those of the “cylindrical cavity” in teeth where downward
shrinkage from the free surface met the upward shrinkage from the lower part in a fictional
zero-line, a line where no axial movement was spotted (Cho et al., 2011).
How would a light-cured composite shrink if simply laid down on a Teflon disc without any
constraining cavity walls? If the surface was absolutely smooth, it would have shrunk from
all free surfaces, even at the margins between the composite and the flat surface. In the “free
shrinkage” it shrank toward the center from all contactfree sides, but in the lower part in
contact with the Teflon disc (0.5 mm) almost no shrinkage was detectable with the sample
being light-cured from above (Figure 47). Therefore, the Teflon surface is assumed to be
incompletely smooth with some degree of roughness or physical adhesion unlike the dental
adhesion. Certainly, such contraction movement is related to its boundary condition, because
there is just a flat surface and no cavity walls to detach from. This leads to the need to
investigate polymerization shrinkage, not only under different boundary conditions in terms
of the bonding situation, but also in cavities with different C-factors and classes.
Teflon represents the most extreme unbonded condition that cannot be surpassed. The
current results give an insight into the shrinkage behavior under such condition which leads
to a basic understanding on how boundary conditions affect the shrinkage pattern. Human
tooth structures and bonding agents offer many factors resulting in variations in bonding
quality which in turn affect the shrinkage vectors’ direction and magnitude. The wide variety
of dentin-bonding agents, both self-etch and total-etch systems, have great differences in
their bond strength values. This topic needs further research that will be addressed in the
next chapter.

85
(A)
(B)
Figure 47 The experimental composite was placed on a Teflon disc and exhibited the “free
shrinkage” and light was applied from above. Shrinkage vectors pointed toward the center
of the composite and the y-plane (A) and z-plane (B) of the micro-CT scan were seen in the
background. The composite in contact with the Teflon disc displayed almost no shrinkage
vectors. Glyphs were scaled by a factor of 5 to enhance visibility.

86
Figure 48 Schematic drawing of composite before (A) and after (B) light-curing on the
Teflon disc. A completely smooth surface would even allow for shrinkage movement on the
Teflon disc surface toward the center.

87
Conclusions
Within the limitations of this study the following can be concluded:
1. The Teflon cavity model served well as a non-adhesive cavity.
2. The composite shrank toward the center, although it was a light-cured type.
3. It can be concluded that this shrinkage pattern was related to the fact that composite
was unbonded.
4. Shrinkage in lateral direction was greater at one side, which is possibly the site of
least resistance to adaptation and first detachment due to shrinkage.
5. The shrinkage pattern is related to the bonding conditions and not the type of
activation.
6. The results of this study can be transferred to weak bonding agents or dental
substrates with unfavorable bonding properties.

88
6 Shrinkage Vectors in an Experimental Cavity with Enamel
Floor
6.1 Abstract
Objectives: As bonding to enamel is stronger than bonding to dentin, the aim of this study
was to determine the role of enamel or its influence on the direction of shrinkage vectors.
Methods: 36 human teeth were divided into 4 groups (n=9); first, according to the cavity
form into “experimental” and “cylindrical” groups, then subdivided according to the bonding
agent into “self-etch” and “total-etch” groups. In the “experimental” group teeth were
embedded upside down in the acrylic resin, the roots removed and cylindrical class I cavities
were prepared (6 mm diameter, 3 mm deep) into dentin with enamel at the cavity floor with
the purpose to evaluate enamel’s influence on the shrinkage direction. In the “cylindrical”
group teeth were embedded with their roots in the acrylic resin followed by the cylindrical
cavity preparation. Then 2 wt% traceable glass beads were added to the composite (Tetric
EvoFlow, Ivoclar Vivadent) and bonded with self-etch-adhesive (Adper Easy Bond, 3M
ESPE) or a total-etch-adhesive (OptiBond FL, Kerr). Two micro-CT scans were performed
of each specimen (uncured, cured), subjected to image segmentation for extraction of glass
beads and followed by registration based on a block-matching algorithm. The resulting
displacement vector field showed shrinkage vectors three-dimensionally and shrinkage
vectors were analyzed regarding the vertical dimension as well.
Results: Mean vector lengths were computed irrespective of their direction, where the
“experimental-self-etch” showed longer vectors (31.8 ± 14.3 μm) than “cylindrical-total-
etch” (25.8 ± 11.0 μm), “experimental-total-etch” (25.5 ± 14.7 μm) and “cylindrical-self-
etch” (23.3 ± 11.1 μm) using one-way ANOVA (F=100.7 , Df=3,5960; p<0.001) and post-
hoc pairwise comparison using Tamhane’s T2 test showed significant differences between
all groups except for “experimental-total-etch” and “cylindrical-total-etch” groups
(p=0.991). Analyzing the glass bead movement in the z-direction only displayed downward
movement in “experimental-self-etch” (7.6 ± 15.9 μm) and “experimental-total-etch” (4.5 ±
13.2 μm) groups, while in “cylindrical-self-etch (-3.7 ± 13.6 μm) and “cylindrical-total-etch”
(-5.2 ± 13.4 μm) the tracer particles moved upward. One-way ANOVA revealed significant
differences (F=271.5 , Df=3,5982; p<0.001) and the post-hoc pairwise comparison using
Tamhane’s T2 test showed significant differences between all groups (p<0.05).

89
Additionally, the vector lengths were analyzed using the univariate ANOVA: the dependent
variable was the vector length, the independent variables were the cavity form and the
bonding agent each with 2 levels: the “experimental” and the “cylindrical” cavities, and the
self-etch and the total-etch adhesives. The same investigation was applied to the filler
movements in the z-direction using IBM SPSS Statistics 20. This investigation aimed at
analyzing the effect of each the cavity and the bonding agent.
Conclusion: The enamel influenced the direction of the shrinkage vectors. The shrinkage
vectors were always directed towards the enamel substrate. The bonding agents caused
variations in the magnitude of the shrinkage vectors.
6.2 Introduction
Bonding to enamel is stronger than bonding to dentin (Swift et al., 1995). Presently, there
has been little information on how enamel influences the shrinkage direction of bonded resin
composites. Data on the displacement vectors in human teeth are available from Chiang et
al., (Chiang et al., 2009; Chiang et al., 2010) and from the first part of this study. Chiang et
al., illustrated that unequal amounts of enamel lead to changes in the displacement vector
fields: in cavities with margins of unequal enamel thickness showed shrinkage towards the
thick enamel margin, while in cavities (Chiang et al., 2009; Chiang et al., 2010). Different
cavity configurations implied that enamel margins which were cut at various angles also
resulted in alterations of the displacement vector fields.
Referring to the fact that bonding to enamel is assumed to be stronger than bonding to dentin
(Van Meerbeek et al., 2003), it is possible that the adhesion to enamel pulls the bonded
composite away from dentin. Thus, in a traditional class I cavity prepared for an adhesive
restoration, the shrinkage vectors should point upwards towards enamel (Chapter 3). This
has been interpreted earlier as “shrinkage toward the light source” (Porte et al., 1984).
The preparation of an experimental cavity with enamel at the cavity floor may clarify the
influence of enamel in terms of the bonding substrate on the shrinkage direction. According
to the “traditional” hypothesis in dentistry, the composite should be shrinking toward the
light source. However, we hypothesize adhesion is more important than the direction of the
light. Therefore, we would assume that the composite shrinkage vectors should be directed
towards the enamel areas inside the cavity.
90
6.3 Aim of the study
How strong is the influence of enamel on the shrinkage direction? In the “experimental”
group a cylindrical cavity with enamel at the cavity floor was prepared and compared to the
“cylindrical” group of Chapter 3. Moreover, the cylindrical cavities can be associated with
previous studies (Chiang et al., 2009; Chiang et al., 2010; Versluis et al., 1998). The aim of
this study was to analyze the effect of the bonding substrates enamel and dentin and two
bonding conditions on the polymerization shrinkage in form of shrinkage vectors. The results
could contribute to a more profound understanding of the effect of boundary conditions on
the shrinkage direction.
6.4 Materials and Methods
The compositions of the experimental composite and the self-etch adhesive were listed in
Table 4, p.39, and the total-etch adhesive was listed in Table 6, p.64.
6.4.1 Specimen preparation
A total of 36 teeth were divided into 4 groups (n=9). First, teeth were divided into two groups
according to the bonding substrate into “experimental” and “cylindrical”, then subdivided
according to the bonding agent (bonding condition) into “self-etch” and “total-etch” groups.
In the “experimental” group, the teeth were embedded in acrylic resin (Technovit 4000,
Heraeus Kulzer, Germany) upside down, with the crown inside the acrylic resin. Then the
roots were removed using a slow speed water-cooled diamond saw (Isomet, Beuhler, Illinois,
USA), (Figure 49, Figure 67), and a cylindrical class I cavity (3 mm deep and 6 mm in
diameter) was prepared from the pulpal side with cavity margins in the dentin and the floor
of the cavity in enamel. This experimental cavity model was intended to analyze the effect
of having a cavity floor of enamel offering stronger bonding properties than dentin. In the
“cylindrical” group, teeth were embedded in acrylic resin below the cement-enamel junction
and the occlusal surface flattened for easy perpendicular light application (Figure 49, Figure
68).
The “cylindrical” cavity was prepared according to Chiang et al., with cylindrical walls
(Chiang et al., 2009; Chiang et al., 2010; Versluis et al., 1998). The samples were fixed to
the sample holder with composite to prevent any movement during the scanning procedure.
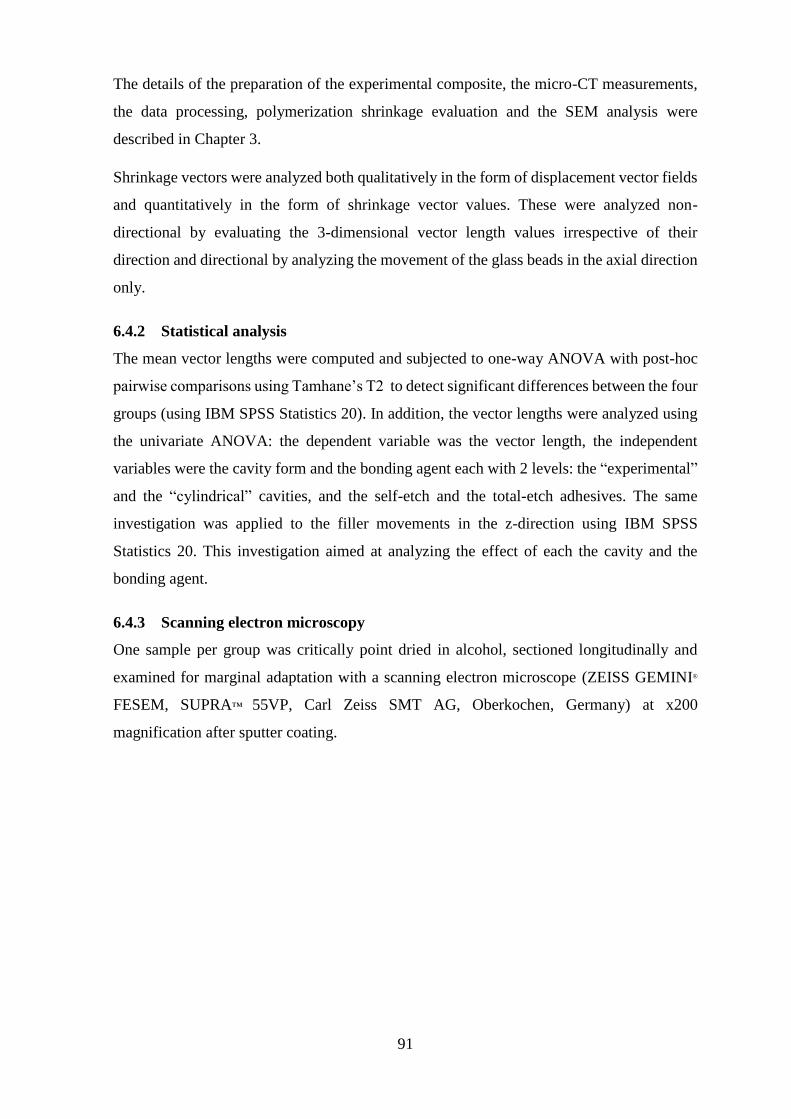
91
The details of the preparation of the experimental composite, the micro-CT measurements,
the data processing, polymerization shrinkage evaluation and the SEM analysis were
described in Chapter 3.
Shrinkage vectors were analyzed both qualitatively in the form of displacement vector fields
and quantitatively in the form of shrinkage vector values. These were analyzed non-
directional by evaluating the 3-dimensional vector length values irrespective of their
direction and directional by analyzing the movement of the glass beads in the axial direction
only.
6.4.2 Statistical analysis
The mean vector lengths were computed and subjected to one-way ANOVA with post-hoc
pairwise comparisons using Tamhane’s T2 to detect significant differences between the four
groups (using IBM SPSS Statistics 20). In addition, the vector lengths were analyzed using
the univariate ANOVA: the dependent variable was the vector length, the independent
variables were the cavity form and the bonding agent each with 2 levels: the “experimental”
and the “cylindrical” cavities, and the self-etch and the total-etch adhesives. The same
investigation was applied to the filler movements in the z-direction using IBM SPSS
Statistics 20. This investigation aimed at analyzing the effect of each the cavity and the
bonding agent.
6.4.3 Scanning electron microscopy
One sample per group was critically point dried in alcohol, sectioned longitudinally and
examined for marginal adaptation with a scanning electron microscope (ZEISS GEMINI®
FESEM, SUPRA™ 55VP, Carl Zeiss SMT AG, Oberkochen, Germany) at x200
magnification after sputter coating.

92
(A)
(B)
Figure 49 Diagrammatic presentation of the “experimental” cavity with enamel at the cavity
floor and dentin margins to study the effect of the bonding substrate on the shrinkage
direction (A) and the “cylindrical” cavity that represents a cylindrical class I cavity (B).
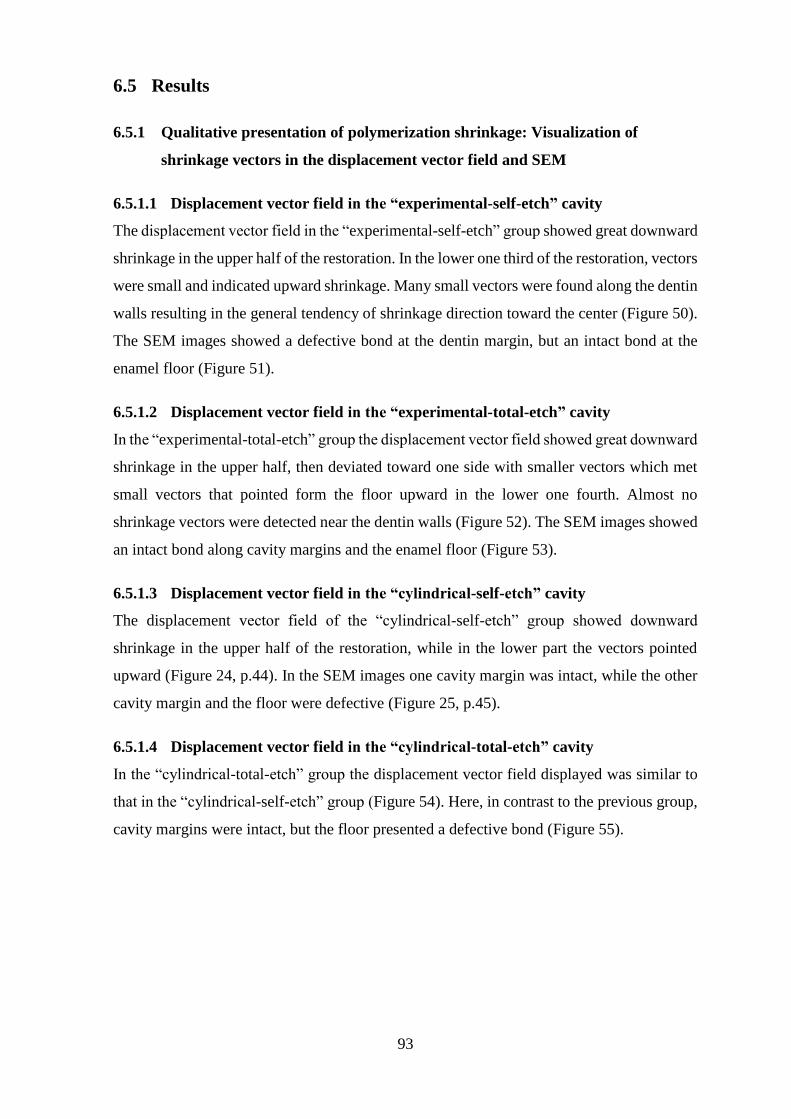
93
6.5 Results
6.5.1 Qualitative presentation of polymerization shrinkage: Visualization of
shrinkage vectors in the displacement vector field and SEM
6.5.1.1 Displacement vector field in the “experimental-self-etch” cavity
The displacement vector field in the “experimental-self-etch” group showed great downward
shrinkage in the upper half of the restoration. In the lower one third of the restoration, vectors
were small and indicated upward shrinkage. Many small vectors were found along the dentin
walls resulting in the general tendency of shrinkage direction toward the center (Figure 50).
The SEM images showed a defective bond at the dentin margin, but an intact bond at the
enamel floor (Figure 51).
6.5.1.2 Displacement vector field in the “experimental-total-etch” cavity
In the “experimental-total-etch” group the displacement vector field showed great downward
shrinkage in the upper half, then deviated toward one side with smaller vectors which met
small vectors that pointed form the floor upward in the lower one fourth. Almost no
shrinkage vectors were detected near the dentin walls (Figure 52). The SEM images showed
an intact bond along cavity margins and the enamel floor (Figure 53).
6.5.1.3 Displacement vector field in the “cylindrical-self-etch” cavity
The displacement vector field of the “cylindrical-self-etch” group showed downward
shrinkage in the upper half of the restoration, while in the lower part the vectors pointed
upward (Figure 24, p.44). In the SEM images one cavity margin was intact, while the other
cavity margin and the floor were defective (Figure 25, p.45).
6.5.1.4 Displacement vector field in the “cylindrical-total-etch” cavity
In the “cylindrical-total-etch” group the displacement vector field displayed was similar to
that in the “cylindrical-self-etch” group (Figure 54). Here, in contrast to the previous group,
cavity margins were intact, but the floor presented a defective bond (Figure 55).

94
(A)
(B)
Figure 50 The displacement vector field of the “experimental-self-etch” cavity, with the x-
plane (A) and the z-plane (B) of the micro-CT scan in the background. Glyphs were scaled
by a factor of 5 to enhance visibility. Large shrinkage vectors were detected in the upper
restoration part and small vectors pointed away from cavity walls.
(A)
(B)
Figure 51 SEM images (x200) of the “experimental-self-etch” group with a defective dentin
margin (A) and an intact bond at the enamel floor (B). One traceable glass filler is marked
by the star *.
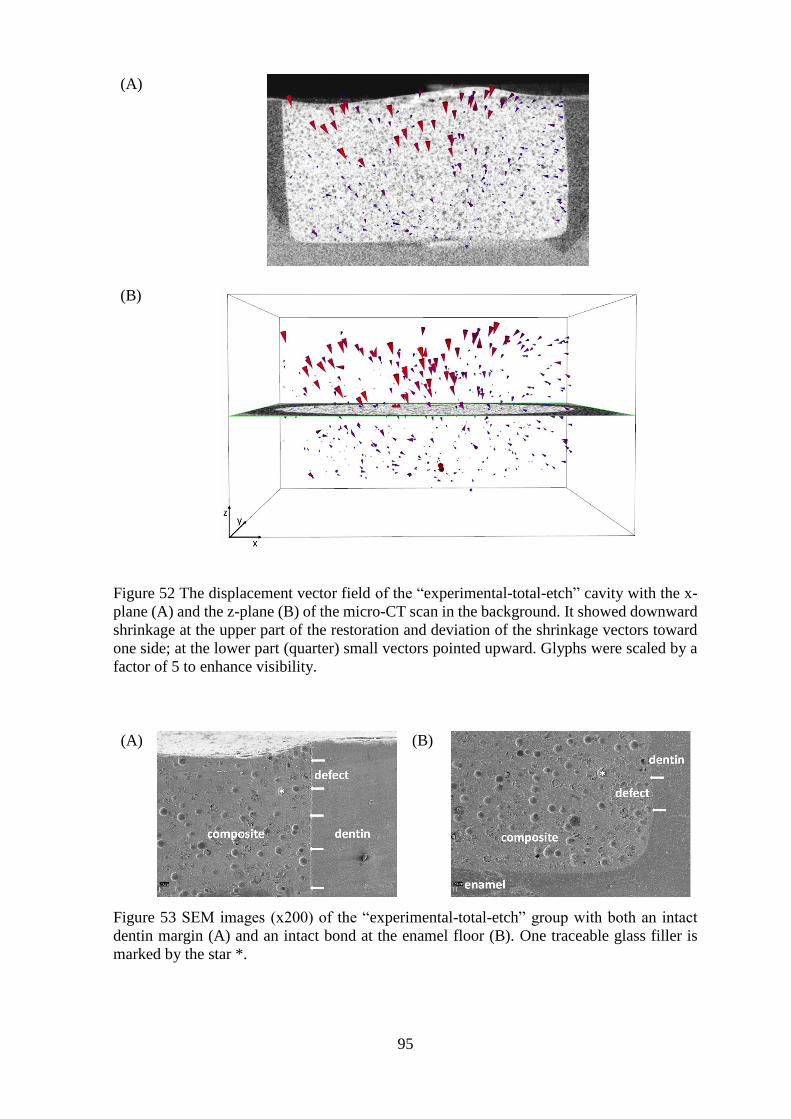
95
(A)
(B)
Figure 52 The displacement vector field of the “experimental-total-etch” cavity with the x-
plane (A) and the z-plane (B) of the micro-CT scan in the background. It showed downward
shrinkage at the upper part of the restoration and deviation of the shrinkage vectors toward
one side; at the lower part (quarter) small vectors pointed upward. Glyphs were scaled by a
factor of 5 to enhance visibility.
(A)
(B)
Figure 53 SEM images (x200) of the “experimental-total-etch” group with both an intact
dentin margin (A) and an intact bond at the enamel floor (B). One traceable glass filler is
marked by the star *.

96
(A)
(B)
Figure 54 The displacement vector field of the “cylindrical-total-etch” cavity, with the x-
plane (A) and the z-plane (B) of the micro-CT scan in the background. Glyphs were scaled
by a factor of 5 to enhance visibility. Downward shrinkage at the upper restoration part and
smaller shrinkage upward pointing upward at the cavity floor.
(A)
(B)
Figure 55 SEM images (x200) of the “cylindrical-total-etch” cavity displaying an intact bond
at the enamel margin (A), while the bond with the dentin floor was defective (B). One
traceable glass filler is marked by the star *.
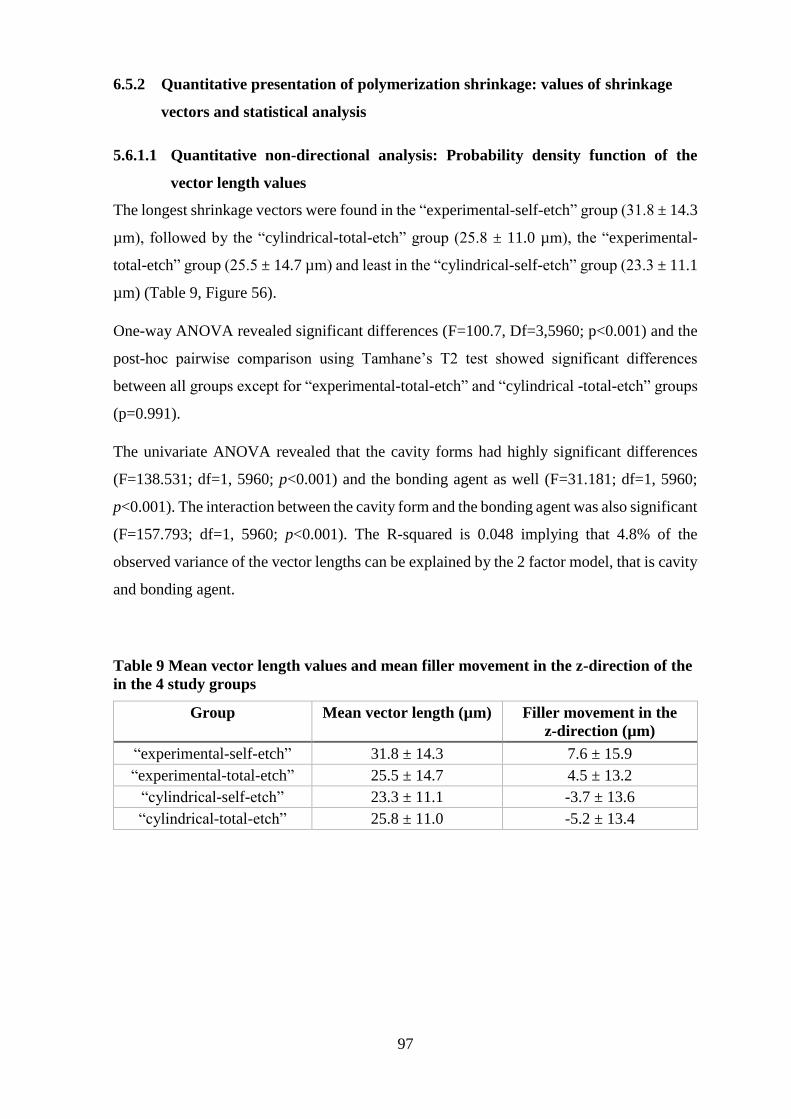
97
6.5.2 Quantitative presentation of polymerization shrinkage: values of shrinkage
vectors and statistical analysis
5.6.1.1 Quantitative non-directional analysis: Probability density function of the
vector length values
The longest shrinkage vectors were found in the “experimental-self-etch” group (31.8 ± 14.3
µm), followed by the “cylindrical-total-etch” group (25.8 ± 11.0 µm), the “experimental-
total-etch” group (25.5 ± 14.7 µm) and least in the “cylindrical-self-etch” group (23.3 ± 11.1
µm) (Table 9, Figure 56).
One-way ANOVA revealed significant differences (F=100.7, Df=3,5960; p<0.001) and the
post-hoc pairwise comparison using Tamhane’s T2 test showed significant differences
between all groups except for “experimental-total-etch” and “cylindrical -total-etch” groups
(p=0.991).
The univariate ANOVA revealed that the cavity forms had highly significant differences
(F=138.531; df=1, 5960; p<0.001) and the bonding agent as well (F=31.181; df=1, 5960;
p<0.001). The interaction between the cavity form and the bonding agent was also significant
(F=157.793; df=1, 5960; p<0.001). The R-squared is 0.048 implying that 4.8% of the
observed variance of the vector lengths can be explained by the 2 factor model, that is cavity
and bonding agent.
Table 9 Mean vector length values and mean filler movement in the z-direction of the
in the 4 study groups
Group Mean vector length (µm) Filler movement in the
z-direction (µm)
“experimental-self-etch” 31.8 ± 14.3 7.6 ± 15.9
“experimental-total-etch” 25.5 ± 14.7 4.5 ± 13.2
“cylindrical-self-etch” 23.3 ± 11.1 -3.7 ± 13.6
“cylindrical-total-etch” 25.8 ± 11.0 -5.2 ± 13.4
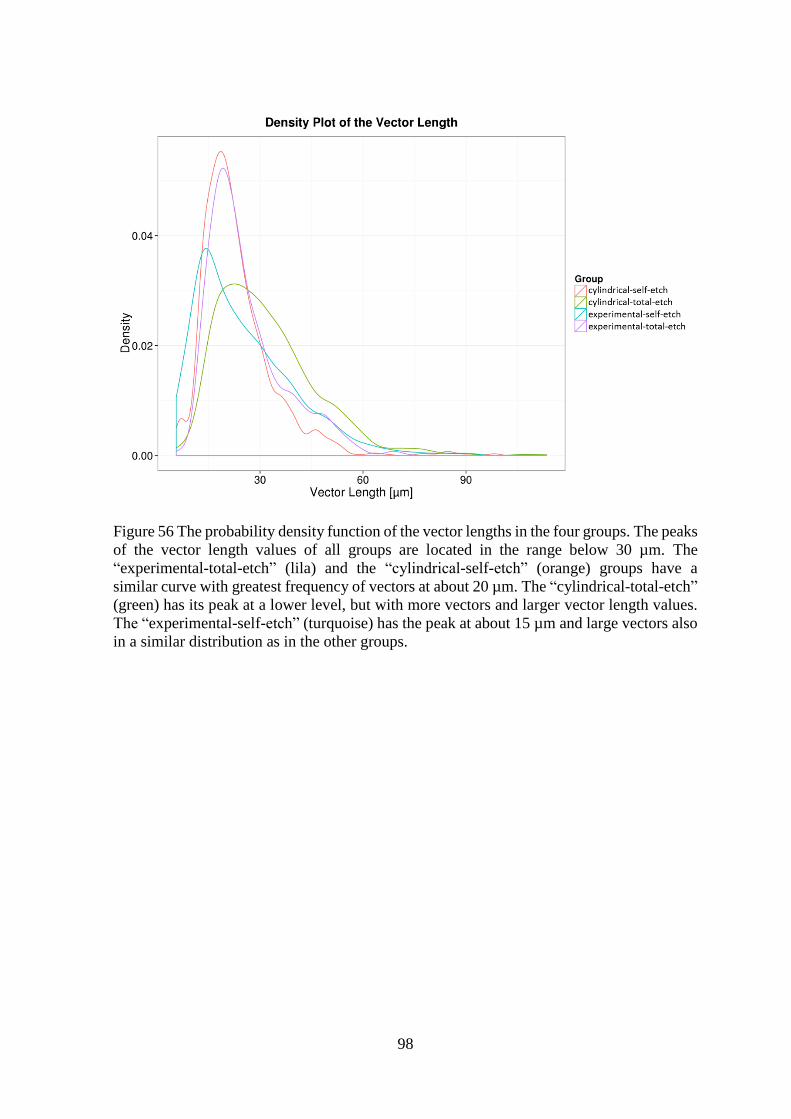
98
Figure 56 The probability density function of the vector lengths in the four groups. The peaks
of the vector length values of all groups are located in the range below 30 µm. The
“experimental-total-etch” (lila) and the “cylindrical-self-etch” (orange) groups have a
similar curve with greatest frequency of vectors at about 20 µm. The “cylindrical-total-etch”
(green) has its peak at a lower level, but with more vectors and larger vector length values.
The “experimental-self-etch” (turquoise) has the peak at about 15 µm and large vectors also
in a similar distribution as in the other groups.
99
6.5.2.1 Quantitative directional analysis: Probability density function of the vector z-
component (Filler Movement in the z-direction):
In the “experimental” group tracer beads generally moved downward and away from the
light source. The movement in the “experimental-self-etch” group was greater (7.6 ± 15.9
µm) than in the “experimental-total-etch” group (4.5 ± 13.2 µm). On the contrary, in the
“cylindrical” groups the tracers moved upward and toward the light source with greater
values in the “cylindrical-total-etch” group (-5.2 ± 13.4 µm) than in “cylindrical-self-etch”
group (-3.7 ± 13.6 µm) (Table 9, Figure 57).
One-way ANOVA revealed significant differences (F=271.5, Df=3,5982; p<0.001) and the
post-hoc pairwise comparison using Tamhane’s T2 test showed significant differences
between all groups (p<0.05).
The univariate ANOVA revealed that the cavity forms had highly significant differences
(F=810.167; df=1, 5982; p<0.001) and the bonding agent as well (F=39.535; df=1, 5982;
p<0.001). The interaction between cavity and the bonding agent was also significant
(F=4.420; df=1, 5982; p<0.001). The R-squared is 0.12 implying that 12% of the observed
variance of the filler movement in the z-direction can be explained by the 2 factor model,
that is the cavity and the bonding agent.

100
Figure 57 The probability density function of the filler movements in the z-direction in the
four groups. 3 Groups have a multimodal distribution of the axial filler movement values.
The “experimental-self-etch” group (turquoise) has the first peak in the negative range of
small movements related to upward shrinkage found at the cavity floor, while the second
peak is located in the positive range that can be attributed to the downward shrinkage of the
free surface. The “experimental-total-etch” group (lila) has only one peak that is located in
the negative range at about -15 µm which relates to the upward shrinkage; yet, another large
portion of the values are in the positive range that conforms to the downward movement of
the free restoration surface. In the “cylindrical-self-etch” group (orange) the two peaks are
situated in the negative range denoting upward shrinkage. In the “cylindrical-total-etch”
group (green) one peak was located in the negative values but the majority of vectors are in
the positive range which indicate downward shrinkage.
101
6.6 Discussion
This study demonstrated that the bonding substrate significantly influenced the
polymerization shrinkage direction. The filler movement in the z-direction showed marked
differences between the “experimental” and the “cylindrical” groups. On the other hand,
varying the bonding condition (self-etch versus total-etch) did not affect the shrinkage
direction, but rather produced alterations in the magnitude of the vector lengths. The self-
etch adhesive was more prone to variations and vector lengths differed significantly between
the “experimental-self-etch” and “cylindrical-self-etch” groups. The vector lengths in the
“total-etch” groups showed no significant difference. Equal vector length values could be
related to the increased film thickness of the total-etch adhesive which balances local
variations, thus, decreases detachment from the cavity walls.
The fictional zero-line was a plane where shrinkage vectors of opposite directions met;
shrinkage vectors from the free surface moved downward, while shrinkage vectors from the
lower restoration part moved upward to join in a region of no horizontal movement. In all
groups, except for the “experimental-total-etch”, the fictional zero-line was located midway
between the cavity floor and the free surface. However, the net axial shrinkage direction
differed depending on the bonding substrate. Yet, in the “experimental-total-etch” group, the
fictional zero-line was located at the lower quarter. Moreover, the displacement vector field
of the “experimental-total-etch” group resembled that of the ceramic cavities with optimal
adhesion (Chapter 4). For this reason, it can be assumed that the bond between the composite
and specially the cavity floor was stronger than in the other groups. This strong bond could
be attributed to both the presence of enamel at the cavity floor, acid etched enamel and the
use of the total-etch adhesive.
The cylindrical cavity with parallel walls was the cavity configuration of choice as it was
free of any configurational variations. In addition, it can be compared to previous studies
(Chiang et al., 2009; Versluis et al., 1998) and the results presented in Chapter 3-5 as well.
On the other hand, the C-factor of the cylindrical class I cavities was the most unfavorable
resulting in greater shrinkage stresses that can lead to subsequent debonding or detachment
from the cavity floor and/or margins. Detachments were seen in the “experimental” group at
dentin cavity margins, maybe due to greater downward shrinkage of the free surface or
because the bond with the dentin margin was weaker than the bond with the enamel margin.
Or in other words, debonding of the composite from the dentin cavity margins occurred and
in turn composite could move downward. On the contrary, detachments in the “cylindrical”
102
groups were rather seen at the cavity floor that consisted of dentin as in the clinical situation.
The detachments were in agreement with the larger shrinkage vectors: in the “experimental”
large vectors were seen in the upper restoration part near the free surface, while in the
“cylindrical” cavities the large shrinkage vectors were located at the lower restoration part.
However, information on the topic of shrinkage vectors is scarce. The results of this study
varied from findings of Chiang et al., 2009, with regards to the displacement vector field.
This could be related to the quantity of enamel at the margins as well as the applied bonding
agent which was in their case a weak self-etch adhesive. Shrinkage vectors point upward in
a cavity with equal enamel margins and point toward one side in a cavity with unequal
enamel margins (Chiang et al., 2009; Chiang et al., 2010). The self-etch adhesive of the
current study was stronger and the cavities did not show noticeable variations in the amount
of enamel at the cavity margins. Consequently, the displacement vector fields were similar
even with the use of self-etch and total-etch adhesives.
The “experimental” cavity with the enamel floor is clinically not relevant or possible, but
the results are useful for learning more about the effect of the bonding substrates on the
shrinkage direction. It highlighted that the location of enamel is able to change the direction
of shrinkage vectors when all other boundary conditions are constant. This is in agreement
with findings of Chiang et al., 2009, that showed that variation of enamel margin’s thickness
led to change in direction of shrinkage vectors (Chiang et al., 2009; Chiang et al., 2010),
though in the current study the enamel was located at the cavity floor. Moreover, the
“cylindrical” group did not have these variations of enamel margin thickness. In the
“experimental” group the cavity floor was not always completely located in enamel because
the presence and amount of enamel is related to the shape of the dentin-enamel junction and
the enamel cap. Accordingly, some cavities had a cavity floor with only a central area of
enamel surrounded by dentin, while other cavity floors were completely formed of enamel.
Nevertheless, the enamel floor pulled the composite, especially in the “total-etch” group. In
the “self-etch” group, this effect was less pronounced which may be attributed to the lower
bond strength values of self-etch adhesives compared with total-etch adhesives (Goracci et
al., 2004; Inoue et al., 2001), even more, when bonding to enamel without previous acid
etching. Indeed, it proved in a tooth model that shrinkage was related to the bonding substrate
and not the light source.
Another study investigating shrinkage vectors used an artificial mold of composite instead
of human teeth (Cho et al., 2011), likewise a glass model cavity was used for shrinkage stress
assessment (Li et al., 2011). Other studies used Teflon molds for gap analysis (Pereira et al.,
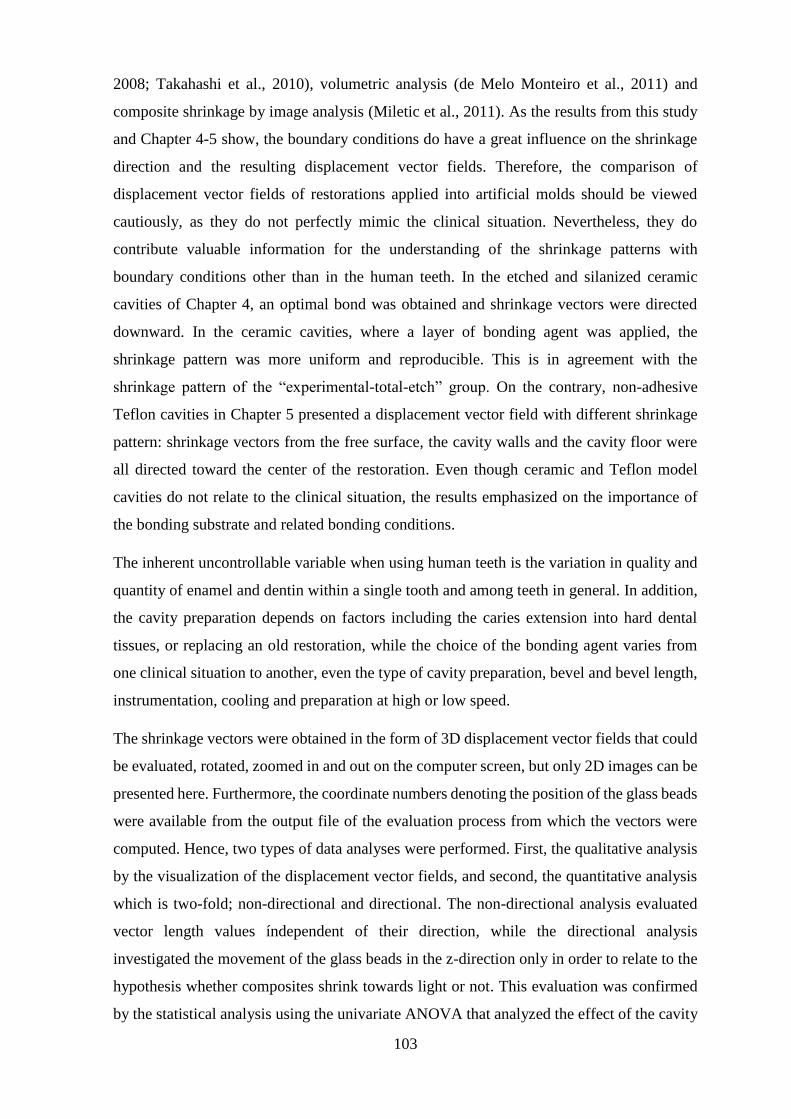
103
2008; Takahashi et al., 2010), volumetric analysis (de Melo Monteiro et al., 2011) and
composite shrinkage by image analysis (Miletic et al., 2011). As the results from this study
and Chapter 4-5 show, the boundary conditions do have a great influence on the shrinkage
direction and the resulting displacement vector fields. Therefore, the comparison of
displacement vector fields of restorations applied into artificial molds should be viewed
cautiously, as they do not perfectly mimic the clinical situation. Nevertheless, they do
contribute valuable information for the understanding of the shrinkage patterns with
boundary conditions other than in the human teeth. In the etched and silanized ceramic
cavities of Chapter 4, an optimal bond was obtained and shrinkage vectors were directed
downward. In the ceramic cavities, where a layer of bonding agent was applied, the
shrinkage pattern was more uniform and reproducible. This is in agreement with the
shrinkage pattern of the “experimental-total-etch” group. On the contrary, non-adhesive
Teflon cavities in Chapter 5 presented a displacement vector field with different shrinkage
pattern: shrinkage vectors from the free surface, the cavity walls and the cavity floor were
all directed toward the center of the restoration. Even though ceramic and Teflon model
cavities do not relate to the clinical situation, the results emphasized on the importance of
the bonding substrate and related bonding conditions.
The inherent uncontrollable variable when using human teeth is the variation in quality and
quantity of enamel and dentin within a single tooth and among teeth in general. In addition,
the cavity preparation depends on factors including the caries extension into hard dental
tissues, or replacing an old restoration, while the choice of the bonding agent varies from
one clinical situation to another, even the type of cavity preparation, bevel and bevel length,
instrumentation, cooling and preparation at high or low speed.
The shrinkage vectors were obtained in the form of 3D displacement vector fields that could
be evaluated, rotated, zoomed in and out on the computer screen, but only 2D images can be
presented here. Furthermore, the coordinate numbers denoting the position of the glass beads
were available from the output file of the evaluation process from which the vectors were
computed. Hence, two types of data analyses were performed. First, the qualitative analysis
by the visualization of the displacement vector fields, and second, the quantitative analysis
which is two-fold; non-directional and directional. The non-directional analysis evaluated
vector length values índependent of their direction, while the directional analysis
investigated the movement of the glass beads in the z-direction only in order to relate to the
hypothesis whether composites shrink towards light or not. This evaluation was confirmed
by the statistical analysis using the univariate ANOVA that analyzed the effect of the cavity

104
independent of the effect of the bonding agent and hereby confirmed the qualitative
shrinkage vector analysis of the displacement vector fields. The qualitative and quantitative
evaluations complement each other and are well supported by the SEM images.
Therefore, the specific displacement vector field for each restoration cannot be fully
predicted. However, the pieces of information gained through this study can be considered
when restoring a tooth defect. The detrimental fact about the polymerization shrinkage is the
generation of shrinkage stresses that lead to detachment of the composite restoration from
the tooth structure. Once debonding occurred, shrinkage is directed away from the detached
part. The critical question is how to manage the detachment at the cavity floor and how to
manage gap formation at the cavity margin. Taking into consideration that the experimental
resin composite, Tetric EvoFlow with added glass beads, is not recommended for application
in bulk, more investigations are needed with bulk-fill composites. The used composite was
fair enough for the evaluation procedure and bulk-fill composites were available only after
the start of the experiments. The composite was sufficiently cured even at a depth of 3 mm
(Lindberg et al., 2004).
Scientists need to reevaluate current restorative techniques and adapt them in the light of
these results. It was suggested that the filling technique and the composite type might have
a strong influence on the adhesion of composite, especially with high C-factor (Van Ende et
al., 2013). More information is needed on the traditional layering technique and its effect on
the direction of shrinkage vectors. Also, reducing the C-factor could help in preserving a
stable bond. In cavities with a high C-factor, oblique composite application could reduce the
C-factor, and perhaps lead to better marginal integrity. Finally, shrinkage vectors can give
answers to these questions.
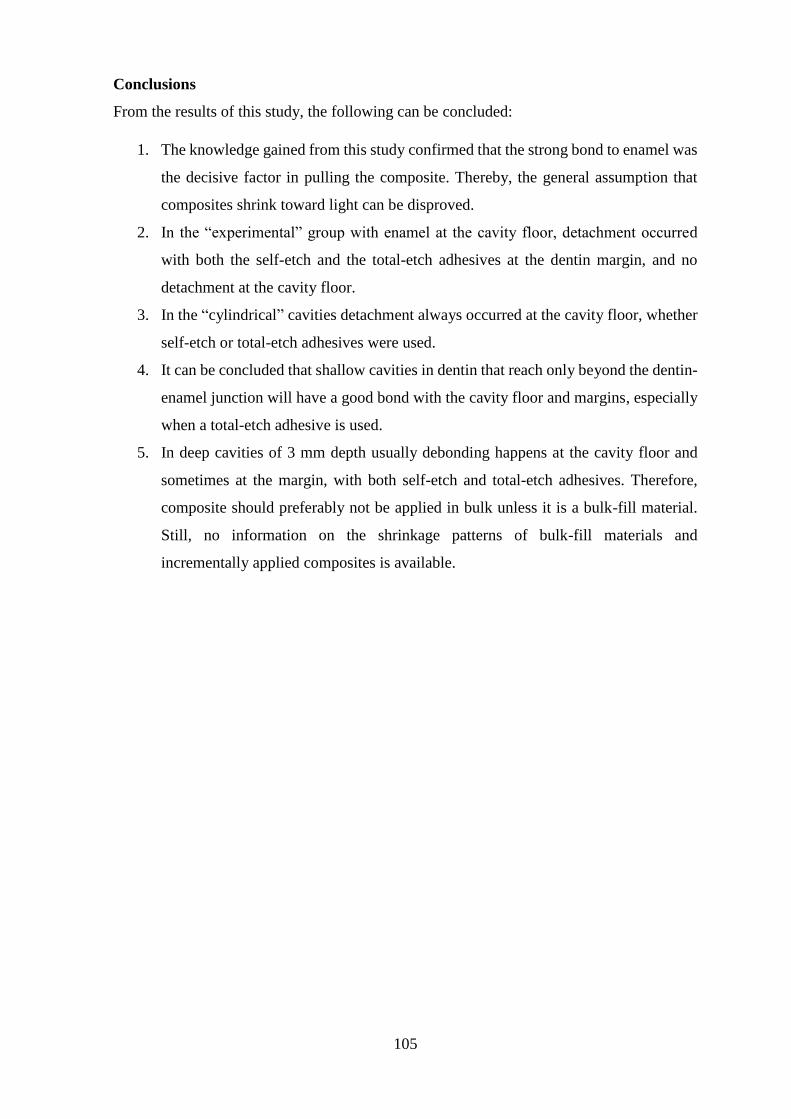
105
Conclusions
From the results of this study, the following can be concluded:
1. The knowledge gained from this study confirmed that the strong bond to enamel was
the decisive factor in pulling the composite. Thereby, the general assumption that
composites shrink toward light can be disproved.
2. In the “experimental” group with enamel at the cavity floor, detachment occurred
with both the self-etch and the total-etch adhesives at the dentin margin, and no
detachment at the cavity floor.
3. In the “cylindrical” cavities detachment always occurred at the cavity floor, whether
self-etch or total-etch adhesives were used.
4. It can be concluded that shallow cavities in dentin that reach only beyond the dentin-
enamel junction will have a good bond with the cavity floor and margins, especially
when a total-etch adhesive is used.
5. In deep cavities of 3 mm depth usually debonding happens at the cavity floor and
sometimes at the margin, with both self-etch and total-etch adhesives. Therefore,
composite should preferably not be applied in bulk unless it is a bulk-fill material.
Still, no information on the shrinkage patterns of bulk-fill materials and
incrementally applied composites is available.
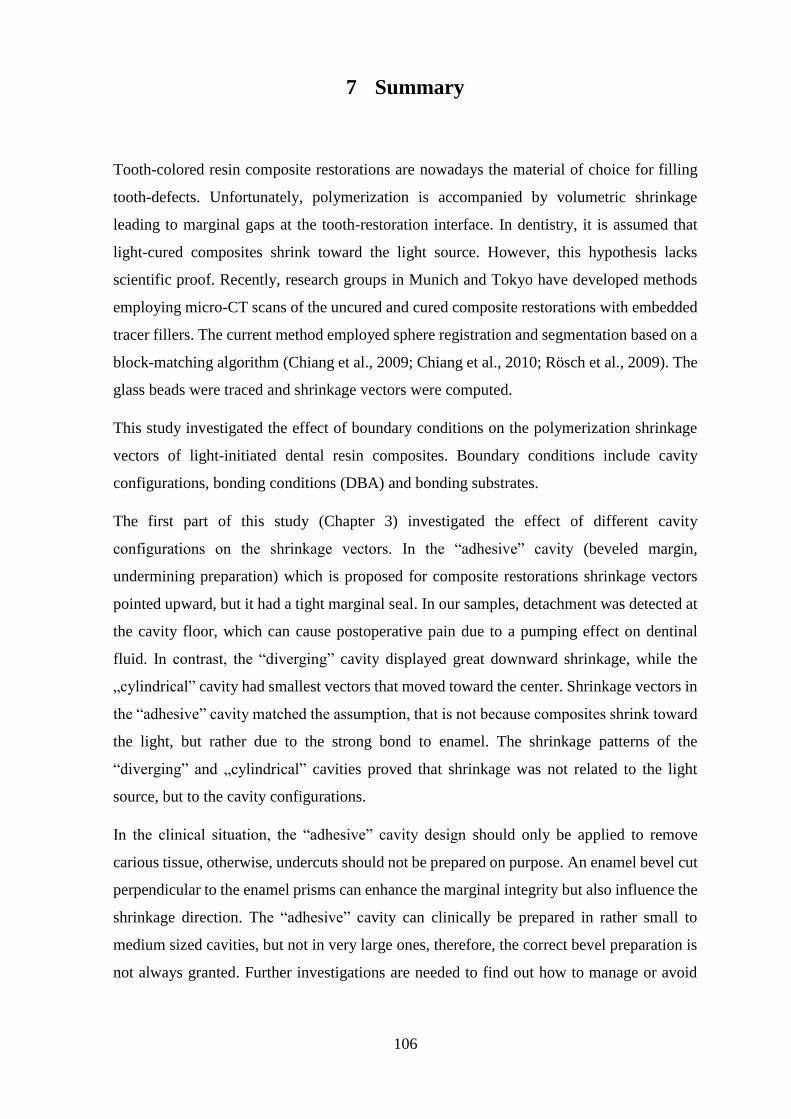
106
7 Summary
Tooth-colored resin composite restorations are nowadays the material of choice for filling
tooth-defects. Unfortunately, polymerization is accompanied by volumetric shrinkage
leading to marginal gaps at the tooth-restoration interface. In dentistry, it is assumed that
light-cured composites shrink toward the light source. However, this hypothesis lacks
scientific proof. Recently, research groups in Munich and Tokyo have developed methods
employing micro-CT scans of the uncured and cured composite restorations with embedded
tracer fillers. The current method employed sphere registration and segmentation based on a
block-matching algorithm (Chiang et al., 2009; Chiang et al., 2010; Rösch et al., 2009). The
glass beads were traced and shrinkage vectors were computed.
This study investigated the effect of boundary conditions on the polymerization shrinkage
vectors of light-initiated dental resin composites. Boundary conditions include cavity
configurations, bonding conditions (DBA) and bonding substrates.
The first part of this study (Chapter 3) investigated the effect of different cavity
configurations on the shrinkage vectors. In the “adhesive” cavity (beveled margin,
undermining preparation) which is proposed for composite restorations shrinkage vectors
pointed upward, but it had a tight marginal seal. In our samples, detachment was detected at
the cavity floor, which can cause postoperative pain due to a pumping effect on dentinal
fluid. In contrast, the “diverging” cavity displayed great downward shrinkage, while the
„cylindrical” cavity had smallest vectors that moved toward the center. Shrinkage vectors in
the “adhesive” cavity matched the assumption, that is not because composites shrink toward
the light, but rather due to the strong bond to enamel. The shrinkage patterns of the
“diverging” and „cylindrical” cavities proved that shrinkage was not related to the light
source, but to the cavity configurations.
In the clinical situation, the “adhesive” cavity design should only be applied to remove
carious tissue, otherwise, undercuts should not be prepared on purpose. An enamel bevel cut
perpendicular to the enamel prisms can enhance the marginal integrity but also influence the
shrinkage direction. The “adhesive” cavity can clinically be prepared in rather small to
medium sized cavities, but not in very large ones, therefore, the correct bevel preparation is
not always granted. Further investigations are needed to find out how to manage or avoid
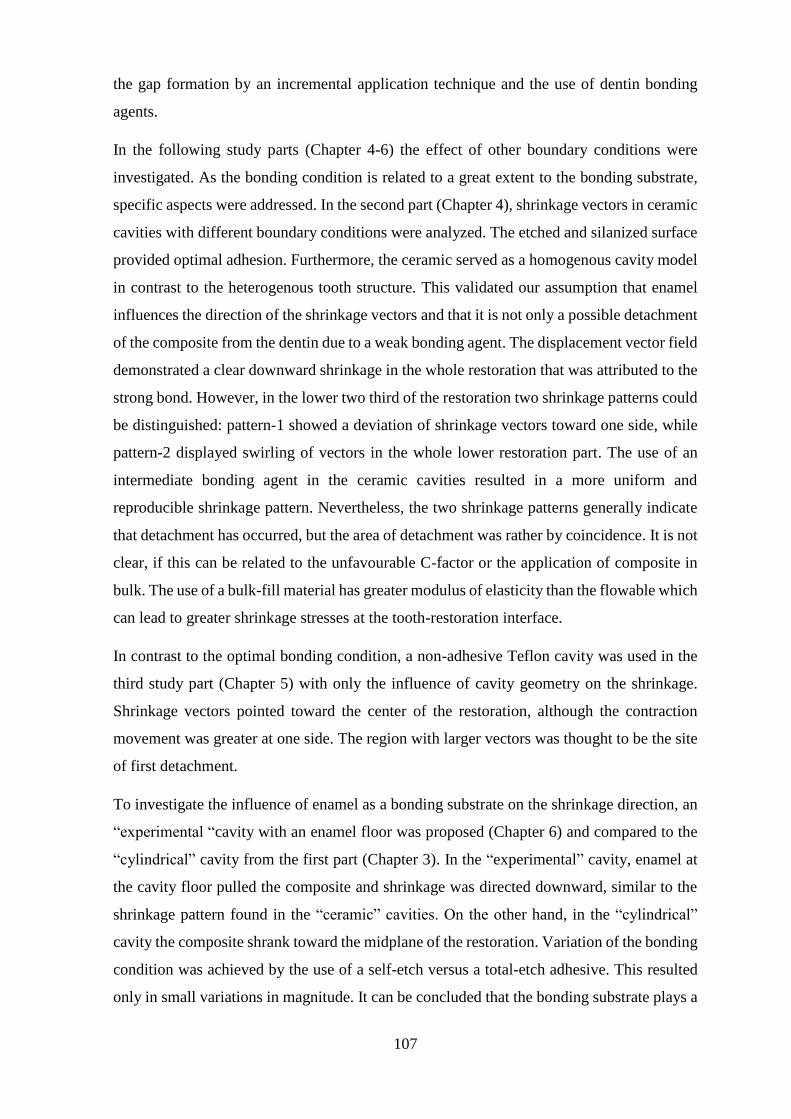
107
the gap formation by an incremental application technique and the use of dentin bonding
agents.
In the following study parts (Chapter 4-6) the effect of other boundary conditions were
investigated. As the bonding condition is related to a great extent to the bonding substrate,
specific aspects were addressed. In the second part (Chapter 4), shrinkage vectors in ceramic
cavities with different boundary conditions were analyzed. The etched and silanized surface
provided optimal adhesion. Furthermore, the ceramic served as a homogenous cavity model
in contrast to the heterogenous tooth structure. This validated our assumption that enamel
influences the direction of the shrinkage vectors and that it is not only a possible detachment
of the composite from the dentin due to a weak bonding agent. The displacement vector field
demonstrated a clear downward shrinkage in the whole restoration that was attributed to the
strong bond. However, in the lower two third of the restoration two shrinkage patterns could
be distinguished: pattern-1 showed a deviation of shrinkage vectors toward one side, while
pattern-2 displayed swirling of vectors in the whole lower restoration part. The use of an
intermediate bonding agent in the ceramic cavities resulted in a more uniform and
reproducible shrinkage pattern. Nevertheless, the two shrinkage patterns generally indicate
that detachment has occurred, but the area of detachment was rather by coincidence. It is not
clear, if this can be related to the unfavourable C-factor or the application of composite in
bulk. The use of a bulk-fill material has greater modulus of elasticity than the flowable which
can lead to greater shrinkage stresses at the tooth-restoration interface.
In contrast to the optimal bonding condition, a non-adhesive Teflon cavity was used in the
third study part (Chapter 5) with only the influence of cavity geometry on the shrinkage.
Shrinkage vectors pointed toward the center of the restoration, although the contraction
movement was greater at one side. The region with larger vectors was thought to be the site
of first detachment.
To investigate the influence of enamel as a bonding substrate on the shrinkage direction, an
“experimental “cavity with an enamel floor was proposed (Chapter 6) and compared to the
“cylindrical” cavity from the first part (Chapter 3). In the “experimental” cavity, enamel at
the cavity floor pulled the composite and shrinkage was directed downward, similar to the
shrinkage pattern found in the “ceramic” cavities. On the other hand, in the “cylindrical”
cavity the composite shrank toward the midplane of the restoration. Variation of the bonding
condition was achieved by the use of a self-etch versus a total-etch adhesive. This resulted
only in small variations in magnitude. It can be concluded that the bonding substrate plays a

108
major role in determining the shrinkage direction, while the bonding condition plays a minor
role. Nevertheless, the bonding condition depends on the bonding substrate to a great degree.
Although the basic investigations of Chapter 4-6 cannot be applied in the clinical situation,
they were important to identify each factor’s role with regard to the polymerization shrinkage
direction. More studies are needed to investigate the effect of the C-factor on the shrinkage
direction, as well as analyzing shrinkage patterns in incrementally applied and bulk-fill
composite restorations. Additionally, more realistic cavity designs instead of cylindrical
class I cavities need to be prepared, as well as class II cavities. More investigations are
needed on the effect of the curing-light source on the shrinkage vectors.
Finally, the results of this study enable researchers to understand some factors affecting
polymerization shrinkage and utilize this knowledge to reevaluate current application
techniques and to suggest adjustments for common drawbacks. For these reasons, every
patient receiving a composite restoration will benefit from this research.

109
Conclusions
Within the limitations of the current study, the following can be concluded regarding the
effect of the boundary conditions on the polymerization shrinkage vectors of light-cured
dental resin composites:
1. The shrinkage amount and direction varied according to the cavity configuration,
with greatest shrinkage vectors in the “adhesive” cavity, followed by the “diverging”
and it was least in the “cylindrical”.
2. The “adhesive” versus the “cylindrical” cavity showed that the cavity margin
influenced the shrinkage direction and the gap formation.
3. In the ceramic model the dentin bonding agent acted as a stress breaker that allowed
for more movement, therefore, the mechanical properties of bonding agents are
important as the influence the polymerization shrinkage direction.
4. In the Teflon group shrinkage in lateral direction was greater at one side, which is
possibly the site of least resistance to adaptation and first detachment due to
shrinkage.
5. The knowledge gained from the study with the “experimental” and “cylindrical”
cavities confirmed that the boundary conditions influenced the shrinkage direction
of light-cured dental resin composites.
6. The claim that composites shrink toward the light source is disproved.
Recommendations for future research
1. Further studies are needed to evaluate different types of self-etch and total-etch
adhesives and investigate the relation between bond strength values and the
shrinkage direction.
2. More clinically relevant cavity designs are also needed to relate to the clinical
situation such as the classical cross-shaped occlusal cavity, MO/MOD-cavities,
cervical cavities and others.
3. Moreover, more types of restorative materials should be investigated to explore the
shrinkage patterns in incrementally applied and bulk-fill composites, in order to give
insight into more clinically relevant information.
110
8 Zusammenfassung
Kompositfüllungen werden heutzutage routinemäßig gelegt, um Zahndefekte zu beheben.
Der große Nachteil der Kompositfüllungen ist deren Schrumpfung, welche zum Randspalt
führen kann. In der Zahnmedizin wird angenommen, dass lichthärtende Komposite zur
Lichtquelle hin schrumpfen, wobei es für diese Hypothese aber keinen wissenschaftlichen
Beweis gibt. Erst in den letzten Jahren ist es Forschungsgruppen aus Tokio und München
gelungen, eine Methode zu entwickeln, die Micro-CT-scans von ungehärtetem und
lichtgehärtetem Komposit mit eingebetteten Glasfüllkörpern verwenden, um
Schrumpfungsvektoren darzustellen. Die in der vorliegenden Studie angewendete Methode
basiert auf der Sphärenregistrierung und –segmentierung durch einen Block-matching
Algorithmus (Chiang et al., 2009; Chiang et al., 2010; Rösch et al., 2009). Die Füllkörper
wurden in beiden Scans verfolgt und die Schrumpfungsvektoren berechnet und graphisch
dargestellt.
Diese Studie untersuchte den Einfluss der Rahmenbedingungen auf die
Schrumpfungsvektoren in lichthärtenden dentalen Kompositen. Die Rahmenbedingungen
beinhalten die Kavitätskonfigurationen, Haftungsbedingungen und Haftsubstanzen.
Im ersten Teil dieser Studie (Kapitel 3) wurde der Einfluss der Kavitätskonfigurationen auf
die Schrumpfungsvektoren untersucht. In der „adhäsiven“ Kavität, die für adhäsive
Füllungen indiziert ist, haben die Vektoren nach oben, in Richtung der Lichtquelle gezeigt.
Im Gegensatz dazu, zeigten die Schrumpfungsvektoren der „divergierenden“ Kavität nach
unten, wobei sie in der „zylindrischen“ Kavität insgesamt am kleinsten waren und zur Mitte
zeigten. Die Vektoren der „adhäsiven“ Kavität bestätigten die Annahme; dabei geschah dies
nicht, weil Komposit zur Lichtquelle hin schrumpft, sondern wegen seiner starken Haftung
am Schmelz. Die Schrumpfungsmuster der „divergierenden“ und „zylindrischen“ Kavitäten
bewiesen, dass die Schrumpfung nicht von der Lichtquelle abhängig war, sondern von der
Kavitätskonfiguration. In der Praxis sollte die „adhäsive“ Kavität nur präpariert werden, um
kariöse Zahnsubstanz zu entfernen, aber Unterschnitte sollten nicht absichtlich präpariert
werden. Eine Schmelzanschrägung sollte senkrecht auf die Schmelzprismen erfolgen, um
die Randintegrität zu fördern, die jedoch auch die Schrumpfungsrichtung beeinflussen.
In den übrigen Abschnitten (Kapitel 4-6) wurden die Einflüsse der weiteren
Rahmenbedingungen untersucht. Da die Haftungsbedingungen zum großen Teil von den

111
Haftsubstanzen abhängen, wurden bestimmte Aspekte untersucht. Im zweiten Teil (Kapitel
4) wurden die Schrumpfungsvektoren in Keramikkavitäten mit unterschiedlichen
Rahmenbedingungen untersucht. Die geätzte und silanisierte Keramikoberfläche stellte
optimale Haftungsbedingungen dar. Außerdem funktionierte die Keramik als homogenes
Material für das Kavitätenmodell im Gegensatz zum heterogenen natürlichen Zahn. Das
Vektorenfeld zeigte eine klare Schrumpfung nach unten, die der starken Haftung zu Grunde
lag. Andererseits konnten zwei unterschiedliche Schrumpfungsmuster im unteren Teil der
Füllung erkannt werden: in Muster-1 schrumpften die Vektoren zu einer Seite hin, wobei sie
in Muster-2 quer durcheinanderwirbelten. Die Anwendung eines Dentinadhäsivs führte zu
einem ebenmäßigeren Erscheinungsbild der Vektoren.
Im dritten Teil der vorliegenden Arbeit (Kapitel 5) wurde nun im Kontrast zur optimalen
Haftung eine nicht-haftende Teflon-Kavität verarbeitet. Die Schrumpfungsvektoren zeigten
zur Mitte der Füllung, auch wenn die Vektoren auf der einen Seite grösser waren. Dies
scheint der Bereich zu sein, von dem sich das Material als erstes von der Wand ablöst.
Wie stark beeinflusst der Schmelz als Haftsubstanz die Schrumpfungsrichtung? Um dies
herauszufinden, wurde eine Kavität mit einem Schmelzboden improvisiert (Kapitel 6) und
mit der „zylindrischen“ Kavität verglichen (Kapitel 3). In der improvisierten Kavität hat der
Schmelz das Komposit nach unten gezogen, ähnlich wie bei der Keramikkavität.
Andererseits schrumpfte das Komposit in der „zylindrischen“ Kavität zur Mitte der
Restauration.
Variationen der Haftbedingungen wurden durch die Anwendung von einem Self-etch- und
einem Total-etch-Adhäsivs erzielt. Dies führte nur zu kleinen Unterschieden in der Länge
der Vektoren, beeinflusste aber nicht die Schrumpfungsrichtung. Daraus kann man
schließen, dass die Haftsubstanz eine große Rolle bezüglich der Schrumpfungsrichtung
spielt, die Haftungsbedingungen jedoch nur eine kleine, wobei diese jedoch weitgehend vom
Haftungssubstrat abhängig sind.
Obwohl die Untersuchungen aus den vorherigen Kapiteln 4-6 nicht in der Praxis angewendet
werden können, waren sie wichtig, um zu erkennen, welche Rolle jeder Faktor bezüglich der
Schrumpfungsrichtung spielt. Es werden noch weitere Studien benötigt, um sowohl den
Einfluss des C-Faktors zu untersuchen, als auch die Schrumpfungsmuster in schichtgelegten
Füllungen und in Bulk-fill-Kompositen. Zusätzlich dazu müssten realistischere
Kavitätsformen und Klasse II Kavitäten untersucht werden anstelle der hier untersuchten

112
zylindrischen Klasse I Kavitäten. Außerdem könnte der Einfluss der Lichtquelle auf die
Schrumpfungsrichtung noch erforscht werden.
Somit führen die Ergebnisse dieser Studie zum Verständnis einiger Faktoren, welche die
Schrumpfung beeinflussen. Dieses Wissen kann wiederum angewendet werden, um gängige
Anwendungsmethoden zu beurteilen und Verbesserungen vorzuschlagen. Aus diesen
Gründen profitiert jeder Patient, der eine Kompositfüllung erhält, von dieser
Forschungsarbeit.

113
5 List of tables
Table 1 Classification of composites according to the functional group determining their
cure (Kunzelmann, 2008) ...................................................................................................... 3
Table 2 Kunzelmann’s classification of composites according to filler system (Kunzelmann,
2008) ...................................................................................................................................... 4
Table 3 Traditional classification of resin composites (Sakaguchi and Powers, 2012) ........ 5
Table 4 Composition of the experimental resin composite and the self-etch adhesive ....... 39
Table 5 Mean vector length values and mean filler movement in the z-direction in the
different cavity configurations............................................................................................. 46
Table 6 Composition of the ceramic block, hydrofluoric acid, silane coupling agent and the
total-etch adhesive ............................................................................................................... 64
Table 7 Mean vector length values and mean filler movement in the z-direction of the
“ceramic+HF+silane” and “ceramic+HF+silane+DBA” groups ........................................ 69
Table 8 Mean vector length values and mean filler movement in the z-direction of the
“Teflon” group ..................................................................................................................... 81
Table 9 Mean vector length values and mean filler movement in the z-direction of the in the
4 study groups ...................................................................................................................... 97

114
6 List of figures
Figure 1 The chemical structure of Bis-GMA (A), UDMA (B), TEGDMA (C) and Bis-
EMA6 (D). ............................................................................................................................. 2
Figure 2 The silane coupling agent........................................................................................ 6
Figure 3 Failures that may occur after application of a composite restoration, modified after
Tantbirojn et al., 2004 (Tantbirojn et al., 2004) .................................................................... 8
Figure 4 stress-strain analyzer machine designed by Dullin, modified after Chen et al., 2001
(Chen et al., 2001; Chen et al., 2003; Dullin, 1998). ........................................................... 10
Figure 5 The Bioman shrinkage-stress instrument, modified after Watts et al., 2003 (Watts
et al., 2003). ......................................................................................................................... 11
Figure 6 Overview of the methods for measuring the polymerization shrinkage strain. .... 13
Figure 7 Measurement of the linear polymerization shrinkage of a composite cylinder. ... 15
Figure 8 The bonded-disc method for measurement of the linear polymerization shrinkage,
also referred to as “Watts method”, modified after Watts and Cash, 1991 (Watts and Cash,
1991). ................................................................................................................................... 16
Figure 9 Linometer for the measurement of linear polymerization shrinkage, modified after
de Gee et al., 1993 (de Gee et al., 1993).............................................................................. 17
Figure 10 The image processing of the 2D shrinkage vector evaluation: (A) the original
source image of the uncured resin composite with the deformation grid. (B) The
displacement field obtained from the elastic registration is superimposed to the output
source-target image of the registered target image. The vector field displays the deformation
due to the mass movement of the polymerization shrinkage and the dotted line marks the
deformed shape after light-curing of the composite (Chiang et al., 2009). Reuse of the images
is with written permission by Dr Yu-Chih Chiang (2014). ................................................. 23
Figure 11 The 3D deformation field by Chiang et al., 2009 (Chiang et al., 2009). Reuse of
the images is with written permission by Dr Yu-Chih Chiang (2014). ............................... 24
Figure 12 The 3D image obtained by superimposing micro-CT scans from the composite
before and after polymerization. The three slices are representative of the 165 slices that
were analyzed for the filler movement in the axial direction by Cho et al., 2011 (Cho et al.,
2011). ................................................................................................................................... 25
Figure 13 The 3D vector field image represents the filler movement direction in the bonded
group by Cho et al., 2011 (Cho et al., 2011). ...................................................................... 26

115
Figure 14 The investigations of the current study were based on the boundary conditions
which include the cavity configuration, the bonding condition and the bonding substrate. 29
Figure 15 Overview of the different study parts. ................................................................ 29
Figure 16 The high resolution micro-computed tomography, µCT 40, Scanco Medical AG,
Switzerland, was used for the 3D scanning procedure of the restorations. ......................... 35
Figure 17 The prepared and filled tooth in the sample holder in the micro-CT (A), covered
with a radiolucent and dark cap to avoid premature polymerization during the first scan (B).
Light curing (20 s) of the composite was performed while the sample remained in the micro-
CT machine (C). .................................................................................................................. 35
Figure 18 Scheme of the workflow for obtaining the digital 3D-data sets from the micro-CT.
............................................................................................................................................. 36
Figure 19 Sphere segmentation and sphere registration based on a block-matching algorithm.
Sphere segmentation: set of all identified and extracted glass fillers in a same sample from
the “adhesive” group (A), Sphere registration: both scans of one sample (here: "adhesive
group") were superimposed. The identified glass fillers in the first scan were simply
radiolucent and colorless while the corresponding glass fillers from the second scan were
superimposed and color coded (B). Sphere registration was performed based on a block-
matching algorithm to determine the displacement of the segmented spheres due to
polymerization shrinkage. ................................................................................................... 40
Figure 20 The displacement vector field of the "adhesive" restoration, with the x-plane (A)
and the z-plane (B) of the micro-CT scan in the background. Glyphs were scaled by a factor
of 5 to enhance visibility. Large shrinkage vectors are seen at the lower restoration part
pointing upwards. ................................................................................................................ 42
Figure 21 SEM image (x200) of the “adhesive” restoration showing an intact bond at the
enamel margin (A) and a defective bond “defect” at the floor of the restoration (B). One
traceable glass filler is marked by the star *. ....................................................................... 42
Figure 22 The displacement vector field of the “diverging” restoration, with the x-plane (A)
and z-plane (B) of the micro-CT scan in the background. Glyphs were scaled by a factor of
5 to enhance visibility. Large shrinkage vectors point downward near the free surface, and
small shrinkage vectors point upward from the restoration floor. ....................................... 43
Figure 23 SEM image (x200) of the “diverging" restoration, displaying a defective bond at
the enamel margin (A) and an intact bond at the floor of the restoration (B). One traceable
glass filler is marked by the star *. ...................................................................................... 43
Figure 24 The displacement vector field in the “cylindrical” group with a predominant
shrinkage pattern with the x-plane (A) and z-plane (B) of the micro-CT scan in the

116
background showed more vectors in the lower part, while the atypical shrinkage pattern in
the “cylindrical” cavity additionally displayed large vectors in the upper restoration part. The
x-plane (C) and z-plane (D) of the micro-CT scan displayed in the background. Glyphs were
scaled by a factor of 5 to enhance visibility. ....................................................................... 44
Figure 25 SEM image (x200) of the “cylindrical” restoration showing an intact bond at the
enamel margin at one side (A) and a defective bond at the floor of the restoration (B). One
traceable glass filler is marked by the star *. ....................................................................... 45
Figure 26 The probability density function of the vector lengths in the “adhesive”,
“diverging” and “cylindrical” groups. The “adhesive” group had two maxima above 25 µm
and a large vectors were more numerous than in the other groups. The “diverging” group
had its maximum at about 25 µm which means that the majority of vectors were in that range.
The “cylindrical” group had its peak at about 15 µm which means that the greatest frequency
of vectors had that value. ..................................................................................................... 47
Figure 27 The probability density function of the filler movements in the z-direction in the
“adhesive”, “diverging” and “cylindrical” groups. The “adhesive” group showed many
peaks which related to the presence of many vectors of that value. The curve is shifted in the
negative range that relates to the upward shrinkage movement at the cavity floor. The
“diverging” group had a shallower curve with two maxima; the first is in the range of -20
µm that relates to the upward shrinkage at the cavity floor, while the second maximum is
located at about 15 µm which can be related to the downward shrinkage seen at the free
surface. The curve of the “cylindrical” cavity also has two peaks, but they are close to each
other near the zero value. The first peak can be attributed to the upward movement at the
lower cavity part and the second peak is related to the downward movement at the free
surface. ................................................................................................................................. 49
Figure 28 Possible shrinkage directions in the “diverging” cavity configuration: (A) upward
shrinkage as composite at the free surface hardens first and pulls the composite upwards as
soon as the adhesive bond interface to the tooth is disrupted, or (B) downward shrinkage of
the free surface..................................................................................................................... 51
Figure 29 The shrinkage of a floating specimen having no contact with any surface exhibits
“free shrinkage” (A), but a specimen in contact with a surface shrinks towards it (B). ..... 52
Figure 30 The light source in relation to the “adhesive” (A), “diverging” (B) and
“cylindrical” (C) cavity configurations. In the “adhesive” cavity, light did not directly reach
the resin composite below the enamel margin. In the “diverging” and “cylindrical” cavities,
there was no configurational impedance to the curing-light. .............................................. 54
117
Figure 31 The light focus of Elipar FreeLight2, 3M ESPE, in relation to the “cylindrical”
cavity. .................................................................................................................................. 55
Figure 32 Cusp tips were flattened to allow for light-curing as close as possible to the
restoration. Cavity margins were mostly located in enamel. ............................................... 57
Figure 33 The ceramic block (A) was cut into three slices into which a cylindrical cavity was
prepared. The outer margin was trimmed to fit into the micro-CT sample holder and flowable
composite was added as a reference landmark for the rigid registration (B). ..................... 63
Figure 34 Schematic drawing of the ceramic model. .......................................................... 63
Figure 35 The displacement vector field in the “ceramic+HF+silane” group with “Shrinkage
Pattern-1”: downward shrinkage at the upper part of the restoration and deviation of the
shrinkage vectors toward one side at the lower part, with the y-plane (A) and the z-plane (B)
of the micro-CT scan in the background. Glyphs were scaled by a factor of 5 to enhance
visibility. .............................................................................................................................. 66
Figure 36 The displacement vector field in the “ceramic+HF+silane” group exhibited
“Shrinkage Pattern-2”: downward shrinkage in the upper part of the restoration, while the
lower part exhibited horizontal swirling, with the y-plane (A) and the z-plane (B) of the
micro-CT scan in the background. Glyphs were scaled by a factor of 5 to enhance visibility.
............................................................................................................................................. 67
Figure 37 SEM images (x200) of the “ceramic+HF+silane” group of the restoration margin
(A) and the floor (B) showing close adaptation. One traceable glass filler is marked by the
star *. ................................................................................................................................... 67
Figure 38 The displacement vector field in the “ceramic+HF+silane+DBA” group with
downward shrinkage at the upper part of the restoration and deviation of the shrinkage
vectors toward one side at the lower part, same as “Shrinkage Pattern-1” in the
“ceramic+HF+silane” group, with the y-plane (A) and the z-plane (B) of the micro-CT scan
in the background. Glyphs were scaled by a factor of 5 to enhance visibility. ................... 68
Figure 39 SEM images (x200) of the “ceramic+HF+silane+DBA” group of the restoration
margin (A) and floor (B) showing close adaptation. One traceable glass filler is marked by
the star *. ............................................................................................................................. 68
Figure 40 The probability density function of the vector lengths in the groups
“ceramic+HF+silane” and “ceramic+HF+silane+DBA” shows the frequency of vector
length values in the groups. In the “ceramic+HF+silane” group the maximum was located at
about 20 µm which can be related to the smaller vectors located majorly in the lower part of
the restoration and near the cavity walls. Yet, a considerable amount of vectors was in the
range below 50 µm which can be associated with the larger vectors directing downwards in

118
the upper part of the cavity. In the “ceramic+HF+silane+DBA” group the distribution of
vector lengths values was over a larger range than in the first group. The first maximum at
20 µm could be related to small vectors of the lower third of the restoration near the cavity
floor. The second maximum had most vectors at about 45 µm that were attributed to the
large downward movement at the free surface. ................................................................... 70
Figure 41 The probability density function of the filler movements in the z-direction in the
groups “ceramic+HF+Silane” and “ceramic+HF+Silane+DBA” displays the frequency of
the axial filler movement values in the groups. In the “ceramic+HF+Silane” group the
maximum was located at about -10 µm which means that the greatest frequency of axial
filler movement was very small and denotes upward movement. The overall quantity of axial
filler movement was in the positive range which stands for downward movement. The
“ceramic+HF+silane+DBA” group displays a maximum at about 13 µm that represents a
greater axial downward movement than in the “ceramic+HF+silane” group. Both curves
look similar to the previous group, but the “ceramic+HF+silane+DBA” group was shifted to
the right into the positive range that stands for greater downward movement. ................... 71
Figure 42 The Teflon cylinder serving as a cavity model. Flowable composite was applied
to the outer contour simulating enamel in order to serve as a reference point for the rigid
registration. .......................................................................................................................... 79
Figure 43 Schematic drawing of the Teflon model. ............................................................ 79
Figure 44 The displacement vector field in a non-adhesive “Teflon” cavity with the x-plane
of the micro-CT scan in the background with two different views (A) and (B). Glyphs were
scaled by a factor of 5 to enhance visibility. Polymerization shrinkage vectors pointed to the
center, with lateral movement greater at one side denoting the site of first detachment from
the cavity walls. ................................................................................................................... 80
Figure 45 The probability density function of the vector lengths in the “Teflon” group shows
a multimodal distribution of the values. The first peak relates to the very small vectors that
can be found close to the center of the restoration, the second peak can be linked to the small
vectors at the restoration side with less movement, while the third peak stands for the main
quantity of shrinkage vectors in the “Teflon” group that are directed towards the center of
the restoration. ..................................................................................................................... 81
Figure 46 The probability density function of the filler movements in the z-direction in the
“Teflon” group shows a multimodal distribution with 4 peaks (grey color). The areas below
the separate peaks are joined into one area (pink color). The first and second peaks conform
to upward shrinkage movement that was found at the cavity floor and the lower restoration
part. The third peak constitutes the large quantity of small axial movement with slight
119
downward shrinkage which can be related to the middle part of the restoration where the
glass beads moved mainly in horizontal direction toward the restoration center. The last peak
can be linked to the downward movement of glass beads at the free surface of the restoration.
............................................................................................................................................. 82
Figure 47 The experimental composite was placed on a Teflon disc and exhibited the “free
shrinkage” and light was applied from above. Shrinkage vectors pointed toward the center
of the composite and the y-plane (A) and z-plane (B) of the micro-CT scan were seen in the
background. The composite in contact with the Teflon disc displayed almost no shrinkage
vectors. Glyphs were scaled by a factor of 5 to enhance visibility. .................................... 85
Figure 48 Schematic drawing of composite before (A) and after (B) light-curing on the
Teflon disc. A completely smooth surface would even allow for shrinkage movement on the
Teflon disc surface toward the center. ................................................................................. 86
Figure 49 Diagrammatic presentation of the “experimental” cavity with enamel at the cavity
floor and dentin margins to study the effect of the bonding substrate on the shrinkage
direction (A) and the “cylindrical” cavity that represents a cylindrical class I cavity (B). . 92
Figure 50 The displacement vector field of the “experimental-self-etch” cavity, with the x-
plane (A) and the z-plane (B) of the micro-CT scan in the background. Glyphs were scaled
by a factor of 5 to enhance visibility. Large shrinkage vectors were detected in the upper
restoration part and small vectors pointed away from cavity walls. ................................... 94
Figure 51 SEM images (x200) of the “experimental-self-etch” group with a defective dentin
margin (A) and an intact bond at the enamel floor (B). One traceable glass filler is marked
by the star *. ........................................................................................................................ 94
Figure 52 The displacement vector field of the “experimental-total-etch” cavity with the x-
plane (A) and the z-plane (B) of the micro-CT scan in the background. It showed downward
shrinkage at the upper part of the restoration and deviation of the shrinkage vectors toward
one side; at the lower part (quarter) small vectors pointed upward. Glyphs were scaled by a
factor of 5 to enhance visibility. .......................................................................................... 95
Figure 53 SEM images (x200) of the “experimental-total-etch” group with both an intact
dentin margin (A) and an intact bond at the enamel floor (B). One traceable glass filler is
marked by the star *............................................................................................................. 95
Figure 54 The displacement vector field of the “cylindrical-total-etch” cavity, with the x-
plane (A) and the z-plane (B) of the micro-CT scan in the background. Glyphs were scaled
by a factor of 5 to enhance visibility. Downward shrinkage at the upper restoration part and
smaller shrinkage upward pointing upward at the cavity floor. .......................................... 96

120
Figure 55 SEM images (x200) of the “cylindrical-total-etch” cavity displaying an intact bond
at the enamel margin (A), while the bond with the dentin floor was defective (B). One
traceable glass filler is marked by the star *. ....................................................................... 96
Figure 56 The probability density function of the vector lengths in the four groups. The peaks
of the vector length values of all groups are located in the range below 30 µm. The
“experimental-total-etch” (lila) and the “cylindrical-self-etch” (orange) groups have a
similar curve with greatest frequency of vectors at about 20 µm. The “cylindrical-total-etch”
(green) has its peak at a lower level, but with more vectors and larger vector length values.
The “experimental-self-etch” (turquoise) has the peak at about 15 µm and large vectors also
in a similar distribution as in the other groups. ................................................................... 98
Figure 57 The probability density function of the filler movements in the z-direction in the
four groups. 3 Groups have a multimodal distribution of the axial filler movement values.
The “experimental-self-etch” group (turquoise) has the first peak in the negative range of
small movements related to upward shrinkage found at the cavity floor, while the second
peak is located in the positive range that can be attributed to the downward shrinkage of the
free surface. The “experimental-total-etch” group (lila) has only one peak that is located in
the negative range at about -15 µm which relates to the upward shrinkage; yet, another large
portion of the values are in the positive range that conforms to the downward movement of
the free restoration surface. In the “cylindrical-self-etch” group (orange) the two peaks are
situated in the negative range denoting upward shrinkage. In the “cylindrical-total-etch”
group (green) one peak was located in the negative values but the majority of vectors are in
the positive range which indicate downward shrinkage. ................................................... 100
Figure 58 Tetric EvoFlow, Ivoclar Vivadent..................................................................... 121
Figure 59 Radiolucent glass fillers, Sigmund Lindner ...................................................... 121
Figure 60 Adper Easy Bond, 3M ESPE ............................................................................ 121
Figure 61 OptiBond FL, Kerr ............................................................................................ 121
Figure 62 VITA CERAMICS ETCH; VITA ..................................................................... 121
Figure 63 ESPE Sil, 3M ESPE .......................................................................................... 121
Figure 64 Elipar FreeLight2, 3M ESPE ............................................................................ 122
Figure 65 Electronic scale (Sartorius research, Germany) ................................................ 122
Figure 66 Scanning electron microscope ZEISS GEMINI® FESEM, SUPRA™ 55VP, Carl
Zeiss SMT AG, Oberkochen, Germany ............................................................................ 123
Figure 67 Slow speed water-cooled diamond saw Isomet, Beuhler, Illinois, USA .......... 123
Figure 68 Polishing machine Leco VP 100, GmbH, Neuss, Germany ............................. 123

121
7 Annex
7.1 Materials and equipments
Figure 58 Tetric EvoFlow, Ivoclar
Vivadent
Figure 59 Radiolucent glass fillers,
Sigmund Lindner
Figure 60 Adper Easy Bond, 3M ESPE
Figure 61 OptiBond FL, Kerr
Figure 62 VITA CERAMICS ETCH;
VITA
Figure 63 ESPE Sil, 3M ESPE

122
Figure 64 Elipar FreeLight2, 3M ESPE
Figure 65 Electronic scale (Sartorius research, Germany)
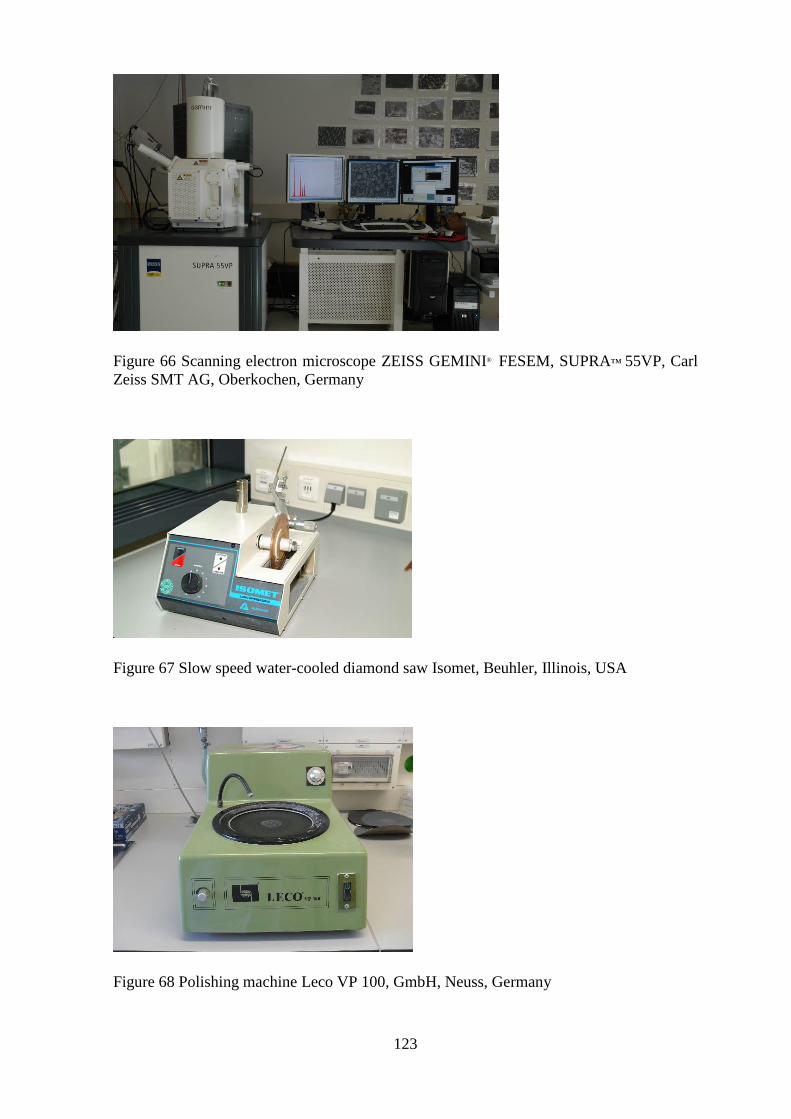
123
Figure 66 Scanning electron microscope ZEISS GEMINI® FESEM, SUPRA™ 55VP, Carl
Zeiss SMT AG, Oberkochen, Germany
Figure 67 Slow speed water-cooled diamond saw Isomet, Beuhler, Illinois, USA
Figure 68 Polishing machine Leco VP 100, GmbH, Neuss, Germany
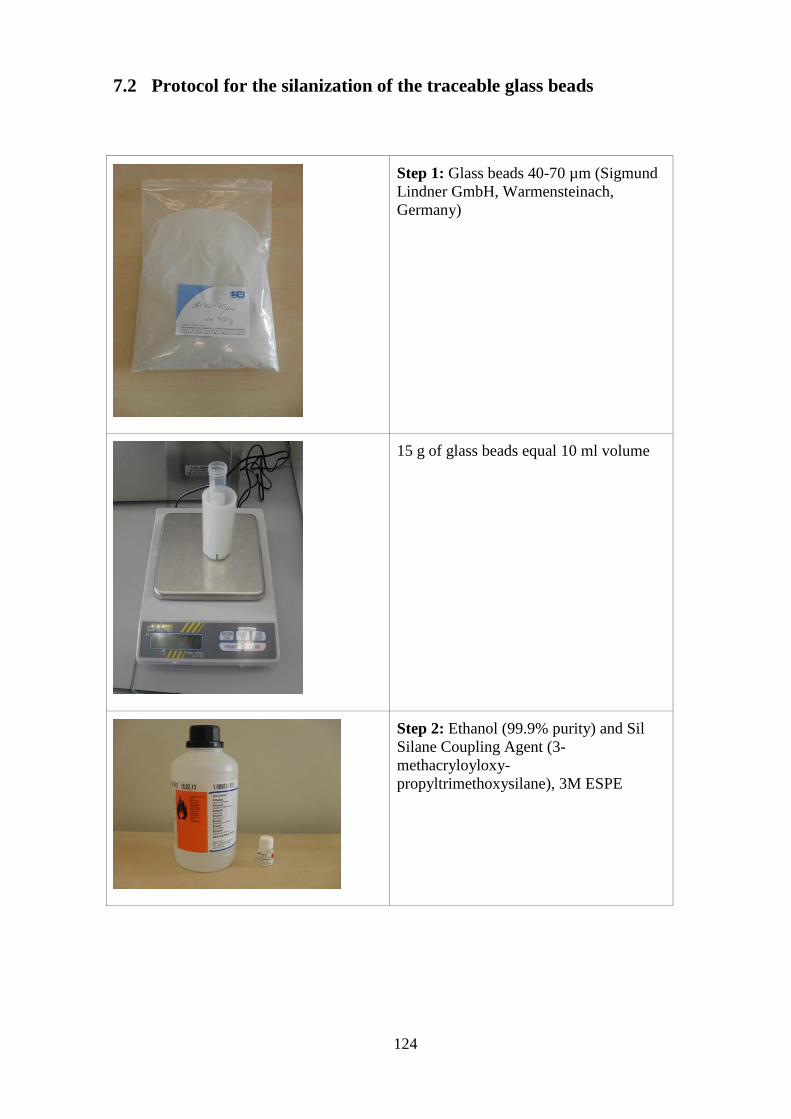
124
7.2 Protocol for the silanization of the traceable glass beads
Step 1: Glass beads 40-70 µm (Sigmund
Lindner GmbH, Warmensteinach,
Germany)
15 g of glass beads equal 10 ml volume
Step 2: Ethanol (99.9% purity) and Sil
Silane Coupling Agent (3-
methacryloyloxy-
propyltrimethoxysilane), 3M ESPE
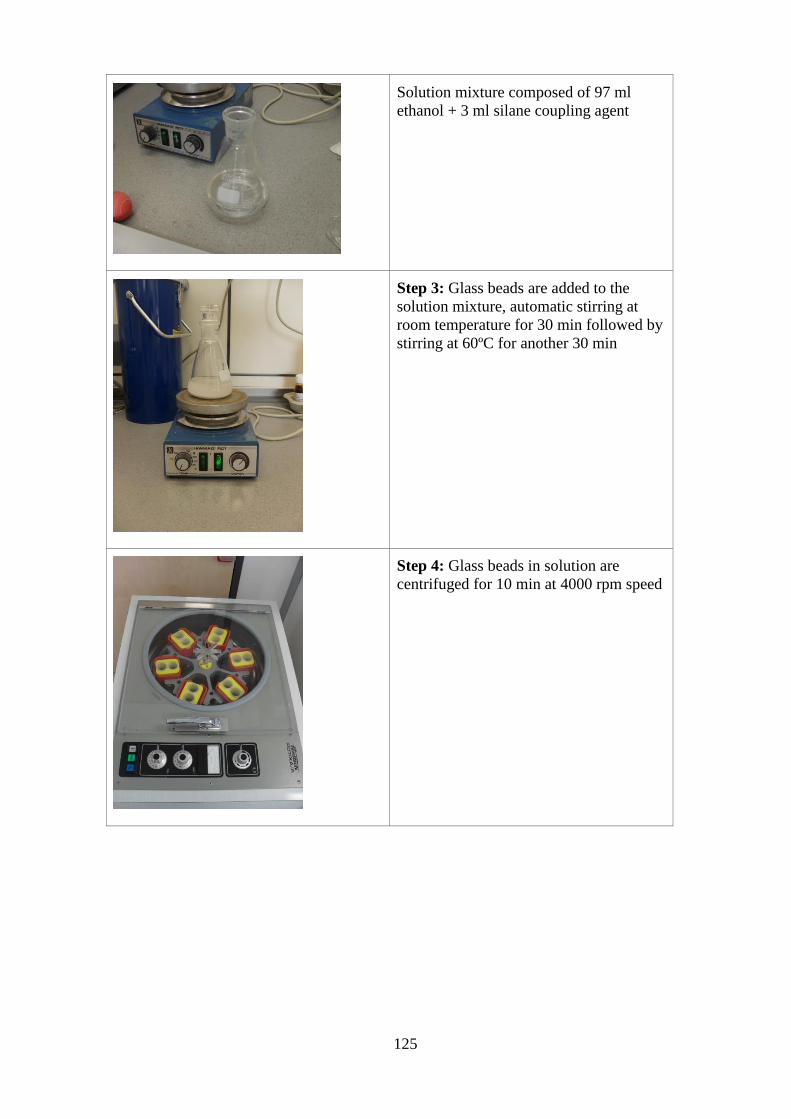
125
Solution mixture composed of 97 ml
ethanol + 3 ml silane coupling agent
Step 3: Glass beads are added to the
solution mixture, automatic stirring at
room temperature for 30 min followed by
stirring at 60ºC for another 30 min
Step 4: Glass beads in solution are
centrifuged for 10 min at 4000 rpm speed

126
Step 5: Silanized glass beads are washed
by acetone (20 ml) three times
Step 6: Silanized glass beads are left to
dry overnight
Step 7: Dry powder of silanized glass
beads
Step 8: Powder of silanized glass beads
is stored in a glass container

127
8 References
Abbas G, Fleming GJ, Harrington E, Shortall AC, Burke FJ (2003). Cuspal movement and
microleakage in premolar teeth restored with a packable composite cured in bulk or in
increments. Journal of dentistry 31(6):437-444.
Alomari QD, Reinhardt JW, Boyer DB (2001). Effect of liners on cusp deflection and gap
formation in composite restorations. Operative dentistry 26(4):406-411.
Alster D, Feilzer AJ, de Gee AJ, Davidson CL (1997). Polymerization contraction stress in
thin resin composite layers as a function of layer thickness. Dental materials : official
publication of the Academy of Dental Materials 13(3):146-150.
Arganda-Carreras I, Sorzano CS, Marabini R, Carazo J, Ortiz-de-Solorzano C, Kybic J
(2006). Consistent and Elastic Registration of Histological Sections Using Vector-Spline
Regularization. In: Computer Vision Approaches to Medical Image Analysis. R Beichel and
M Sonka editors: Springer Berlin Heidelberg, pp. 85-95.
Armstrong S, Geraldeli S, Maia R, Raposo LH, Soares CJ, Yamagawa J (2010). Adhesion
to tooth structure: a critical review of "micro" bond strength test methods. Dental materials
: official publication of the Academy of Dental Materials 26(2):e50-62.
Asmussen E, Jorgensen KD (1972). A microscopic investigation of the adaptation of some
plastic filling materials to dental cavity walls. Acta odontologica Scandinavica 30(1):3-21.
Ausiello P, Apicella A, Davidson CL (2002). Effect of adhesive layer properties on stress
distribution in composite restorations--a 3D finite element analysis. Dental materials :
official publication of the Academy of Dental Materials 18(4):295-303.
Badole GP, Warhadpande MM, Meshram GK, Bahadure RN, Tawani SG, Tawani G et al.
(2013). A comparative evaluation of cytotoxicity of root canal sealers: an in vitro study.
Restor Dent Endod 38(4):204-209.
Bauer S, Wiest R, Nolte LP, Reyes M (2013). A survey of MRI-based medical image
analysis for brain tumor studies. Physics in medicine and biology 58(13):R97-R129.
Bausch JR, de Lange K, Davidson CL, Peters A, de Gee AJ (1982). Clinical significance of
polymerization shrinkage of composite resins. The Journal of prosthetic dentistry 48(1):59-
67.
Bekkedahl N (1949). Volume dilatometry. Journal of research of the National Bureau of
Standards 43(2):145-156.
128
Bouillaguet S, Gamba J, Forchelet J, Krejci I, Wataha JC (2006). Dynamics of composite
polymerization mediates the development of cuspal strain. Dental materials : official
publication of the Academy of Dental Materials 22(10):896-902.
Bouxsein ML, Boyd SK, Christiansen BA, Guldberg RE, Jepsen KJ, Muller R (2010).
Guidelines for assessment of bone microstructure in rodents using micro-computed
tomography. Journal of bone and mineral research : the official journal of the American
Society for Bone and Mineral Research 25(7):1468-1486.
Bowen RL (1956). Use of epoxy resins in restorative materials. Journal of dental research
35(3):360-369.
Bowen RL inventor (1962). Dental filling material comprising vinyl-silane treated fused
silica and a binder consisting of the reaction product of bis-phenol and glycidyl acrylate,
U.S. Patent No. 3, 066,112, November 27, 1962.
Bowen RL (1963). Properties of a silica-reinforced polymer for dental restorations. Journal
of the American Dental Association (1939) 66(57-64.
Bowen RL (1967). Adhesive bonding of various materials to hard tooth tissues. VI. Forces
developing in direct-filling materials during hardening. Journal of the American Dental
Association (1939) 74(3):439-445.
Bowen RL, Nemoto K, Rapson JE (1983). Adhesive bonding of various materials to hard
tooth tissues: forces developing in composite materials during hardening. Journal of the
American Dental Association (1939) 106(4):475-477.
Braem M, Lambrechts P, Vanherle G, Davidson CL (1987). Stiffness increase during the
setting of dental composite resins. Journal of dental research 66(12):1713-1716.
Braga RR, Ferracane JL (2002). Contraction stress related to degree of conversion and
reaction kinetics. Journal of dental research 81(2):114-118.
Braga RR, Boaro LCC, Kuroe T, Azevedo CLN, Singer JM (2006). Influence of cavity
dimensions and their derivatives (volume and ‘C’ factor) on shrinkage stress development
and microleakage of composite restorations. Dental Materials 22(9):818-823.
Braga RR, Meira JB, Boaro LC, Xavier TA (2010). Adhesion to tooth structure: a critical
review of "macro" test methods. Dental materials : official publication of the Academy of
Dental Materials 26(2):e38-49.
Brekelmans WA, Poort HW, Slooff TJ (1972). A new method to analyse the mechanical
behaviour of skeletal parts. Acta orthopaedica Scandinavica 43(5):301-317.

129
Brodbelt RH, O'Brien WJ, Fan PL, Frazer-Dib JG, Yu R (1981). Translucency of human
dental enamel. Journal of dental research 60(10):1749-1753.
Buonocore MG (1955). A simple method of increasing the adhesion of acrylic filling
materials to enamel surfaces. Journal of dental research 34(6):849-853.
Buonocore MG, Wileman W, Brudevold F (1956). A Report on a Resin Composition
Capable of Bonding to Human Dentin Surfaces. Journal of dental research 35(6):846-851.
Cara RR, Fleming GJ, Palin WM, Walmsley AD, Burke FJ (2007). Cuspal deflection and
microleakage in premolar teeth restored with resin-based composites with and without an
intermediary flowable layer. Journal of dentistry 35(6):482-489.
Chang HS, Cho KJ, Park SJ, Lee BN, Hwang YC, Oh WM et al. (2013). Thermal analysis
of bulk filled composite resin polymerization using various light curing modes according to
the curing depth and approximation to the cavity wall. Journal of applied oral science :
revista FOB 21(4):293-299.
Cheetham JJ, Palamara JE, Tyas MJ, Burrow MF (2014). Evaluation of the interfacial work
of fracture of glass-ionomer cements bonded to dentin. Journal of the mechanical behavior
of biomedical materials 29(427-437.
Chen HY, Manhart J, Hickel R, Kunzelmann KH (2001). Polymerization contraction stress
in light-cured packable composite resins. Dental materials : official publication of the
Academy of Dental Materials 17(3):253-259.
Chen HY, Manhart J, Kunzelmann KH, Hickel R (2003). Polymerization contraction stress
in light-cured compomer restorative materials. Dental materials : official publication of the
Academy of Dental Materials 19(7):597-602.
Cheng CF, Wu KM, Chen YT, Hung SL (2013). Bacterial adhesion to antibiotic-loaded
guided tissue regeneration membranes - A scanning electron microscopy study. Journal of
the Formosan Medical Association = Taiwan yi zhi.
Chiang YC, Roesch P, Lin CL, Hickel R, Kunzelmann K Deformation Analysis of
Composite Polymerization Shrinkage from μCT Images. Annual Meeting of the Academy
of Dental Materials2008, Wuerzburg, Germany.
Chiang YC, Roesch P, Kunzelmann KH (2009). Polymerization Shrinkage with Light-
Initiated Dental Composites. Germany, Ludwig-Maximilians-Universitaet Muenchen.
Chiang YC, Rosch P, Dabanoglu A, Lin CP, Hickel R, Kunzelmann KH (2010).
Polymerization composite shrinkage evaluation with 3D deformation analysis from
microCT images. Dental materials : official publication of the Academy of Dental Materials
26(3):223-231.

130
Cho BH, Dickens SH, Bae JH, Chang CG, Son HH, Um CM (2002). Effect of interfacial
bond quality on the direction of polymerization shrinkage flow in resin composite
restorations. Operative dentistry 27(3):297-304.
Cho E, Sadr A, Inai N, Tagami J (2011). Evaluation of resin composite polymerization by
three dimensional micro-CT imaging and nanoindentation. Dental materials : official
publication of the Academy of Dental Materials 27(11):1070-1078.
Choi KK, Condon JR, Ferracane JL (2000). The effects of adhesive thickness on
polymerization contraction stress of composite. Journal of dental research 79(3):812-817.
Chuang SF, Chen TY, Chang CH (2008). Application of Digital Image Correlation Method
to Study Dental Composite Shrinkage. Strain 44(3):231-238.
Chuang SF, Chang CH, Chen TY (2011a). Contraction behaviors of dental composite
restorations--finite element investigation with DIC validation. Journal of the mechanical
behavior of biomedical materials 4(8):2138-2149.
Chuang SF, Chang CH, Chen TY (2011b). Spatially resolved assessments of composite
shrinkage in MOD restorations using a digital-image-correlation technique. Dental materials
: official publication of the Academy of Dental Materials 27(2):134-143.
Ciamponi AL, Del Portillo Lujan VA, Ferreira Santos JF (1994). Effectiveness of reflective
wedges on the polymerization of composite resins. Quintessence international (Berlin,
Germany : 1985) 25(9):599-602.
Clementino-Luedemann TNR, Dabanoglu A, Ilie N, Hickel R, Kunzelmann K (2006).
Micro-computed tomographic evaluation of a new enzyme solution for caries removal in
deciduous teeth. Dental materials journal 25(4):675-683.
Clementino-Luedemann TNR, Kunzelmann K (2006). Mineral concentration of natural
human teeth by a commercial micro-CT. Dental materials journal 25(1):113-119.
Condon JR, Ferracane JL (1998). Reduction of composite contraction stress through non-
bonded microfiller particles. Dental materials : official publication of the Academy of Dental
Materials 14(4):256-260.
Cook WD, Forrest M, Goodwin AA (1999). A simple method for the measurement of
polymerization shrinkage in dental composites. Dental materials : official publication of the
Academy of Dental Materials 15(6):447-449.
Cramer NB, Stansbury JW, Bowman CN (2011). Recent advances and developments in
composite dental restorative materials. Journal of dental research 90(4):402-416.

131
Davidson CL, de Gee AJ (1984). Relaxation of polymerization contraction stresses by flow
in dental composites. Journal of dental research 63(2):146-148.
Davidson CL, de Gee AJ, Feilzer A (1984). The competition between the composite-dentin
bond strength and the polymerization contraction stress. Journal of dental research
63(12):1396-1399.
Davidson CL, Feilzer AJ (1997). Polymerization shrinkage and polymerization shrinkage
stress in polymer-based restoratives. Journal of dentistry 25(6):435-440.
de Gee AF, Feilzer AJ, Davidson CL (1993). True linear polymerization shrinkage of
unfilled resins and composites determined with a linometer. Dental materials : official
publication of the Academy of Dental Materials 9(1):11-14.
de Gee AJ, Davidson CL, Smith A (1981). A modified dilatometer for continuous recording
of volumetric polymerization shrinkage of composite restorative materials. Journal of
dentistry 9(1):36-42.
de la Macorra JC, Cabrera E (2012). Regional variations of microTBS of light- and
chemically cured resin composite restorations in clinically relevant situations. The journal
of adhesive dentistry 14(6):551-559.
de Melo Monteiro GQ, Montes MA, Rolim TV, de Oliveira Mota CC, de Barros Correia
Kyotoku B, Gomes AS et al. (2011). Alternative methods for determining shrinkage in
restorative resin composites. Dental materials : official publication of the Academy of Dental
Materials 27(8):e176-185.
De Santis R, Mollica F, Prisco D, Rengo S, Ambrosio L, Nicolais L (2005). A 3D analysis
of mechanically stressed dentin-adhesive-composite interfaces using X-ray micro-CT.
Biomaterials 26(3):257-270.
DeLong R, Pintado M, Douglas WH (1985). Measurement of change in surface contour by
computer graphics. Dental materials : official publication of the Academy of Dental
Materials 1(1):27-30.
Dionysopoulos D, Papadopoulos C, Kouros P, Tsitrou E, Koliniotou-Koumpia E (2013).
Temperature Rise During Photo-polymerization Under Ceramic Restorations. Oral health
and dental management 12(4):273-278.
Donly KJ, Wild TW, Bowen RL, Jensen ME (1989). An in vitro investigation of the effects
of glass inserts on the effective composite resin polymerization shrinkage. Journal of dental
research 68(8):1234-1237.
Dullin P (1998). Development of a measuring system for the determination of the
polymerization behavior of dental composite materials. "Entwicklung eines Mess-Systems
132
zur Untersuchung des Polymerisationsverhaltens von zahnmedizinischen
Kompositfuellungswerkstoffen." (Thesis in Engineering Technology "Feinwerk und
Mikrotechnik"), University of Munich.
Ernst CP, Meyer GR, Klocker K, Willershausen B (2004). Determination of polymerization
shrinkage stress by means of a photoelastic investigation. Dental materials : official
publication of the Academy of Dental Materials 20(4):313-321.
Fano V, Ortalli I, Pizzi S, Bonanini M (1997). Polymerization shrinkage of microfilled
composites determined by laser beam scanning. Biomaterials 18(6):467-470.
Farah JW, Craig RG, Sikarskie DL (1973). Photoelastic and finite element stress analysis of
a restored axisymmetric first molar. Journal of biomechanics 6(5):511-520.
Feilzer AJ, De Gee AJ, Davidson CL (1987). Setting stress in composite resin in relation to
configuration of the restoration. Journal of dental research 66(11):1636-1639.
Feilzer AJ, De Gee AJ, Davidson CL (1988). Curing contraction of composites and glass-
ionomer cements. The Journal of prosthetic dentistry 59(3):297-300.
Feilzer AJ, De Gee AJ, Davidson CL (1989). Increased wall-to-wall curing contraction in
thin bonded resin layers. Journal of dental research 68(1):48-50.
Feilzer AJ, De Gee AJ, Davidson CL (1990). Quantitative determination of stress reduction
by flow in composite restorations. Dental materials : official publication of the Academy of
Dental Materials 6(3):167-171.
Ferracane JL (2005). Developing a more complete understanding of stresses produced in
dental composites during polymerization. Dental materials : official publication of the
Academy of Dental Materials 21(1):36-42.
Ferracane JL (2008). Buonocore Lecture. Placing dental composites--a stressful experience.
Operative dentistry 33(3):247-257.
Filtek LS, Technical Product Profile (2007). USA: 3M ESPE Dental Products.
Filtek™ Silorane, Silorane System Adhesive, Technical Product Profile (2007). In: ME AG
editor. Seefeld, Germany, pp. 40.
Fischer B, Modersitzki J (2008). Ill-posed medicine-an introduction to image registration.
Inverse Problems 24(3):034008(034016pp).

133
Fleming GJ, Hall DP, Shortall AC, Burke FJ (2005). Cuspal movement and microleakage in
premolar teeth restored with posterior filling materials of varying reported volumetric
shrinkage values. Journal of dentistry 33(2):139-146.
Fleming GJ, Cara RR, Palin WM, Burke FJ (2007a). Cuspal movement and microleakage in
premolar teeth restored with resin-based filling materials cured using a 'soft-start'
polymerisation protocol. Dental materials : official publication of the Academy of Dental
Materials 23(5):637-643.
Fleming GJ, Khan S, Afzal O, Palin WM, Burke FJ (2007b). Investigation of polymerisation
shrinkage strain, associated cuspal movement and microleakage of MOD cavities restored
incrementally with resin-based composite using an LED light curing unit. Journal of
dentistry 35(2):97-103.
Fogleman EA, Kelly MT, Grubbs WT (2002). Laser interferometric method for measuring
linear polymerization shrinkage in light cured dental restoratives. Dental materials : official
publication of the Academy of Dental Materials 18(4):324-330.
Gonzalez-Lopez S, Lucena-Martin C, de Haro-Gasquet F, Vilchez-Diaz MA, de Haro-
Munoz C (2004). Influence of different composite restoration techniques on cuspal
deflection: an in vitro study. Operative dentistry 29(6):656-660.
Goracci C, Sadek FT, Monticelli F, Cardoso PE, Ferrari M (2004). Microtensile bond
strength of self-etching adhesives to enamel and dentin. The journal of adhesive dentistry
6(4):313-318.
Guven EP, Yalvac ME, Kayahan MB, Sunay H, Sahin F, Bayirli G (2013). Human tooth
germ stem cell response to calcium-silicate based endodontic cements. Journal of applied
oral science : revista FOB 21(4):351-357.
Hansen EK (1982a). Visible light-cured composite resins: polymerization contraction,
contraction pattern and hygroscopic expansion. Scandinavian journal of dental research
90(4):329-335.
Hansen EK (1982b). Contraction pattern of composite resins in dentin cavities. Scandinavian
journal of dental research 90(6):480-483.
Hayashi T, Kobayashi S, Asakura M, Kawase M, Ueno A, Uematsu Y et al. (2013).
Immature muscular tissue differentiation into bone-like tissue by bone morphogenetic
proteins in vitro, with ossification potential in vivo. Journal of biomedical materials
research Part A.
Hegdahl T, Gjerdet NR (1977). Contraction stresses of composite resin filling materials.
Acta odontologica Scandinavica 35(4):191-195.

134
Hill DL, Batchelor PG, Holden M, Hawkes DJ (2001). Medical image registration. Physics
in medicine and biology 46(3):R1-45.
Huang TTY, Jones AS, He LH, Darendeliler MA, Swain MV (2007). Characterisation of
enamel white spot lesions using X-ray micro-tomography. Journal of dentistry 35(9):737-
743.
Huang YH, Quan C, Tay CJ, Chen LJ (2005). Shape measurement by the use of digital image
correlation. Optical Engineering 44(8):087011-087011.
Ikeda T, Uno S, Tanaka T, Kawakami S, Komatsu H, Sano H (2002). Relation of enamel
prism orientation to microtensile bond strength. American journal of dentistry 15(2):109-
113.
Inai N, Katahira N, Hashimoto K, Tagami J, Hirakimoto A, Marshall SJ et al. Microfocus
X-ray CT Analysis of Shrinking Direction in Resin Composite2002, San Diego,
California;2014.
Inoue S, Vargas MA, Abe Y, Yoshida Y, Lambrechts P, Vanherle G et al. (2001).
Microtensile bond strength of eleven contemporary adhesives to dentin. The journal of
adhesive dentistry 3(3):237-245.
IPS Empress CAD,Technical Product Profile (2007). In: IV AG editor. Schaan,
Liechtenstein, pp. 48.
Kakaboura A, Rahiotis C, Watts D, Silikas N, Eliades G (2007). 3D-marginal adaptation
versus setting shrinkage in light-cured microhybrid resin composites. Dental materials :
official publication of the Academy of Dental Materials 23(3):272-278.
Kapferer I, Beier US, Jank S, Persson R (2013). Randomized controlled trial: lip piercing:
the impact of material on microbiological findings. Pediatric dentistry 35(1):E23-28.
Kemp-Scholte CM, Davidson CL (1990). Complete marginal seal of Class V resin
composite restorations effected by increased flexibility. Journal of dental research
69(6):1240-1243.
Kinomoto Y, Torii M (1998). Photoelastic analysis of polymerization contraction stresses in
resin composite restorations. Journal of dentistry 26(2):165-171.
Kinomoto Y, Torii M, Takeshige F, Ebisu S (1999). Comparison of polymerization
contraction stresses between self- and light-curing composites. Journal of dentistry
27(5):383-389.

135
Kinomoto Y, Torii M, Takeshige F, Ebisu S (2000). Polymerization contraction stress of
resin composite restorations in a model Class I cavity configuration using photoelastic
analysis. Journal of esthetic dentistry 12(6):309-319.
Kleverlaan CJ, Feilzer AJ (2005). Polymerization shrinkage and contraction stress of dental
resin composites. Dental materials : official publication of the Academy of Dental Materials
21(12):1150-1157.
Kramer N, Lohbauer U, Garcia-Godoy F, Frankenberger R (2008). Light curing of resin-
based composites in the LED era. American journal of dentistry 21(3):135-142.
Kullmann W (1989). [Studies on the course of polymerization shrinkage of self-cured and
light-cured composites]. Deutsche zahnarztliche Zeitschrift 44(9):711-713.
Kunzelmann K (1996). Analysis and quantification of wear of filling materials in vivo and
in vitro. "Verschleißanalyse und -quantifizierung von Füllungsmaterialien in vivo und in
vitro." ("Habilitationsschrift"), University of Munich.
Kunzelmann KH (2008). Aufbau der Kompositfüllungswerkstoffe. In: Zahnärztliche
Werkstoffe und ihre Verarbeitung, Bd 2: Werkstoffe unter klinischen Aspekten. KE Heinrich
Friedrich Kappert editor. Stuttgart, Germany: Georg Thieme Verlag KG, pp. 204-241.
Kweon HJ, Ferracane J, Kang K, Dhont J, Lee IB (2013). Spatio-temporal analysis of
shrinkage vectors during photo-polymerization of composite. Dental materials : official
publication of the Academy of Dental Materials 29(12):1236-1243.
Kwon O-H, Park S-H (2012). Evaluation of internal adaptation of dental adhesive
restorations using micro-CT. Restor Dent Endod 37(1):41-49.
Kwon Y, Ferracane J, Lee IB (2012). Effect of layering methods, composite type, and
flowable liner on the polymerization shrinkage stress of light cured composites. Dental
materials : official publication of the Academy of Dental Materials 28(7):801-809.
Kybic J, Unser M (2003). Fast parametric elastic image registration. Image Processing,
IEEE Transactions on 12(11):1427-1442.
Labella R, Lambrechts P, Van Meerbeek B, Vanherle G (1999). Polymerization shrinkage
and elasticity of flowable composites and filled adhesives. Dental materials : official
publication of the Academy of Dental Materials 15(2):128-137.
Lai JH, Johnson AE (1993). Measuring polymerization shrinkage of photo-activated
restorative materials by a water-filled dilatometer. Dental materials : official publication of
the Academy of Dental Materials 9(2):139-143.
136
Lang H, Rampado M, Mullejans R, Raab WH (2004). Determination of the dynamics of
restored teeth by 3D electronic speckle pattern interferometry. Lasers in surgery and
medicine 34(4):300-309.
Lee HL, Jr., Swartz ML, Smith FF (1969). Physical properties of four thermosetting dental
restorative resins. Journal of dental research 48(4):526-535.
Lee IB, Cho BH, Son HH, Um CM (2005). A new method to measure the polymerization
shrinkage kinetics of light cured composites. Journal of oral rehabilitation 32(4):304-314.
Lee IB, Min SH, Seo DG (2012). A new method to measure the polymerization shrinkage
kinetics of composites using a particle tracking method with computer vision. Dental
materials : official publication of the Academy of Dental Materials 28(2):212-218.
Lee MR, Cho BH, Son HH, Um CM, Lee IB (2007). Influence of cavity dimension and
restoration methods on the cusp deflection of premolars in composite restoration. Dental
materials : official publication of the Academy of Dental Materials 23(3):288-295.
Leprince JG, Palin WM, Hadis MA, Devaux J, Leloup G (2013). Progress in dimethacrylate-
based dental composite technology and curing efficiency. Dental materials : official
publication of the Academy of Dental Materials 29(2):139-156.
Li J, Fok AS, Satterthwaite J, Watts DC (2009). Measurement of the full-field
polymerization shrinkage and depth of cure of dental composites using digital image
correlation. Dental materials : official publication of the Academy of Dental Materials
25(5):582-588.
Li J, Li H, Liu X, Fok A A glass model cavity system for shrinkage stress assessment.
IADR/AADR/CADR 89th General Session2011, San Diego, Calif.;1578.
Lindberg A, Peutzfeldt A, van Dijken JW (2004). Curing depths of a universal hybrid and a
flowable resin composite cured with quartz tungsten halogen and light-emitting diode units.
Acta odontologica Scandinavica 62(2):97-101.
Liu Q, Ding J, Chambers DE, Debnath S, Wunder SL, Baran GR (2001). Filler-coupling
agent-matrix interactions in silica/polymethylmethacrylate composites. Journal of
biomedical materials research 57(3):384-393.
Lopes HB, Santos TD, de Oliveira FS, Freitas GP, de Almeida AL, Gimenes R et al. (2013).
Poly(vinylidene-trifluoroethylene)/ barium titanate composite for in vivo support of bone
formation. Journal of biomaterials applications.
Lu H, Stansbury JW, Dickens SH, Eichmiller FC, Bowman CN (2004a). Probing the origins
and control of shrinkage stress in dental resin composites. II. Novel method of simultaneous

137
measurement of polymerization shrinkage stress and conversion. Journal of biomedical
materials research Part B, Applied biomaterials 71(1):206-213.
Lu H, Stansbury JW, Dickens SH, Eichmiller FC, Bowman CN (2004b). Probing the origins
and control of shrinkage stress in dental resin-composites: I. Shrinkage stress
characterization technique. Journal of materials science Materials in medicine 15(10):1097-
1103.
Lung CY, Matinlinna JP (2012). Aspects of silane coupling agents and surface conditioning
in dentistry: an overview. Dental materials : official publication of the Academy of Dental
Materials 28(5):467-477.
Lutz F, Luescher B, Ochsenbein H, Muehlemann HR (1976). Adhaesive Zahnheilkunde
Zurich: Juris Druck und Verlag.
Lutz F, Luscher B, Ochsenbein H (1977). [In vitro evaluation of the adaptation and quality
of the margins in various composite systems]. Schweizerische Monatsschrift fur
Zahnheilkunde = Revue mensuelle suisse d'odonto-stomatologie / SSO 87(8):752-763.
Lutz F, Phillips RW (1983). A classification and evaluation of composite resin systems. The
Journal of prosthetic dentistry 50(4):480-488.
Lutz F, Krejci I, Luescher B, Oldenburg TR (1986). Improved proximal margin adaptation
of Class II composite resin restorations by use of light-reflecting wedges. Quintessence
international (Berlin, Germany : 1985) 17(10):659-664.
Magne P (2007). Efficient 3D finite element analysis of dental restorative procedures using
micro-CT data. Dental materials : official publication of the Academy of Dental Materials
23(5):539-548.
Meira JB, Braga RR, de Carvalho AC, Rodrigues FP, Xavier TA, Ballester RY (2007).
Influence of local factors on composite shrinkage stress development--a finite element
analysis. The journal of adhesive dentistry 9(6):499-503.
Meleo D, Manzon L, Pecci R, Zuppante F, Bedini R (2012). A proposal of microtomography
evaluation for restoration interface gaps. Annali dell'Istituto superiore di sanita 48(1):83-
88.
Meredith N, Setchell DJ (1997). In vitro measurement of cuspal strain and displacement in
composite restored teeth. Journal of dentistry 25(3-4):331-337.
Miletic V, Manojlovic D, Mitrovic N, Stankovic TS, Maneski T (2011). Analysis of local
shrinkage patterns of self-adhering and flowable composites using 3D digital image
correlation. Quintessence international (Berlin, Germany : 1985) 42(9):797-804.

138
Moorthy A, Hogg CH, Dowling AH, Grufferty BF, Benetti AR, Fleming GJ (2012). Cuspal
deflection and microleakage in premolar teeth restored with bulk-fill flowable resin-based
composite base materials. Journal of dentistry 40(6):500-505.
Morin DL, Douglas WH, Cross M, DeLong R (1988). Biophysical stress analysis of restored
teeth: experimental strain measurement. Dental materials : official publication of the
Academy of Dental Materials 4(1):41-48.
Mungara J, Philip J, Joseph E, Rajendran S, Elangovan A, Selvaraju G (2013). Comparative
evaluation of fluoride release and recharge of pre-reacted glass ionomer composite and nano-
ionomeric glass ionomer with daily fluoride exposure: an in vitro study. Journal of the Indian
Society of Pedodontics and Preventive Dentistry 31(4):234-239.
Naoum SJ, Ellakwa A, Morgan L, White K, Martin FE, Lee IB (2012). Polymerization
profile analysis of resin composite dental restorative materials in real time. Journal of
dentistry 40(1):64-70.
Oliveira KM, Consani S, Goncalves LS, Brandt WC, Ccahuana-Vasquez RA (2012).
Photoelastic evaluation of the effect of composite formulation on polymerization shrinkage
stress. Brazilian oral research 26(3):202-208.
Onose H, Sano H, Kanto H, Ando S, Hasuike T (1985). Selected curing characteristics of
light-activated composite resins. Dental materials : official publication of the Academy of
Dental Materials 1(2):48-54.
Opdam NJ, Feilzer AJ, Roeters JJ, Smale I (1998). Class I occlusal composite resin
restorations: in vivo post-operative sensitivity, wall adaptation, and microleakage. American
journal of dentistry 11(5):229-234.
Pabis LV, Xavier TA, Rosa EF, Rodrigues FP, Meira JB, Lima RG et al. (2012). A method
to investigate the shrinkage stress developed by resin-composites bonded to a single flat
surface. Dental materials : official publication of the Academy of Dental Materials
28(4):e27-34.
Palin WM, Fleming GJ, Nathwani H, Burke FJ, Randall RC (2005). In vitro cuspal deflection
and microleakage of maxillary premolars restored with novel low-shrink dental composites.
Dental materials : official publication of the Academy of Dental Materials 21(4):324-335.
Park JW, Ferracane JL (2005). Measuring the residual stress in dental composites using a
ring slitting method. Dental materials : official publication of the Academy of Dental
Materials 21(9):882-889.
Park JW, Ferracane JL (2006). Residual Stress in Composites with the Thin-ring-slitting
Approach. Journal of dental research 85(10):945-949.

139
Pearson GJ, Hegarty SM (1989). Cusp movement of molar teeth with composite filling
materials in conventional and modified MOD cavities. British dental journal 166(5):162-
165.
Penn RW (1986). A recording dilatometer for measuring polymerization shrinkage. Dental
materials : official publication of the Academy of Dental Materials 2(2):78-79.
Pereira RA, Araujo PA, Castaneda-Espinosa JC, Mondelli RF (2008). Comparative analysis
of the shrinkage stress of composite resins. Journal of applied oral science : revista FOB
16(1):30-34.
Phillips RW, Lutz F, Roulet JF (1983). [Lateral tooth composites--an assessment of the
situation]. Schweizerische Monatsschrift fur Zahnheilkunde = Revue mensuelle suisse
d'odonto-stomatologie / SSO 93(8):666-673.
Porte A, Lutz F, Lund MR, Swartz ML, Cochran MA (1984). Cavity designs for composite
resins. Operative dentistry 9(2):50-56.
Price RB, Felix CA, Andreou P (2004). Effects of resin composite composition and
irradiation distance on the performance of curing lights. Biomaterials 25(18):4465-4477.
Price RB, Fahey J, Felix CM (2010a). Knoop microhardness mapping used to compare the
efficacy of LED, QTH and PAC curing lights. Operative dentistry 35(1):58-68.
Price RB, Felix CM, Whalen JM (2010b). Factors affecting the energy delivered to simulated
class I and class v preparations. Journal (Canadian Dental Association) 76(a94.
Price RB, Labrie D, Rueggeberg FA, Felix CM (2010c). Irradiance differences in the violet
(405 nm) and blue (460 nm) spectral ranges among dental light-curing units. Journal of
esthetic and restorative dentistry : official publication of the American Academy of Esthetic
Dentistry [et al] 22(6):363-377.
Price RB, McLeod ME, Felix CM (2010d). Quantifying light energy delivered to a Class I
restoration. Journal (Canadian Dental Association) 76(a23.
Price RB, Rueggeberg FA, Labrie D, Felix CM (2010e). Irradiance uniformity and
distribution from dental light curing units. Journal of esthetic and restorative dentistry :
official publication of the American Academy of Esthetic Dentistry [et al] 22(2):86-101.
Price RB, Labrie D, Whalen JM, Felix CM (2011). Effect of distance on irradiance and beam
homogeneity from 4 light-emitting diode curing units. Journal (Canadian Dental
Association) 77(b9.

140
Price RB, Sullivan B, Labrie D, Kostylev I Matching the Light Beam Profile to Resin
Microhardness Maps. IADR/AADR/CADR 91st General Session2013, Seattle,
Washington;290.
Puckett AD, Smith R (1992). Method to measure the polymerization shrinkage of light-cured
composites. The Journal of prosthetic dentistry 68(1):56-58.
Qualtrough AJ, Cramer A, Wilson NH, Roulet JF, Noack M (1991). An in vitro evaluation
of the marginal integrity of a porcelain inlay system. The International journal of
prosthodontics 4(6):517-523.
Qvist V, Qvist J (1985). Replica patterns on composite restorations performed in vivo with
different acid-etch restorative procedures. Scandinavian journal of dental research
93(4):360-370.
Rees JS, Jacobsen PH (1989). The polymerization shrinkage of composite resins. Dental
materials : official publication of the Academy of Dental Materials 5(1):41-44.
Rees JS, Jagger DC, Williams DR, Brown G, Duguid W (2004). A reappraisal of the
incremental packing technique for light cured composite resins. Journal of oral
rehabilitation 31(1):81-84.
Roberson TM (2006a). In: Sturdevant's Art and Science of Operative Dentsitry. TM
Roberson, HO Heymann and EJJ Swift editors: Mosby Elsevier, pp. 92-94.
Roberson TM (2006b). In: Sturdevant's Art and Science of Operative Dentsitry. TM
Roberson, HO Heymann and EJJ Swift editors: Mosby Elsevier, pp. 243-280.
Rodrigues FP, Li J, Silikas N, Ballester RY, Watts DC (2009). Sequential software
processing of micro-XCT dental-images for 3D-FE analysis. Dental Materials 25(6):e47-
e55.
Rodrigues FP, Silikas N, Watts DC, Ballester RY (2012). Finite element analysis of bonded
model Class I 'restorations' after shrinkage. Dental materials : official publication of the
Academy of Dental Materials 28(2):123-132.
Rodriguez VI, Abate PF, Macchi RL (2006). Immediate polymerization shrinkage in light
cured restorative resins. Acta odontologica latinoamericana : AOL 19(1):3-7.
Rösch P, Chiang YC, Kunzelmann K (2009). Quantification of local polymerisation
shrinkage from 3D micro CT images of dental composites. International Journal of
Computer assisted Radiology and Surgery 4 (Suppl. 1)(200-201.
Roulet JF, Salchow B, Wald M (1991). Margin analysis of posterior composites in vivo.
Dental materials : official publication of the Academy of Dental Materials 7(1):44-49.
141
Rullmann I, Schattenberg A, Marx M, Willershausen B, Ernst CP (2012). Photoelastic
determination of polymerization shrinkage stress in low-shrinkage resin composites.
Schweizer Monatsschrift fur Zahnmedizin = Revue mensuelle suisse d'odonto-stomatologie
= Rivista mensile svizzera di odontologia e stomatologia / SSO 122(4):294-299.
Sakaguchi RL, Sasik CT, Bunczak MA, Douglas WH (1991). Strain gauge method for
measuring polymerization contraction of composite restoratives. Journal of dentistry
19(5):312-316.
Sakaguchi RL, Peters MC, Nelson SR, Douglas WH, Poort HW (1992). Effects of
polymerization contraction in composite restorations. Journal of dentistry 20(3):178-182.
Sakaguchi RL, Versluis A, Douglas WH (1997). Analysis of strain gage method for
measurement of post-gel shrinkage in resin composites. Dental materials : official
publication of the Academy of Dental Materials 13(4):233-239.
Sakaguchi RL, Wiltbank BD, Murchison CF (2004a). Contraction force rate of polymer
composites is linearly correlated with irradiance. Dental materials : official publication of
the Academy of Dental Materials 20(4):402-407.
Sakaguchi RL, Wiltbank BD, Shah NC (2004b). Critical configuration analysis of four
methods for measuring polymerization shrinkage strain of composites. Dental materials :
official publication of the Academy of Dental Materials 20(4):388-396.
Sakaguchi RL, Powers JM (2012). Craig's Restorative Dental Materials. Philadelphia:
Elsevier/Mosby, pp. 161-198.
Sandholzer MA, Walmsley AD, Lumley PJ, Landini G (2013). Radiologic evaluation of
heat-induced shrinkage and shape preservation of human teeth using micro-CT. Journal of
Forensic Radiology and Imaging 0).
Scherrer SS, Cesar PF, Swain MV (2010). Direct comparison of the bond strength results of
the different test methods: a critical literature review. Dental materials : official publication
of the Academy of Dental Materials 26(2):e78-93.
Schneider LF, Cavalcante LM, Silikas N (2010). Shrinkage Stresses Generated during
Resin-Composite Applications: A Review. Journal of dental biomechanics 2010(
Schwass DR, Swain MV, Purton DG, Leichter JW (2009). A system of calibrating
microtomography for use in caries research. Caries Res 43(4):314-321.
Schweikl H, Hiller KA, Carl U, Schweiger R, Eidt A, Ruhl S et al. (2013). Salivary protein
adsorption and Streptococccus gordonii adhesion to dental material surfaces. Dental
materials : official publication of the Academy of Dental Materials 29(10):1080-1089.

142
Scientific Documentation Tetric EvoCeram® Bulk Fill (2013). In: IV AG editor. Schaan,
Liechtenstein, pp. 39.
Sharp LJ, Choi IB, Lee TE, Sy A, Suh BI (2003). Volumetric shrinkage of composites using
video-imaging. Journal of dentistry 31(2):97-103.
Simon Y, Mortier E, Dahoun A, Gerdolle DA (2008). Video-controlled characterization of
polymerization shrinkage in light-cured dental composites. Polymer Testing 27(6):717-721.
Smith DL, Schoonover IC (1953). Direct filling resins: dimensional changes resulting from
polymerization shrinkage and water sorption. Journal of the American Dental Association
(1939) 46(5):540-544.
Soltesz U, Bath P, Klaiber B (1986). Dimensional behavior of dental composites due to
polymerization shrinkage and water sorption. In: Biological and Biomechanical
Performance of Biomaterials. P Christel, A Meunier and A Lee editors. Amsterdam:
Elsevier, pp. 123-128.
Sorzano COS, Thevenaz P, Unser M (2005). Elastic registration of biological images using
vector-spline regularization. Biomedical Engineering, IEEE Transactions on 52(4):652-663.
Suh BI, Wang Y (2001). Determining the direction of shrinkage in dental composites by
changes in surface contour for different bonding configurations. American journal of
dentistry 14(2):109-113.
Suliman AA, Boyer DB, Lakes RS (1993a). Interferometric measurements of cusp
deformation of teeth restored with composites. Journal of dental research 72(11):1532-
1536.
Suliman AA, Boyer DB, Lakes RS (1993b). Cusp movement in premolars resulting from
composite polymerization shrinkage. Dental materials : official publication of the Academy
of Dental Materials 9(1):6-10.
Suliman AH, Boyer DB, Lakes RS (1994). Polymerization shrinkage of composite resins:
comparison with tooth deformation. The Journal of prosthetic dentistry 71(1):7-12.
Sun J, Lin-Gibson S (2008). X-ray microcomputed tomography for measuring
polymerization shrinkage of polymeric dental composites. Dental materials : official
publication of the Academy of Dental Materials 24(2):228-234.
Sun J, Eidelman N, Lin-Gibson S (2009a). 3D mapping of polymerization shrinkage using
X-ray micro-computed tomography to predict microleakage. Dental materials : official
publication of the Academy of Dental Materials 25(3):314-320.
143
Sun J, Fang R, Lin N, Eidelman N, Lin-Gibson S (2009b). Nondestructive quantification of
leakage at the tooth-composite interface and its correlation with material performance
parameters. Biomaterials 30(27):4457-4462.
Suzuki K, Anada T, Miyazaki T, Miyatake N, Honda Y, Kishimoto KN et al. (2014). Effect
of addition of hyaluronic acids on the osteoconductivity and biodegradability of synthetic
octacalcium phosphate. Acta biomaterialia 10(1):531-543.
Swanson TK, Feigal RJ, Tantbirojn D, Hodges JS (2008). Effect of Adhesive Systems and
Bevel on Enamel Margin Integrity in Primary and Permanent Teeth. Pediatric dentistry
30(2):134-140.
Swennen GRJ, Barth EL, Eulzer C, Schutyser F (2007). The use of a new 3D splint and
double CT scan procedure to obtain an accurate anatomic virtual augmented model of the
skull. International journal of oral and maxillofacial surgery 36(2):146-152.
Swift EJ, Jr., Perdigao J, Heymann HO (1995). Bonding to enamel and dentin: a brief history
and state of the art, 1995. Quintessence international (Berlin, Germany : 1985) 26(2):95-
110.
Tagami J, Nikaido T, Nakajima M, Shimada Y (2010). Relationship between bond strength
tests and other in vitro phenomena. Dental materials : official publication of the Academy of
Dental Materials 26(2):e94-99.
Taha NA, Palamara JE, Messer HH (2009). Cuspal deflection, strain and microleakage of
endodontically treated premolar teeth restored with direct resin composites. Journal of
dentistry 37(9):724-730.
Takahashi H, Finger WJ, Wegner K, Utterodt A, Komatsu M, Wostmann B et al. (2010).
Factors influencing marginal cavity adaptation of nanofiller containing resin composite
restorations. Dental materials : official publication of the Academy of Dental Materials
26(12):1166-1175.
Takahashi N, Kitagami T, Komori T (1980). Behaviour of teeth under various loading
conditions with finite element method. Journal of oral rehabilitation 7(6):453-461.
Tantbirojn D, Versluis A, Pintado MR, DeLong R, Douglas WH (2004). Tooth deformation
patterns in molars after composite restoration. Dental materials : official publication of the
Academy of Dental Materials 20(6):535-542.
Thresher RW, Saito GE (1973). The stress analysis of human teeth. Journal of biomechanics
6(5):443-449.
Toefco Engineered Coating Systems I (2013).

144
Tornavoi DC, Agnelli JA, Panzeri H, Reis AC (2013). Color change of composite resins
subjected to accelerated artificial aging. Indian journal of dental research : official
publication of Indian Society for Dental Research 24(5):605-609.
van Dijken JW, Horstedt P, Meurman JH (1985). SEM study of surface characteristics and
marginal adaptation of anterior resin restorations after 3-4 years. Scandinavian journal of
dental research 93(5):453-462.
Van Ende A, De Munck J, Van Landuyt KL, Poitevin A, Peumans M, Van Meerbeek B
(2013). Bulk-filling of high C-factor posterior cavities: effect on adhesion to cavity-bottom
dentin. Dental materials : official publication of the Academy of Dental Materials 29(3):269-
277.
Van Meerbeek B, De Munck J, Yoshida Y, Inoue S, Vargas M, Vijay P et al. (2003).
Buonocore memorial lecture. Adhesion to enamel and dentin: current status and future
challenges. Operative dentistry 28(3):215-235.
Versluis A, Douglas WH, Cross M, Sakaguchi RL (1996). Does an incremental filling
technique reduce polymerization shrinkage stresses? Journal of dental research 75(3):871-
878.
Versluis A, Tantbirojn D, Douglas WH (1998). Do dental composites always shrink toward
the light? Journal of dental research 77(6):1435-1445.
Versluis A, Tantbirojn D, Douglas WH (2004a). Distribution of transient properties during
polymerization of a light-initiated restorative composite. Dental materials : official
publication of the Academy of Dental Materials 20(6):543-553.
Versluis A, Tantbirojn D, Pintado MR, DeLong R, Douglas WH (2004b). Residual shrinkage
stress distributions in molars after composite restoration. Dental materials : official
publication of the Academy of Dental Materials 20(6):554-564.
Wagner DW, Lindsey DP, Beaupre GS (2011). Deriving tissue density and elastic modulus
from microCT bone scans. Bone 49(5):931-938.
Watts DC, Amer O, Combe EC (1984). Characteristics of visible-light-activated composite
systems. British dental journal 156(6):209-215.
Watts DC, Cash AJ (1991). Determination of polymerization shrinkage kinetics in visible-
light-cured materials: methods development. Dental materials : official publication of the
Academy of Dental Materials 7(4):281-287.
Watts DC, Hindi AA (1999). Intrinsic ‘soft-start’ polymerisation shrinkage-kinetics in an
acrylate-based resin-composite. Dental Materials 15(1):39-45.
145
Watts DC, Marouf AS (2000). Optimal specimen geometry in bonded-disk shrinkage-strain
measurements on light-cured biomaterials. Dental materials : official publication of the
Academy of Dental Materials 16(6):447-451.
Watts DC, Marouf AS, Al-Hindi AM (2003). Photo-polymerization shrinkage-stress kinetics
in resin-composites: methods development. Dental materials : official publication of the
Academy of Dental Materials 19(1):1-11.
Watts DC, Satterthwaite JD (2008). Axial shrinkage-stress depends upon both C-factor and
composite mass. Dental materials : official publication of the Academy of Dental Materials
24(1):1-8.
Weinmann W, Thalacker C, Guggenberger R (2005). Siloranes in dental composites. Dental
materials : official publication of the Academy of Dental Materials 21(1):68-74.
Wilson HJ (1978). Properties of Radiation-Cured Restorative Resins. London: Franklin
Scientific Projects.
Yamamoto A, Miyazaki M, Rikuta A, Kurokawa H, Takamizawa T (2007). Comparison of
two methods for measuring the polymerization characteristics of flowable resin composites.
Dental materials : official publication of the Academy of Dental Materials 23(7):792-798.
Yamamoto T, Ferracane JL, Sakaguchi RL, Swain MV (2009). Calculation of contraction
stresses in dental composites by analysis of crack propagation in the matrix surrounding a
cavity. Dental Materials 25(4):543-550.
Yamamoto T, Kubota Y, Momoi Y, Ferracane JL (2012). Polymerization stresses in low-
shrinkage dental resin composites measured by crack analysis. Dental materials : official
publication of the Academy of Dental Materials 28(9):e143-149.
Yu B, Ahn JS, Lee YK (2009). Measurement of translucency of tooth enamel and dentin.
Acta odontologica Scandinavica 67(1):57-64.
Zeiger DN, Sun J, Schumacher GE, Lin-Gibson S (2009). Evaluation of dental composite
shrinkage and leakage in extracted teeth using X-ray microcomputed tomography. Dental
materials : official publication of the Academy of Dental Materials 25(10):1213-1220.
Zou W, Gao J, Jones AS, Hunter N, Swain MV (2009). Characterization of a novel
calibration method for mineral density determination of dentine by X-ray micro-
tomography. Analyst 134(1):72-79.

146
Eidesstattliche Versicherung
Kaisarly, Dalia Adel Mahmoud
Ich erkläre hiermit an Eides statt,
dass ich die vorliegende Dissertation mit dem Thema
“The Effect of Boundary Conditions on the Polymerization Shrinkage Vectors of
Light-Cured Dental Resin Composites”
selbständig verfasst, mich außer der angegebenen keiner weiteren Hilfsmittel bedient und
alle Erkenntnisse, die aus dem Schrifttum ganz oder annähernd übernommen sind, als
solche kenntlich gemacht und nach ihrer Herkunft unter Bezeichnung der Fundstelle
einzeln nachgewiesen habe.
Ich erkläre des Weiteren, dass die hier vorgelegte Dissertation nicht in gleicher oder in
ähnlicher Form bei einer anderen Stelle zur Erlangung eines akademischen Grades
eingereicht wurde.
München, den 29.07.2014
Eidesstattliche Versicherung Stand: 31.01.2013