The effect of bio-based materials on quality and shelf ...
134
Clemson University TigerPrints All eses eses 8-2009 e effect of bio-based materials on quality and shelf life of celery Chike Ifezue Clemson University, [email protected] Follow this and additional works at: hps://tigerprints.clemson.edu/all_theses Part of the Engineering Commons is esis is brought to you for free and open access by the eses at TigerPrints. It has been accepted for inclusion in All eses by an authorized administrator of TigerPrints. For more information, please contact [email protected]. Recommended Citation Ifezue, Chike, "e effect of bio-based materials on quality and shelf life of celery" (2009). All eses. 632. hps://tigerprints.clemson.edu/all_theses/632
Transcript of The effect of bio-based materials on quality and shelf ...

Clemson UniversityTigerPrints
All Theses Theses
8-2009
The effect of bio-based materials on quality andshelf life of celeryChike IfezueClemson University, [email protected]
Follow this and additional works at: https://tigerprints.clemson.edu/all_theses
Part of the Engineering Commons
This Thesis is brought to you for free and open access by the Theses at TigerPrints. It has been accepted for inclusion in All Theses by an authorizedadministrator of TigerPrints. For more information, please contact [email protected].
Recommended CitationIfezue, Chike, "The effect of bio-based materials on quality and shelf life of celery" (2009). All Theses. 632.https://tigerprints.clemson.edu/all_theses/632

THE EFFECT OF BIO-BASED FILMS ON QUALITY AND SHELF LIFE OF FRESH CELERY
_______________________________________________________
A thesis
Presented to
The Graduate School
of Clemson University
_____________________________________________________
In partial Fulfillment
of the Requirements for the Degree
Master of Science
Packaging Science
____________________________________________________
By
Chike Ifezue
August 2009
_____________________________________________________
Accepted by:
Dr. Kay Cooksey, Committee Chair
Dr. Duncan Darby
Dr. Robert Kimmel

ii
ABSTRACT
Bio-based materials have garnered increasing interest as food packaging materials due to
their raw materials derived from renewable resources such as corn starch, cellulose, and sugar
beets. One important drawback is that they can exhibit poor mechanical performance compared
to non-bio based materials and their effect on quality and shelf life of some produce is unknown.
This research studied the effect of three bio-based materials on quality and shelf life of
fresh celery. Materials include non-perforated biopolymer films and perforated low density
polyethylene (LDPE) film. The variable materials were: Polylactic Acid (PLA), a versatile
biodegradable aliphatic polyester derived from 100% renewable resources, Ecoflex, a
biodegradable aliphatic-aromatic copolyester, and Mater-Bi, a bio-plastic derived mainly from
natural renewable resources such as corn, wheat, and potato starch. The control was perforated
LDPE.
The objective of this research was to determine if biopolymer films could be used to
package fresh celery and if they were comparable to the currently used packaging material
(LDPE).
Whole (uncut) fresh celery stalks packaged into sleeves made from the above materials
were subjected to refrigeration conditions (5°C & 95%RH) and bi-monthly analysis for 3
months. The analysis included appearance, weight loss, microbiology, sensory, texture, and
petiole color. Material or film analysis included WVTR, OTR, Tensile Strength, and Elongation.
The results showed that product quality attributes did not significantly differ between
materials. Consequently, celery could be packaged in any of the materials utilized in the study

iii
and maintain natural quality over time as well as naturally deteriorate over time. With respect to
weight loss, celery packaged in all bio-based materials experienced decreases in weight. Celery
packaged in Mater-Bi material had the least weight loss at end of study. Results also
demonstrated material deterioration occurring in both Ecoflex and PLA materials based on
tensile and break elongation results under the high humidity conditions of the present study.
Both materials also displayed the highest increases and fluctuation in permeation rates. While
Ecoflex and PLA materials were suitable materials with respect to product quality attributes,
their mechanical properties would need to be improved to match the performance of Mater-Bi.
Mater-Bi was superior to other bio-based materials with regard to mechanical performance and
therefore would be recommended for storage of fresh celery over other bio-based materials.

iv
DEDICATION
I dedicate this work to my parents and all family members in Nigeria who have always
advocated higher education and a thirst for continuous learning.

v
ACKNOWLEDGEMENTS
I sincerely offer my heartfelt gratitude to my thesis advisor, Dr. Kay Cooksey, for her
patience and guidance throughout my research study. A special appreciation to my committee
members Dr. Duncan Darby, and Dr. Robert Kimmel who have been patient and willing to offer
a fresh start when I made mistakes and gone astray. I also extend appreciation to my sensory
coordinator, Mrs. Halpin for her assistance in coordinating sensory analysis and soliciting
panelists. Thanks to Dr. Whiteside for organizing the distribution and arrival of a storage cooler
and for his challenging style that assisted in enriching the body of this work.

vi
TABLE OF CONTENTS
Page
TITLE PAGE……………………………………………………………………………… i
ABSTRACT………………………………………………………………………………... ii
DEDICATION…………………………………………………………………………….. iv
ACKNOWLEDGEMENTS……………………………………………………………….. v
LIST OF TABLES…………………………………………………………………………. ix
LIST OF FIGURES………………………………………………………………………... xi
CHAPTER
1. INTRODUCTION………………….....................................................................1
2. LITERATURE REVIEW……………………………………………………… .3 Celery characteristics……………………………………………………… .3
Variety…………………………………………………………….....3 Leaves, Stem and Root…………………………………………….. .3 Flowers…………………………………………………………….. .4 Seeds………………………………………………………………. .4
Factors Affecting Shelf Life of Celery.............................................................5 Basic Material Properties…………………………………………………... .7 Low Density Polyethylene…………………………………………. .7 Bio-Based Materials……………………………………………………….. .9 Specific Bio-Based Materials: Mater-Bi…………………………………… .10 Mater-Bi……………………………………………………………. .10 Polylactic Acid……………………………………………………... .12 Ecoflex……………………………………………………………... .14 Mechanical Properties……………………………………………………… .17 Tensile Properties………………………………………………….. .18 Stress Strain………………………………………………………... .18 Standard Testing Method…………………………………………... .18

vii
Table of Contents (Continued) Page
Permeation…………………………………………………………. ……....19 Oxygen Permeability Measurement System………………. ……....19 Water Vapor Permeability Measurement System…………. ……....20 Water Vapor Permeability Measurement System: Permatron........... 21 Shelf Life of Food Products……………………………………………….. 21 Shelf Life Assessment of Fresh Produce…………………………………... 24 Sensory Analysis of Fresh Produce………………………………………... 26 Celery Textural Attributes and Measurement……………………………… 30 Color of Vegetable Products………………………………………………. 33
3. MATERIALS AND METHODS………………………………………. ……....36 Celery Arrival and Preparation…………………………………….............. 36 Packaging Materials……………………………………………………….. 38
Oxygen Permeation Determination…………………………………40 Water Vapor Permeation Determination…………………………... 40 Tensile Tests……………………………………………………….. 41 Sensory Evaluation of Celery……………………………………………… 41 Color Analysis of Celery………….……………………………………….. 42 Texture Analysis of Celery………………………………………………… 43 Weight loss assessment of Celery………………………………………….. 44 Microbial Quality of Celery………………………………………………... 44 Storage Conditions…………………………………………………………. 45 Statistical Analysis…………………………………………………………47
4. RESULTS AND DISCUSSION % Weight Loss of Celery………………………………………………….. 48 ∆E Analysis………………………………………………………………... 52
L* Color Analysis………………………………………………….............. 58 a*Color Analysis…………………………………………………………… 64 b* Color Analysis………………………………………………………….. 70 Summary of Color Analysis………………………………………………..75 Textural Measurements…………………………………………….............. 77 Microbial Analysis…………………………………………………………. 83 Sensory Analysis…………………………………………………………… 84

viii
Table of Contents (Continued) Page Summary of Sensory Results…………………………………………………..92 Material Analysis………………………………………………………………93 Permeation Analysis…………………………………………………………… 93 Mechanical Analysis…………………………………………………… ……....94
5. SUMMARY……………………………………………………………. ……..106
6. RECOMMENDATIONS…………………………………………….... ……..108
APPENDICES……………………………………………………………………..............109
A: Plastic Tensile Testing Data……………………………………………………109
B: Sensory Ballot Sheet…………………………………………………………....110
C: Material Spec Sheets……………………………………………………………111
D: Celery Pictures...………………………………………………………………..116
E: Material Deterioration…………………………………………………………..117
REFERENCES……………………………………………………………………………..119

ix
LIST OF TABLES
Table Page 1.1 Material OPR, WVPR, Thickness & Dimensions…………………………………. 39 1.2 Experimental Design: Part A………………………………………………………. 45 1.3 Experimental Design: Part B………………………………………………………. 46 4.1 % Weight Loss of Celery during Refrigerated Storage……………………………. 48 4.2 ∆E Analysis: Outer Stalks…………………………………………………………. 52 4.3 ∆E Analysis: Middle Stalks………………………………………………………... 54 4.4 ∆E Analysis: Inner Stalks………………………………………………………….. 56 4.5 L* Color Analysis: Outer Stalks…………………………………………………… 58 4.6 L* Color Analysis: Middle Stalks…………………………………………………. 60 4.7 L* Color Analysis: Inner Stalks……………………………………………………. 62 4.8 a* Color Analysis: Outer Stalks……………………………………………………. 64 4.9 a* Color Analysis: Middle Stalks………………………………………………….. 66 5.0 a* Color Analysis: Inner Stalks……………………………………………………. 68 5.1 b* Color Analysis: Outer Stalks…………………………………………………… 70 5.2 b* Color Analysis: Middle Stalks………………………………………………….. 72 5.3 b* Color Analysis: Inner Stalks……………………………………………………. 74 5.4 Textural Measurement: Firmness vs. Time………………………………………... 77 5.5 Textural Measurement: Stiffness vs. Time………………………………………… 79 5.6 Textural Measurement: Toughness vs. Time………………………………………. 81
x
List of Tables (Continued) Table Page 5.7 Sensory Analysis…………………………………………………………………… 84 5.8 Permeation Studies………………………………………………………………….93 5.9 Break Strength……………………………………………………………………... 94 6.0 Yield Stress………………………………………………………………………… 96 6.1 Break Elongation (%)……………………………………………………………… 97 6.2 Curve Shape………………………………………………………………………100

xi
LIST OF FIGURES
Figure Page 1.1 Apium graveolens of the Wild Celery Variety……………………………………...4 1.2 PLA Chemical Structure…………………………………………………………...12 1.3 Ecoflex Chemical Profile…………………………………………………………..14 1.4 Stress Strain Curve…………………………………………………………………17 1.5 L* a* b* color scale………………………………………………………………...34 1.6 Sleeved Uncut Celery Stalk………………………………………………………...37 1.7 Cut Celery Stalk……………………………………………………………………37 2.8 Celery Stalk………………………………………………………………………...43 4.1 % Weight Loss of Celery during Refrigerated Storage...............................................49 4.2 ∆E Outer Stalks…………………………………………………………………….52 4.3 ∆E Middle Stalks…………………………………………………………………...54 4.4 ∆E Inner Stalks……………………………………………………………………..56 4.5 L* Color Analysis: Outer Stalks……………………………………………………58 4.6 L* Color Analysis: Middle Stalks………………………………………………….60 4.7 L* Color Analysis: Inner Stalks……………………………………………………62 4.8 a* Color Analysis: Outer Stalks……………………………………………………64 4.9 a* Color Analysis: Middle Stalks…………………………………………………..66 5.0 a* Color Analysis: Inner Stalks…………………………………………………….68 5.1 b* Color Analysis: Outer Stalks…………………………………………………....70

xii
LIST OF FIGURES (Continued) Figure Page 5.2 b* Color Analysis: Middle Stalks………………………………………………….. 72 5.3 b* Color Analysis: Inner Stalks……………………………………………………. 74 5.4 Firmness vs. Time………………………………………………………………….. 77 5.5 Stiffness vs. Time…………………………………………………………………...79 5.6 Toughness vs. Time………………………………………………………………... 81 5.7 Microbial Counts vs. Time………………………………………………………… 83 5.8 Sensory: Aroma Profile……………………………………………………………. 85 5.9 Sensory: Appearance Profile………………………………………………………. 86 6.0 Sensory: Flavor Profile…………………………………………………………….. 87 7.0 Sensory: Liking of Flavor Profile………………………………………………….. 88 7.1 Sensory: Texture Profile…………………………………………………………… 89 7.2 Sensory: Overall…………………………………………………………………… 90 7.3 Sensory: Ranking Profile…………………………………………………………... 91 7.4 Tensile Strength at Break…………………………………………………………... 98 7.5 Tensile Strength at Yield…..………………………………………………………. 99 7.6 Ecoflex Stress Strain Curve...……………………………………………………..100 7.7 Mater-Bi Stress Strain Curve….…………………………………………………..100 7.8 PLA Stress Strain Curve…………………………………………………………..101 7.9 LDPE Stress Strain Curve………………………………………………………....101

1
CHAPTER 1
INTRODUCTION
Most plastic packaging applications utilize fossil fuel based polymers which are highly
non-biodegradable and difficult to recycle or reuse due to blends of materials, impurities, and
complex composites. The disposal of packaging waste serving as a main part of municipal solid
waste and the rising cost of petroleum based materials has revived concerns prompting actions to
significantly reduce amount of packaging waste (Bastioli, Catia, 2005). Consequently, the
advent of biodegradable packaging materials from renewable resources may potentially play a
role in contributing to sustainable development by having a reduced environmental impact
(Bastioli, Catia, 2005). For instance, bio-based materials can serve as mulch films that protect
soil and plants against weed growth, raise yields and elevate soil temperatures, then can be
disposed by plowing into the soil.
Although modern plastics such as polyethylene (PE), polypropylene (PP), polystyrene
(PS), and polyethylene terephthalate (PET) are strong, inexpensive, and durable, they are
resistant to biological degradation due to inability of their carbon components to be broken down
by microorganisms (Bastioli, Catia, 2005). Additionally, the hydrophobic nature of synthetic
plastics, coupled with their low surface area and high molecular weight, further inhibits enzyme
activity and compounds their resistance to microbial attack (Bastioli, Catia, 2005).
The advent of biodegradable polymers that are readily manufactured, possess good
mechanical properties, and are derived from renewable resources, can compete strongly in the
market place alongside petroleum based counterparts. If biopolymers are to replace some of the

2
synthetic polymers, more research is needed to determine what effects they will have on the
quality and shelf life of foods.

3
CHAPTER 2
LITERATURE REVIEW
Celery Characteristics
Variety
The Celery plant species is called Apium graveolens. It yields two important vegetables
which are celery and celeriac. Celery is a biennial crop that later becomes an annual crop when
early or warm weather causes development of a flowering stem. Biennial crops require two
years to complete their life cycle. During the second year, they begin to flower and produce
other botanical structural components such as flowering, seeds, etc, that are indicative of a
mature crop (APIACEAE- The Celery Family).
Celery belongs to the family of Apiaceae. Over 2500 members of the Apiaceae family
are found worldwide at predominantly temperate regions. Other notable vegetables and herbs
found in this family include carrots, parsnip, fennel, and ornamental garden plants such as
Eryngium, Astrantia, and Aciphylla. Characteristics of the plant family Apiaceae are indicated in
Figure 1.1.
Leaves, Stem and Root
Apiaceae family members are soft-stemmed annuals, biennials, or perennials
(APIACEAE- The Celery Family). At the leaf joints, stems can be hollow or ribbed as celery,
while the leaves are divided.

4
Figure 1.1 Apium graveolens of the Wild Celery Variety (USDA Plants)
Flowers
Flower stalks grow from the leaf axil. The axil is the angle between the upper side of a
leaf or stem and the stem or branch that supports it (APIACEAE- The Celery Family). As the
flowers grow, they form into clusters in an umbrella shape. Outer flowers may bloom first and
can appear in colors of white, cream or yellow. The appearance of members in the Apiaceae
family grow to be relatively lanky and appear gangling in similar fashion to an asparagus.
Seeds
The seeds of the Apiaceae family are comprised of different shapes and sizes ranging from
winged shaped to spiny. Located behind the petals, seed capsules consist of two parts, each
having a single seed.

5
Factors Affecting Shelf Life of Celery
Overall quality of a wide assortment of produce such as broccoli, lettuce, and celery is
determined by quality factors which include weight loss, microbial spoilage, appearance (visual
characteristics), and sensory qualities (Kilcast & Subramaniam, 2000). Consequently, those
quality criteria are important determinants of product shelf life. Quality criteria also depend on
specific commodities and the condition in which the commodity is sold. For instance, quality
criteria for produce sold fresh will differ from that sold minimally processed. For wholesome
uncut non- processed celery sticks, the key factors and criteria that affect shelf life and quality
are grouped into the categories of appearance, texture, and flavor/aroma. Initially, signs of
quality decay and decreasing shelf life for celery are the loss of green color and the onset of
pithiness (Gomez & Artes, 2005). Pithiness is characterized by the appearance of whitish
regions and air spaces within celery tissues and leads to reduced tissue density (Luo, Suslow, &
Cantwell, 2002). Pithiness is identified as a major source of quality loss and decreased shelf-life
in celery (Saltveit & Mangrich, 1996). Excessive development of pithiness can be retarded by
storage at low enough temperatures (0°C, 32°F) which prolongs shelf life of the celery.
Shelf life of vegetable products alike can vary depending on storage conditions. A
vegetable product such as celery will rapidly degrade if storage conditions are incapable of
maintaining and or retaining inherent moistness or water activity. Since celery contains 94.7%
water (Bartz & Brecht, 2003), the shelf life of wholesome uncut celery at optimum storage
conditions (0°C, 32°F & > 95%RH) is 5-7 weeks (Hardenburg, Watada, & Wang, 1986).
Otherwise, conventional refrigeration conditions limits shelf life to approximately three weeks.

6
Celery shelf life, quality, and storage can be limited by any defect in appearance.
Appearance is a critical feature in consumer decision making regarding purchase of fresh celery.
Fresh celery is expected to exhibit zero defects in appearance while also displaying evenness in
color, shape, and size. Visual celery quality also includes lighter green areas underneath the
inner surface of celery sticks and heavier green areas on the outer external areas of celery sticks.
Conversely, the yellowing of a green vegetable, such as celery, is an indication of accelerated
maturation and thus signals the end of the shelf life. The other critical appearance characteristics
that affect shelf life include wilting, skin wrinkling, and shriveling.
Just as appearance characteristics affect shelf life of celery, textural properties also
provide an indication of celery quality. Good quality celery is associated with crisp and firm
textural attributes. In contrast, developments of tough textural attributes are undesirable and
closely associated with product maturation. Textural attributes can also be visually identified via
appearance indications of wilting and shriveling. While textural and appearance attributes can be
vividly and physically observed, flavor/aroma attributes are another key category of celery that
affects quality and shelf life. Flavor can not be easily evaluated by consumers prior to purchase
of a vegetable product such as celery. Nevertheless, vital celery flavor characteristics include
bitter, aromatic, astringent, and salty. Unlike flavor, aroma can be evaluated before purchase by
consumer. For fresh produce such as celery, aroma is a pivotal quality component that
consumers utilize in determining freshness and appeal of celery sticks before purchase.
Unpleasant odors that may indicate putridity can develop due to mechanical damage to cell tissue
during distribution which renders the produce highly vulnerable to microbial contamination.
Microbial agents such as Pseudomonas fluorescens and P. marginalis have been identified as
decay and soft rot causative agents in fresh cut celery (Robbs, Bartz, Mcfie, & Hodge, 1996).

7
Such microbiological agents are responsible for unpleasant aromas which can render a product
unmarketable despite other quality factors being desirable. Consequently, aroma is an important
factor in the quality, storage, and shelf life of celery. (Selke, Cutler, & Hernandez, 2004)
BASIC MATERIAL PROPERTIES
Low Density Polyethylene
Low Density Polyethylene (LDPE) is a thermoplastic polymer made from petrochemicals
and is the most widely used packaging plastic for a variety of manufacturing applications
including plastic bags, tubing and food packaging containers. A thermoplastic can be defined as
a polymer that can be shaped multiple times at reasonably low temperatures (Kimmel 2006) that
can be heated, formed and cooled into a new shape. Belonging to the polyethylene resin family,
LDPE is classified as a branched polymer due to a high degree of short and long chain branching
(Selke, Cutler, & Hernandez, 2004).
Shortly after its introduction in the 1950’s, polyethylene became a common material used
in film production, and container closures (Selke, Cutler, & Hernandez, 2004). Additionally,
mechanical properties such as strength, toughness, heat sealing properties, etc, have considerably
improved since its introduction as a premier packaging material. LDPE possesses a branched
structure similar to other members in the family of branched polyethylenes which include
homopolymers and copolymers of ethylene that are non-linear, thermoplastic, and partially
crystalline. Homopolymers are polymers formed from only one type of monomer while
copolymers are polymers composed of two or more different types of monomers (Selke, Cutler,

8
& Hernandez, 2004). These polymers are manufactured under high pressure and temperature
parameters via free radical polymerization processes. The manufacture of ethylene via such
polymerization conditions produces a branched polymer composed of a blend of large molecules
with different backbone lengths, variation of side chain lengths, and various degrees of side-
chain branching (Selke, Cutler, & Hernandez, 2004).
Chain branching in LDPE offers a variety of attractive mechanical properties which
include clarity, flexibility and heat sealability. In addition to such properties, LDPE is adaptable
to a variety of processing means such as blow molding, injection molding, and film casting.
Film casting is particularly relevant in the packaging industry because LDPE films serve as the
largest volume of LDPE produced, as well as the largest use for packaging applications (Selke,
Cutler, & Hernandez, 2004). LDPE production into films comprises of bags for food, industrial
liners, vapor barriers, agricultural films, and shrink/stretch films. Serving as the most widely
used plastic in packaging, LDPE can be used alone or in combination with other polymers in the
polyethylene family. Some other important features of LDPE include: (Selke, Cutler, &
Hernandez, 2004)
• Excellent flexibility
• Good impact resistance
• Fair machinability
• Good oil resistance
• Fair chemical resistance
• Good heat sealing characteristics
• Low cost ($1.60/kg)

9
BIO-BASED MATERIALS
Bio-based materials are derived from renewable sources such as corn starch, cellulose
and polysaccharides. They have garnered increasing interest as materials that begin to address
the emerging challenge for the 21st century polymer manufacturing for a wide array of
applications (Bastioli, Catia, 2005).
The selection of bio-based materials for a range of packaging applications has been based
on the evaluation of polymer properties as well as recyclability and sustainability of such
polymers. Materials utilized in this study such as Polylactic Acid (PLA) polymer have garnered
increasing attention in recent years as consumers demand use of bio-friendly packaging materials
(Auras, Singh, & Singh, 2005). Additionally, decreasing availability of landfills (mainly in
Europe) triggered by lingering issues surrounding degradation of municipal solid waste have also
enhanced consumer interest in packaging materials that are capable of biodegrading.
Biodegradation involves the actions of a microorganism’s extracellular enzymes in
breaking down a polymer (by attacking ends of large molecules) into products or fragments that
are small enough to be assimilated (Bastioli, Catia, 2005). Polymer fragments must be broken
down into small enough chain lengths for degradation to occur because enzymes are incapable of
digesting larger macromolecules. In biodegradation of polymers, the first step is a chain
cleavage step involving the conversion of a long polymer chain into smaller oligomeric
fragments. Secondly, small size oligomeric polymer fragments are converted into biomass such
as minerals, salts, CO2 and methane (Bastioli, Catia, 2005)

10
Specific Bio-based Materials:
Mater-Bi
Mater-Bi (manufactured by Novamont) is made of extracted corn starch coupled with the
integration of various synthetic polymers such as poly- є- caprolactone and polyvinyl alcohol to
increase flexibility and resistance to moisture. Mater-Bi is a bio-plastic material with similar
properties (i.e., flexibility and hydrophobicity) to conventional plastics. Due to the use of natural
materials as the constituents, products made from Mater-Bi biodegrade to carbon dioxide, water
and organic matter with no toxic residue when subjected to an environment containing bacteria
(Plastral-Bioplastics).
Suitable for injection molding and sheet film applications, Mater-Bi conforms to the
European EN 13432-2000 requirement for packaging recoverable through composting and
biodegradation (Plastral-Bioplastics). Various packaging materials for a variety of applications
made from conventional plastics can also be made from Mater-Bi in order to offer various
environmental advantages. These advantages include low environmental impact,
biodegradability, and non toxicity to marine and terrestrial wildlife. The variety of applications
that utilize Mater-Bi include (Plastral-Bioplastics):
• Agricultural mulching films
• Carrier bags
• Liners for separate organic waste collection
• Personal care products
• Catering products (cutlery, plates and cups)
• Food packaging

11
• Pet products
• Expanded packaging products
• Produce packaging (storage and distribution)
In the processing of starch and similar renewable raw materials to a bio-plastic film, a
limited amount of water is utilized coupled with the maintenance of a confined volume
throughout entire process (Plastral-Bioplastics). After heating in presence of water for a certain
time period, a homogeneous blend is produced that has the ability to be machinable in injection
molding equipments and extruders. Typical, finished products possess the ability to be (Plastral-
Bioplastics):
• used like conventional plastic materials
• colored with natural pigments
• heat laminated to paper, cardboard, cotton and other natural fibers
• sterilized by gamma rays
• glued with solvents and water-based adhesives

12
Polylactic Acid
Figure 1.2: PLA Structure
(Dugan)
Polylactic acid (PLA), produced by NatureWorks LLC, is a biodegradable aliphatic
polyester derived from 100% renewable resources such as corn and sugar beets (Drumright,
Gruber, & Henton). Since the lactides from which PLA is ultimately produced can be derived
via the fermentation of agricultural by-products, PLA is considered a sustainable alternative to
petrochemical derived products (Drumright, Gruber, & Henton). PLA has a wide range of
applications ranging from food packaging applications (microwavable trays) to biomedical
applications (drug delivery equipment). The biodegradable characteristic of PLA enables it to be
utilized in the development of bio-plastic packaging bags such as compost bags and a variety of
loose fill packaging utilized in produce packaging. Although PLA is more costly than its
petroleum based counterparts, the price has been dropping as production has increased.
The formation of Cargill Dow LLC in 1997 brought two large companies together to
focus on the production and marketing of PLA with a goal of reducing production costs and
manufacturing PLA in large volumes (Drumright, Gruber, & Henton). PLA can be
manufactured by both direct condensation of lactic acid and by the ring opening polymerization
of the cyclic lactide dimer. The ultimate molecular weight achieved by the ring opening
polymerization approach is generally limited due to difficulties in removing trace amounts of
-CH-C-O-CH-C-O-
CH 3
O CH 3
n
O

13
water in the late stages of polymerization. Immense research has been directed towards the ring
opening polymerization even through Mitsui Toatsu Chemicals has patented an azeotropic
distillation process utilizing a high boiling solvent to drive the removal of water in the direct
esterification process in order to obtain high molecular weight PLA (Drumright, Gruber, &
Henton).
PLA is suitable for a variety of applications due to an assortment of qualities such as
crease retention, crimp properties, excellent grease and oil resistance, easy low-temperature heat
sealability, and good barrier to flavors and aromas. Additionally, PLA is also suitable for
various mechanical processing applications which include sheet extrusion, film blowing, and
fiber spinning.
Due to its degradation capability, PLA is also suitable for environmental applications
such as agricultural mulch films and bags in addition to clear food containers and beverage
bottles. Such broad application has enabled PLA to be introduced into fresh-cut produce
packaging at Sam’s Club and Wal-Mart Super Centers. Since 2005, clear, thermoformed PLA
packaging containing fresh cut fruit, herbs, strawberries, and Brussels sprouts has surfaced in
grocery stores nationwide (NatureWorks-Sam's Club, 2005). Due to such introduction into the
fresh produce chain, there could be potential for savings (gasoline and money) gained from use
of a bio-based plastic made from 100% renewable natural resource rather than petroleum based
plastic packaging.

14
Eco-Flex
Ecoflex, produced by Badische Anilin-und Soda-Fabrik (BASF), is an aliphatic aromatic
copolyester that can be broken down by an array of common microorganisms in both soil and
compost (Mariniello, et al., 2007). Specifically, Ecoflex is an aliphatic aromatic copolyester
made of modular units including 1, 4-butanediol, adipic acid, and terephthalic acid (Mariniello,
et al., 2007). Novamont and BASF produce such materials by adjusting components and adding
special additives such as poly- є- caprolactone and polyvinyl alcohol.
Figure 1.3: Chemical profile of Ecoflex
(Motonori, Witt, Skupin, Beimborn, & Muller)
With modern culture emphasizing renewable raw materials, materials such as Ecoflex
have a potential to replace conventional plastics in certain applications where dependence on
fossil fuels can be reduced. Below is a list of applications suitable for Ecoflex (Motonori, Witt,
Skupin, Beimborn, & Muller):
• Compost bags
• Packaging films
• Horticultural films
• Agricultural films
• Films for household applications

15
The properties of Ecoflex are designed to meet the requirements of processability,
utilization properties, and biodegradability (Motonori, Witt, Skupin, Beimborn, & Muller). Such
requirements are achieved by the synthesis of tailor made molecular structures obtained through
modular units by which the copolyester units (1, 4-butanediol and dicarbonic acids, adipic acid
and terephthalic acid) are linked. The modular system involves the incorporation of hydrophilic
components of monomers with branching, thereby leading to chain lengthening and an increase
in the molecular weight to yield tailor made products with different material properties
(Motonori, Witt, Skupin, Beimborn, & Muller).
Mechanical properties of Ecoflex are reported to be similar to those of Low Density
Polyethylene (LDPE) (Motonori, Witt, Skupin, Beimborn, & Muller). Films are tear resistant,
flexible, and resilient to water and fluctuations in humidity. They are breathable due to their
moderate water vapor permeability (Motonori, Witt, Skupin, Beimborn, & Muller). Ecoflex can
be processed via conventional blown film lines for LDPE. The excellent draw down ability of
Ecoflex lends some appealing applications in thin film segment with the attainment of 10 µm
films. Special handling and pre-drying usually associated with thermoplastic polyesters are not
necessary for Ecoflex, thereby providing an additional advantage for the converter. Production
of pigmented resins, adjustment of water vapor barrier, antiblock slip properties, and
transparency have been developed for extruded film applications to fulfill customer needs
(Motonori, Witt, Skupin, Beimborn, & Muller).
Special additives that improve properties allow Ecoflex to be used in applications such as
compost bags, films for the agricultural sector, household films, lamination applications, and
coating materials for starch based products (Motonori, Witt, Skupin, Beimborn, & Muller). Via
integration of special additives and optimizing processing conditions, transparent films can be

16
obtained using blown film process. Such films can then be used for the wrapping of vegetables
and fruits. Other applications include the following (Motonori, Witt, Skupin, Beimborn, &
Muller):
Compost bags for organic waste
Kitchen waste can be gathered in an Ecoflex bag and composted. The requirements for
compost bags include wet strength of the film, time in which it remains stable to the organic
waste and problem free processing in a compost facility.
Mulch Films
Mulch films made from Ecoflex utilize the biodegradability characteristic. After harvest,
mulch films can be plowed together with the plant residue into the soil, where they fully degrade.
Laminated Materials
Ecoflex as part of a biodegradable laminate offers an advantage of problem free disposal
by composting. Lamination is used when there is a necessity for high wet strength and fat
resistance. Items of particular interest and relevance include packaging materials soiled with
food residues such as paper wraps, paper/plastic cups, and boxes and containers for frozen foods.

17
MECHANICAL PROPERTIES
The mechanical behavior of a polymer can be evaluated by its stress-strain characteristics
under tensile deformation (Selke, Cutler, & Hernandez, 2004). While stress is measured in force
per unit area and expressed in psi, strain is the dimensionless fractional length increase (Selke,
Cutler, & Hernandez, 2004). Illustrated in Figure 1.4 is a typical stress strain curve (figure 2)
depicting the necking and drawing regions (Roylance, 2001).
Figure 1.4: Stress Strain Curve. Necking or necking-in refers to the tendency of a material’s width to decrease during stretching (Selke, Cutler, & Hernandez, 2004) while drawing is the propagation of the necking region until spanning entire gage length of the specimen (Roylance, 2001).

18
Tensile Properties
Tensile tests are performed to measure mechanical quality of materials during evaluation
and development for a variety of applications (Davis, 2004). Tensile properties such as break
strength, yield stress, and break elongation can be measured via deformation of a sample while
monitoring stress and deformation until the sample breaks (Anker, 1996).
Break strength is the tensile load or force required to break a film (Instron: Materials Testing).
Yield stress is the stress level of highly ductile materials at which large strains take place without
further increase in stress (Davis, 2004).
Break elongation is the elongation of a specimen to the break point (Instron: Materials Testing)
Stress-Strain Definition
Engineering stress or nominal stress is defined as s = F/A0 , where F is the tensile force
and A0 is the initial cross-sectional area of the gauge section, while Engineering strain or nominal
strain, e, is defined as e = ΔL/L0, where ∆L is the change in gage length (L–Lo) and Lo is the
initial gauge length (Davis, 2004).
Standard Testing Method
The test method for evaluating tensile properties of thin plastic sheets is identified under
ASTM method D-882. ASTM D-882 describes a static weighing test method in which a
specimen is placed between two grips that are separated at a constant rate while the applied force
and amount of grip separation are recorded (ASTM, 1991).
19
PERMEATION
Some packaging materials are designed to contain a barrier to permeants such as oxygen
and water vapor in order to maintain quality and prolong shelf life of food stuffs such as cereals,
granola bars and the like. Conversely, vegetable products such as celery require a barrier that
can allow permeation of such permeants as oxygen and water vapor in order to maintain aerobic
respiration and adequate cell turgor (turgor refers to the ability of the cell to hold water and
provides the plant with a firm texture) necessary to avoid product wilting or shriveling.
Permeation is the movement of gases, vapors, or liquids across a homogeneous packaging
material (Selke, Cutler, & Hernandez, 2004). Permeation measurements for both oxygen and
water vapor exist under ASTM standard methods
Oxygen Permeability Measurement System
Oxygen permeability rate can be measured according to ASTM D 3985 with oxygen
permeability testing equipment. During operation, a partial pressure difference across a film
with respect to test gases is created without a difference in total pressure. This difference is
maintained by sweeping one side of film with a test gas while maintaining an inert gas on the
opposite side in order to diffuse the test gas (Robertson, 1993). The use of a Mocon OxTran
equipment (Modern Controls, Inc, Minneapolis Minn.) is utilized in measuring oxygen
permeability. Mocon OxTran has the capability to also measure the permeability of bottles,
pouches, tubes, etc, as well as thin sheet of films (Caner, 1997). The OxTran measuring
equipment consists of two chambers of a measuring cell between which the test film is placed. A
gas stream of known oxygen partial pressure flows through one chamber while oxygen free
carrier gas is passed though the other chamber to a Coulometric detector (Robertson, 1993). A

20
maximum of two test specimens can be installed per testing session. The OxTran operates in
conjunction with a computer connected to a disk drive, monitor and printer. After performing
the specified testing procedure, a display of the resultant transmission rates for each tested
specimen will be displayed in the computer (Caner, 1997).
Water Vapor Permeability Measurement System
One method for determining water vapor permeability (WVPR) is the gravimetric
method (ASTM, 1990). The gravimetric method involves sealing a test film in a cup partially
filled with water or saturated salt solution thereby providing an air gap beneath the film (Anker,
1996). After sealing a film specimen on the mouth of cup, the assembly is weighed and
afterwards held in an environmental chamber under a set temperature and relative humidity
(Caner, 1997).
Water vapor flux through a tested film is provided by the partial water vapor pressure
difference from the lower side of film to top side of film. Additionally, weight change of the
cup, recorded by weighing at scheduled intervals represents WVP from the cup through the film
and into the chamber (Caner, 1997). Weight loss is also plotted over time and monitored
because when steady state is achieved, the plot is a straight line. To obtain WVPR of tested film,
the slope of straight line is divided by exposed film area (ASTM, 1990).
WVTR= slope (g/hr)/area (m2) × 24hr/day = gram/m2 day (Robertson, 1993)
WVPR (Water Vapor Permeation Rate) = WVTR × film thickness

21
Water Vapor Permeability Measurement System: Permatran-6000
A more automated method that utilizes The Permatron-6000 (Modern Controls, Inc.
Mocon, Minneapolis, MN) can also measure WVPR of plastic films and permeable barriers
alike. Test cells consist of two sections separated by material to be tested. While the lower
section contains a fixed amount of moisture, the upper section is connected to a humidity sensor
that is able to determine moisture content in dry purge air (Robertson, 1993). Meanwhile, the
relative humidity of air surrounding the humidity sensor is elevated via the movement of water
vapor through the film, enabling the recording of time for a given rise in relative humidity
(Robertson, 1993).
SHELF LIFE OF FOOD PRODUCTS
Shelf life is a critical feature of any food product that conveys the quality and safety of
food over time to a consumer before purchase. In general, shelf life of a food product is the time
period, from point of purchase till point of consumption, in which a product is microbiologically
safe and maintains quality and nutritional attributes (Kilcast & Subramaniam, 2000).
Consequently, shelf life is extremely critical to both food processors and consumers.
Additionally, food safety and quality attributes are the two major components of an acceptable
shelf life. The factors that influence microbiological safety and quality in food are linked.
Therefore, in evaluating the shelf life of a food product, those quality attributes that are
satisfactory to consumers and essential to consumer acceptance are vital in assessing shelf life of
a product.

22
In assessing the shelf life of food products, the deterioration mechanism of identified
quality and safety characteristics must be understood. The end of shelf life is determined by
food safety and quality characteristics. Accordingly, during shelf life testing, mechanisms such
as moisture gain or loss, flavor/odor migration, microbiological proliferation and sensory
changes, can be monitored and used as practical basis to explain, test, and measure product shelf
life (Kilcast & Subramaniam, 2000). The general methods for shelf life testing involve sensory
analysis, instrumental analysis, chemical measurements and microbiological measurements
(Kilcast & Subramaniam, 2000). Each measurement is critical in offering information about the
stability of a food product over time. Sensory analysis systematically assesses the changes in
eating quality as a function of storage conditions and other environmental conditions for which a
product may be subjected. Living subjects were used as participants for sensory analysis in this
study. Instrumental analyses are valuable in augmenting and complementing sensory data.
Instruments such as texture analyzers and the colorimeters for measuring texture and color
properties are extremely relevant especially when striking parallels to sensory data and product
attributes over time. Additionally, reactions occurring in foods during storage that are
undetectable via sensory and instrumental analyses can be detected through chemical analysis
(Kilcast & Subramaniam, 2000). Chemical analysis can be used to identify and measure
chemical reactions occurring in food during storage and to validate or explain the degradation
mechanism that lead to quality deterioration of a product (Kilcast & Subramaniam, 2000).
Different chemical reactions occur concurrently during storage. Therefore, the major
reactions inducing quality changes such as rancidity in a product must be measured during shelf
life testing (Steele, 2004).

23
Another critical quality change that must be addressed is the microbiological stability of a
product. The two important aspects to be considered in determining the microbiological stability
of a product are microbial growth, which leads to the spoilage of a food product, and the growth
of microbial pathogens that affect product safety (Kilcast & Subramaniam, 2000). To identify
and enumerate such microbial agents responsible for compromising both product safety and
quality, time until spoilage can be determined by storing product at appropriate storage
conditions and measuring microbial load at staged intervals (Kilcast & Subramaniam, 2000).
Once a predetermined level of microbial count has been achieved, the end of shelf life is
declared. Intrinsic product factors such as water activity and pH as well as extrinsic factors such
as storage temperature and time can be used to predict shelf life of products.
Shelf life prediction of foods has been developed to meet the need of new products into
retail outlets with minimum delay (Steele, 2004). While posing a challenge for the introduction
of new longer shelf life products, knowledge of storage characteristics over intended shelf life
period is critical in predicting shelf life and avoiding problems of unacceptable delays into the
marketplace. Consequently, accelerated shelf life testing is utilized to avoid such problems once
there is a valid relationship between storage characteristics under ambient storage conditions and
the storage characteristics under accelerated condition. The principle behind accelerated shelf
life testing correlates a change in storage condition to an acceleration of the chemical or physical
processes that lead to deterioration (Kilcast & Subramaniam, 2000). Additionally, a predictive
shelf life relationship related to ambient conditions can be defined. The basis behind such
principle is the assumption that the deteriorative processes limiting shelf life remains the same
under both ambient and accelerated conditions. Nevertheless, if the above assumption is not
correct and another deteriorative process dominates at the accelerated conditions, then a valid
24
relationship between ambient and accelerated conditions is not attainable (Kilcast &
Subramaniam, 2000). Some possible deteriorative processes that can dominate include
denaturation of proteins, increased water activity, crystallization of amorphous carbohydrates
and increased water activity (Steele, 2004).
SHELF LIFE ASSESSMENT OF FRESH PRODUCE
For fresh produce, shelf life is defined as the time period within which the product retains
acceptable quality (with respect to appearance, texture, and flavor/aroma) for sale to the
consumer (Kilcast & Subramaniam, 2000). Shelf life knowledge of produce is critical to
individuals who manage fresh produce supply chains from the grower to the retailer. Certain
produce (out of season, highly perishable or short shelf life) may require rapid transportation via
air shipment rather than by land or sea. Conversely, others with a longer shelf life can be stored
and released according to market demand. Consequently, shelf life measurement of an
assortment of fresh produce must be conducted in order to recognize and be forewarned of
quality deterioration that may occur during shipment (Kilcast & Subramaniam, 2000).
In shelf life measurement of fresh produce, product samples are removed from the
packing line and placed in shelf life storage rooms at a temperature that reflects retail conditions.
At those conditions, shelf life tests are conducted at predetermined intervals that assess
appearance, texture, flavor/aroma, and microbiological proliferation (Kilcast & Subramaniam,
2000). Appearance is analyzed for uniformity in size, shape and color. Visual quality and
acceptable appearance include absence of defects in shape and skin of products (Lamikanra,
Imam, & Ukuku, 2005). Visually, an indication of textural quality can also be assessed. For

25
instance wilting and shriveling are appearance indicators but are also indicators of deteriorating
textural quality. Crispness and firmness are desirable traits in vegetable crops such as celery.
Such traits are easily detected via sensory or organoleptic studies that also assess flavor and
aroma. Sensory analysis over predetermined intervals assesses key taste components in fresh
produce such as sweetness, acidity, or astringency. Additionally, they also evaluate key textural
attributes of crispness and firmness over time as an indication of deteriorating quality. Texture
analyzers provide instrumental analysis and solid data over time that can support or complement
prior texture analysis conducted via a sensory method.
Finally, microbiological tests will assess the effect of microorganisms on quality and
safety of products. Fresh produce are not considered high risk products with regard to food
safety because they normally become completely undesirable for consumption prior to complete
proliferation by hazardous microorganisms (Kilcast & Subramaniam, 2000).
In addition to real time shelf life testing, Accelerated Shelf Life Testing (ASLT) may be
conducted at elevated temperatures to reveal any possible development of pathogenic rots.
Subsequently, produce will be subjected to quality assessment (outlined previously) and changes
over a predetermined time period for a particular product. Due to different quality and shelf life
requirements by individual retailers, samples are assessed from each separate product line.
These shelf life tests are designed to raise awareness of potential quality problems that will
prompt action to address the issue. Such testing may reveal patterns in quality which can be used
in decisions such as when to change the supply source (Kilcast & Subramaniam, 2000). While
shelf life predictions can be critical in produce supply chains especially when there are time
constraints, accurate shelf life prediction for fresh produce is not feasible due to inherent

26
variability in all quality attributes of fruits and vegetables that are used to determine shelf life
(Kilcast & Subramaniam, 2000).
SENSORY ANALYSIS OF FRESH PRODUCE
In measuring shelf life, the underlying assumption about product sensory attributes and
eating quality is that a certain level of deterioration occurs over time. Consequently,
measurement of changes in eating quality and sensory attributes requires sensory evaluation
techniques. Sensory evaluation techniques sometimes involve trained panelists issuing
quantitative quality ranks on various quality attributes. Alternatively, untrained panelists can
also assess quality attributes on general categories such as overall liking or preference
surrounding a sensory quality profile (Kilcast & Subramaniam, 2000). Before sensory analysis,
microbiological testing must be completed to assure the safety of individual panelists. There
should be an identified benchmark at which bacterial levels must not exceed before conducting
sensory analysis. For instance, for minimally fresh processed (immersion in NaOCL water
solution) celery sticks, the maximum aerobic bacteria limit is 107 CFU g -1 (Colony Forming
Units) (Gomez & Artes, 2005). If microbiological analysis exceeds 107 CFU g -1 prior to a
scheduled sensory evaluation, considerations should be made for sensory evaluation to be
restricted to appearance and odor evaluation.
Sensory evaluation is most effective when a selected panel is utilized in conducting
sensory evaluation of a product. Panelists can be trained to detect, identify and assess key
quality attributes that are vital to product quality. Such panelists, also referred to as human
subjects are generally recruited and screened (Kilcast & Subramaniam, 2000). Beforehand, the

27
type and number of subjects are determined based on availability of panelists, time allocated for
training, and sensorial complexity of food product subject to analysis (Kilcast & Subramaniam,
2000). In addition, the type of test performed can dictate the type of statistical analysis required.
For example, if only two samples are tested, a simple t-test can suffice but if there are more than
two samples are tested and multiple attributes are measured by the panelists, more sophisticated
statistical analysis is needed. These can include multivariate analysis and response surface
methodology.
Panelists can be recruited from within a company, university department, or local
population. Also, dedicated part time panelists can be recruited from a pool of individuals in a
workplace environment. Once panelists are selected, they must be screened for familiarity of
product as well as identification and detection of key sensory attributes. Screening tests are
utilized to verify that sensory impairment is absent, establish sensitivity to appropriate stimuli,
and evaluate ability to verbalize and communicate responses (Kilcast & Subramaniam, 2000).
These screening tests depend mainly on defined objectives of sensory testing and typically
consist of the following: (Kilcast & Subramaniam, 2000)
• Ability to detect and describe the four basic tastes of sweet, sour, salt and bitter.
However, additional detection may be extended to include metallic, and astringent.
• Ability to detect and recognize common odorants coupled with odor characteristics of
product range of interest.
• Ability to rank increasing intensities of a specific stimulus correctly. For instance,
increasing sweetness or increasing firmness.
• Ability to characterize textural terms of relevant food types.
• Tests conducted using Ishihara charts to evaluate the absence of color vision deficiencies.

28
Acceptable performance across the entire range of tests merits selection of suitable
panelists rather than excellent performance in some areas of test and poor performance in other
areas. Nevertheless, if a sensory panel is to be utilized for a specific purpose (ex. detection of a
single texture attribute) then screening tests relevant to that specific purpose can be weighted
appropriately (Kilcast & Subramaniam, 2000). After panelists are screened, training is
conducted to immerse panelists with specific product and product attributes of interest.
Specifically, targeted training is conducted using the product(s) of interest with major emphasis
directed towards specific tests to be used in practice. During practice or training, close
monitoring of panel performance is essential to a successful completion of training program.
Any noticed drift in panelist performance must be corrected by retraining procedures (Kilcast &
Subramaniam, 2000).
After panelists have been selected, screened and trained, they are equipped for
conducting sensory analyses according to specific trained method. There are a variety of
methods utilized in conducting sensory evaluation. Many available test methodologies fall into
two main classes. They are analytical tests and hedonic/affective tests. Analytical tests are used
to measure sensory characteristics of products by providing answers to questions such as is there
a difference, what is the nature of the difference(s), and how big is/are the differences(s). (Kilcast
& Subramaniam, 2000) Hedonic/affective tests are used to measure consumer response to
sensory characteristics of relevant product(s) by providing answers to the questions; which
product is preferred and how much is it liked. Analytical tests are further classified into
difference and quantitative tests. Difference tests include paired comparison, duo-trio, triangle
and R-index, while quantitative tests include simple descriptive, profiling, and time-intensity.

29
Hedonic tests include preference acceptability and relative to ideal (Kilcast & Subramaniam,
2000).
For the current research study involving shelf life of celery in bio-based materials, the
sensory test methodology utilized was a 15 cm unstructured scale. An unstructured scale
requires panelists to be familiar with the range of attributes under study. Samples are presented
and rated according to attributes listed on sensory ballot sheet. The 15 cm unstructured scale is a
line anchored at both ends by ½ in. marks representing the terms that define and limit a specific
attribute (Robertson, 1993). For instance, the texture attribute of a celery product can be limited
by the anchor words, rubbery and crisp. In ranking that specific attribute for celery, the panelist
simply marks across the line at the point which represents what is perceived. That specific point
as a measurement of panelist perception is a data point which is measured as the distance from
the left anchor mark to the panelist’s mark. Other data points are collected in an identical
manner for additional attributes and analyzed statistically. Analyses that can be conducted
include Analysis of Variance, t-tests, and multiple comparison tests to identify significant
differences in attributes within samples over time.

30
CELERY TEXTURAL ATTRIBUTES AND MEASUREMENT
Crisp and firm tissues are desirable textural qualities in vegetable crops such as celery.
While some textural components can be evaluated visually via indications of wilting or
shriveling, a plethora of other textural components for a wide array of produce require
mechanical measurements to measure textural properties. Textural testing equipment, known by
their manufacturer’s names, such as Instron and Texture Technologies, are commonly used for
evaluating various textural components of plant or vegetable tissues which change over time
during storage or shelf life study. For instance, the softening of a product over time during a
storage study can be detected mechanically via a texture measurement system equipped with
artificial jaws attached to force gauges that can simulate bite action and ultimately evaluate
textural qualities such as crispness, firmness, or softness (Kilcast & Subramaniam, 2000).
Textural attributes of celery must initially be identified prior to texture analysis in order
to select appropriate probes that can accurately assess specific textural attributes relevant to a
product. For instance, a good quality celery product exhibits turgor pressure, characterized by
the rigidity of cell caused by outward pressure of water (Vina & Chaves, 2003). Consequently,
the key textural attributes of celery to assess during texture analysis must encompass attributes
that emphasize textural strength of the celery product. Moreover, a marker of a poor textural
quality celery product indicates a product that is brittle and tough within interstitial fibers
(Lamikanra, Imam, & Ukuku, 2005). Therefore, a major textural attribute such as firmness must
be assessed as an effective indicator of textural quality.

31
Firmness, a good indicator of textural quality can be measured instrumentally with a
texture analyzer such as a TA-XT2 plus texture analyzer fitted with a specific probe that makes
contact with product during analysis in order to provide firmness data over time (Prakash,
Inthajak, Huibregtse, Caporaso, & Foley, 2000). Additional texture analysis with a stainless
steel probe can also measure the maximum shear force (MSF) applied before breaking (Rizzo &
Muratore, 2009). Prior research involving texture of celery have utilized an Instron
electromechanical testing system fitted with a Warner-Bratzler knife to measure the maximum
shear force (MSF) in Newtons (N) applied before breaking. A 500 N transductor employed with
a knife at a displacement rate of 10 mm per minute was used to measure the MSF on 20 different
stalks that were cut transversally between ribs of the collenchyma (outside layer) and parallel to
the fibers (Vina & Chaves, 2003). The complex and diverse structure of celery pertaining to
ribs, curvature, variation in stalks, varying sizes, etc presents difficulties in arriving at a uniform
textural analysis. Nevertheless, researchers cited in this study have utilized an approach of
employing probes that make parallel contact between the ribs and penetrate downwards until
completely puncturing samples.
Further textural analysis pertaining to shelf life studies have been conducted by
researchers studying the effect of various factors on celery shelf life and quality. An analysis on
texture of celery was performed by Prakash et.al in (2000) to measure firmness of gamma
irradiated celery samples in a research study aimed at extending shelf life of precut celery. The
firmness of treated samples were measured at room temperature by a puncture test using a Stable
Micro Systems Texture Analyzer (model TA-XT2, Texture Technology Corp. Scarsdale, NY.,
U.S.A.) equipped with a 2 mm diameter stainless steel cylinder probe (TA P/2). The probe was
set at 30 mm from the bottom of the plate and moved downward at a speed of 5 mm/s, stopping

32
upon sensing samples, followed by further descending at 3 mm/s until completely puncturing
samples (Prakash, Inthajak, Huibregtse, Caporaso, & Foley, 2000).
Firmness dominates as the key textural attribute to measure while utilizing probes such as
the Warner-Bratzler. Besides the Warner-Bratzler knife probe, other probes have also been
utilized such as a stainless steel cylinder probe, and a knife blade. Such probes are set at a
specific distance from the bottom of the texture analyzer base and triggered downward at a
constant speed to make contact with sample followed by further decrease at constant rate until
completely puncturing samples. Afterwards, firmness is reported as the maximum force in
grams and registered on a spreadsheet provided by instrument software (Seow, NG, & Bourne,
1992).
Other textural attributes measured in this study include toughness and stiffness. Both
attributes are related to the structure and textural properties of fresh produce that is maintained
by adequate cell turgor. Cell turgor is defined as the rigidity of cell wall caused by outward
pressure of water content of each cell on membrane Kilcast, D., & Subramaniam, P. (2000).
Generally, turgor pressure maintains rigidity of cells and nearby tissues while the stiffness and
toughness assessments serve as complimentary mechanical measurements of turgidity. In
deriving firmness, the incisor blade (probe) mounted onto the texture analyzer measures the peak
force required for the blade to puncture a sample, while stiffness is derived by measurement of
how fast the force (per distance) increases as probe penetrates sample. In other words, as a
sample is masticated (chewed) by the teeth, the force required to masticate increases along with
stiffness. Finally, the textural attribute of toughness is derived by measuring the energy required
to masticate a sample.

33
COLOR OF VEGETABLE PRODUCTS
Color is a surface and aesthetic indicator of vegetable quality (Bartz & Brecht, 2003). A
major feature in vegetable appearance, color can also function as a measure of physiological
maturity, ripeness, and also an indicator of physiological, mechanical, or pathological injury
(Bartz & Brecht, 2003). Alternatively, color can be a misleading gauge of vegetable quality if
appearance is utilized as the sole marker of vegetable quality at the expense of other quality
attributes such as flavor and texture. Nevertheless, color is a primary means of evaluating
vegetable quality within the postharvest handling chain and in a consumer’s decision to purchase
a vegetable product. Vegetable products that look unappealing are highly unlikely to be
purchased and consumed. Thus, method(s) of accurately measuring vegetable color in addition
to understanding the effect of color on consumer acceptability is important in maintaining and
enhancing vegetable quality and marketability (Bartz & Brecht, 2003).
Vegetable color can be quantified by colorimetry. Colorimetry is an instrumental
technique that describes color mathematically in terms of human perception (Hunter and Harold;
1987 Hutchings, 1994; Shewfelt, 1993). Figure 1.5 identifies the most extensively used color
scale based on the CIE color solid (L*a*b*). The color solid is based on the color opponent
theory of expressing color of objects in terms of red-green character and blue-yellow character
(Bartz & Brecht, 2003). Therefore, color that is more red then green is represented by “+a*,”
while more green than red is represented by “-a*.” Additionally, color that is more yellow than
blue is represented by “+b*,” and more blue than yellow is represented by “-b* ” (Bartz &
Brecht, 2003). The L* color value of the color scale represents lightness in which 0 corresponds
to black and 100 corresponds to white (Hunter, 1987).

34
Figure 1.5: L* a* b* color scale
(Cooksey, 2007)
Prior research involving shelf life of celery has utilized the above color scale and values
as a metric for measuring color quality over time. Along with the above color scale, a Hunter
Lab Colorimeter (Model D25 PC2 Colorimeter, Reston, VA., U.S.A.) calibrated with black and
white standard color tiles have been used to obtain color measurements. Results are recorded
using CIE L, a, b color values (Kovacs, Horvath, & Bnecze-Bocs, 1977). Additionally, total
color difference (ΔE) between any two time intervals were determined by measurement of
individual points and calculated by equation 4 below:
∆E = [(L- L0) 2 + (a-a0)
2 + (b-b0) 2]1/2
(Prakash, Inthajak, Huibregtse, Caporaso, & Foley, 2000)
In the above formula, L0, a0 and b0 represent color readings on the first day.
High quality celery consists of petioles (stalks) that are thick, compact, straight, and light
green in color (Suslow & Cantwell, 1998). Nevertheless, there are variations in celery color
within the outer middle and inner stalks. The middle and inner stalks tend to exhibit lighter

35
shades of greenness than the outer stalks. Due to such disparity in shades of greenness from
outer to inner stalks, measurements can be taken from outer, middle, and inner stalks in obtaining
color values that are a fair representation of an individual celery quality. Rizzo et al obtained
surface color of celery with a hand held colorimeter (NR-3000, Nippon Denshoku Ind. Co., Ltd.,
Japan) calibrated with a standard white tile with the following parameters: X=83.47, Y=84.43,
Z=95.16. Using the ∆E formula mentioned above, L* a* b* data were collected on the internal,
medium, and external stalks (Rizzo & Muratore, 2009).
36
CHAPTER 3
MATERIALS AND METHODS
Celery arrival and preparation
After harvest at marketable ripeness, 14-16 inches in stalk length (Luo, Suslow, &
Cantwell, 2002) in Uma, Arizona, celery was brought to a packing house within close proximity
to harvest fields. In the packing house, celery was pre-cooled via hydro-cooling to
approximately 0°C followed by packaging into polyethylene sleeves (Figure 1.6) and boxed for
transportation in refrigerated (1°C) trucks. The refrigerated trucks transported (4-5 days) sleeved
celery in corrugated cases to a local warehouse in Greenville, South Carolina. At the warehouse,
14 cases of celery, 210 individual bunches (as ordered for research) were offloaded to smaller
refrigerated trucks and transported (40 minutes) to Clemson University Packaging Science
Department where the shelf life research was undertaken.
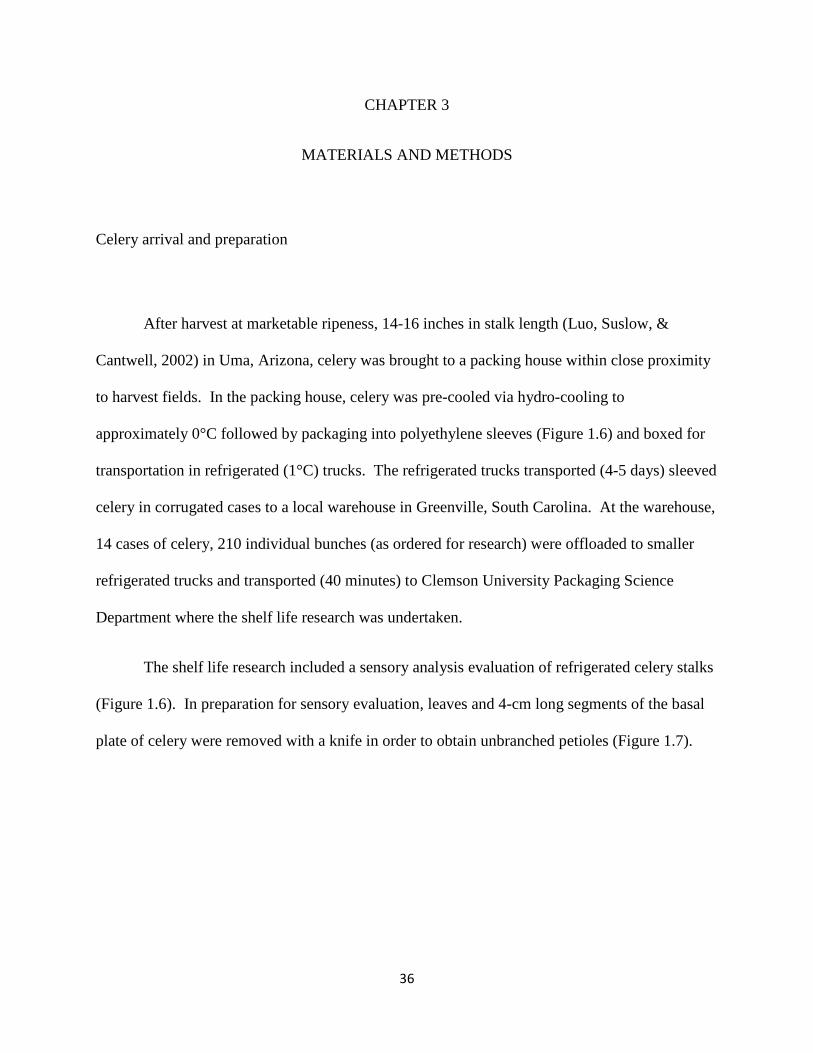
The shelf life research included a sensory analysis evaluation of refrigerated celery stalks
(Figure 1.6). In preparation for sensory evaluation, leaves and 4-cm long segments of the basal
plate of celery were removed with a knife in order to obtain unbranched petioles (Figure 1.7).

37
Figure 1.6: Sleeved Uncut Celery Stalk (Tanimura & Antle, 2007)
Figure 1.7: Cut Celery Stalk (Tanimura & Antle, 2007)
Petioles were washed with tap water while brushing thoroughly to remove any dirt or
debris. Afterwards, they were allowed to dry under room conditions followed by sorting for
uniformity and freedom of defects. Visual quality attributes were examined for appearance and
microbial spoilage. Celery sticks with extreme defects were immediately discarded. A defected
celery stick was one containing enough defects to prevent attaining of at least four 4 cm cut

38
samples. After being completely dried, samples were prepared for sensory evaluation by cutting
with a sharp clean knife into 4-cm long strips.
PACKAGING MATERIALS
Celery stalks were packaged into four different materials. The control material was Low
Density Polyethylene (LDPE) which contained perforations and was provided by the celery
supplier, Tanimura and Antle. The remaining three variable materials were un-perforated and
were supplied by Innovia Films Ltd. The variable materials arrived in rolls and were cut into
individual sheets that matched the dimensions of the control material, 2 × (42 × 17 cm). After
being cut, they were folded over length wise to match the exact dimensions (42 × 17 cm) of the
control material followed by low temperature sealing (~ 5 seconds) on sides and bottom with an
Onor Pack hand operated heat sealer (Model FS-200).
All four materials, along with their respective thicknesses, permeabilities, and
dimensions are listed in table 1.1 below. Additional information contained in specification
sheets can be found in the appendix.

39
Table 1.1: Material OPR, WVPR, Thickness & Dimensions
Material Thickness Measurement
Material thickness was measured with a micrometer (L.S. Starrett Co., of Athol MA,
USA) to the nearest 0.001 mm at 3 random positions on films.
Material Analysis
Permeation
Oxygen permeation and water vapor permeation rates of films were determined using
ASTM method D-3985 and F-1249 for oxygen and water respectively. Testing conditions were
at 23°C and 100%RH. All samples were masked with aluminum in order to avoid failures
during testing. Sample sizes were cut at 100m2 and 50 m2 for oxygen and water vapor
respectively.
OPR
LDPE Ecoflex Mater-Bi PLA
9500 2793 2673 494
WVPR
LDPE Ecoflex Mater-Bi PLA
24 995 647 211
Thickness (µm) LDPE Ecoflex Mater-Bi PLA
1.24 1.07 1.26 1.06
Dimensions (cm) LDPE Ecoflex Mater-Bi PLA
42×17 42×17 42×17 42×17
OPR: cc· mil/ (m2 · day) 754.17 mmHg @ 23.0°C
WVPR: g · mil/ (m2 · day) 754.17 mmHg @ 23.0°C

40
Oxygen Permeability Rate (OPR)
Oxygen permeability was determined according to ASTM Standard Method D 3985 on
each material at weeks 0, 6 and 12. Oxygen permeability was measured by using a Mocon Ox-
Tran 1000 Permeability Tester (Modern Control Inc, Minneapolis, MN). For each material,
duplicates samples were masked and mounted onto the Ox-Tran followed by conditioning for
12-18 hours with nitrogen gas. Testing was performed at 23°C and 100%RH. To calculate OPR
of tested specimen, derived OPR was multiplied by thickness of tested film.
Water Vapor Permeability Rate (WVPR)
WVP of duplicate film samples (also masked) were determined at 23°C and 100% RH.
Films were tested using The Permatran-3/31 (Modern Controls, Inc. Mocon, Minneapolis, MN)
according to ASTM Standard Method F-1249 (ASTM, 1990). Test cells were mounted by
masked samples of each material. One cell contains a fixed amount of moisture while the other
is connected to a humidity sensor that is able to determine moisture content in dry purge air
(Robertson, 1993). Meanwhile, the relative humidity of air surrounding the humidity sensor is
elevated via the movement of water vapor through the film, enabling the recording of time for a
given rise in relative humidity (Robertson, 1993).

41
Tensile Tests
Tensile tests were conducted according to ASTM Standard Method D-882 for Tensile Properties
of Thin Plastic Sheeting (ASTM, 1991) on an Instron Universal Testing Machine (Model 4201,
Instron Corp., Canton, MA, USA). Three samples of each film type were cut to 4 inches in
length before testing. Each strip of film was placed between pneumatic jaws of the Instron that
was preset to 51 mm (ASTM, 1991). Film strips were stretched at a rate of 30 mm per minute
until sample failure. Measurements of load (N) and deformation (mm) were used to calculate
tensile strength and elongation to break. Tensile strength was calculated by dividing maximum
load placed on sample by the cross-sectional area while elongation to break was calculated by
dividing deformation of sample at maximum load by the original gauge length (ASTM, 1991).
Relevant equations can be viewed in the literature review section.
SENSORY EVALUATION OF CELERY
Sensory evaluation was conducted with 15 panelists familiar with the product. Panelists
participated in two 30 minute training sessions to identify and evaluate key celery sensory
characteristics of color, off aroma, firmness, and celery flavor (Prakash, Inthajak, Huibregtse,
Caporaso, & Foley, 2000). During training, panelists indentified celery attributes relating to
aroma, appearance, flavor and texture. Their identification of those attributes were tailored to
depict anchor words on opposite ends of 15 cm unstructured scale used for sensory scoring. For

42
instance, after panelists identified firmness as a key textural attribute, anchor words tailored to
reflect firmness were depicted on sensory scoring sheet as 0 = rubbery 15= crisp.
A 15 cm unstructured scale was used to rank the following attributes: aroma, appearance,
flavor, liking of flavor, texture, overall liking and sample rank. The lower end of scale
corresponded to undesirable quality descriptors while higher end corresponded to desirable
quality descriptors. For instance, the appearance attribute contains anchor descriptors of old and
fresh, equivalent to anchors 0 and 15 respectively. Celery samples (4 cm length) were given to
panelists in cups coded with 3 digit random numbers. Samples were evaluated biweekly (week
0, 2, 4, 6, and 8) for a total of 8 weeks during storage. After week 8, microbial levels (aerobic
bacteria) surpassed 7 Log CFU/g, rendering samples unsafe for consumption.
COLOR ANALYSIS OF CELERY
Color analysis was determined using a Konica Minolta CR 300 colorimeter with an 8 mm
diameter measuring area and calibrated (L* 95.52, a* 0.06, b* 1.81) with a standard white plate.
Measurements were conducted by applying the colorimeter head on the outer surface of celery
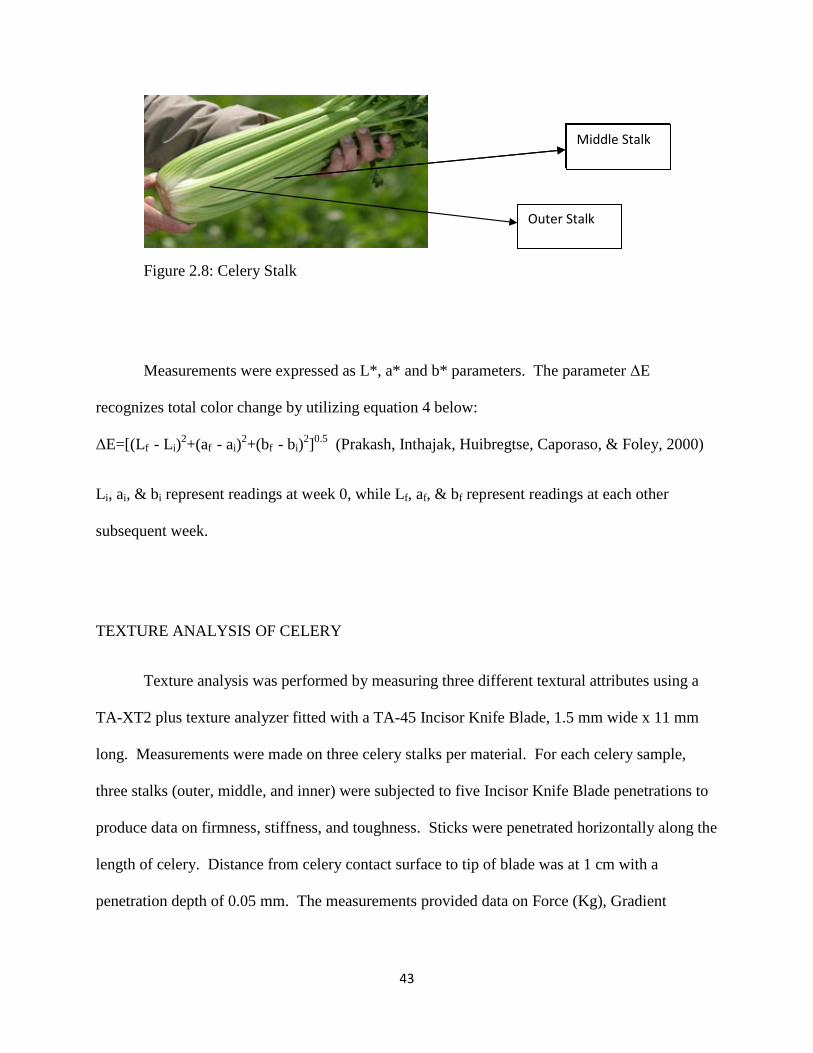
sticks to obtain the L*, a* and b* values of the CIE scale. Measurements were taken on three
different spots on the outer surface of celery stalks. For each sample, three stalks, as depicted in
Figure 2.8, (inner, middle and outer) were used to obtain color measurements.
43
Figure 2.8: Celery Stalk
Measurements were expressed as L*, a* and b* parameters. The parameter ∆E
recognizes total color change by utilizing equation 4 below:
∆E=[(Lf - Li)2+(af - ai)
2+(bf - bi)2]0.5 (Prakash, Inthajak, Huibregtse, Caporaso, & Foley, 2000)
Li, ai, & bi represent readings at week 0, while Lf, af, & bf represent readings at each other
subsequent week.
TEXTURE ANALYSIS OF CELERY
Texture analysis was performed by measuring three different textural attributes using a
TA-XT2 plus texture analyzer fitted with a TA-45 Incisor Knife Blade, 1.5 mm wide x 11 mm
long. Measurements were made on three celery stalks per material. For each celery sample,
three stalks (outer, middle, and inner) were subjected to five Incisor Knife Blade penetrations to
produce data on firmness, stiffness, and toughness. Sticks were penetrated horizontally along the
length of celery. Distance from celery contact surface to tip of blade was at 1 cm with a
penetration depth of 0.05 mm. The measurements provided data on Force (Kg), Gradient
Outer Stalk
Middle Stalk Middle Stalk

44
(Kg/sec), and Area (Kg·sec), which corresponds to textural attributes of firmness, stiffness and
toughness respectively.
WEIGHT LOSS OF CELERY
Weight measurements were conducted with a standard balance (Scout Pro. Model SP4001).
Weight loss was determined by weighing the same samples designated specifically for the
weight analysis category. The same set of samples per material were weighed during each week
using a simple formula, % weight loss = {(I-F)/I} *100 , and results were expressed as a
percentage. I and F denotes initial and final respectively. Initial weight always denotes weight
at week 0.
MICROBIAL QUALITY OF CELERY
Total aerobic plate counts were (triplicate plates) used to analyze microbial quality of
celery samples 48 hrs before sensory evaluation. An 11 gram sample from celery packaged in
each material was homogenized for 2 minutes in 99mL of sterile peptone water in a sterile
stomacher bag with a stomacher (Seward Stomacher 400 Circulator). Plate count agar was used
for bacteria enumeration after 48 hrs in incubation at 38°C. Microbial counts were expressed as
log10 CFU g-1. Samples were analyzed at week 0, 2, 4, 6, and 8. The maximum aerobic bacteria
limit is107 CFU g -1 (Gomez & Artes, 2005). After week 8, microbial levels (aerobic bacteria)
surpassed 7 Log CFU g-1 and microbial analysis as well as sensory evaluation was discontinued.
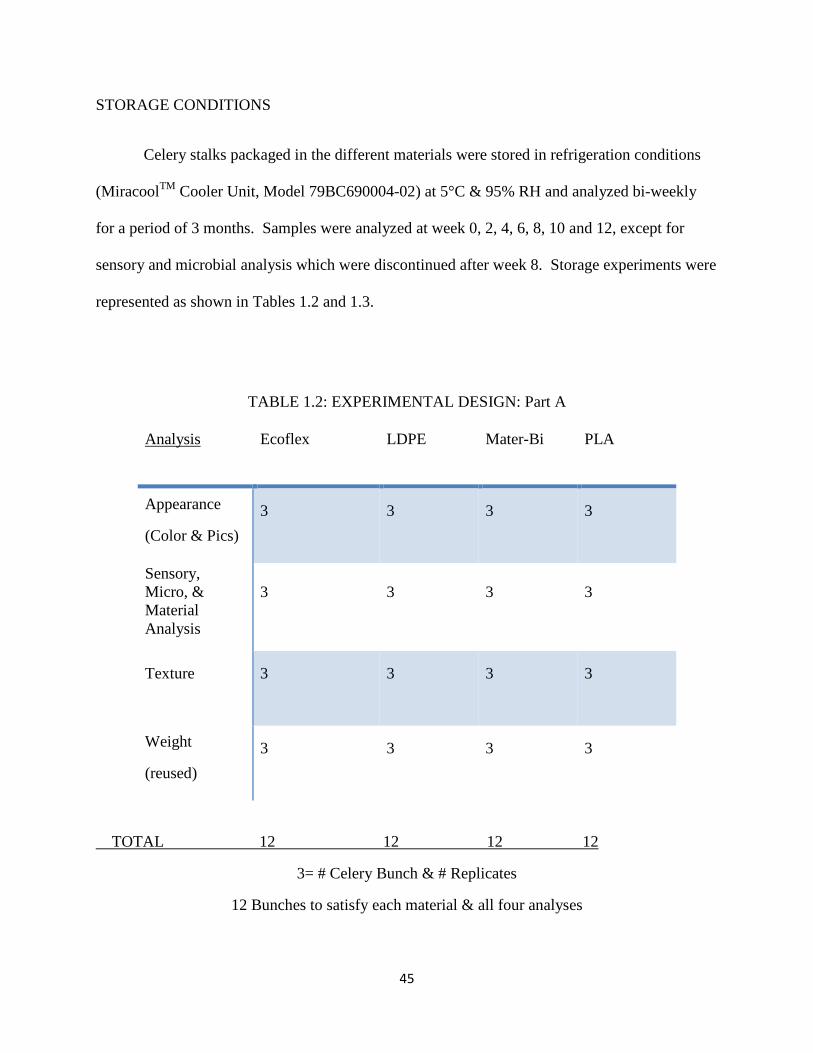
45
STORAGE CONDITIONS
Celery stalks packaged in the different materials were stored in refrigeration conditions
(MiracoolTM Cooler Unit, Model 79BC690004-02) at 5°C & 95% RH and analyzed bi-weekly
for a period of 3 months. Samples were analyzed at week 0, 2, 4, 6, 8, 10 and 12, except for
sensory and microbial analysis which were discontinued after week 8. Storage experiments were
represented as shown in Tables 1.2 and 1.3.
TABLE 1.2: EXPERIMENTAL DESIGN: Part A
Analysis Ecoflex LDPE Mater-Bi PLA
Appearance
(Color & Pics)
3 3 3 3
Sensory, Micro, & Material Analysis
3 3 3 3
Texture 3 3 3 3
Weight
(reused)
3 3 3 3
TOTAL 12 12 12 12
3= # Celery Bunch & # Replicates
12 Bunches to satisfy each material & all four analyses

46
TABLE 1.3: EXPERIMENTAL DESIGN: Part B
# Sleeves (bags) per Material Week
48 0
36 2
36 4
36 6
36 8
36 10
36 12
240: Total # Sleeves
*After week 0, the 12 celery stalks for weight analysis were reused for remainder of study. Therefore, only 36 (48-12) were used for other analyses.

47
STATISTICAL ANALYSIS
Statistical analysis was conducted based on time (week) and material. Data were treated
by Analysis of Variance (ANOVA). Comparison of means pertaining to all analyses conducted
within weeks were subjected to Fisher’s Least Significant Difference (LSD) test at a significance
level p = 0.05.

48
CHAPTER 4
RESULTS & DISCUSSION
The objective of this research was to determine if biopolymer films could be used to package
fresh celery and if they were comparable to the currently used packaging material (LDPE).
Chapter 4 provides results of the objective and subjective testing of celery as well as properties
of the packaging materials during the 12 week storage period.
Table 4.1: Weight loss (%) of celery during refrigerated storage
*Within columns, materials with same letter are not significantly different
Material week 0 week 2 week 4 week 6 week 8 week 10 week 12 Overall
Control 0.00 a 4.25 a 8.72 a 13.7 b 18.7 b 23.3 a 26.5 a 13.6 b
Ecoflex 0.00 a 4.0 a 6.5 a 9.2 a 15.3 a 20.1 a 24.0 a 11.3 a,b
Mater-Bi 0.00 a 3.0 a 5.7 a 9.0 a 12.0 a 16.0 b 19.6 b 9.3 a
PLA 0.00 a 2.81 a 5.7 a 9.0 a 13.6 a 20.7 a 23.6 a 10.8 a

49
Fig 4.1 % Weight loss (%) of celery during refrigerated storage
Celery contained within all materials experienced a decrease in weight over time. The
Mater-Bi material experienced the least decrease in weight while the control material
experienced the greatest weight loss. Overall, both materials were significantly different (p<0.
05) from each other, while Mater-Bi, PLA and Ecoflex were not (p>0.05). Weight loss was
statistically different between materials beginning in week 6. Celery in the control material lost
significantly more weight than celery contained in other materials between weeks 6-8. Over
entire 12 week period, Tukey’s Test (p>0.05) identified Mater-Bi material as significantly
different from the control in experiencing less percent weight loss.
Packaged celery in the control film may have lost more weight than celery packaged in
other films because it contained perforations while the other films did not. In comparing
performance with regard to weight loss amongst the biopolymers, celery packaged in the Mater-
Bi material experienced the least percent weight loss. Mater-Bi was the thickest of all the

50
biopolymer materials and also contained some hydrophobic polymers blended with corn starch
during manufacturing. These characteristics may have improved moisture retention and
mechanical properties of Mater-Bi, thereby rendering it as the best performer of bio-based
materials in this regard.
Rizzo and colleagues utilized a polyolefin material with an antifogging additive (AF) and
micro perforated polypropylene (MP) in studying the effects of packaging on the shelf life of
fresh celery. The AF was a non-perforated co-extruded polyethylene and polypropylene film
treated with an antifogging additive, while the MP was a co-extruded polypropylene with a
piercing density of 7 holes/cm2. Celery was stored at 4°C, 90% RH for 35 days. A set of
unpackaged celery was stored as a control. As expected, weight loss increased during storage for
both plastic films. In the MP film, weight loss ranged from 10.7% at day 6 to 33.6% at day 31,
which was similar to the unpackaged control. Weight loss of celery in the AF package was
lower than 3 % over the 31 day period while the control (unpackaged) had 27% weight loss over
20 day period. The antifogging layer was critical in preventing accumulation of condensate on
film surface that could enhance moisture loss and reduce shelf life. By day 17, unpackaged
celery significantly lost more weight than MP film due to an absence of a film to entrap moisture
or prevent excess moisture loss during transpiration.
At week 2, celery packaged in the AF material was significantly lowest in weight loss at
0.83% compared to celery packaged in the MP film (19.66 %) and unpackaged celery as control
(24.24 %). However, at week 2 in current study, celery packaged in PLA material was lowest in
weight loss at 2.8% but was not significantly different than weight loss of celery packaged in
other materials. In a two week weight loss comparison between both studies, the AF material
utilized by Rizzo and colleagues demonstrated better moisture retention than materials utilized in

51
current study. However, materials utilized in current study performed better at moisture
retention during a two week period comparison to the MP material utilized by Rizzo and
colleagues.

52
Color
Table 4.2 ΔE Analysis: Outer Stalks
Material week 0-2 week 0-4 week 0-6 week 0-8 week 0-10 week 0-12
Control 2.75 8.75 12.08 17.84 17.61 19.36
Ecoflex 5.36 12.31 18.84 16.54 20.75 23.88
Mater-Bi 2.49 5.56 13.39 13.46 17.45 21.95
PLA 2.10 3.24 15.41 15.80 17.23 18.49
*Within columns, materials with same letter are not significantly different
*ΔE is calculated through a formula and takes into account week 0 and each other subsequent week. Consequently, one data point is obtained and statistical analysis cannot be achieved.
Figure 4.2: ΔE Outer Stalks

53
Celery packaged within all materials experienced color change throughout the 12 weeks
of storage. The celery packaged in Ecoflex material appears to experience a greater degree in
color change from weeks 0-6 but eventually levels off along with other materials thereafter.
However, since statistical analysis could not be performed, it cannot be determined if these
differences are significant.
Over time, the Ecoflex films under storage began to disintegrate. Consequently, the
Ecoflex material was expected to perform poorly in comparison to other materials. However, no
obvious impact on the color attribute was noticed.

54
ΔE Analysis: Middle Stalks
Table 4.3 ΔE Analysis: Middle Stalks
*Within columns, materials with same letter are not significantly different
Figure 4.3: ΔE Middle Stalks
Material week 0-2 week 0-4 week 0-6 week 0-8 week 0-10 week 0-12
Control 8.92 11.40 13.58 14.07 16.26 17.93
Ecoflex 2.33 5.59 9.02 7.95 13.12 16.11
Mater-Bi 5.12 3.29 7.10 10.33 12.17 13.54
PLA 4.37 1.44 9.90 8.80 14.05 14.09

55
The Control material experienced a greater degree in color change over the 12 weeks of
storage. The ∆E analysis for the outer stalks depicted Ecoflex showing a greater change in ∆E
while control was showing a greater change in ∆E for the middle stalks. Such disparity in ∆E
between outer and middle stalks is possibly due to inherent variability in celery product.

56
ΔE Analysis: Inner Stalks
Table 4.4 ΔE Analysis: Inner Stalks
Material week 0-2 week 0-4 week 0-6 week 0-8 week 0-10 week 0-12
Control 4.46 4.86 12.13 11.36 10.96 13.14
Ecoflex 7.30 5.86 6.87 7.64 12.49 11.19
Mater-Bi 3.74 2.06 1.29 6.93 6.08 8.02
PLA 3.74 1.07 4.73 5.27 7.78 8.34
*Within columns, materials with same letter are not significantly different
Figure 4.4: ΔE Inner Stalks

57
As expected, the inner stalks are lighter in color compared to outer stalks and do not
reach higher ∆E values as the outer and middle stalks. The same variability and similarity in
trend was also observed for the middle stalks.

58
L* Color Analysis: Outer Stalks
Table 4.5 L* Color Analysis: Outer Stalks
Material
week 0 week 2 week 4 week 6 week 8 week 10 week 12 Overall
Control 44.02 a 46.40 a 52.60 a 54.10 a 59.76 a 59.39 a 61.38 a 53.95 a
Ecoflex 41.40 a 46.60 a 53.27 a 58.33 a 54.08 a,b 60.03 a 63.77 a 53.93 a
Mater-Bi 41.27 a 43.65 a 46.50 b 54.0 a 52.06 b 57.27 a 61.85 a 50.95 b
PLA 43.10 a 45.0 a 45.66 b 56.85 a 57.06 a,b 58.41 a 59.74 a 52.26 a,b
*Within columns, materials with same letter are not significantly different
Figure 4.5: L color value. Outer Stalks

59
There were significant differences (p>0.05) between materials but only at weeks 4 and 8.
Celery in Mater-Bi was identified as significantly lower in L* value from celery in Control and
Ecoflex materials at weeks 4, 8 and for overall analysis. In general celery packaged in all
materials progessively got lighter due to natural aging of product.

60
L* Color Analysis: Middle Stalks
Table 4.6 L* Color Analysis: Middle Stalks
Material week 0 week 2 week 4 week 6 week 8 week 10 week 12 Overall
Control 47.0 a 55.77 a 58.34 a 60.50 a 60.95 a 63.03 a 64.10 a 58.53 ab
Ecoflex 53.18 a 55.48 a 57.96 a 61.35 a 60.65 a 65.25 a 66.51 a 60.05 a
Mater-Bi 50.70 a 55.75 a 53.70 b 57.60 a 60.91 a 62.50 a 62.83 a 57.71 b
PLA 50.84 a 55.0 a 51.60 b 60.50 a 59.48 a 64.32 a 63.07 a 57.83 b
*Within columns, materials with same letter are not significantly different
Figure 4.6: L color value. Middle Stalks

61
There were no significant differences between materials when comparing on a weekly
basis except at week 4 when celery in PLA and Mater-Bi were statistically shown to be
significantly lower in L* (lighter) than the celery in the Control and Ecoflex materials. Overall,
celery in Ecoflex material was identified as significantly lighter than celery contained in Mater-
Bi and PLA materials. Nevertheless, all materials followed a similar trend of steady increase in
L* value from week 6-12. The trend for middle stalks follow a matching pattern to the trend for
outer stalks.

62
Table 4.7: L* Color Analysis: Inner Stalks
*Within columns, materials with the same letter are not significantly different
Figure 4.7: L* Color Value: Inner Stalks
Material week 0 week 2 week 4 week 6 week 8 week 10 week 12 Overall
Control 52.09 a 56.46 a 56.58 a 63.90 a 63.25 a 62.97 b 65.04 a 60.04 b
Ecoflex 55.16 a 62.13 a 60.95 a 61.44 ab 62.76 a 66.40 a 65.20 a 62.00 a
Mater-Bi 58.71 a 58.33 a 57.86 a 58.94 b 64.15 a 63.51 ab 64.67 a 60.88 ab
PLA 58.0 a 59.68 a 57.19 a 62.22 ab 61.85 a 64.39 ab 65.51 a 61.26 ab

63
Overall, celery in Ecoflex material was significantly lighter than celery in Control
material. At week 6, celery in Control was significantly lighter than celery in Mater-Bi.
Similarly, at week 10, celery in Ecoflex material was significantly lighter than celery in Control
material. In general, the L* color value for outer, middle and inner stalks all follow a similar
trend of increasing L* over time. As the weeks progress, the dominant pigment, chlorophyll,
responsible for maintaining innate celery color began to fade due to natural deterioration, while
carotenoids (pigments that coexist with chlorophyll), responsible for the lighter hue of yellow,
began to dominate.
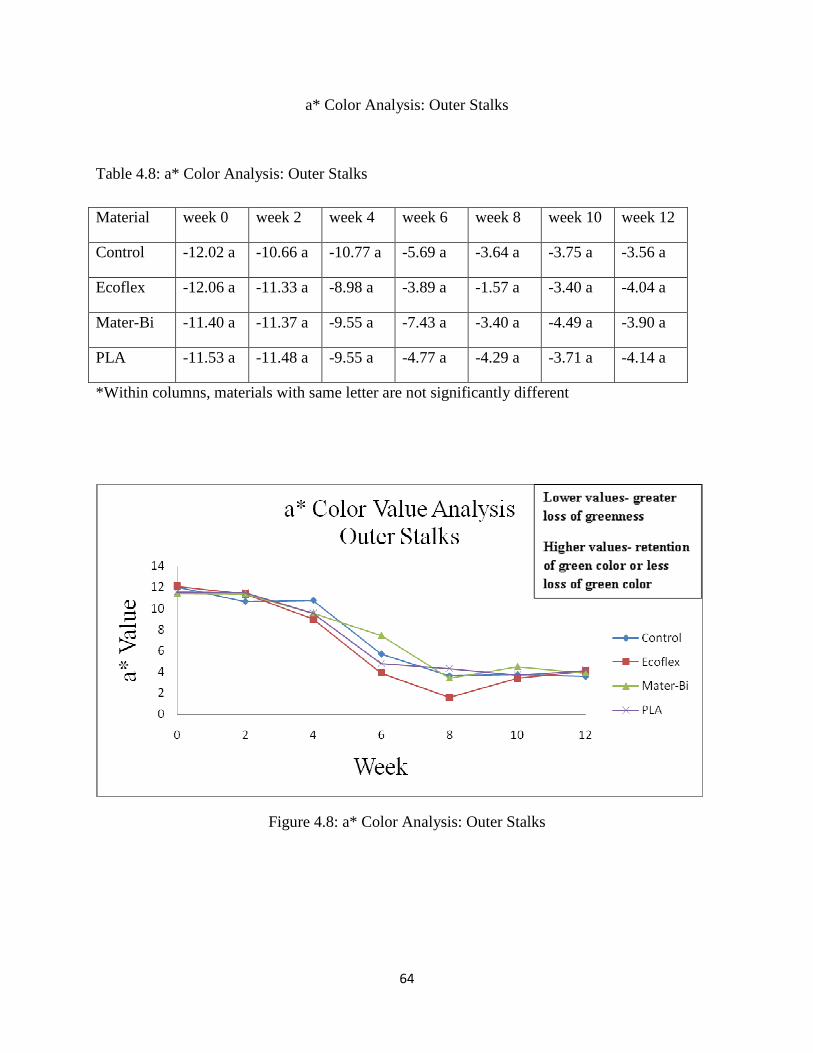
64
a* Color Analysis: Outer Stalks
Table 4.8: a* Color Analysis: Outer Stalks
*Within columns, materials with same letter are not significantly different
Figure 4.8: a* Color Analysis: Outer Stalks
Material week 0 week 2 week 4 week 6 week 8 week 10 week 12
Control -12.02 a -10.66 a -10.77 a -5.69 a -3.64 a -3.75 a -3.56 a
Ecoflex -12.06 a -11.33 a -8.98 a -3.89 a -1.57 a -3.40 a -4.04 a
Mater-Bi -11.40 a -11.37 a -9.55 a -7.43 a -3.40 a -4.49 a -3.90 a
PLA -11.53 a -11.48 a -9.55 a -4.77 a -4.29 a -3.71 a -4.14 a

65
Color measurement of a* values showed no significant differences between materials.
The chlorophyll pigment responsible for green color naturally degrades during storage.
Consequently, celery in all materials lost greenness over time. The a* color measurement
resulted in lower values corresponding to greater loss of greenness and higher values
corresponding to less loss of green color or a greater retention of green color.

66
a* Color analysis: Middle Stalks
Table 4.9: a* Color Analysis: Middle Stalks
Material week 0 week 2 week 4 week 6 week 8 week 10 week 12 Overall
Control -12.27 a -12.75 a -11.01 a -10.81 a -10.37 a -9.55 a -7.03 a -10.54 a
Ecoflex -12.78 a -12.36 a -10.77 a -9.94 a -10.43 a -8.71 a -5.34 a -10.05 a
Mater-Bi -12.71 a -12.04 a -13.03 b -11.02 a -11.14 a -9.87 a -7.26 a -11.01 a
PLA -12.84 a -11.52 a -11.70 ab -10.80 a -11.16 a -9.22 a -6.34 a -10.51 a
*Within columns, materials with same letter are not significantly different
Figure 4.9: a* Color Analysis: Middle Stalks

67
At week 4, celery in both Control and Ecoflex materials experienced a significantly
greater loss of greenness than celery contained in the Mater-Bi material. There was no other
significant differences (p>0.05) between materials within each week, nor were there differences
in materials overall. The a* color value for the outer stalk had declined sharply from week 0-8,
while the same value for the middle stalk experienced a more gentle decline before sharply
falling from week 10-12. The reason for such disparity in greenness between outer and middle
stalks is because the outer stalks have a darker shade of greenness, while the middle has a lighter
hue of green. Additionally, the outer stalks age faster than middle or inner stalks because a
greater surface area containing chlorophyll, responsible for green color, is exposed to ambient
conditions of oxygen and therefore degrade faster.

68
a* Color analysis: Inner Stalks
Table 5.0: a* Color Analysis: Inner Stalks
Material week 0 week 2 week 4 week 6 week 8 week 10 week 12 Overall
Control -11.93 a -11.04 b -10.40 a -9.42 ab -9.88 a -10.67 b -9.94 b -10.47 b
Ecoflex -11.22 a -9.12 a -10.41 a -9.18 a -10.61 a -7.02 a -7.01 a -9.22 a
Mater-Bi -12.30 a -9.66 ab -11.29 a -11.53 b -9.67 a -9.75 b -8.60 ab -10.40 b
PLA -11.94 a -9.46 ab -11.78 a -10.29 ab -9.72 a -8.90 ab -8.91 b -10.14 b
*Within columns, materials with the same letter are not significantly different
Figure 5.0: a* Color Analysis: Inner Stalks

69
Overall, celery in Ecoflex experienced greater loss of greenness than celery in other
materials. There was no constant trend throughout the weeks but rather a random fluctuation
(possibly due to inherent product variation) from week 0-12. However, within some weeks,
there were significant differences in greenness values between materials. At week 2, celery in
Ecoflex material experienced significantly greater loss of greenness than the Control but was not
significantly different than celery packaged in other bio-based materials. Similarly, at weeks 10
and 12, celery in Ecoflex material also experienced significant loss of greenness compared to
Control. Nevertheless, at weeks 0, 4, and 8, there were no significant differences in a* color
value for celery packaged in each material. The inner stalks naturally vary with regard to color,
compared to outer stalks, and therefore show greater variation in measurements over time.

70
b* Color analysis: Outer Stalks
Table 5.1: b* Color Analysis: Outer Stalks
Material week 0 week 2 week 4 week 6 week 8 week 10 week 12 Overall
Control 17.17 a 17.27 a 18.32 a 15.10 b 17.25 ab 14.85 a 15.72 a 16.53 ab
Ecoflex 17.08 a 18.14 a 18.20 a 15.92 ab 15.50 ab 14.23 a 14.73 a 16.25 ab
Mater-Bi 16.64 a 17.37 a 16.23 a 17.86 a 17.57 a 15.78 a 15.17 a 16.66 a
PLA 16.71 a 17.63 a 16.56 a 15.06 b 15.21 b 15.59 a 13.46 a 15.74 b
*Within columns, materials with same letter are not significantly different
Figure 5.1: b* Color Analysis: Outer Stalks

71
The above b* color analysis is relevant with respect to yellowing of vegetables. At week
6, celery in Mater-Bi material experienced significantly greater yellowing than celery contained
in PLA and Control materials. Similarly, the same development occurs at week 8 with celery in
Mater-Bi experiencing significantly greater yellowing than celery in PLA. Plant pigments, such
as carotenoids are primarily responsible for the yellow hue in vegetables after the fading of
chlorophyll, responsible for the green color. A loss of green color (week 4) was found to be
significantly greater for celery in the Mater-Bi material. Hence, greater loss of greenness
prompts the dominance of a yellow hue attributable to yellow carotenoid pigments.

72
b* Color Analysis: Middle Stalks
Table 5.2: b* Color Analysis: Middle Stalks
Material week 0 week 2 week 4 week 6 week 8 week 10 week 12 Overall
Control 18.52 a 20.16 a 18.33 b 19.04 a 18.65 a 18.20 a 17.23 a 18.6 a
Ecoflex 20.27 a 20.41 a 18.16 b 17.68 a 18.82 a 17.09 a 15.09 a 18.22 a
Mater-Bi 19.34 a 19.87 a 20.68 a 18.84 a 19.58 a 18.37 a 16.81 a 19.07 a
PLA 19.42 a 19.26 a 18.95 b 18.70 a 19.44 a 17.80 a 16.84 a 18.63 a
*Within columns, materials with same letter are not significantly different
Figure 5.2: b* Color Analysis: Middle Stalks

73
There were no significant differences between materials within weeks nor were there
differences in materials overall. Essentially, there was very little change in b* color value for the
middle stalks throughout the storage period. The above trend is similar to the outer stalks for b*
color analysis.

74
Table 5.3: b* Color Analysis: Inner Stalk
*Within columns, materials with the same letter are not significantly different
Figure 5.3: b* Color Analysis: Inner Stalks
Material Week 0 week 2 week 4 week 6 week 8 week 10 week 12 Overall
Control 19.24 a 19.34 a 18.15 a 18.01 ab 18.60 a 19.73 a 20.26 a 19.04 a
Ecoflex 19.06 a 18.58 a 18.66 a 17.14 b 19.50 a 15.58 b 16.46 c 17.85 b
Mater-Bi 20.86 a 18.24 a 19.28 a 19.85 a 17.47 a 18.14 a 16.96 bc 18.68 ab
PLA 20.55 a 18.30 a 19.86 a 19.21 ab 17.71 a 17.31 ab 18.55 ab 18.78 a

75
The b* color analysis for inner stalks follow a different trend than outer and middle stalks
but from a practical viewpoint, the b* values don’t change greatly over time. From weeks 8-12,
b* value began to level off in contrast to slightly declining as noticed with outer and middle
stalks. The outer and middle stalks changed more rapidly to a lighter hue than inner stalks
because they experienced greater exposure to ambient conditions and therefore deteriorate earlier
in color.
Summary: Color Analysis
L* values for outer, inner and middle stalks had increases in L* following the same trend
(with regard to no significant difference between materials) through week 6. At week 6, there
were significant differences between materials for inner stalks (celery in control was
significantly lighter than celery in Mater-Bi). Nevertheless, these differences were likely due to
normal variation between celery sticks because there was no discernable trend. At week 8 there
was a significant difference between materials for outer stalks as well as week 10 for inner
stalks. There were no significant differences in L* value between materials per week for middle
stalks.
Similarly for outer and middle stalks, there were no significant differences between
materials for a* value measurement. Inner stalks, which are particularly less green than outer
and middle stalks demonstrated significant differences in a* value measurement at weeks 2, 6, 10
and 12.
For b* color measurements, there were significant differences at week 6 and 8 for outer
stalks. At weeks 6 and 8, yellowing was significantly less for celery packaged in PLA

76
compared to celery packaged in the other bio-based materials. However, for the middle and
inner stalks, there were significant differences between materials at week 4 for middle stalks
(celery in Mater-Bi was significantly lighter than others) and at week 6, 10, and 12 for inner
stalks. Inner stalks appear less green in color (compared to outer and middle) which predisposes
them to greater variability in color measurements. These differences are probably due to random
variation in celery product.

77
Table 5.4: Textural Measurement: Firmness vs. Time
Material week 0 week 2 week 4 week 6 week 8 week 10 week 12
Control 2.83 a 2.68 a 2.38 a 2.50 a 1.97 b 2.20 a 2.42 a
Ecoflex 2.50 a 2.52 a 2.24 a 2.74 a 2.58 a 1.94 a 1.24 b
Mater-Bi 2.3 a 2.72 a 1.88 a 2.38 a 2.64 a 1.97 a 1.94 a,b
PLA 2.65 a 2.28 a 2.62 a 2.53 a 2.68 a 2.78 a 1.15 b
*Within columns, materials with same letter are not significantly different
Figure 5.4: Firmness vs. Time

78
There was large fluctuation in firmness of packaged celery over time. From weeks 0-6, there
were no significant differences between materials per week. The only significant difference
occurred at week 8, where the celery in the control material was less firm than the others. By
week 12, a different trend occurs with celery in control material achieving significant difference
in firmness than celery in Ecoflex and PLA.

79
Table 5.5: Textural Measurement: Stiffness vs. Time
Material week 0 week 2 week 4 week 6 week 8 week 10 week 12
Control 1.76 a 1.31 a 1.02 a 1.63 a 1.14 b 1.14 a 1.64 a
Ecoflex 1.21 a 1.87 a 1.01 a 1.97 a 1.46 a,b 1.17 a 0.79 b
Mater-Bi 1.3 a 1.60 a 1.12 a 1.45 a 1.7 a,b 1.35 a 1.07 a,b
PLA 1.43 a 1.17 a 1.60 a 1.83 a 1.93 a 1.5 a 0.48 b
*Within columns, materials with same letter are not significantly different
Figure 5.5: Stiffness vs. Time
80
Although there appears to be large fluctuation in trend, there were no significant
differences in textural measurement of celery packaged in each material from week 0-6 and at
week 10. Significant differences were noticed in weeks 8 and 12. At week 8, stiffness of celery
in PLA was significantly higher than celery in control. However, by week 12, the trend reverses
with celery in control significantly higher in stiffness than celery in PLA. Differences in both
weeks are possibly due to inherent product variation.

81
Table 5.6: Textural Measurement: Toughness vs. Time
*Within columns, materials with same letter are not significantly different
Figure 5.6: Toughness vs. Time
Material week 0 week 2 week 4 week 6 week 8 week 10 week 12
Control 7.14 a 6.97 a,b 5.76 a 6.28 a 5.88 b 6.50 a 6.9 a
Ecoflex 6.24 a 7.68 a 5.60 a 7.14 a 7.33 a,b 5.66 a 3.6 b
Mater-Bi 6.78 a 6.9 a,b 4.0 a 7.10 a 7.6 a,b 6.41 a 6.12 a,b
PLA 6.10 a 5.72 b 5.94 a 6.67 a 8.0 a 7.20 a 3.24 b

82
While toughness of celery in all materials except PLA seemed to fluctuate, the toughness
of celery in PLA material appeared to be constantly increasing from week 2-8 and declined
thereafter. Along with firmness, textural quality of celery includes toughness and rigidity.
While there appeared to be some variation in trend over time, there were also significant
differences between materials at weeks 2, 8, and 12. Celery in Ecoflex is significantly tougher
than celery in PLA at week 2 while at week 8, celery in PLA is significantly tougher than the
control. At week 12, celery packaged in both Ecoflex and PLA show decreases while Control
and Mater-bi level off. Celery in control film also appears to be significantly tougher than celery
packaged in Ecoflex and PLA at week 12.
The variation in textural measurements between materials over time is probably due to
variability in product. Similarity in textural variability trends can also be identified in previous
research involving shelf life of celery. Variation in texture along with fluctuation in textural
measurements was noticed by Vina and Chaves (2003) in a study investigating textural changes
in fresh cut celery during refrigerated storage. The shear force required to cut celery sticks
increased during the first two week from an initial value of 40.5 N to 47.8 N at day 14. After day
14, the shear force required to cut the pieces decreased to 43 N due to softening of tissue.
Further firmness measurements using a texture analyzer also generated trends that depicted
variation in measurements over time as studied by Rizzo and Muratore, 2008. Rizzo and
Muratore noticed that petioles softened and firmness decreased during storage in all materials.
Additionally, no significant differences were noticed during the shelf life period (one month)
between both films (polyolefin anti-fog (AF) and polypropylene micro perforated (MP)
materials) of packaged celery.

83
Total Aerobic Plate Count
Figure 5.7: Total Aerobic Plate Counts vs. Time
Microbial growth of celery increased during storage in all materials. The microbial growth for
celery in the control material was lower by about 1-2 log from weeks 6-8 but eventually reached
7 log CFU/g along with other materials by week 10. 7 Log CFU/g had been identified by Gomez
et al as the maximum aerobic bacterial limit for celery.

84
Table 5.7: Sensory Analysis
Aroma 0=lack aroma
15=aromatic
Aroma Material week 0 week 2 week 4 week 6 week 8 Control 9.30 a 6.63 a 7.42 a,b 6.61 a,b 7.7 a Ecoflex 15.0 a 8.82 a 8.6 a 7.24 a,b 8.72 a Mater-Bi 9.13 a 7.12 a 5.4 b 8.52 a 7.6 a PLA 7.19 a 8.73 a 8.11 a 5.75 b 7.46 a Appearance 0=old 15=fresh Appearance Control 11.10 a 6.77 b 9.39 a 7.47 b 7.49 a,b Ecoflex 9.89 b 11.09 a 9.98 a 7.57 b 7.61 a,b Mater-Bi 10.41 a,b 10.56 a 9.22 a 9.11 a 7.23 b PLA 11.03 a,b 11.11 a 9.18 a 7.73 a,b 9.43 a Flavor 0=bitter 15=sweet Flavor Control 9.59 a 6.85 a 7.95 a 6.81 a 6.16 b Ecoflex 8.23 a 8.86 a 8.84 a 8.51 a 6.73 a,b Mater-Bi 9.18 a 8.13 a 7.75 a 7.25 a 8.31 a PLA 8.43 a 8.03 a 8.61 a 8.01 a 7.95 a,b Like of Flav. 0=dislike 15=like Liking of flavor
Control 11.03 a 6.59 a 9.03 a,b 7.25 a 6.70 a
Ecoflex 9.78 a 10.3 b 10.00 a 8.67 a 7.17 a Mater-Bi 9.92 a 9.04 b 8.08 b 8.83 a 8.57 a PLA 9.66 a 9.14 b 9.11 a,b 7.81 a 8.38 a Texture 0=rubbery 15=crisp Texture Control 11.59 a 9.43 b 10.65 a 9.31 a 7.68 b Ecoflex 10.45 a 12.25 a 10.67 a 9.88 a 6.99 b Mater-Bi 11.57 a 11.60 a 8.89 b 10.49 a 8.36 a,b PLA 11.35 a 11.66 a 10.47 a 9.46 a 10.2 a Overall Lik. 0=dislike 15=like Overall Control 10.90 a 6.63 b 9.35 a,b 7.84 a 6.97 a Ecoflex 9.65 a 10.77 a 10.13 a 8.37 a 7.47 a Mater-Bi 10.57 a 9.38 a 7.87 b 9.42 a 7.86 a PLA 9.95 a 10.05 a 9.25 a,b 8.07 a 9.13 a Rank 1=like most 4=like least Rank Control 2.14 a 3.4 a 2.08 b,c 2.67 a 3.22 a Ecoflex 2.43 a 1.93 b 1.84 c 2.53 a 3.11 a Mater-Bi 2.78 a 2.53 b 3.23 a 2.07 a 2.00 b PLA 2.64 a 2.13 b 2.85 a,b 2.73 a 1.67 b

85
Figure 5.8: Sensory. Aroma Profile
At week 4, celery stored in Mater-Bi was scored significantly less than Ecoflex and PLA but
reversed trends by week 6. By week 6, celery in Mater-Bi was scored significantly higher than
PLA while others showed no significant differences. During weeks 0,2, and 8, there were no
significant differences between materials with regard to aroma. Therefore, the differences
observed for celery in Mater-Bi were likely due to normal variability found in produce rather
than actual differences. Essentially, aroma was not affected by material differences.

86
Figure 5.9: Sensory. Appearance Profile
There was a great deal of variation with regard to appearance. The only time a set of samples
was ranked below 7.5 (which was the point at which samples fall closer to the unacceptable part
of the sensory scale), was for the control at week 2. There was no diserable trend throughout the
8 week evaluation period. Based on statistical analysis, the celery in control film was ranked
significantly lower in appearance at week 2, celery in Mater-Bi was ranked significantly higher
in appearance than Control and Ecoflex at week 6 and
PLA was ranked significantly higher in appearance than Mater-Bi at week 8. In general, the
variation could again be related to normal variability within and between samples and statistical
differences are not likely due to diffrences between materials.

87
Figure 6.0: Sensory. Flavor Profile
Flavor for all materials was ranked lower at week 8 compared to week 0 but did not change
dranstically. There were no significant differences between celery in all materials from weeks 0-
6 but at week 8 celery in Materi-Bi was ranked signficantly higher in flavor than celery in other
materials.

88
Figure 7.0: Sensory. Liking of Flavor Profile
Generally, the liking of flavor category seem to decline from week 4-8
There is a similarity in trend between “flavor” and “liking of flavor categories” which indicates
that panelists utilized their perception of ‘flavor’ in assessing their perception for ‘liking of
flavor. At week 2, celery in the control film was ranked significantly lower than rest. Similarly,
in the flavor profile above, the control sample was also ranked lower than the rest at week 2.
At week 2, there was a significant difference in the “Liking of Flavor” category.
Generally, the “liking of flavor” category seem to decline from week 4-8

89
Figure 7.1: Sensory. Texture
Based on the sensory evaluation of texture over the 8 week period, texture declined for all
samples. Again, some statistical differences were observed but no specific trend was established.
Celery in the control material was scored significantly lower (least crisp) than others at week 2
while celery packaged in Mater-Bi was scored significantly lower than others at week 4. At
week 8, celery in all other materials were scored similarly except PLA which was ranked higher
(more crisp).

90
Figure 7.2: Sensory. Overall Profile
The results from the overall category shows a decline from weeks 2-8 with some fluctuation
occurring samples in the Mater-Bi and control materials. The results also indicate that there is
a similarity between the texture trend and the overall trend. At week 2, celery in the control
material was ranked significantly ranked lower than other samples. Similarly, control was also
ranked significantly lower for texture at week 2. At week 4, the Mater-Bi sample was also
ranked significantly lower than all other materials which compared to results observed for
texture when compared to celery in Ecoflex alone. . The indication of same samples ranked
significantly different from others for two sensory attributes reveals that both attributes are
relevant in assessing each other and panelists utilize both in assessing quality of celery samples.

91
Figure 7.3: Sensory. Ranking Profile
Results of ranking indicate that there were no significant differences between samples at weeks 0
and 6. The greatest variation between sample ranking occurred at weeks 2 and 4 where the
celery in control film was ranked least liked (p<0.05) and then rankings changed drastically at
the next sampling period. At week 4, celery in Ecoflex was ranked the most liked (p<0.05) and
celery in Mater-Bi was ranked least liked (p<0.05). At the end of the sensory testing, the
samples broke into to two distinct rankings. The celery in the two biopolymer films (Mater-Bi
and PLA) were ranked most liked and the celery in the control and Ecoflex were ranked lower
with regard to liking (p<0.05).

92
Summary of Sensory Results
• Aroma: some variation but no significant differences
• Appearance: Celery in PLA was scored more fresh than others
• Flavor: Celery in Mater-Bi and PLA ranked significantly higher
• Liking of flavor: No significant differences
• Texture: Celery in PLA was ranked significantly higher than celery in control and Ecoflex but not significantly different than celery in Mater-Bi
• Overall: There are no significant differences
• Ranking: Celery in Mater-Bi and PLA were most liked
Flavor and other relevant quality attributes analyzed via sensory evaluation in
combination with aerobic microbiological analysis are critical in determining end of shelf life.
In a shelf life study involving diced celery, Prakash and colleagues (2000) linked aerobic
bacterial load surpassing 8 Log to an end of shelf life. Furthermore, edible quality based on
aroma, color, and texture was deemed inedible and unacceptable at time period (day 19) of study
when microbiological levels surpassed 8 Log. A comparable correlation was also established to
current work that links increasing microbiological enumeration to increasing overall dislike of
samples and flavor over time. As microbiological analysis of samples increased within each
week, overall liking of samples as well as liking of flavor decreased. The proliferation of
bacteria appears to impart an influence on perception of sensory attributes which are critical
determinants of edible quality and hence shelf life of product. Consequently, the correlation
between increasing microbiological enumeration, deteriorating edible quality attributes, and an
end of shelf life is established.

93
MATERIAL ANALYSIS
Table 5.8: Permeation Studies
Table 5.8A: Oxygen Permeability Rate: cc·mil/ (m2·day) 23°C and 0%RH, 754.17 mmHg
Week Control Ecoflex Mater-Bi
PLA
0 9500 2793 2673 494
6 9508 8181 2850 12,760
12 5990 *** 3130 ***
Table 5.8 B: Water Vapor Permeability Rate (g·mil/(m2·day) 37°C and 100%RH,754.17 mmHg
Week Control Ecoflex Mater-Bi
PLA
0 24 995 647 211
6 26 2164 548 225
12 22.09 *** 560 ***
** indicates extreme variability in results – unable to report accurate values
Much of the variability in data occurred between Ecoflex (OPR and WVPR) and PLA
(OPR) materials. Their respective permeability rates had increased drastically by week 12 and
became so variable that the permeation equipment was unable to complete the test without
failing. Upon observation of the film, it was likely that the film cracked during testing even
though the film installed was intact and masked with aluminum foil to reduce the test size area.

94
At week 12, the control film experienced variability in results resulting in transmission
rates higher than weeks 0 and 6. Therefore, the OPR appeared different at week 12 than at
weeks 0 and 6. LDPE is a synthetic hydrophobic polymer and should not show permeation
decreases impacted by high RH conditions nor display any fluctuations in oxygen permeability
data over time. Consequently, the data presented in the above permeation studies may be flawed
due to testing error and should be subjected to further analysis.
Mechanical Analysis
Mechanical Analysis
Table 5.9: Break Strength (MPa):
a,b,c - materials with same letter within columns are not significantly different
* No data recorded. Undetected reading
- insufficient material available (due to deterioration) to conduct testing
There were significant differences in break strength between materials within each week.
No tensile strength was recorded for PLA from weeks 6-12 because the film failed immediately
Material
week 0 week 2 week 4 week 6 week 8 week 10 week12
Control 18.36 b 18.0 b 28.1 b 21.61 a,b 21.95 b 23.0 a 19.34 b
Ecoflex 21.75 b 16.1 b 26 b 16.12 b 14.30 c 12.54 b -
Mater-Bi 29.12 b 35.8 a,b 37.2 b 27.48 a 28.87 a 27.40 a 24.64 a
PLA 50.38 a 50.7 a 66.8 a * * * *

95
upon testing and was probably below the sensing level of the load cell. PLA was the strongest
material, indicated by higher values, and also most brittle from weeks 0-4. At weeks 8 and 12,
there were significant differences in tensile strength between the remaining materials. Mater-Bi
had a significantly greater tensile strength at weeks 8 and 12 while tensile strength for Ecoflex
was significantly lowest at weeks 8 and 10.
Break strength is the force required to rupture a film (Instron: Materials Testing). The
PLA film required the greatest force to break because it was a brittle material containing “cold”
polymer chains. This occurs when the polymer is below its glass transition temperature (Tg).
These chains can not easily move or change position when subjected to stress. The inability to
move or change positions when subjected to stress prevents them from absorbing any stress
placed on them. Consequently, they can either resist the stress imposed on them or break
immediately upon sensing stress, as noticed with PLA. Conversely, other materials utilized in
the study were ductile materials above their Tg. These polymer chains can change positions
easily, because molecules have more kinetic energy required for movement which allows them to
easily absorb stress placed on them. A ductile film absorbs more energy before breaking, but the
force required to break the film will be lower than a brittle film.

96
Table 6.0:Yield Stress (MPa):
a,b - materials with same letter, within columns are not significantly different
*displayed brittle curves. No data obtained
Yield stress was reported only for control and Mater-Bi films because they displayed
ductile curves. PLA displayed brittle curves, therefore no data was reported.
Mater-Bi had significantly higher yield stress than control per week throughout the entire
duration of study. Ecoflex is not a brittle material, but its yield point was not sufficiently
pronounced to be detected by the software.
The response to force acted on films is identified as yield stress (Instron: Materials
Testing). Both ductile materials (Control and Mater-Bi) in Table 6.0 display a yield region under
tensile deformation (Figure 7.5 & 7.7). The other two materials do not display yield.
Material
week 0 week 2 week 4 week 6 week 8 week 10 week12
Control 10.1 b 12.03 b 12.03 b 9.75 b 9.94 b 10.34 b 9.08 b
Ecoflex * * * * * * *
Mater-Bi 17.29 a 21.05 a 22.06 a 16.44 a 16.77 a 16.65 a 16.80 a
PLA * * * * * * *

97
Table 6.1: Break Elongation (%): Material
week 0 week 2 week 4 week 6 week 8 week 10 week12
Control 516.30 a 477.93 a 692.63 a 566.57 a 573.7 a 562.10 a 526.77 a
Ecoflex 97.83 b 40.07 c 111.83 c 53.50 c 62.33 c 53.40 c *
Mater-Bi 330.13 a 331.17 b 342.77 b 289.9 b 303.0 b 298.0 b 251.33 b
PLA 4.43 b 4.87 c 4.20 d - - - -
a,b,c,d- materials with same letter, within columns are not significantly different
- No data recorded. Undetected reading
* Insufficient material available (due to deterioration) to conduct testing
PLA remained lowest in % break elongation from week 0-4. At week 4, PLA was
significantly lower than other materials in break elongation. From week 4, materials were
significantly different from each other in break elongation. Beginning at week 6, the control
material was significantly greater in break elongation while Ecoflex was the lowest. At week 12,
the Ecoflex material severely deteriorated and there was not enough film to conduct a tensile test.
Break elongation is defined as elongation of the specimen to the point where it breaks
(break point) (Instron: Materials Testing, 2009). Yield elongation can be recognized as the
farthest a material can be stretched without undergoing permanent deformation (Selke, S. E.,
Cutler, J. D., & Hernandez, R. J. (2004). Both LDPE and Mater-Bi materials displayed large
elongation because they are ductile materials. The other two materials also displayed elongation.
Figure 7.6 displays a brittle PLA material with minimal elongation (and no necking) compared
to Ecoflex. Figure 7.6 displays a PLA curve simply increasing and decreasing with no yield

98
region. Conversely, Figure 7.4 shows a ductile Ecoflex with larger elongation than PLA but no
necking. Necking refers to the tendency of a material’s width to decrease when stretched (Selke,
Cutler, & Hernandez, 2004).
Figure 7.4: Tensile Strength at Break
There is fairly large variability in tensile strength during weeks 2 & 4 for all materials. After
week 4, the variability begin to level off from weeks 6-12 for all materials. Mater-Bi
demonstrated greater tensile and yield strength than both LDPE and Ecoflex. For instance, at
weeks 0 and 2, Mater-Bi had a yield stress of 17.3 Mpa and 21.05 Mpa respectively, while LDPE
had a yield stress of 10.1 Mpa and 12.03 Mpa respectively.

99
Figure 7.5: Tensile Strength at Yield
Only LDPE and Mater-Bi displayed ductile curves and a detectable yield stress point on the
stress strain curve. Ecoflex was also ductile but displayed no yield point. The yield stress
between materials within each week were significantly different from each other.
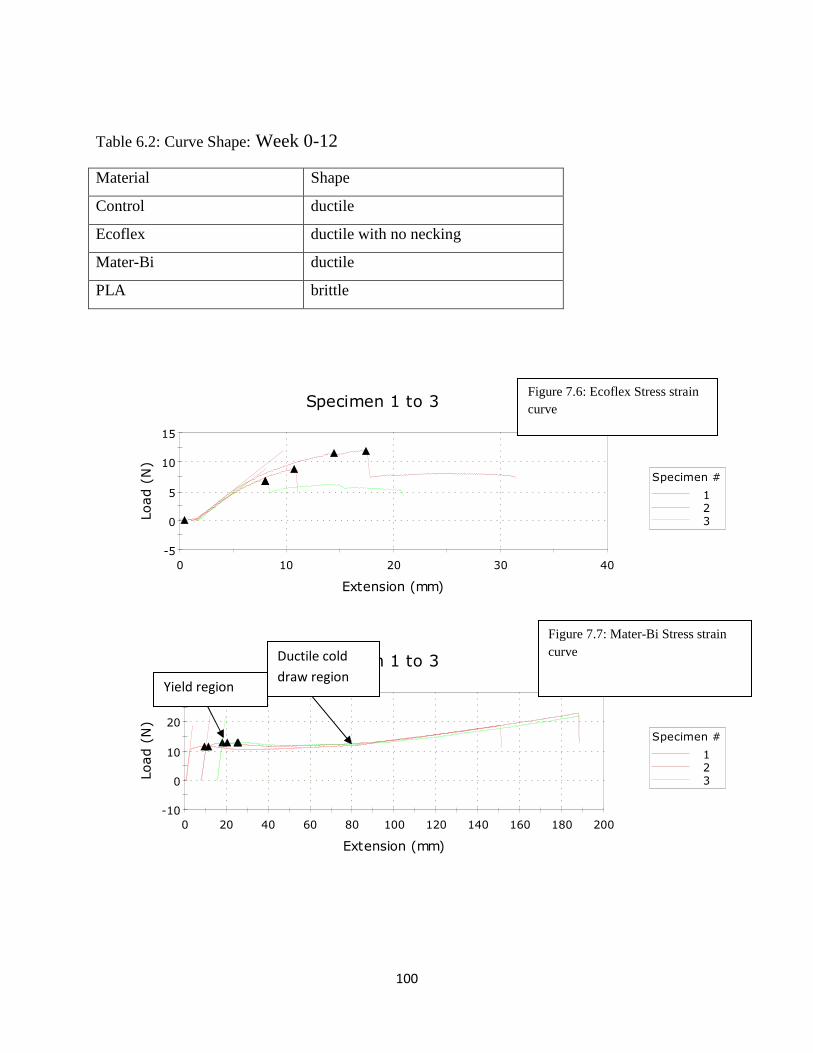
100
Table 6.2: Curve Shape: Week 0-12
Material Shape
Control ductile
Ecoflex ductile with no necking
Mater-Bi ductile
PLA brittle
-5
0
5
10
15
0 10 20 30 40
Load (N)
Extension (mm)
Specimen 1 to 3
Specimen #
123
-10
0
10
20
30
0 20 40 60 80 100 120 140 160 180 200
Load (N)
Extension (mm)
Specimen 1 to 3
Specimen #
123
Figure 7.6: Ecoflex Stress strain curve
Figure 7.7: Mater-Bi Stress strain curve
Ductile cold
draw region Yield region

101
-10
0
10
20
30
0 1 2 3 4
Load (N)
Extension (mm)
Specimen 1 to 3
Specimen #
123
-5
0
5
10
15
20
0 100 200 300 400
Load (N)
Extension (mm)
Specimen 1 to 3
Specimen #
123
The mechanical behavior of materials used in this study were evaluated by their stress strain
characteristics under tensile deformation. Stress is measured in force per unit area and expressed
in Pascal or psi. Each material behavior is influenced by rate of deformation. Both the Control
and Mater-Bi materials exhibit elastic elongation as indicated by their yield point and ductile
cold draw regions. Ecoflex demonstrated no real yield point, and an immediate elongation.
Conversely, PLA material displayed an inability to endure a significant amount of strain before
breaking because polymer chains were below the glass transition temperature. The glass
transition temperature (Tg) is the point where the change in mobility takes place. Below Tg,
Figure 7.8: PLA Stress strain curve
Figure 7.9: Control Stress strain curve
Ductile cold draw
region
Yield region

102
polymer chains are rigid and exhibit little movement. Consequently, when force is acted on
them, they are incapable of absorbing the force, thereby breaking upon impact. On the other
hand, control, Ecoflex and Mater-Bi materials contain polymer chains above Tg. Their polymer
chains display mobility required to absorb force placed on them. With regard to the main
mechanical functions of a package (contain, protect, and utility of use), the Mater-Bi material
performed best of the bio-based materials used in this study.
Appearance of Materials:
* view appendix for pictures of material deterioration
Both Ecoflex and PLA materials deteriorated at end of study due to poor mechanical performance under high humidity conditions
The Mater-Bi material remained intact and showed no deterioration
DISCUSSION
Materials utilized in this shelf life study were selected based on their variations in water
vapor permeability rates in addition to being sustainable hydrophilic biopolymers derived from
renewable resources. A high moisture product (celery) was utilized in studying the effect of
these materials on quality and shelf life of product. In analyzing the effect of materials on
quality of celery, various measurements were conducted which include texture, color, weight
measurements (moisture loss), and sensory analysis. In addition, permeation and mechanical
analysis were also conducted on materials over time in order to relate potential changes in
material properties to the product quality changes.

103
Some quality measurements conducted to assess celery quality over time indicated no
significant differences between materials within a given week. For instance, texture
measurements indicated no significant differences between materials per week. There were
differences between weeks which indicated deteriorating quality over time as a function of time
but not between materials. Additionally, inherent variation in celery quality was noticed due to
random differences between certain weeks that display no particular trend. Such differences
exist due to inherent variability in celery product.
Another quality attribute, color analysis, displayed no significant difference in ∆E for
overall degree of color change. However, there were some significant differences within
materials in the individual color scale measurements. Celery in the Ecoflex material was found
to be significantly lighter than celery in other materials in an overall assessment throughout
entire study. Likewise, there were also significant differences within weeks that reveal natural
deterioration of product over time. The color scale a* is particularly relevant for a green celery
product in determining loss of greenness over time. Celery packaged in all materials lost
greenness overtime. The b* color scale measurement indicated that celery in Mater-Bi material
exhibited significantly higher yellowing while other materials were not significantly different
from each other.
Moisture loss was experienced by celery in all materials over the course of 12 week
study. However, celery in the Mater-Bi material experienced the least moisture loss over the
course of the study and was therefore significantly different than the control material. Overall,
celery in the Control material lost significantly more weight than Mater-Bi and PLA but was
statistically similar to Ecoflex. There was no significant difference in overall % moisture loss

104
between Ecoflex, Mater-Bi, and PLA materials. Throughout the entire study, celery stored in the
Mater-Bi material lost the least amount of weight at 9.3%.
Correspondingly, the Mater-Bi material also showed less variability in WVPR compared
to the Ecoflex material which was significantly greater in celery weight loss (moisture loss) in
comparison to celery in the Mater-Bi material at end of study.
Sensory analysis revealed significant differences within materials per week. At week 8,
celery in Mater-Bi material was ranked significantly higher (more desirable) than celery in
control film on the basis of flavor. Similarly, at week 2, celery in PLA film was ranked
significantly higher (more crisp) in texture profile than celery in the Control film. At week 8,
PLA was also ranked significantly higher than Control and Ecoflex films on the basis of texture.
Celery in PLA and Mater-Bi films were liked the most at week 8 and significantly differed from
others in a final sensory ranking of samples. In general, sensory analyses indicate that there are
some significant differences in certain attributes such as texture and flavor within weeks that are
in favor of the variable materials. In attributes with no significant differences within weeks, the
variable materials strongly compete with or match the control.
Sensory testing results indicate that some of the variable materials can maintain quality
attributes just as the control material. Where there are no significant differences between
materials, quality attributes are the same irrespective of material utilized in packaging celery.
Consequently, celery could be packaged in any of the materials utilized in the above study and
maintain natural quality attributes over time as well as naturally deteriorate over time.
While the celery product can naturally degrade overtime, the materials used in packaging
could also deteriorate as noticed with the Ecoflex and PLA materials. Both materials also

105
displayed the highest increases and fluctuation in permeation rates. Additionally, their
mechanical performance was also poor compared to Mater-Bi and Control materials. While
Ecoflex and PLA materials were suitable materials with respect to product quality attributes,
their mechanical properties could be improved to match the performance of Control and Mater-
Bi materials.

106
CHAPTER 5
SUMMARY
The quality attributes evaluated in this shelf life research study were moisture loss, color
analysis, texture analysis, and sensory analysis. Additionally, permeation and tensile tests were
conducted to evaluate permeability and mechanical properties. All attributes in variable
materials were evaluated and compared to each other. Although the control material was also
used for comparison, direct correlations cannot be made since it had perforations and the bio-
based materials did not. The main purpose of the control was to use it as benchmark since it is
the most commonly used package material used in the fresh whole celery market.
There were significant differences in % weight loss between materials per week. Control
material experienced the greatest % weight loss (p<0.05) from weeks 6-10 while at end of study,
Mater-Bi experienced the least% weight loss. Both Mater-Bi and PLA were significantly
different than the control in attaining the least increase in % moisture loss overall.
All materials showed increases in ∆E, indicating that all materials showed an overall
change in color. Individual color value measurements demonstrated some differences between
materials per week in addition to random variability in celery product over time. Celery in
Mater-Bi material showed greater yellowing than the PLA material but was not significantly
different from the control. Additionally, the Mater-Bi celery was also significantly less light
than the control in overall L* color value analysis for the outer stalks. The b* color value
analysis showed no significant differences between the variable materials and the control. Over
the entire 12 week period, there were no significant differences in a* color value between

107
variable materials and the control. Celery in all materials demonstrated a loss of greenness over
time.
Textural attributes demonstrated severe variability in product in much the same way as
sensory analysis. By week 8, there were no significant differences between variable materials
and the control. However, for the sensory flavor profile, celery in Mater-Bi material was scored
significantly higher than the control by week 8. Additionally, for the texture profile, celery in
PLA scored significantly higher (more crisp) than the control by week 8 and was also
significantly preferred more than the control (sample rank category) at week 8. Along with PLA,
Mater-Bi was also ranked as significantly preferred more than the control at week 8 for the
sample rank category of sensory analysis.
Microbial growth increased over time for all materials and reached 6 Log by week 8,
after which sensory analysis ceased.
Permeation studies depict Mater-Bi as showing the least fluctuation (of the renewable
materials) in WVPR. Mater-Bi also performed best at moisture retention and the texture sensory
profile. Alternatively, PLA performed better at greenness retention and experienced the least
degree of total color change (∆E).
Overall, Mater-Bi performed better than the other materials with regard to weight loss,
WVPR, flavor, sensory rank, and tensile testing. Based on these results, a renewable biomaterial
such as Mater-Bi, could possibly replace the nonrenewable material for fresh celery.

108
CHAPTER 6
RECOMMENDATIONS
The stress strain test performed in this research demonstrated degradation for both
Ecoflex and PLA materials. Future research can be conducted in order to improve their ability to
resist degradation. Both films could be processed to contain different additives that may aid in
improving performance. Such additives can include synthetic polymers such as polyethylene-
vinyl alcohol blended with starch to offer flexible films with improved mechanical properties
and lower water sensitivity (Mariniello, et al., 2007). The Mater-Bi film used in this shelf life
study is made of corn extracted starch to which different synthetic polymers were added to
increase flexibility and hydrophobicity. Consequently, the Mater-Bi material performed better
than Ecoflex and PLA in moisture retention and tensile tests.
Considerable week-to-week variability in conducted measurements was attributed to
natural variation within the celery stalks. Studies of this variability would be a desirable
precursor to future work, with celery or other similar high moisture content vegetables such as
lettuce, cabbage, and asparagus. Additionally, a larger sample size could also be used to
possibly offset natural variation of product.
Future work on shelf life study of assorted produce should also utilize perforated bio-
based materials along with perforated LDPE or un-perforated LDPE along with un-perforated
bio-based materials.

109
APPENDIX A: Plastic Tensile Testing Data
Film Week Break Strength
(MPa) Yield Stress
(MPa) Break Elongation
(%) Curve Shape
Control 0 18.36 9.86 102.2 Ductile Ecoflex 0 21.75 28.08 97.8 Brittle
Mater-Bi 0 29.12 17.29 330.2 Ductile PLA 0 50.39 ----- 4.4 Brittle
Control 2 18.0 12.03 477.9 Ductile Ecoflex 2 16.1 ----- 40.1 Brittle
Mater-Bi 2 35.8 21.05 331.2 Ductile PLA 2 50.7 ----- 4.9 Brittle
Control 4 28.1 12.03 692.7 Ductile Ecoflex 4 26 111.8 Brittle
Mater-Bi 4 37.2 22.06 342.8 Ductile PLA 4 66.8 4.2 Brittle
Control 6 21.61 9.75 566.6 Ductile Ecoflex 6 16.12 17.45 53.5 Brittle
Mater-Bi 6 27.48 16.44 289.9 Ductile PLA 6 ----- ----- ----- Brittle
Control 8 21.95 9.94 573.7 Ductile Ecoflex 8 14.3 17.26 62.3 Brittle
Mater-Bi 8 28.87 16.77 303 Ductile PLA 8 ----- ----- ----- Brittle
Control 10 23 10.34 562.1 Ductile Ecoflex 10 12.54 16.4 53.4 Brittle
Mater-Bi 10 27.39 16.64 298 Ductile PLA 10 ----- ----- ----- Brittle
Control 12 19.34 9.08 526.8 Ductile Ecoflex 12 ----- ----- ----- Brittle
Mater-Bi 12 24.64 16.8 251.3 Ductile PLA 12 ----- ----- ----- Brittle

110
SENSORY PROFILE OF REFRIGERATED CELERY STICKS
ID No.__________ DATE: ?-?-09 Place a hash mark (I) through the line indicating your evaluation of each attribute. Cleanse your palate with water before you begin and as frequently as necessary during the evaluation session. Please comment on all attributes. CODE: xxx Aroma:
Lacks Aroma Aromatic
Appearance:
Old Fresh
Flavor: Typical celery flavor can be bitter and or sweet
Bitter Sweet
Liking of flavor:
Dislike Like
Texture:
Rubbery Crisp
Overall Liking:
Dislike Like
Comments: Sample Rank: Using code numbers, please rank samples from 1-4 1=like most 4=like least ___ ___ ___ ___ 1 2 3 4 Sensory Profile on Refrigerated Celery 10-20-08/Smart G
Appendix B: Sensory Ballot Sheet

111
Appendix C: Material Spec Sheets

112

113

114

115

116
Week 0 Pictures
Week 12 Pictures
Appendix D: Celery Pictures

117
Ecoflex close- up picture: Week 12
PLA close-up picture: Week 12
Appendix E: Material Deterioration

118
Mater-Bi close- up picture: Week 12

119
REFERENCES
Anker, M. (1996). Edible and biodegradable films and coatings for food packaging literature review. Goteberg, Sweden : Ski-Report.
APIACEAE (formerly UMBELLIFERAE)- The Celery Family. (n.d.). Retrieved June 28, 2009, from http://theseedsite.co.uk/apiaceae.html
ASTM. (1990). Standard Test Method for Water Vapour Transmission Rate Through Plastic Film and Sheeting Using a Modulated Infrared Sensor. Designated: F 1249 , pp. 1-5.
ASTM. (1993). Standard Test Method for Water Vapor Transmission of Materials. Standard Designation: E 96. , pp. 771-778.
ASTM. (2002). Standard Test Method for Oxygen Gas Transmission Rate Through Plastic Film and Sheeting Using a Coulometric Sensor. Standard Designation: D 3985-02 .
ASTM D 14334. (n.d.). Standard test method for oxygen gas transmission rate through plastic film .
ASTM D 6400-04. (n.d.). Standard Specification for Compostable Plastics , pp. 596-598.
ASTM. (1991). Standard Test Method for Tensile Properties of Thin Plastics Sheeting. D882. Philadelphia, PA.
Bartz, J. A., & Brecht, J. K. (2003). Postharvest Physiology and Pathology of Vegetables. New York, NY: Marcel Dekker, Inc.
Bastioli, Catia. (2005). Handbook of Biodegradable Polymers. In G. M. Bohlmann, General Characteristics, Processability, Industrial Applications and Market Evolution of Biodegradable Polymers (pp. 183-185). Smithers Rapra Technology .
Burg, S. P. (2004). Postharvest Physiology and Hypobaric Storage of Fresh Produce . Oxfordshire, UK: CABI Publishing .
Caner, C. (1997). Thesis: Chitosan Film Mechanical and Permeation Properties as Affected by Solvents, Plasticizers and Storage Time. Clemson, S.C.
Catia, B. (2005). General Characteristics, Processability, Industrial Applications and Market Evolution of Biodegradable Polymers. In G. M. Bohlmann, Handbook of Biodegradable Polymers (pp. 183-185).
Celery: Facts, Discussion Forum, and Encyclopedia Article . (n.d.). Retrieved June 28, 2009, from AbsoluteAstronomy.com: http://www.absoluteastronomy.com/topics/celery

120
Cooksey, K., 2007. Packaging of Flesh Foods. PKGSC 464/664 Class notes. Clemson University, Clemson, SC.
Davis, J. (2004). Tensile Testing . Materials Park, OH: Davis & Associates .
Drumright, R. E., Gruber, P. R., & Henton, D. E. (n.d.). Polylactic Acid Technology. Advanced Materials .
Gomez, P. A., & Artes, F. (2005). Improved keeping quality of minimally fresh processed celery sticks by modified atmosphere packaging. Lebensmittel Wissenschaft und Technologie , 323-329.
Hardenburg, R., Watada, A., & Wang, C. (1986). The Commercial Storage of Fruits, Vegetables , and Florist and Nursery Stocks. In USDA Agricultural Handbook (p. 66). Washington, D.C.
Hunter, R. a. (1987). The measurement of appearance . New York: Wiley.
Instron: Materials Testing. (n.d.). Retrieved June 30, 2009, from Instron: Materials Testing: http://www.instron.us
Kilcast, D., & Subramaniam, P. (2000). The stability and shelf-life of food. Cambridge, England: Woodhead Publishing Limited.
Kimmel, R., 2006. PKGSC 416/616 Class notes. Clemson University, Clemson, SC.
Kovacs, E., Horvath, L., & Bnecze-Bocs, J. (1977). Comparison of sensory and instrumental methods in the study of color of celery. Acta Alimentaria 6(1) , 73-86.
Lamikanra, O., Imam, S., & Ukuku, D. (2005). Produce Degradation. Pathways and prevention . Boca Raton, FL: CRC Press.
Luo, Y., Suslow, T., & Cantwell, M. Celery. Davis, CA: Mann Laboratory, Department of Vegetable Crops, University of California, Davis, CA.
Mariniello, L., Giosafatto, C., Moschetti, G., Aponte, M., Masi, P., Sorrentino, A., et al. (2007). Fennel Wate-Based Films Suitable for Protecting Cultivations . Biomacromolecules , 3008-3013.
Motonori, Y., Witt, U., Skupin, D. G., Beimborn, D., & Muller, R.-J. Biodegradable Aliphatic-Aromatic Polyesters: "Ecoflex". Ludwigshafen, Germany.
NatureWorks-Sam's Club. (2005, October 24). Retrieved June 3, 2009, from Bio-Based plastic to cover Sam's produce: http://refrigeratedtrans.com/news/Sams-Club-to-use-NatureWorks-packaging/
Olusola Lamikanra, S. I. (2005). Produce Degradation. Pathways and Prevention . Boca Raton, FL: CRC Press. Taylor & Francis Group.
121
Plastral-Bioplastics. (n.d.). Retrieved June 3rd, 2009, from http://www.plastral.com.au/bioplastics.htm
Prakash, A., Inthajak, P., Huibregtse, H., Caporaso, F., & Foley, D. (2000). Effects of Low-dose Gamma Irradiation and Conventional Treatments on Shelf Life and Quality Characteristics of Diced Celery. Journal of Food Science , 1070-1075.
Rizzo, V., & Muratore, G. (2009). Effects of packaging on shelf life of fresh celery. Journal of Food Engineering , 124-128.
Robbs, P., Bartz, J., Mcfie, G., & Hodge, N. (1996). Causes of Decay of Fresh-cut Celery. Journal of Food Science , 444-447.
Robertson, G. L. (1993). Food Packaging: Principles and Practice . New York, NY: Marcel Decker Inc.
Roylance, D. (2001). STRESS-STRAIN CURVES. Cambridge, MA.
Saltveit, M., & Mangrich, M. (1996). Using density measurement to study the effectof excision, storage, abscisic acid, and ethylene on pithiness in celery petioles. J. Amer. Soc. Hort. Sci. , 137-141.
Selke, S. E., Cutler, J. D., & Hernandez, R. J. (2004). Plastics Packaging. Properties, Processing, Applications, and Regulations. Cincinnati, Ohio: Hanser Gardner Publications, Inc.
Seow, C., NG, K., & Bourne, M. (1992). Effect of blanching treatments in physiochemical properties of dehydrated carrots, celery and green beans. ASEAN Food Journal 7 (4) , 184-188.
Steele, B. (2004). Understanding and measuring the shelf-life of food. Cambridge England: Woodhead Publishing Limited .
Suslow, T., & Cantwell, M. (1998). Celery Produce Facts. Recommendations for Maintaining Postharvest Quality . Davis, California: http://postharvest.ucdavis.edu/produce .
USDA Plants. (n.d.). Retrieved June 30, 2009, from Plants Profile for Apium Graveolens var. dulce (Wild Celery): http://plants.usda.gov
Vina, S. Z., & Chaves, A. R. (2003). Texture changes in fresh cut celery during refrigerated storage . Journal of the Science of Food and Agriculture , 1308-1314.