THE EFFECT OF ASSET LIABILITY MANAGEMENT ON PROFITABILITY ... · the effect of asset liability...
52
THE EFFECT OF ASSET LIABILITY MANAGEMENT ON PROFITABILITY OF COMMERCIAL BANKS IN KENYA BY LILIAN AKWII OBARI A RESEARCH PROJECT SUBMITTED IN PARTIAL FULFILLMENT OF THE REQUIREMENTS FOR THE AWARD OF MASTER OF BUSINESS ADMINISTRATION, SCHOOL OF BUSINESS, UNIVERSITY OF NAIROBI OCTOBER 2015
Transcript of THE EFFECT OF ASSET LIABILITY MANAGEMENT ON PROFITABILITY ... · the effect of asset liability...

THE EFFECT OF ASSET LIABILITY MANAGEMENT ON
PROFITABILITY OF COMMERCIAL BANKS IN KENYA
BY
LILIAN AKWII OBARI
A RESEARCH PROJECT SUBMITTED IN PARTIAL
FULFILLMENT OF THE REQUIREMENTS FOR THE AWARD
OF MASTER OF BUSINESS ADMINISTRATION, SCHOOL OF
BUSINESS, UNIVERSITY OF NAIROBI
OCTOBER 2015

ii
DECLARATION
This research project is my original work and has not been submitted for examination
to any other University.
Signature…………………………….. Date………………………………
Lillian Akwii Obari
D61/64671/2013
This project has been submitted with my authority as the university supervisor.
Signature……………………………………. Date....................................................
Dr. Duncan Elly Ochieng; PhD, CIFA
Lecturer,
Department of Finance and Accounting

iii
ACKNOWLEDGEMENT
I would like to give glory and honor to the Almighty God for His profound blessings
that has enabled me reach this far. I would also like to thank all those whose
assistance proved to be a milestone in the success of my project. Although it is not
possible to name all of them, I wish to acknowledge a few people for their
professional input, support and encouragement during this research project.
First and foremost, I wish to express my profound gratitude and deep regard to my
supervisor, Dr. Duncan Elly, for his exemplary guidance, valuable feedback and
constant encouragement throughout the duration of the project. His continued interest,
remarkable patience, constructive feedback and critiques of the project in progress
have been invaluable.
My sincere gratitude goes to my family: my sisters, Emilly Adung’o, Catherine Isia,
Sarah Amoit, Elizabeth Naududu, Marion Asere and Joyce Obari for their emotional
support and encouragement throughout this study; mom and dad for giving me this
golden opportunity to aim higher in my studies by supporting and encouraging me to
work on this study.
Lastly I would like to acknowledge my best friend Billy Obango for the unceasing
support and encouragement he gave me throughout my study and close friends for
their moral and emotional support and encouragement throughout the study.

iv
DEDICATION
I dedicate this research project to my amazing parents Dr. Thadeus Obari and Mrs.
Immaculate Ojaamong and my sisters for their profound support and encouragement
to always soar with the eagles. I am forever indebted and grateful for their love and
support shown towards me.

v
TABLE OF CONTENTS
DECLARATION.......................................................................................................... ii
ACKNOWLEDGEMENT ......................................................................................... iii
DEDICATION............................................................................................................. iv
LIST OF TABLES ................................................................................................... viii
ABBREVIATIONS AND ACRONYMS ................................................................... ix
ABSTRACT .................................................................................................................. x
CHAPTER ONE: INTRODUCTION ........................................................................ 1
1.1 Background of the Study ......................................................................................... 1
1.1.1 Asset Liability Management ........................................................................... 2
1.1.2 Profitability ..................................................................................................... 3
1.1.3 The Relationship between Asset Liability Management and Profitability ..... 4
1.1.4 Commercial Banks in Kenya .......................................................................... 5
1.2 Research Problem .................................................................................................... 6
1.3 Research Objective .................................................................................................. 8
1.4 Value of the Study ................................................................................................... 8
CHAPTER TWO: LITERATURE REVIEW ........................................................... 9
2.1 Introduction .............................................................................................................. 9
2.2. Theoretical Framework ........................................................................................... 9
2.2.1 Liquidity Preference Theory ........................................................................... 9
vi
2.2.2 Trade off Theory ........................................................................................... 10
2.2.3 Portfolio Theory ............................................................................................ 11
2.3 Determinants of Profitability of Commercial Banks ............................................. 13
2.3.1 Liquidity ........................................................................................................ 13
2.3.2 Size of the Firm ............................................................................................. 13
2.3.3 Use of Leverage ............................................................................................ 14
2.3.4 The Risk Profile of the Firm ......................................................................... 15
2.3.5 Management Competence Index................................................................... 15
2.4 Empirical Review................................................................................................... 16
2.5 Summary of the Literature Review ........................................................................ 19
CHAPTER THREE: RESEARCH METHODOLOGY ........................................ 21
3.1 Introduction ............................................................................................................ 21
3.2 Research Design..................................................................................................... 21
3.3 Study Population .................................................................................................... 21
3.4 Data Collection ...................................................................................................... 21
3.5 Data Analysis ......................................................................................................... 22
3.5.1 Regression Model ......................................................................................... 23
3.6 Tests of Significance .............................................................................................. 24
CHAPTER FOUR: DATA ANALYSIS, RESULTS AND DISCUSSIONS ......... 25
4.1 Introduction ............................................................................................................ 25
4.2 Descriptive Statistics .............................................................................................. 25
4.3 Diagnostic Statistics ............................................................................................... 26
4.4 Correlation Analysis .............................................................................................. 27

vii
4.5 Effects of Asset Liability Management on Financial Performance ....................... 28
CHAPTER FIVE: SUMMARY, CONCLUSIONS AND
RECOMMENDATIONS ........................................................................................... 31
5.1 Introduction ............................................................................................................ 31
5.2 Summary of Findings ............................................................................................. 31
5.3 Recommendations .................................................................................................. 33
5.4 Limitations of the Study......................................................................................... 34
5.5 Suggestion for Further Research ............................................................................ 34
REFERENCES ........................................................................................................... 35
APPENDICES ............................................................................................................ 40
Appendix I: Commercial Banks in Kenya ................................................................... 40
Appendix Ii: Data Collection Schedule ....................................................................... 42

viii
LIST OF TABLES
Table 4.1: Descriptive Statistics .................................................................................. 25
Table 4.2: Model Summaryb ........................................................................................ 26
Table 4.3: Coefficientsa ................................................................................................ 27
Table 4.4: Correlations................................................................................................. 27
Table 4.5: Model Summary ......................................................................................... 28
Table 4.6: ANOVAa ..................................................................................................... 29
Table 4.7: Coefficientsa ................................................................................................ 29
ix
ABBREVIATIONS AND ACRONYMS
ALM-Asset Liability Management
ANOVA- Analysis of Variance
CBK-Central Bank of Kenya
IRR- Interest Rate Risk
KBA- Kenya Bankers Association
NII- Net Interest Income
NSE- Nairobi Securities Exchange
ROA- Return on Assets
ROE- Return on Equity

x
ABSTRACT
To effectively compete in the market place, banks manage their assets and liabilities
taking into consideration the risk level, earnings, liquidity, profit, solvency, the level
of loans and deposits to mitigate losses and thus improve profitability. Asset liability
management is comprehensive and dynamic framework used to measure, monitor and
manage the market risk of a bank. Considering that the Kenyan banking sector has
been competitive and ALM is critical for success of financial institutions, this
descriptive study set out to determine the effect of asset liability management on
profitability of commercial banks in Kenya. The study collected secondary data from
published financial statements of 44 commercial banks in Kenya for the period 2010
to 2014. The regression analysis establish that 47.7 percent of variations in financial
performance proxied by ROA are explained by variations in the study independemt
variables namely; Size, Capital structure and asset liability management position of
the bank. The findings show that there is a statistically significant positive
relationship between bank size and financial performance and a statistically
significant negative relationship between capital structure and financial performance.
A unit increase in ALM position caused by increase in advances and decrease in
deposits causes a decline in average financial performance of the banks. The study
therefore recommends that bank managers should put in place mechanisms to attract
deposits and low cost funding so as to manage any potential liquidity mismatches that
may force the banks to resort to expensive debt capital. Given that bigger banks are
seen to perform better than smaller banks, policy should be geared towards making
the smaller banks equally competitive so that they can contribute in financial
inclusion in the country. Future studies should revisit the presumed linear
relationships between the study variables and choice should be made on use of fixed
or random effects with the panel data.

1
CHAPTER ONE
INTRODUCTION
1.1 Background of the Study
The business environment is characterized by risks and uncertainties. To effectively
compete in the market place, banks manage their assets and liabilities taking into
consideration the risk level, earnings, liquidity, profit, solvency, the level of loans and
deposits to mitigate losses and thus improve profitability (Zopounidis, 2001). Asset
liability management can be achieved through mitigating risks within the accepted
levels. Financial institutions are inclined to carry out this process profitably and seek
to use optimal allocated capital (Angelopoulos and Mourdoukoutas, 2001).
According to Ozkan‐Gunay (1998) Asset Liability Management (ALM) has grown up
as a response to the problem of managing modern day business which is exposed to a
wide variety of risks in an environment where interest rates, exchange rates and
economic conditions are highly volatile. The maturity mismatches and changes in the
levels of assets and liabilities cause both liquidity risk and interest-rate risk. The ALM
process is the only solution for banks to survive in this rapidly changing environment
where the composition and risk profile of their assets and liabilities have a direct
impact on their performance and profitability.
Angelopoulos et al. (2001) posit that asset liability management (ALM) ensures that
all the relevant asset and liability classes are managed in an integrated fashion. The
values of the assets and the liabilities are influenced by, amongst others, management
strategy and economic circumstances. ALM models can be used to show the expected
development of an organization, usually measured as solvency and profitability,
dependent on both internal (strategy) and external (economy) factors. Zopounidis

2
(2001) maintain that traditional ALM models often only facilitate the use of one or a
few possible economic scenarios. These traditional models can be used to obtain a
general picture of the expected development of solvency and profitability. However,
these models do not take into account the uncertainty that is involved in predicting
long‐term economic developments. Managing liquidity and the balance sheet are
crucial to the existence of a financial institution and sustenance of its operations. It is
also essential for seamless growth of the balance sheet in a profitable way.
1.1.1 Asset Liability Management
According to Angelopoulos et al. (2001) the management of assets and liabilities can
be defined as the strategic management of the balance sheet for risk optimization
of liabilities and assets taking into account all market risks. Asset liability
management is comprehensive and dynamic framework used to measure, monitor and
manage the market risk of a bank. It is the management of structure of balance sheet
in such a manner that the net earnings from interest is maximized within the overall
risk-preference of the firm.
The management of assets and liabilities seeks to maximize earnings, adjusted for
risk, given the long-term shareholders. Uyemura (2003) argue that asset-liability
management is a cost profit function which takes into account the assumed risk, level
of earnings and liquidity of the bank. The management of asset and liabilities is
important because it acts as a risk management technique designed to earn an
adequate return while maintaining a comfortable surplus of assets beyond liabilities. It
takes into consideration interest rates, earning power, and degree of willingness to
take on debt and hence is also known as surplus management. Oguzsoy and Guven
(1997) indicate that the management of risk aims at assisting the banks to achieve a

3
balance between risks and profitability; this is realized through a proper match of
assets and liabilities. The firm is able to meet its short term obligations when due and
also invest in profitable ventures.
The function of ALM is not just protection from risk. The safety achieved through
ALM also opens up opportunities for enhancing net worth. Interest rate risk (IRR)
largely poses a problem to a bank’s net interest income and hence profitability.
Changes in interest rates can significantly alter a bank’s net interest income (NII),
depending on the extent of mismatch between the asset and liability interest rate reset
times. Changes in interest rates also affect the market value of a bank’s equity. Asset
liability management will be measured using credit risk which is measured using loan
loss reserve divided by portfolio at risk (Moore, 2006).
1.1.2 Profitability
According to Penman (2007), profitability can be defined as the ability of the firm to
make profit from its business activities. Profitability measures the efficiency in the
utilization of organizational resources in adding value to the business. Profitability is
deemed as a relative term measurable in terms of profit and its relation to other
elements that directly influence profitability. According to Srivastava and Srivastava
(2006), profitability is the ability of a given investment to earn a return from its use.
Pandy (2005) argues that profit maximization is the fundamental objective of all firms. In
a competitive marketplace, a business owner must learn to achieve a satisfactory level
of profitability. Increasing profitability involves determining which areas of a
financial strategy are working and which ones need improvement. Profitability is a
measure of economic gains realized by a firm in relation to the capital invested. This

4
level of economic success can be determined by the amount of reported profits in a
financial year. Profitability measures include: ROA (Return on Assets) computed as
Net Income divided by Total Assets and ROE (Return on Equity) computed as to Net
Income divided by Equity, which is the ultimate measure of economic success.
1.1.3 The Relationship between Asset Liability Management and Profitability
Asset liability management enables the firm to balance between its liabilities and
assets. This in turn minimizes financial risks and hence improves profitability. Asset
liability management of the firm guides the management of the firm in making
investment decision. This is because the firm is able to allocate sufficient funds for
investment as a result of adoption of liquidity management best practices (Uyemura
and Van Deventer, 2003).
Uyemura (2003) argues that firms that maintain a proper structure of their balance
sheet records high profitability compared to those firms who fail to maintain proper
balances of assets and liabilities. This is achieved by effective risk management which
play an integral role in addressing financial risk since all risk cannot be eliminated but
it is the responsibility of risk managers to identify their risk levels and know which
level can be controlled or accepted. Anjichi (2014) notes that sound asset liability
management practices create a profitable and conducive environment that enables
financial institutions to define strategic asset allocation and to identify financial
opportunities and uncertainty in order to improve their financial resources. Asset
liability management is relevant to, and critical for, the sound management of the
finances of any firm that invests to meet its future cash flow needs and capital
requirements.

5
Bhunia (2010) indicates that asset and liability management ensures that the firm is
liquid to meet short term obligations of the firm for instance; payments for expenses
like salaries, materials and taxes. Future cash flows are uncertain, holding cash gives
a safety margin for eventual downturns. It is an important task for the financial
manager to achieve appropriate balance between liquidity and profitability when
making key investment decisions.
1.1.4 Commercial Banks in Kenya
The banking industry in Kenya is regulated by the Central Bank of Kenya Act,
Banking Act, and the Companies Act among other guidelines issued by the Central
Bank of Kenya (CBK). Commercial banks in Kenya are licensed, supervised and
regulated by the Central Bank of Kenya (CBK) as mandated under the Banking Act
(Cap 488). Banking industry in Kenya was liberalized back in 1995 and exchange
controls revoked (CBK, 2015). Currently there are there are 43 licensed commercial
banks and 1 mortgage finance company. The banks have come together under the
Kenya bankers Association (KBA), which works as lobby for the local banking
industry. Kenya bankers Association (KBA) also serves as a forum to address issues
affecting the banking sector (CBK, 2015).
Mwende (2014) indicates that the commercial banks in Kenya has over the past few
years enjoyed exponential growth in deposits, assets, profitability and products
offering, mainly attributed to automation of services and branch network expansion
both locally and regionally. This growth has brought about increasing competition
among players and new entrants into the banking sector. Asset-liability management
plays a crucial role in enabling the bank to mitigate their financial losses. Currently,
banks are now focusing on the diverse customer rather than traditional banking
products such as over the counter deposits and withdrawal.

6
Commercial banks aims to have a proper match in the terms of the rate sensitive
assets with their funding sources in order to reduce interest rate risk while maximizing
profitability. Due to changes in the market commercial banks are forced to adjust the
interest rate on deposits upward to remain competitive, but their earning assets are
concentrated in long- term, fixed-rate loans, and investments. Financial performance
might be impaired because the institution cannot adjust its income earned on loans
upward as fast as the cost of funds is increasing. Interest rate risk to some degree is
unavoidable, but it is manageable (Zenios and Ziemba, 2007).
1.2 Research Problem
To cope with the changes in the environment, banks have been forced to effectively
manage their asset and liability to mitigate various risks that arise due to mismatch
between their assets and liabilities that is loans and advances of the bank
(Angelopoulos et al., 2001). According to Oguzsoy and Guven (1997) asset liability
management (ALM) is an essential tool for monitoring, measuring and managing the
market risk of a bank.
Due to changes in the environment the Kenya market has become competitive,
competition usually reduces the margin between the interest rate charged on loans and
the rate paid on deposits. In a competitive environment, commercial banks may not be
able to increase rates earned on loans or lower the rate paid on deposits without
affecting client demand and the profitability of the institution. Managers should strive
to reduce or manage the effect interest rate risk will have on the commercial banks
profitability. Proper management of assets and liabilities ensures a smooth and
efficient functioning of the banking sector in a manner that it accommodates changes
in the external environment. Mwende (2014) indicates that developing appropriate
bank management strategies assists banks in mitigating financial risks and engaging
in profitable ventures.

7
Chakraborty (2008) did a study to establish the relationship between asset liability and
profitability of Indian pharmaceutical companies. The findings depicted a significant
positive relationship between the asset liability and profitability of the pharmaceutical
firms. Deloof (2003) studied the effect of asset liability management and profitability
of Belgian services firms. The results revealed that there was a positive correlation
between asset liability management and profitability. Belete (2013) investigated the
relationship between asset liability management and commercial banks profitability in
Ethiopia. The results confirmed that assets of the commercial banks exhibited a
positive relationship with profitability. Similarly, it was further revealed that liabilities
had a significant negative relationship with the bank’s profitability.
Gikonya (2011) investigated the effect of asset liability management on profitability
of commercial banks in Kenya. The study found out that there is a positive
relationship between profitability and asset liquidity management of commercial
banks in Kenya. The study limited itself to: return on assets (ROA) and current ratios.
Therefore, the current study seeks to extend the model by incorporating the following
variables: financial leverage and management efficiency to assess commercial bank’s
debt to equity ratio and how management efficiency impacts on operating profit to
income ratio.
From the above studies, little focus has been laid on the effect of asset liability
management and profitability of commercial banks in Kenya. Gikonya (2011)
recommended that banks entrench effective asset liability management policies so as
to maximize their profits. This study therefore sought to expand on the effective asset
liability management policies with the intent to answer the following research
question: What is the effect of asset liability management on profitability of
commercial banks in Kenya?
8
1.3 Research Objective
This study sought to determine the effect of asset liability management and
profitability of commercial banks in Kenya.
1.4 Value of the Study
The study provides more understanding of the best practices in managing different
risks in the banking industry and economic environment. It will also provide insights
to other firms in the finance sector on how to mitigate risks through ensuring a proper
balance between assets and liabilities.
Central bank is a key partner in policy setting. It might use the findings for this study
to set policies that ensure commercial banks manage their assets and liabilities to
mitigate financial risks. This enables commercial banks to meet their short-term
financial obligations and maintain a good balance that guarantees improved
profitability and long-term viability.
This research work contributes to the literature on significance of maintaining a
proper balance between assets and liability and risk reduction. This research therefore
forms the basis for further research into the application of innovative asset and
liability management strategies by similar industry players since it has a direct bearing
with institutional profitability.

9
CHAPTER TWO
LITERATURE REVIEW
2.1 Introduction
This chapter covers the theoretical framework, the determinants of profitability,
empirical studies and the summary of the literature review.
2.2. Theoretical Framework
This section reviews the theories that support the relationship between asset-liability
management and the profitability of firms. These theories are namely: liquidity
preference theory, tradeoff theory and portfolio theory.
2.2.1 Liquidity Preference Theory
This concept was first expressed by Keynes (1989), this theory is also known as
liquidity preference hypothesis. Liquidity preference theory intimates the idea that
investors demand a premium for securities with longer maturities, which entail greater
risk, because they would prefer to hold cash, which entails less risk. The more liquid
an investment, the easier it is to sell quickly for its full value. The amount of money
demanded for this purpose increases as income increases. When the interest rate
decreases people demand more money to hold until the interest rate increases, which
would drive down the price of an existing bond to keep its yield in line with the
interest rate. Thus, the lower the interest rate, the more money demanded and vice
versa.
Jappelli and Pagano (2002) indicate that a financial institution that lends out credit to
borrowers may face liquidity problem especially if the borrowers are not able to pay
the loans on time. This may prevent the firms from investing in profitable projects
that promises higher returns in future. According to this theory, a firm needs to hold

10
more cash for investment, it is therefore important for the firm to mitigate the level of
credit risk by ensuring that borrowers are credit worthy before giving out credit
(Rogers, 1997).
The relevance of this theory is that firms should maintain an optimal level of liquidity.
This is because the firm is able to grasp opportunities that promise higher returns.
Pasinetti (1997) emphasizes that the firm should work towards achieving a balance
through proper management of the firm’s finances to meet future cash flow needs and
capital requirements. It is therefore important for the firm to put efforts in monitoring
and coordinating its assets and liabilities. This will enable the firm to gain stability
and thus easily absorb risks and shocks. Asset liability management is a key
ingredient towards achieving efficiency and growth of banks.
2.2.2 Trade off Theory
Brusov and Filatova (1991) posit that trade-off theory of capital structure refers to the
idea that a firm chooses the amount of debt finance and how much equity finance to
use by balancing the costs and benefits. Canner et al. (1997) emphasizes that
corporations are usually financed partly with debt and partly with equity. The firm has
to make a proper match between its assets and liabilities in order to protect itself from
financial risks and take advantage of profitable investment opportunities.
According to Brusov (2013), trade-off theory of capital structure basically deals with
the two concepts namely; the cost of financial distress and agency costs. The
relevance of the trade- off theory of capital structure is to explain the fact the firms are
usually financed partly with debt and partly with equity. This means that the firm
should make appropriate decisions regarding when to use debt and equity to finance
its investment. In so doing, an appropriate match between assets and liabilities should

11
be maintained to mitigate financial losses and from various risks and loss of
investment opportunities.
There are certain benefits that accrue once a firm is financed using debt; the tax
benefits of debt. There is a cost of financing with debt, financial distress costs
including bankruptcy costs of debt and non-bankruptcy costs for instance staff
turnover, suppliers demanding disadvantageous payment terms (Modigliani and
Miller, 1958). Brau and Woller (2004) argue that a firm experiences financial distress
when the firm is unable to cope with the debt holders' obligations. If the firm
continues to fail in making payments to the debt holders, the firm can even be
insolvent. With a proper balance of assets and liabilities, the firm is less likely to face
challenges of financial distress. The assumption of this theory is that as the marginal
benefit of the firm increases the debt declines. Similarly, while the marginal cost
increases the firm optimizes its overall value and thus focuses on the tradeoff when
choosing how much debt and equity to use for financing.
2.2.3 Portfolio Theory
Markowitz (1952) posits that portfolio theory plays a pivotal role in making
investment decisions. This theory emphasizes on the need to have a portfolio balance
model of asset diversification to mitigate the financial risks that may expose the firm
to financial losses. This might negatively affect the liquidity position of a financial
institution. However, a well-defined portfolio prevents the firm from sustaining total
loss since the risks are minimized by the portfolio of assets invested by the firm.
Black, Jensen and Scholes (1972) argue that this implies that the portfolio
diversification and the desired portfolio composition of commercial banks are results
of decisions taken by the bank management. The ability to attain maximum profits

12
depends on the feasible set of assets and liabilities determined by the management and
the unit costs incurred by the bank for producing each component of assets
(Nzongang and Atemnkeng, 2006). This means that the firm can limit the volatility of
the firms’ portfolio to improve its performance by spreading the risks among different
types of securities that do not always behave the same way.
According to Canner et al. (1997), the relevance of this theory is that the firm should
maintain a proper balance of assets and liabilities to meet its short-term and long-term
financial obligation. To maintain this balance, the firm should diversify its portfolios
to minimize risks that may bring about financial losses and impact negatively on the
liquidity position of a financial institution. This is important because each asset class
performs differently over time due to its unique balance of risk and reward.
Previously, stocks have a higher rate of return, but also a higher risk. Bonds and cash
are both usually lower-risk investments, thus produce more modest returns.
Modigliani and Miller (1958) put forth that periodic rebalancing has significantly
lower the risk of a portfolio. A firm that intends to mitigate its risks should work
towards establishing a portfolio to cope with the various risks. It is imperative to note
that investments in a portfolio may alter their values due to changes in the external
environment. This might negatively affect the balance of asset portfolio allocation
mix. To maintain a proper balance of your portfolio that can cope with the changes in
the market, the firm should practice rebalancing. This means that the firm should
consider selling the proportions of its investments that have accumulated high values.
Those funds can then be sued to purchase underperforming portfolio of assets and
retain the original asset allocation mix.

13
2.3 Determinants of Profitability of Commercial Banks
Determinants of profitability are essential components in assisting the firm towards
achieving profits. Below are some of the determinants of profitability that have been
discussed in this study: liquidity, size of the firm, use of leverage and the risk profile
of the firm.
2.3.1 Liquidity
Liquidity is characterized by a high level of trading activity. It measures how much
cash a company has and how easily it is able to pay its debt. Assets in any firm are
categorized into various classes. A firm that holds high amount of cash is likely to
take advantage of profitable investments unlike a firm that is illiquid. Credit risk may
expose a firm. Liquid assets constitute a significant portion of a firm’s total asset
(Bourke, 2002).
Financial managers pay due attention to the measurement and management of
corporate liquidity failure to which may lead to severe shortage of liquidity leading to
inability to meet its short and medium term obligations as and when they become due
hence financial distress (Uyemura, 1993). Liquidity risk can be measured by two
main methods: liquidity gap and liquidity ratios. The liquidity gap is the difference
between assets and liabilities at both present and future dates. Liquidity is the amount
of capital that is available for investment and spending. Capital includes cash, credit
and equity (Bourke, 2001).
2.3.2 Size of the Firm
The other determinant of profitability is the size of the firm. Large firms are more
likely to manage their working capitals more efficiently than small firms. According
to Zenios and Ziemba (2007), most large firms enjoy economies of scale and thus are
14
able to minimize their costs and improve on their financial performance. Size of a
firm is measured by the sales volume of a firm.
The proxy used for calculating the size of the firm is the log of net sales including
Sharpe (1990) in their research studies have found out a negative relation between
size of firm and its leverage as there is more transparency about large firms which
reduces the undervaluation of new equity issue and encourages the firms to finance
through their equity. If the size of the firm increases profitability also increases
therefore large sized firms tend to be more profitable. This means that a positive
relationship is expected between the size of the firm and profitability (Sharpe and
Tint, 1990).
2.3.3 Use of Leverage
Leverage of the firm is a key determinant of profitability of the firm. The firms
leverage decisions centers on the allocation between debt and equity on financing a
firm. Rosen and Zenios (2006) notes that leverage affects the level and variability of
the firm's after tax earnings and hence, the firm's overall risk and return.
The study of leverage is significant due to the following reasons: Operating risk refers
to the risk of the firm not being able to cover its fixed operating costs. Since operating
leverage depends on fixed operating costs, larger fixed operating costs indicates
higher degree of operating leverage and thus, higher operating risk of the firm. High
operating leverage is good when sales are rising but risk when the sales are falling
(Memmel and Schertler, 2011).

15
2.3.4 The Risk Profile of the Firm
The risk profile of the firm is a key determinant of profitability. Due to the turbulent
nature of the external environment firms are exposed to different risks that may
negatively affect their profitability. These risks may expose the firm to additional
costs or disruption of operations. DeYoung and Yom (2008) argue that financial risk
management allows firms to seize opportunities by allowing managers to better
identify and more effectively assess capital needs and improve capital allocation.
Kusy and Ziemba (2001) indicate that firm managers are likely to have many
opportunities to create value for shareholders however; they must ensure a proper
match between assets and liabilities in order to mitigate risks and create room for
investment opportunities. Firm managers should secure business continuity and
support the achievement of the company’s goals by preventing dangerous situations in
an efficient way.
2.3.5 Management Competence Index
Management defines competence is the characteristics or traits of a person which he
or she uses to improve performance. The management of the firm is expected to be
competent to achieve efficient and effective delivery of quality services that improves
customer satisfaction. This in turn leads to improved profitability of the firm (Pandy,
2005).
Penman (2007) posits that the capability of the management to deploy its resources
efficiently, income maximization, reducing operating costs can be measured by
financial ratios. One of these ratios used to measure management quality is operating
profit to income ratio. The higher the operating profits to total income the more the
efficient management is in terms of operational efficiency and income generation.

16
Pasinetti (1997) explains that the other important ratio is expense to asset ratio. The
ratio of operating expenses to total asset is expected to be negatively associated with
profitability. Management quality in this regard, determines the level of operating
expenses and in turn affects profitability.
2.4 Empirical Review
Moore (2006) investigated the impact of asset and liability management on financial
performance of commercial banks in United Kingdom. The sample size consisted of
45 commercial banks. An explorative survey was used to test the relationship between
the variables, the results of the study found a positive correlation between asset
liability management and financial performance of commercial banks.
Singh (2008) conducted a study on the relationship between working capital
management and profitability of small manufacturing firms in Europe. A survey of
100 manufacturing firms was conducted and secondary data sources from financial
statements of these firms were used. The researcher did a cross-sectional study for
these firms and the data was analyzed using descriptive statistics. It was concluded
that there was a positive relationship between working capital components and
profitability of manufacturing firms in Kenya.
Stierwald (2010) studied the impact of asset and liability management on Profitability
of large Australian firms. The study used a descriptive survey and secondary data
source for five years was obtained from financial statements and records of large
Australian firms. The study used secondary data sources. Correlation and regression
analysis were used for analysis to show the relationship between the variables. The
results of the study found that there was a positive relationship between asset and
liability management and profitability.

17
Gikonya (2011) studied the relationship between asset liability management and
profitability of commercial banks in Kenya. A cross-sectional survey was used in a
population of 43 licensed commercial banks in Kenya. Secondary data was obtained
from financial statements and records of commercial banks. Analysis of data was
done using a linear regression mode. The study found asset liability management was
positively related to profitability. The limitation of this study is that it did not
investigate the effect of financial leverage on profitability of commercial banks and
the effect of financial risk and profitability of the firm.
Maina (2011) examined the relationship between liquidity management and
profitability of the Oil companies in Kenya. The study covered the period 2007- 2010.
A regression model was developed to determine the relationship between the
dependent variable (Profitability of the firms) and independent variables (liquidity
position). The independent variable used in the model consisted of Current ration,
quick ratio, cash conversion cycle, while leverage and the age of the firm were used
as control variables. The results of the study showed a weak relationship between
liquidity and profitability. The study concluded that liquidity management is not a
significant contributor alone of the firm’s profitability and there exist other variables
that will influence ROA.
Wambu (2013) sought to establish the relationship between the profitability and the
liquidity of commercial banks in Kenya. The population of the study was comprised
of all 44 commercial banks in Kenya operating in the years 2008 to 2012. For a bank
to qualify it needed to have been in operation during the whole period of the study and
therefore institutions that merged or were not in operation in the whole period of
study were eliminated The study used secondary data obtained from audited financial

18
statements of the banks for five years and a regression model was used for data
analysis. The study used secondary data collection of the return on assets, to measure
profitability and CBK liquidity ratio and current ratio to measure liquidity in each
year. The study found out that there was an inverses relationship between profitability
and liquidity of commercial banks in Kenya.
Gregory (2013) investigated the relationship between asset liability management and
financial performance of sampled service firms in America. The study used a
longitudinal study research design. Secondary data for ten years was obtained from
financial statements and records. Analysis of data was done using a regression model.
The study concluded that there was a positive relationship between asset liability
management and financial performance of service firms in United States.
Darush (2013) did a study on the impact of asset liability management and financial
performance of Swedish firms. The study used a cross-sectional survey design
whereby secondary sources of data were obtained from the financial statements of
Swedish micro firms. The study used descriptive statistics for analysis; the results
established that there was a positive correlation between asset liability management
and financial performance of Swedish micro firms.
Karani (2014) carried out a study to investigate the effect of liquidity management on
profitability of commercial banks in Kenya. The population of the study comprised of
all the 43 commercial banks in Kenya operating in the years 2009 to 2013. Secondary
data was obtained from audited financial statements and records. The study used
regression analysis to establish the relationship between liquidity management and
profitability. The study found out that liquidity management was positively related to
profitability of commercial banks in Kenya.

19
Anjichi (2014) did a study to establish the relationship between asset and liability
management and financial performance of commercial banks in Kenya. The study
used a descriptive survey to find out the relationship between the variables. The
population of the study involved 43 licensed commercial banks in Kenya. Secondary
data was obtained from central bank for a period between 2005-2010. Data was
analyzed using a regression model and the results of the analysis indicated that there
was a positive a relationship between the asset and liability management and financial
performance of commercial banks in Kenya.
2.5 Summary of the Literature Review
The results of the empirical findings confirms to the hypothesis of the study which
predicts the existence of a positive relationship between asset liability management
and profitability of commercial banks in Kenya. Literature has confirmed that poor
management of assets and liabilities exposes the firm into financial risks that might
impact negatively on the profitability of the firm. The firm should therefore work
towards achieving a proper match between assets and liabilities. This is also
consistent with the theories of the study which shows that firms that maintain a proper
fit between their assets and liabilities achieve profitability as compared to those firms
that do not effectively balance their assets and liabilities.
The above studies have shown that there exists a positive relationship between asset
liability management and profitability of the firm. Examples include: Gikonya (2011),
Karani (2014) and Anjichi (2014) among others. However, the limitations of this
study are that they have limited themselves to the main variables of the study that is
return on assets and current ratio. This therefore necessitates the need to investigate

20
other factors that have a bearing on asset liability management and impacts on the
profitability of commercial banks in Kenya. The current study considers two more
variables other than the two main variables discussed previously by Gikonya (2011),
Karani (2014) and Anjichi (2014). These variables are: financial leverage and
management efficiency as captured under the determinants of profitability in this
study. This study therefore seeks to find an answer to the research question; what is
the effect of asset liability management on profitability of commercial banks in
Kenya?

21
CHAPTER THREE
RESEARCH METHODOLOGY
3.1 Introduction
This section gives an outline of the research methodology that will be used for the
study. It comprises the research design, the study population, data collection and data
analysis.
3.2 Research Design
The study will use a descriptive survey. Kothari (2004) posit that a descriptive survey
is used in explaining the relationship between variables in a study. It will be applied in
laying more emphasis in determining the extent of association between the variables
and the relationships exhibited between them. A descriptive survey will be used in
establishing the relationship between asset liability management and profitability of
commercial banks in Kenya.
3.3 Study Population
Cooper and Schindler (2008) posit that a target population is a complete set of cases,
objectives or individuals with similar characteristics. According to CBK (2015) there
are 43 commercial banks in Kenya that are licensed to work and operate within the
boundaries of Kenya (See Appendix I). The research will study all the 43 licensed
commercial banks in Kenya. This is because of their composition and risk profile of
their assets and liabilities that have a direct impact on their performance and
profitability.
3.4 Data Collection
The study will use secondary sources of data since the nature of data to be collected in
quantitative. Secondary data will obtained from the regulator; central bank of Kenya.

22
The data will be extracted from audited financial statements of commercial banks for
the period of five years (2010-2014). Data selection will be done based on the
measurements of the specific variables under investigation. Profitability will be
measured using ROA. The measurements will be obtained profit and loss statements
and balance sheet statements. Current ratio will be measured using current assets
divided by current liabilities. These measurements will be obtained from the balance
sheet statements. Size of the firm will be measured using natural logarithm of total
assets. These measurements will be obtained from the balance sheet statements.
Management efficiency will be measured using operating profit to income ratio.
These measurements will be obtained from profit and loss statements while financial
leverage measurements will be obtained from balance sheet statements.
3.5 Data Analysis
Data will be analyzed using descriptive statistics, correlation analysis and regression
model. This will include: mean and standard deviation which will be used in showing
the relationship between the variables. Inferential statistics will be used in establishing
the relationship between Asset liability management and profitability of commercial
banks in Kenya.
The summary of the output will be used to determine correlation and coefficient of
determination while the tests of coefficient will be used to determine the p-values.
Analysis of variance (ANOVA) will be used to test hypothesis of this study which
predicts a positive relationship between asset liability management and profitability of
commercial banks in Kenya.
23
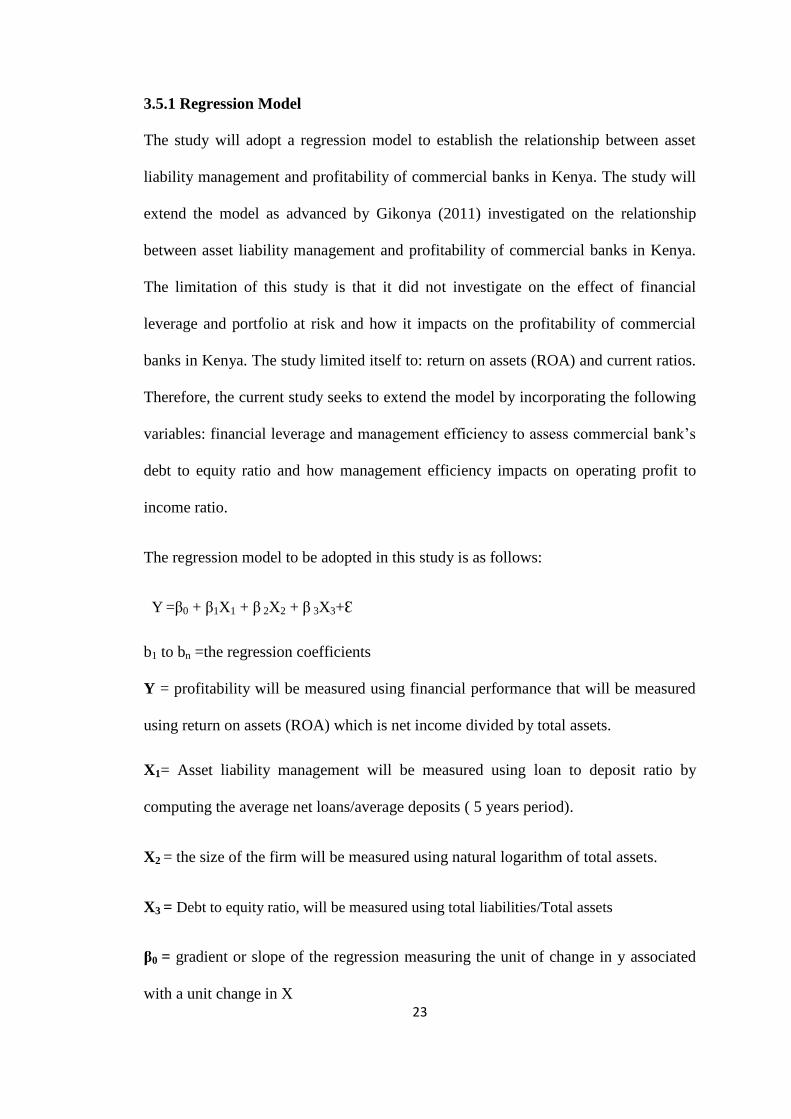
3.5.1 Regression Model
The study will adopt a regression model to establish the relationship between asset
liability management and profitability of commercial banks in Kenya. The study will
extend the model as advanced by Gikonya (2011) investigated on the relationship
between asset liability management and profitability of commercial banks in Kenya.
The limitation of this study is that it did not investigate on the effect of financial
leverage and portfolio at risk and how it impacts on the profitability of commercial
banks in Kenya. The study limited itself to: return on assets (ROA) and current ratios.
Therefore, the current study seeks to extend the model by incorporating the following
variables: financial leverage and management efficiency to assess commercial bank’s
debt to equity ratio and how management efficiency impacts on operating profit to
income ratio.
The regression model to be adopted in this study is as follows:
Y =β0 + β1X1 + β 2X2 + β 3X3+Ɛ
b1 to bn =the regression coefficients
Y = profitability will be measured using financial performance that will be measured
using return on assets (ROA) which is net income divided by total assets.
X1= Asset liability management will be measured using loan to deposit ratio by
computing the average net loans/average deposits ( 5 years period).
X2 = the size of the firm will be measured using natural logarithm of total assets.
X3 = Debt to equity ratio, will be measured using total liabilities/Total assets
β0 = gradient or slope of the regression measuring the unit of change in y associated
with a unit change in X

24
€ = Error term within a confidence interval of 5%
3.6 Tests of Significance
Model for coefficients will be used to test the hypothesis of this study. The level of
significance will be determined using p-values. If the p-value(s) is more than 5% then
the null hypothesis is true since this will mean that there is no statistically significant
relationship between asset liability management and profitability of commercial banks
in Kenya.
Similarly, if the p-value is less than 5% then the alternative hypothesis will be
considered true since this will mean that there is a positive relationship between
variables. The coefficient of determination will be used to determine if the model is a
satisfactory predictor or not using the R2. R is the correlation coefficient which varies
from -1 to +1. (-1) means a perfect negative correlation and (+1) means perfect
positive correlation. All the tests will be performed at 95% degree of confidence.

25
CHAPTER FOUR
DATA ANALYSIS, RESULTS AND DISCUSSIONS
4.1 Introduction
This chapter presents the information processed from the data collected during the
study on the effects of asset liability management on financial performance of
commercial banks in Kenya. It presents the descriptive statistics, correlation analysis
and regression analysis from the study findings.
4.2 Descriptive Statistics
The study targeted 43 commercial banks with an expectation of attaining annual data
on the study variables translating to 215 observations. Because of instances of
imbalanced data, a balanced panel data of 136 observations was attained as shown in
table 4.1 below providing 63.3 percent of the expected data points.
Table 4.1: Descriptive Statistics
N Minimu
m
Maximu
m
Mean Std.
Deviation
Skewness
Statisti
c
Statistic Statistic Statistic Statistic Statistic Std.
Error
ROA 136 -.0480 .1040 .0359 .02186 -.547 .208
ALM 136 .0121 1.2429 .7564 .19015 -.206 .208
Debt Equity
Ratio 136 1.0000 17.9543 5.4698 2.0853 1.711 .208
Size 136 8.4185 12.6252 10.3710 1.2239 .061 .208
Valid N
(listwise) 136
As presented in table 4.1 above, the mean ROA for the commercial banks in the five
year period is 3.5 percent with a standard deviation of 0.021. The ROA data is
negatively skewed. Asset Liability management proportion represented by average

26
loans to average deposits is 75.64 percent which shows that not all deposits are
advanced by the banks to manage their cash flow gaps and their liquidity positions.
The ALM data set has a standard deviation of 0.190 and is negatively skewed.
The Mean debt equity ratio is at 5.469 with a standard deviation of 2.0853. The data is
positively skewed. The average size proxied by log of total assets is 10.3710 with a
standard deviation of 1.2239. The data is positively skewed.
4.3 Diagnostic Statistics
Durbin watson test is conducted to check on collinearity of variables. The value of
Durbin Watson statistic ranges from 0 to 4. As Presented in table 4.2 below, the value
of Durbin-Watson is 1.303 which is approximately close to 2. This is interpreted to
indicate no serial correlation. As a rule of thumb, residuals are considered
uncorrelated when the Durbin watson statistic is approximately 2.
Table 4.2: Model Summaryb
Model Durbin-Watson
1 1.303a
a. Predictors: (Constant), Size, Debt Equity Ratio, ALM
b. Dependent Variable: ROA
Variance inflation factor (VIF) and Tolerance levels are applied to test for
multicolinearity. The variance inflation factor (VIF) which is a reciprocal of tolerance
shows how much the variance of the coefficient estimate is being inflated by
multicollinearity. As a rule of thumb, Myers (1990) explain that a VIF for all the
independent and dependent variables less than 3 (VIF ≤ 3) indicates no
multicollinearity while a VIF of ≥ 3 indicates collinearity and more than 10 indicates
a problem with multicollinearity. The Tolerance Statistics values below 0.1 indicate a

27
serious problem while those below 0.2 indicate a potential problem. As indicated in
table 4.3 below, all the variables tolerance levels are greater than 0.2 and all the VIF
factors are less than 3 implying that the regression data are not prone to
multicollinearity problems.
Table 4.3: Coefficientsa
Model Collinearity Statistics
Tolerance VIF
1
ALM .968 1.033
Debt Equity Ratio .974 1.027
Size .978 1.022
a. Dependent Variable: ROA
4.4 Correlation Analysis
The Correlation matrix presented in table 4.4 below shows a statistically significant
weak positive association between ROA and bank size (r=0.451) and a statistically
significant weak negative assocation between capital structure and ROA (r=-0.484).
The association between ROA and bank size confirm the notion that larger financial
institutions tend to be more profitable than smaller financial institutions possibly
because of efficiencies from their scale of operations. The statistically significant
weak negative association between capital structure and ROA is an indication of
negative effects of gearing on overall firm performance.
Table 4.4: Correlations
ROA ALM Debt Equity Ratio Size
ROA 1
ALM .010 1
Debt Equity Ratio -.484**
-.131 1
Size .451**
.113 .079 1
**. Correlation is significant at the 0.01 level (2-tailed).

28
The study finds weak positive associations between ALM and ROA (r=0.010), ALM
and size (r=0.113) and Size and Capital structure (r=0.079). These relationships are
however not statistically significant. There is also a weak negative association
between capital structure and ALM position (r=-0.131) which is not statistically
significant.
4.5 Effects of Asset Liability Management on Financial Performance
A regression model was fitted to estimate the effects of ALM on financial
performance of commercial banks in Kenya. As indicated in table 4.5 below, 47.7
percent of variations in financial performance proxied by ROA are explained by
variations in the study independemt variables namely; Size, Capital structure and asset
liability management position of the bank (Adjusted R Squared = 0.477).
Table 4.5: Model Summary
Mode
l
R R Square Adjusted R
Square
Std. Error of
the Estimate
1 .699a .488 .477 .0158165
a. Predictors: (Constant), Size, Debt Equity Ratio, ALM
Table 4.6 below shows that the fitted regression model is significant with F statistic of
41.983 and P< 0.05 which indicates that the points lie moderately close to the line of
best fit in the scatter diagram. This indicates that the model is relatively suitable in
explaining the variance of financial performance of the commercial banks as
explained by the variance in ALM, Capital Structure and Bank Size.

29
Table 4.6: ANOVAa
Model Sum of
Squares
df Mean
Square
F Sig.
1
Regression .032 3 .011 41.983 .000b
Residual .033 132 .000
Total .065 135
a. Dependent Variable: ROA
b. Predictors: (Constant), Size, Debt Equity Ratio, ALM
Table 4.7 below shows the coefficients of the fitted regression equation that translates
to:
ROA = -0.017 -0.117 (ALM) – 0.539 (Debt equity) + 0.507 (Size)
Table 4.7: Coefficientsa
Model Unstandardized
Coefficients
Standardized
Coefficients
t Sig.
B Std. Error Beta
1
(Constant) -.017 .013 -1.321 .189
ALM -.013 .007 -.117 -1.854 .066
Debt Equity Ratio -.006 .001 -.539 -8.542 .000
Size .009 .001 .507 8.055 .000
a. Dependent Variable: ROA
The study finds that ALM position negatively affects bank performance (ROA) (β=-
0.117, t = -1.854, p>0.05). A unit increase in the ALM proportion necessitated by
either an increase in advances or a decrease in deposits results into a decline in the
ROA by up to 0.117. This may be explained by the possibility that the increase
distabilizes the bank liquidity position and compells the bank to source for more
expensive financing to fund the liquidity gaps. The cost of such funding therefore
affects the overall profitability of the bank.

30
The study also observes a negative relationship between capital structure and financial
performance of the commercial banks (β=-0.539, t = -8. 542, p<0.05). This indicates
that a unit increase in debt equity ratio caused by an increase in leverage by the banks
or a decrease in bank equity influences a decline in the ROA to the extent of 0.539.
This finding suggests that excessive leverage affects banks financial performance
through the costs of borrowings.
There is also a positive relationship between bank size and financial performance.
From the regerssion output in table 4.7 above, a unit increase in bank size translates
into increased financial performance by up to 0.507. The relationship between size
and performance is statistically significant (β=0.507, t=8.055, p<0.05). This finding
therefore implies that comparatively, larger financial institutions post better financial
performance than the smaller financial institutions.

31
CHAPTER FIVE
SUMMARY, CONCLUSIONS AND RECOMMENDATIONS
5.1 Introduction
This chapter presents a summary of the study. It discusses the key findings and
interprets the results there from. The chapter also presents the conclusions drawn from
the research findings and provides recommendations for improvement as well as
suggestions for further research.
5.2 Summary of Findings
The mean ROA for the commercial banks in the five year period is 3.5 percent which
confirms the sound performance of the financial services sector when compared with
other sectors of the economy. The average loans to average deposits proportion is at
75.64 percent which shows that not all deposits are advanced by the commercial
banks. To manage their cash flow gaps and their liquidity positions, commercial
banks retain some reserves from deposits.
The statistically significant weak positive association between ROA and bank size
confirms the arguments that bigger banks tend to be more profitable than smaller
banks because of efficiencies from their scale of operations.
The regression model has an adjusted R squared of 0.477 which implies that 47.7
percent of variations in financial performance of the commercial banks proxied by
ROA are explained by variations in the study independemt variables namely; Size,
Capital structure and asset liability management position of the bank.

32
The study findings suggest that an increase in ALM position negatively affects bank
performance such that a unit increase in the ALM proportion necessitated by either an
increase in advances or a decrease in deposits results into a decline in the ROA by up
to 0.117. This specific finding shows that an increase in ALM proportions distabilizes
the bank liquidity position and compells the bank to source for more expensive
financing to fund the liquidity gaps. The cost of such funding therefore affects the
overall profitability of the bank.
The statistically significant negative relationship between capital structure and
financial performance of the commercial banks infers that a unit increase in debt
equity ratio caused by an increase in leverage by the banks or a decrease in bank
equity influences a decline in the ROA to the extent of 0.539. This finding suggests
that gearing negatively influences banks financial performance through the increased
costs of borrowings.
The statistically significant positive relationship between bank size and financial
performance shows that a unit increase in bank size translates into increased financial
performance by up to 0.507. This finding confirms the proposition that comparatively,
larger financial institutions post better financial performance than the smaller
financial institutions.
The study findings are a departure from earlier propositions Moore (2006), Stierwald
(2010), Gregory (2013), Darush (2013), Gikonya (2011), Karani (2014) and Anjichi
(2014). In the United Kingdom, Moore (2006) found a positive correlation between
asset liability management and financial performance of commercial banks. In
Australia, Stierwald (2010) found a positive relationship between asset and liability
33
management and profitability. In The United States, Gregory (2013) notes a positive
relationship between asset liability management and financial performance of service
firms and in Sweden, Darush (2013) established that there was a positive correlation
between asset liability management and financial performance.
In Kenya, Gikonya (2011) found asset liability management was positively related to
profitability of commercial banks. Anjichi (2014) indicated that there was a positive a
relationship between the asset and liability management and financial performance of
commercial banks and Karani (2014) observed that liquidity management was
positively related to profitability of commercial banks.
5.3 Recommendations
Given that a unit increase in asset liability position of the commercial banks
necessitated by increase in advances and decrease in deposits may lead to a decline in
bank performance, bank management should put in place mechanisms that ensure
there is no liquidity mismatch caused by increased lending and reduced deposits that
compels the bank to borrow at costlier rates and reduce their overall profitability.
In view of the research findings, a significant positive relationship is evident between
bank size and levels of commercial banks financial performance. Policy makers
should endeavor to put in place policies that support smaller commercial banks to be
competitive and eventually stable and successful so as to promote further financial
deepening in Kenya.
The significant negative relationship between capital structure and financial
performance is a pointer to the negative effects of gearing on banks performance.
Bank management should continually monitor their long term debt position so as not
to expose the bank to overall financial instability.

34
5.4 Limitations of the Study
Secondary data was collected from the specific banks’ financial reports as per the
central bank of Kenya requirements. The study was therefore limited to the degree of
precision of the data obtained from the secondary source. While the data was
verifiable, it may however be prone to these shortcomings associated with preparation
or collection as well as accounting standards.
The study was based on a five year study period from the year 2010 to 2014. A longer
duration of the study will have captured periods of different economic performance
that may clearly show the trend of the relationships.
The study presumed a linear relationship between the variables. There is chance that
the variables may relate in other forms other than the presumed linear relationships.
There is chance to pursue curvilinear models as well.
5.5 Suggestion for Further Research
This study has examined the effect of ALM on performance of commercial banks in
Kenya. A similar study for a longer period should be carried out in other forms of
financial institutions and in other countries to ascertain if the same findings will be
obtained. Other types of relationships other than linear relationships could be
modeled.
Future research on this area should review the applicability of linear regression
models. The data sets should be tested for application of fixed effects and random
effect models given that the studies are based on panel data.

35
REFERENCES
Angelopoulos, P. & Mourdoukoutas, P. (2001). Banking Risk Management in a
Globalizing Economy, Greenwood Publishing Group, Westport, CT.
Anjichi, D. A. (2014). Effects of asset and liability management on the financial
performance of commercial banks in Kenya, Unpublished MSC project,
School of Business, University of Nairobi
Anjichi, D. A. (2014). Effects of asset and liability management on the financial
performance of commercial banks in Kenya, Unpublished MSC project,
School of Business, University of Nairobi
Belete, T. (2013). Asset Liability Management and Commercial Banks Profitability in
Ethiopia, Journal of Finance and Accounting, 4, 10, 2222-1697
Bhunia, A. (2010). A trend analysis of liquidity management efficiency in selected
private sector Indian steel industry, International Journal of Research in
Commerce and Management, 1(1),1-5
Black, F., Jensen, M., & Scholes, M. (1972). The capital-asset pricing model: some
empirical tests. In M. Jensen (Ed.), Studies in the theories of capital markets.
Bourke, P. (2001). Concentration and other determinants of bank profitability in
Europe, North America and Australia. Journal of Banking and Finance,
1(2)1-7
Bourke, P. (2002). Concentration and other determinants of bank profitability in
Europe, North America and Australia. Journal of Banking and Finance:
7(1):1-4
Brau, T. & Woller, W. (2004). A new capital regulation for large financial
institutions, Working Paper, 2, 1-5

36
Brusov, P. & Filatova, T., (1991). Absence of an optimal capital structure in the
famous trade-off theory, Journal of Reviews on Global Economics, 2, 94-116
Brusov, P., Filatova, T., & Orekhova N. (2013). Absence of an optimal capital
structure in the famous trade-off theory, Journal of Reviews on Global
Economics, 2, 94-116
Canner, N. Gregory, M. & David, N. (1997). An asset allocation puzzle. The
American Economic Review, 87 (1): 181–191
CBK (2015). https://www.centralbank.go.ke/index.php/banksupervision
Chakraborty, T. (2008). Asset Liability and Profitability: An Empirical Analysis of
Their Relationship with Reference to Selected Companies in the Indian
Pharmaceutical Industry, the Icfai, Journal of Management Research, 3(4),1-2
Cooper, D. R., & Schindler, P. S. (2008). Business research methods. Boston:
McGraw-Hill Irwin.
Darush, Y. (2013). Asset liability management micro firms: evidence from Swedish
data, International Journal of Managerial Finance, 9(2), 151 -160
Deloof, M. (2003). Asset liability management affect profitability of Belgian firms,
Journal of Business Finance and Accounting, 3(4), 573-587.
DeYoung, R., & Yom, C. (2008). On the independence of assets and liabilities:
evidence from U.S. Commercial Banks, 1990-2005, Journal of Financial
Stability, 4(3), 275–303.
Gikonya, S. W. (2011). The relationship between asset-liability management and
profitability of commercial banks in Kenya, Unpublished MBA project, School
of Business, University of Nairobi
37
Gregory, A. (2013). Asset liability management and financial performance among
sampled firms United States, International Review of Business Research
Papers, 2(2), 45-58.
Jappelli, T. & Pagano, M. (2002). Information sharing, lending and defaults: cross-
country evidence, Journal of Banking & Finance, 26, 17-45
Karani, M. (2014). The effect of liquidity management on profitability of commercial
banks in Kenya, Unpublished MBA Project, University of Nairobi
Keynes, J. M. (1989). The Collected Writings of John Maynard Keynes, London:
Macmillan for the Royal Economic Society.
Kimondo, N. (2014). The relationship between liquidity and profitability of
nonfinancial companies listed in Nairobi securities exchange, Unpublished
MBA Project, University of Nairobi
Kothari, C. R. (2005). Research methodology: Methods & techniques. New Delhi:
New Age International (P) Ltd.
Kusy, M., & Ziemba, W. T. (2001). A bank asset and liability management model,
Operations Research.
Maina, K. (2011). Relationship between the liquidity and profitability of oil
companies in Kenya, Unpublished MBA Project, School of Business,
University of Nairobi
Markowitz, H. (1952). Portfolio Selection, Journal of Finance 7: 77-91
Memmel, C. & Schertler, A. (2011). Banks’ management of the net interest margin:
Evidence from Germany.
Modigliani, F. & Miller, H. (1958). The cost of capital, corporation finance, and the
Theory of Investment, American Economic Review 48,261-297.

38
Moore, R. (2006). The impact of asset and liability management on financial
performance of commercial banks in United Kingdom, Journal of finance and
Accounting, 2(1), 1-4
Mwende, J. (2014) Overview of banking industry in Kenya: Accessed
from,http://www.kenyanbusinessreview.com/557/banking-industry-in-kenya/
Oguzsoy, C.B. & Guven, S. (1997). Bank asset‐liability management under
uncertainty, European Journal of Operational Research, 102, 575‐600.
Ozkan‐Gunay, E.N. (1998). Economies of scale and scope in the Turkish banking
industry: the effect of the financial liberalization program, The Journal of
Economics, 1,1‐18.
Pandy, I.M. (2005). Financial Management, New Delhi, India, Vikas Publishing
House. Pass.
Pasinetti, L. (1997). The marginal efficiency of investment. A second edition of the
general theory. London: Routledge.
Penman, S. H. (2007). Financial Statement Analysis. 3rd international edition,
McGraw Hill, Singapore.
Rogers, C. (1997). Post Keynesian monetary theory and the principle of effective
demand. In: Cohen, Hageman, smith in (eds.), money, financial institutions,
and macroeconomics
Rosen, D., & Zenios, S. A. (2006). Enterprise-wide asset and liability management:
issues, institutions, and models. Handbook of asset and liability management,
Theory and Methodology, 1, 1.
Sharpe, W. F., & Tint, L. G. (1990). Liabilities-a new approach, The Journal of
Portfolio Management, 16(2), 5–10.

39
Singh, K. (2006). Asset liability management and its impact on firm’s performance:
an analysis of European small manufacturing firms, International Review of
Business Research Papers, 2(2), 45-58.
Srivastava, K. & Srivastava, K. (2006). Managing product returns for reverse
logistics, International Journal of Physical Distribution and Logistics
Management, 36(7),524-546.
Stierwald, A. (2010). The impact of asset and liability management on Profitability:
An Analysis of Large Australian Firms (April 30, 2010). Melbourne Institute
Working Paper 3/10. Available at SSRN: http://ssrn.com/abstract=1632749 or
http://dx.doi.org/10.2139/ssrn.1632749
Uyemura, D. G. (1993). Financial risk management in banking: The theory &
application of asset & liability management, Bankers Pub. Co.
Uyemura, D.G. & Van Deventer, D.R. (2003). Financial Risk Management in
Banking, McGraw‐Hill, New York, NY.
Wambu, M. (2013). The relationship between profitability and liquidity of
Commercial Banks in Kenya, Unpublished MBA Project, School of Business,
University of Nairobi
Zenios, S. & Ziemba, W. T. (2007). Handbook of asset and liability management:
Theory and Methodologies. North Holland
Zopounidis, C. (2001). Multicriteria decision aid in financial management, European
Journal of Operational Research, 119, 2, 404‐15

40
APPENDICES
APPENDIX I: COMMERCIAL BANKS IN KENYA
a). Foreign owned institutions
i). Foreign owned not locally incorporated
Bank of India
Citibank N.A. Kenya
Habib Bank A.G. Zurich
Habib Bank Ltd.
ii). Foreign owned but locally incorporated institutions (Partly owned by locals)
Bank of Baroda (K) Ltd.
Barclays Bank of Kenya Ltd.
Diamond Trust Bank Kenya Ltd.
K-Rep Bank Ltd.
Standard Chartered Bank (K) Ltd.
Ecobank Ltd
Gulf Africa Bank (K) Ltd
First Community Bank
iii). Foreign owned but locally incorporated institutions
Bank of Africa (K) Ltd.
UBA Kenya Bank Limited
b). Insitutions with Government participation
Consolidated Bank of Kenya Ltd.
Development Bank of Kenya Ltd.
Housing Finance Ltd.
Kenya Commercial Bank Ltd.
National Bank of Kenya Ltd.
CFC Stanbic Bank Ltd.

41
c). Institutions locally owned
African Banking Corporation Ltd.
Jamii Bora Bank Ltd.
Commercial Bank of Africa Ltd.
Co-operative Bank of Kenya Ltd.
Credit Bank Ltd.
Charterhouse Bank Ltd.
Chase Bank (K) Ltd.
Dubai Bank Kenya Ltd
Equatorial Commercial Bank Ltd.
Equity Bank Ltd.
Family Bank Ltd.
Fidelity Commercial Bank Ltd.
Fina Bank Ltd.
Giro Commercial Bank Ltd.
Guardian Bank Ltd.
Imperial Bank Ltd.
Investment & Mortgages Bank Ltd.
Middle East Bank (K) Ltd.
NIC Bank Ltd.
Oriental Commercial Bank Ltd.
Paramount Universal Bank Ltd.
Prime Bank Ltd.
Trans-National Bank Ltd.
Victoria Commercial Bank Ltd.
II. Institutions listed on the NSE
Barclays Bank of Kenya Ltd.
CFC Stanbic Bank Ltd.
Equity Bank Ltd.
Housing Finance Ltd.
Kenya Commercial Bank Ltd.
NIC Bank Ltd.
Standard Chartered Bank (K) Ltd.
Diamond Trust Bank Kenya Ltd
National Bank of Kenya
Co-operative Bank of Kenya Ltd

42
APPENDIX II: DATA COLLECTION SCHEDULE
The student will obtain a letter from the University that will grant her the permission
to collect data. Data will be collected from Central Bank of Kenya. The study will
collected secondary data in one day based on the availability and accessibility of the
data. Below is the data collection schedule that will guide the researcher on important
variables during data collection and the period upon which data will be collected.
Parameters Company Year
Commercial
Banks
2010 2011 2012 2013 2014
Asset Liability Management
(measured using loan to deposit
ratio by computing average net
loans/average deposits {5 years})
Data on the size of the firm
(natural logarithm of total assets)
Current ratio (measured using
current assets/current liabilities).
Financial leverage (debt to
equity ratio; will be measured
using total liabilities/total assets)
Financial performance (return
on assets=net income/total assets).