The effect of alternative fuels on gaseous and particulate...
27
This is a repository copy of The effect of alternative fuels on gaseous and particulate matter (PM) emission performance in an auxiliary power unit (APU) . White Rose Research Online URL for this paper: http://eprints.whiterose.ac.uk/145912/ Version: Accepted Version Article: Khandelwal, B. orcid.org/0000-0001-9295-188X, Cronly, J., Ahmed, I.S. et al. (2 more authors) (2019) The effect of alternative fuels on gaseous and particulate matter (PM) emission performance in an auxiliary power unit (APU). The Aeronautical Journal. ISSN 0001-9240 https://doi.org/10.1017/aer.2019.16 This article has been published in a revised form in The Aeronautical Journal [http://doi.org/10.1017/aer.2019.16]. This version is free to view and download for private research and study only. Not for re-distribution, re-sale or use in derivative works. © Royal Aeronautical Society. [email protected] https://eprints.whiterose.ac.uk/ Reuse Items deposited in White Rose Research Online are protected by copyright, with all rights reserved unless indicated otherwise. They may be downloaded and/or printed for private study, or other acts as permitted by national copyright laws. The publisher or other rights holders may allow further reproduction and re-use of the full text version. This is indicated by the licence information on the White Rose Research Online record for the item. Takedown If you consider content in White Rose Research Online to be in breach of UK law, please notify us by emailing [email protected] including the URL of the record and the reason for the withdrawal request.
Transcript of The effect of alternative fuels on gaseous and particulate...

This is a repository copy of The effect of alternative fuels on gaseous and particulate matter (PM) emission performance in an auxiliary power unit (APU).
White Rose Research Online URL for this paper:http://eprints.whiterose.ac.uk/145912/
Version: Accepted Version
Article:
Khandelwal, B. orcid.org/0000-0001-9295-188X, Cronly, J., Ahmed, I.S. et al. (2 more authors) (2019) The effect of alternative fuels on gaseous and particulate matter (PM) emission performance in an auxiliary power unit (APU). The Aeronautical Journal. ISSN 0001-9240
https://doi.org/10.1017/aer.2019.16
This article has been published in a revised form in The Aeronautical Journal [http://doi.org/10.1017/aer.2019.16]. This version is free to view and download for private research and study only. Not for re-distribution, re-sale or use in derivative works. © Royal Aeronautical Society.
[email protected]://eprints.whiterose.ac.uk/
Reuse
Items deposited in White Rose Research Online are protected by copyright, with all rights reserved unless indicated otherwise. They may be downloaded and/or printed for private study, or other acts as permitted by national copyright laws. The publisher or other rights holders may allow further reproduction and re-use of the full text version. This is indicated by the licence information on the White Rose Research Online record for the item.
Takedown
If you consider content in White Rose Research Online to be in breach of UK law, please notify us by emailing [email protected] including the URL of the record and the reason for the withdrawal request.
The Effect of Alternative Fuels on Gaseous and Particulate Matter
(PM) Emission Performance in an APU
B. Khandelwal, J. Cronly, I. S. Ahmed, C. J. Wijesinghe, C. Lewis
Abstract
There is a growing interest in the use of alternative fuels in gas turbine engines to reduce emissions. Testing
of alternative fuels is expensive when done on a large-scale gas turbine engine. In this study a re-
commissioned small gas turbine Auxiliary Power unit (APU), has been used to test various blends of Jet A-
1 and Synthetic Paraffinic Kerosene (SPK), diesel with eight other novel fuels. A detailed analysis of
performance, gaseous emissions and particulate emissions has been presented in this study. It is observed
that aromatic content in general as well as the particular chemical composition of the aromatic compound
plays a vital role in particulate emissions generation. SPK fuel shows substantially lower particulate
emissions with respect to Jet A. However, not all the species of aromatics negatively impact particulate
emissions. Gaseous emissions measured are comparable for all the fuels tested in this study.
Introduction
There is a growing interest in decreasing the net emissions produced by gas turbines. This has led to research
and development towards operating gas turbines using alternative fuels. The driving factors for this
increased interest towards alternative fuels and decreasing emissions comes from rising fuel cost [1],
decreasing crude oil resources and increasing environmental consideration [2–4]. There is also a growing
concern about local air quality around airports and steps are being taken by industry to reduce emissions.
The aviation industry is growing at a rate of approximately 4% each year and is predicted to rise at this rate
for decades to come [1]. It is estimated that aviation currently accounts for about 3% of total global warming
gases produced and is therefore continuously rising due to growth in the aviation industry. Alternative fuels

derived by Fischer-Tropsch (F-T) process from biomass, coal and gas draws a interest of researchers and
industry due to their drop-in capability [5]. Another reason for this interest is to improve the security of
energy supply as alternative fuel sources can be obtained domestically.
While oil shale and F-T fuels offer increased energy security, bio-derived fuels are renewable and claimed
to reduce carbon emissions in their life-cycle [6]. FT fuels can be derived from a wide range of feedstocks
such as natural gas, used cooking oil (UCO), fuel crops, coal etc. FT Fuels have the potential to provide
better combustion properties and lower emissions. Fuel derived from oil shale, gas and coal are non-
renewable sources of fuels, but are readily available and viable as these are obtained using existing
technologies. Commercial production of fuel from shale, gas and coal has been accomplished in several
countries to date. In 1999, Sasol produced a Semi Synthetic Jet Fuel (SSJF), which was a blend of up to
50% of synthetic fuel, made from coal by F-T synthesis and conventional jet fuel. From that time onwards
SSJF has been supplied to the Johannesburg Airport, South Africa for use for gas turbines [7].
According to present regulations, restrictions placed on commercial flights on use of alternative fuels are
stringent. This is due to economical and logistic issues and partly to provide safe and reliable fuel that can
perform in the arduous conditions in which gas turbines work [8]. Since the aviation industry tends to keep
its assets for around 40 years [9], the ability to be used as a drop-in fuels in legacy aircrafts is very important
along with their ability to meet future fuel standards. The present aviation fuel specifications are laid out in
the ASTM D 1655[10]. Any new fuel has to meet the specifications and has to go through a rigorous
approval process as shown in the Fig. 1 [11]. Any new alternate fuel development program must consider
all other aspects of airframe, fuel handling and fuel processing as well [12].
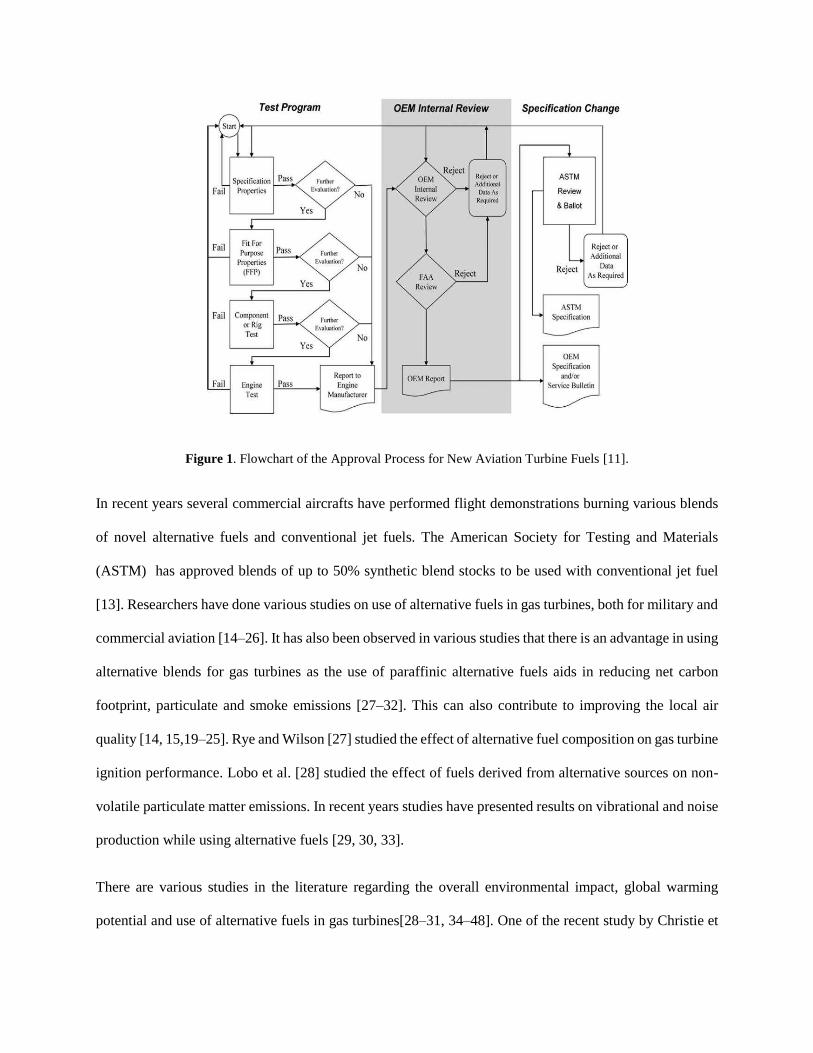
Figure 1. Flowchart of the Approval Process for New Aviation Turbine Fuels [11].
In recent years several commercial aircrafts have performed flight demonstrations burning various blends
of novel alternative fuels and conventional jet fuels. The American Society for Testing and Materials
(ASTM) has approved blends of up to 50% synthetic blend stocks to be used with conventional jet fuel
[13]. Researchers have done various studies on use of alternative fuels in gas turbines, both for military and
commercial aviation [14–26]. It has also been observed in various studies that there is an advantage in using
alternative blends for gas turbines as the use of paraffinic alternative fuels aids in reducing net carbon
footprint, particulate and smoke emissions [27–32]. This can also contribute to improving the local air
quality [14, 15,19–25]. Rye and Wilson [27] studied the effect of alternative fuel composition on gas turbine
ignition performance. Lobo et al. [28] studied the effect of fuels derived from alternative sources on non-
volatile particulate matter emissions. In recent years studies have presented results on vibrational and noise
production while using alternative fuels [29, 30, 33].
There are various studies in the literature regarding the overall environmental impact, global warming
potential and use of alternative fuels in gas turbines[28–31, 34–48]. One of the recent study by Christie et

al. [47] and Brem et al. [48] shows impact of hydrogen content in the fuel on PM emissions. Results of
experimental tests related to impact of gas turbine engines on environment are not evident in literature and
not fully explored. One of the reasons for fewer studies and tests on use of alternative fuels with gas turbines
is the high cost and fuel requirement for a gas turbine engine for completing these tests. APU’s, however,
are well suited to perform studies and critical evaluations of alternative fuels for use in gas turbines.
This paper reports the results of an experimental campaign to evaluate the gaseous and PM emissions
characteristics of an aircraft APU burning various blends of synthetic fuels with Jet A-1 and several other
alternative fuels. The study was partially conducted FAA CLEEN project at the University of Sheffield’s
Low Carbon Combustion Centre and involved teams from the University of Sheffield, British Airways and
Rolls-Royce. Gas phase emissions and PM emissions were measured at the engine exit plane.
Properties of Fuels Tested
Properties and list of the fuels tested in this study are presented in Table 1. The blending was carried out
using grade A glassware. The uncertainty in the volumetric blending was calculated to be approximately
±1%. For ease of data representation, all the fuels have been named fuels 1 to 6 and fuel A to H as shown
in the table below. Fuels 1 to 4 are different blends of SPK and Baseline Jet A-1, whereas fuels A to D are
different ASTM approved novel jet fuels to be blended with conventional jet fuel, sourced from different
companies. Fuel 5 is commercially available diesel, and fuel E-H are novel fuels sources from different
sources, not currently approved under ASTM.
Table 1. Pertinent properties of fuels used
Fuel Representation
Name
Density
(g/l)
Energy
Content
(MJ/kg)
Fuel Aromatic
Content (% vol)
Baseline Jet A-1 Fuel 1 801.9 43.23 17.3
50% Jet A-1 and 50% SPK Fuel 2 781.9 43.66 8.6

25% Jet A-1 and 75% SPK Fuel 3 771.8 43.88 4.4
SPK Fuel 4 761.7 44.10 0.1
Diesel Fuel 5 832 45.0 23.6
Straight Run Jet A Fuel 6
Novel Fuel 1 Fuel A 791.0 43.57 9.4
Novel Fuel 2 Fuel B 756.2 43.67 13.4
Novel Fuel 3 Fuel C 756.2 43.47 19.7
Novel Fuel 4 Fuel D 804.4 43.26 15.8
Novel Fuel 5 Fuel E
Novel Fuel 6 Fuel F
Novel Fuel 7 Fuel G
Novel Fuel 8 Fuel H
Experimental Set-up
A re-commissioned APU gas turbine (Honeywell GTCP85 APU engine) has been used in this study to
examine the effect of different fuel blends on emissions and performance. Figure 2 shows a schematic of
the experimental setup used in this study. Real time data acquisition system and control mechanisms have
been used for conducting these experiments. Performance parameters including exhaust gas temperatures,
bleed air flow, fuel flow, inlet air flow, engine RPM, pressure and temperature at various core locations
have been measured and examined. This APU gas turbine has a two-stage centrifugal compressor. The
compressed air, mixed with fuel and ignited, drives a radial inward-flow turbine wheel. The rotating shaft
power of the turbine wheel drives the compressor, which also provides bleed air, and generator.

Figure 2. Experimental Set-up
The APU control panel is used to change the bleed flow rate to a predefined value for reaching a set
operating condition. Fig. 3 below shows the actual picture of the APU, inlet duct, generator, transducers
and bleed valve mounted on the test bed. All the relevant performance parameters are measured with the
help of pressure transducers, flow meters and thermocouples fixed on the engine bed and engine. The bleed
duct is connected to a variable solenoid operated valve before the exhaust to control the flow of bleed air,
as bleed air is used for loading the APU (changing operating conditions). This APU also houses a 32 KW
generator, which is conventionally used to control the operating conditions of the APU. The generator on
the APU is not able to change the operating conditions of the engine, since power generated by the APU is
substantially higher than generator and no noticeable change in fuel flow and exhaust gas temperature is
observed when the generator is fully loaded or when the load on the generator load is changed. Calibration
of all the transducers used in the experimental set-up has been carried out regularly to maintain
measurement accuracy. The operation panel (PCB based control panel) is used to monitor exhaust gas

temperature, engine operating speed (RPM) and bleed flow rate. This is installed to act as a safety control
mechanism in case the more complex control software based on LabVIEW stops responding. The operation
panel also provides control of fuel solenoid, starter motor and ignition system. The starter motor is used to
spool the engine to 50% speed of engine RPM (Maximum) before being cut off. The ignition system is cut
off when the engine RPM reaches 95% speed of engine RPM. This is done to avoid any damage to igniter.
Boolean data on status of ignition system, fuel and oil systems are also fed from the APU to the operation
panel for the purpose of operator feedback and emergency shutdown.
Figure 3. Gas Turbine Experimental Set-up
Continuous sampling and measurement of gaseous emission have been carried out as per SAE ARP1256D
testing standards. The University of Sheffield’s Mobile Emissions Laboratory has been set-up to comply
with the SAE ARP1256D standard [41], and has been used to take measurements in this study. The
Experiments were conducted using the Mobile Emission Laboratory. The same mobile emission laboratory
has also been used for measuring emissions in various other test campaigns available in literature [19,27–
31].

A stainless-steel sampling probe is fixed in place with bolts behind the APU for extractive sampling of
exhaust gases. The probes themselves do no conform to the afore mentioned ARP standard. A cross section
traverse of the engine exhaust has been done, and it was found that two locations where these probes were
placed had same AFR and PM. The conditioned exhaust sample is drawn through a ¼ inch heated sample
line into Mobile Emissions Laboratory for analysis. The sample lines are maintained at 160±5C per
ARP1256D [41] with a minimum bend radius of 10x the line diameter. A constant sampling flow rate (and
system pressure) was maintained in the gaseous analysis equipment by using a metal bellows pump, with
excess sample flow being exhausted through a back-pressure regulator. Gaseous emissions (Unburned
Hydrocarbon ‘UHC’, Carbon Monoxide ‘CO’ and Nitrous Oxides ‘NOx’) were measured per ARP1256D
[41]. A Flame Ionization Detector (FID), namely a Signal 3000HM hydrocarbon analyser, are used to
measure unburned hydrocarbons in the exhaust stream. The concentration of CO and CO2 emissions in the
exhaust stream were characterized using a Rosemount Binos 1000 analyser. The unit is a dual channel Non-
Dispersive Infrared Analyzer (NDIR), the principle of which is based on the absorption of infrared radiation
in the CO and CO2 frequency band. In order to reduce the interference effect of water in the exhaust sample,
a chiller was installed upstream of the NDIR analyser to dry the sample. Figure 4 shows the location of
sampling probes with reference to the exhaust of engine.
Figure 4. Sampling Probe
An Eco Physics CLA EL ht (chemiluminescence) analyser was used to record NOx in this experiment.
Oxygen levels in the exhaust sample were also monitored, as a redundant measurement to assess data

quality. The analysers were zeroed and then spanned using appropriate gas concentrations just prior to the
beginning of each experiment, with the zero and span drift established at engine shutdown. The Span gas
cylinders were accurate to ±2%. Instrument linearity and interference effects were assessed and corrected
for as per the aerospace recommended practices [42]. The experimental error associated with the
measurement of gaseous emissions is estimated to be approximately ±4% of the reading.
A separate sampling probe was fixed in close proximity to the gaseous emissions sampling probe for
measurement of particulates by DMS500. Smoke emissions were measured using the gaseous emissions
probe. PM size distribution and mass were tested using a DMS 500 supplied by Cambustion. A separate
sampling line heated at 160±5C was used to supply exhaust gases to the DMS 500. For uniformity with
gaseous emission sample lines, the line was fabricated with a minimum bend radius of 10x the line diameter
in the sampling line for both DMS 500 and gas sampling line to avoid any error in the readings taken. The
DMS500 analysers use electrical mobility measurements to produce particle size/number spectra between
5 nanometres and 1000 nanometres. Since the classification of particles according to their differing
electrical mobility takes place in parallel (rather than in series as in a scanning instrument) the DMS series
is able to offer the fastest available size/number spectral measurement of its type. The DMS500 uses a high
sample flow rate (8 litres per minute) and unique multiple sheath flows in the charger, resulting in low
diffusion losses even of small particles. Figure 5 below shows schematic of particulate measurement
instrument principle. Particles are introduced in the instrument from left hand said of the tube; particulates
are provided charge by Unipolar Corona Charger and passed through tube of electrometer detectors to detect
the size, weight and number of particulate emissions.
Fig 5. Principle of particulate emission measurement instrument (DMS 500) [43].
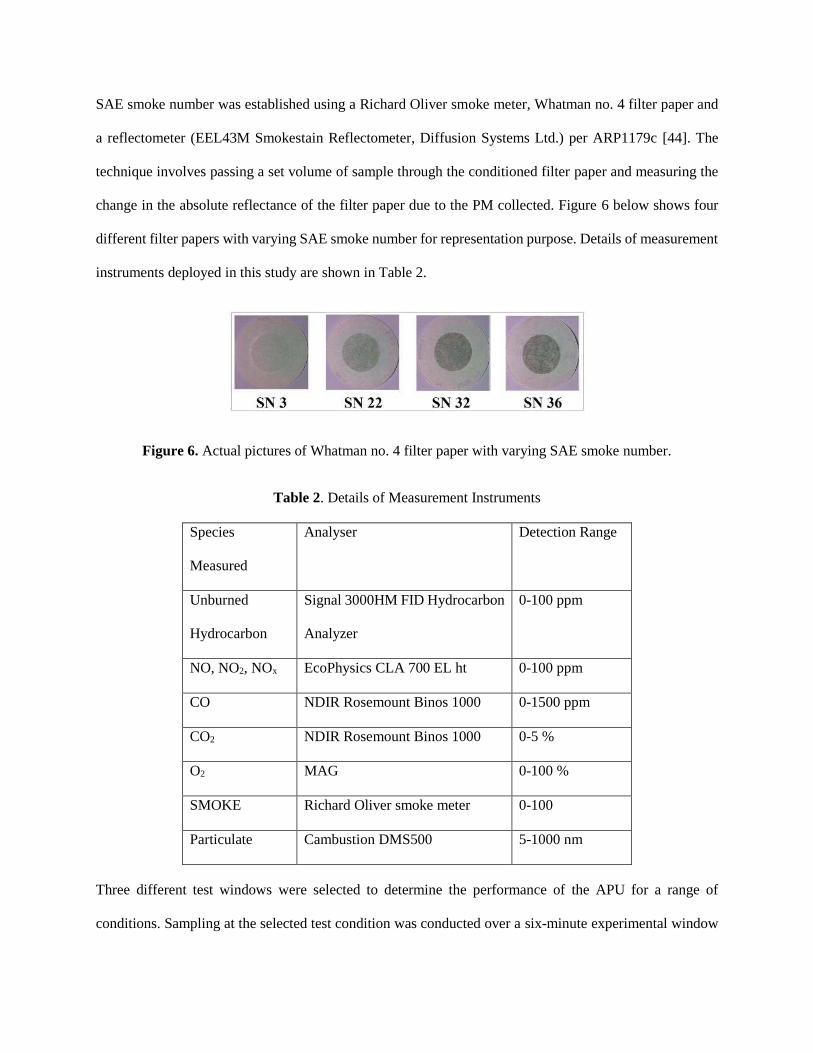
SAE smoke number was established using a Richard Oliver smoke meter, Whatman no. 4 filter paper and
a reflectometer (EEL43M Smokestain Reflectometer, Diffusion Systems Ltd.) per ARP1179c [44]. The
technique involves passing a set volume of sample through the conditioned filter paper and measuring the
change in the absolute reflectance of the filter paper due to the PM collected. Figure 6 below shows four
different filter papers with varying SAE smoke number for representation purpose. Details of measurement
instruments deployed in this study are shown in Table 2.
Figure 6. Actual pictures of Whatman no. 4 filter paper with varying SAE smoke number.
Table 2. Details of Measurement Instruments
Species
Measured
Analyser Detection Range
Unburned
Hydrocarbon
Signal 3000HM FID Hydrocarbon
Analyzer
0-100 ppm
NO, NO2, NOx EcoPhysics CLA 700 EL ht 0-100 ppm
CO NDIR Rosemount Binos 1000 0-1500 ppm
CO2 NDIR Rosemount Binos 1000 0-5 %
O2 MAG 0-100 %
SMOKE Richard Oliver smoke meter 0-100
Particulate Cambustion DMS500 5-1000 nm
Three different test windows were selected to determine the performance of the APU for a range of
conditions. Sampling at the selected test condition was conducted over a six-minute experimental window

once the APU had appeared to stabilize. Figure 7 shows exhaust temperature profile measured at the exit
of the gas turbine with time. One test window is at full RPM when the engine is without any load at an EGT
of 300±10C and AFR of 130±2, second is with the bleed on at EGT of 445±10C and AFR of 75±2 and
third with the bleed on at EGT of 580±10C and AFR of 50±2 test windows, before returning the engine to
a full power condition prior to shut down. Full RPM window is stable when EGT remains constant at
300±5C for three minutes. The second and third window is stable when EGT remains constant at 445±10C
and 580±10C respectively in addition to the bleed mass flow for three minutes.
Fig 7. Exhaust Temperature profile for illustration of engine test windows.
Results and Discussion
Emissions data concentrations have been converted into emission indices to aid in the quantification of
emissions per kilogram of fuel burned. The conversion to emission indices is done as per standard
calculation methods [19, 42].
Gaseous Emissions Analysis
Table 3 below shows gaseous emissions data collected at maximum RPM with EGT of 300±10C and AFR
of 130±2 for different fuels. CO2, CO, NOx and NO emissions are represented in form of emission index
(EI), whereas NO2, THC is represented as PPM.

Table 3. Gaseous emissions data at condition 1.
Uncert
ainty
Fuel
1
[45]
Fuel
2
[45]
Fuel
3
[45]
Fuel
4
[45]
Fuel
5
Fuel
6
Fuel
A
[45]
Fuel
B
[45]
Fuel
C
[45]
Fuel
D
[45]
Fuel
G
Fuel
H
CO2 (EI) ± 10 3171 3178 3182 3182 3165 3175 3188 3192 3189 3189 3201 3185
CO (EI) ± 2 34.1 33.2 31.9 31.6 37.5 33.8 33.6 30.5 33.0 33.3 30.2 35.4
NOx (EI) ± 0.1 4 4.1 4.2 4.2 3.88 4.0 4 4 3.9 4 4.2 4.1
NO (EI) ± 0.1 1.5 1.6 1.6 1.5 1.98 1.7 1.5 1.6 1.7 1.6 1.6 1.8
NO2 (PPM) ± 0.1 7.0 7.5 7.4 6.9 9.94 8.1 7.0 7.4 7.9 7.2 7.3 8.8
THC (PPM) ± 3 25 23 21 22 72.4 8 10 6 1 5 3 6
Oxygen (%) ± 0.2 18.4 18.4 18.4 18.5 18.3 18.4 18.4 18.4 18.4 18.4 18.5 18.4
It is observed that all the fuels give similar range of emissions. Table 4 represents gaseous emissions data
collected at EGT of 450±10C and AFR of 75±2 for different fuels.
Table 4. Gaseous emissions data at condition 2.
Uncert
ainty
Fuel
1
[45]
Fuel
2
[45]
Fuel
3
[45]
Fuel
4
[45]
Fuel
5
Fuel
6
Fuel
A
[45]
Fuel
B
[45]
Fuel
C
[45]
Fuel
D
[45]
Fuel
G
Fuel
H
CO2 (EI) ± 10 3169 3172 3172 3174 3162 3170 3171 3171 3170 3170 3172 3162
CO (EI) ± 2 23.9 22.9 21.3 22.1 26.3 22.8 23.2 21.5 23.5 23.7 21.4 24.3
NOx (EI) ± 0.1 4 4.1 4.2 4.2 4 4 4 4 3.9 4.1 4 3.9

NO (EI) ± 0.1 2 2.1 2.2 2.1 2.5 2.2 2.1 2.2 2.1 2.1 2.1 2.2
NO2 (PPM) ± 0.1 16.4 16.8 18.1 16.2 21 18.8 16.5 17.7 17.2 16.7 16.6 17.0
THC PPM) ± 3 1 0 0 0 3 48 3 2 0 1 25 55
Oxygen (%) ± 0.2 16.7 16.8 16.7 16.9 16.5 16.7 16.7 16.8 16.7 16.8 16.9 16.7
Table 5. Gaseous emissions data at condition 3.
Uncert
ainty
Fuel
1
[45]
Fuel
2
[45]
Fuel
3
[45]
Fuel
4
[45]
Fuel
5
Fuel
6
Fuel
A
[45]
Fuel
B
[45]
Fuel
C
[45]
Fuel
D
[45]
Fuel
G
Fuel
H
CO2 (EI) ± 10 3169 3171 3172 3172 3164 3171 3170 3171 3170 3171 3173 3169
CO (EI) ± 2 14.1 13.4 13.0 12.8 17.4 14.1 14 13.0 14.0 13.9 12.7 14.4
NOx (EI) ± 0.1 4.1 4.2 4.2 4.2 4.1 4.1 4.4 4.1 4.0 4.2 4.1 4
NO (EI) ± 0.1 2.9 2.9 3.0 2.9 3 3.0 2.8 2.9 2.8 2.9 2.9 2.8
NO2 (PPM) ± 0.1 34.1 33.4 33.6 47.9 35.0 33.2 32.4 33.2 32.3 33.3 33.1 33.4
THC (PPM) ± 3 0 0 0 0 0 0 1 1 0 0 0 0
Oxygen (%) ± 0.2 14.9 15.1 15.1 15.2 14.9 15.2 15.1 15.2 15.0 15.1 15.2 15.0
Table 5 represents gaseous emissions data collected at EGT of 580±10C and AFR of 50±2 for different
fuels. Gaseous emissions analysis (CO, CO2, NO, NOx and THC) conducted on fuels studied in this work
showed similar performance for all fuels and were within the uncertainty of instruments. It can be seen that
for all fuel’s NOx remains relatively the same hovering around 4 and also does not appear to change with
the engine condition. Moreover, it can be seen that THC for Fuel 6 is extremely high with respect to the
other fuels in the first two conditions. With a high point of 78 ppm in the first condition then reducing to
48 ppm in the second condition. Eventhough total NOx remains relatively constant with respect to engine
condition the amount of NO increases with engine condition. The amount of NO2 also increases as engine
condition increases. This phenomenon can be attributed to the higher engine peak flame temperatures
reached as more power is extracted from the engine.

Smoke Number
SAE smoke numbers for all the fuels tested in this study are presented in Fig. 8. The accepted accuracy of
the method is ±3 smoke numbers and average of three different samples have been presented in Fig. 8. It is
observed that fuels 1-4 produces substantially lower smoke as compared to fuels with Jet A. Fuel 5 has the
highest smoke number of all for all three conditions, this can be expected as fuel 5 is Diesel has a highest
aromatic content as compared to the other fuels tested in this study. Diesel’s higher smoke results are in-
line with other published literature. Fuel’s E and H have the lowest smoke number of all the fuels tested.
Fuel A, B, C and D have significantly lower smoke as compared to Jet A-1. It can be observed from the
figure that at third power condition smoke emissions goes down, this could be due to thermophoretic losses.
Figure 8. SAE smoke number distribution for all fuels and conditions. Fuels 1-4 and A-D [45]
PM Emissions
Figure 9 shows size spectral density comparison for first, second and third condition for all fuels considered
in this study. It can be clearly observed from the figure that particulates emissions decrease with a decline
in aromatic content from Fuel 1 to 4. This is consistent with the smoke measurements as shown in Fig. 9.
Fuel A, B, C and D follows similar trend to that of Baseline Jet-A1 fuel. Overall Similar trends are observed
0
10
20
30
40
50
60
Fuel 1 Fuel 2 Fuel 3 Fuel 4 Fuel 5 Fuel 6 Fuel A Fuel B Fuel C Fuel D Fuel E Fuel F Fuel G Fuel H
1st Condition
2nd Condition
3rd Condition

at engine operating conditions 2 and 3 as shown in Fig. 11 and 12. It is also observed that at condition 1,
fuels with higher aromatic content produces substantially larger particulates as compared to fuels with a
lower proportion of aromatics.
Figure 9. Number and Size distribution of Particulates measured for 1st condition

Figure 10. Number and Size distribution of Particulates measured for 2nd condition

Figure 11. Number and Size distribution of Particulates measured for 3nd condition
Figure 12. Particulates measured for fuels at size of ~27 nm.
Figure 12 shows the distribution of particulate mass for all the fuels and conditions tested in this study. To
calculate the mass of the particulates coming out of the test engine, effective density of baseline Jet A-1
fuel was used [46]. It can be clearly observed that particulate mass follows the same trend as of particulate
number when aromatics are decreased from Fuel 1 to 4 (shown in Fig. 10, 11 and 12). Fuel 1 and Fuel B
has 24.6% and 21.7 % aromatic content respectively by weight, whereas their mass and particulate size
distribution differs substantially. Fuel B gave a substantially better performance in terms of particulate mass
and size emissions. The probable reason for reduction in particulate emissions in the case of Fuel B is due
to its aromatic content composition. This result is in line with one of our other studies where it was found
that different aromatic composition behaves in a different manner when it interacts with seals and produces
different PM [22, 41]. Though it is to be noted that seals could lead to production of small number of
volatiles in the exhaust and this aspect has not been covered in this study. Decreasing the number of
aromatics in the fuel would lead to reduction in energy density per litre of the fuel, which could eventually
lead to reduction in range of the aircraft. Not all aromatics have a direct effect on smoke and particulate

emissions; it is just that right aromatics species need to be selected for reduction in particulate emissions
and appropriate seal swell.
Figure 13. Particulate mass concentration against hydrogen contents of fuels
Figure 13 above shows the particulate mass concentration against the hydrogen content (mass percentage
% m/m). It can be observed from Fig. 13 that the particulate concentration is reduced as the hydrogen
content is increased. This can be fundamentally explained by the fact that the more the hydrogen content
is, the less the number of carbon-carbon bonds present in the fuel. This observation is in-line with other
literature Christie et al. [47] and Brem et al. [48].

Figure 14. Particulate mean gravimetric diameter against hydrogen content of fuels tested
Figure 14 shows the particulate mean gravimetric diameter against the hydrogen content (mass percentage
% m/m). It can be observed from the figure that the gravimetric diameter of particulates is reduced as the
hydrogen content is increased. These findings are corroborated by Christie et al. [47] and Brem et al. [48] .
Conclusions
Gaseous emissions analysis (CO, CO2, NO, NOx and THC) conducted on fuels studied in this work showed
similar performance and were within the uncertainty of instruments. The smoke and particulate emissions
of the SPK fuel were substantially lower than other fuels tested in this study. It is observed from the results
that smoke and particulate emissions are decreased with a reduction in aromatic content of the fuel. It has
also been observed that PM emissions also depends on hydrogen content of the fuel. Particulate mass
emissions of Fuel B are substantially lower than other comparative fuels, due to different types of aromatics,
even though fuel B contains more aromatic content by volume than Fuel A. Further study is required to
evaluate the effect of different types of aromatics on particulate emissions, some investigation into the
composition of aromatics and their specific impact on emissions has been studied by Corporan et al. [22].

Acknowledgements
The Honeywell GTCP85 APU used in this test campaign was kindly donated by British Airways. Part of
this work was funded by the US Federal Aviation Administration (FAA) Office of Environment and Energy
as a part of CLEEN Program under FAA Award Number: DTFAWA-10-C-00006. Any opinions, findings,
and conclusions or recommendations expressed in this material are those of the authors and do not
necessarily reflect the views of the FAA or other CLEEN Sponsors.
References
[1] Airbus Global Market Forecast 2012-2031 - The Air Blog..., Air Blog. (2013).
http://theairblog.weebly.com/pilot-blog/airbus-global-market-forecast-2012-2031 (accessed
February 13, 2019).
[2] J. Žarnovský, V. Petková, R. Drlička, J. Dobránsky, Air Quality Improvement by Reduction of
Gas Turbines Emissions, Appl. Mech. Mater. 308 (2013) 159–164.
doi:10.4028/www.scientific.net/AMM.308.159.
[3] U. Schumann, H. Schlager, F. Arnold, J. Ovarlez, H. Kelder, Hov, G. Hayman, I.S.A. Isaksen, J.
Staehelin, P.D. Whitefield, Pollution from aircraft emissions in the North Atlantic flight corridor:
Overview on the POLINAT projects, J. Geophys. Res. Atmos. 105 (2000) 3605–3631.
doi:10.1029/1999JD900941.
[4] H.L. Rogers, D.S. Lee, D.W. Raper, P.M. de F. Foster, C.W. Wilson, P.J. Newton, The impacts of
aviation on the atmosphere, Aeronaut. J. 106 (2002) 521–546. doi:10.1017/s0001924000018157.
[5] S. Blakey, L. Rye, C.W. Wilson, Aviation gas turbine alternative fuels: A review, Proc. Combust.
Inst. 33 (2011) 2863–2885. doi:10.1016/j.proci.2010.09.011.
[6] A. Murugesan, C. Umarani, R. Subramanian, N. Nedunchezhian, Bio-diesel as an alternative fuel

for diesel engines—A review, Renew. Sustain. Energy Rev. 13 (2009) 653–662.
doi:10.1016/J.RSER.2007.10.007.
[7] G. Hemighaus, T. Boval, C. Bosley, R. Organ, J. Lind, R. Brouette, T. Thompson, J. Lynch, J.
Jones, Alternative Jet Fuels A supplement to Chevron’s Aviation Fuels Technical Review,
Chevron, 2006. https://skybrary.aero/bookshelf/books/2479.pdf (accessed February 13, 2019).
[8] U. Yildirim, S. Abanteriba, Manufacture, qualification and approval of new aviation turbine fuels
and additives, Procedia Eng. 49 (2012) 310–315. doi:10.1016/j.proeng.2012.10.142.
[9] R. Parker, M. Lathoud, Green aero-engines: Technology to mitigate aviation impact on
environment, Proc. Inst. Mech. Eng. Part C J. Mech. Eng. Sci. 224 (2010) 529–538.
doi:10.1243/09544062jmes1515.
[10] ASTM, ASTM D1655 18a Standard Specification for Aviation Turbine Fuels, 2018.
[11] ASTM, ASTM D4054 Standard Practice for Evaluation of New Aviation Turbine Fuels and Fuel
Additives, n.d.
[12] W.S. Blazowski, Combustion considerations for future jet fuels, Symp. Combust. 16 (1977) 1631–
1639. doi:10.1016/S0082-0784(77)80442-6.
[13] ASTM, D7566 − 17a Standard Specification for Aviation Turbine Fuel Containing Synthesized
Hydrocarbons 1, (2017). doi:10.1520/D7566-17A.
[14] E. Corporan, M.J. DeWitt, V. Belovich, R. Pawlik, A.C. Lynch, J.R. Gord, T.R. Meyer, Emissions
characteristics of a turbine engine and research combustor burning a Fischer-Tropsch jet fuel,
Energy and Fuels. 21 (2007) 2615–2626. doi:10.1021/ef070015j.
[15] B.E. Anderson, A.J. Beyersdorf, C.H. Hudgins, J. V Plant, K.L. Thornhill, E.L. Winstead, L.D.
Ziemba, P.D. Whitefield, D. Hagen, P. Lobo, R. Howard, W.B. Knighton, D. Bulzan, K. Tacina,

C. Wey, E. Corporan, R. Vander Wal, R.C. Miake-Lye, S.C. Herndon, A. Bhargava, W. Dodds, J.
Kinsey, B. Lee, G. Santori, D.S. Liscinsky, Alternative Aviation Fuel Experiment (AAFEX),
2011. http://www.sti.nasa.gov (accessed February 14, 2019).
[16] R.H. Moore, M. Shook, A. Beyersdorf, C. Corr, S. Herndon, W.B. Knighton, R. Miake-Lye, K.L.
Thornhill, E.L. Winstead, Z. Yu, L.D. Ziemba, B.E. Anderson, Influence of jet fuel composition
on aircraft engine emissions: A synthesis of aerosol emissions data from the NASA APEX,
AAFEX, and ACCESS missions, Energy and Fuels. 29 (2015) 2591–2600.
doi:10.1021/ef502618w.
[17] R.H. Moore, K.L. Thornhill, B. Weinzierl, D. Sauer, E. D’ascoli, J. Kim, M. Lichtenstern, M.
Scheibe, B. Beaton, J. Beyersdorf, J. Barrick, D. Bulzan, C.A. Corr, E. Crosbie, T. Jurkat, R.
Martin, D. Riddick, M. Shook, G. Slover, C. Voigt, R. White, E. Winstead, R. Yasky, L.D.
Ziemba, A. Brown, H. Schlager, B.E. Anderson, Biofuel blending reduces particle emissions from
aircraft engines at cruise conditions, (2017). doi:10.1038/nature21420.
[18] L. Zheng, C. Ling, E.A. Ubogu, J. Cronly, I. Ahmed, Y. Zhang, B. Khandelwal, Effects of
Alternative Fuel Properties on Particulate Matter Produced in a Gas Turbine Combustor, Energy &
Fuels. 32 (2018) 9883–9897. doi:10.1021/acs.energyfuels.8b01442.
[19] P. Lobo, D.E. Hagen, P.D. Whitefield, Comparison of PM emissions from a commercial jet engine
burning conventional, biomass, and fischer-tropsch fuels, Environ. Sci. Technol. 45 (2011) 10744–
10749. doi:10.1021/es201902e.
[20] P.I. Williams, J.D. Allan, P. Lobo, H. Coe, S. Christie, C. Wilson, D. Hagen, P. Whitefield, D.
Raper, L. Rye, Impact of Alternative Fuels on Emissions Characteristics of a Gas Turbine Engine
− Part 2: Volatile and Semivolatile Particulate Matter Emissions, Environ. Sci. Technol. 46 (2012)
10812–10819. doi:10.1021/es301899s.

[21] P. Lobo, L. Rye, P.I. Williams, S. Christie, I. Uryga-Bugajska, C.W. Wilson, D.E. Hagen, P.D.
Whitefield, S. Blakey, H. Coe, D. Raper, M. Pourkashanian, Impact of Alternative Fuels on
Emissions Characteristics of a Gas Turbine Engine − Part 1: Gaseous and Particulate Matter
Emissions, Environ. Sci. Technol. 46 (2012) 10805–10811. doi:10.1021/es301898u.
[22] E. Corporan, T. Edwards, L. Shafer, M.J. Dewitt, C. Klingshirn, S. Zabarnick, Z. West, R.
Striebich, J. Graham, J. Klein, Chemical, thermal stability, seal swell, and emissions studies of
alternative jet fuels, Energy and Fuels. 25 (2011) 955–966. doi:10.1021/ef101520v.
[23] S. Christie, D. Raper, D.S. Lee, P.I. Williams, L. Rye, S. Blakey, C.W. Wilson, P. Lobo, D.
Hagen, P.D. Whitefield, Polycyclic Aromatic Hydrocarbon Emissions from the Combustion of
Alternative Fuels in a Gas Turbine Engine, Environ. Sci. Technol. 46 (2012) 6393–6400.
doi:10.1021/es300301k.
[24] P. Lobo, D.E. Hagen, P.D. Whitefield, Measurement and analysis of aircraft engine PM emissions
downwind of an active runway at the Oakland International Airport, Atmos. Environ. 61 (2012)
114–123. doi:10.1016/J.ATMOSENV.2012.07.028.
[25] B.H. Lee, G.W. Santoni, E.C. Wood, S.C. Herndon, R.C. Miake-Lye, M.S. Zahniser, S.C. Wofsy,
J.W. Munger, Measurements of Nitrous Acid in Commercial Aircraft Exhaust at the Alternative
Aviation Fuel Experiment, Environ. Sci. Technol. 45 (2011) 7648–7654. doi:10.1021/es200921t.
[26] B.T. Brem, L. Durdina, F. Siegerist, P. Beyerle, K. Bruderer, T. Rindlisbacher, S. Rocci-Denis, ٣
M Gurhan Andac, J. Zelina, O. Penanhoat, J. Wang, Effects of Fuel Aromatic Content on
Nonvolatile Particulate Emissions of an In-Production Aircraft Gas Turbine, Environ. Sci.
Technol. 49 (2015) 13149–13157. doi:10.1021/acs.est.5b04167.
[27] L. Rye, C. Wilson, The influence of alternative fuel composition on gas turbine ignition
performance, Fuel. 96 (2012) 277–283. doi:10.1016/j.fuel.2011.12.047.

[28] P. Lobo, S. Christie, B. Khandelwal, S.G. Blakey, D.W. Raper, Evaluation of Non-volatile
Particulate Matter Emission Characteristics of an Aircraft Auxiliary Power Unit with Varying
Alternative Jet Fuel Blend Ratios, Energy & Fuels. 29 (2015) 7705–7711.
doi:10.1021/acs.energyfuels.5b01758.
[29] B. Khandelwal, S. Roy, C. Lord, S. Blakey, Comparison of Vibrations and Emissions of
Conventional Jet Fuel with Stressed 100% SPK and Fully Formulated Synthetic Jet Fuel,
Aerospace. 1 (2014) 52–66. doi:10.3390/aerospace1020052.
[30] B. Khandelwal, S. Roy, C. Lord, Effect of novel alternative fuels and compositions on vibrations
of a gas turbine engine, in: 50th AIAA/ASME/SAE/ASEE Jt. Propuls. Conf., American Institute
of Aeronautics and Astronautics, Reston, Virginia, 2014. doi:10.2514/6.2014-3410.
[31] M. Ruslan, I. Ahmed, B. Khandelwal, Evaluating Effects of Fuel Properties on Smoke Emissions,
in: Vol. 4A Combust. Fuels Emiss., 2016: p. V04AT04A046. doi:10.1115/GT2016-56791.
[32] B. Khandelwal, C.J. Wijesinghe, S. Sriraman, Effect of Alternative Fuels on Emissions and
Engine Compatibility, in: A.K. Runchal, A.K. Gupta, A. Kushari, A. De, S.K. Aggarwal (Eds.),
Energy Propuls. A Sustain. Technol. Approach, Springer Singapore, Singapore, 2018: pp. 27–50.
doi:10.1007/978-981-10-7473-8_2.
[33] C.J. Wijesinghe, B. Khandelwal, Impact of alternative fuel on gas turbine noise, vibration and
instability, in: AIAA Scitech 2019 Forum, American Institute of Aeronautics and Astronautics,
2019. doi:doi:10.2514/6.2019-0240.
[34] S. Blakey, C.W. Wilson, M. Farmery, R. Midgley, Fuel effects on range versus payload for
modern jet aircraft, Aeronaut. J. 115 (2011) 627–634. doi:10.1017/S000192400000631X.
[35] S. Roy, B. Khandelwal, Comparison of Gaseous Emissions between Jet A-1 and Severely Hydro-
Processed Jet Fuel from Conventional sources, in: 13th Int. Energy Convers. Eng. Conf.,

American Institute of Aeronautics and Astronautics, Reston, Virginia, 2015. doi:10.2514/6.2015-
4014.
[36] I. Uryga-Bugajska, M. Pourkashanian, D. Borman, E. Catalanotti, C.W. Wilson, Theoretical
investigation of the performance of alternative aviation fuels in an aero-engine combustion
chamber, Proc. Inst. Mech. Eng. Part G J. Aerosp. Eng. 225 (2011) 874–885.
doi:10.1177/0954410011402277.
[37] D.E. Hagen, P.D. Whitefield, H. Schlager, Particulate emissions in the exhaust plume from
commercial jet aircraft under cruise conditions, J. Geophys. Res. 101 (1996) 19551.
doi:10.1029/95JD03276.
[38] C.C. Wey, B.A. Anderson, C. Wey, R.C. Miake-Lye, P. Whitefield, R. Howard, Overview on the
Aircraft Particle Emissions Experiment (APEX), J. Propuls. Power. 23 (2007) 898–905.
doi:10.2514/1.26406.
[39] B. Khandelwal, E. Ubogu, M. Akram, S. Blakey, C.W. Wilson, Experimental Analysis on
Emission Production and Performance of Stressed 100 % SPK, Stressed Fully Formulated
Synthetic Jet Fuel, Jet A-1 in a Small Gas Turbine Engine, in: 11th Int. Energy Convers. Eng.
Conf., American Institute of Aeronautics and Astronautics, Reston, Virginia, 2013.
doi:10.2514/6.2013-3936.
[40] V.S.B. Shankar, B. Khandelwal, Comparison of Jet Fuel produced by Nonconventional Sources:
Manufacturing, Emission and Performance, in: 11th Int. Energy Convers. Eng. Conf., American
Institute of Aeronautics and Astronautics, Reston, Virginia, 2013. doi:10.2514/6.2013-3937.
[41] SAE, ARP1256 Procedure for the Continuous Sampling and Measurement of Gaseous Emissions
from Aircraft Turbine Engines, (1971). doi:https://doi.org/10.4271/ARP1256.
[42] SAE, ARP1533A Procedure for the Analysis and Evaluation of Gaseous Emissions from Aircraft

Engines, (2004). doi:https://doi.org/10.4271/ARP1533A.
[43] Cambustion, DMS Instrument Principle | Cambustion, (n.d.).
https://www.cambustion.com/products/dms (accessed February 15, 2019).
[44] SAE, ARP1179C Aircraft Gas Turbine Engine Exhaust Smoke Measurement, (1997).
doi:https://doi.org/10.4271/ARP1179C.
[45] Rolls-Royce, FAA, Rolls-Royce Alternative Fuels Program-Final Report (CLEEN), 2015.
[46] T.J. Johnson, J.S. Olfert, J.P.R. Symonds, M. Johnson, T. Rindlisbacher, J.J. Swanson, A.M.
Boies, K. Thomson, G. Smallwood, D. Walters, Y. Sevcenco, A. Crayford, R. Dastanpour, S.N.
Rogak, L. Durdina, Y.K. Bahk, B. Brem, J. Wang, Effective Density and Mass-Mobility Exponent
of Aircraft Turbine Particulate Matter, J. Propuls. Power. 31 (2015) 573–582.
doi:10.2514/1.B35367.
[47] S. Christie, P. Lobo, D. Lee, D. Raper, Gas turbine engine nonvolatile particulate matter mass
emissions: Correlation with smoke number for conventional and alternative fuel blends, Environ.
Sci. Technol. 51 (2017) 988–996. doi:10.1021/acs.est.6b03766.
[48] B.T. Brem, L. Durdina, F. Siegerist, P. Beyerle, K. Bruderer, T. Rindlisbacher, S. Rocci-Denis,
M.G. Andac, J. Zelina, O. Penanhoat, J. Wang, Effects of Fuel Aromatic Content on Nonvolatile
Particulate Emissions of an In-Production Aircraft Gas Turbine, Environ. Sci. Technol. 49 (2015)
13149–13157. doi:10.1021/acs.est.5b04167.