The Educational Benefits of ... - University of Chicago
23
Educational Evaluation and Policy Analysis June 2017, Vol. 39, No. 2, pp. 175–197 DOI: 10.3102/0162373716672039 © 2016 AERA. http://eepa.aera.net POLICYMAKERS nationwide are implementing an array of reforms that rest on a simple assump- tion: Students do better when they attend schools with high-achievement levels. The federal No Child Left Behind Act allows parents to choose other public schools if their child attends a per- sistently low-performing school. Race to the Top encouraged districts to consider closing poor- performing schools and send students to schools with higher performance. At the same time, many districts are trying to increase schooling opportu- nities by opening charter schools, career acade- mies, small schools, and selective schools that admit students based on academic performance, as well as providing scorecards that report the achievement levels of those schools to help guide families as they make enrollment decisions. Yet, existing research is insufficient to tell us whether, how, and under what circumstances stu- dents benefit from attending schools where their peers demonstrate high levels of achievement. Schools are perceived to be high performing based on the statistics reported about their stu- dents’ academic attainment—average test scores, percentage of students scoring at proficiency lev- els, and graduation rates. These statistics are sen- sible markers of school success, yet they may reflect the initial qualities of the students who choose to attend a particular school as much as the quality of the school. If a school is labeled as high performing based on the characteristics of the students who enroll there, it is not clear whether other students will benefit simply by attending it. Furthermore, state and district offi- cials need to understand how students benefit from attending higher performing schools as they weigh the pros and cons of implementing conten- tious policies such as closing low-performing schools or opening selective ones. Much is unknown about the benefits to stu- dents of attending schools that have higher overall achievement level. The benefits may not be the same for all types of schools: Gaining admissions based on academic qualifications 672039EPA XX X 10.3102/0162373716672039Allensworth et al.The Educational Benefits of Attending Higher Performing Schools research-article 2016 The Educational Benefits of Attending Higher Performing Schools: Evidence From Chicago High Schools Elaine M. Allensworth Paul T. Moore Lauren Sartain Marisa de la Torre University of Chicago Consortium on School Research Policymakers are implementing reforms with the assumption that students do better when attending high-achieving schools. In this article, we use longitudinal data from Chicago Public Schools to test that assumption. We find that the effects of attending a higher performing school depend on the school’s performance level. At elite public schools with admission criteria, there are no academic benefits—test scores are not better, grades are lower—but students report better environments. In contrast, forgoing a very low-performing school for a nonselective school with high test scores and graduation rates improves a range of academic and nonacademic outcomes. Keywords: school choice, academic outcomes, survey research, matching, school quality
Transcript of The Educational Benefits of ... - University of Chicago
Educational Evaluation and Policy AnalysisJune 2017, Vol. 39, No. 2, pp. 175 –197
DOI: 10.3102/0162373716672039© 2016 AERA. http://eepa.aera.net
Policymakers nationwide are implementing an array of reforms that rest on a simple assump-tion: Students do better when they attend schools with high-achievement levels. The federal No Child Left Behind Act allows parents to choose other public schools if their child attends a per-sistently low-performing school. Race to the Top encouraged districts to consider closing poor-performing schools and send students to schools with higher performance. At the same time, many districts are trying to increase schooling opportu-nities by opening charter schools, career acade-mies, small schools, and selective schools that admit students based on academic performance, as well as providing scorecards that report the achievement levels of those schools to help guide families as they make enrollment decisions.
Yet, existing research is insufficient to tell us whether, how, and under what circumstances stu-dents benefit from attending schools where their peers demonstrate high levels of achievement. Schools are perceived to be high performing
based on the statistics reported about their stu-dents’ academic attainment—average test scores, percentage of students scoring at proficiency lev-els, and graduation rates. These statistics are sen-sible markers of school success, yet they may reflect the initial qualities of the students who choose to attend a particular school as much as the quality of the school. If a school is labeled as high performing based on the characteristics of the students who enroll there, it is not clear whether other students will benefit simply by attending it. Furthermore, state and district offi-cials need to understand how students benefit from attending higher performing schools as they weigh the pros and cons of implementing conten-tious policies such as closing low-performing schools or opening selective ones.
Much is unknown about the benefits to stu-dents of attending schools that have higher overall achievement level. The benefits may not be the same for all types of schools: Gaining admissions based on academic qualifications
672039 EPAXXX10.3102/0162373716672039Allensworth et al.The Educational Benefits of Attending Higher Performing Schoolsresearch-article2016
The Educational Benefits of Attending Higher Performing Schools: Evidence From Chicago
High Schools
Elaine M. AllensworthPaul T. MooreLauren Sartain
Marisa de la Torre
University of Chicago Consortium on School Research
Policymakers are implementing reforms with the assumption that students do better when attending high-achieving schools. In this article, we use longitudinal data from Chicago Public Schools to test that assumption. We find that the effects of attending a higher performing school depend on the school’s performance level. At elite public schools with admission criteria, there are no academic benefits—test scores are not better, grades are lower—but students report better environments. In contrast, forgoing a very low-performing school for a nonselective school with high test scores and graduation rates improves a range of academic and nonacademic outcomes.
Keywords: school choice, academic outcomes, survey research, matching, school quality
Allensworth et al.
176
into a very high-achieving selective school may be very different from the effect of getting out of a very low-achieving school. With the preva-lence of school choice systems, there is also a need to know whether there are benefits to get-ting into the highest achieving school possible, among schools that are neither high- nor low-performing. Furthermore, almost all research to date has examined the effects of schools on stu-dents’ test scores, so there is little knowledge about the effects on other outcomes that fami-lies care about, such as students’ experiences in school (e.g., feelings of safety, belonging, aca-demic challenge) and college outcomes. This article addresses these gaps in research, asking,
Research Question 1: What are the effects of attending a higher performing school on students’ academic and nonacademic out-comes, relative to the school they would otherwise attend?
Research Question 2: Do the effects of attending a higher achieving school vary based on the high school’s quality (as measured by test scores and graduation rates)?
Previous Research on the Effects of Attending a Higher Performing School
Studying the effects of higher performing schools is difficult; there is the potential for sub-stantial selection bias when families choose schools. Among studies with strong strategies to address bias, there are contradictory findings. Some studies show strong positive effects from attending higher performing schools, but many others show no benefits. However, this body of research includes many different types of con-trasts with different definitions of “high-achiev-ing” schools and different counterfactuals. There is more consistency in the literature when focus-ing on three kinds of comparisons: (a) gaining admission to a selective school with achieve-ment requirements, (b) attending a higher per-forming nonselective school versus a lower performing one within a heterogeneous system of schools, and (c) moving out of very low-per-forming schools into schools with somewhat higher achievement.
Gaining Admission to a Selective School
Public selective schools concentrate on the most academically talented students together. Despite high demand to get into these schools, and perceptions that they are strong schools, there is little evidence that students show signifi-cantly better academic achievement as a result of gaining entrance. One study that used extensive controls found only limited benefits for students’ test scores from attending magnet high schools—higher test scores in reading and social studies, but not in math and science (Gamoran, 1996). More recent studies that explicitly address selec-tion bias through regression-discontinuity meth-ods found no benefits to students’ test scores from attending higher performing high schools with conflicting evidence on benefits to college enrollment (Abdulkadiroğlu, Angrist, & Pathak, 2014; Clark, 2010; Dobbie & Fryer, 2014). These recent studies suggest that any apparent advan-tages on student achievement gained by attend-ing a selective school are actually due to selection and not due to value that the schools themselves add for their students.
Attending a Higher Performing School Across a Heterogeneous System of Schools
In districts with open-enrollment policies, stu-dents have choices about which high school to attend. In contrast to studies on selective schools, several studies have generally found positive effects from attending higher performing schools when examining system-wide enrollment pat-terns. Two experiments in Charlotte-Mecklenburg Public School District, in which treated families enrolled in higher achieving schools after receiv-ing information about the achievement levels of local schools, both found that attending a higher scoring school increased student test scores (Hastings & Weinstein, 2008). Two international studies, where students are allowed to rank their school choices but receive admission based on test scores, found large positive effects on exit exams based on regression-discontinuity designs (Jackson, 2010; Pop-Eleches & Urquiola, 2013).
At the same time, there may be heterogeneity in the effects of getting into a higher performing school within a tiered system. The positive find-ings from the international studies (Jackson, 2010; Pop-Eleches & Urquiola, 2013) were not
The Educational Benefits of Attending Higher Performing Schools
177
observed among students who made it into low-achieving schools (those in the bottom third), relative to students who just missed the cutoff for those schools and attended even lower perform-ing ones (at the very bottom of the distribution). Instead, the positive effects from these studies seem to be have been driven by students gaining entrance to schools in the top two thirds of the achievement distribution. Another study that shows little effect from gaining entrance to mod-erately performing schools (relative to very poor-performing ones) can be seen in the work of Cullen, Jacob, and Levitt (2005) who examined the effects of gaining admission to nonselective neighborhood high schools in Chicago through lotteries. Students who won a school lottery attended marginally better-performing high schools than students who applied but lost the lottery, but the schools in their study with lotter-ies were generally low-to-moderate achieving.1 Lottery winners showed no benefit in terms of graduation, test scores, attendance rates, course taking, and credit accumulation, although they did find lower rates of disciplinary incidences and arrest rates for lottery winners. Thus, there is not strong evidence that students benefit academ-ically from getting into moderately performing schools, relative to very low-performing ones.
Exiting Very Low-Performing Schools
At the other end of the spectrum are schools with extremely low performance. These schools generally serve large numbers of low-income students with poor incoming achievement; they face substantial educational challenges, and staff members are often overwhelmed by the vast needs of their students (Neild, 2004). The option to attend a different high school may be particularly crucial for the outcomes of students who would otherwise attend these very low-performing schools. These are the types of schools that have been targeted by policies such as the federal Race to the Top and No Child Left Behind Acts, which have provisions to allow or force students to move to higher performing schools through vouchers or school closure. Yet, there are few studies that exist on the effects of moving out of bottom-performing schools, and those that are most relevant show no academic benefits. Studies of closing low-performing
schools show no improvements in test scores, on average, for the students who were displaced (Barrow, Park, & Schanzenbach, 2011; Brummet, 2014; de la Torre & Gwynne, 2009). This could result because most displaced stu-dents moved to schools that were only modestly higher achieving than the ones that closed; those few students who enrolled in schools that had much higher achievement levels than the schools that were closed did experience test score gains (Brummet, 2014; de la Torre & Gwynne, 2009; Engberg, Gill, Zamarro, & Zimmer, 2012).
Limitations of Existing Studies
One of the limitations of the existing research is the lack of knowledge about whether there are different effects based on the type of comparison that is being made: Studies either narrowly examine the benefits of one type of high-per-forming school (e.g., getting into selective schools, getting out of extremely low-performing schools), or they combine many different types of schools into the analysis without differentiat-ing the type of contrast being made. A second limitation arises from the need to account for selection bias. Those studies that are most atten-tive to potential bias tend to use lotteries or regression discontinuities. Although they suffi-ciently address selection bias, they are often con-strained to study only a limited number of schools (e.g., those that are able to run lotteries or use explicit admission criteria) or a limited number of students (e.g., those with achievement near the admission cutoff). Yet, these marginal students may have different experiences than students with more typical qualifications. Likewise, schools that are popular enough to run lotteries may be very different from undersubscribed schools. Another limitation is that few studies examine many outcomes beyond test scores, so there is little known about other important out-comes. Parents may also be concerned about their children’s experience in school, such as stu-dents’ feelings of safety and belonging in school, their perceptions of the quality of classroom instruction, and their risk of being suspended.
This article contributes to the existing lit-erature on all of these dimensions. We exam-ine the effects of attending higher performing
Allensworth et al.
178
high schools on a variety of academic and nonacademic outcomes. We examine all schools in a large district—not just those that have lotteries or specific enrollment poli-cies—and all students who had some propen-sity for attending schools with different levels of achievement. We also examine the impact of attending schools on various performance levels—what it means for students to attend selective high schools, to attend high-per-forming nonselective high schools, and to avoid a very low-performing school.
The Chicago Context: Options for High School
Chicago Public Schools (CPS) is a large, pub-lic school district that enrolls 85% minority stu-dents and where 85% of students qualify for free or reduced-price lunch. Chicago is an ideal place to do this work. It contains different types of schools of varying academic composition: extremely high-achieving selective schools, quality neighborhood schools, many heteroge-neous schools, and a number of poor-performing schools. CPS is an open-enrollment district with a portfolio-style approach to providing high school options for students. Each student has a default high school with geographic attendance boundaries. However, students can apply to attend another neighborhood school that is not at capacity, as well as high schools with admissions criteria, including charter high schools, technical schools, military academies, and performing arts schools. In the 2011–2012 school year, 69% of ninth graders attended a high school other than their neighborhood school. Thus, it is a district in which questions of school choice are relevant and pressing.
The district encourages students to engage in the high school choice process through high school fairs, information to parents, and adver-tisements on billboards and the radio. They pro-vide students with a high school handbook that provides information on all high schools in the district, including indicators of the school’s performance level (ACT scores and graduation rates among them), as well as information about specific programs and admissions processes. CPS central office has made efforts to
streamline the high school application process, though it can still be difficult for students to navigate.
Data and Method
Defining the Treatment
We define high school performance in a way that utilizes information available to families when making choices about high school enroll-ment. We use two measures of performance, average ACT scores and 4-year graduation rates, that were publicly available in the year before students entered high school when students would make decisions about which school to attend. Therefore, definitions of school perfor-mance level are based on the performance of stu-dents who entered the high school several years prior to the students making choices about where to enroll. We follow the methodology used in Black and Smith (2004) to classify colleges in terms of quality. We first separate the selective schools from the other high schools; these are examined separately from others for several rea-sons: (a) They have testing requirements for stu-dents and, because of that, serve students with exceptionally high levels of incoming achieve-ment relative to other schools; (b) their admis-sion algorithm is known, and we can control directly for the variables that determine admis-sion in the propensity score model; and (c) this group of selective schools is comparable with exam-based schools that have been the subject of research in other places, and we want to isolate the effects of attending these schools to compare results with those in other districts. Because the selection criteria for selective schools are known, we can compare the estimates we obtain from this analysis with those obtained through other methodologies (e.g., regression-discontinuity designs) in subsequent work.
For all remaining schools (i.e., those that are nonselective), we demean the graduation rate and ACT score within each year to account for time trends in these measures. To combine ACT and graduation rates into a single measure, we use principal components analysis. The school-year observations are then assigned to one of three groups, based on breaking the first principal component score into terciles. This results in four
The Educational Benefits of Attending Higher Performing Schools
179
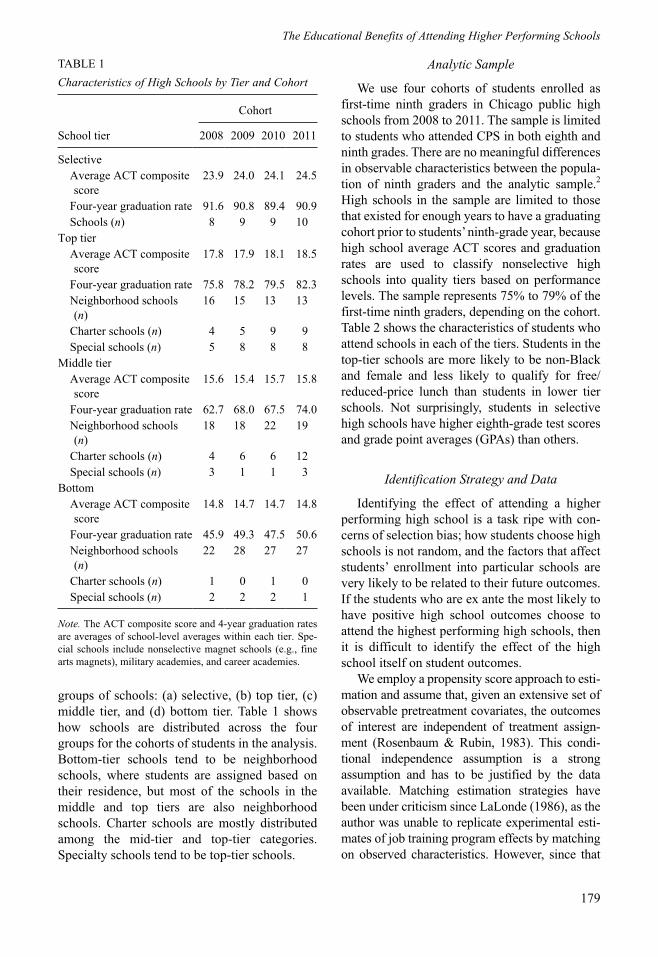
groups of schools: (a) selective, (b) top tier, (c) middle tier, and (d) bottom tier. Table 1 shows how schools are distributed across the four groups for the cohorts of students in the analysis. Bottom-tier schools tend to be neighborhood schools, where students are assigned based on their residence, but most of the schools in the middle and top tiers are also neighborhood schools. Charter schools are mostly distributed among the mid-tier and top-tier categories. Specialty schools tend to be top-tier schools.
Analytic Sample
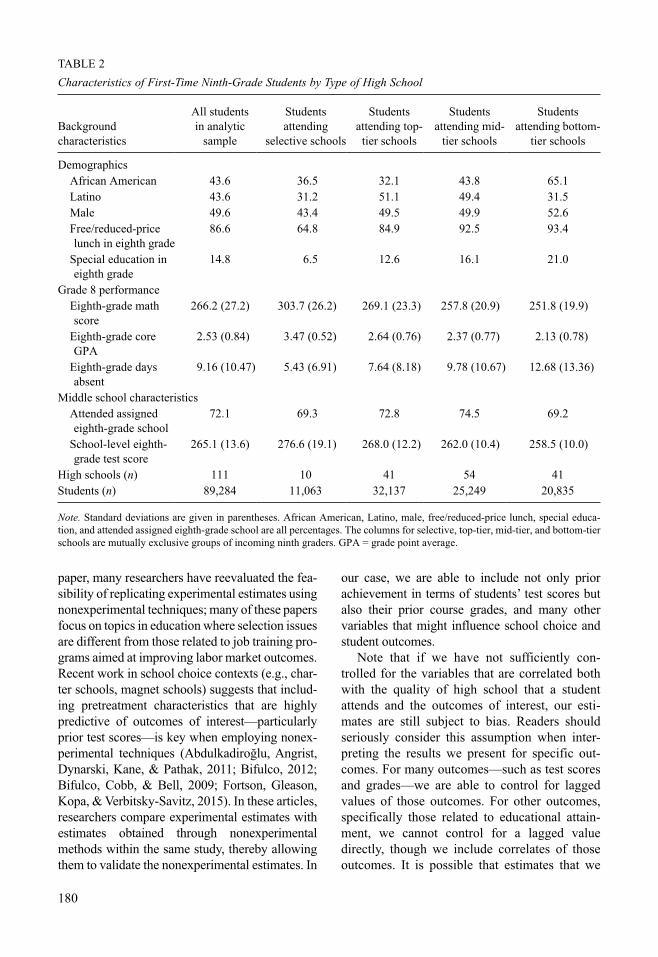
We use four cohorts of students enrolled as first-time ninth graders in Chicago public high schools from 2008 to 2011. The sample is limited to students who attended CPS in both eighth and ninth grades. There are no meaningful differences in observable characteristics between the popula-tion of ninth graders and the analytic sample.2 High schools in the sample are limited to those that existed for enough years to have a graduating cohort prior to students’ ninth-grade year, because high school average ACT scores and graduation rates are used to classify nonselective high schools into quality tiers based on performance levels. The sample represents 75% to 79% of the first-time ninth graders, depending on the cohort. Table 2 shows the characteristics of students who attend schools in each of the tiers. Students in the top-tier schools are more likely to be non-Black and female and less likely to qualify for free/reduced-price lunch than students in lower tier schools. Not surprisingly, students in selective high schools have higher eighth-grade test scores and grade point averages (GPAs) than others.
Identification Strategy and Data
Identifying the effect of attending a higher performing high school is a task ripe with con-cerns of selection bias; how students choose high schools is not random, and the factors that affect students’ enrollment into particular schools are very likely to be related to their future outcomes. If the students who are ex ante the most likely to have positive high school outcomes choose to attend the highest performing high schools, then it is difficult to identify the effect of the high school itself on student outcomes.
We employ a propensity score approach to esti-mation and assume that, given an extensive set of observable pretreatment covariates, the outcomes of interest are independent of treatment assign-ment (Rosenbaum & Rubin, 1983). This condi-tional independence assumption is a strong assumption and has to be justified by the data available. Matching estimation strategies have been under criticism since LaLonde (1986), as the author was unable to replicate experimental esti-mates of job training program effects by matching on observed characteristics. However, since that
TABLE 1
Characteristics of High Schools by Tier and Cohort
School tier
Cohort
2008 2009 2010 2011
Selective Average ACT composite
score23.9 24.0 24.1 24.5
Four-year graduation rate 91.6 90.8 89.4 90.9 Schools (n) 8 9 9 10Top tier Average ACT composite
score17.8 17.9 18.1 18.5
Four-year graduation rate 75.8 78.2 79.5 82.3 Neighborhood schools
(n)16 15 13 13
Charter schools (n) 4 5 9 9 Special schools (n) 5 8 8 8Middle tier Average ACT composite
score15.6 15.4 15.7 15.8
Four-year graduation rate 62.7 68.0 67.5 74.0 Neighborhood schools
(n)18 18 22 19
Charter schools (n) 4 6 6 12 Special schools (n) 3 1 1 3Bottom Average ACT composite
score14.8 14.7 14.7 14.8
Four-year graduation rate 45.9 49.3 47.5 50.6 Neighborhood schools
(n)22 28 27 27
Charter schools (n) 1 0 1 0 Special schools (n) 2 2 2 1
Note. The ACT composite score and 4-year graduation rates are averages of school-level averages within each tier. Spe-cial schools include nonselective magnet schools (e.g., fine arts magnets), military academies, and career academies.
180
paper, many researchers have reevaluated the fea-sibility of replicating experimental estimates using nonexperimental techniques; many of these papers focus on topics in education where selection issues are different from those related to job training pro-grams aimed at improving labor market outcomes. Recent work in school choice contexts (e.g., char-ter schools, magnet schools) suggests that includ-ing pretreatment characteristics that are highly predictive of outcomes of interest—particularly prior test scores—is key when employing nonex-perimental techniques (Abdulkadiroğlu, Angrist, Dynarski, Kane, & Pathak, 2011; Bifulco, 2012; Bifulco, Cobb, & Bell, 2009; Fortson, Gleason, Kopa, & Verbitsky-Savitz, 2015). In these articles, researchers compare experimental estimates with estimates obtained through nonexperimental methods within the same study, thereby allowing them to validate the nonexperimental estimates. In
our case, we are able to include not only prior achievement in terms of students’ test scores but also their prior course grades, and many other variables that might influence school choice and student outcomes.
Note that if we have not sufficiently con-trolled for the variables that are correlated both with the quality of high school that a student attends and the outcomes of interest, our esti-mates are still subject to bias. Readers should seriously consider this assumption when inter-preting the results we present for specific out-comes. For many outcomes—such as test scores and grades—we are able to control for lagged values of those outcomes. For other outcomes, specifically those related to educational attain-ment, we cannot control for a lagged value directly, though we include correlates of those outcomes. It is possible that estimates that we
TABLE 2
Characteristics of First-Time Ninth-Grade Students by Type of High School
Background characteristics
All students in analytic
sample
Students attending
selective schools
Students attending top-tier schools
Students attending mid-
tier schools
Students attending bottom-
tier schools
Demographics African American 43.6 36.5 32.1 43.8 65.1 Latino 43.6 31.2 51.1 49.4 31.5 Male 49.6 43.4 49.5 49.9 52.6 Free/reduced-price
lunch in eighth grade86.6 64.8 84.9 92.5 93.4
Special education in eighth grade
14.8 6.5 12.6 16.1 21.0
Grade 8 performance Eighth-grade math
score266.2 (27.2) 303.7 (26.2) 269.1 (23.3) 257.8 (20.9) 251.8 (19.9)
Eighth-grade core GPA
2.53 (0.84) 3.47 (0.52) 2.64 (0.76) 2.37 (0.77) 2.13 (0.78)
Eighth-grade days absent
9.16 (10.47) 5.43 (6.91) 7.64 (8.18) 9.78 (10.67) 12.68 (13.36)
Middle school characteristics Attended assigned
eighth-grade school72.1 69.3 72.8 74.5 69.2
School-level eighth-grade test score
265.1 (13.6) 276.6 (19.1) 268.0 (12.2) 262.0 (10.4) 258.5 (10.0)
High schools (n) 111 10 41 54 41Students (n) 89,284 11,063 32,137 25,249 20,835
Note. Standard deviations are given in parentheses. African American, Latino, male, free/reduced-price lunch, special educa-tion, and attended assigned eighth-grade school are all percentages. The columns for selective, top-tier, mid-tier, and bottom-tier schools are mutually exclusive groups of incoming ninth graders. GPA = grade point average.
The Educational Benefits of Attending Higher Performing Schools
181
provide for educational attainment, and for some of the nonacademic outcomes for which we do not have a lagged control, are more subject to bias.
One approach to address bias in matching esti-mators is to utilize data on students that predict both an individual’s participation in treatment and the outcomes of interest. We use detailed pretreat-ment student-level information, including compre-hensive academic records in the middle grades (course grades, test scores), their behaviors in the middle grades (attendance, discipline records), stu-dent reports about parent involvement, character-izations of socioeconomic status and crime in their neighborhood, their demographics, and character-istics of their middle school. Information about students’ middle school, parents, and communities is particularly important for this article. Better-educated and motivated parents are more likely to participate in school choice programs (Levin, 2002; McEwan, 2000), and these parental charac-teristics could generate a spurious relationship between choice and outcomes. Yet, it is very unlikely that parents who are active in securing a “good” high school for their child would have been ambivalent about their child’s middle school edu-cation. The mechanisms that parents use to place their child (e.g., residential neighborhood choice, entering a school lottery) might differ for middle versus high school, but the degree of parents’ moti-vation to secure a good education for their child should result in similarly advantageous place-ments. Table 3 describes the data used to construct the propensity weights. In total, it is hard to imag-ine factors influencing both high school selection and student achievement that would not be cap-tured by this rich student-level information.
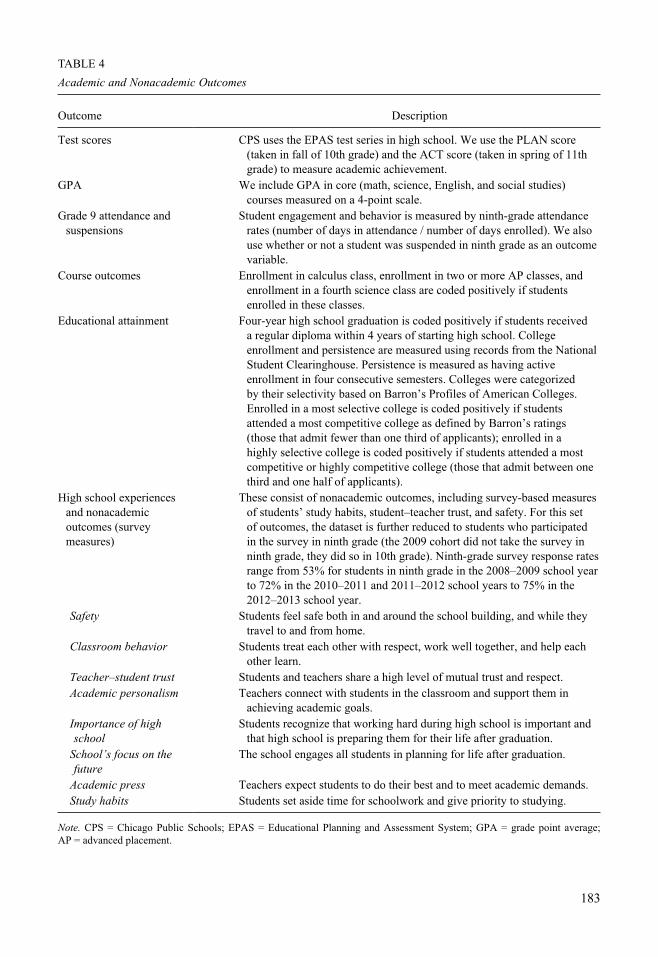
Table 4 lists the academic and nonacademic out-comes that we study. Academic outcomes are derived from district administrative datasets. They include test scores from ACT’s Educational Planning and Assessment System (EPAS), taken by all students. We examine 11th-grade GPA (which is the GPA that students use to apply to college), whether students graduate from high school, and course-taking patterns. For two cohorts of students, we are able to examine college enrollment, includ-ing the selectivity of the college. Two indicators of nonacademic outcomes come from CPS adminis-trative data—attendance (the percentage of enrolled days that a student attends school) and suspensions.
Nonacademic outcomes also include survey mea-sures of students’ perceptions of safety at school, classroom behavior, relationships with teachers, academic challenge and study habits, and the degree to which the high school is focused on pre-paring students for the future (see Appendix Table A1, for detailed information on measures, available in the online version of the journal). Survey mea-sures may be subject to reference bias, in which respondents make judgments based on compari-sons with others within the same context. Here, we are less interested in the actual quality of the school than in students’ perceptions, for which reference bias is less of a concern.
Propensity Score Models
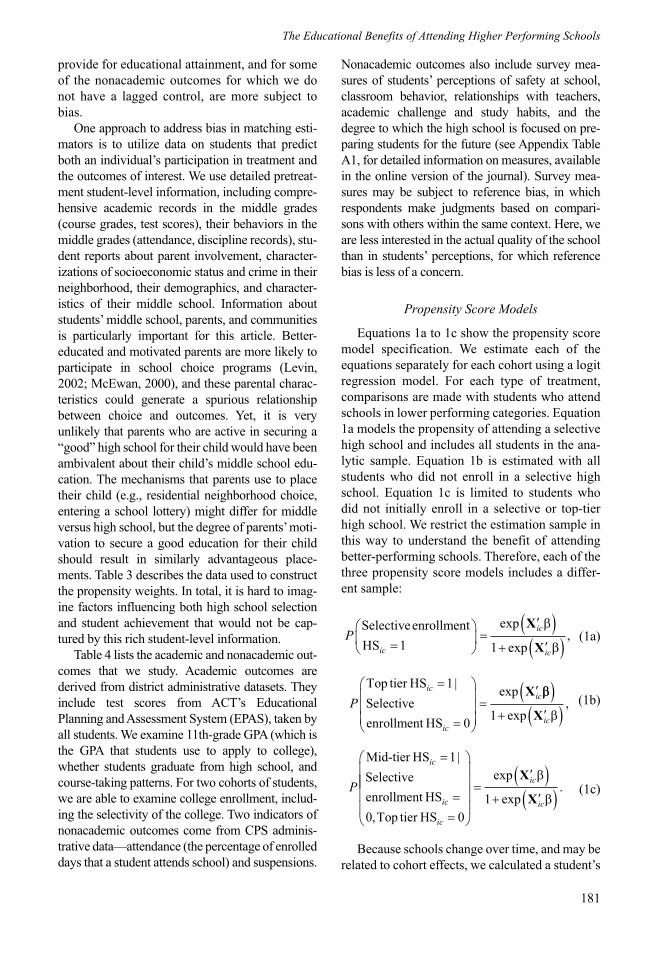
Equations 1a to 1c show the propensity score model specification. We estimate each of the equations separately for each cohort using a logit regression model. For each type of treatment, comparisons are made with students who attend schools in lower performing categories. Equation 1a models the propensity of attending a selective high school and includes all students in the ana-lytic sample. Equation 1b is estimated with all students who did not enroll in a selective high school. Equation 1c is limited to students who did not initially enroll in a selective or top-tier high school. We restrict the estimation sample in this way to understand the benefit of attending better-performing schools. Therefore, each of the three propensity score models includes a differ-ent sample:
Pic
ic
ic
Selectiveenrollment
HS
exp
exp=
=
′( )+ ′( )1 1
X
X
β
β, (1a)
Pic
ic
icTop tier HS
Selective
enrollment HS
exp=
=
=
′1
0
|X ββ
β
( )+ ′( )1 exp Xic
, (1b)
P
ic
ic
ic
Mid-tier HS
Selective
enrollment HS
Top tier HS
=
==
1
0 0
|
,
=′( )
+ ′( )exp
exp
X
X
ic
ic
β
β1. (1c)
Because schools change over time, and may be related to cohort effects, we calculated a student’s

182
propensity for treatment within his or her cohort of first-time ninth graders. We use a semi-non-parametric specification, binning continuous variables such as prior test scores and adding
interaction terms. The Xic vector contains exten-sive pretreatment covariates, as shown in Table 3, for student i in cohort c. This vector also includes information about the student’s neighborhood and
TABLE 3
Covariates Included in the Propensity Score Model
Covariates Description
Student background Demographic variables such as gender, race/ethnicity, special education, limited English proficiency, old for grade, and number of school moves during middle grades.
Neighborhood characteristics
Student addresses allow for linking of students to census block-group characteristics. We use two poverty indices: the percentage of adult males employed and the percentage of families with incomes above the poverty line. A measure of social status includes the mean level of education of adults and the percentage of employed persons who work as managers or professionals. These measures are created from the 2000 Census (for 2008–2009 cohorts) and from the American Community Survey (for 2010–2011 cohorts). We use a crime measure based on annual Chicago Police Department incident statistics, calculated as the log of the ratio of total number of crimes to the total population by census block. These variables were included in the analysis as indicator variables for nine different groups (stanines) separately for each of the variables.
Pre–high school choice We include an indicator for student opting out of his or her neighborhood elementary school. This is important because students who opt out of their neighborhood elementary schools are more likely to exercise school choice in high school.
Elementary/middle school characteristics
We include middle school characteristics because a student’s experience in the middle grades may influence high school choice and student outcomes. These variables include the average eighth-grade reading and math score, and whether the middle school was a charter, magnet, or neighborhood school. The schools’ average scores were included in the model as indicator variables for nine different groups (stanines) separately for reading and math.
Course grades Some high school admissions are based on grades in middle school core courses. We include indicator variables for nine groups of student performance (stanines) in core GPA Grades 7 and 8 separately. The number of core course failures in Grades 7 and 8 is also included in the model. The number of failures is introduced as six dummy variables indicating no failures and up to more than five failures. Due to data limitations, the model for the 2008 cohort only contains eighth-grade information.
Test scores High school admissions (where applicable) are based on student performance on the seventh-grade standardized test in reading and math. We include indicator variables for the stanine of student performance in reading and math in Grades 7 and 8.
Attendance and suspensions
Student engagement and behavior is accounted for with indicator variables for nine different groups (stanines) of attendance rates (days in school/days enrolled) in Grades 7 and 8. The number of suspensions in Grades 7 and 8 is introduced as six dummy variables indicating no suspensions up to more than five suspensions.
Middle-grade survey measures
We include student reports of the academic rigor of their classes, the hours spent studying or doing homework outside of school, parental support for learning, parental education level, and how perceptions of safety in middle school. The measures are included in the model as a series of dummy variables representing different levels on the measures. Data are used from whichever year the student participated most recently in the surveys before entering high school (seventh or eighth grade). The survey measures have similar average values among seventh graders and eighth graders.
High school application
Indicators for whether a student (a) began a selective high school application and (b) completed a selective high school application.
Indicators of missing data
We include indicator variables for each covariate that equals 1 if a student has missing data for that covariate and 0 otherwise.
Note. GPA = grade point average.
183
TABLE 4
Academic and Nonacademic Outcomes
Outcome Description
Test scores CPS uses the EPAS test series in high school. We use the PLAN score (taken in fall of 10th grade) and the ACT score (taken in spring of 11th grade) to measure academic achievement.
GPA We include GPA in core (math, science, English, and social studies) courses measured on a 4-point scale.
Grade 9 attendance and suspensions
Student engagement and behavior is measured by ninth-grade attendance rates (number of days in attendance / number of days enrolled). We also use whether or not a student was suspended in ninth grade as an outcome variable.
Course outcomes Enrollment in calculus class, enrollment in two or more AP classes, and enrollment in a fourth science class are coded positively if students enrolled in these classes.
Educational attainment Four-year high school graduation is coded positively if students received a regular diploma within 4 years of starting high school. College enrollment and persistence are measured using records from the National Student Clearinghouse. Persistence is measured as having active enrollment in four consecutive semesters. Colleges were categorized by their selectivity based on Barron’s Profiles of American Colleges. Enrolled in a most selective college is coded positively if students attended a most competitive college as defined by Barron’s ratings (those that admit fewer than one third of applicants); enrolled in a highly selective college is coded positively if students attended a most competitive or highly competitive college (those that admit between one third and one half of applicants).
High school experiences and nonacademic outcomes (survey measures)
These consist of nonacademic outcomes, including survey-based measures of students’ study habits, student–teacher trust, and safety. For this set of outcomes, the dataset is further reduced to students who participated in the survey in ninth grade (the 2009 cohort did not take the survey in ninth grade, they did so in 10th grade). Ninth-grade survey response rates range from 53% for students in ninth grade in the 2008–2009 school year to 72% in the 2010–2011 and 2011–2012 school years to 75% in the 2012–2013 school year.
Safety Students feel safe both in and around the school building, and while they travel to and from home.
Classroom behavior Students treat each other with respect, work well together, and help each other learn.
Teacher–student trust Students and teachers share a high level of mutual trust and respect. Academic personalism Teachers connect with students in the classroom and support them in
achieving academic goals. Importance of high
schoolStudents recognize that working hard during high school is important and
that high school is preparing them for their life after graduation. School’s focus on the
futureThe school engages all students in planning for life after graduation.
Academic press Teachers expect students to do their best and to meet academic demands. Study habits Students set aside time for schoolwork and give priority to studying.
Note. CPS = Chicago Public Schools; EPAS = Educational Planning and Assessment System; GPA = grade point average; AP = advanced placement.

Allensworth et al.
184
elementary school.3 In Appendix Table A2 (avail-able in the online version of the journal), we pro-vide correlations between pretreatment covariates used in the propensity model and a student’s like-lihood to attend a higher performing high school. This table provides readers with a sense of which pretreatment covariates more strongly predict a student’s high school choice. Note that continu-ous variables that we binned (e.g., poverty mea-sures, prior achievement) are shown in their continuous form in the table.
We then use the predicted probability P xic( )� from Equations 1a to 1c to estimate the outcome model (Equation 2) with inverse probability weights (IPWs; Equation 3):
Y T
w
ic ic c ic
ic
= + +
( )
δ φ ε , with
inverse probability weights
based on PP xic( )� , (2)
where Tic = 1 if the student attends a higher per-forming high school, and Tic = 0 otherwise.
w T TP x
P xic ic ic
ic
ic
= + −( )× ( )− ( )
11
�
�. (3)
Yic is the outcome of interest. Tic equals 1 if the student attends a higher performing high school and equals 0 otherwise. We run variants of Equation 2 to estimate separately the effect of attending (a) a selective high school, (b) a top-tier high school, and (c) a mid-tier high school. The estimated coefficient on Tic, δ , represents the effect of attending a higher performing high school. We also include a set of cohort fixed effects φc. The weights in Equation 3 indicate that δ should be interpreted as the average treat-ment effect of the treated. The weight equals 1 for treated students. Nontreated students are given higher weights when their propensity to receive treatment P xic( )� approaches 1. The out-comes of students with the lowest propensity for attending a higher performing high school receive weights that approach zero.
Common Support and Covariate Balance
We ensured that students at each propensity score level have some probability of being in
both the treatment and control groups: If students at some propensity score levels have a zero prob-ability of being in either the control or treated group, there is no comparison group for students with these combinations of covariates. The esti-mation of the treatment effect can only be defined in the region of common support. In fact, the dis-tribution of propensity scores for students in the treatment and control groups covers almost the entire range of scores for all three sets of com-parisons (see Appendix Figure A1, available in the online version of the journal). There are some students in the treatment groups with very low propensity scores, and students in the control group with very high propensity scores. We dis-regard students who fall outside the common support region, but the number is relatively small and does not pose a threat to the estimation of the treatment effects.4
Next, we checked for the balance of the covariates in both the control and treatment groups by comparing how far apart they were before and after the sample was weighted using the estimated propensity. We assessed the bal-ance of the variables by defining the difference of sample means in the treated and control groups divided by the square root of the average of sam-ple variances in both groups. The standardized bias for a particular covariate x in the original
sample is given by SB = − +( ( ) /) /x x s sc t c t2 2 2 ,
where xc is the mean of the control group, xt is the mean of the treated group, and sc
2 and st2 are
the variances of the control group and treated group, respectively.
Although other approaches rely on testing the differences in the covariates means, given the very large data samples in these analyses, they are not appropriate. In most empirical studies, a bias reduction that brings the standardized bias below .25 (Harder, Stuart, & Anthony, 2010) is seen as sufficient and considers the covariates balanced. Some researchers prefer a more strict cutoff point close to .1. In all 12 propensity models (four cohorts and three different treatments), none of the covariates had a standardized bias greater than .25 after weighting, and fewer than 12 of the variables in any of the propensity analyses showed standard-ized bias greater than .10 among all the original variables, the missing indicators, and the interac-tion terms (see Figure A2 and Table A3 in the
185
Appendix, available in the online version of the journal).5 Among the different treatments, the selection into selective schools was the one that showed the largest unbalances in the covariates before applying propensity score weights. Those covariates with potential for bias were tested in subsequent sensitivity analyses.
Results
This section provides estimates of the effects of attending higher performing high schools on a range of academic and nonacademic outcomes, relative to attending schools with lower quality. We make a number of comparisons that investi-gate heterogeneity in effects based on the quality of the high school attended. In the case of top-tier nonselective schools, we also provide separate estimates based on the counterfactual condition, for reasons described below. The comparisons are presented along a continuum of school qual-ity—from the effects of attending elite selective schools to the effects of attending schools with middling test scores and graduation rates, rela-tive to schools with lower quality. The estimates compare observationally similar students who attend
1. a selective school versus any other school (top-tier, mid-tier, or bottom-tier school)
2. a top-tier nonselective school versus a lower quality school (mid-tier or bottom tier)a. restricting top-tier to mid-tier com-
parisonsb. restricting top-tier to bottom-tier
comparisons3. a mid-tier school versus a bottom-tier
school.
Students who are in the comparison group for each definition of a higher performing school could potentially attend any high school in a lower performing tier; however, it turns out that students with the highest IPWs mostly come from schools in the bordering quality category. For instance, when estimating the probability of attending a top-tier school, students attending mid-tier schools tend to have higher propensity weights than stu-dents attending bottom-tier schools. Figures 1 to 3 illustrate this phenomenon.
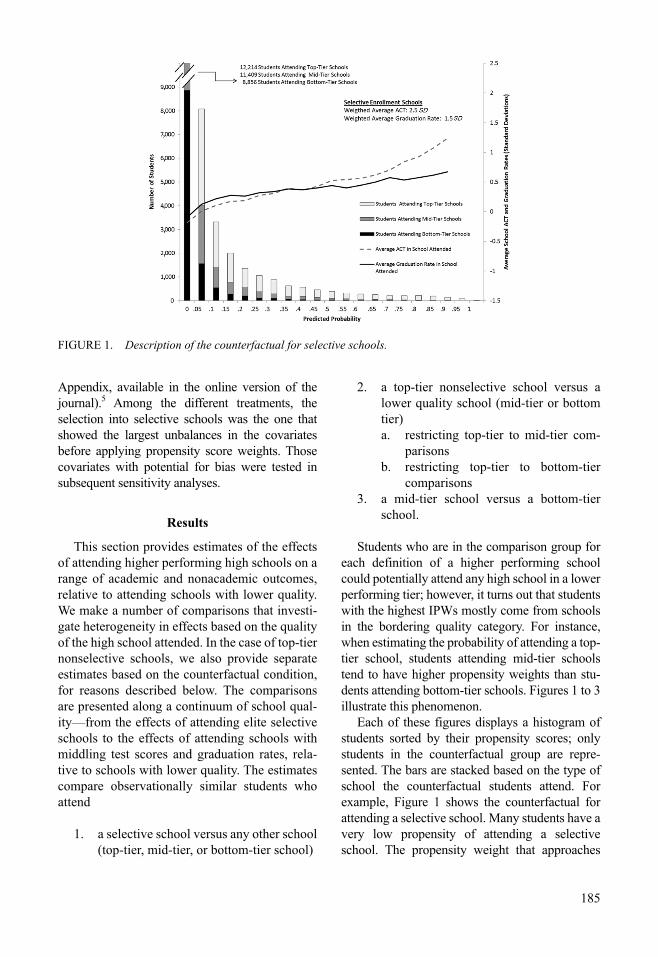
Each of these figures displays a histogram of students sorted by their propensity scores; only students in the counterfactual group are repre-sented. The bars are stacked based on the type of school the counterfactual students attend. For example, Figure 1 shows the counterfactual for attending a selective school. Many students have a very low propensity of attending a selective school. The propensity weight that approaches
FIGURE 1. Description of the counterfactual for selective schools.

186
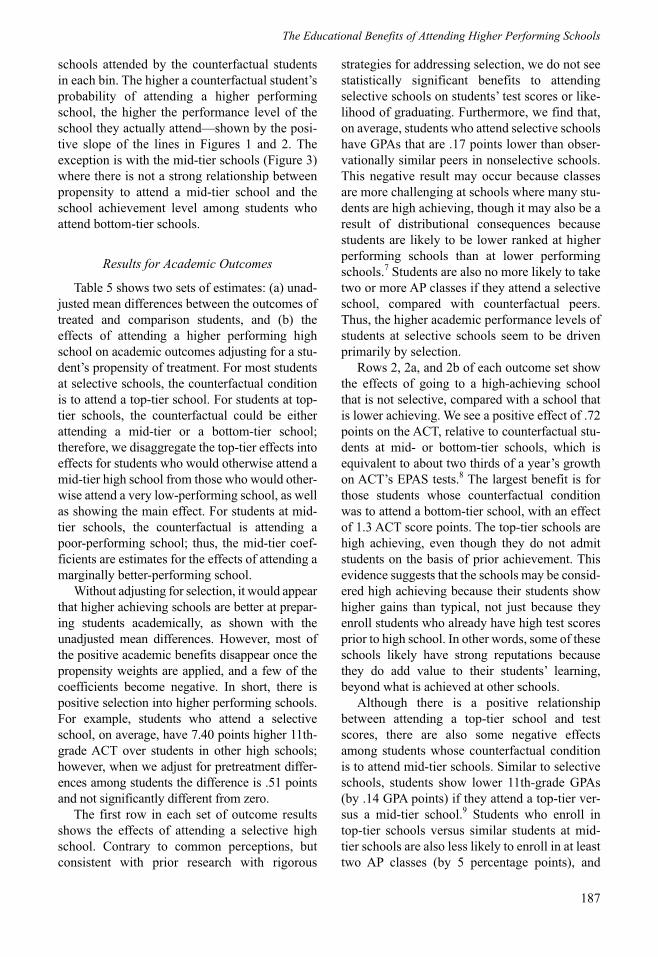
zero effectively removes them from the estimation model, as discussed previously. Among counter-factual students with propensities for attending a selective school of 5% or higher, most students attend top-tier schools. The differences are less stark in the figure for top-tier nonselective schools (Figure 2). At each propensity level, some stu-dents in the counterfactual for attending top-tier schools end up in either mid-tier or bottom-tier
schools. However, those with high propensities are more likely to end up in mid-tier schools, whereas those with low propensities are more likely to end up in bottom-tier schools.6
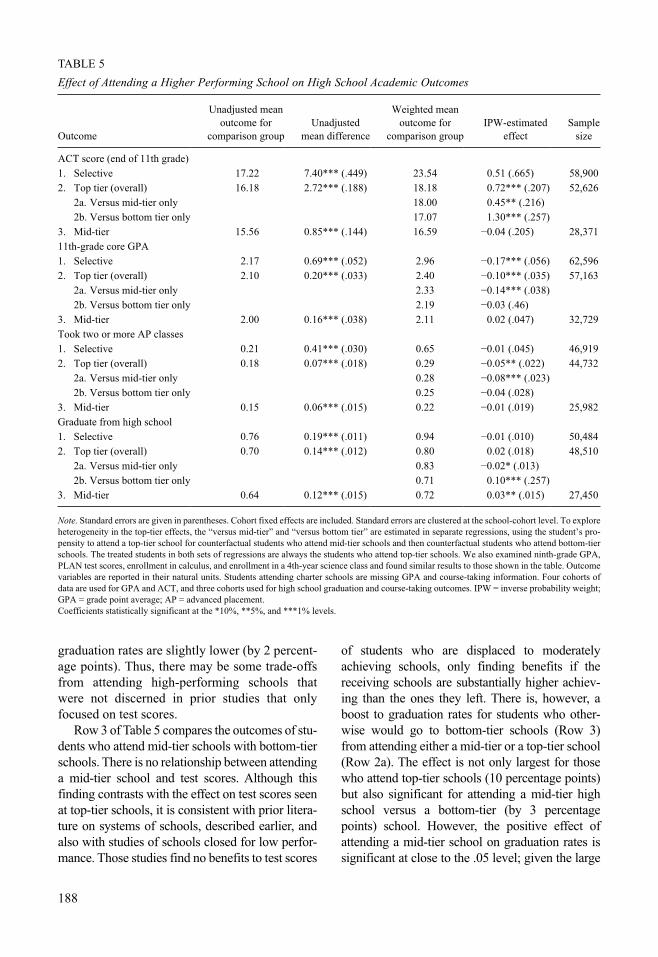
There are also two lines on the figures. The solid line represents the average graduation rate at the schools attended by the counterfactual stu-dents in each of the propensity score bins, and the dashed line is the average ACT score at the
FIGURE 3. Description of the counterfactual for mid-tier schools.
FIGURE 2. Description of the counterfactual for top-tier schools.
The Educational Benefits of Attending Higher Performing Schools
187
schools attended by the counterfactual students in each bin. The higher a counterfactual student’s probability of attending a higher performing school, the higher the performance level of the school they actually attend—shown by the posi-tive slope of the lines in Figures 1 and 2. The exception is with the mid-tier schools (Figure 3) where there is not a strong relationship between propensity to attend a mid-tier school and the school achievement level among students who attend bottom-tier schools.
Results for Academic Outcomes
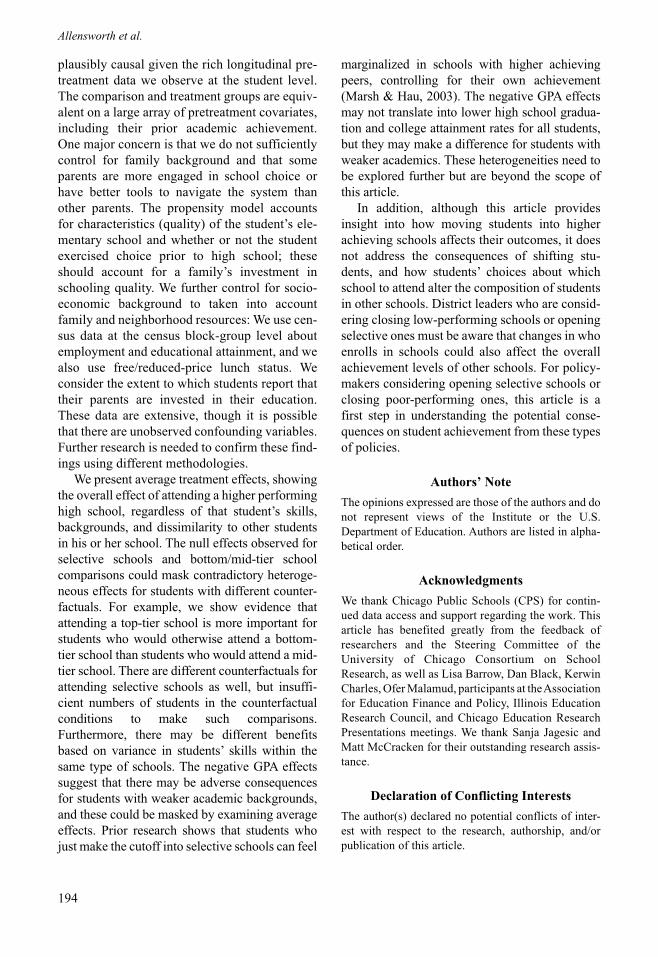
Table 5 shows two sets of estimates: (a) unad-justed mean differences between the outcomes of treated and comparison students, and (b) the effects of attending a higher performing high school on academic outcomes adjusting for a stu-dent’s propensity of treatment. For most students at selective schools, the counterfactual condition is to attend a top-tier school. For students at top-tier schools, the counterfactual could be either attending a mid-tier or a bottom-tier school; therefore, we disaggregate the top-tier effects into effects for students who would otherwise attend a mid-tier high school from those who would other-wise attend a very low-performing school, as well as showing the main effect. For students at mid-tier schools, the counterfactual is attending a poor-performing school; thus, the mid-tier coef-ficients are estimates for the effects of attending a marginally better-performing school.
Without adjusting for selection, it would appear that higher achieving schools are better at prepar-ing students academically, as shown with the unadjusted mean differences. However, most of the positive academic benefits disappear once the propensity weights are applied, and a few of the coefficients become negative. In short, there is positive selection into higher performing schools. For example, students who attend a selective school, on average, have 7.40 points higher 11th-grade ACT over students in other high schools; however, when we adjust for pretreatment differ-ences among students the difference is .51 points and not significantly different from zero.
The first row in each set of outcome results shows the effects of attending a selective high school. Contrary to common perceptions, but consistent with prior research with rigorous
strategies for addressing selection, we do not see statistically significant benefits to attending selective schools on students’ test scores or like-lihood of graduating. Furthermore, we find that, on average, students who attend selective schools have GPAs that are .17 points lower than obser-vationally similar peers in nonselective schools. This negative result may occur because classes are more challenging at schools where many stu-dents are high achieving, though it may also be a result of distributional consequences because students are likely to be lower ranked at higher performing schools than at lower performing schools.7 Students are also no more likely to take two or more AP classes if they attend a selective school, compared with counterfactual peers. Thus, the higher academic performance levels of students at selective schools seem to be driven primarily by selection.
Rows 2, 2a, and 2b of each outcome set show the effects of going to a high-achieving school that is not selective, compared with a school that is lower achieving. We see a positive effect of .72 points on the ACT, relative to counterfactual stu-dents at mid- or bottom-tier schools, which is equivalent to about two thirds of a year’s growth on ACT’s EPAS tests.8 The largest benefit is for those students whose counterfactual condition was to attend a bottom-tier school, with an effect of 1.3 ACT score points. The top-tier schools are high achieving, even though they do not admit students on the basis of prior achievement. This evidence suggests that the schools may be consid-ered high achieving because their students show higher gains than typical, not just because they enroll students who already have high test scores prior to high school. In other words, some of these schools likely have strong reputations because they do add value to their students’ learning, beyond what is achieved at other schools.
Although there is a positive relationship between attending a top-tier school and test scores, there are also some negative effects among students whose counterfactual condition is to attend mid-tier schools. Similar to selective schools, students show lower 11th-grade GPAs (by .14 GPA points) if they attend a top-tier ver-sus a mid-tier school.9 Students who enroll in top-tier schools versus similar students at mid-tier schools are also less likely to enroll in at least two AP classes (by 5 percentage points), and
188
graduation rates are slightly lower (by 2 percent-age points). Thus, there may be some trade-offs from attending high-performing schools that were not discerned in prior studies that only focused on test scores.
Row 3 of Table 5 compares the outcomes of stu-dents who attend mid-tier schools with bottom-tier schools. There is no relationship between attending a mid-tier school and test scores. Although this finding contrasts with the effect on test scores seen at top-tier schools, it is consistent with prior litera-ture on systems of schools, described earlier, and also with studies of schools closed for low perfor-mance. Those studies find no benefits to test scores
of students who are displaced to moderately achieving schools, only finding benefits if the receiving schools are substantially higher achiev-ing than the ones they left. There is, however, a boost to graduation rates for students who other-wise would go to bottom-tier schools (Row 3) from attending either a mid-tier or a top-tier school (Row 2a). The effect is not only largest for those who attend top-tier schools (10 percentage points) but also significant for attending a mid-tier high school versus a bottom-tier (by 3 percentage points) school. However, the positive effect of attending a mid-tier school on graduation rates is significant at close to the .05 level; given the large
TABLE 5
Effect of Attending a Higher Performing School on High School Academic Outcomes
Outcome
Unadjusted mean outcome for
comparison groupUnadjusted
mean difference
Weighted mean outcome for
comparison groupIPW-estimated
effectSample
size
ACT score (end of 11th grade)1. Selective 17.22 7.40*** (.449) 23.54 0.51 (.665) 58,9002. Top tier (overall) 16.18 2.72*** (.188) 18.18 0.72*** (.207) 52,626
2a. Versus mid-tier only 18.00 0.45** (.216) 2b. Versus bottom tier only 17.07 1.30*** (.257)
3. Mid-tier 15.56 0.85*** (.144) 16.59 −0.04 (.205) 28,37111th-grade core GPA1. Selective 2.17 0.69*** (.052) 2.96 −0.17*** (.056) 62,5962. Top tier (overall) 2.10 0.20*** (.033) 2.40 −0.10*** (.035) 57,163
2a. Versus mid-tier only 2.33 −0.14*** (.038) 2b. Versus bottom tier only 2.19 −0.03 (.46)
3. Mid-tier 2.00 0.16*** (.038) 2.11 0.02 (.047) 32,729Took two or more AP classes1. Selective 0.21 0.41*** (.030) 0.65 −0.01 (.045) 46,9192. Top tier (overall) 0.18 0.07*** (.018) 0.29 −0.05** (.022) 44,732
2a. Versus mid-tier only 0.28 −0.08*** (.023) 2b. Versus bottom tier only 0.25 −0.04 (.028)
3. Mid-tier 0.15 0.06*** (.015) 0.22 −0.01 (.019) 25,982Graduate from high school1. Selective 0.76 0.19*** (.011) 0.94 −0.01 (.010) 50,4842. Top tier (overall) 0.70 0.14*** (.012) 0.80 0.02 (.018) 48,510
2a. Versus mid-tier only 0.83 −0.02* (.013) 2b. Versus bottom tier only 0.71 0.10*** (.257)
3. Mid-tier 0.64 0.12*** (.015) 0.72 0.03** (.015) 27,450
Note. Standard errors are given in parentheses. Cohort fixed effects are included. Standard errors are clustered at the school-cohort level. To explore heterogeneity in the top-tier effects, the “versus mid-tier” and “versus bottom tier” are estimated in separate regressions, using the student’s pro-pensity to attend a top-tier school for counterfactual students who attend mid-tier schools and then counterfactual students who attend bottom-tier schools. The treated students in both sets of regressions are always the students who attend top-tier schools. We also examined ninth-grade GPA, PLAN test scores, enrollment in calculus, and enrollment in a 4th-year science class and found similar results to those shown in the table. Outcome variables are reported in their natural units. Students attending charter schools are missing GPA and course-taking information. Four cohorts of data are used for GPA and ACT, and three cohorts used for high school graduation and course-taking outcomes. IPW = inverse probability weight; GPA = grade point average; AP = advanced placement.Coefficients statistically significant at the *10%, **5%, and ***1% levels.

The Educational Benefits of Attending Higher Performing Schools
189
number of significant tests that were conducted, this finding should be interpreted cautiously. Course-taking patterns generally look similar for students attending mid-tier schools and their coun-terparts in bottom-tier schools.
Not shown in Table 5 are ninth-grade GPA and PLAN test scores; these mirror the estimates seen in the 11th grade in terms of both direction and significance level. Other course-taking pat-terns were also examined, such as taking calcu-lus and a 4th year of science, and similar results were detected.
Results for Nonacademic Outcomes
Although there are few benefits to attending a selective school on high school academic out-comes, there seem to be considerable nonaca-demic benefits (see Table 6). Generally, students who attend either selective or top-tier schools have better perceptions of high school experi-ences than their counterparts in lower performing schools. The differences are bigger in magnitude for selective schools than for top-tier schools, and few nonacademic differences are observed for mid-tier schools. The estimated effects of attend-ing a top-tier school on students’ nonacademic outcomes are also larger for students whose coun-terfactual is a bottom-tier school than for those whose counterfactual is a mid-tier school.
The experiential differences that are largest in magnitude are with students’ reports of their peers’ behaviors in school. Students at selective schools report better classroom behavior among their peers than students in the comparison group by greater than .5 of a standard deviation. Students at top-tier schools also report better-behaving classroom peers than their counterfactual peers by .18 standard deviations. Students at selective schools also report stronger trust of their teacher (.20 SDs), more academic personalism (.11 SDs), more academic press (.15 SDs), and a stronger focus on the future in their schools. They are also more likely to be in attendance and less likely to get suspended than counterfactual students.
Students at top-tier schools also tend to report better high school experiences than their counter-factual counterparts, but the differences are not as pronounced as with students at selective schools. Students who attend mid-tier schools compared with similar students in lower performing schools
report fairly similar high school experiences. Their attendance, suspension rates, and study habits are similar to their comparable peers in bottom-tier schools. The only difference in non-academic outcomes for students who attend mid-tier schools is that they report that their school environments are safer (by .09 SDs). However, as with the mid-tier effect on high school gradua-tion, this positive effect is marginally significant and not robust to sensitivity analysis. Again, it should be noted that the propensity score models do not have pretreatment values for all of these outcomes, though we are able to control for prior attendance and suspensions, as well as student reports of academic rigor, time spent on home-work, parental support for learning, and safety during the middle grades (see Table 3).
Results for College Outcomes
A major focus for high schools is to prepare students for life after high school. Table 7 shows the estimated effects of attending higher perform-ing schools on college enrollment, selectivity, and persistence. All estimates are generated from samples unconditional of graduating from high school for readers to compare across panels of the table. There are generally positive effects on attending a higher performing high school for col-lege outcomes, though there is heterogeneity in those estimates. First, after the propensity score adjustments, selective high schools offer no apparent advantage in terms of enrolling in col-lege, persisting in college, or attending selective colleges (see Table 4 for a description of college selectivity categories). At the same time, students who attend top-tier nonselective high schools see many benefits in college outcomes relative to stu-dents at mid- or bottom-tier schools. These stu-dents are more likely to enroll in college (a 6-percentage-point increase) and more likely to persist in college for 2 years (a 5-percentage-point increase). Students who attend top-tier high schools are more likely to enroll in colleges with lower acceptance rates (called “highly selective” or “most selective”). The positive estimates for attending a top-tier school are driven by compari-sons of observably similar students who attend top-tier and bottom-tier schools. Attending mid-tier schools relative to bottom-tier schools also shows some benefits for college; there are gains

190
TABLE 6
Effect of Attending a Higher Performing School on Nonacademic Outcomes
Outcome
Unadjusted mean outcome for
comparison groupUnadjusted
mean difference
Weighted mean outcome for
comparison groupIPW-estimated
effect Sample size
Classroom behavior1. Selective 0.22 0.67*** (.053) 0.32 0.54*** (.059) 55,6962. Top tier (overall) 0.13 0.26*** (.030) 0.22 0.18*** (.033) 51,100
2a. Versus mid-tier only 0.26 0.14*** (.037) 2b. Versus bottom tier only 0.11 0.28*** (.045)
3. Mid-tier 0.05 0.10** (.040) 0.07 0.07 (.045) 27,657Safety1. Selective 0.63 0.64*** (.043) 0.83 0.34*** (.057) 55,6872. Top tier (overall) 0.54 0.26*** (.031) 0.65 0.16*** (.034) 51,120
2a. Versus mid-tier only 0.67 0.12*** (.039) 2b. Versus bottom tier only 0.57 0.24*** (.039)
3. Mid-tier 0.48 0.10*** (.036) 0.45 0.09** (.045) 27,667Teacher–student trust1. Selective 0.48 0.36*** (.033) 0.64 0.20*** (.045) 51,2402. Top tier (overall) 0.46 0.06** (.028) 0.49 0.01 (.030) 45,607
2a. Versus mid-tier only 0.52 −0.01 (.034) 2b. Versus bottom tier only 0.45 0.08** (.034)
3. Mid-tier 0.42 0.04 (.028) 0.42 0.03 (.032) 24,339Academic press1. Selective 0.68 0.38*** (.041) 0.89 0.15*** (.045) 52,5542. Top tier (overall) 0.65 0.10*** (.024) 0.66 0.06** (.027) 47,584
2a. Versus mid-tier only 0.67 0.04 (.029) 2b. Versus bottom tier only 0.65 0.11*** (.036)
3. Mid-tier 0.64 0.03 (.027) 0.60 0.03 (.047) 25,335Study habits1. Selective 0.23 0.33*** (.030) 0.51 0.05 (.046) 52,4162. Top tier (overall) 0.21 0.04** (.019) 0.22 0.05** (.024) 47,082
2a. Versus mid-tier only 0.22 0.04 (.027) 2b. Versus bottom tier only 0.20 0.06** (.031)
3. Mid-tier 0.23 −0.06** (.026) 0.20 −0.04 (.037) 25,091Percentage of school days in attendance1. Selective 0.87 0.11*** (.008) 0.93 0.02*** (.006) 79,3522. Top tier (overall) 0.83 0.10*** (.007) 0.88 0.05*** (.011) 75,469
2a. Versus Mid-tier only 0.88 0.03*** (.007) 2b. Versus bottom tier only 0.81 0.09*** (.027)
3. Mid-tier 0.81 0.06*** (.012) 0.85 0.01 (.011) 44,508Suspended in Grade 91. Selective 0.23 −0.21*** (.015) 0.08 −0.04*** (.013) 79,3522. Top tier (overall) 0.29 −0.15*** (.015) 0.17 −0.03** (.014) 75,469
2a. Versus mid-tier only 0.17 −0.02 (.017) 2b. Versus bottom tier only 0.22 −0.07*** (.017)
3. Mid-tier 0.36 −0.13*** (.023) 0.26 −0.03 (.023) 44,508
Note. Standard deviations are given in parentheses. Cohort fixed effects are included. Standard errors are clustered at the school-cohort level. To explore heterogeneity in the top-tier effects, the “versus mid-tier” and “versus bottom tier” are estimated in separate regressions, using the student’s propensity to attend a top-tier school for counterfactual students who attend mid-tier schools and then counterfactual students who attend bottom-tier schools. The treated students in both sets of regressions are always the students who attend top-tier schools. Survey outcomes are reported as standard deviation units; administrative data outcomes are reported in their natural units. IPW = inverse probability weight.Coefficients statistically significant at the *10%, **5%, and ***1% levels.

191
in college enrollment (a 4-percentage-point increase) and enrollment in a highly selective col-lege (a 2-percentage-point increase); however, there is not a statistically significant effect on per-sistence in college for 2 years.
One caveat to the findings on college enroll-ment is that they are less robust to sensitivity analyses than most of the other findings presented in this article described below. The sample size is
smaller, as some of the cohorts are not old enough to have enrolled or persisted in college. Some of their significance levels are not below .01; given the number of significance tests that were con-ducted, we should be somewhat cautious in our interpretation of these results. However, there is no evidence that going to a higher achieving school has a negative effect on college enrollment or selectivity, despite the negative effects that are
TABLE 7
Effect of Attending a Higher Performing School on College Outcomes
Outcome
Unadjusted mean outcome for
comparison groupUnadjusted
mean difference
Weighted mean outcome for
comparison groupIPW-estimated
effect Sample size
Enrolled in any college1. Selective 0.43 0.33*** (.023) 0.78 −0.01 (.024) 32,3492. Top tier (overall) 0.32 0.20*** (.017) 0.46 0.06*** (.02) 32,901
2a. Versus mid-tier only 0.49 0.02 (.022) 2b. Versus bottom tier only 0.40 0.04 (.025)
3. Mid-tier 0.27 0.10*** (.015) 0.33 0.04** (.018) 18,790Enrolled in 4-year college1. Selective 0.26 0.42*** (.031) 0.69 −0.001 (.036) 32,3492. Top tier (overall) 0.16 0.16*** (.019) 0.29 0.03 (.022) 32,901
2a. Versus mid-tier only 0.32 0.00 (.023) 2b. Versus bottom tier only 0.24 0.08 (.028)
3. Mid-tier 0.13 0.06*** (.010) 0.17 0.02 (.015) 18,790Enrolled in a highly selective college1. Selective 0.09 0.38*** (.043) 0.47 0.02 (.063) 32,2722. Top tier (overall) 0.04 0.10*** (.012) 0.09 0.04** (.013) 32,850
2a. Versus mid-tier only 0.11 0.02 (.015) 2b. Versus bottom tier only 0.07 0.06*** (.015)
3. Mid-tier 0.02 0.03*** (.006) 0.03 0.02** (.007) 18,766Enrolled in a most selective college1. Selective 0.004 0.07*** (.021) 0.04 0.03 (.022) 32,2722. Top tier (overall) 0.001 0.004*** (.001) 0.002 0.003* (.001) 32,850
2a. Versus mid-tier only 0.003 0.002 (.002) 2b. Versus bottom tier only 0.001 0.003*** (.001)
3. Mid-tier 0.001 0.001* (.001) 0.001 0.001 (.001) 18,766Persisted for 2 years in college1. Selective 0.21 0.38*** (.008) 0.60 −0.02 (.061) 13,7952. Top tier (overall) 0.09 0.14*** (.020) 0.18 0.05* (.024) 16,980
2a. Versus mid-tier only 0.21 0.02 (.026) 2b. Versus bottom tier only 0.14 0.09*** (.028)
3. Mid-tier 0.07 0.05*** (.011) 0.08 0.02 (.014) 9,617
Note. Standard deviations are given in parentheses. Results presented are not conditional on high school graduation, allowing for comparisons across the outcomes. Cohort fixed effects are included. Standard errors are clustered at the school-cohort level. To explore heterogeneity in the top-tier effects, the “versus mid-tier” and “versus bottom tier” are estimated in separate regressions, using the student’s propensity to attend a top-tier school for counterfactual students who attend mid-tier schools and then counterfactual students who attend bottom-tier schools. The treated students in both sets of regressions are always the students who attend top-tier schools. Two cohorts of data are used for college outcomes. IPW = inverse probability weight.Coefficients statistically significant at the *10%, **5%, and ***1% levels.

Allensworth et al.
192
observed on GPA. For many outcomes in this article, we are able to control for a lagged value of that outcome (e.g., controlling for prior achieve-ment when looking at test score effects). That is not the case for educational attainment outcomes, so there is a bigger assumption that we have taken into consideration all factors that relate to high school quality and college going.
Sensitivity Analyses
To check the robustness of the estimates, we ran the models restricting the counterfactual only to students who attended schools in the next lower tier (e.g., comparing students in selective high schools with students in top-tier high schools only), and the results were very similar. We also ran the outcome models for each individual cohort, instead of grouping all cohorts together, and the yearly results were similar to the ones with all cohorts together. In addition, we ran the outcome regressions includ-ing those covariates that showed a standardized bias greater than .10 and the results did not change; those covariates are provided in Appendix Table A3 (available in the online ver-sion of the journal).
In any study that uses nonexperimental esti-mation, selection on unobservables is a concern. We can examine the extent to which there would have to be unobserved endogeneity to change the findings (e.g., a negative effect is nullified; Frank, Maroulis, Duong, & Kelcey, 2013). This method quantifies the amount of sample replace-ment needed (by replacing observed cases with unobserved cases in which there was no treat-ment effect) to invalidate an inference due to selection bias. For example, for an average school climate effect—the .15 standard deviation increase in perceptions of academic press in selective schools—41% of the cases in which there was a positive effect would have to be replaced with cases in which there were zero effects to change that finding. For most of our findings, with the exception of those discussed below, the proportion of cases that would need to be replaced with cases of zero effect to invalidate the inference is similar to that of the two exam-ples reported here. The large amount of error required to negate our estimates is significantly
larger than many of the published causal claims that Frank et al. (2013) tested and suggests con-siderable robustness of most of the results.
There are a few estimates which are less robust to the potential influence of selection bias. Across Tables 5 to 7, there are 10 effects that are marked as significant, but whose significance level is greater than .01. Three of these signifi-cance tests are associated with the analyses on college selectivity, whereas a fourth comes from the effect of a mid-tier school on attending any college. For these outcomes, 16% or less of the effect would need to change to invalidate the findings. It is possible that college selectivity is affected by unobservables, such as one’s prefer-ence for prestige, in a way that is not captured by the propensity score. Students who select into prestigious top-tier and selective high schools may be more likely to pursue selective colleges than observationally similar students who are less concerned with institutional prestige, beyond what is accounted for by covariates such as the quality of their middle school and their neighbor-hood characteristics.
Two other effects that are particularly not robust to the potential influence of selection bias are the mid-tier school effects on high school graduation and safety. Only 2% of cases would need to change to outcomes to invalidate those significance tests. Thus, we are cautious about presenting benefits for attending mid-tier schools, and suggest the findings be replicated in other studies. In addition, a small percentage of the cases (6%–15%) would need to change to invalidate the effects of top-tier schools on stu-dents’ study habits, suspension rates, AP course-work, and reports of academic press. Because most of the top-tier school effects on nonaca-demic outcomes are very robust, potential uncer-tainty in these findings does not change the overall conclusions about the benefits of these schools for students’ nonacademic outcomes.
Discussion
Families are fighting to get their children into schools with strong reputations, or to find alternatives to the poor-performing schools in their neighborhood. Policymakers are encour-aging families to choose schools with higher

The Educational Benefits of Attending Higher Performing Schools
193
performance by closing low-achieving schools, providing vouchers, publicizing school perfor-mance levels, and opening selective schools. Without adjustments for selection, schools can look like they have a large effect on student out-comes, while these apparent successes should actually be attributed to the students themselves. As families weigh options about school, and as policymakers shape the choices available to families, they need to know the actual benefits.
Overall, we find mixed, but mostly positive, consequences for attending higher achieving schools, providing some support for policies that encourage families to consider school quality when choosing a high school. Our results show why past research has seemed inconsistent: The effects of attending higher performing schools depend on the outcome being studied and the type of comparison being made. Getting into a selective school is not the same as getting out of a bottom-tier school to go to a mid-tier school, or attending a strong nonselective school in terms of consequences for students’ experiences in high school, their achievement, or their educa-tional attainment.
Students want to gain admission to selec-tive schools, often because of a feeling that they will get an academic edge in more selec-tive environments. However, attending a highly selective school does not give students an academic edge, at least on academic out-comes: Test scores and coursework are no bet-ter, and students’ GPAs are actually somewhat lower if they attend a selective school than a nonselective one. Students at selective schools are no more likely to attend college, or to per-sist once there, than they would have been at a nonselective school. Instead, the major advan-tage of selective schools is that they provide a more desirable school environment. Students are more likely to feel positive about their high school experiences at selective schools. Note, however, that we cannot say what would happen to students at a selective school if they were to enroll in a poorly performing (mid-tier or bottom-tier) school; students who have access to selective schools do not tend to enroll in either mid- or bottom-tier schools, and so the comparison is to high-performing nonselective schools.
At the other end of the spectrum, there are also few academic benefits for “getting out” of bottom-tier high schools into mid-tier ones. Although there are many policies that aim to improve student achievement by getting students out of very low-performing schools, policymak-ers may not find substantial improvements in stu-dent test scores from such policies, especially if students who leave very poorly performing schools end up at schools that are only moder-ately higher achieving. There are modest bene-fits, however, in terms of high school graduation and college enrollment.
The most positive effects are observed with strong nonselective schools; students who attend these schools, rather than mid-tier or bottom-tier schools, do see benefits with a number of aca-demic and nonacademic dimensions, including test scores. They report a more positive high school environment, and they show benefits in terms of college enrollment, college selectivity, and college persistence. These schools are high achieving despite being nonselective: Perhaps they are high achieving precisely because stu-dents do perform better at these schools than they would at other schools.
Impacts on nonacademic outcomes and edu-cational attainment highlight the importance of examining outcomes other than just test scores. Educational attainment is critical for students’ life chances, including better employment out-comes, health outcomes, and life expectancy (Autor, Katz, & Kearney, 2008; Day & Newburger, 2002; Heckman, Lochner, & Todd, 2008; Juhn, Murphy, & Pierce, 1993; Muennig, 2005; Sum, Khatiwada, & McLaughlin, 2009). Policies that move students into higher perform-ing schools might fail at raising test scores, yet have positive consequences that are more impor-tant than test scores for students’ futures.
Limitations and Future Research
These results have been interpreted with the assumption that when modeling a student’s pro-pensity to attend a high school of a given perfor-mance level, we have accounted for any variables that are related to both the choice of school and future outcomes. This assumption is an impor-tant caveat, though we believe the results are
Allensworth et al.
194
plausibly causal given the rich longitudinal pre-treatment data we observe at the student level. The comparison and treatment groups are equiv-alent on a large array of pretreatment covariates, including their prior academic achievement. One major concern is that we do not sufficiently control for family background and that some parents are more engaged in school choice or have better tools to navigate the system than other parents. The propensity model accounts for characteristics (quality) of the student’s ele-mentary school and whether or not the student exercised choice prior to high school; these should account for a family’s investment in schooling quality. We further control for socio-economic background to taken into account family and neighborhood resources: We use cen-sus data at the census block-group level about employment and educational attainment, and we also use free/reduced-price lunch status. We consider the extent to which students report that their parents are invested in their education. These data are extensive, though it is possible that there are unobserved confounding variables. Further research is needed to confirm these find-ings using different methodologies.
We present average treatment effects, showing the overall effect of attending a higher performing high school, regardless of that student’s skills, backgrounds, and dissimilarity to other students in his or her school. The null effects observed for selective schools and bottom/mid-tier school comparisons could mask contradictory heteroge-neous effects for students with different counter-factuals. For example, we show evidence that attending a top-tier school is more important for students who would otherwise attend a bottom-tier school than students who would attend a mid-tier school. There are different counterfactuals for attending selective schools as well, but insuffi-cient numbers of students in the counterfactual conditions to make such comparisons. Furthermore, there may be different benefits based on variance in students’ skills within the same type of schools. The negative GPA effects suggest that there may be adverse consequences for students with weaker academic backgrounds, and these could be masked by examining average effects. Prior research shows that students who just make the cutoff into selective schools can feel
marginalized in schools with higher achieving peers, controlling for their own achievement (Marsh & Hau, 2003). The negative GPA effects may not translate into lower high school gradua-tion and college attainment rates for all students, but they may make a difference for students with weaker academics. These heterogeneities need to be explored further but are beyond the scope of this article.
In addition, although this article provides insight into how moving students into higher achieving schools affects their outcomes, it does not address the consequences of shifting stu-dents, and how students’ choices about which school to attend alter the composition of students in other schools. District leaders who are consid-ering closing low-performing schools or opening selective ones must be aware that changes in who enrolls in schools could also affect the overall achievement levels of other schools. For policy-makers considering opening selective schools or closing poor-performing ones, this article is a first step in understanding the potential conse-quences on student achievement from these types of policies.
Authors’ Note
The opinions expressed are those of the authors and do not represent views of the Institute or the U.S. Department of Education. Authors are listed in alpha-betical order.
Acknowledgments
We thank Chicago Public Schools (CPS) for contin-ued data access and support regarding the work. This article has benefited greatly from the feedback of researchers and the Steering Committee of the University of Chicago Consortium on School Research, as well as Lisa Barrow, Dan Black, Kerwin Charles, Ofer Malamud, participants at the Association for Education Finance and Policy, Illinois Education Research Council, and Chicago Education Research Presentations meetings. We thank Sanja Jagesic and Matt McCracken for their outstanding research assis-tance.
Declaration of Conflicting Interests
The author(s) declared no potential conflicts of inter-est with respect to the research, authorship, and/or publication of this article.
The Educational Benefits of Attending Higher Performing Schools
195
Funding
The author(s) disclosed receipt of the following finan-cial support for the research, authorship, and/or publi-cation of this article: The research reported here was supported by the Institute of Education Sciences, U.S. Department of Education, through Grant R305A120136.
Notes
1. Schools ranged from having 30% to 62% of stu-dents scoring at or above national norms, with half of the students scoring at or above national norms in only five of the 16 schools.
2. The overall sample of first-time ninth graders is slightly more African American than the analytic sample (47% compared with 44%), less Latino (40% compared with 44%), and more likely to have free/reduced-price lunch status (92% compared with 87%).
3. A possible concern for missing data is nonre-sponse on the University of Chicago Consortium on School Research survey, which provides measures of the culture and climate of the middle school. In addi-tion, grade data for students attending elementary charter schools are not available to us, even though we have all other covariates. Although most problems with missing data revolve around estimating the parameters in an equation, the goal of the propensity score model is to estimate propensity scores for each student, rather than precise parameter estimation of each covariate. When the parameter estimation is not the goal of the model, an acceptable strategy is to create an indicator of missingness for each covariate and include them in the model (D’Agostino & Rubin, 2000).
4. The sample within the region of common sup-port tends to comprise more than 96% of the observa-tions when studying attending a top- or mid-tier school in both treatment and control groups. The analysis of attending selective enrollment high schools drops around one third of the observations from the control group—dropping from 19,000 observations to 12,000 observations—and about 5% from the treatment group.
5. In total, we check the standardized bias of 1,023 variables across the 12 propensity models.
6. We show results comparing similar students who attend top-tier schools and bottom-tier schools, yet these high school choices are very different. Although we match on a robust set of pre-high school indica-tors, readers should consider there may be unobserved differences between these students and their families that could influence outcomes and their high school choices. The estimates presented in the article then could potentially be a combination of attending a much high-performing high school and any selection bias due to unobserved factors.
7. In fact, attending a selective school results in a rank that is 29 points lower compared with other peers in a student’s ninth-grade class than their counterfac-tual counterparts, based on eighth-grade test scores. There is evidence that students’ grades are lower when their incoming achievement is lower than their class-room peers, even if they are high-achieving students (Nomi & Allensworth, 2013).
8. Average gains on ACT’s Educational Planning and Assessment System (EPAS), which includes the EXPLORE, PLAN, and ACT exams, are 1.16 points per year (ACT, 2007).
9. Students who enroll in top-tier schools versus lower performing schools end up with lower incom-ing achievement rank relative to their class peers (by 14 percentage points), and lower relative rank can be associated with lower grades.
References
Abdulkadiroğlu, A., Angrist, J. D., Dynarski, S. M., Kane, T. J., & Pathak, P. A. (2011). Accountability and flexibility in public schools: Evidence from Boston’s charters and pilots. Quarterly Journal of Economics, 126, 699–748.
Abdulkadiroğlu, A., Angrist, J. D., & Pathak, P. A. (2014). The elite illusion: Achievement effects at Boston and New York exam schools. Econometrica, 82, 137–196.
ACT, Inc. (2007). The PLAN technical manual. Iowa City, IA: Author.
Autor, D. H., Katz, L. F., & Kearney, M. S. (2008). Trends in US wage inequality: Revising the revi-sionists. The Review of Economics and Statistics, 90, 300–323.
Barrow, L., Park, K., & Schanzenbach, D. W. (2011). Assessing the impacts on students of closing persis-tently failing schools. Unpublished paper.
Bifulco, R. (2012). Can non experimental estimates replicate estimates based on random assignment in evaluations of school choice? A within-study comparison. Journal of Policy Analysis and Management, 31, 729–751.
Bifulco, R., Cobb, C. D., & Bell, C. (2009). Can inter-district choice boost student achievement? The case of Connecticut’s interdistrict magnet school program. Educational Evaluation and Policy Analysis, 31, 323–345.
Black, D. A., & Smith, J. A. (2004). How robust is the evidence on the effects of college quality? Evidence from matching. Journal of Econometrics, 121, 99−124.
Brummet, Q. (2014). The effects of school closings on student achievement. Journal of Public Economics, 119, 108–124.
Allensworth et al.
196
Clark, D. (2010). Selective schools and academic achievement. B.E. Journal of Economic Analysis and Policy: Advances in Economic Analysis and Policy, 10(1), Article 9.
Cullen, J. B., Jacob, B. A., & Levitt, S. D. (2005). The impact of school choice on student outcomes: An analysis of the Chicago Public Schools. Journal of Public Economics, 89, 729–760.
D’Agostino, R., Jr., & Rubin, D. B. (2000). Estimating and using propensity scores with partially miss-ing data. Journal of the American Statistical Association, 95, 749–759.
Day, J., & Newburger, E. (2002). The big payoff: Educational attainment and synthetic estimates of work-life earnings (Current Population Report P23-210). Washington, DC: U.S. Census Bureau.
de la Torre, M., & Gwynne, J. (2009).When schools close: Effects on displaced students in Chicago Public Schools. Chicago, IL: University of Chicago Consortium on Chicago School Research.
Dobbie, W., & Fryer, R. (2014). The impact of attend-ing a school with high-achieving peers: Evidence from the New York City exam schools. American Economic Journal: Applied Economics, 6(3), 58–75.
Engberg, J., Gill, B., Zamarro, G., & Zimmer, R. (2012). Closing schools in a shrinking district: Do student outcomes depend on which schools are closed? Journal of Urban Economics, 71, 189–203.
Fortson, K., Gleason, P., Kopa, E., & Verbitsky-Savitz, N. (2015). Horseshoes, hand grenades, and treatment effects: Reassessing bias in nonex-perimental estimators. Economics of Education Review, 44, 100–113.
Frank, K. A., Maroulis, S. J., Duong, M. Q., & Kelcey, B. M. (2013). What would it take to change an inference? Using Rubin’s causal model to interpret the robustness of causal inferences. Educational Evaluation and Policy Analysis, 35, 437–460.
Gamoran, A. (1996). Student achievement in public magnet, public comprehensive, and private city high schools. Educational Evaluation and Policy Analysis, 18, 1–18.
Harder, V. S., Stuart, E. A., & Anthony, J. C. (2010). Propensity score techniques and the assessment of measured covariate balance to test causal asso-ciations in psychological research. Psychological Methods, 15, 234–249.
Hastings, J. S., & Weinstein, J. M. (2008). Information, school choice, and academic achievement: Evidence from two experiments. The Quarterly Journal of Economics, 123, 1373–1414.
Heckman, J. J., Lochner, L. J., & Todd, P. E. (2008). Earnings functions and rates of return (No.
w13780). Washington, DC: National Bureau of Economic Research.
Jackson, K. C. (2010). Do students benefit from attending better schools? Evidence form rule-based student assignment in Trinidad and Tobago. The Economic Journal, 120, 1399–1429.
Juhn, C., Murphy, K. M., & Pierce, B. (1993). Wage inequality and the rise in returns to skill. Journal of Political Economy, 101, 410–442.
LaLonde, R. J. (1986). Evaluating the econometric evaluations of training programs with experi-mental data. American Economic Review, 76, 604–620.
Levin, H. M. (2002). A comprehensive framework for evaluating educational vouchers. Educational Evaluation and Policy Analysis, 24, 159–174.
Marsh, H. W., & Hau, K. T. (2003). Big-fish-little-pond effect on academic self-concept: A cross-cultural (26-country) test of the negative effects of academically selective schools. American Psychologist, 58, 364–376.
McEwan, P. J. (2000). The potential impact of large-scale voucher programs. Review of Educational Research, 70, 103–149.
Muennig, F. (2005, October 24–25). Health returns to education interventions. Paper prepared for the Columbia Teachers College Social Costs of Inadequate Education Symposium, New York, NY.
Neild, R. C. (2004). The effects of magnet schools on neighborhood high schools: An examination of achievement among entering freshmen. Journal of Education for Students Placed at Risk, 9(1), 1–21.
Nomi, T., & Allensworth, E. A. (2013). Sorting and supporting: Why double-dose algebra led to bet-ter test scores but more course failures. American Educational Research Journal, 50, 756–788.
Pop-Eleches, C., & Urquiola, M. (2013). Going to a better school: Effects and behavioral responses. American Economic Review, 103, 1289–1324.
Rosenbaum, P. R., & Rubin, D. B. (1983). The central role of the propensity score in observational studies for casual effects. Biometrika, 70, 41–55.
Sum, A., Khatiwada, I., & McLaughlin, J. (2009). The consequences of dropping out of high school: Joblessness and jailing for high school dropouts and the high cost for taxpayers. Boston, MA: Center for Labor Market Studies.
Authors
ELAINE M. ALLENSWORTH is the Lewis-Sebring Director of the University of Chicago Consortium on Chicago School Research, where she conducts studies on students’ educational attainment, school leadership,

The Educational Benefits of Attending Higher Performing Schools
197
and school organization. She is one of the authors of the book Organizing Schools for Improvement: Lessons From Chicago, which documents the ways in which organizational structures in schools influence improve-ments in student achievement. She regularly serves on policy commissions, working groups, and review pan-els at the local, state, and national levels.
PAUL T. MOORE is a research analyst at the University of Chicago Consortium on School Research. His research interests include urban school reform, school choice policies and practices, and quasi-experimental design methodologies.
LAUREN SARTAIN is a senior research analyst at the University of Chicago Consortium on School
Research. Her research focuses on issues related to school choice, teacher and principal effectiveness, and urban school reform.
MARISA DE LA TORRE is a senior research associ-ate at the University of Chicago Consortium on School Research. Her research interests include school choice, urban school reform, and early warn-ing indicators.
Manuscript received September 8, 2015First revision received May 31, 2016
Second revision received August 24, 2016Third revision received September 6, 2016
Accepted September 8, 2016