the Economy wide Effects of Structural Reforms in and ... · Quantifying the Economy‐wide Effects...
44
Quantifying the Economy‐wide Effects of Structural Reforms in Transport, Energy and Telecommunications in APEC Economies Dr Philippa Dee Crawford School of Economics and Government Australian National University [email protected] May 2010 Paper prepared as a contribution to the project ‘The Impacts and Benefits of Structural Reforms in Transport, Energy and Telecommunications Sectors’, commissioned by the APEC Policy Support Unit. Published in APEC Policy Support Unit (2011), The Impacts and Benefits of Structural Reforms in the Transport, Energy and Telecommunications Sectors in APEC Economies, Singapore: APEC Secretariat.
Transcript of the Economy wide Effects of Structural Reforms in and ... · Quantifying the Economy‐wide Effects...
QuantifyingtheEconomy‐wideEffectsofStructuralReformsinTransport,EnergyandTelecommunicationsinAPECEconomies
Dr Philippa Dee
Crawford SchoolofEconomicsandGovernment
AustralianNationalUniversity
May2010
Paper prepared as a contribution to the project ‘The Impacts and Benefits of Structural Reforms in
Transport, Energy and Telecommunications Sectors’, commissioned by the APEC Policy Support Unit.
Published in APEC Policy Support Unit (2011), The Impacts and Benefits of Structural Reforms in the
Transport, Energy and Telecommunications Sectors in APEC Economies, Singapore: APEC Secretariat.
1
1 Introduction
Structural reform in transport, energy and telecommunications is not synonymous with
deregulation, but better regulation. Nor is privatisation the key. The critical aim of structural reform
is to encourage as much competition as is appropriate in these sectors, while configuring the
regulation targeted at other legitimate economic and social objectives so that it does least damage
to that competition, and therefore to economic efficiency. Competition can be a powerful method of
squeezing excess profits and driving producers to find lower cost ways of doing business. Ownership
matters primarily to the extent that it affects the incentives of producers to respond in these ways to
competitive pressures. And government‐owned enterprises can respond quite adequately to private
sector competition if they operate under the appropriate governance structures. As will be seen,
there can be significant gains from structural reforms in some of these sectors, even when they
continue to operate with current ownership structures.
The appropriate level of competition depends on the sector in question. Many of these activities
involve networks — networks of railway lines, of electricity transmission and distribution lines, of gas
transmission and distribution pipelines, and of telecommunications transmission and distribution
lines. At least some components of these networks have the characteristics of a ‘natural monopoly’,
meaning that it is less costly for their operation to be carried out by a single producer using a single
set of facilities, rather than having two or more operators with duplicate facilities.
The structural reforms in these sectors are typically aimed at introducing competition into those
parts of the production chain that are not natural monopolies. This requires the competitive
suppliers to have access to those parts of the network that are natural monopolies. Successful
reform also requires that the restructuring be done in such a way that the benefits of competition in
the competitive sectors outweigh the loss of any economies of scope that may have prevailed when
the monopoly and competitive activities were operated together under single ownership.
In maritime and air transport, the natural monopoly elements are more likely to be at the ports or
airports than in the transport operation per se. But maritime and aviation networks operate across
national boundaries. In both activities, a degree of regulatory cooperation may be required to
ensure safety and coordination along international routes. But such regulation should not unduly
impede competition. Nor should competition be unduly stifled in the interests of promoting or
protecting ‘national champions’.
This paper draws on studies in this report that have identified the types of regulatory structures that
unduly impede competition, and have quantified their first round impact on economic performance
in the sectors in question. The purpose of this paper is to go one step further — to quantify the
effects of reforming those regulatory structures, not just on the sectors in question, but also on
sectors that might use these services, on whole economies, and ultimately on the region as a whole.
The paper also aims to quantify the adjustment costs that these prospective reforms might
generate.
2
2 Thereformagenda
Air transport
International air services are governed by a system of bilateral air services agreements. While these
agreements cover a wide range of topics that would be deemed legitimate targets of regulation
(such as aviation security, incident investigation, immigration and control of travel documents), they
also include seven key features that have been identified by the WTO Secretariat (WTO 2006) as
restricting scheduled air passenger services.
Designation governs the right to designate one (single designation) or more than one (multiple
designation) airline from the home economy to operate the agreed services between the two
economies.
Withholding defines the ownership conditions required for the designated airline(s) of the
foreign economy to be allowed to operate the agreed services. The most restrictive conditions
require substantial ownership and effective control to be vested in the designating economy or
its nationals. The most liberal regime (principal place of business) removes the substantial
ownership requirement, but still requires the designated airline to be incorporated in the
designating economy, and to have its principal place of business there. This falls far short of the
relatively generous ‘rules of origin’ typically written into services trade agreements. These would
typically require only ‘substantial business’ in the designated economy, irrespective of
ownership.
Grant of rights that define the rights to provide air services between two economies. The
dimensions in which air services agreements are generally being liberalised is in the granting of
the fifth, sixth and seventh freedoms and cabotage. The fifth freedom is the freedom to carry
passengers between two economies by an airline of a third economy on a route with origin or
destination in its home economy. The sixth freedom is the freedom to carry passengers between
two economies by an airline of a third economy on a route that goes via its home economy.
(Note that sixth freedoms can also be constructed via a combination of the third and fourth
freedoms from different bilateral agreements, and so are rarely specified explicitly.) The seventh
freedom is the freedom to carry passengers between two economies by an airline of a third
economy on a route with no connection to its home economy. Cabotage is the freedom to carry
passengers within an economy by an airline of another economy on a route with origin or
destination in its home economy.
Capacity clause that identifies the regime to determine the capacity of an agreed service, where
capacity refers to the volume of traffic, frequency of service and/or aircraft type.
Tariff approval refers to the regime of fare setting. Under the most restrictive regime, the
aeronautical authorities of both economies have to approve a fare before it can be applied.
Under the most liberal regime, fares are not subject to the approval of either authority.
Statistics provides rules on exchange of statistics between economies or their airlines. If
exchange of statistics is (or can be) requested, it is a sign that the parties intend to monitor the
performance of each other’s airline and is thus viewed as a restrictive feature of an agreement.
Cooperative arrangements define the right for the designated airlines to enter into cooperative
marketing arrangements (such as code sharing and alliances). This right is considered as a liberal

3
feature because it provides a means to rationalise networks, in the absence of liberalisation of
the ownership clause.
These restrictive features of air services agreements have been shown to impose costs, by raising
international airfares and restricting international traffic. Gonenc and Nicoletti (2000) and Doove et
al. (2001) found a positive and significant effect of the restrictiveness of air services agreements on
passenger air fares. For example, Doove et al. (2001) estimated that the restrictive provisions of the
agreements in place at the time had inflated international airfares from Indonesia and the
Philippines by over 20 per cent, and from Malaysia, Singapore and Thailand by 16–18 per cent.
Piermartini and Rousová (2008) found that an increase in the degree of liberalisation from the 25th
to the 75th percentile would increase passenger traffic volumes between economies linked by a
direct air service by about 30 per cent. In particular, they found that the removal of restrictions on
the determination of prices and capacity, cabotage rights, and designation were found to be the
most traffic‐enhancing provisions.
The restrictive provisions of air services agreements also impose costs on air freight services. Most
air freight is carried in the belly of passenger aircraft, and is thus affected by exactly the same
provisions as passenger traffic. Freight‐only flights are generally also governed by the same
provisions as passenger flights, although in some instances they are granted more liberal traffic
rights. Grosso (2008) found a positive and statistically significant relationship between relaxing
restrictions and the value of merchandise trade. Achard (2009) found a significant correlation
between liberal air services agreements and the volume of air cargo.
In recognition of such costs, a growing number of economies are negotiating more liberal air services
agreements. The typical ‘open skies’ agreement grants third, fourth and fifth freedom rights, and
removes restrictions on designation, capacity, frequencies, code‐sharing and fares. Open skies
agreements typically do not grant cabotage rights, nor lift foreign ownership restrictions on
domestic airlines. Seventh freedom rights are sometimes included, but often restricted to cargo‐only
traffic.
Increasingly, economies have also liberalised their domestic aviation services, which they can do on
a unilateral basis. Such liberalisation has typically included allowing additional domestic and foreign
entry on domestic routes, particularly by low cost carriers, and freeing up restrictions on domestic
air fares. Sometimes, liberalisation has also included the full or partial privatisation of government‐
owned carriers.
The index of policy restrictions compiled by Zhang and Findlay (2010) covers some the key measures
affecting both domestic and international aviation. Table 1 shows the index and its components,
where an index value of 1 indicates full restrictiveness, a value of 0 denotes no restriction, and
intermediate values denote partial restrictions (see the original paper for details).1 The index covers
privatisation of national airlines, foreign equity participation in domestic airlines, the existence of
low cost carriers, the number of effective passenger airlines (indicating ease of entry), whether there
is multiple designation on international routes, whether there are more than two open skies
1 The analysis throughout this paper is restricted to those APEC members that have been included in the computable general equilibrium model, based on data available from the GTAP model database (Hertel 1997). The analysis therefore excludes Brunei and Papua New Guinea.
4
agreements, and whether seventh freedom cargo rights are granted to at least some foreign
carriers.
The table indicates that China, Viet Nam, Russia, the Philippines and Chinese Taipei currently have
the most restrictive regulatory regimes among APEC economies. The United States, Australia,
Singapore, Malaysia and Thailand have the least restrictive regimes.
Maritimetransport
McGuire, Schuele and Smith (2000) surveyed the maritime policy regimes in a number of APEC, Latin
American and European economies. They described the key restrictions affecting shipping services
as follows.
Right to fly the national flag. This requires ships to be registered or licensed to provide maritime
services on domestic and international routes. The conditions on registration may include
legitimate requirements such as meeting seaworthiness and safety requirements, but also
include restrictions such as having a commercial presence in the domestic economy, and the
ship being built and/or owned domestically.
Cabotage restrictions. These restrict shipping services on domestic and coastal routes to vessels
that meet certain conditions. Shipping services between domestic ports may be required to be
carried out by domestically owned, operated, built and/or crewed ships.
Conferences. These are private sector arrangements between shippers that are supposed to
facilitate the planning and coordination of shipping traffic, but typically also include anti‐
competitive provisions. Governments that have enacted general competition laws usually permit
the existence of conferences through exemptions from the price setting and collusion provisions
of their domestic competition legislation.
UN Convention on a Code of Conduct for Liner Conferences (UN Liner Code). This stipulates
that conference trade between two economies can allocate cargo according to the 40:40:20
rule, whereby 40 per cent of tonnage is reserved for the national flag lines of each economy and
20 per cent is allocated to liner ships from a third economy.
Cargo sharing. These are other types of arrangements that stipulate the allocation of cargo on
particular routes between parties to bilateral and multilateral agreements.
Bilateral agreements. These are agreements between two economies that primarily restrict the
supply of shipping services and the allocation of cargo. Some bilateral agreements also restrict
the use of port facilities.
Many developing economies do not have general competition law or any legislative framework for
regulating the behaviour of shipping conferences. However, in recent times conferences have been
subjected to increasing competition. They no longer dominate shipping routes, and are no longer
regarded as the impediments to maritime performance that they once were. PDP Australia and
Meyrick and Associates (2005) note that within ASEAN, cargo reservation measures have been very
significantly reduced and in many cases completely abandoned. Similarly, a growing number of
economies have ‘open’ ship registries, which means that local ship registration is no longer tightly
tied to local ownership of the shipping company. This leaves cabotage restrictions, along with
inadequate and aging infrastructure, as the main impediments to economic performance in shipping
services in many economies.
5
These regulatory restrictions on shipping services have been shown to be costly, particularly to
developing economies. Kang (2000) found that the maritime restrictions imposed by goods
exporting economies appear to have a much greater impact on bilateral shipping margins (as
measured by cif/fob ratios) than those imposed by importing economies. He also found that in
exporting economies, lowering restrictions such as cabotage and port services restrictions had a
greater effect on margins than reducing restrictions on the commercial presence of foreign
suppliers. In several applications of these findings, the sum total of restrictions on shipping and port
services was found to have inflated shipping costs by around 30 per cent in Morocco (Dee 2006) and
by around 26 per cent in Indonesia (Dee 2008).
The index of regulatory openness compiled by Bertho (2010) covers some the key measures
affecting maritime transportation. Table 2 shows the index and its components, where an index
value of 1 indicates full openness, a value of 0 denotes full restrictiveness, and intermediate values
denote partial restrictions (see the original paper for details). The index covers cabotage restrictions,
cargo handling restrictions, quotas for private or government cargo, the availability of exemptions
for carrier agreements from competition law, and the existence of an independent regulatory
authority. It also covers measures that fall squarely into the category of barriers to services trade —
foreign equity limits, limits on the legal form of establishment (branches, subsidiaries) of foreign
greenfield operations, whether foreign operators can take a controlling stake in existing private or
public entities, and whether there are nationality requirements on the employees or boards of
directors of foreign companies.
The table confirms that cabotage restrictions are the predominant restrictions on maritime services
among APEC economies. Hong Kong is the most liberal, followed by Chile, New Zealand and
Australia. The least liberal APEC member is Viet Nam. It does not have a deep sea port, so most
goods are transported to Singapore and Hong Kong before going on to final destinations. Foreign
firms usually provide cross‐border services via a Vietnamese (wholly domestic) agency, which does
everything on behalf of foreign suppliers in Viet Nam and earns a commission from the foreign
partners (Dee 2010a).
Railtransport
Rail can be a very efficient means of transporting cargoes, especially bulky ones, once they are
loaded onto the trains, but the loading and unloading is costly. By contrast, road freight transport
may be less efficient in moving large cargos, but can operate door‐to‐door, often avoiding a cycle of
loading and unloading. Similar tradeoffs apply in the economics of rail passenger transport.
Furthermore, rail operating costs make it more economic than road for moving freight over longer
distances, while over short distances road transport dominates. For these reasons, rail transport
often plays a surprisingly minor role in national transport networks. For example, in Indonesia rail
transport accounts for only 7 percent of passenger transport and less than 1 per cent of freight
transport (Dee 2008).
In rail services, the natural monopoly elements are the track bed, while rolling stock (ie rail carriages)
can be leased or bought by competitors and operated on the incumbent’s rail tracks (subject to an
adequate access regime, timetabling and safety standards). Horizontal separation is the term given
to competition in the market (eg via the free entry of freight operators) or for the market (eg via
tendering or franchising arrangements for passenger services). However, to promote effective
6
competition, it may be necessary to require the track operator to become a separate corporate
entity, without any interest in passenger or freight operations (vertical separation). Without such an
interest, the track operator will have an incentive to maximise its revenue by maximising traffic.
With such an interest, it may have an incentive to restrict the access of competitors to promote the
profitability of its own passenger or freight operations.
Cantos, Pastor and Serrano (2010a) examined the effects of horizontal and vertical separation in
European railways. They found that the reforms had been beneficial in terms of efficiency (allowing
laggards to catch up to leaders) and productivity (also incorporating the benefits of technical change
through innovation). Key drivers of both types of benefits were vertical separation and the free entry
of new freight operators. No significant effects on either efficiency or productivity were found for
the introduction of tendering systems in passenger traffic.
The index of policy openness compiled by Cantos, Pastor and Serrano (2010b) covers some of these
elements of rail regimes in APEC economies. Table 3 shows their index components (some values
available when this study was undertaken are provisional), where an index value of 1 indicates
openness, and a value of 0 denotes restrictiveness. The index covers vertical separation, free entry in
freight operations and franchising in passenger services.
The table indicates that Australia, Chile, Mexico, Peru and Russia have regimes that are most
conducive to competition in rail services. The most restrictive regulatory regimes are in many of the
East Asian members of APEC.
Electricity
The production of electricity involves generation, transport over high voltage lines (transmission),
transportation over low voltage lines (distribution) and marketing to consumers (supply). Transport
operations are considered to be natural monopolies, and typically remain regulated, even after
structural reform. But generation is seen as a competitive activity, and is generally the first activity
to be opened to competition, followed by wholesale trading and retail supply. However, retail prices
may remain regulated in some economies, even after structural reform.
Doove et al (2001) describe the broad outlines of the structural reform agenda in electricity as
follows:
structurally separating (unbundling) the competitive activities (particularly generation, but
sometimes also retailing) from the natural monopoly elements (particularly transmission, but
occasionally sometimes also distribution);
dividing existing generation capacity among a number of different generation companies, who
then compete with each other (horizontal separation);
allowing new generators to enter the market;
guaranteeing open and non‐discriminatory access for all generators to the transmission grid
(subject to available capacity), so that they can sell directly to downstream suppliers or users,
rather than selling to the incumbent (third party access);
establishing a wholesale price pool, or spot wholesale market for electricity (either mandatory or
optional), so that new entrants are not obliged to enter both the generation and retailing sector
at the same time, thus lowering entry costs;
7
regulating the natural monopoly activities to prevent any abuse of market power;
introducing a regulator independent of industry players and day‐to‐day influence, and typically
separate from the system operator;
enabling large customers (retailers and sometimes large industrial users) to buy electricity
directly from the generator of their choice;
introducing competition into metering and billing activities and contract terms, thus allowing
retail customers freedom to choose among different electricity suppliers;
providing a full range of tradable financial instruments (eg futures contracts and options);
undertaking partial or complete privatisation or corporatisation of publicly‐owned assets;
introducing cross‐ownership restrictions, especially between competitive and natural monopoly
activities;
liberalising restrictions on foreign investment and ownership;
mandating service quality standards; and
allowing retailers to introduce innovative services (eg the ability to switch retailers over the
internet, or providing electricity jointly with other services such as telephony and gas).
One of the first empirical assessments of the effects of electricity reform was Steiner’s (2000) study
of OECD members over the period 1986‐96. She found that unbundling of generation, third party
access and the introduction of wholesale electricity markets were all associated with lower
electricity prices. However, she found that private ownership was not necessarily associated with
increased competition. Nevertheless, both private ownership and unbundling of generation and
transmission were found to be associated with a higher rate of utilisation of existing generation
capacity, and with reserve plant margins that were closer to optimal.
Two other recent studies have been less definitive. Hattori and Tsutsui (2004) undertook a similar
study of OECD members over a slightly later period of 1987–99, although their measurement of
variables (particularly prices) was different. They found that giving customers access to alternative
suppliers (which they argue is highly correlated with third party access) was associated with lower
prices. However, unlike Steiner, they did not find a significant effect of unbundling or the
introduction of a wholesale spot market on prices. Nagayama (2007) undertook a broadly similar
study of 83 economies over the period 1985–2002. He found that neither unbundling nor the
introduction of a wholesale pool market on their own would necessarily reduce electricity prices. In
fact, contrary to expectations, there was a tendency for the price to rise. However, coexistent with
an independent regulatory, unbundling could work to reduce prices. He also found that privatisation,
the introduction of foreign independent producers and retail competition could lower electricity
prices in some regions, but not all.
To some extent, the mixed results are a sign that reforms may not have been taken far enough in
some economies. Either reforms have not been taken far enough to have any real effects, or there
are not enough reforms in the chosen samples for econometric techniques to discern any significant
effects. Dee (2010b) found more evidence of significant benefits from structural reforms among
OECD members over a period of more active reform, associated with the EU’s Second Electricity
Directive.
The index of policy openness compiled by Dee (2010b) covers some these key dimensions of
electricity regimes in APEC economies. Table 4 shows the index components, where an index value

8
of 1 indicates openness and a value of 0 denotes restrictiveness. The index covers unbundling, third
party access and the existence of a deregulated wholesale electricity market.
APEC economies with regimes that are most conducive to competition in electricity generation are
Australia, Chile, the Republic of Korea, New Zealand, Russia and Singapore. The most restrictive
regulatory regimes are in Indonesia, Hong Kong, Malaysia, Mexico, Chinese Taipei and Viet Nam.
Gas
Natural gas is found in underground reserves, often in combination with oil and condensate
products. Exploration and production is generally done by oil companies, and there are few
synergies between this and other activities in gas markets. In economies without indigenous
production, however, the primary supply activity is undertaken by importers, who may also be
involved in downstream activities.
In many economies, gas importation, transmission and storage was traditionally undertaken by a
single monopolist (or several companies with regional monopolies). Sometimes the monopoly
importer also sold to end users, or else these sales were handled by downstream monopolies.
Like electricity, structural reform of gas markets involves allowing new entrants into the potentially
competitive segments of the market, without requiring them to be vertically integrated. This can
involve new companies producing gas or importing it from external sources, in competition with the
incumbent(s). It can involve new shipper/suppliers buying gas on wholesale markets, arranging for
its transportation with the network company, and signing retail contracts with end‐users. It can also
involve pure traders buying and selling on wholesale markets to take advantage of arbitrage
opportunities (European Commission 2007).
These new activities rely on the development of functioning wholesale markets, and on third party
access to transmission and distribution networks. To reduce the possibility of incumbents using their
control over pipeline or terminal facilities to thwart competition, both transmission and distribution
can be unbundled into separate transmission system operators and distribution system operators.
When such operators are sufficiently independent from incumbents, they have an incentive to
maximise, rather than restrict, the amount of gas sold through their networks, thus facilitating
competition.
Thus the broad features of structural reform in gas markets are similar to those in electricity
markets, though the scope for competition in primary production/importing is somewhat more
limited than in electricity generation.
There are relatively few studies of the effects of structural reform in gas markets. Jamasb, Pollitt and
Triebs (2008) studied the effects of US regulatory reform on productivity, and found that
encouraging competition has been rather successful in raising productivity. Hawdon (2003) found
evidence that the types of reforms introduced in the UK are associated with higher levels of
efficiency, good utilisation of labour and levels of underutilisation of capital sufficient to support the
development of competitive markets. Nevertheless, Brakman, van Marrewijk and van Witteloostuijn
(2009) warn that lack of competition and capacity constraints in gas production/import can prevent
these gains being passed on to consumers.
9
The index of policy openness compiled by Dee (2010b) covers some of these key dimensions of gas
regimes in APEC economies. Table 5 shows the index components, where an index value of 1
indicates openness and a value of 0 denotes restrictiveness. The index covers unbundling of
production/import, unbundling of supply, third party access, the absence of entry restrictions and
the presence of retail competition.
APEC economies with regimes that are most conducive to competition in gas markets are Australia,
Canada, New Zealand and the United States. The most restrictive regulatory regimes are in Hong
Kong, the Republic of Korea, Malaysia, Russia, Chinese Taipei and Viet Nam.
Telecommunications
As reflected in the WTO Reference Paper on telecommunications, the reforms of the 1990s
recognised that efficiency gains could be had by introducing competition into those components of
the telecommunications network that were not natural monopolies. However, competitors would
need access to the monopoly elements (typically the ‘last mile’) in order to provide a full retail
service. According to the Reference Paper, access regimes should provide competitors with access to
essential facilities at access charges that were cost‐based and non‐discriminatory. The appropriate
regulation of access charges is a complex issue, although sometimes made more complex than
necessary when access charges (as a single policy instrument) are used to pursue multiple objectives
(eg Dee and Findlay 2008).
A related requirement for promoting contestability was to ensure the general interconnectivity of
the facilities of various competitors, whether or not they constituted essential facilities. This was
required so the subscribers of one provider could make calls to subscribers of all other providers,
irrespective of the ownership of the various network components involved. Various regulatory
principles were also developed to ensure that interconnection charges were not used by the
incumbent to preserve network dominance (eg Economides, Lopomo and Woroch 1996, ITU 2000).
A further component of these reforms was ensuring number portability, so that retail subscribers
could take their original phone number with them if they switched providers. This was necessary to
reduce the cost of ‘shopping around’, and thus to increase the competitive pressures on providers.
A key supporting component of these pro‐competitive reforms was to revise the ways in which
universal service obligations were met. To that point, they had often been met by cross‐subsidies
built into the retail prices of telecommunications services. These provided competitors with a
chance to cherry‐pick the lucrative, long‐distance parts of the market, and left incumbents with
fewer options to cover their fixed costs. Their response was often to inflate the wholesale access
prices charged to competitors for access to the essential facility. Of course, this worked to defeat the
introduction of competition. A key reform component of the 1990s was therefore to ‘rebalance’
retail prices to remove the cross‐subsidies and ensure that fixed costs were covered, and to find
other ways to fund universal service obligations — typically either directly from the government
budget, or through an industry levy imposed on all service providers.
Since then, a number of technological advances have in some ways radically transformed the
industry. The first key development has been the phenomenal growth of mobile telephony. This
technology has few natural monopoly elements, so it has allowed extensive entry by new providers.
10
To the extent that mobile services provide a close substitute to fixed line services, competition from
this source can discipline the behaviour of fixed line service providers and reduce the need for
regulatory intervention or oversight. The two services are close substitutes for individuals and
perhaps even households. But businesses of any size typically also need fixed line connections to
meet the sheer volume of their voice and data needs. Most governments have therefore retained
the kind of regulatory structures described in the WTO Reference Paper.
A second key development has been the growth of internet, particularly broadband, services. These
services, which combine developments in the size and nature of the ‘pipe’ with developments in
switching and signal transmission technology, have made it technologically meaningless to
distinguish voice from data traffic. This is the essence of ‘convergence’. So now there is an
imperative for regulatory structures to acknowledge this convergence. The key way in which this is
happening is in the move from ‘individual’ to ‘general’ or ‘class’ licensing, not just for carrier
licences, but also for licences to access the spectrum required for mobile and fixed wireless
technologies. Typically, individual licences were not only attached to a particular technology, they
were also attached to a particular service. General licenses are less tied to particular services, and
will often allow both voice and data transmission, although most governments are not yet ready to
include broadcasting services in the bundle.
The proliferation of delivery technologies for broadband services (eg ADSL, fibre optic, fixed
wireless) has also provided an imperative for regulatory structures to be ‘technology‐neutral’. This is
also facilitated by the move from ‘individual’ to ‘general’ or ‘class’ licensing, since general licenses
are typically no longer tied to a particular technology.
But there are limits on the extent to which regulatory structures can be completely technology‐
neutral. This is because a key rationale for regulatory intervention remains dealing with ‘natural
monopoly’ components of the network, and the nature and extent of the natural monopoly problem
depends on the particular technology in question. Thus given the rapid development and
proliferation of technologies, there may be no ‘one‐size‐fits‐all’ best approach to regulation. The
most recent ITU survey of trends in reform (ITU 2008) stresses the importance of ensuring
interconnectivity across all technologies and all providers, to maximise the use that will be made of
any particular facility. The report is subtitled ‘Six Degrees of Sharing’, and notes (p. 1):
‘In a way, many regulatory practices can be viewed as sharing. What is new and innovative is
their application to meet the needs of developing economies. What is the same is that they use
time‐tested, pro‐competitive tools, such as the regulation of essential or bottleneck facilities,
transparency, and the promotion of collocation and interconnection’.
Nevertheless, there is considerable current uncertainty about which technologies may become
dominant in the future, and as noted, the scope of such regulation depends on the technology.
Economies may not necessarily be sure to ‘pick the best winner’, but they can at least ensure that
their regulatory regimes are internally consistent. For example, economies making a serious
commitment to fibre optic technologies could need to put more regulatory effort into access
regimes that economies relying more on mobile and fixed wireless technologies.
As well as technological developments, services trade reform has also been an important vehicle for
promoting the contestability of markets. The potential benefits have been shown to be significant.
11
Mattoo, Rathindran and Subramanian (2001) estimated that economies with fully open
telecommunications and financial sectors grow up to 1.5 percentage points faster than other
economies. The analysis of Warren (2000) suggested that in the ASEAN 5, the regulatory restrictions
then affecting domestic new entrants would have raised the prices of their services by an average of
over 10 per cent, while the additional discrimination (including foreign equity limits) against foreign‐
invested suppliers would have raised the cost of their services by more than 80 per cent.
The overall coherence of regulatory regimes can ultimately be judged according to whether they
have engendered a competitive market structure. An index of policy openness has been compiled
for this paper, using information from Lee (2010) and ITU sources. It focuses mainly on market
structure, and is based on that used by Warren (2000). Tables 6 and 7 shows the index components,
where a higher value denotes more openness and a lower value denotes less. The tables give the
number of competitors in fixed and mobile markets (where more than three competitors also
receive a score of three). It also records the state of competition in the mobile market and various
segments of the fixed line market. Finally, it records the portion of the fixed and mobile incumbent
operator that is privatised (where any type of partial privatisation receives a score of 0.5), and the
portion of foreign ownership that is allowed in competitive carriers in fixed and mobile markets.
The results confirm that fixed and mobile markets in most APEC economies are by now fully
competitive. Despite this, there are residual restrictions on foreign ownership in a majority of APEC
economies. These are hard to rationalise, given the extent of competition that already exists.
3 Quantifyingthefirstroundeffectsofreform
The policy indexes are arbitrary, but are not important by themselves. Instead, they provide inputs
into econometric exercises that quantify the first‐round effects of policy restrictions on measures of
economic performance in the sectors in question, while controlling for all the other factors that
affect economic performance in those sectors. This methodology has been developed in the context
of measuring and evaluating barriers to services trade (eg Findlay and Warren 2000), and can also be
used to evaluate the effects of structural reforms. The performance measures used in the
econometric exercises are often prices or price‐cost margins, but sometimes quantities or costs.
The econometric estimates of the effects of policy indexes on these measures of performance can
be used to construct the counterfactual — what economic performance would be in the absence of
the regulatory restrictions, holding all other factors constant. This counterfactual comparison gives
the first‐round effects of structural reform. It can be seen as a ‘tax equivalent’, if the restrictions
have raised price‐cost margins, or a ‘productivity equivalent’, if the restrictions have raised real
resource costs. Ideally, the econometric exercises should include a rich enough menu of
performance measures to be able to determine which of these applies (Dee 2005).
Air andmaritimetransport
In this paper, the first‐round effects of structural reforms in air and maritime transport have been
derived from the econometric study by Sourdin (2010). She estimated the effects of policy
restrictions in these sectors using the policy indexes presented in the previous section. Her measure
of economic performance was the ad valorem transport costs incurred in shipping goods
internationally using air or sea transport. She made use of data from four economies — Australia,
12
Brazil, Chile and the United States — that compile detailed (6‐digit), consistent data on import values
on both a fob (free on board) and cif (cost, insurance, freight) basis. Her measure of ad valorem
transport costs was the percentage difference between cif and fob valuations, calculated separately
(by commodity and source economy) for imports transported by air and by sea. Her controls in the
estimation were the value of total imports between the economy pairs, the distance between them,
the value‐to‐weight ratio of the particular import shipment and a product‐specific fixed effect. Her
estimated semi‐elasticity of air transport costs with respect to the air transport restrictiveness index
was 0.055. Her estimated semi‐elasticity of maritime transport costs with respect to the maritime
transport openness index was ‐0.487.
Given further structural reforms in air and maritime transport in each APEC economy, it is assumed
that the air restrictiveness indexes would all reach a value of zero, and the maritime openness
indexes would all reach a value of unity. In air transport, this implies a range of reforms to air
services agreements, to entry conditions for domestic and foreign carriers, and to ownership. In
maritime transport, it implies the dismantling of any remaining entry restrictions, quotas or cargo
sharing arrangements, and the granting of national treatment to foreign‐owned carriers located
domestically. The above semi‐elasticities can be used to calculate the resulting percentage changes
in air and maritime transport costs for each APEC economy.
One key question for modelling purposes is whether to interpret these prospective cost changes as
coming about because the price‐cost margins of transport operators would be squeezed, or because
the real resource cost of shipping goods by air or sea would fall. Should the first‐round effects be
interpreted as ‘tax equivalents’ or ‘productivity equivalents’? As will be seen, this difference in
treatment can have a marked effect on the projected economy‐wide effects of structural reform. By
itself, however, Sourdin’s (2010) econometrics does not resolve the issue.
The issue is decided on a priori grounds. Price‐cost markups are only likely to be inflated for
significant periods of time if regulatory restrictions prevent entry — otherwise the excess profits are
likely to be eroded by the entry of new service providers. On the other hand, many kinds of
regulatory restrictions are likely to raise real resource costs, particularly regulations that lead to
shipping delays or prevent transport operators from configuring their transport routes to achieve
network economies. In air transport, restrictive designation provisions can limit the entry of any new
carriers on international routes, but other provisions, such as restrictive traffic rights, can prevent
the achievement of network economies. In maritime, cabotage restrictions limit foreign but not
domestic entry on domestic routes. Quotas and cargo handling restrictions can lead to shipping
delays that add significantly to shipping costs.
Overall, it is judged that the regulatory restrictions in air and maritime are likely to have raised
transport costs, rather than inflated the price‐cost margins of international transport operators. So
the first round effects of structural reform are interpreted as productivity improvements. They are
shown for each APEC economy in Figures 1 and 2. Nevertheless, this assumption is subjected to
sensitivity testing in the next section, by assessing the economy‐wide effects of an alternative
treatment, whereby half the first‐round impact is assumed to fall on price‐cost margins.
A second key question for modelling purposes is whether the first round impacts would fall only on
the cost of shipping goods internationally, or whether they would also affect the costs of domestic
maritime and air services. Sourdin (2010) only measured the first effect. Nevertheless, the policy
13
indexes for both air and maritime include regulatory restrictions that would also be expected to
affect domestic services. Accordingly, in the modelling of the next section, the first‐round
productivity effects are assumed to fall on international air and sea transport margins, as well as on
the domestic production of air and maritime transport services. Further, the effects are assumed to
fall equally on domestically‐owned and foreign‐owned service providers, even though a few
components of the indexes would be expected to affect foreign‐owned carriers more than domestic
ones.
Railtransport
The first‐round effects of structural reforms in rail transport have been derived from the
econometric study by Cantos, Pastor and Serrano (2010a). They estimated the effects of horizontal
and vertical separation on the efficiency and productivity of rail operations, using data on 16
European railway systems from 1985 to 2005. In measuring efficiency and productivity, they used a
production structure that recognized two outputs (passenger and freight transport) and four inputs
(employees, passenger train supply, freight train supply, and railway infrastructure). In examining
the determinants of efficiency and productivity, they controlled for the share of passengers in the
total transport task, measures of the size and density of the network, measures of passenger and
freight occupancy, and individual and time fixed effects.
Their measured impacts of structural reforms on efficiency indicate how structural reforms can
encourage railway operators to move towards the production frontier, from a point inside it
(typically by making better use of existing infrastructure facilities). The measured impacts on
productivity also show how structural reforms can encourage technical progress in rail operations,
moving the production frontier outwards (typically by encouraging better infrastructure facilities). In
the context of rail operations in contiguous European economies, one of the ways in which technical
progress could be achieved is via investments that lead to more seamless international rail services.
This option is less easily available to APEC economies, which are spread around the Pacific Rim. In
recognition of this, the current paper only makes use of the estimates of the effects of structural
reforms on efficiency. Cantos, Pastor and Serrano (2010a) estimate the semi‐elasticity of efficiency
with respect to vertical separation as 0.025, and the semi‐elasticity of efficiency with respect to free
entry in freight operations as 0.083. Thus free entry has a greater effect on efficiency than vertical
separation (the relative impacts on productivity are the reverse).
Given further structural reforms in rail transport in each APEC economy, it is assumed that the rail
openness indexes would all reach a value of unity. This implies vertical separation and free entry in
freight operations in those economies that do not yet have them. It does not necessarily imply any
change in ownership.
The above semi‐elasticities can be used to calculate the resulting percentage changes in
‘productivity’ (a term now used more broadly than by Cantos, Pastor and Serrano 2010a) in rail
operations for each APEC economy. These are shown in Figure 3.
Electricityandgas
The first‐round effects of structural reforms in electricity and gas have been derived from the
econometric study by Dee (2010). She estimated the effects of policy restrictions in these sectors
14
using the policy indexes presented in the previous section. Her measures of economic performance
were electricity and gas prices to industrial users in OECD economies over the period 1990 to 2008.
Her controls for electricity prices were per capita GDP, the rate of urbanisation, the shares of hydro
and nuclear in total generation, and a linear time trend. Her controls for gas prices were per capita
GDP, the rate of urbanisation, pipeline length, and a nonlinear time trend (to capture the upward
movement of gas input costs). Looking only at the policy coefficients that were significantly different
from zero, the coefficients measuring the impact on electricity prices (measured in US$ PPP/kWh) of
third party access, a wholesale price pool, and unbundling were ‐0.0032, ‐0.0049 and ‐0.0075,
respectively. The coefficients measuring the impact on gas prices (measured in US$ PPP/10e+7 kcal)
of retail competition and the unbundling of production/import were ‐30.446 and ‐47.5065,
respectively.
Given further structural reforms in electricity and gas in each APEC economy, it is assumed that the
electricity and gas openness indexes would all reach a value of unity. This implies third party access,
unbundling, wholesale markets and/or retail competition in economies that have not yet
implemented these. It does not imply any change in ownership.
The above coefficients can be used to calculate the resulting percentage changes in electricity and
gas prices. It remains to decide whether these price changes would come about through changes in
price‐cost margins or though changes in productivity, because the econometrics does not resolve
the issue. Consistent with the presumption of Steiner (2000), and with anecdotal evidence in
economies such as Australia that have undergone significant reform, it is assumed that structural
reforms would manifest primarily as productivity improvements. The estimated improvements are
shown in Figures 4 and 5. This assumption is tested later via sensitivity analysis.
Telecommunications
The first‐round effects of structural reforms in telecommunications have been derived from an
updated version of the econometric study by Warren (2000) (see Dee 2005). The main contribution
of the updated study was to use a database with a slightly expanded coverage of economies, and to
enter the subcomponents of the policy indexes separately into the econometric estimation. The
database covered many more economies than just APEC members. The performance measures were
the number of mainlines per 100 inhabitants and the number of cellular phones per 100 inhabitants.
The controls in the fixed line estimation were GDP per capita, household density, the percentage of
mainlines connected to digital exchange, and waiting lists as a percentage of mainlines. The controls
in the mobile estimation were GDP per capita and population density. In both cases, the relationship
with per capita GDP was assumed to be cubic, to allow for ‘saturation’ levels of penetration. The
policy variables were combinations of the indexes shown in Tables 6 and 7. Separate weighted
average indexes of market access and national treatment for fixed and mobile telephony were
calculated as in Warren (2000), where these indexes ranged between zero and one. The coefficients
of fixed mainline penetration with respect to market access and national treatment were 2.892 and
3.529, respectively. The coefficients of mobile penetration with respect to market access and
national treatment were 1.898 and 1.075, respectively.
Given further structural reforms in telecommunications in each APEC economy, it is assumed that
the telecommunications indexes of market access and national treatment would all reach a value of
unity. These reforms would predominantly involve the removal of remaining foreign equity limits.
15
The above coefficients can be used to calculate the resulting small percentage changes in fixed and
mobile penetration. With the same price elasticity of ‐1.2 as assumed by Warren (2000), the quantity
effects can be converted to equivalent changes in price. It remains to decide whether these price
changes would come about through changes in price‐cost margins or though changes in productivity.
In previous exercises, when strict licensing requirements limited entry, it was reasonable to assume
that reforms would squeeze price‐cost margins (as in Dee and Hanslow 2001, for example). By now,
most such entry requirements have been relaxed. Accordingly, the remaining small price reductions
are assumed to accrue through changes in productivity, though once again this assumption is tested
via sensitivity analysis. But as in previous exercises, the impact is assumed to be greater on foreign‐
invested than on domestic operators, because a greater portion of the limitations on market access
and national treatment apply to them. The estimated improvements for foreign‐invested operators
are shown in Figure 6. The values for domestic operators are not shown, but are smaller.
Summary
In order to get an overall picture of the prospective reform task, Figure 7 presents an output‐
weighted average of the productivity improvements across all sectors in each APEC economy. The
weighted average productivity improvements fall roughly in the range of 2 to 14 per cent. The most
extensive reform effort, and largest resulting productivity gains (ie above 10 per cent), are projected
to occur in Indonesia, Malaysia, Mexico, the Philippines, Chinese Taipei, Thailand and Viet Nam.
To put these projected first‐round impacts of structural reform in perspective, Figures 8 and 9 show
the simple average tariff rates on agriculture and food, and on manufacturing, in each APEC
economy. These would be the targets of further at‐the‐border trade reforms. (Trade reform in
agriculture and food would also target explicit subsidies on output and exports, and implicit
subsidies on inputs, though these measures are not shown here.) The tariff estimates are derived
from version 7 of the GTAP model database (Hertel 1997).2 The average tariffs on manufacturing are
the same order of magnitude as the prospective productivity improvements from structural reforms
— up to 13 per cent. The average tariffs on agriculture and food in some economies are far higher —
up to 45 per cent.
This does not mean that structural reforms would generate smaller gains that further trade reforms.
Tariffs operate in the same way as inflated price‐cost margins — inducing large transfers between
producers and consumers, but much smaller welfare losses to the economy as a whole. By contrast,
the net welfare costs of forgone productivity gains could conceivably be as high as the transfers
produced by a tariff, and much larger than its net welfare costs. The relative sizes are examined
further in the next section.
4 Quantifyingtheeconomy‐andregion‐wideeffectsofreform
The economy‐ and region‐wide effects of structural reforms have been projected using FTAP, a
computable general equilibrium model of the world economy that is described in Box 1,
documented fully in Hanslow, Phamduc and Verikios (1999), and available for download at
2 The model’s tariff estimates are import weighted when aggregating from GTAP’s 57 sectors to the 25 sectors used in the current model. Simple averages are then taken when aggregating from 25 sectors to the two broad sectors shown in Figures 8 and 9.
16
http://www.crawford.anu.edu.au/staff/pdee.php. This model differs from the GTAP model (from
which it is derived) by having a treatment of foreign direct investment, an important mode by which
services are delivered.
The measure of welfare in the FTAP model takes into account, not just changes in the level of activity
generated in each economy, but changes in the amount of income from that activity that is retained
by the residents of each economy. The distinction is important in a long‐run context. One of the
possible impacts of productivity‐enhancing reforms is that they make each economy a more
attractive destination for foreign direct investment. Not all the income from that investment will
necessarily stay in the economy. However, the model has a fully articulated treatment of savings,
investment and capital accumulation (see Box 1), so it takes into account how much of the returns
on foreign investment are repatriated overseas, and how much are re‐invested. Thus the measure of
economic well‐being is related to the concept of gross national product (the income earned by
residents of a region) rather than gross domestic product (the income generated in region).3
The version of FTAP used here contains 20 regions — 19 APEC regions (excluding Brunei and Papua
New Guinea, which are not represented in the underlying GTAP database), and a single Rest of the
World region. It contains 25 sectors, shown in Table 8.
The first‐round impacts of prospective structural reforms in each economy are modeled via the
productivity improvements to the transport, energy and telecommunications sectors shown in
Figures 1 to 6. In each sector, the productivity improvements are applied to domestic production,
whether domestically‐owned or foreign‐invested, though as noted above, the productivity shocks to
domestic telecommunications firms are smaller than those to foreign‐invested firms. In the case of
rail transport, the productivity improvement can only be applied to a bigger ‘Other Transport’ sector,
which also includes road transport and storage. Detailed input‐output data available for the United
States and Australia suggest that the rail industry could account for about 14 per cent of this bigger
aggregate, so 14 per cent of the productivity improvements from Figure 3 are applied to the bigger
sector.
In air and maritime transport, the productivity improvements are also applied to the international air
and maritime transport margins used to transport merchandise exports out of each economy. In the
model, as in the real world, such transport margins could be provided by transport operators in the
source economy, the destination economy, or any third party. As the econometrics of Sourdin (2010)
demonstrates, the regulatory restrictions in these sectors currently penalise all these transport
providers.
In an alternative treatment of structural reform, half of the domestic gains are modelled as accruing
in the form of productivity gains, and half as reductions in the price‐cost margins of domestically
located service providers. This treatment is more in line with recent findings for the insurance
sector, where licensing restrictions on entry still apply (Dee and Dinh 2008). It is not possible to
provide a comparable ‘split’ treatment of the impact on international transport margins, because the
FTAP model, like its GTAP source, does not allow for ‘taxes’ on international transport margins. In
this alternative treatment, the initial ‘tax equivalents’ of regulatory restrictions on domestic
3 Hanslow (2000) has a good general treatment of welfare measures and welfare decomposition in computable general equilibrium models.
17
producers are injected into the model’s database in as neutral a fashion as possible while
maintaining database balance (using an FTAP analogue of GTAP’s Altertax procedure, Malcolm
1998), before being eliminated via a policy simulation. In the FTAP theoretical structure, the rents
from such ‘tax equivalents’ in services accrue to producers rather than to the government.
The FTAP model provides a long‐run snapshot of how different each economy would look about ten
years after the reforms, compared to the situation at that same point in time if the reforms had not
taken place. During the ten year adjustment period, many other changes would affect each
economy, but they are not taken into account in the current analysis. For this reason, the results
should not be interpreted as indicating the likely changes that would occur over time — this would
require all changes, not just those in regulatory restrictions, to be taken into account.
The distinction is important to keep in mind. Sometimes, to aid fluency, the results are couched as if
key indicators ‘rise’ or ‘fall’. This does not mean that the indicators would be higher or lower than
they are now. It means that at some future time, they would be higher or lower than they would be
otherwise. In both cases, in a growing economy, they could be higher than they are now.
Theeconomy‐andregion‐wideeffects ofstructuralreforms
The projected effects of the structural reforms, undertaken jointly, on each APEC economy are
shown in Figure 10, where to normalise for economic size, the absolute welfare gain in each
economy has been expressed relative to its initial GDP. As noted, welfare changes give the effects on
the economic well‐being of the residents in each economy, while real GDP measures the effects on
its level of activity. Figure 11 also shows the projected effects on real GDP, measured as the
percentage deviations from baseline, ten years after the structural reforms.
In both cases, not surprisingly, there is a strong correlation between the gains from reform and the
size of the reform task. The biggest gains in both welfare and real GDP, at about 5 per cent, are
projected to occur in Viet Nam, where the reform task is largest. Across all APEC economies, the
simple correlation coefficient between the welfare gains in Figure 10 and the average productivity
improvements in Figure 7 is 0.75. The correlation between the real GDP gains in Figure 11 and the
average productivity improvements in Figure 7 is 0.71. The latter is slightly smaller than the former
because economic activity in each economy is affected, more so than welfare, by reforms in other
economies, not just reforms at home.
To get an initial indication of the extent of these ‘cross’ effects, Figure12 shows the proportion of the
welfare gain in each economy that is attributable to reforms at home, relative to reforms in all other
APEC economies. The first observation is that in all economies, an overwhelming proportion of the
gains comes from reforms at home, rather than reforms in other economies. Thus while the gains
from joint reforms are considerable, there is no compelling reason for each APEC economy to wait
for others to start.
The second observation is that in most APEC economies, there are small gains to be had from the
reforms of others. This is not a foregone conclusion, because productivity improvements are
typically a two‐edged sword — while they increase incomes in other economies and can encourage
them to buy more from the home economy, they also improve the price competitiveness of other
economies and induce substitution away from the home economy. Typically in these types of
simulations, the latter effects dominate. The difference here is that structural reforms in other
18
economies also reduce the cost of transporting merchandise exports from the home economy,
because in most APEC economies, a large portion of that transport task is undertaken by foreign
rather than domestic transport operators. So this restores the balance in favour of the home
economy.
The three APEC economies that are not projected to gain from reforms elsewhere in the APEC region
are Hong Kong, Japan and Russia (though all three experience gains from their own reforms). Hong
Kong is already an efficient and substantial supplier of maritime transport services to the rest of the
region. It is projected to lose its relative position as others become more efficient in maritime
services. Russia is already relatively efficient in electricity generation, having undertaken a virtual
revolution in the organisation of its electricity sector in recent years. It is projected to lose from
more intensive competition in energy‐intensive products as others become more efficient in
electricity generation. Finally, Japan is projected to lose from reforms in the gas sector in other
economies. As will be seen later, one of the sectors that is often ‘crowded out’ in relative terms from
these reforms is the motor vehicle sector, and Japan is a significant producer of motor vehicles, not
just at home, but via is foreign direct investments elsewhere in the region. Figure 13 confirms these
sectoral sources of loss to Hong Kong, Japan and Russia.
More broadly, Figure 13 gives the percentage contributions to the overall gains in each economy
from the structural reforms in each sector. The biggest gains tend to come from reforms in air and
maritime transport, because as Figures 1 to 6 demonstrate, this is where the biggest reforms tend to
occur.
Puttingthegainsinperspective
Across the whole APEC region, structural reforms in transport, energy and telecommunications are
projected to generate US$175 billion a year in additional real income (in 2004 dollars), relative to
what would have accrued had no reforms occurred. This is a snapshot of the gains after a ten year
adjustment period.
These gains can be put in perspective by comparing them with the potential gains from further at‐
the‐border trade reform. Complete liberalisation of all remaining trade barriers in agriculture and
food, other primary products and manufacturing by all APEC economies is projected to generate real
income gains of just over US$100 billion a year, after about 10 years. These gains would be
generated in sectors that currently produce about US$16,300 billion in output annually. This
compares with the annual output of only $3,700 billion annually in the transport, energy and
telecommunications sectors undergoing the structural reforms.
APEC wide, therefore, the projected gains from structural reforms are almost twice as big as the
gains from liberalisation of merchandise trade. Yet the sectors here where structural reforms occur
are less than a quarter of the size of those engaged in merchandise trade. When structural reforms
lower real production costs rather than just squeezing profit margins, they can generate a ‘bang for
the buck’ that is much greater than from trade reforms.
As noted, however, it is not always certain that the structural reforms considered here would have
their first‐round effects on productivity levels rather than price‐cost margins, although there are a
priori arguments in favour of this treatment. As a sensitivity test, half of the domestic gains are
modelled as accruing in the form of productivity gains, and half as reductions in the price‐cost
19
margins of domestically located service providers. For technical reasons, the impact on international
transport margins continues to accrue as a productivity gain, as before. In this alternative treatment,
the APEC wide real income gains from structural reforms are smaller, at US$116 billion a year. Part
of this accrues from the domestic impacts of reform, which are now about 60 per cent of those
previously (about US$86 billion a year rather than US$145 billion a year). The remaining gains accrue
from the impacts on international transport margins, which are the same as before (about US$ 30
billion year).
Adjustment costs
As the name suggests, structural reforms cannot generate significant gains without also generating
significant structural adjustments.
Computable general equilibrium models can help to identify and quantify the extent of structural
adjustments, measured by the relative gains and losses to sectoral output and employment in each
economy. However, in a model with 20 regions and 25 sectors, the amount of detail that could
potentially be presented is considerable (full detail is available on request from the author). In an
attempt to condense the detail, Figures 14 and 15 show the output‐weighted average, across all
APEC economies, of the projected deviations from baseline in sectoral output in each economy.
Figure 14 shows the ‘typical’ (in this sense) sectoral response to an economy’s own reforms. Figure
15 shows the ‘typical’ response in one economy to reforms by all APEC economies. Obviously, the
percentage deviations from baseline in at least some individual economies are more severe than the
weighted averages. The extremes are examined shortly, in the context of employment changes
rather than output changes.
In the typical response to ‘own’ reforms, the sectors with output higher than otherwise are the
services sectors undergoing the reforms. Their output deviations tend to be in direct proportion to
their reform effort. Other sectors to gain in relative terms are those that are heavy users of these
services. They tend to be metals (an intensive user of electricity), chemicals (an intensive user of
gas), and wood and paper products (an intensive user of domestic transport services). Construction
also typically gains slightly from the additional impetus given to industry investment.
The sectors projected to lose in relative terms from an economy’s own structural reforms are
typically those that do not fall into the above categories. They suffer indirectly from higher wages
and rates of return, effects that are induced primarily by the expansions in overall activity. Industries
typically losing in this way include textiles and clothing, motor vehicles, other transport equipment,
electronic equipment and other machinery and equipment. The relative loses in industry output in
these sectors are relatively minor, however.
When reforms in other APEC economies are taken into account, the deviations from baseline in
sectoral output are typically smaller than for ‘own’ reforms. Thus structural reforms in other APEC
economies can play a useful role in helping to cushion the adjustment costs of reforms at home,
even if they do not add greatly to the overall gains from reform.
Furthermore, a slightly wider set of industries are projected to gain in relative terms. They now
include sectors that are intensive users of international transport margins, and benefit from
transport reforms elsewhere. These sectors can include meat and livestock, forestry and fishing,
20
grains, dairy, and other manufacturing. The relative output losses are therefore concentrated in a
smaller set of industries, but are typically not as severe as with own reforms because of the gains
from reforms elsewhere.
While Figures 14 and 15 give an indication of the typical industry output responses to reforms, they
do not show the full extent of adjustment costs, for two reasons. Firstly, as noted, they show the
average responses rather than the extremes. Secondly, in sectors undergoing productivity
improvements, the employment effects can be much more severe than the output effects. The
essence of a productivity improvement is that an industry can produce more with less. As a result,
input usage can fall, even as output rises.
To capture the full extent of adjustment costs, Figures 16 shows, for each industry, the biggest
relative gain and the biggest relative loss in sectoral employment of unskilled labour projected in any
of the APEC economies. In air transport, for example, Figure 16 shows that the biggest relative gain
in unskilled employment is projected to be about 150 per cent (in Hong Kong) while the biggest
relative loss in unskilled employment is projected to be about 10 per cent (in the United States). 4 In
water transport, the biggest relative gain is shown to be about 90 per cent (in Thailand), while the
biggest relative loss is almost 50 per cent (in Hong Kong). In dairy, the biggest projected gain is over
70 per cent (from a very small base) in Malaysia, while the biggest relative loss is around 4 per cent
(in Chinese Taipei). As the examples show, the particular economies in which the minimums and
maximums occur can vary from sector to sector. The corresponding diagram showing the minimum
and maximum changes in employment of skilled labour is similar, so is not shown here.
By far the biggest relative losses in unskilled employment are projected to occur in the gas industry
in Singapore (67 per cent), the water transport industry in Hong Kong (46 per cent), and the
electricity industry in Chinese Taipei (34 per cent). The first two cases are where substantial reform
in the home economy has already taken place. These sectors lose employment, not as a result of
their own productivity improvements, but because the electricity or gas using industries in these
economies lose their position as other economies reform.
These relative employment losses need to be kept in perspective. If unskilled employment in
maritime transport in Hong Kong is projected to be 46 per cent lower than otherwise after ten years,
then annual economic growth of 6.2 per cent a year over each of those ten years would ensure that
the relative loss did not translate into an absolute one. Such a growth rate is not unreasonable for
the Hong Kong economy, particularly with the added boost to economic activity arising from reforms
in other sectors. Similarly, if unskilled employment in electricity in Chinese Taipei is projected to be
34 per cent lower than otherwise after ten years, then annual economic growth of just over 4 per
cent a year would ensure that the relative loss did not translate into an absolute one. Perhaps the
only sector that might experience an absolute employment loss as a result of the reforms considered
here would be the gas industry in Singapore (where annual growth of over 9 per cent would be
required to prevent this outcome).
4 For clarity of presentation, Figure 16 suppresses the very biggest relative employment gains in water and air transport, which are projected to occur in Viet Nam. If the more than four‐fold increase in unskilled employment in these sectors were shown, it would unduly compress the results for other sectors.
21
A further consideration is that while structural reforms may require significant reallocations of
unskilled labour between sectors, they also generate higher real wages for unskilled workers. Figure
17 shows projected increases in real wages of unskilled labour of up to 6 per cent as a result of
structural reforms throughout the APEC region (the increases in skilled wages are similar).
One of the best ways that APEC economies can guard against the adjustment costs associated with
structural reforms is to maintain healthy underlying rates of economic growth. To some extent,
structural reforms provide their own reward, in terms of stimulating activity and increasing the
resilience of the economy, but prudent macroeconomic management is also crucial.
For the particular structural reforms considered here, there is not much prospect that adjustment
costs could be cushioned by accompanying the structural reforms with trade reforms. The reasons
were hinted at earlier — the sectors that tend to lose in output terms from these structural reforms
include textiles and clothing and motor vehicles, sectors that would also be penalised in at least
some economies from trade reforms. However, there are prospects that a wider set of structural
reforms could be more complementary with trade reforms, in terms of cushioning adjustment costs.
Such offsets are more likely if reforms targeted at the traded goods sectors are combined with
reforms in sectors that cater more to the needs of households (eg Dee 2008).
5 Summaryandconclusions
This paper has examined the economy‐ and region‐wide effects of prospective structural reforms in
the transport energy and telecommunications sectors of APEC economies. Key to these reforms is
the introduction of additional competition into each sector.
In air transport, this implies a range of reforms to air services agreements, to entry conditions for
domestic and foreign carriers, and to ownership. In maritime transport, it implies the dismantling of
any remaining entry restrictions, quotas or cargo sharing arrangements, and the granting of national
treatment to foreign‐owned carriers located domestically. In rail transport, it implies vertical
separation and free entry in freight operations in those economies that do not yet have them. In
electricity and gas, it implies third party access, unbundling, wholesale markets and/or retail
competition in economies that have not yet implemented them. Note that no privatisation of
incumbents is assumed in rail, electricity or gas. In telecommunications, the reforms predominantly
involve the removal of remaining foreign equity limits.
The estimated first‐round impacts of these reforms suggest that they could lead to weighted average
productivity improvements in the range 2 to 14 per cent across the sectors involved. The most
extensive reform effort, but the largest productivity gains (ie above 10 per cent), are projected to
occur in Indonesia, Malaysia, Mexico, the Philippines, Chinese Taipei and Viet Nam.
There is strong correlation between the sizes of the reform tasks and the economy‐wide gains they
generate. Furthermore, in all economies, an overwhelming proportion of the gains comes from
reforms at home, rather than reforms in other economies. Thus while the gains from joint reforms
are considerable, there is no compelling reason for each APEC economy to wait for others to start.
Nevertheless, most APEC economies are also projected to reap small gains from reforms elsewhere.
This is not a foregone conclusion, because productivity improvements elsewhere are a two‐edged
22
sword. The income and price effects on the home economy work in opposite directions, and very
often the adverse price effects dominate. The difference here is that structural reforms in other
economies also reduce the cost of transporting merchandise exports from the home economy. In
most cases, this restores the balance in favour of the home economy.
Across the whole APEC region, structural reforms in transport, energy and telecommunications are
projected to generate US$175 billion a year in additional real income (in 2004 dollars), relative to
what would have accrued had no reforms occurred. This is a snapshot of the gains after a ten year
adjustment period.
APEC wide, these projected gains from these structural reforms are almost twice as big as the gains
from further liberalisation of merchandise trade. Yet the sectors where the structural reforms occur
are less than a quarter of the size of those engaged in merchandise trade. When structural reforms
lower real production costs, even by half as much as is estimated here, they generate a ‘bang for the
buck’ that is much greater than from trade reforms. The findings of this paper therefore vindicate
the decision of APEC Leaders to move beyond a ‘border’ agenda to one that focuses on behind‐the‐
border reforms.
Yet structural reforms cannot generate significant gains without also generating significant structural
adjustments. This paper has also examined the expected size and extent of those adjustments.
At the sectoral level, the projected output gains tend to be in the services sectors undergoing
reform, and in the sectors that use their services intensively. These can include metals (intensive
users of electricity), chemicals (intensive users of gas), wood and paper products (intensive users of
domestic transport services), and a range of industries (meat and livestock, forestry and fishing,
grains, dairy, other manufacturing) that are intensive users of international transport services.
Construction is typically also projected to gain slightly from the additional impetus given to industry
investment.
The sectors projected to lose in relative terms are typically those that do not fall into the above
categories. They suffer indirectly from higher wages and rates of return, effects that are induced
primarily by the expansions in overall activity. Industries typically losing in this way include textiles
and clothing, motor vehicles, other transport equipment, electronic equipment and other machinery
and equipment.
The relative losses in industry output in these sectors are relatively minor, however. And they are
even smaller when reforms in other APEC economies are taken into account. Thus structural reforms
in other APEC economies can play a useful role in helping to cushion the adjustment costs of reforms
at home, even if they do not add greatly to the overall gains from reform.
The employment effects of structural reforms can be more severe. The essence of a productivity
improvement is that an industry can produce more with less. As a result, input usage can fall, even
when output rises. Nevertheless, two of the three cases where the worst outcomes for unskilled
employment are projected to occur are in sectors where substantial reform in the home economy
has already taken place. These sectors lose employment, not as a result of their own productivity
improvements, but because the home industries that use their services lose their position as other
economies reform.

23
In these three worst cases, the relative losses in unskilled employment after ten years are about 30
to 60 per cent. But these losses need to be kept in perspective. Healthy but realistic rates of
underlying economic growth in the intervening years would probably ensure that in all but one case,
the relative losses did not translate into absolute ones. Furthermore, while structural reforms may
require significant relative shifts of labour across sectors over time in some economies, they are also
projected to generate higher real wages for all workers in all economies.
Thus one of the best ways that APEC economies can guard against any adverse employment effects
of structural reforms is to maintain healthy underlying rates of economic growth. To some extent,
structural reforms provide their own reward, in terms of stimulating activity and increasing the
resilience of the economy, but prudent macroeconomic management is also crucial.
24
References
Achard, P. 2009, ‘The Regulation of International Air Cargo Services’, Mimeo, Sciences Po, Paris.
Bertho, F. 2010, 'Maritime Transport in Australia', Chapter 9 in APEC Policy Support Unit, The
Impacts and Benefits of Structural Reforms in Transport, Energy and Telecommunications
Markets, APEC Secretariat, Singapore, forthcoming.
Brakman, S., C. van Marrewijk and A. van Witteloostuijn 2009, ‘Market Liberalisation in the European
Natural Gas Market: The Importance of Capacity Constraints and Efficiency Differences’,
CESifo Working Paper No. 2697, CESifo Group, Munich.
Brons, M., E. Pels, P. Nijkamp and P. Rietveld 2001, ‘Price Elasticities of Demand for Passenger Air
Travel: A Meta‐Analysis’, Tinbergen Institute Discussion Paper TI2001‐047/3, Tinbergen
Institute, Amsterdam.
Cantos, P., Pastor, J.M. and Serrano. L. 2010a, ‘Vertical and horizontal separation in the European
railway sector and its effects on productivity’, Journal of Transport Economics and Policy,
44(2), pp. 1–25.
Cantos, P., Pastor, J.M. and Serrano. L. 2010b, ‘Productivity, efficiency and technical change for the
national railway systems: The case of the APEC economies’, Chapter 19 in APEC Policy
Support Unit, The Impacts and Benefits of Structural Reforms in Transport, Energy and
Telecommunications Markets, APEC Secretariat, Singapore, forthcoming.
Dee, P. 2003, ‘Modelling the policy issues in services trade’, Économie Internationale (94‐95), pp.
283–300.
Dee, P. 2005, ‘A Compendium of Barriers to Services Trade’, prepared for World Bank, available at
http://www.crawford.anu.edu.au/pdf/Combined_report.pdf.
Dee, P. 2006, ‘The Economy‐wide Effects of Moroccan Services Sector Reforms’, paper prepared for
the World Bank, The Australian National University, Canberra.
Dee, P. 2007, ‘East Asian economic integration and its impact on future growth’, The World
Economy, 30(3), pp. 405–23.
Dee, P. 2008, ‘Benchmarking and Assessing Indonesia’s Regulation of Services’, paper prepared for
the World Bank, The Australian National University, Canberra.
Dee,P. 2010a, ‘Services Liberalisation toward the ASEAN Economic Community’, paper prepared for
report on Tracing the Progress toward the ASEAN Economic Community, Economic Research
Institute for ASEAN and East Asia (ERIA), Jakarta, forthcoming.
Dee, P. 2010b, ‘Quantifying the impact of structural reforms in electricity and gas markets’, Chapter
16 in APEC Policy Support Unit, The Impacts and Benefits of Structural Reforms in Transport,
Energy and Telecommunications Markets, APEC Secretariat, Singapore, forthcoming.
25
Dee, P. and Dinh, H. 2008, ‘The Sectoral Impact of Barriers to Trade in Insurance: A Cost‐ and Profit‐
based Approach’, Mimeo, Crawford School of Economics and Government, Australian
National University, Canberra.
Dee, P. and C. Findlay 2008, ‘Trade in Infrastructure Services: A Conceptual Framework’, in A.
Mattoo, R. Stern and G. Zanini (eds), A Handbook of International Trade in Services, Oxford
University Press, Oxford, pp. 338–55.
Dee, P. and Hanslow, K. 2001, ‘Multilateral liberalisation of services trade’, in R. Stern (ed.),
Services in the International Economy, University of Michigan Press, Ann Arbor, pp.
117–39.
Doove, S., O. Gabbitas, D. Nguyen‐Hong and J. Owen, J. 2001, ‘Price Effects of Regulation:
International Air Passenger Transport, Telecommunications and Electricity
Supply’,Productivity Commission Staff Research Paper, Ausinfo, Canberra.
Economides, N., G. Lopomo and G. Woroch 1996, ‘Regulatory pricing rules to neutralise network
dominance’, Industrial and Corporate Change, 5(4), pp. 1013–28.
European Commission 2007, ‘DG Competition Report on Energy Sector Inquiry’, SEC(2006) 1724,
Competition DG, European Commission, Brussels.
Findlay, C. and Warren, T. (eds) 2000, Impediments to Trade in Services: Measurement and Policy
Implications, Routledge, London and New York.
Gonenc, R., and G. Nicoletti 2000, ‘Regulation, Market Structure and Performance in Air Passenger
Transport’, Working Paper No. 254, ECO/WKP(2000)27, Economics Department,
Organization for Economic Cooperation and Development, Paris.
Grosso, M.G. 2008, ‘Liberalising Air Cargo Services in APEC’, GEM Working Paper, Sciences Po, Paris.
Hanslow, K. 2000, ‘A General Welfare Decomposition for CGE Models’, GTAP Technical Paper No. 19,
Centre for Global Trade Policy Analysis, Purdue University, West Lafayette IN.
Hanslow, K., T. Phamduc and G. Verikios 1999, ‘The structure of the FTAP model’, Research
Memorandum, Productivity Commission, Canberra, December, available from
http://www.crawford.anu.edu.au/staff/pdee.php.
Hertel, T. 1997, Global Trade Analysis: Modelling and Applications, Cambridge University Press,
Cambridge.
Hattori, T. and M. Tsutsui 2004, ‘Economic impact of regulatory reforms in the electricity supply
industry: a panel data analysis for OECD countries’, Energy Policy 32, pp. 823–32.
Hawdon, D. 2003, ‘Efficiency. Performance and regulation of the international gas industry — a
bootstrap DEA approach’, Energy Policy 31, pp. 1167–78.

26
ITU (International Telecommunications Union) 2000, ‘Fixed‐Mobile Interconnection Workshop’,
Document WFMI/04, ITU New Initiatives Program 20–22 September 2000, International
Telecommunications Union, Geneva.
ITU 2008, Trends on Telecommunication Reform 2008, International Telecommunications Union,
Geneva.
Jamasb, T., M. Pollitt and T. Triebs 2008, ‘Productivity and Efficiency of US Gas Transmission
Companies: a European Regulatory Perspective’, Cambridge Working Papers in Economics
CWPE 0812, University of Cambridge.
Kang, J. 2000, ‘Price impact of restrictions on maritime transport services’, in C. Findlay and T.
Warren (eds), Impediments to Trade in Services, Measurement and Policy Implications,
Routledge, London and New York, pp. 189–200.
Lee, R. 2010, ‘Quantifying the impact of structural reforms in telecommunications markets in APEC’,
Chapter 14 in APEC Policy Support Unit, The Impacts and Benefits of Structural Reforms in
Transport, Energy and Telecommunications Markets, APEC Secretariat, Singapore,
forthcoming.
Malcolm. G. 1998, ‘Adjusting Tax Rates in the GTAP Database’, GTAP Technical Paper No. 12, Centre
for Global Trade Policy Analysis, Purdue University, West Lafayette IN.
Mattoo, A., R. Rathindran and A. Subramanian 2001, ‘Measuring Services Trade Liberalisation and its
Impact on Economic Growth: An Illustration’, World Bank Working Paper No. 2655, World
Bank, Washington DC.
McGuire, G., Schuele, M. and Smith, T. 2000, ‘Restrictiveness of international trade in maritime
services’, in C. Findlay and T. Warren (eds), Impediments to Trade in Services, Measurement
and Policy Implications, Routledge, London and New York, pp. 172–88.
Nagayama, H. 2007, ‘Effects of regulatory reforms in the electricity supply industry on electricity
prices in developing countries’, Energy Policy 35, pp. 3440–62.
PDP Australia Pty Ltd and Meyrick and Associates 2005, ‘Promoting Efficient and Competitive Intra‐
ASEAN Shipping Services’, REPSF Project No. 04/001, Final Report, ASEAN Secretariat,
Singapore.
Piermartini, R. and L. Rousová 2008, ‘Liberalisation of Air Transport Services and Passenger Traffic’,
Staff Working Paper ERSD‐2008‐06, Economic Research and Statistics Division, World Trade
Organization, Geneva.
Sourdin, P. 2010, ‘Quantifying the impact of structural reforms on international transport margins’,
Chapter 17 in APEC Policy Support Unit, The Impacts and Benefits of Structural Reforms in
Transport, Energy and Telecommunications Markets, APEC Secretariat, Singapore,
forthcoming.
Steiner, F. 2000, ‘Regulation, Industry Structure and Performance in the Electricity Supply Industry’,
Working Paper No. 238, ECO/WKP(2000)11, Economics Department, OECD, Paris.
27
Warren, T. 2000, ‘The impact on output of impediments to trade and investment in
telecommunications services’, in C. Findlay and T. Warren (eds), Impediments to Trade in
Services: Measurement and Policy Implications, Routledge, London and New York, pp. 85–
100.
WTO (World Trade Organization) 2006, ‘Second Review of the Air Transport Annex: Developments in
the Air Transport Sector (Part Two), Quantitative Air Services Agreements Review
(QUASAR)’, Volumes I and II, Note by the Secretariat, S/C/W/270/Add.1, World Trade
Organization, Geneva.
Zhang, S. and C. Findlay, 2010, 'Quantifying the impact of structural reforms on air traffic flows in
APEC', Chapter 15 in APEC Policy Support Unit, The Impacts and Benefits of Structural
Reforms in Transport, Energy and Telecommunications Markets, APEC Secretariat, Singapore,
forthcoming.
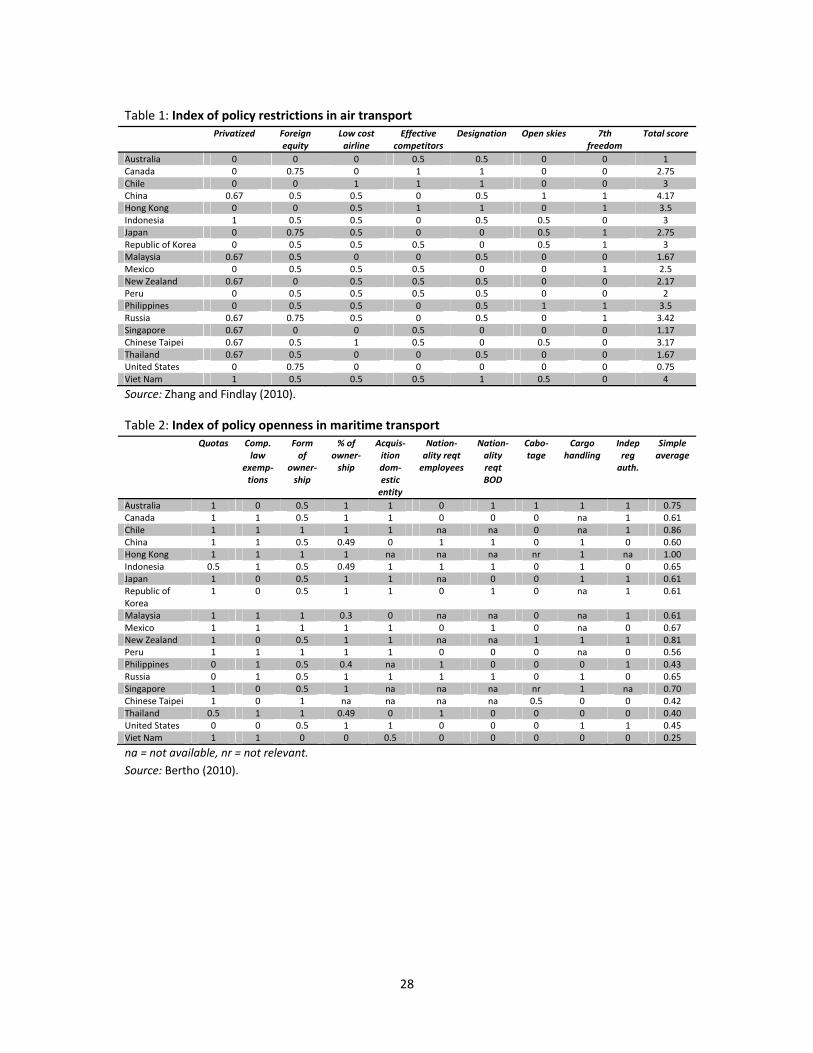
28
Table 1: Index of policy restrictions in air transport Privatized Foreign
equity Low cost airline
Effective competitors
Designation Open skies 7th freedom
Total score
Australia 0 0 0 0.5 0.5 0 0 1Canada 0 0.75 0 1 1 0 0 2.75Chile 0 0 1 1 1 0 0 3China 0.67 0.5 0.5 0 0.5 1 1 4.17Hong Kong 0 0 0.5 1 1 0 1 3.5Indonesia 1 0.5 0.5 0 0.5 0.5 0 3Japan 0 0.75 0.5 0 0 0.5 1 2.75Republic of Korea 0 0.5 0.5 0.5 0 0.5 1 3Malaysia 0.67 0.5 0 0 0.5 0 0 1.67Mexico 0 0.5 0.5 0.5 0 0 1 2.5New Zealand 0.67 0 0.5 0.5 0.5 0 0 2.17Peru 0 0.5 0.5 0.5 0.5 0 0 2Philippines 0 0.5 0.5 0 0.5 1 1 3.5Russia 0.67 0.75 0.5 0 0.5 0 1 3.42Singapore 0.67 0 0 0.5 0 0 0 1.17Chinese Taipei 0.67 0.5 1 0.5 0 0.5 0 3.17Thailand 0.67 0.5 0 0 0.5 0 0 1.67United States 0 0.75 0 0 0 0 0 0.75Viet Nam 1 0.5 0.5 0.5 1 0.5 0 4
Source: Zhang and Findlay (2010).
Table 2: Index of policy openness in maritime transport Quotas Comp.
law exemp‐ tions
Form of
owner‐ship
% of owner‐ship
Acquis‐ition dom‐ estic entity
Nation‐ality reqt employees
Nation‐ality reqt BOD
Cabo‐tage
Cargo handling
Indep reg auth.
Simple average
Australia 1 0 0.5 1 1 0 1 1 1 1 0.75Canada 1 1 0.5 1 1 0 0 0 na 1 0.61Chile 1 1 1 1 1 na na 0 na 1 0.86China 1 1 0.5 0.49 0 1 1 0 1 0 0.60Hong Kong 1 1 1 1 na na na nr 1 na 1.00Indonesia 0.5 1 0.5 0.49 1 1 1 0 1 0 0.65Japan 1 0 0.5 1 1 na 0 0 1 1 0.61Republic of Korea
1 0 0.5 1 1 0 1 0 na 1 0.61
Malaysia 1 1 1 0.3 0 na na 0 na 1 0.61Mexico 1 1 1 1 1 0 1 0 na 0 0.67New Zealand 1 0 0.5 1 1 na na 1 1 1 0.81Peru 1 1 1 1 1 0 0 0 na 0 0.56Philippines 0 1 0.5 0.4 na 1 0 0 0 1 0.43Russia 0 1 0.5 1 1 1 1 0 1 0 0.65Singapore 1 0 0.5 1 na na na nr 1 na 0.70Chinese Taipei 1 0 1 na na na na 0.5 0 0 0.42Thailand 0.5 1 1 0.49 0 1 0 0 0 0 0.40United States 0 0 0.5 1 1 0 0 0 1 1 0.45Viet Nam 1 1 0 0 0.5 0 0 0 0 0 0.25
na = not available, nr = not relevant.
Source: Bertho (2010).
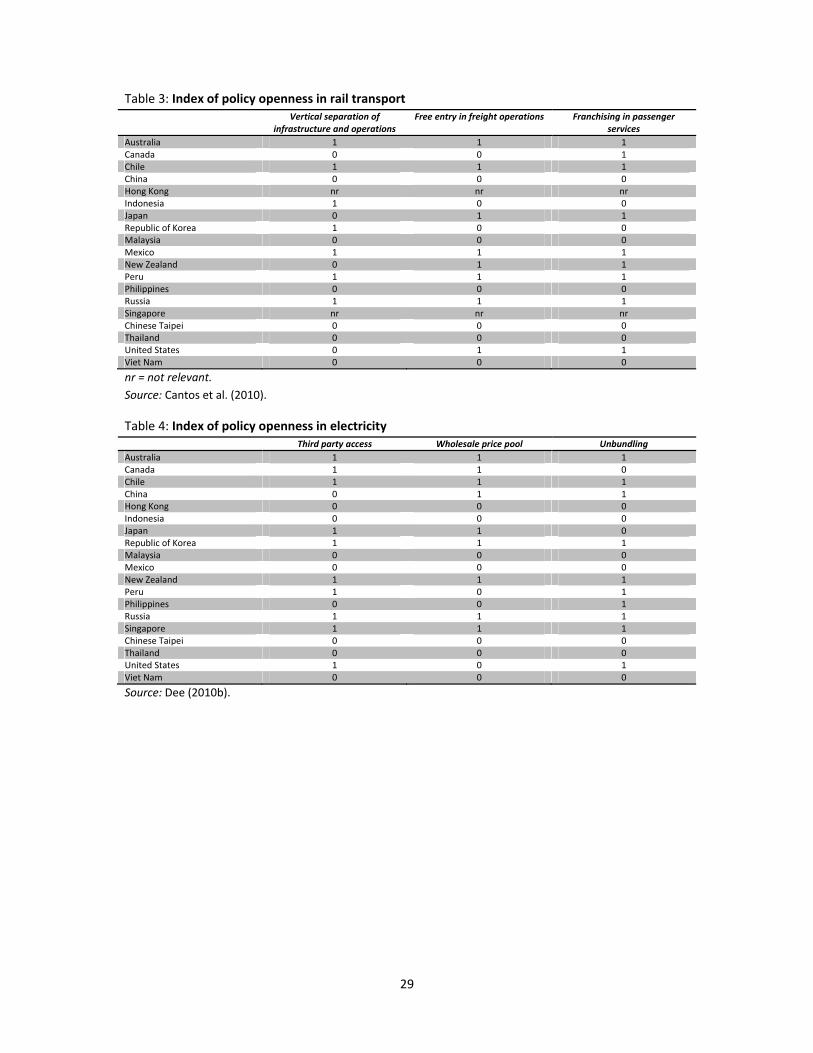
29
Table 3: Index of policy openness in rail transport Vertical separation of
infrastructure and operations Free entry in freight operations Franchising in passenger
services
Australia 1 1 1 Canada 0 0 1 Chile 1 1 1 China 0 0 0 Hong Kong nr nr nr Indonesia 1 0 0 Japan 0 1 1 Republic of Korea 1 0 0 Malaysia 0 0 0 Mexico 1 1 1 New Zealand 0 1 1 Peru 1 1 1 Philippines 0 0 0 Russia 1 1 1 Singapore nr nr nr Chinese Taipei 0 0 0 Thailand 0 0 0 United States 0 1 1 Viet Nam 0 0 0
nr = not relevant.
Source: Cantos et al. (2010).
Table 4: Index of policy openness in electricity Third party access Wholesale price pool Unbundling
Australia 1 1 1 Canada 1 1 0 Chile 1 1 1 China 0 1 1 Hong Kong 0 0 0 Indonesia 0 0 0 Japan 1 1 0 Republic of Korea 1 1 1 Malaysia 0 0 0 Mexico 0 0 0 New Zealand 1 1 1 Peru 1 0 1 Philippines 0 0 1 Russia 1 1 1 Singapore 1 1 1 Chinese Taipei 0 0 0 Thailand 0 0 0 United States 1 0 1 Viet Nam 0 0 0
Source: Dee (2010b).
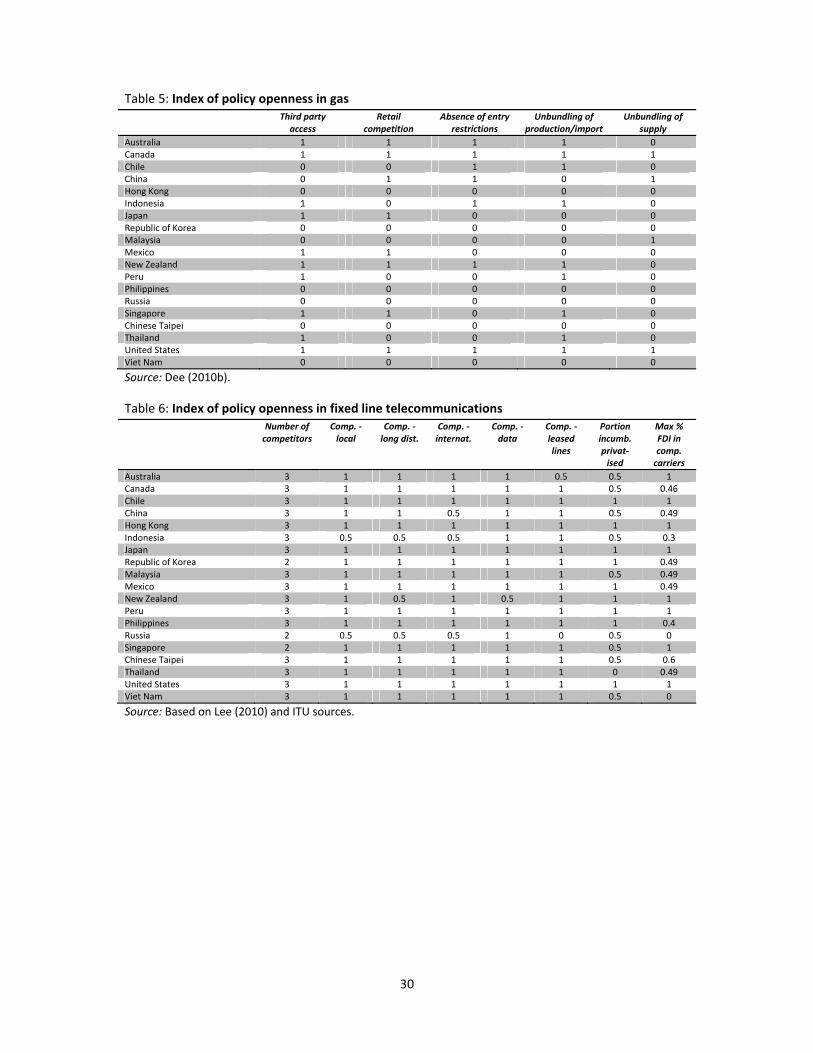
30
Table 5: Index of policy openness in gas Third party
access Retail
competition Absence of entry
restrictions Unbundling of
production/import Unbundling of
supply
Australia 1 1 1 1 0Canada 1 1 1 1 1Chile 0 0 1 1 0China 0 1 1 0 1Hong Kong 0 0 0 0 0Indonesia 1 0 1 1 0Japan 1 1 0 0 0Republic of Korea 0 0 0 0 0Malaysia 0 0 0 0 1Mexico 1 1 0 0 0New Zealand 1 1 1 1 0Peru 1 0 0 1 0Philippines 0 0 0 0 0Russia 0 0 0 0 0Singapore 1 1 0 1 0Chinese Taipei 0 0 0 0 0Thailand 1 0 0 1 0United States 1 1 1 1 1Viet Nam 0 0 0 0 0
Source: Dee (2010b).
Table 6: Index of policy openness in fixed line telecommunications Number of
competitors Comp. ‐local
Comp. ‐long dist.
Comp. ‐internat.
Comp. ‐data
Comp. ‐ leased lines
Portion incumb. privat‐ ised
Max % FDI in comp. carriers
Australia 3 1 1 1 1 0.5 0.5 1Canada 3 1 1 1 1 1 0.5 0.46Chile 3 1 1 1 1 1 1 1China 3 1 1 0.5 1 1 0.5 0.49Hong Kong 3 1 1 1 1 1 1 1Indonesia 3 0.5 0.5 0.5 1 1 0.5 0.3Japan 3 1 1 1 1 1 1 1Republic of Korea 2 1 1 1 1 1 1 0.49Malaysia 3 1 1 1 1 1 0.5 0.49Mexico 3 1 1 1 1 1 1 0.49New Zealand 3 1 0.5 1 0.5 1 1 1Peru 3 1 1 1 1 1 1 1Philippines 3 1 1 1 1 1 1 0.4Russia 2 0.5 0.5 0.5 1 0 0.5 0Singapore 2 1 1 1 1 1 0.5 1Chinese Taipei 3 1 1 1 1 1 0.5 0.6Thailand 3 1 1 1 1 1 0 0.49United States 3 1 1 1 1 1 1 1Viet Nam 3 1 1 1 1 1 0.5 0
Source: Based on Lee (2010) and ITU sources.
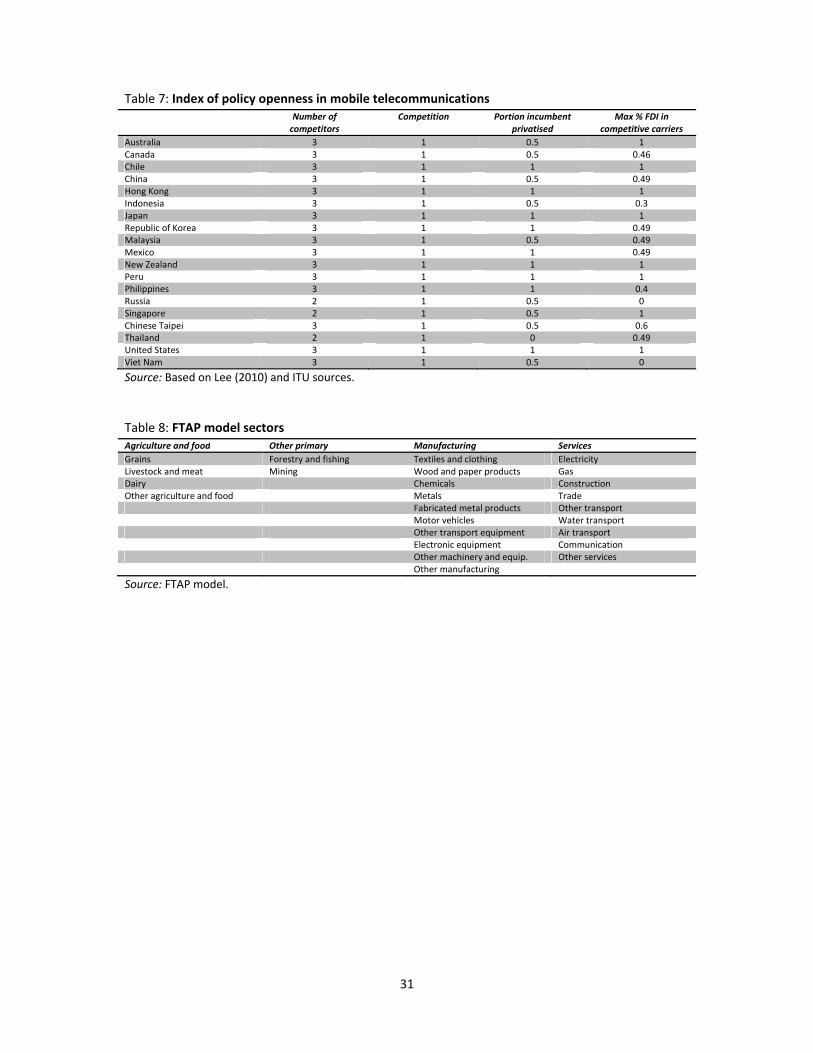
31
Table 7: Index of policy openness in mobile telecommunications Number of
competitors Competition Portion incumbent
privatised Max % FDI in
competitive carriers
Australia 3 1 0.5 1 Canada 3 1 0.5 0.46 Chile 3 1 1 1 China 3 1 0.5 0.49 Hong Kong 3 1 1 1 Indonesia 3 1 0.5 0.3 Japan 3 1 1 1 Republic of Korea 3 1 1 0.49 Malaysia 3 1 0.5 0.49 Mexico 3 1 1 0.49 New Zealand 3 1 1 1 Peru 3 1 1 1 Philippines 3 1 1 0.4 Russia 2 1 0.5 0 Singapore 2 1 0.5 1 Chinese Taipei 3 1 0.5 0.6 Thailand 2 1 0 0.49 United States 3 1 1 1 Viet Nam 3 1 0.5 0
Source: Based on Lee (2010) and ITU sources.
Table 8: FTAP model sectors Agriculture and food Other primary Manufacturing Services
Grains Forestry and fishing Textiles and clothing Electricity Livestock and meat Mining Wood and paper products Gas Dairy Chemicals Construction Other agriculture and food Metals Trade Fabricated metal products Other transport Motor vehicles Water transport Other transport equipment Air transport Electronic equipment Communication Other machinery and equip. Other services Other manufacturing
Source: FTAP model.
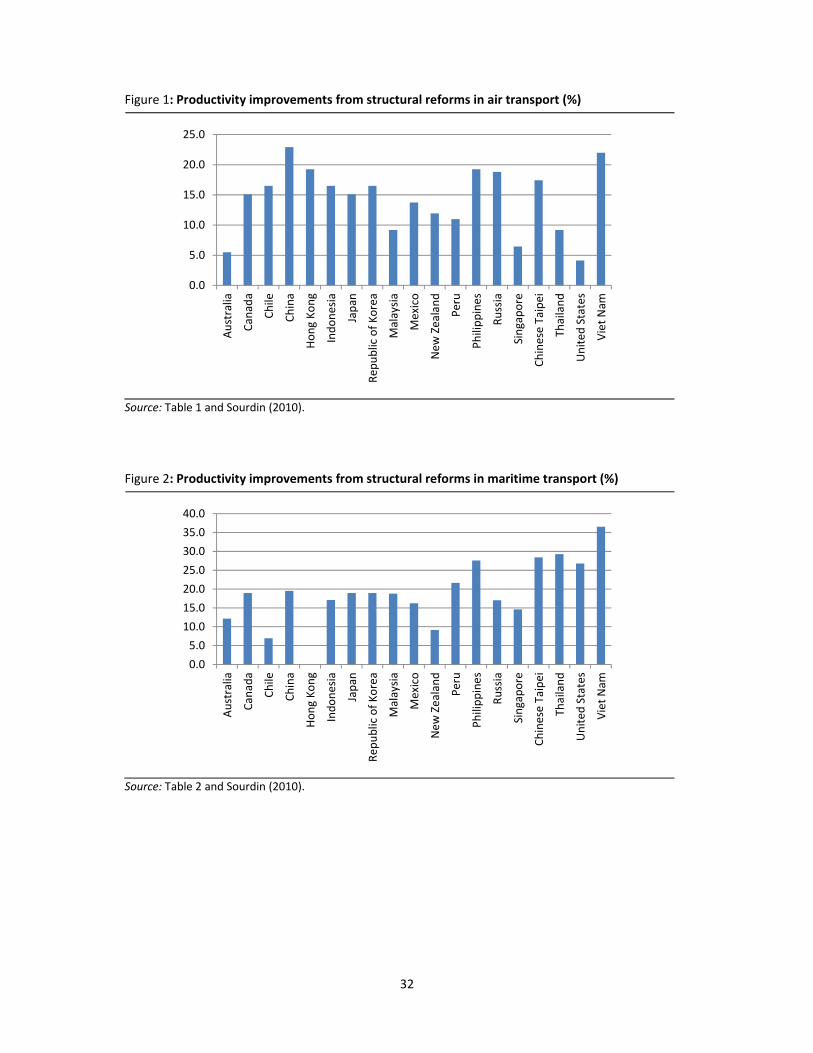
32
Figure 1: Productivity improvements from structural reforms in air transport (%)
Source: Table 1 and Sourdin (2010).
Figure 2: Productivity improvements from structural reforms in maritime transport (%)
Source: Table 2 and Sourdin (2010).
0.0
5.0
10.0
15.0
20.0
25.0
Australia
Canada
Chile
China
Hong Kong
Indonesia
Japan
Rep
ublic of Korea
Malaysia
Mexico
New
Zealand
Peru
Philippines
Russia
Singapore
Chinese Taipei
Thailand
United
States
Viet Nam
0.0
5.0
10.0
15.0
20.0
25.0
30.0
35.0
40.0
Australia
Canada
Chile
China
Hong Kong
Indonesia
Japan
Rep
ublic of Korea
Malaysia
Mexico
New
Zealand
Peru
Philippines
Russia
Singapore
Chinese Taipei
Thailand
United
States
Viet Nam
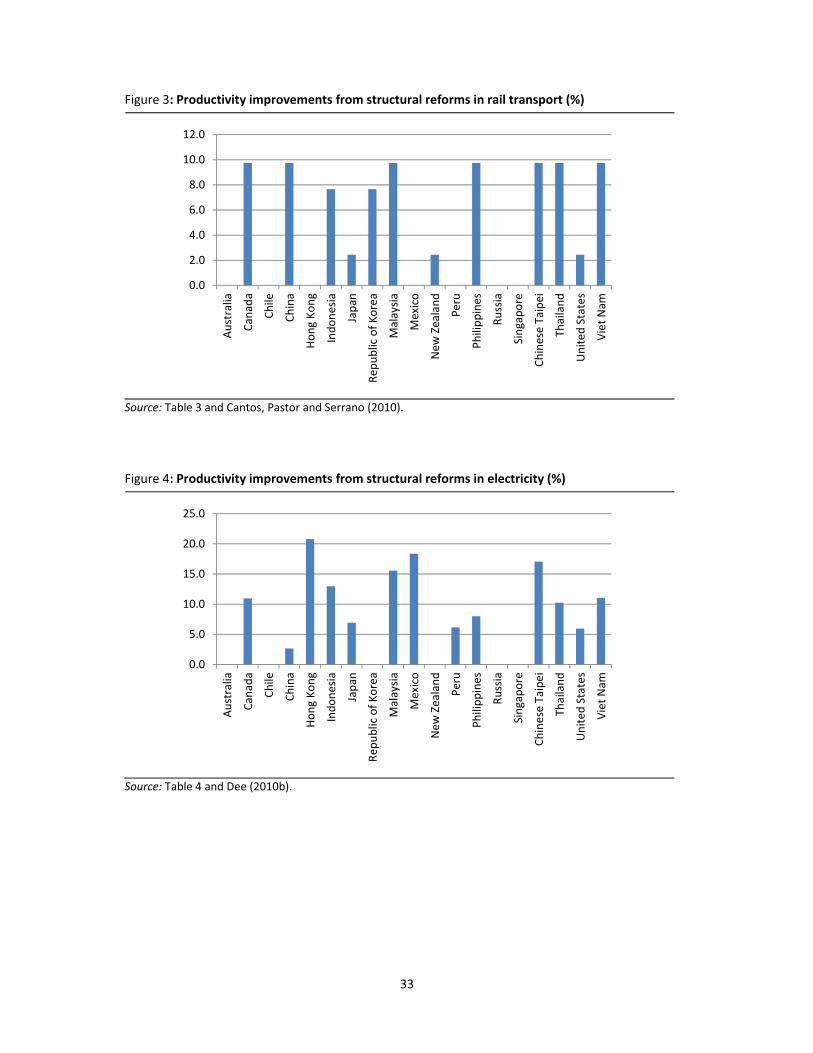
33
Figure 3: Productivity improvements from structural reforms in rail transport (%)
Source: Table 3 and Cantos, Pastor and Serrano (2010).
Figure 4: Productivity improvements from structural reforms in electricity (%)
Source: Table 4 and Dee (2010b).
0.0
2.0
4.0
6.0
8.0
10.0
12.0
Australia
Canada
Chile
China
Hong Kong
Indonesia
Japan
Rep
ublic of Korea
Malaysia
Mexico
New
Zealand
Peru
Philippines
Russia
Singapore
Chinese Taipei
Thailand
United
States
Viet Nam
0.0
5.0
10.0
15.0
20.0
25.0
Australia
Canada
Chile
China
Hong Kong
Indonesia
Japan
Rep
ublic of Korea
Malaysia
Mexico
New
Zealand
Peru
Philippines
Russia
Singapore
Chinese Taipei
Thailand
United
States
Viet Nam

34
Figure 5: Productivity improvements from structural reforms in gas (%)
Source: Table 5 and Dee (2010b).
Figure 6: Productivity improvements from structural reforms in telecommunications (%)
Source: Tables 6 and 7 and Dee (2005).
0.0
5.0
10.0
15.0
20.0
25.0
Australia
Canada
Chile
China
Hong Kong
Indonesia
Japan
Rep
ublic of Korea
Malaysia
Mexico
New
Zealand
Peru
Philippines
Russia
Singapore
Chinese Taipei
Thailand
United
States
Viet Nam
0.00.51.01.52.02.53.03.54.04.55.0
Australia
Canada
Chile
China
Hong Kong
Indonesia
Japan
Rep
ublic of Korea
Malaysia
Mexico
New
Zealand
Peru
Philippines
Russia
Singapore
Chinese Taipei
Thailand
United States
Viet Nam
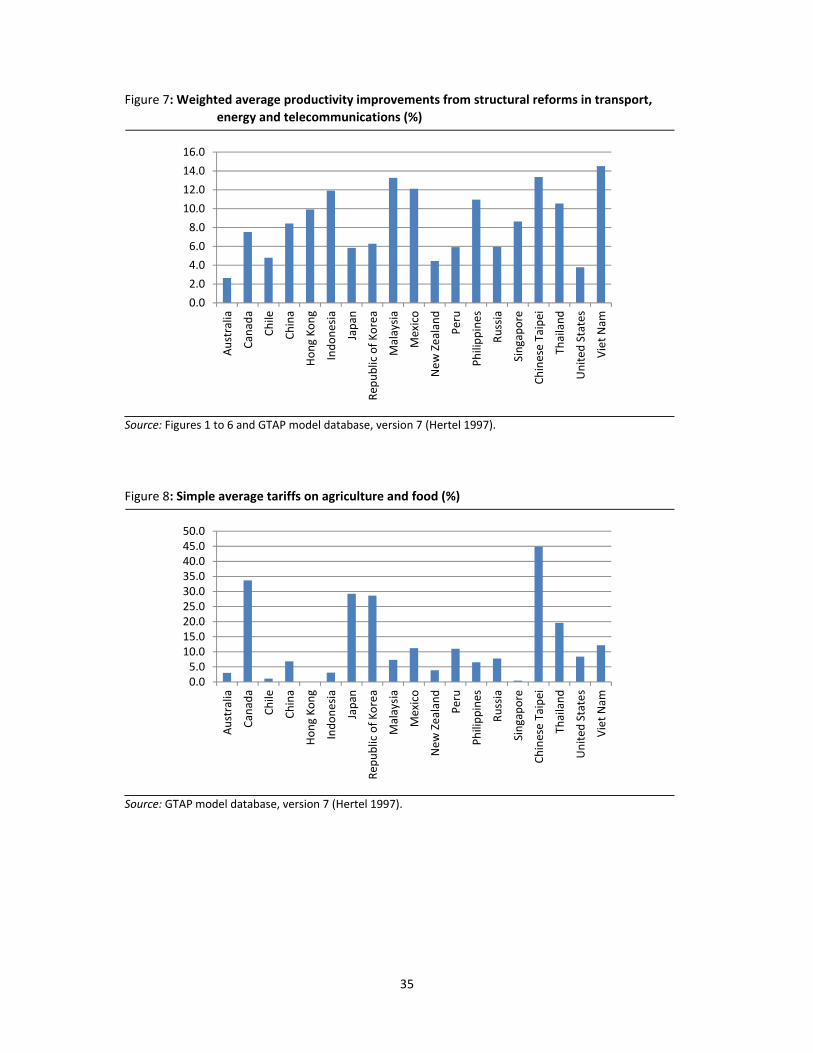
35
Figure 7: Weighted average productivity improvements from structural reforms in transport,
energy and telecommunications (%)
Source: Figures 1 to 6 and GTAP model database, version 7 (Hertel 1997).
Figure 8: Simple average tariffs on agriculture and food (%)
Source: GTAP model database, version 7 (Hertel 1997).
0.0
2.0
4.0
6.0
8.0
10.0
12.0
14.0
16.0
Australia
Canada
Chile
China
Hong Kong
Indonesia
Japan
Rep
ublic of Korea
Malaysia
Mexico
New
Zealand
Peru
Philippines
Russia
Singapore
Chinese Taipei
Thailand
United
States
Viet Nam
0.05.010.015.020.025.030.035.040.045.050.0
Australia
Canada
Chile
China
Hong Kong
Indonesia
Japan
Rep
ublic of Korea
Malaysia
Mexico
New
Zealand
Peru
Philippines
Russia
Singapore
Chinese Taipei
Thailand
United
States
Viet Nam

36
Figure 9: Simple average tariffs on manufacturing (%)
Source: GTAP model database, version 7 (Hertel 1997).
0.0
2.0
4.0
6.0
8.0
10.0
12.0
14.0
Australia
Canada
Chile
China
Hong Kong
Indonesia
Japan
Rep
ublic of Korea
Malaysia
Mexico
New
Zealand
Peru
Philippines
Russia
Singapore
Chinese Taipei
Thailand
United
States
Viet Nam

37
Figure 10: Welfare gains from structural reforms, relative to initial economic size (%)
Source: FTAP model projections.
Figure 11: Gains in real GDP (% deviation from baseline)
Source: FTAP model projections.
0.00
1.00
2.00
3.00
4.00
5.00
6.00
Australia
Canada
Chile
China
Hong Kong
Indonesia
Japan
Rep
ublic of Korea
Malaysia
Mexico
New
Zealand
Peru
Philippines
Russia
Singapore
Chinese Taipei
Thailand
United
States
Viet Nam
0.00
1.00
2.00
3.00
4.00
5.00
6.00
Australia
Canada
Chile
China
Hong Kong
Indonesia
Japan
Rep
ublic of Korea
Malaysia
Mexico
New
Zealand
Peru
Philippines
Russia
Singapore
Chinese Taipei
Thailand
United
States
Viet Nam
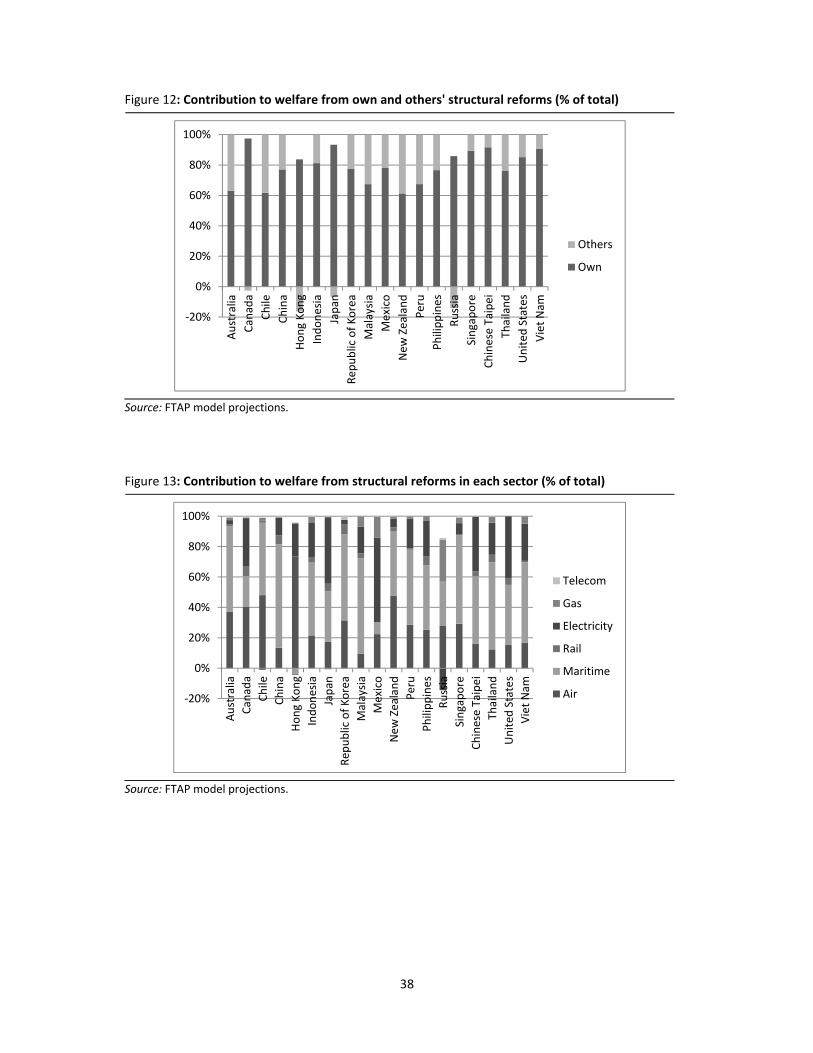
38
Figure 12: Contribution to welfare from own and others' structural reforms (% of total)
Source: FTAP model projections.
Figure 13: Contribution to welfare from structural reforms in each sector (% of total)
Source: FTAP model projections.
‐20%
0%
20%
40%
60%
80%
100%
Australia
Canada
Chile
China
Hong Kong
Indonesia
Japan
Rep
ublic of Korea
Malaysia
Mexico
New
Zealand
Peru
Philippines
Russia
Singapore
Chinese Taipei
Thailand
United
States
Viet Nam
Others
Own
‐20%
0%
20%
40%
60%
80%
100%
Australia
Canada
Chile
China
Hong Kong
Indonesia
Japan
Rep
ublic of Korea
Malaysia
Mexico
New
Zealand
Peru
Philippines
Russia
Singapore
Chinese Taipei
Thailand
United
States
Viet Nam
Telecom
Gas
Electricity
Rail
Maritime
Air
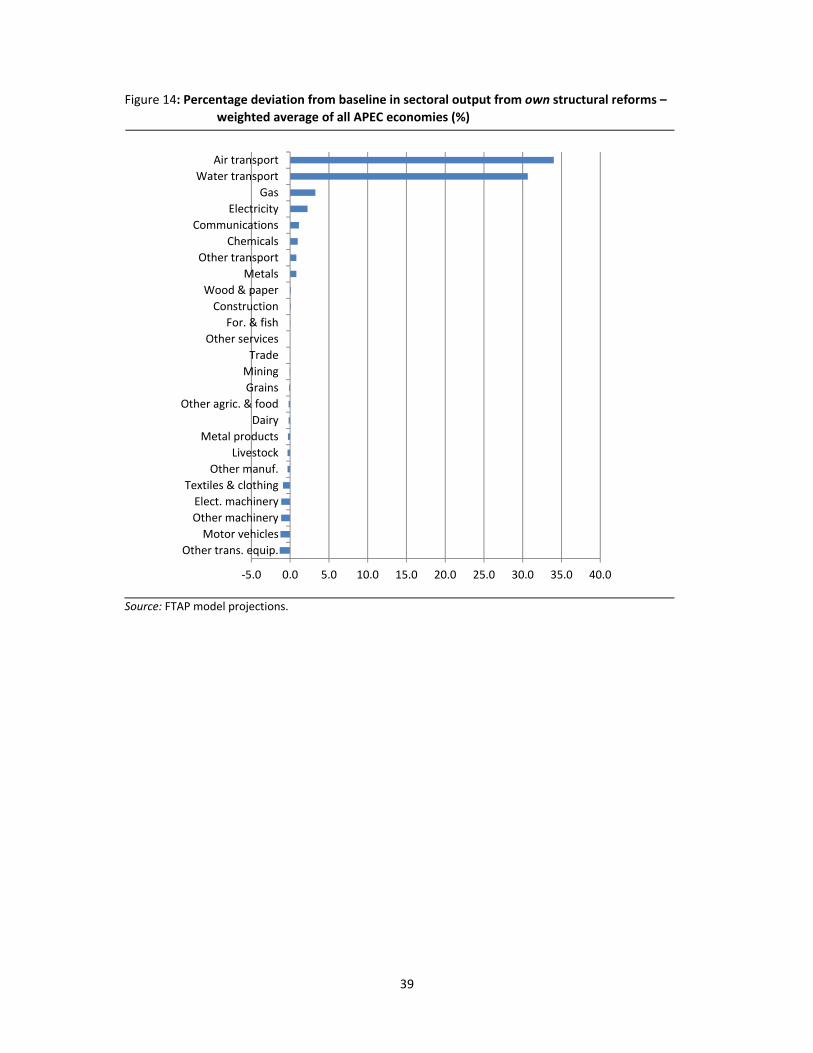
39
Figure 14: Percentage deviation from baseline in sectoral output from own structural reforms –
weighted average of all APEC economies (%)
Source: FTAP model projections.
‐5.0 0.0 5.0 10.0 15.0 20.0 25.0 30.0 35.0 40.0
Other trans. equip.
Motor vehicles
Other machinery
Elect. machinery
Textiles & clothing
Other manuf.
Livestock
Metal products
Dairy
Other agric. & food
Grains
Mining
Trade
Other services
For. & fish
Construction
Wood & paper
Metals
Other transport
Chemicals
Communications
Electricity
Gas
Water transport
Air transport
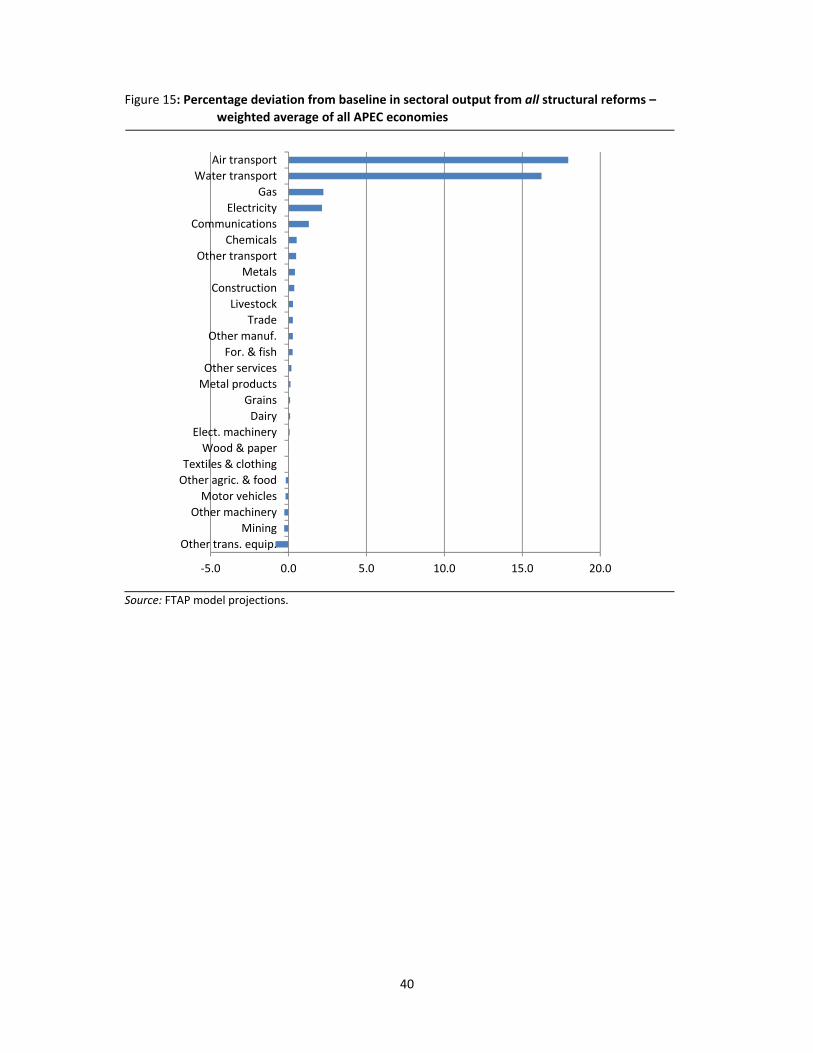
40
Figure 15: Percentage deviation from baseline in sectoral output from all structural reforms –
weighted average of all APEC economies
Source: FTAP model projections.
‐5.0 0.0 5.0 10.0 15.0 20.0
Other trans. equip.
Mining
Other machinery
Motor vehicles
Other agric. & food
Textiles & clothing
Wood & paper
Elect. machinery
Dairy
Grains
Metal products
Other services
For. & fish
Other manuf.
Trade
Livestock
Construction
Metals
Other transport
Chemicals
Communications
Electricity
Gas
Water transport
Air transport
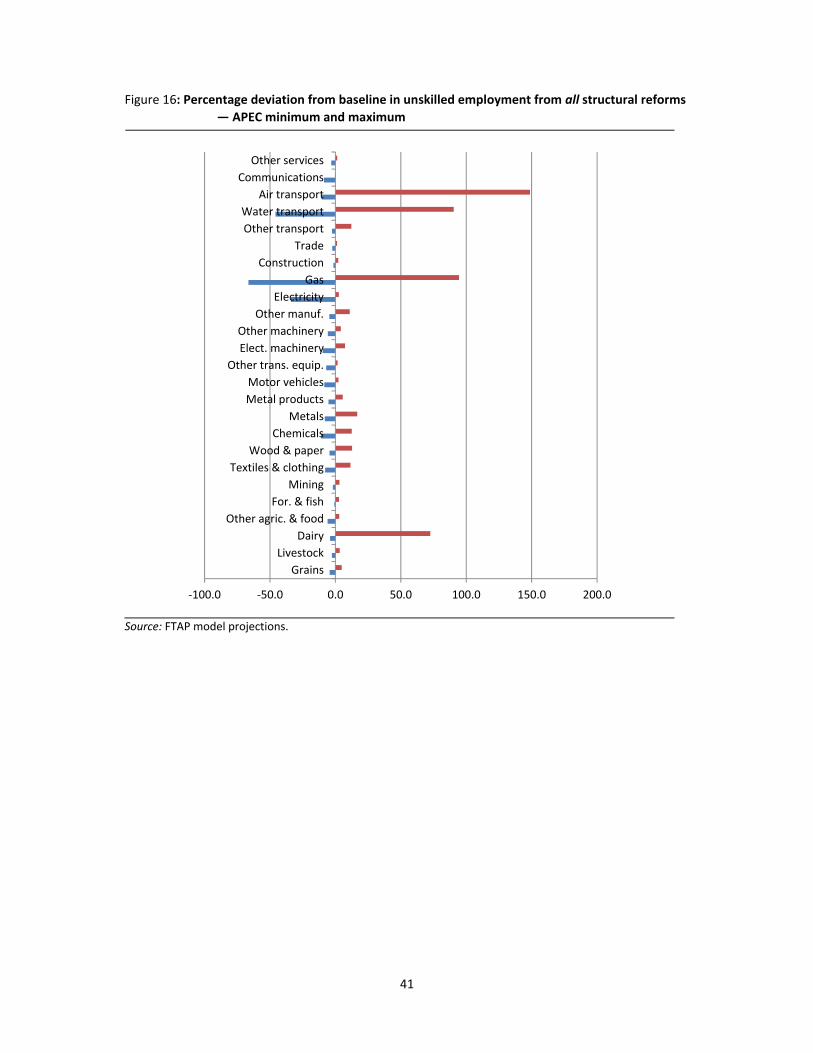
41
Figure 16: Percentage deviation from baseline in unskilled employment from all structural reforms
— APEC minimum and maximum
Source: FTAP model projections.
‐100.0 ‐50.0 0.0 50.0 100.0 150.0 200.0
Grains
Livestock
Dairy
Other agric. & food
For. & fish
Mining
Textiles & clothing
Wood & paper
Chemicals
Metals
Metal products
Motor vehicles
Other trans. equip.
Elect. machinery
Other machinery
Other manuf.
Electricity
Gas
Construction
Trade
Other transport
Water transport
Air transport
Communications
Other services
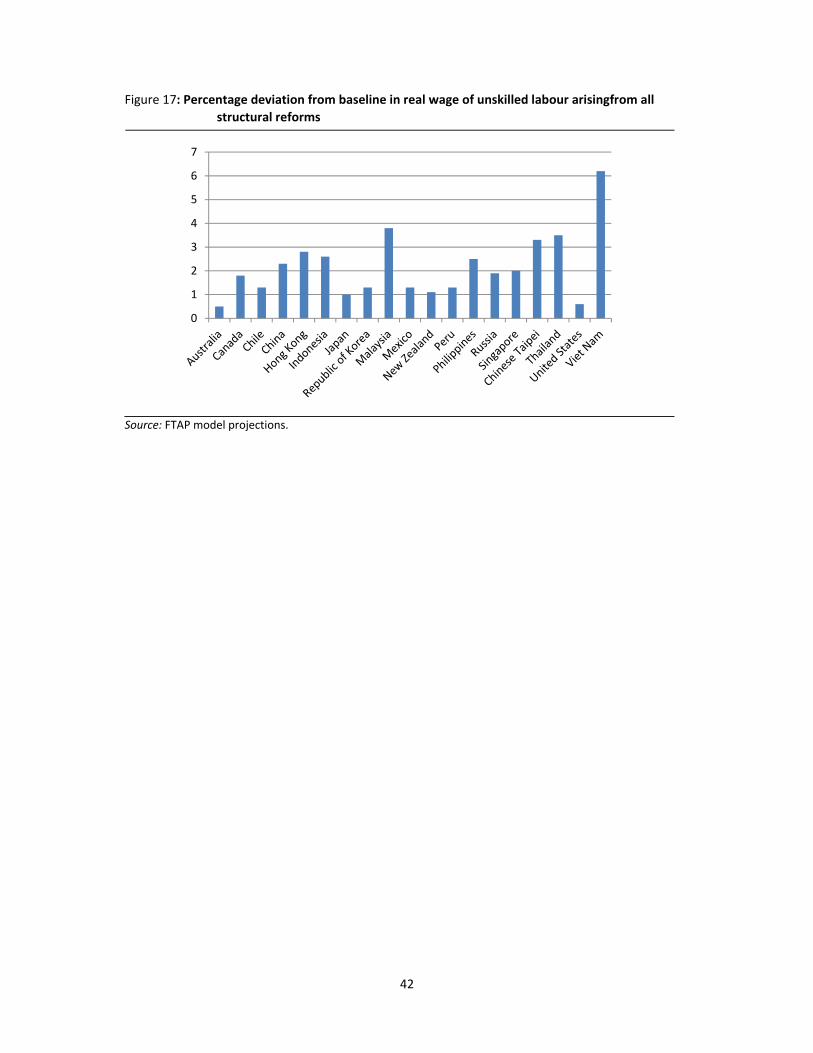
42
Figure 17: Percentage deviation from baseline in real wage of unskilled labour arisingfrom all
structural reforms
Source: FTAP model projections.
0
1
2
3
4
5
6
7
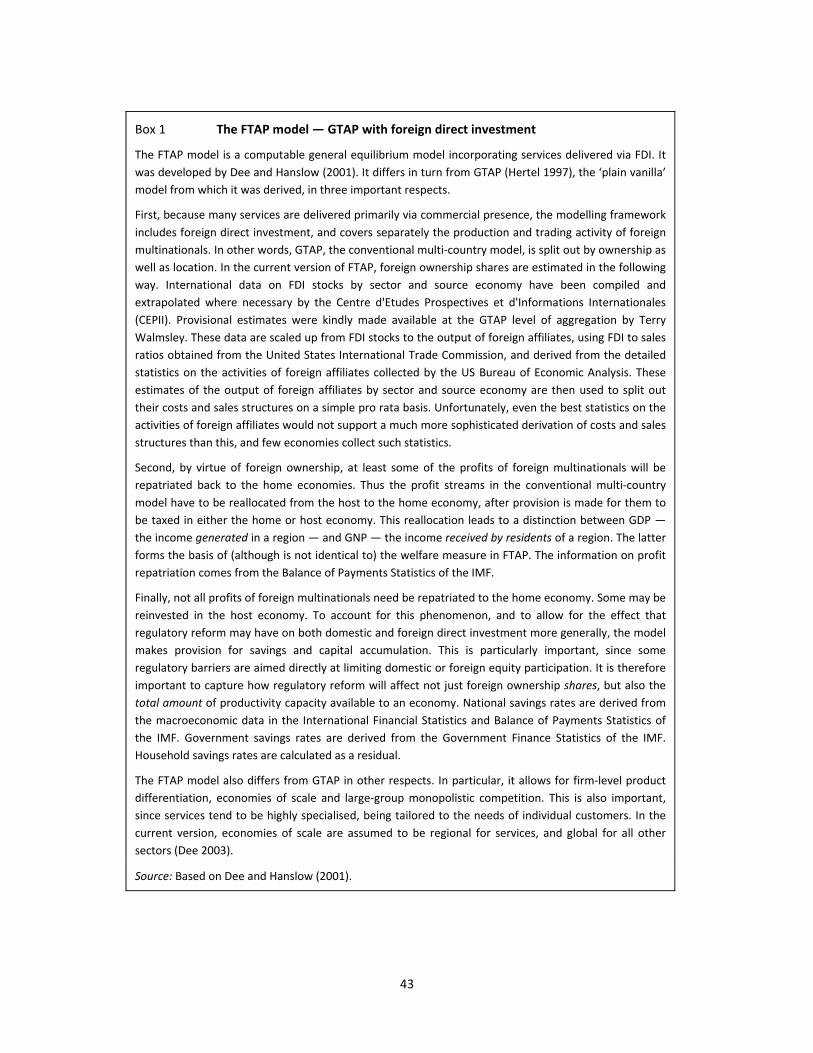
43
Box 1 The FTAP model — GTAP with foreign direct investment
The FTAP model is a computable general equilibrium model incorporating services delivered via FDI. It
was developed by Dee and Hanslow (2001). It differs in turn from GTAP (Hertel 1997), the ‘plain vanilla’
model from which it was derived, in three important respects.
First, because many services are delivered primarily via commercial presence, the modelling framework
includes foreign direct investment, and covers separately the production and trading activity of foreign
multinationals. In other words, GTAP, the conventional multi‐country model, is split out by ownership as
well as location. In the current version of FTAP, foreign ownership shares are estimated in the following
way. International data on FDI stocks by sector and source economy have been compiled and
extrapolated where necessary by the Centre d'Etudes Prospectives et d'Informations Internationales
(CEPII). Provisional estimates were kindly made available at the GTAP level of aggregation by Terry
Walmsley. These data are scaled up from FDI stocks to the output of foreign affiliates, using FDI to sales
ratios obtained from the United States International Trade Commission, and derived from the detailed
statistics on the activities of foreign affiliates collected by the US Bureau of Economic Analysis. These
estimates of the output of foreign affiliates by sector and source economy are then used to split out
their costs and sales structures on a simple pro rata basis. Unfortunately, even the best statistics on the
activities of foreign affiliates would not support a much more sophisticated derivation of costs and sales
structures than this, and few economies collect such statistics.
Second, by virtue of foreign ownership, at least some of the profits of foreign multinationals will be
repatriated back to the home economies. Thus the profit streams in the conventional multi‐country
model have to be reallocated from the host to the home economy, after provision is made for them to
be taxed in either the home or host economy. This reallocation leads to a distinction between GDP —
the income generated in a region — and GNP — the income received by residents of a region. The latter
forms the basis of (although is not identical to) the welfare measure in FTAP. The information on profit
repatriation comes from the Balance of Payments Statistics of the IMF.
Finally, not all profits of foreign multinationals need be repatriated to the home economy. Some may be
reinvested in the host economy. To account for this phenomenon, and to allow for the effect that
regulatory reform may have on both domestic and foreign direct investment more generally, the model
makes provision for savings and capital accumulation. This is particularly important, since some
regulatory barriers are aimed directly at limiting domestic or foreign equity participation. It is therefore
important to capture how regulatory reform will affect not just foreign ownership shares, but also the
total amount of productivity capacity available to an economy. National savings rates are derived from
the macroeconomic data in the International Financial Statistics and Balance of Payments Statistics of
the IMF. Government savings rates are derived from the Government Finance Statistics of the IMF.
Household savings rates are calculated as a residual.
The FTAP model also differs from GTAP in other respects. In particular, it allows for firm‐level product
differentiation, economies of scale and large‐group monopolistic competition. This is also important,
since services tend to be highly specialised, being tailored to the needs of individual customers. In the
current version, economies of scale are assumed to be regional for services, and global for all other
sectors (Dee 2003).
Source: Based on Dee and Hanslow (2001).