The Economist/YouGov Poll List of Tablescdn.yougov.com/cumulus_uploads/document/nvv0jr3qvo/... ·...
49
The Economist /YouGov Poll June 16-18, 2012 List of Tables 1. Attention to election campaign ....................................................................... 2 2. Direction of country ............................................................................. 3 3. Important issue ............................................................................... 4 4. Most important issue ............................................................................ 5 5. Respondents believe these countries have strong economies ...................................................... 7 6. Respondents believe these countries have weak economies ....................................................... 8 7. Awareness of European debt crisis ..................................................................... 9 8. Views on how much European debt crisis is affecting the U.S. economy ................................................. 10 9. Views on Obama administration’s change in deportation policy ...................................................... 11 10. Views on giving illegal immigrants legal status if they go to college ................................................... 12 11. Views on giving illegal immigrants legal status if they join the military .................................................. 13 12. Respondents have a somewhat or very favorable opinion of these individuals ............................................. 14 13. Respondents have a somewhat or very unfavorable opinion of these individuals ............................................ 15 14. Respondents have a somewhat or very favorable opinion of these groups ............................................... 16 15. Respondents have a somewhat or very unfavorable opinion of these groups .............................................. 17 16. Approval of Obama as President ..................................................................... 18 17. Obama approval on issues ........................................................................ 19 18. Approval of U.S. Congress ......................................................................... 20 19. Presidential vote preference: Obama vs. Romney ............................................................ 21 20. Prediction of who will win in November .................................................................. 22 21. 2012 Congressional vote ......................................................................... 23 22. Knowledge of President Obama’s statement about private sector job growth .............................................. 24 23. Knowledge of employment changes in private companies ........................................................ 25 24. Knowledge of employment changes in government jobs ......................................................... 26 25. How well Obama understands economic situation facing most Americans ............................................... 27 26. How well Romney understands economic situation facing most Americans ............................................... 28 27. Respondents believe private sector jobs are better in terms of these matters ............................................. 29 28. Respondents believe government jobs are better in terms of these matters .............................................. 30 29. Respondents strongly or somewhat agree with these immigration-related statements ......................................... 31 30. Respondents strongly or somewhat disagree with these immigration-related statements ....................................... 32 31. Own involvement in Tea Party movement ................................................................. 33 32. Respondent’s ideology ........................................................................... 34 33. Obama’s ideological leanings ....................................................................... 35 34. Romney’s ideological leanings ...................................................................... 36 35. Obama’s sincerity ............................................................................. 37 36. Obama’s likeability ............................................................................. 38 1
Transcript of The Economist/YouGov Poll List of Tablescdn.yougov.com/cumulus_uploads/document/nvv0jr3qvo/... ·...

The Economist /YouGov PollJune 16-18, 2012
List of Tables
1. Attention to election campaign . . . . . . . . . . . . . . . . . . . . . . . . . . . . . . . . . . . . . . . . . . . . . . . . . . . . . . . . . . . . . . . . . . . . . . . 22. Direction of country . . . . . . . . . . . . . . . . . . . . . . . . . . . . . . . . . . . . . . . . . . . . . . . . . . . . . . . . . . . . . . . . . . . . . . . . . . . . . 33. Important issue . . . . . . . . . . . . . . . . . . . . . . . . . . . . . . . . . . . . . . . . . . . . . . . . . . . . . . . . . . . . . . . . . . . . . . . . . . . . . . . 44. Most important issue . . . . . . . . . . . . . . . . . . . . . . . . . . . . . . . . . . . . . . . . . . . . . . . . . . . . . . . . . . . . . . . . . . . . . . . . . . . . 55. Respondents believe these countries have strong economies . . . . . . . . . . . . . . . . . . . . . . . . . . . . . . . . . . . . . . . . . . . . . . . . . . . . . . 76. Respondents believe these countries have weak economies . . . . . . . . . . . . . . . . . . . . . . . . . . . . . . . . . . . . . . . . . . . . . . . . . . . . . . . 87. Awareness of European debt crisis . . . . . . . . . . . . . . . . . . . . . . . . . . . . . . . . . . . . . . . . . . . . . . . . . . . . . . . . . . . . . . . . . . . . . 98. Views on how much European debt crisis is affecting the U.S. economy . . . . . . . . . . . . . . . . . . . . . . . . . . . . . . . . . . . . . . . . . . . . . . . . . 109. Views on Obama administration’s change in deportation policy . . . . . . . . . . . . . . . . . . . . . . . . . . . . . . . . . . . . . . . . . . . . . . . . . . . . . . 1110. Views on giving illegal immigrants legal status if they go to college . . . . . . . . . . . . . . . . . . . . . . . . . . . . . . . . . . . . . . . . . . . . . . . . . . . 1211. Views on giving illegal immigrants legal status if they join the military . . . . . . . . . . . . . . . . . . . . . . . . . . . . . . . . . . . . . . . . . . . . . . . . . . 1312. Respondents have a somewhat or very favorable opinion of these individuals . . . . . . . . . . . . . . . . . . . . . . . . . . . . . . . . . . . . . . . . . . . . . 1413. Respondents have a somewhat or very unfavorable opinion of these individuals . . . . . . . . . . . . . . . . . . . . . . . . . . . . . . . . . . . . . . . . . . . . 1514. Respondents have a somewhat or very favorable opinion of these groups . . . . . . . . . . . . . . . . . . . . . . . . . . . . . . . . . . . . . . . . . . . . . . . 1615. Respondents have a somewhat or very unfavorable opinion of these groups . . . . . . . . . . . . . . . . . . . . . . . . . . . . . . . . . . . . . . . . . . . . . . 1716. Approval of Obama as President . . . . . . . . . . . . . . . . . . . . . . . . . . . . . . . . . . . . . . . . . . . . . . . . . . . . . . . . . . . . . . . . . . . . . 1817. Obama approval on issues . . . . . . . . . . . . . . . . . . . . . . . . . . . . . . . . . . . . . . . . . . . . . . . . . . . . . . . . . . . . . . . . . . . . . . . . 1918. Approval of U.S. Congress . . . . . . . . . . . . . . . . . . . . . . . . . . . . . . . . . . . . . . . . . . . . . . . . . . . . . . . . . . . . . . . . . . . . . . . . . 2019. Presidential vote preference: Obama vs. Romney . . . . . . . . . . . . . . . . . . . . . . . . . . . . . . . . . . . . . . . . . . . . . . . . . . . . . . . . . . . . 2120. Prediction of who will win in November . . . . . . . . . . . . . . . . . . . . . . . . . . . . . . . . . . . . . . . . . . . . . . . . . . . . . . . . . . . . . . . . . . 2221. 2012 Congressional vote . . . . . . . . . . . . . . . . . . . . . . . . . . . . . . . . . . . . . . . . . . . . . . . . . . . . . . . . . . . . . . . . . . . . . . . . . 2322. Knowledge of President Obama’s statement about private sector job growth . . . . . . . . . . . . . . . . . . . . . . . . . . . . . . . . . . . . . . . . . . . . . . 2423. Knowledge of employment changes in private companies . . . . . . . . . . . . . . . . . . . . . . . . . . . . . . . . . . . . . . . . . . . . . . . . . . . . . . . . 2524. Knowledge of employment changes in government jobs . . . . . . . . . . . . . . . . . . . . . . . . . . . . . . . . . . . . . . . . . . . . . . . . . . . . . . . . . 2625. How well Obama understands economic situation facing most Americans . . . . . . . . . . . . . . . . . . . . . . . . . . . . . . . . . . . . . . . . . . . . . . . 2726. How well Romney understands economic situation facing most Americans . . . . . . . . . . . . . . . . . . . . . . . . . . . . . . . . . . . . . . . . . . . . . . . 2827. Respondents believe private sector jobs are better in terms of these matters . . . . . . . . . . . . . . . . . . . . . . . . . . . . . . . . . . . . . . . . . . . . . 2928. Respondents believe government jobs are better in terms of these matters . . . . . . . . . . . . . . . . . . . . . . . . . . . . . . . . . . . . . . . . . . . . . . 3029. Respondents strongly or somewhat agree with these immigration-related statements . . . . . . . . . . . . . . . . . . . . . . . . . . . . . . . . . . . . . . . . . 3130. Respondents strongly or somewhat disagree with these immigration-related statements . . . . . . . . . . . . . . . . . . . . . . . . . . . . . . . . . . . . . . . 3231. Own involvement in Tea Party movement . . . . . . . . . . . . . . . . . . . . . . . . . . . . . . . . . . . . . . . . . . . . . . . . . . . . . . . . . . . . . . . . . 3332. Respondent’s ideology . . . . . . . . . . . . . . . . . . . . . . . . . . . . . . . . . . . . . . . . . . . . . . . . . . . . . . . . . . . . . . . . . . . . . . . . . . . 3433. Obama’s ideological leanings . . . . . . . . . . . . . . . . . . . . . . . . . . . . . . . . . . . . . . . . . . . . . . . . . . . . . . . . . . . . . . . . . . . . . . . 3534. Romney’s ideological leanings . . . . . . . . . . . . . . . . . . . . . . . . . . . . . . . . . . . . . . . . . . . . . . . . . . . . . . . . . . . . . . . . . . . . . . 3635. Obama’s sincerity . . . . . . . . . . . . . . . . . . . . . . . . . . . . . . . . . . . . . . . . . . . . . . . . . . . . . . . . . . . . . . . . . . . . . . . . . . . . . 3736. Obama’s likeability . . . . . . . . . . . . . . . . . . . . . . . . . . . . . . . . . . . . . . . . . . . . . . . . . . . . . . . . . . . . . . . . . . . . . . . . . . . . . 38
1

The Economist /YouGov PollJune 16-18, 2012
37. Romney’s sincerity . . . . . . . . . . . . . . . . . . . . . . . . . . . . . . . . . . . . . . . . . . . . . . . . . . . . . . . . . . . . . . . . . . . . . . . . . . . . . 3938. Romney’s likeability . . . . . . . . . . . . . . . . . . . . . . . . . . . . . . . . . . . . . . . . . . . . . . . . . . . . . . . . . . . . . . . . . . . . . . . . . . . . 4039. Which of these words to describe Barack Obama . . . . . . . . . . . . . . . . . . . . . . . . . . . . . . . . . . . . . . . . . . . . . . . . . . . . . . . . . . . . 4140. Which of these words to describe Mitt Romney . . . . . . . . . . . . . . . . . . . . . . . . . . . . . . . . . . . . . . . . . . . . . . . . . . . . . . . . . . . . . . 4341. Trend of economy . . . . . . . . . . . . . . . . . . . . . . . . . . . . . . . . . . . . . . . . . . . . . . . . . . . . . . . . . . . . . . . . . . . . . . . . . . . . . 4542. Stock market expectations over next year . . . . . . . . . . . . . . . . . . . . . . . . . . . . . . . . . . . . . . . . . . . . . . . . . . . . . . . . . . . . . . . . . 4643. Change in personal finances over past year . . . . . . . . . . . . . . . . . . . . . . . . . . . . . . . . . . . . . . . . . . . . . . . . . . . . . . . . . . . . . . . 47
2

The Economist /YouGov PollJune 16-18, 2012
1. Attention to election campaignHow closely have you been following news about the 2012 presidential election campaign?
Age Race Gender Education
Total 18-29 30-64 65+ White Black Hispanic Male Female HS or less Some college College graduate
Very closely 33% 18% 35% 42% 34% 27% 24% 38% 27% 23% 31% 49%Somewhat closely 33% 34% 32% 32% 33% 25% 35% 33% 33% 28% 38% 35%Not too closely 24% 32% 21% 24% 24% 32% 19% 20% 28% 33% 22% 12%Not at all 11% 16% 12% 1% 9% 16% 22% 9% 13% 16% 10% 3%
Totals 100% 100% 100% 100% 100% 100% 100% 100% 100% 100% 100% 100%(Unweighted) (999) (121) (713) (165) (799) (123) (77) (463) (536) (364) (331) (304)
Party ID Ideology Region Family Income
Total Dem Rep Ind Lib Mod Con Northeast Midwest South West Under 40 40-100 100+
Very closely 33% 29% 42% 36% 40% 29% 45% 38% 24% 34% 34% 23% 41% 52%Somewhat closely 33% 36% 33% 36% 40% 40% 29% 29% 33% 33% 34% 27% 34% 38%Not too closely 24% 23% 20% 21% 13% 21% 23% 21% 27% 24% 23% 33% 19% 10%Not at all 11% 12% 4% 7% 7% 9% 2% 12% 16% 9% 9% 16% 6% 0%
Totals 100% 100% 100% 100% 100% 100% 100% 100% 100% 100% 100% 100% 100% 100%(Unweighted) (999) (368) (260) (296) (207) (357) (317) (174) (235) (380) (210) (378) (388) (139)
3

The Economist /YouGov PollJune 16-18, 2012
2. Direction of countryWould you say things in this country today are...
Age Race Gender Education
Total 18-29 30-64 65+ White Black Hispanic Male Female HS or less Some college College graduate
Generally headed in theright direction 26% 30% 25% 25% 23% 44% 33% 26% 25% 22% 27% 31%Off on the wrong track 58% 50% 61% 58% 63% 24% 52% 58% 58% 60% 55% 59%Not sure 16% 20% 14% 18% 14% 31% 15% 16% 16% 18% 18% 11%
Totals 100% 100% 100% 100% 100% 100% 100% 100% 100% 100% 100% 100%(Unweighted) (998) (121) (713) (164) (799) (122) (77) (463) (535) (365) (329) (304)
Party ID Ideology Region Family Income
Total Dem Rep Ind Lib Mod Con Northeast Midwest South West Under 40 40-100 100+
Generally headed in theright direction 26% 47% 6% 24% 57% 35% 6% 31% 30% 20% 28% 23% 28% 30%Off on the wrong track 58% 34% 87% 63% 29% 47% 90% 55% 52% 63% 59% 58% 59% 65%Not sure 16% 19% 6% 13% 14% 19% 4% 14% 18% 17% 13% 19% 13% 6%
Totals 100% 100% 100% 100% 100% 100% 100% 100% 100% 100% 100% 100% 100% 100%(Unweighted) (998) (366) (260) (297) (207) (355) (318) (174) (235) (381) (208) (377) (387) (140)
4

The Economist /YouGov PollJune 16-18, 2012
3. Important issueHow important are the following issues to you?
Age Race Gender Education
Total 18-29 30-64 65+ White Black Hispanic Male Female HS or less Some college College graduate
The economy 95% 86% 98% 99% 96% 96% 94% 95% 96% 94% 95% 99%Immigration 75% 68% 73% 90% 77% 71% 62% 73% 76% 82% 69% 71%The environment 76% 72% 76% 79% 76% 82% 67% 74% 78% 81% 71% 72%Terrorism 80% 64% 82% 90% 80% 80% 79% 78% 82% 86% 75% 76%Gay rights 42% 50% 41% 38% 44% 40% 29% 39% 45% 36% 46% 48%Education 87% 85% 88% 85% 86% 89% 87% 83% 91% 85% 86% 90%Health care 91% 82% 92% 97% 91% 91% 83% 87% 94% 92% 87% 92%Social security 88% 63% 93% 99% 88% 90% 85% 86% 90% 92% 82% 89%The budget deficit 86% 77% 87% 94% 87% 81% 81% 86% 87% 89% 81% 87%The war in Afghanistan 73% 64% 73% 81% 74% 67% 70% 68% 77% 75% 71% 71%Taxes 89% 81% 90% 96% 90% 91% 83% 88% 90% 91% 87% 89%Medicare 85% 70% 86% 100% 86% 92% 74% 81% 89% 90% 83% 81%Abortion 58% 57% 56% 64% 59% 59% 40% 49% 67% 61% 53% 58%
Totals (998) (120) (713) (165) (799) (122) (77) (462) (536) (364) (330) (304)
Party ID Ideology Region Family Income
Total Dem Rep Ind Lib Mod Con Northeast Midwest South West Under 40 40-100 100+
The economy 95% 98% 97% 94% 95% 97% 96% 97% 96% 94% 96% 95% 96% 95%Immigration 75% 70% 83% 75% 58% 71% 88% 72% 74% 78% 73% 79% 72% 74%The environment 76% 86% 58% 78% 90% 78% 62% 74% 82% 70% 81% 83% 72% 72%Terrorism 80% 77% 90% 76% 60% 79% 89% 79% 80% 81% 79% 82% 78% 86%Gay rights 42% 53% 25% 44% 75% 46% 23% 40% 52% 34% 47% 43% 41% 45%Education 87% 90% 84% 88% 93% 90% 82% 86% 85% 88% 87% 88% 87% 83%Health care 91% 94% 88% 90% 92% 93% 88% 93% 95% 85% 93% 92% 91% 95%Social security 88% 89% 88% 87% 88% 91% 85% 91% 87% 86% 89% 89% 88% 88%The budget deficit 86% 83% 94% 86% 73% 85% 94% 85% 88% 86% 85% 89% 86% 81%The war in Afghanistan 73% 73% 79% 71% 71% 72% 75% 73% 79% 68% 74% 77% 68% 80%Taxes 89% 87% 98% 86% 84% 88% 94% 91% 92% 87% 90% 91% 90% 86%Medicare 85% 90% 82% 86% 84% 90% 79% 86% 87% 84% 85% 89% 82% 87%Abortion 58% 54% 64% 56% 57% 53% 62% 53% 63% 56% 59% 61% 55% 61%
Totals (998) (367) (260) (297) (207) (356) (318) (173) (235) (380) (210) (378) (388) (140)
5

The Economist /YouGov PollJune 16-18, 2012
4. Most important issueWhich of these is the most important issue for you?
Age Race Gender Education
Total 18-29 30-64 65+ White Black Hispanic Male Female HS or less Some college College graduate
The economy 39% 40% 44% 22% 37% 49% 50% 44% 35% 37% 43% 38%Immigration 4% 5% 3% 5% 4% 8% 2% 5% 3% 5% 4% 2%The environment 4% 12% 3% 0% 5% 0% 1% 6% 3% 4% 7% 1%Terrorism 1% 1% 1% 0% 1% 2% 0% 0% 1% 0% 1% 1%Gay rights 2% 6% 2% 0% 3% 1% 0% 3% 2% 1% 4% 3%Education 6% 13% 4% 3% 4% 7% 16% 2% 9% 2% 10% 6%Health care 12% 5% 14% 16% 12% 14% 12% 9% 16% 11% 9% 19%Social security 14% 0% 12% 33% 15% 9% 7% 14% 13% 24% 7% 4%The budget deficit 8% 5% 8% 10% 9% 4% 5% 10% 7% 5% 7% 14%The war in Afghanistan 1% 0% 1% 1% 1% 0% 0% 1% 1% 2% 0% 1%Taxes 3% 2% 3% 2% 3% 3% 2% 3% 3% 1% 3% 5%Medicare 2% 0% 2% 7% 2% 3% 1% 2% 3% 4% 2% 0%Abortion 4% 12% 3% 0% 4% 1% 4% 2% 6% 4% 3% 5%
Totals 100% 100% 100% 100% 100% 100% 100% 100% 100% 100% 100% 100%(Unweighted) (964) (109) (691) (164) (777) (116) (71) (446) (518) (354) (318) (292)
Party ID Ideology Region Family Income
Total Dem Rep Ind Lib Mod Con Northeast Midwest South West Under 40 40-100 100+
The economy 39% 38% 41% 41% 32% 44% 44% 43% 40% 41% 32% 36% 41% 37%Immigration 4% 1% 5% 3% 0% 3% 4% 6% 1% 5% 3% 5% 3% 2%The environment 4% 4% 0% 7% 11% 6% 0% 4% 5% 3% 5% 4% 4% 5%Terrorism 1% 1% 1% 1% 0% 1% 1% 1% 1% 0% 1% 1% 1% 1%Gay rights 2% 3% 1% 3% 7% 4% 0% 4% 3% 1% 3% 1% 4% 3%Education 6% 9% 4% 5% 11% 7% 2% 3% 5% 4% 12% 7% 4% 5%Health care 12% 17% 7% 10% 21% 14% 8% 9% 12% 14% 14% 12% 10% 21%Social security 14% 16% 10% 12% 9% 12% 10% 12% 16% 16% 9% 21% 10% 2%The budget deficit 8% 4% 15% 8% 2% 5% 16% 9% 8% 7% 9% 6% 10% 13%The war in Afghanistan 1% 1% 0% 2% 1% 1% 0% 1% 0% 2% 1% 1% 1% 2%Taxes 3% 2% 5% 2% 2% 2% 4% 2% 2% 3% 4% 1% 5% 1%Medicare 2% 3% 3% 1% 2% 1% 1% 3% 4% 2% 1% 2% 3% 0%Abortion 4% 1% 7% 6% 1% 1% 9% 4% 4% 3% 6% 3% 4% 7%
continued on the next page . . .
6

The Economist /YouGov PollJune 16-18, 2012
continued from previous pageParty ID Ideology Region Family Income
Total Dem Rep Ind Lib Mod Con Northeast Midwest South West Under 40 40-100 100+
Totals 100% 100% 100% 100% 100% 100% 100% 100% 100% 100% 100% 100% 100% 100%(Unweighted) (964) (356) (255) (284) (198) (345) (312) (172) (230) (361) (201) (362) (376) (139)
7

The Economist /YouGov PollJune 16-18, 2012
5. Respondents believe these countries have strong economiesDo you think the economies of the following countries are....
Age Race Gender Education
Total 18-29 30-64 65+ White Black Hispanic Male Female HS or less Some college College graduate
China 61% 70% 57% 63% 63% 60% 46% 65% 57% 49% 68% 72%Spain 10% 18% 7% 8% 8% 19% 15% 6% 14% 11% 11% 6%Germany 47% 52% 45% 51% 49% 39% 38% 52% 43% 34% 48% 66%Canada 50% 50% 46% 64% 51% 48% 40% 55% 46% 46% 48% 59%Greece 6% 10% 5% 5% 6% 14% 4% 1% 11% 9% 7% 1%Mexico 9% 10% 7% 15% 8% 17% 8% 10% 9% 10% 8% 9%Great Britain 30% 42% 26% 31% 30% 31% 30% 29% 31% 24% 36% 33%
Totals (997) (120) (712) (165) (799) (121) (77) (462) (535) (363) (330) (304)
Party ID Ideology Region Family Income
Total Dem Rep Ind Lib Mod Con Northeast Midwest South West Under 40 40-100 100+
China 61% 57% 60% 72% 75% 63% 69% 65% 54% 63% 62% 54% 68% 66%Spain 10% 13% 6% 11% 7% 12% 11% 9% 9% 11% 9% 14% 8% 8%Germany 47% 41% 46% 59% 59% 52% 53% 51% 41% 46% 54% 40% 51% 71%Canada 50% 50% 46% 58% 65% 50% 51% 64% 42% 46% 55% 46% 56% 51%Greece 6% 8% 5% 6% 5% 6% 8% 8% 7% 6% 4% 10% 3% 7%Mexico 9% 9% 7% 12% 9% 11% 10% 9% 6% 10% 13% 12% 7% 6%Great Britain 30% 33% 31% 33% 39% 32% 31% 29% 29% 32% 30% 32% 30% 20%
Totals (997) (366) (260) (297) (207) (356) (318) (173) (235) (379) (210) (377) (388) (140)
8

The Economist /YouGov PollJune 16-18, 2012
6. Respondents believe these countries have weak economiesDo you think the economies of the following countries are....
Age Race Gender Education
Total 18-29 30-64 65+ White Black Hispanic Male Female HS or less Some college College graduate
China 7% 7% 8% 7% 7% 5% 12% 6% 9% 10% 6% 4%Spain 53% 40% 56% 58% 57% 32% 42% 65% 41% 36% 58% 73%Germany 13% 12% 13% 13% 12% 14% 17% 12% 13% 13% 17% 7%Canada 5% 5% 6% 3% 5% 4% 12% 7% 4% 6% 6% 3%Greece 68% 67% 67% 69% 72% 48% 50% 78% 58% 51% 72% 90%Mexico 46% 36% 50% 47% 48% 34% 48% 48% 45% 37% 51% 55%Great Britain 23% 15% 23% 30% 24% 13% 26% 26% 19% 20% 18% 32%
Totals (997) (120) (712) (165) (799) (121) (77) (462) (535) (363) (330) (304)
Party ID Ideology Region Family Income
Total Dem Rep Ind Lib Mod Con Northeast Midwest South West Under 40 40-100 100+
China 7% 9% 9% 6% 6% 9% 7% 9% 6% 7% 8% 7% 7% 10%Spain 53% 43% 64% 63% 52% 60% 61% 54% 43% 51% 67% 36% 65% 75%Germany 13% 15% 15% 11% 9% 17% 11% 8% 14% 13% 16% 11% 14% 8%Canada 5% 4% 8% 6% 3% 4% 7% 3% 6% 5% 6% 5% 6% 4%Greece 68% 56% 76% 81% 72% 76% 75% 65% 58% 70% 77% 53% 80% 83%Mexico 46% 45% 55% 44% 46% 50% 52% 46% 37% 48% 55% 36% 55% 61%Great Britain 23% 19% 27% 23% 17% 24% 26% 27% 18% 19% 31% 17% 24% 39%
Totals (997) (366) (260) (297) (207) (356) (318) (173) (235) (379) (210) (377) (388) (140)
9

The Economist /YouGov PollJune 16-18, 2012
7. Awareness of European debt crisisHow much have you heard or read about the European debt crisis?
Age Race Gender Education
Total 18-29 30-64 65+ White Black Hispanic Male Female HS or less Some college College graduate
A lot 30% 21% 32% 31% 31% 26% 25% 40% 20% 17% 29% 52%A little 49% 61% 44% 52% 51% 41% 45% 48% 50% 50% 53% 42%Nothing at all 21% 17% 24% 16% 19% 33% 30% 12% 30% 33% 17% 6%
Totals 100% 100% 100% 100% 100% 100% 100% 100% 100% 100% 100% 100%(Unweighted) (998) (121) (714) (163) (798) (123) (77) (463) (535) (364) (331) (303)
Party ID Ideology Region Family Income
Total Dem Rep Ind Lib Mod Con Northeast Midwest South West Under 40 40-100 100+
A lot 30% 22% 33% 42% 31% 32% 39% 32% 24% 31% 33% 19% 39% 50%A little 49% 52% 52% 44% 57% 51% 48% 50% 49% 49% 49% 50% 48% 45%Nothing at all 21% 26% 15% 14% 12% 17% 13% 19% 27% 20% 18% 31% 13% 5%
Totals 100% 100% 100% 100% 100% 100% 100% 100% 100% 100% 100% 100% 100% 100%(Unweighted) (998) (368) (260) (295) (207) (356) (317) (173) (235) (380) (210) (378) (386) (140)
10
The Economist /YouGov PollJune 16-18, 2012
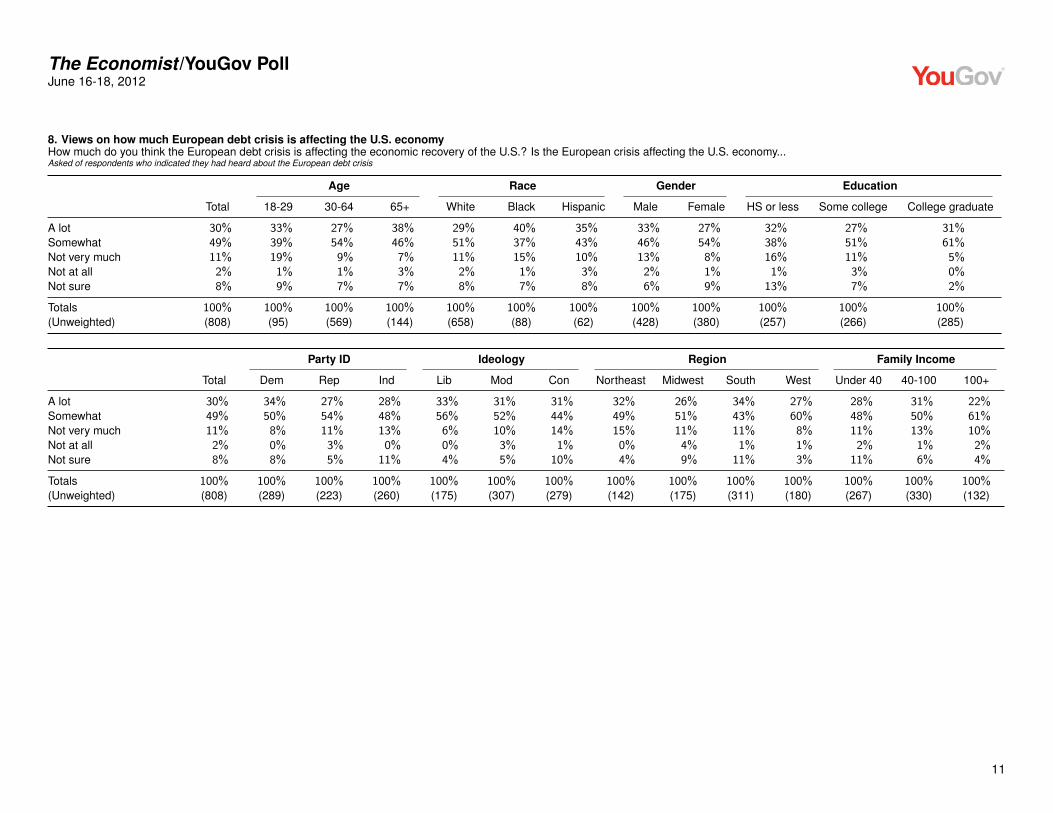
8. Views on how much European debt crisis is affecting the U.S. economyHow much do you think the European debt crisis is affecting the economic recovery of the U.S.? Is the European crisis affecting the U.S. economy...Asked of respondents who indicated they had heard about the European debt crisis
Age Race Gender Education
Total 18-29 30-64 65+ White Black Hispanic Male Female HS or less Some college College graduate
A lot 30% 33% 27% 38% 29% 40% 35% 33% 27% 32% 27% 31%Somewhat 49% 39% 54% 46% 51% 37% 43% 46% 54% 38% 51% 61%Not very much 11% 19% 9% 7% 11% 15% 10% 13% 8% 16% 11% 5%Not at all 2% 1% 1% 3% 2% 1% 3% 2% 1% 1% 3% 0%Not sure 8% 9% 7% 7% 8% 7% 8% 6% 9% 13% 7% 2%
Totals 100% 100% 100% 100% 100% 100% 100% 100% 100% 100% 100% 100%(Unweighted) (808) (95) (569) (144) (658) (88) (62) (428) (380) (257) (266) (285)
Party ID Ideology Region Family Income
Total Dem Rep Ind Lib Mod Con Northeast Midwest South West Under 40 40-100 100+
A lot 30% 34% 27% 28% 33% 31% 31% 32% 26% 34% 27% 28% 31% 22%Somewhat 49% 50% 54% 48% 56% 52% 44% 49% 51% 43% 60% 48% 50% 61%Not very much 11% 8% 11% 13% 6% 10% 14% 15% 11% 11% 8% 11% 13% 10%Not at all 2% 0% 3% 0% 0% 3% 1% 0% 4% 1% 1% 2% 1% 2%Not sure 8% 8% 5% 11% 4% 5% 10% 4% 9% 11% 3% 11% 6% 4%
Totals 100% 100% 100% 100% 100% 100% 100% 100% 100% 100% 100% 100% 100% 100%(Unweighted) (808) (289) (223) (260) (175) (307) (279) (142) (175) (311) (180) (267) (330) (132)
11
The Economist /YouGov PollJune 16-18, 2012
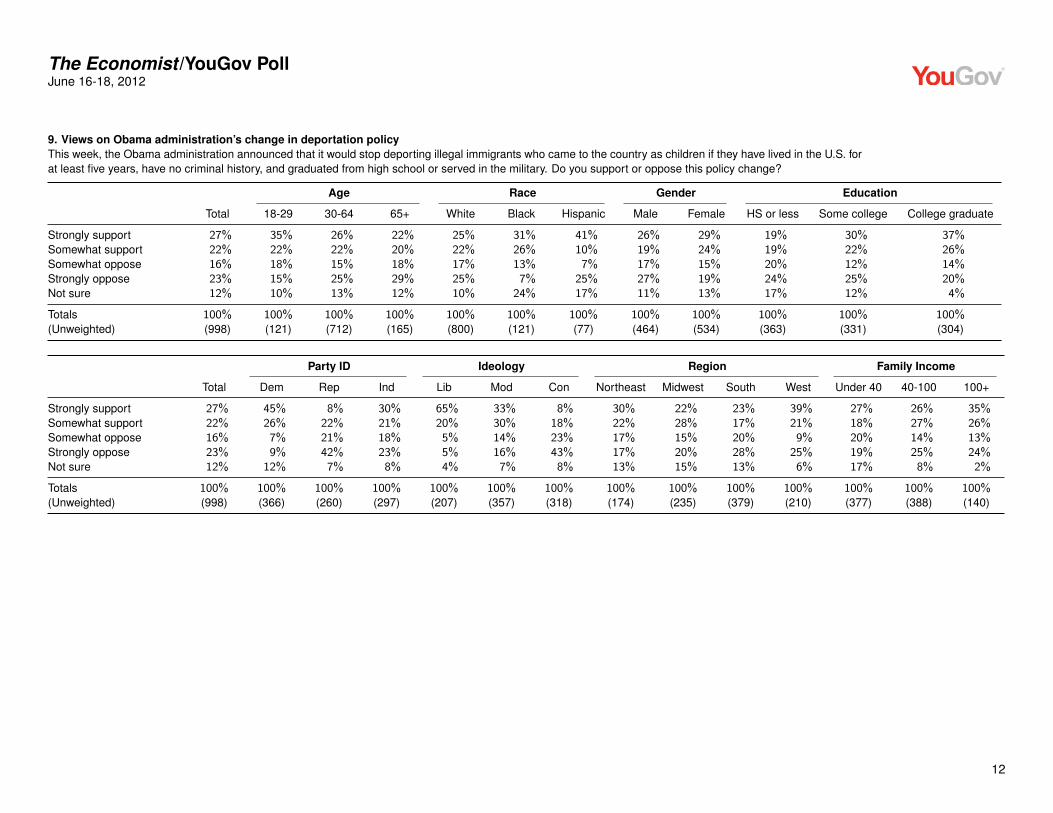
9. Views on Obama administration’s change in deportation policyThis week, the Obama administration announced that it would stop deporting illegal immigrants who came to the country as children if they have lived in the U.S. forat least five years, have no criminal history, and graduated from high school or served in the military. Do you support or oppose this policy change?
Age Race Gender Education
Total 18-29 30-64 65+ White Black Hispanic Male Female HS or less Some college College graduate
Strongly support 27% 35% 26% 22% 25% 31% 41% 26% 29% 19% 30% 37%Somewhat support 22% 22% 22% 20% 22% 26% 10% 19% 24% 19% 22% 26%Somewhat oppose 16% 18% 15% 18% 17% 13% 7% 17% 15% 20% 12% 14%Strongly oppose 23% 15% 25% 29% 25% 7% 25% 27% 19% 24% 25% 20%Not sure 12% 10% 13% 12% 10% 24% 17% 11% 13% 17% 12% 4%
Totals 100% 100% 100% 100% 100% 100% 100% 100% 100% 100% 100% 100%(Unweighted) (998) (121) (712) (165) (800) (121) (77) (464) (534) (363) (331) (304)
Party ID Ideology Region Family Income
Total Dem Rep Ind Lib Mod Con Northeast Midwest South West Under 40 40-100 100+
Strongly support 27% 45% 8% 30% 65% 33% 8% 30% 22% 23% 39% 27% 26% 35%Somewhat support 22% 26% 22% 21% 20% 30% 18% 22% 28% 17% 21% 18% 27% 26%Somewhat oppose 16% 7% 21% 18% 5% 14% 23% 17% 15% 20% 9% 20% 14% 13%Strongly oppose 23% 9% 42% 23% 5% 16% 43% 17% 20% 28% 25% 19% 25% 24%Not sure 12% 12% 7% 8% 4% 7% 8% 13% 15% 13% 6% 17% 8% 2%
Totals 100% 100% 100% 100% 100% 100% 100% 100% 100% 100% 100% 100% 100% 100%(Unweighted) (998) (366) (260) (297) (207) (357) (318) (174) (235) (379) (210) (377) (388) (140)
12

The Economist /YouGov PollJune 16-18, 2012
10. Views on giving illegal immigrants legal status if they go to collegePassing a law that would allow illegal immigrants brought to the U.S. as children to gain legal resident status if they go to college
Age Race Gender Education
Total 18-29 30-64 65+ White Black Hispanic Male Female HS or less Some college College graduate
Strongly support 22% 30% 22% 15% 20% 29% 34% 22% 23% 16% 23% 32%Somewhat support 22% 21% 21% 24% 23% 23% 13% 22% 21% 17% 22% 29%Somewhat oppose 17% 18% 15% 20% 18% 17% 8% 16% 18% 23% 15% 9%Strongly oppose 27% 19% 30% 29% 29% 12% 30% 29% 25% 30% 26% 24%Not sure 12% 12% 11% 11% 10% 19% 15% 11% 12% 14% 14% 6%
Totals 100% 100% 100% 100% 100% 100% 100% 100% 100% 100% 100% 100%(Unweighted) (999) (121) (713) (165) (800) (122) (77) (464) (535) (364) (331) (304)
Party ID Ideology Region Family Income
Total Dem Rep Ind Lib Mod Con Northeast Midwest South West Under 40 40-100 100+
Strongly support 22% 37% 7% 24% 49% 26% 9% 22% 21% 18% 34% 23% 20% 28%Somewhat support 22% 25% 22% 25% 26% 29% 17% 23% 23% 20% 23% 19% 28% 26%Somewhat oppose 17% 10% 20% 18% 6% 17% 21% 23% 15% 19% 10% 22% 14% 12%Strongly oppose 27% 13% 43% 26% 10% 20% 48% 19% 26% 32% 27% 24% 29% 28%Not sure 12% 15% 8% 7% 9% 9% 6% 13% 15% 12% 6% 12% 9% 7%
Totals 100% 100% 100% 100% 100% 100% 100% 100% 100% 100% 100% 100% 100% 100%(Unweighted) (999) (367) (260) (297) (207) (357) (318) (174) (235) (380) (210) (378) (388) (140)
13

The Economist /YouGov PollJune 16-18, 2012
11. Views on giving illegal immigrants legal status if they join the militaryPassing a law that would allow illegal immigrants brought to the U.S. as children to gain legal resident status if they join the military
Age Race Gender Education
Total 18-29 30-64 65+ White Black Hispanic Male Female HS or less Some college College graduate
Strongly support 31% 32% 32% 29% 31% 31% 32% 35% 28% 22% 32% 45%Somewhat support 27% 34% 24% 32% 28% 22% 29% 27% 28% 25% 28% 30%Somewhat oppose 13% 17% 12% 13% 13% 21% 8% 8% 18% 18% 12% 8%Strongly oppose 17% 9% 21% 15% 18% 13% 13% 19% 15% 20% 16% 13%Not sure 11% 8% 12% 12% 10% 13% 18% 10% 12% 15% 12% 3%
Totals 100% 100% 100% 100% 100% 100% 100% 100% 100% 100% 100% 100%(Unweighted) (998) (121) (712) (165) (799) (122) (77) (464) (534) (363) (331) (304)
Party ID Ideology Region Family Income
Total Dem Rep Ind Lib Mod Con Northeast Midwest South West Under 40 40-100 100+
Strongly support 31% 46% 21% 31% 57% 36% 20% 35% 31% 26% 39% 25% 36% 42%Somewhat support 27% 24% 27% 34% 24% 34% 29% 22% 26% 28% 33% 29% 30% 28%Somewhat oppose 13% 8% 19% 13% 7% 11% 19% 13% 14% 15% 11% 17% 9% 16%Strongly oppose 17% 9% 27% 14% 6% 12% 26% 16% 17% 19% 13% 16% 18% 11%Not sure 11% 12% 6% 7% 7% 6% 6% 14% 13% 12% 5% 14% 8% 3%
Totals 100% 100% 100% 100% 100% 100% 100% 100% 100% 100% 100% 100% 100% 100%(Unweighted) (998) (367) (259) (297) (207) (357) (317) (173) (235) (380) (210) (377) (388) (140)
14

The Economist /YouGov PollJune 16-18, 2012
12. Respondents have a somewhat or very favorable opinion of these individualsDo you have a favorable or an unfavorable opinion of the following people?
Age Race Gender Education
Total 18-29 30-64 65+ White Black Hispanic Male Female HS or less Some college College graduate
Barack Obama 47% 56% 45% 45% 43% 78% 45% 47% 47% 43% 52% 48%Mitt Romney 38% 29% 36% 53% 42% 13% 32% 44% 33% 37% 36% 42%Joe Biden 42% 46% 39% 44% 39% 54% 47% 42% 41% 36% 46% 45%Hillary Clinton 53% 49% 53% 58% 51% 66% 56% 51% 56% 52% 52% 57%Marco Rubio 27% 19% 26% 40% 29% 11% 22% 33% 21% 23% 25% 36%Paul Ryan 29% 19% 26% 48% 31% 9% 26% 34% 23% 28% 25% 34%Chris Christie 33% 26% 31% 45% 35% 19% 25% 38% 28% 30% 27% 43%
Totals (996) (120) (711) (165) (799) (120) (77) (462) (534) (362) (330) (304)
Party ID Ideology Region Family Income
Total Dem Rep Ind Lib Mod Con Northeast Midwest South West Under 40 40-100 100+
Barack Obama 47% 81% 18% 46% 84% 62% 16% 54% 50% 37% 56% 46% 48% 48%Mitt Romney 38% 16% 73% 38% 8% 32% 71% 35% 32% 44% 36% 35% 40% 48%Joe Biden 42% 72% 14% 42% 78% 55% 15% 50% 41% 33% 49% 39% 43% 45%Hillary Clinton 53% 80% 31% 54% 78% 67% 32% 61% 51% 48% 59% 51% 56% 59%Marco Rubio 27% 9% 53% 29% 5% 22% 55% 21% 24% 35% 21% 23% 27% 38%Paul Ryan 29% 12% 53% 32% 7% 20% 59% 22% 28% 33% 28% 28% 28% 38%Chris Christie 33% 17% 60% 35% 15% 26% 59% 34% 30% 34% 32% 27% 36% 47%
Totals (996) (366) (259) (297) (207) (357) (317) (174) (235) (377) (210) (377) (388) (140)
15

The Economist /YouGov PollJune 16-18, 2012
13. Respondents have a somewhat or very unfavorable opinion of these individualsDo you have a favorable or an unfavorable opinion of the following people?
Age Race Gender Education
Total 18-29 30-64 65+ White Black Hispanic Male Female HS or less Some college College graduate
Barack Obama 45% 34% 48% 51% 51% 9% 32% 48% 42% 47% 39% 50%Mitt Romney 47% 46% 50% 37% 46% 59% 40% 48% 46% 42% 48% 54%Joe Biden 43% 33% 45% 47% 47% 23% 28% 46% 39% 42% 37% 50%Hillary Clinton 34% 31% 35% 36% 38% 16% 22% 40% 29% 29% 37% 40%Marco Rubio 27% 26% 28% 25% 27% 30% 25% 33% 22% 24% 26% 33%Paul Ryan 29% 25% 31% 26% 29% 33% 21% 33% 25% 23% 29% 38%Chris Christie 30% 32% 30% 29% 31% 33% 24% 37% 24% 24% 33% 37%
Totals (996) (120) (711) (165) (799) (120) (77) (462) (534) (362) (330) (304)
Party ID Ideology Region Family Income
Total Dem Rep Ind Lib Mod Con Northeast Midwest South West Under 40 40-100 100+
Barack Obama 45% 14% 80% 48% 13% 31% 80% 41% 42% 54% 38% 45% 47% 52%Mitt Romney 47% 70% 20% 53% 84% 53% 24% 49% 50% 40% 55% 45% 49% 48%Joe Biden 43% 13% 77% 46% 12% 33% 76% 34% 42% 50% 39% 39% 48% 51%Hillary Clinton 34% 10% 65% 37% 16% 22% 62% 21% 36% 40% 35% 33% 37% 36%Marco Rubio 27% 40% 13% 31% 51% 31% 12% 34% 23% 24% 30% 20% 31% 37%Paul Ryan 29% 40% 14% 34% 51% 37% 11% 36% 24% 24% 35% 22% 31% 43%Chris Christie 30% 39% 14% 36% 52% 38% 13% 41% 24% 29% 30% 26% 33% 37%
Totals (996) (366) (259) (297) (207) (357) (317) (174) (235) (377) (210) (377) (388) (140)
16

The Economist /YouGov PollJune 16-18, 2012
14. Respondents have a somewhat or very favorable opinion of these groupsDo you have a favorable or an unfavorable opinion of the following groups?
Age Race Gender Education
Total 18-29 30-64 65+ White Black Hispanic Male Female HS or less Some college College graduate
Labor unions 32% 30% 32% 35% 31% 46% 23% 33% 31% 29% 36% 33%Mormons 18% 18% 17% 22% 20% 13% 5% 17% 19% 15% 18% 22%Gays and lesbians 27% 30% 29% 16% 28% 17% 26% 24% 29% 17% 30% 38%
Totals (996) (120) (711) (165) (799) (120) (77) (462) (534) (362) (330) (304)
Party ID Ideology Region Family Income
Total Dem Rep Ind Lib Mod Con Northeast Midwest South West Under 40 40-100 100+
Labor unions 32% 54% 12% 30% 61% 36% 11% 38% 34% 25% 36% 30% 37% 32%Mormons 18% 12% 31% 17% 13% 15% 28% 19% 21% 13% 22% 15% 21% 27%Gays and lesbians 27% 36% 12% 30% 67% 28% 8% 31% 30% 20% 31% 23% 28% 35%
Totals (996) (366) (259) (297) (207) (357) (317) (174) (235) (377) (210) (377) (388) (140)
17

The Economist /YouGov PollJune 16-18, 2012
15. Respondents have a somewhat or very unfavorable opinion of these groupsDo you have a favorable or an unfavorable opinion of the following groups?
Age Race Gender Education
Total 18-29 30-64 65+ White Black Hispanic Male Female HS or less Some college College graduate
Labor unions 36% 25% 38% 44% 40% 20% 26% 44% 29% 33% 32% 48%Mormons 28% 35% 27% 20% 26% 33% 32% 26% 29% 31% 23% 28%Gays and lesbians 35% 34% 32% 46% 35% 40% 25% 38% 32% 46% 27% 27%
Totals (996) (120) (711) (165) (799) (120) (77) (462) (534) (362) (330) (304)
Party ID Ideology Region Family Income
Total Dem Rep Ind Lib Mod Con Northeast Midwest South West Under 40 40-100 100+
Labor unions 36% 9% 66% 40% 9% 31% 62% 39% 30% 41% 34% 31% 39% 47%Mormons 28% 30% 21% 32% 36% 27% 23% 20% 29% 29% 29% 32% 26% 17%Gays and lesbians 35% 23% 49% 31% 8% 26% 55% 28% 36% 39% 33% 44% 28% 24%
Totals (996) (366) (259) (297) (207) (357) (317) (174) (235) (377) (210) (377) (388) (140)
18

The Economist /YouGov PollJune 16-18, 2012
16. Approval of Obama as PresidentDo you approve or disapprove of the way Barack Obama is handling his job as President?
Age Race Gender Education
Total 18-29 30-64 65+ White Black Hispanic Male Female HS or less Some college College graduate
Strongly Approve 16% 14% 16% 18% 13% 34% 24% 15% 16% 13% 16% 20%Somewhat Approve 26% 35% 25% 17% 24% 36% 27% 25% 27% 27% 26% 24%Somewhat Disapprove 13% 12% 13% 12% 14% 7% 5% 12% 13% 12% 16% 10%Strongly Disapprove 39% 30% 39% 46% 43% 12% 35% 41% 36% 41% 32% 43%Not Sure 7% 9% 6% 7% 6% 12% 10% 7% 7% 7% 9% 3%
Totals 100% 100% 100% 100% 100% 100% 100% 100% 100% 100% 100% 100%(Unweighted) (999) (121) (713) (165) (799) (123) (77) (464) (535) (364) (331) (304)
Party ID Ideology Region Family Income
Total Dem Rep Ind Lib Mod Con Northeast Midwest South West Under 40 40-100 100+
Strongly Approve 16% 35% 2% 13% 35% 20% 3% 19% 13% 15% 18% 15% 18% 14%Somewhat Approve 26% 40% 11% 24% 51% 34% 8% 33% 34% 18% 24% 23% 28% 27%Somewhat Disapprove 13% 7% 12% 15% 7% 17% 8% 18% 8% 10% 18% 15% 13% 9%Strongly Disapprove 39% 10% 75% 42% 5% 22% 80% 25% 36% 49% 35% 38% 37% 48%Not Sure 7% 8% 1% 5% 1% 7% 1% 5% 9% 8% 5% 9% 4% 1%
Totals 100% 100% 100% 100% 100% 100% 100% 100% 100% 100% 100% 100% 100% 100%(Unweighted) (999) (368) (260) (296) (207) (357) (317) (174) (235) (381) (209) (378) (387) (140)
19

The Economist /YouGov PollJune 16-18, 2012
17. Obama approval on issuesDo you approve or disapprove of the way Barack Obama is handling these specific issues?
Age Race Gender Education
Total 18-29 30-64 65+ White Black Hispanic Male Female HS or less Some college College graduate
The economy 35% 35% 37% 29% 31% 61% 39% 33% 37% 30% 36% 43%Immigration 41% 53% 39% 33% 39% 61% 35% 41% 41% 34% 42% 49%The environment 39% 40% 38% 40% 35% 67% 39% 40% 37% 36% 39% 42%Terrorism 51% 53% 52% 45% 49% 69% 51% 54% 48% 47% 52% 55%Gay rights 37% 41% 37% 31% 36% 44% 39% 36% 38% 30% 37% 49%Education 40% 42% 39% 39% 36% 68% 41% 39% 40% 40% 39% 40%Health care 39% 48% 37% 33% 35% 66% 40% 38% 39% 33% 41% 45%Social security 34% 32% 35% 33% 30% 62% 39% 36% 32% 31% 34% 38%The budget deficit 30% 31% 31% 27% 27% 56% 32% 32% 28% 24% 32% 38%The war in Afghanistan 42% 50% 41% 34% 38% 66% 42% 43% 41% 38% 38% 52%Taxes 36% 39% 35% 33% 32% 66% 33% 36% 35% 33% 36% 40%Medicare 35% 35% 35% 32% 32% 60% 29% 35% 34% 29% 37% 40%Abortion 29% 29% 30% 26% 28% 45% 23% 30% 28% 22% 33% 36%
Totals (997) (120) (712) (165) (799) (121) (77) (462) (535) (363) (330) (304)
Party ID Ideology Region Family Income
Total Dem Rep Ind Lib Mod Con Northeast Midwest South West Under 40 40-100 100+
The economy 35% 67% 8% 33% 75% 47% 9% 43% 33% 29% 40% 32% 38% 37%Immigration 41% 67% 14% 42% 79% 54% 14% 46% 43% 32% 49% 37% 46% 46%The environment 39% 62% 16% 39% 64% 53% 17% 48% 31% 33% 48% 37% 43% 40%Terrorism 51% 74% 33% 49% 74% 65% 32% 58% 48% 45% 60% 46% 58% 55%Gay rights 37% 63% 11% 38% 82% 47% 9% 44% 39% 29% 45% 30% 42% 47%Education 40% 68% 17% 37% 68% 52% 19% 51% 38% 31% 46% 38% 43% 40%Health care 39% 66% 11% 39% 73% 54% 11% 52% 34% 29% 48% 35% 42% 43%Social security 34% 62% 9% 33% 61% 48% 12% 46% 30% 29% 37% 28% 40% 38%The budget deficit 30% 60% 4% 29% 63% 44% 7% 34% 29% 25% 37% 27% 35% 34%The war in Afghanistan 42% 62% 25% 39% 64% 51% 28% 47% 40% 36% 50% 38% 46% 47%Taxes 36% 61% 10% 36% 66% 48% 14% 44% 30% 29% 44% 31% 42% 35%Medicare 35% 59% 12% 35% 62% 48% 13% 46% 30% 30% 38% 30% 40% 41%Abortion 29% 52% 5% 32% 63% 40% 6% 35% 28% 24% 35% 24% 37% 30%
Totals (997) (366) (260) (297) (207) (356) (318) (173) (235) (379) (210) (378) (388) (140)
20
The Economist /YouGov PollJune 16-18, 2012
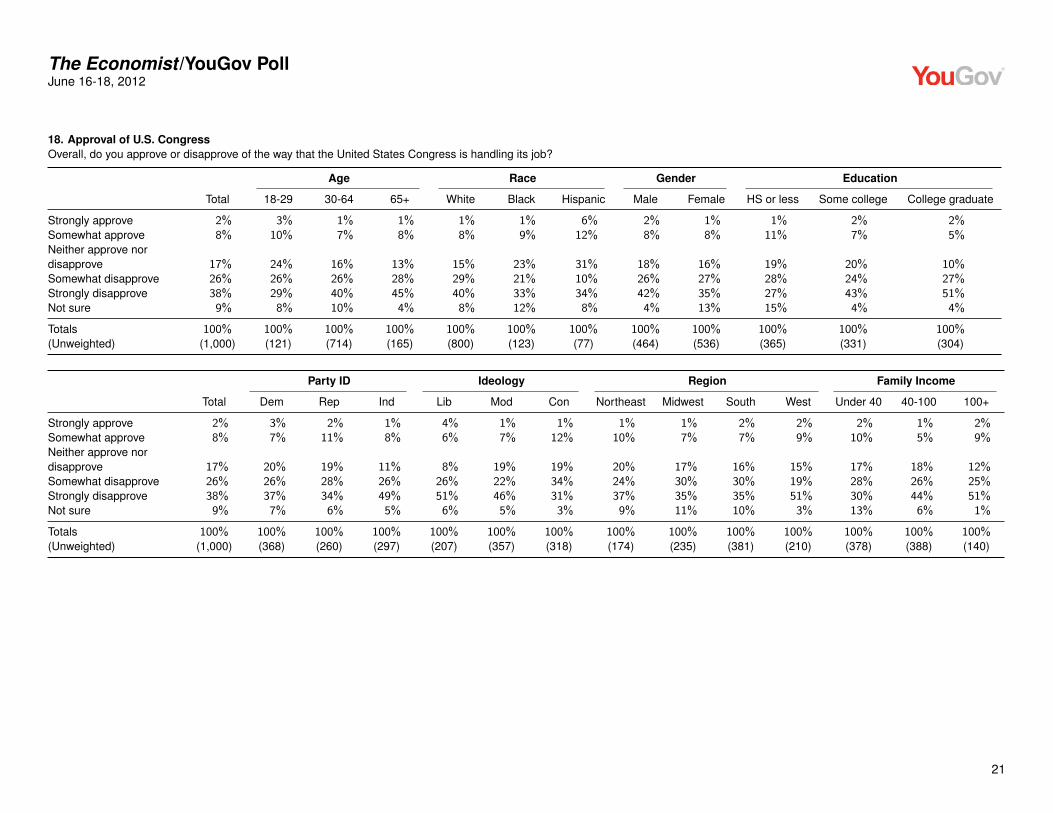
18. Approval of U.S. CongressOverall, do you approve or disapprove of the way that the United States Congress is handling its job?
Age Race Gender Education
Total 18-29 30-64 65+ White Black Hispanic Male Female HS or less Some college College graduate
Strongly approve 2% 3% 1% 1% 1% 1% 6% 2% 1% 1% 2% 2%Somewhat approve 8% 10% 7% 8% 8% 9% 12% 8% 8% 11% 7% 5%Neither approve nordisapprove 17% 24% 16% 13% 15% 23% 31% 18% 16% 19% 20% 10%Somewhat disapprove 26% 26% 26% 28% 29% 21% 10% 26% 27% 28% 24% 27%Strongly disapprove 38% 29% 40% 45% 40% 33% 34% 42% 35% 27% 43% 51%Not sure 9% 8% 10% 4% 8% 12% 8% 4% 13% 15% 4% 4%
Totals 100% 100% 100% 100% 100% 100% 100% 100% 100% 100% 100% 100%(Unweighted) (1,000) (121) (714) (165) (800) (123) (77) (464) (536) (365) (331) (304)
Party ID Ideology Region Family Income
Total Dem Rep Ind Lib Mod Con Northeast Midwest South West Under 40 40-100 100+
Strongly approve 2% 3% 2% 1% 4% 1% 1% 1% 1% 2% 2% 2% 1% 2%Somewhat approve 8% 7% 11% 8% 6% 7% 12% 10% 7% 7% 9% 10% 5% 9%Neither approve nordisapprove 17% 20% 19% 11% 8% 19% 19% 20% 17% 16% 15% 17% 18% 12%Somewhat disapprove 26% 26% 28% 26% 26% 22% 34% 24% 30% 30% 19% 28% 26% 25%Strongly disapprove 38% 37% 34% 49% 51% 46% 31% 37% 35% 35% 51% 30% 44% 51%Not sure 9% 7% 6% 5% 6% 5% 3% 9% 11% 10% 3% 13% 6% 1%
Totals 100% 100% 100% 100% 100% 100% 100% 100% 100% 100% 100% 100% 100% 100%(Unweighted) (1,000) (368) (260) (297) (207) (357) (318) (174) (235) (381) (210) (378) (388) (140)
21

The Economist /YouGov PollJune 16-18, 2012
19. Presidential vote preference: Obama vs. RomneyIf the 2012 presidential election were being held today, who would you vote for?Asked of registered voters. Respondents who initially answered ’not sure’ but indicated they were leaning toward Obama or Romney in a follow-up question are counted as Obama or Romney supporters
Age Race Gender Education
Total 18-29 30-64 65+ White Black Hispanic Male Female HS or less Some college College graduate
Barack Obama 44% 49% 44% 37% 39% 76% 46% 40% 47% 37% 49% 47%Mitt Romney 44% 40% 42% 53% 49% 9% 40% 48% 41% 48% 38% 46%Other 5% 4% 6% 4% 6% 1% 5% 6% 4% 5% 6% 4%Not sure 7% 7% 8% 5% 6% 14% 9% 6% 8% 10% 8% 3%
Totals 100% 100% 100% 100% 100% 100% 100% 100% 100% 100% 100% 100%(Unweighted) (866) (96) (616) (154) (687) (110) (69) (413) (453) (284) (295) (287)
Party ID Ideology Region Family Income
Total Dem Rep Ind Lib Mod Con Northeast Midwest South West Under 40 40-100 100+
Barack Obama 44% 79% 6% 42% 87% 60% 7% 50% 47% 38% 46% 42% 47% 40%Mitt Romney 44% 14% 87% 39% 5% 29% 83% 39% 38% 52% 40% 41% 41% 57%Other 5% 0% 3% 9% 7% 3% 5% 3% 4% 5% 9% 6% 6% 1%Not sure 7% 6% 3% 10% 1% 7% 6% 8% 11% 5% 5% 11% 6% 2%
Totals 100% 100% 100% 100% 100% 100% 100% 100% 100% 100% 100% 100% 100% 100%(Unweighted) (866) (336) (237) (259) (185) (327) (290) (143) (208) (333) (182) (300) (354) (132)
22

The Economist /YouGov PollJune 16-18, 2012
20. Prediction of who will win in NovemberRegardless of which candidate you support, who do you think is most likely to win the Presidential election in November?Asked of registered voters
Age Race Gender Education
Total 18-29 30-64 65+ White Black Hispanic Male Female HS or less Some college College graduate
Obama will definitely win 13% 12% 14% 14% 8% 41% 28% 13% 14% 15% 14% 11%Obama will probably win 28% 41% 25% 27% 28% 32% 26% 27% 29% 24% 34% 28%Obama and Romney areequally likely to win 19% 19% 20% 17% 21% 9% 7% 20% 18% 16% 16% 25%Romney will probably win 18% 15% 20% 17% 20% 3% 22% 21% 16% 22% 14% 19%Romney will definitely win 9% 2% 9% 15% 10% 2% 13% 11% 7% 10% 8% 9%Don’t know 12% 12% 13% 10% 12% 13% 4% 7% 16% 14% 14% 8%
Totals 100% 100% 100% 100% 100% 100% 100% 100% 100% 100% 100% 100%(Unweighted) (867) (97) (616) (154) (688) (110) (69) (412) (455) (284) (296) (287)
Party ID Ideology Region Family Income
Total Dem Rep Ind Lib Mod Con Northeast Midwest South West Under 40 40-100 100+
Obama will definitely win 13% 27% 2% 10% 18% 20% 6% 12% 11% 15% 15% 19% 12% 7%Obama will probably win 28% 42% 14% 28% 51% 36% 10% 42% 33% 19% 30% 24% 30% 32%Obama and Romney areequally likely to win 19% 12% 24% 23% 19% 18% 21% 10% 24% 19% 19% 16% 21% 22%Romney will probably win 18% 8% 30% 18% 4% 13% 32% 14% 11% 24% 20% 17% 16% 26%Romney will definitely win 9% 1% 20% 9% 0% 3% 20% 12% 6% 11% 7% 10% 9% 8%Don’t know 12% 10% 10% 12% 7% 10% 10% 9% 15% 12% 9% 13% 12% 5%
Totals 100% 100% 100% 100% 100% 100% 100% 100% 100% 100% 100% 100% 100% 100%(Unweighted) (867) (337) (238) (259) (185) (328) (291) (144) (208) (333) (182) (299) (354) (133)
23

The Economist /YouGov PollJune 16-18, 2012
21. 2012 Congressional voteIf an election for U.S. Congress were being held today, who would you vote for in the district where you live?
Age Race Gender Education
Total 18-29 30-64 65+ White Black Hispanic Male Female HS or less Some college College graduate
The Democratic Partycandidate 38% 43% 36% 35% 35% 58% 39% 35% 40% 33% 40% 42%The Republican Partycandidate 33% 26% 33% 41% 37% 6% 26% 35% 30% 29% 30% 41%Other 1% 1% 1% 0% 1% 0% 3% 1% 1% 1% 1% 1%Not sure 17% 13% 19% 17% 17% 19% 17% 17% 17% 20% 18% 11%I would not vote 12% 17% 11% 7% 11% 17% 14% 12% 11% 16% 11% 4%
Totals 100% 100% 100% 100% 100% 100% 100% 100% 100% 100% 100% 100%(Unweighted) (1,000) (121) (714) (165) (800) (123) (77) (464) (536) (365) (331) (304)
Party ID Ideology Region Family Income
Total Dem Rep Ind Lib Mod Con Northeast Midwest South West Under 40 40-100 100+
The Democratic Partycandidate 38% 81% 4% 31% 85% 46% 10% 44% 48% 28% 38% 33% 42% 37%The Republican Partycandidate 33% 2% 82% 32% 3% 23% 73% 25% 24% 43% 31% 27% 34% 49%Other 1% 0% 1% 3% 1% 1% 1% 1% 1% 1% 1% 1% 1% 0%Not sure 17% 14% 11% 23% 5% 21% 13% 10% 21% 19% 15% 20% 14% 12%I would not vote 12% 3% 3% 11% 7% 10% 2% 21% 6% 9% 15% 18% 9% 0%
Totals 100% 100% 100% 100% 100% 100% 100% 100% 100% 100% 100% 100% 100% 100%(Unweighted) (1,000) (368) (260) (297) (207) (357) (318) (174) (235) (381) (210) (378) (388) (140)
24

The Economist /YouGov PollJune 16-18, 2012
22. Knowledge of President Obama’s statement about private sector job growthIn a press conference last week, President Obama was asked about the state of the economy. How did he describe economic growth in the private sector?
Age Race Gender Education
Total 18-29 30-64 65+ White Black Hispanic Male Female HS or less Some college College graduate
The private sector isdoing fine. 47% 31% 46% 69% 49% 41% 36% 52% 43% 40% 43% 63%The private sector isstruggling. 9% 10% 11% 4% 10% 11% 4% 12% 7% 7% 12% 9%The private sector ismostly the same as itwas. 4% 8% 4% 2% 3% 2% 17% 6% 3% 6% 3% 3%I didn’t hear what he said 39% 51% 39% 25% 38% 46% 43% 30% 48% 46% 41% 25%
Totals 100% 100% 100% 100% 100% 100% 100% 100% 100% 100% 100% 100%(Unweighted) (993) (120) (708) (165) (795) (121) (77) (462) (531) (361) (329) (303)
Party ID Ideology Region Family Income
Total Dem Rep Ind Lib Mod Con Northeast Midwest South West Under 40 40-100 100+
The private sector isdoing fine. 47% 37% 54% 59% 45% 48% 61% 49% 39% 50% 51% 38% 52% 67%The private sector isstruggling. 9% 10% 10% 10% 13% 11% 8% 9% 8% 10% 11% 8% 13% 11%The private sector ismostly the same as itwas. 4% 10% 2% 2% 4% 6% 4% 7% 7% 3% 1% 5% 3% 1%I didn’t hear what he said 39% 43% 35% 29% 38% 36% 27% 35% 47% 37% 37% 49% 32% 22%
Totals 100% 100% 100% 100% 100% 100% 100% 100% 100% 100% 100% 100% 100% 100%(Unweighted) (993) (366) (258) (295) (206) (356) (317) (174) (235) (374) (210) (374) (388) (138)
25

The Economist /YouGov PollJune 16-18, 2012
23. Knowledge of employment changes in private companiesIn the past year, do you think that employment in private companies...
Age Race Gender Education
Total 18-29 30-64 65+ White Black Hispanic Male Female HS or less Some college College graduate
Has increased 22% 17% 23% 27% 23% 25% 10% 26% 19% 17% 22% 30%Has stayed about thesame 31% 35% 31% 26% 30% 26% 44% 31% 31% 32% 30% 31%Has decreased 33% 25% 35% 34% 35% 20% 30% 35% 31% 29% 36% 34%Don’t now 14% 23% 11% 13% 12% 29% 16% 9% 19% 22% 11% 5%
Totals 100% 100% 100% 100% 100% 100% 100% 100% 100% 100% 100% 100%(Unweighted) (994) (121) (709) (164) (796) (122) (76) (463) (531) (361) (330) (303)
Party ID Ideology Region Family Income
Total Dem Rep Ind Lib Mod Con Northeast Midwest South West Under 40 40-100 100+
Has increased 22% 32% 14% 24% 37% 30% 12% 29% 21% 18% 27% 17% 25% 30%Has stayed about thesame 31% 33% 32% 32% 31% 35% 31% 34% 34% 29% 28% 32% 28% 34%Has decreased 33% 19% 48% 36% 21% 25% 52% 24% 30% 38% 35% 33% 35% 34%Don’t now 14% 16% 6% 8% 11% 10% 5% 13% 15% 15% 10% 18% 12% 2%
Totals 100% 100% 100% 100% 100% 100% 100% 100% 100% 100% 100% 100% 100% 100%(Unweighted) (994) (365) (257) (297) (206) (354) (317) (174) (233) (378) (209) (374) (387) (139)
26

The Economist /YouGov PollJune 16-18, 2012
24. Knowledge of employment changes in government jobsIn the past year, do you think that employment in local, state, and federal government...
Age Race Gender Education
Total 18-29 30-64 65+ White Black Hispanic Male Female HS or less Some college College graduate
Has increased 23% 12% 21% 43% 24% 15% 22% 27% 19% 22% 21% 27%Has stayed about thesame 28% 36% 29% 16% 27% 30% 39% 28% 28% 31% 28% 24%Has decreased 34% 30% 37% 31% 36% 31% 24% 36% 32% 27% 38% 42%Don’t know 14% 23% 13% 10% 13% 24% 15% 8% 20% 20% 13% 7%
Totals 100% 100% 100% 100% 100% 100% 100% 100% 100% 100% 100% 100%(Unweighted) (995) (121) (710) (164) (799) (119) (77) (464) (531) (361) (330) (304)
Party ID Ideology Region Family Income
Total Dem Rep Ind Lib Mod Con Northeast Midwest South West Under 40 40-100 100+
Has increased 23% 15% 34% 27% 17% 19% 36% 26% 16% 24% 27% 20% 26% 26%Has stayed about thesame 28% 31% 31% 24% 24% 32% 30% 31% 30% 28% 24% 29% 29% 24%Has decreased 34% 38% 28% 39% 49% 38% 27% 32% 37% 31% 39% 33% 34% 47%Don’t know 14% 16% 7% 10% 9% 11% 7% 10% 17% 17% 10% 17% 11% 3%
Totals 100% 100% 100% 100% 100% 100% 100% 100% 100% 100% 100% 100% 100% 100%(Unweighted) (995) (365) (260) (295) (207) (357) (316) (174) (234) (377) (210) (373) (388) (140)
27
The Economist /YouGov PollJune 16-18, 2012
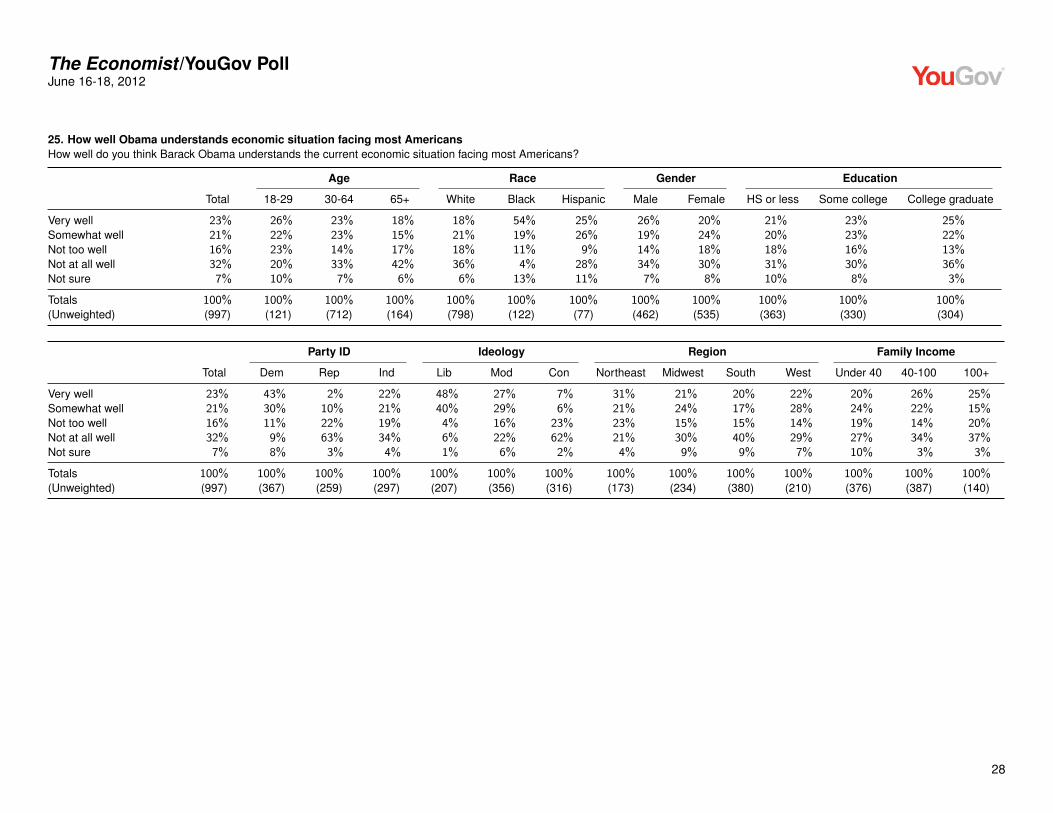
25. How well Obama understands economic situation facing most AmericansHow well do you think Barack Obama understands the current economic situation facing most Americans?
Age Race Gender Education
Total 18-29 30-64 65+ White Black Hispanic Male Female HS or less Some college College graduate
Very well 23% 26% 23% 18% 18% 54% 25% 26% 20% 21% 23% 25%Somewhat well 21% 22% 23% 15% 21% 19% 26% 19% 24% 20% 23% 22%Not too well 16% 23% 14% 17% 18% 11% 9% 14% 18% 18% 16% 13%Not at all well 32% 20% 33% 42% 36% 4% 28% 34% 30% 31% 30% 36%Not sure 7% 10% 7% 6% 6% 13% 11% 7% 8% 10% 8% 3%
Totals 100% 100% 100% 100% 100% 100% 100% 100% 100% 100% 100% 100%(Unweighted) (997) (121) (712) (164) (798) (122) (77) (462) (535) (363) (330) (304)
Party ID Ideology Region Family Income
Total Dem Rep Ind Lib Mod Con Northeast Midwest South West Under 40 40-100 100+
Very well 23% 43% 2% 22% 48% 27% 7% 31% 21% 20% 22% 20% 26% 25%Somewhat well 21% 30% 10% 21% 40% 29% 6% 21% 24% 17% 28% 24% 22% 15%Not too well 16% 11% 22% 19% 4% 16% 23% 23% 15% 15% 14% 19% 14% 20%Not at all well 32% 9% 63% 34% 6% 22% 62% 21% 30% 40% 29% 27% 34% 37%Not sure 7% 8% 3% 4% 1% 6% 2% 4% 9% 9% 7% 10% 3% 3%
Totals 100% 100% 100% 100% 100% 100% 100% 100% 100% 100% 100% 100% 100% 100%(Unweighted) (997) (367) (259) (297) (207) (356) (316) (173) (234) (380) (210) (376) (387) (140)
28

The Economist /YouGov PollJune 16-18, 2012
26. How well Romney understands economic situation facing most AmericansHow well do you think Mitt Romney understands the current economic situation facing most Americans?
Age Race Gender Education
Total 18-29 30-64 65+ White Black Hispanic Male Female HS or less Some college College graduate
Very well 14% 6% 13% 24% 14% 11% 12% 18% 10% 12% 14% 15%Somewhat well 24% 23% 26% 17% 24% 14% 34% 25% 22% 24% 19% 29%Not too well 19% 23% 18% 19% 19% 21% 14% 17% 22% 20% 19% 19%Not at all well 29% 26% 31% 26% 29% 34% 23% 29% 30% 23% 35% 34%Not sure 14% 22% 12% 13% 13% 19% 17% 12% 16% 22% 13% 4%
Totals 100% 100% 100% 100% 100% 100% 100% 100% 100% 100% 100% 100%(Unweighted) (1,000) (121) (714) (165) (800) (123) (77) (464) (536) (365) (331) (304)
Party ID Ideology Region Family Income
Total Dem Rep Ind Lib Mod Con Northeast Midwest South West Under 40 40-100 100+
Very well 14% 6% 28% 14% 5% 10% 28% 10% 11% 16% 16% 12% 14% 20%Somewhat well 24% 15% 40% 20% 7% 22% 37% 29% 22% 23% 22% 19% 28% 29%Not too well 19% 22% 17% 23% 19% 22% 19% 21% 23% 18% 16% 21% 19% 17%Not at all well 29% 44% 9% 35% 60% 36% 11% 26% 24% 31% 36% 26% 34% 30%Not sure 14% 13% 6% 8% 10% 11% 5% 13% 21% 13% 10% 23% 6% 3%
Totals 100% 100% 100% 100% 100% 100% 100% 100% 100% 100% 100% 100% 100% 100%(Unweighted) (1,000) (368) (260) (297) (207) (357) (318) (174) (235) (381) (210) (378) (388) (140)
29
The Economist /YouGov PollJune 16-18, 2012
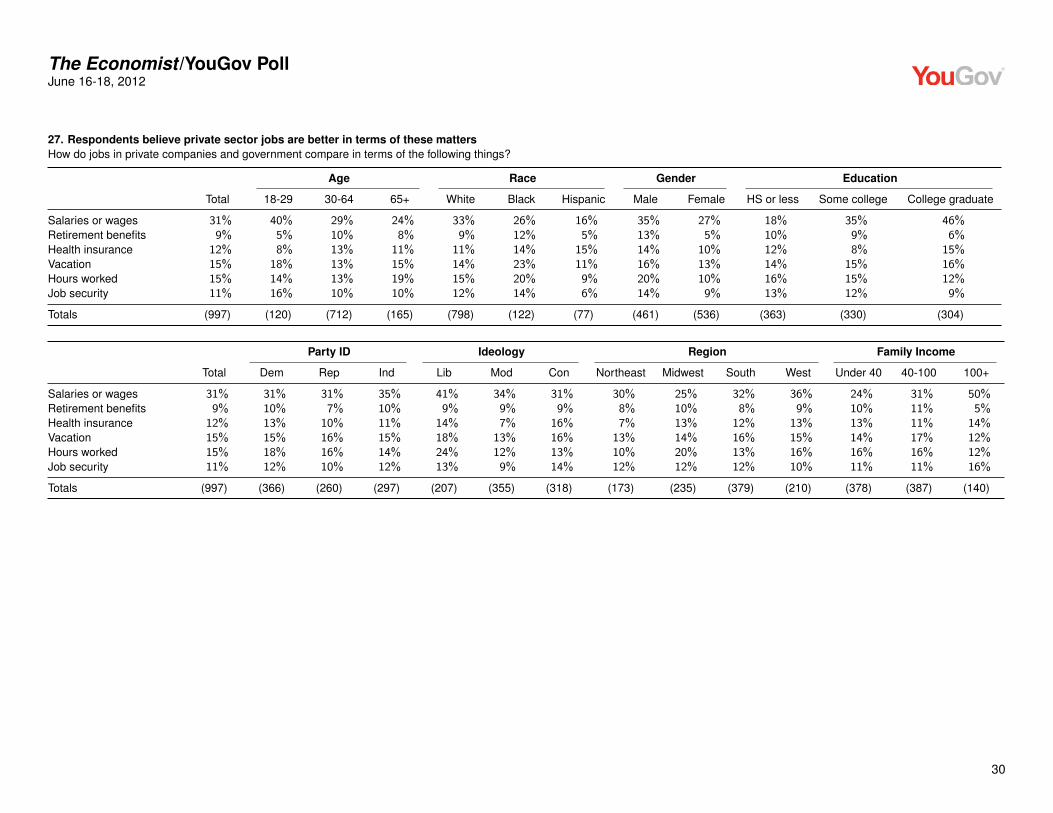
27. Respondents believe private sector jobs are better in terms of these mattersHow do jobs in private companies and government compare in terms of the following things?
Age Race Gender Education
Total 18-29 30-64 65+ White Black Hispanic Male Female HS or less Some college College graduate
Salaries or wages 31% 40% 29% 24% 33% 26% 16% 35% 27% 18% 35% 46%Retirement benefits 9% 5% 10% 8% 9% 12% 5% 13% 5% 10% 9% 6%Health insurance 12% 8% 13% 11% 11% 14% 15% 14% 10% 12% 8% 15%Vacation 15% 18% 13% 15% 14% 23% 11% 16% 13% 14% 15% 16%Hours worked 15% 14% 13% 19% 15% 20% 9% 20% 10% 16% 15% 12%Job security 11% 16% 10% 10% 12% 14% 6% 14% 9% 13% 12% 9%
Totals (997) (120) (712) (165) (798) (122) (77) (461) (536) (363) (330) (304)
Party ID Ideology Region Family Income
Total Dem Rep Ind Lib Mod Con Northeast Midwest South West Under 40 40-100 100+
Salaries or wages 31% 31% 31% 35% 41% 34% 31% 30% 25% 32% 36% 24% 31% 50%Retirement benefits 9% 10% 7% 10% 9% 9% 9% 8% 10% 8% 9% 10% 11% 5%Health insurance 12% 13% 10% 11% 14% 7% 16% 7% 13% 12% 13% 13% 11% 14%Vacation 15% 15% 16% 15% 18% 13% 16% 13% 14% 16% 15% 14% 17% 12%Hours worked 15% 18% 16% 14% 24% 12% 13% 10% 20% 13% 16% 16% 16% 12%Job security 11% 12% 10% 12% 13% 9% 14% 12% 12% 12% 10% 11% 11% 16%
Totals (997) (366) (260) (297) (207) (355) (318) (173) (235) (379) (210) (378) (387) (140)
30

The Economist /YouGov PollJune 16-18, 2012
28. Respondents believe government jobs are better in terms of these mattersHow do jobs in private companies and government compare in terms of the following things?
Age Race Gender Education
Total 18-29 30-64 65+ White Black Hispanic Male Female HS or less Some college College graduate
Salaries or wages 43% 28% 43% 62% 46% 25% 38% 47% 40% 51% 38% 38%Retirement benefits 64% 55% 64% 75% 70% 38% 47% 68% 61% 57% 59% 81%Health insurance 62% 59% 60% 73% 67% 42% 39% 67% 58% 58% 61% 70%Vacation 53% 37% 56% 65% 58% 26% 40% 59% 48% 54% 47% 60%Hours worked 55% 42% 57% 61% 59% 29% 43% 56% 54% 49% 51% 68%Job security 58% 49% 59% 67% 62% 41% 45% 66% 52% 52% 54% 75%
Totals (997) (120) (712) (165) (798) (122) (77) (461) (536) (363) (330) (304)
Party ID Ideology Region Family Income
Total Dem Rep Ind Lib Mod Con Northeast Midwest South West Under 40 40-100 100+
Salaries or wages 43% 40% 53% 48% 32% 42% 54% 41% 45% 45% 41% 45% 50% 34%Retirement benefits 64% 60% 74% 72% 69% 65% 74% 61% 61% 68% 65% 57% 71% 80%Health insurance 62% 57% 71% 72% 65% 66% 67% 67% 58% 63% 61% 55% 72% 72%Vacation 53% 49% 60% 62% 47% 55% 63% 54% 51% 55% 53% 47% 61% 60%Hours worked 55% 50% 64% 61% 51% 57% 66% 60% 46% 58% 54% 46% 62% 73%Job security 58% 56% 69% 64% 60% 58% 68% 63% 52% 58% 62% 49% 68% 68%
Totals (997) (366) (260) (297) (207) (355) (318) (173) (235) (379) (210) (378) (387) (140)
31

The Economist /YouGov PollJune 16-18, 2012
29. Respondents strongly or somewhat agree with these immigration-related statementsPlease tell us how strongly you agree or disagree with the following statements: (A) If one or two members of a family have migrated to the US, the governmentshould allow other immediate family members to join them.; (B) If someone helps an undocumented migrant, that person should be fined or given jail time.; (C) Iwould be more likely to help someone if they are from my hometown.; (D) I would be more likely to help someone if they are the same religion as me.; (E) I am morelikely to donate to a charity that helps people in the United States than to a charity that helps people in other countries.
Age Race Gender Education
Total 18-29 30-64 65+ White Black Hispanic Male Female HS or less Some college College graduate
A 23% 38% 20% 16% 23% 30% 18% 20% 26% 17% 24% 32%B 37% 30% 36% 45% 39% 29% 23% 41% 32% 41% 35% 32%C 38% 36% 38% 40% 39% 39% 30% 39% 38% 42% 34% 37%D 15% 25% 12% 13% 15% 24% 9% 13% 17% 16% 12% 18%E 56% 37% 56% 78% 60% 36% 43% 55% 58% 60% 52% 55%
Totals (993) (120) (708) (165) (796) (120) (77) (459) (534) (363) (328) (302)
Party ID Ideology Region Family Income
Total Dem Rep Ind Lib Mod Con Northeast Midwest South West Under 40 40-100 100+
A 23% 32% 17% 22% 42% 27% 14% 26% 24% 17% 31% 26% 20% 26%B 37% 25% 51% 36% 20% 35% 50% 40% 34% 38% 33% 36% 41% 35%C 38% 36% 42% 39% 36% 34% 48% 35% 43% 42% 29% 42% 35% 36%D 15% 12% 23% 15% 10% 14% 22% 10% 13% 17% 18% 17% 16% 13%E 56% 50% 69% 55% 50% 56% 65% 57% 54% 58% 54% 53% 62% 58%
Totals (993) (364) (258) (297) (206) (356) (316) (172) (233) (379) (209) (375) (388) (139)
32

The Economist /YouGov PollJune 16-18, 2012
30. Respondents strongly or somewhat disagree with these immigration-related statementsPlease tell us how strongly you agree or disagree with the following statements: (A) If one or two members of a family have migrated to the US, the governmentshould allow other immediate family members to join them.; (B) If someone helps an undocumented migrant, that person should be fined or given jail time.; (C) Iwould be more likely to help someone if they are from my hometown.; (D) I would be more likely to help someone if they are the same religion as me.; (E) I am morelikely to donate to a charity that helps people in the United States than to a charity that helps people in other countries.
Age Race Gender Education
Total 18-29 30-64 65+ White Black Hispanic Male Female HS or less Some college College graduate
A 49% 34% 49% 67% 53% 30% 38% 51% 48% 52% 48% 47%B 33% 40% 32% 27% 33% 34% 35% 28% 38% 22% 36% 47%C 19% 22% 17% 22% 19% 17% 26% 17% 21% 13% 25% 22%D 37% 32% 39% 37% 38% 23% 46% 35% 39% 28% 46% 42%E 15% 27% 14% 8% 15% 23% 14% 14% 17% 7% 22% 21%
Totals (993) (120) (708) (165) (796) (120) (77) (459) (534) (363) (328) (302)
Party ID Ideology Region Family Income
Total Dem Rep Ind Lib Mod Con Northeast Midwest South West Under 40 40-100 100+
A 49% 33% 67% 54% 32% 46% 67% 48% 47% 53% 45% 44% 56% 52%B 33% 42% 20% 39% 61% 34% 23% 27% 30% 30% 48% 29% 36% 39%C 19% 20% 15% 23% 29% 21% 17% 21% 11% 17% 31% 15% 22% 24%D 37% 44% 29% 42% 59% 38% 30% 43% 35% 28% 50% 33% 39% 46%E 15% 17% 11% 19% 24% 16% 13% 17% 15% 11% 21% 15% 15% 18%
Totals (993) (364) (258) (297) (206) (356) (316) (172) (233) (379) (209) (375) (388) (139)
33

The Economist /YouGov PollJune 16-18, 2012
31. Own involvement in Tea Party movementDo you think of yourself as a part of the Tea Party movement?
Age Race Gender Education
Total 18-29 30-64 65+ White Black Hispanic Male Female HS or less Some college College graduate
Yes 13% 6% 13% 21% 14% 3% 20% 14% 12% 11% 13% 16%No 72% 77% 70% 70% 71% 74% 70% 72% 71% 68% 73% 75%Not sure 15% 17% 17% 9% 15% 23% 10% 14% 17% 20% 14% 9%
Totals 100% 100% 100% 100% 100% 100% 100% 100% 100% 100% 100% 100%(Unweighted) (999) (120) (714) (165) (800) (123) (76) (464) (535) (365) (330) (304)
Party ID Ideology Region Family Income
Total Dem Rep Ind Lib Mod Con Northeast Midwest South West Under 40 40-100 100+
Yes 13% 3% 31% 11% 0% 4% 34% 9% 9% 16% 15% 12% 12% 21%No 72% 85% 54% 78% 94% 82% 55% 80% 71% 68% 71% 72% 73% 68%Not sure 15% 12% 16% 11% 6% 14% 11% 11% 20% 16% 14% 16% 15% 11%
Totals 100% 100% 100% 100% 100% 100% 100% 100% 100% 100% 100% 100% 100% 100%(Unweighted) (999) (367) (260) (297) (207) (357) (318) (174) (235) (381) (209) (377) (388) (140)
34
The Economist /YouGov PollJune 16-18, 2012
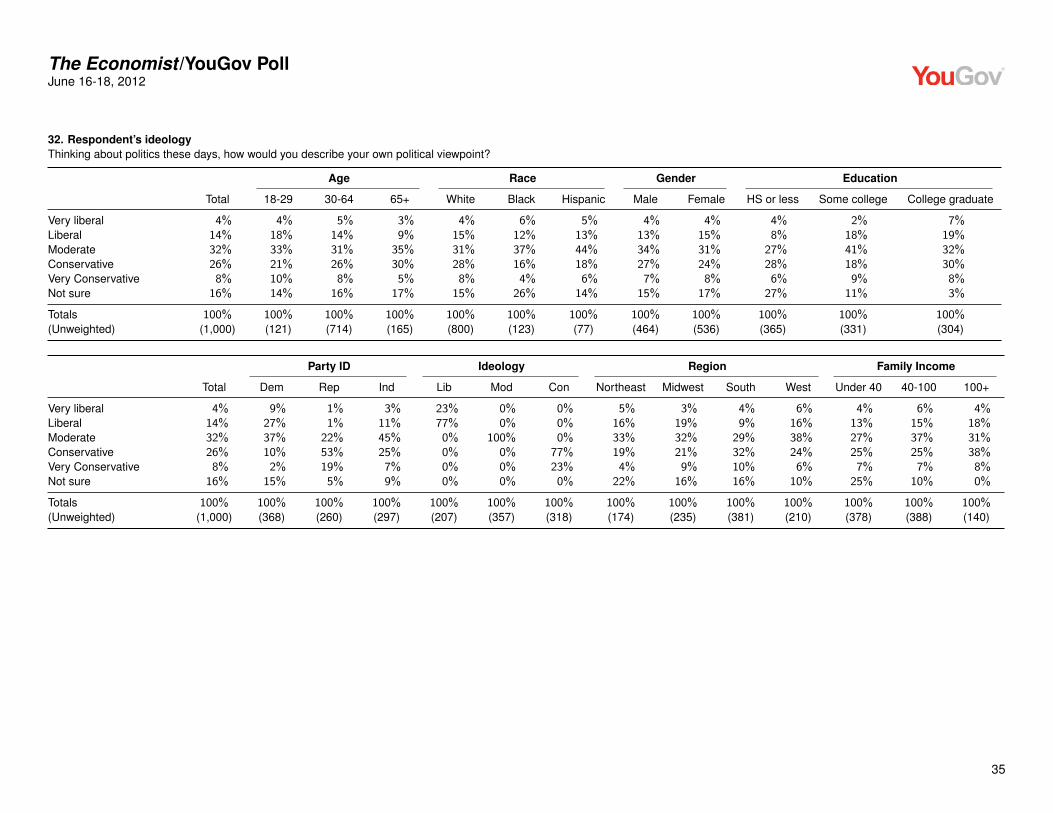
32. Respondent’s ideologyThinking about politics these days, how would you describe your own political viewpoint?
Age Race Gender Education
Total 18-29 30-64 65+ White Black Hispanic Male Female HS or less Some college College graduate
Very liberal 4% 4% 5% 3% 4% 6% 5% 4% 4% 4% 2% 7%Liberal 14% 18% 14% 9% 15% 12% 13% 13% 15% 8% 18% 19%Moderate 32% 33% 31% 35% 31% 37% 44% 34% 31% 27% 41% 32%Conservative 26% 21% 26% 30% 28% 16% 18% 27% 24% 28% 18% 30%Very Conservative 8% 10% 8% 5% 8% 4% 6% 7% 8% 6% 9% 8%Not sure 16% 14% 16% 17% 15% 26% 14% 15% 17% 27% 11% 3%
Totals 100% 100% 100% 100% 100% 100% 100% 100% 100% 100% 100% 100%(Unweighted) (1,000) (121) (714) (165) (800) (123) (77) (464) (536) (365) (331) (304)
Party ID Ideology Region Family Income
Total Dem Rep Ind Lib Mod Con Northeast Midwest South West Under 40 40-100 100+
Very liberal 4% 9% 1% 3% 23% 0% 0% 5% 3% 4% 6% 4% 6% 4%Liberal 14% 27% 1% 11% 77% 0% 0% 16% 19% 9% 16% 13% 15% 18%Moderate 32% 37% 22% 45% 0% 100% 0% 33% 32% 29% 38% 27% 37% 31%Conservative 26% 10% 53% 25% 0% 0% 77% 19% 21% 32% 24% 25% 25% 38%Very Conservative 8% 2% 19% 7% 0% 0% 23% 4% 9% 10% 6% 7% 7% 8%Not sure 16% 15% 5% 9% 0% 0% 0% 22% 16% 16% 10% 25% 10% 0%
Totals 100% 100% 100% 100% 100% 100% 100% 100% 100% 100% 100% 100% 100% 100%(Unweighted) (1,000) (368) (260) (297) (207) (357) (318) (174) (235) (381) (210) (378) (388) (140)
35

The Economist /YouGov PollJune 16-18, 2012
33. Obama’s ideological leaningsWould you say Barack Obama is...
Age Race Gender Education
Total 18-29 30-64 65+ White Black Hispanic Male Female HS or less Some college College graduate
Very liberal 32% 20% 34% 40% 34% 13% 34% 37% 27% 29% 28% 41%Liberal 21% 34% 18% 18% 22% 21% 21% 19% 24% 18% 23% 24%Moderate 21% 26% 20% 18% 20% 25% 26% 23% 20% 14% 26% 28%Conservative 5% 8% 5% 3% 5% 10% 0% 6% 5% 8% 4% 3%Very conservative 1% 0% 2% 0% 1% 3% 0% 1% 1% 2% 0% 0%Not sure 19% 12% 21% 20% 18% 29% 19% 15% 23% 29% 18% 4%
Totals 100% 100% 100% 100% 100% 100% 100% 100% 100% 100% 100% 100%(Unweighted) (998) (121) (712) (165) (798) (123) (77) (464) (534) (365) (329) (304)
Party ID Ideology Region Family Income
Total Dem Rep Ind Lib Mod Con Northeast Midwest South West Under 40 40-100 100+
Very liberal 32% 8% 68% 36% 5% 23% 70% 21% 31% 39% 30% 26% 35% 42%Liberal 21% 28% 16% 22% 39% 27% 14% 21% 22% 20% 24% 24% 20% 22%Moderate 21% 36% 3% 26% 44% 35% 3% 28% 16% 16% 29% 14% 28% 23%Conservative 5% 7% 2% 4% 5% 7% 4% 6% 8% 4% 4% 7% 3% 10%Very conservative 1% 2% 1% 0% 1% 0% 2% 1% 1% 1% 1% 1% 1% 0%Not sure 19% 18% 10% 11% 6% 8% 6% 23% 22% 19% 12% 29% 13% 3%
Totals 100% 100% 100% 100% 100% 100% 100% 100% 100% 100% 100% 100% 100% 100%(Unweighted) (998) (368) (260) (295) (206) (356) (318) (174) (235) (379) (210) (378) (387) (139)
36

The Economist /YouGov PollJune 16-18, 2012
34. Romney’s ideological leaningsWould you say Mitt Romney is...
Age Race Gender Education
Total 18-29 30-64 65+ White Black Hispanic Male Female HS or less Some college College graduate
Very liberal 2% 2% 2% 1% 1% 6% 4% 2% 2% 2% 1% 3%Liberal 4% 2% 4% 4% 4% 3% 5% 4% 3% 4% 3% 3%Moderate 19% 13% 22% 17% 20% 9% 25% 21% 17% 17% 19% 23%Conservative 32% 46% 26% 35% 34% 19% 28% 36% 28% 24% 38% 37%Very conservative 17% 11% 19% 21% 17% 21% 12% 16% 18% 13% 17% 25%Not sure 26% 26% 27% 23% 24% 42% 26% 20% 32% 39% 23% 9%
Totals 100% 100% 100% 100% 100% 100% 100% 100% 100% 100% 100% 100%(Unweighted) (997) (121) (711) (165) (798) (122) (77) (463) (534) (364) (329) (304)
Party ID Ideology Region Family Income
Total Dem Rep Ind Lib Mod Con Northeast Midwest South West Under 40 40-100 100+
Very liberal 2% 3% 1% 2% 2% 2% 3% 3% 1% 3% 1% 2% 2% 0%Liberal 4% 2% 1% 7% 1% 2% 8% 5% 4% 4% 1% 4% 5% 2%Moderate 19% 8% 32% 23% 9% 15% 37% 18% 13% 24% 17% 14% 19% 30%Conservative 32% 27% 50% 30% 29% 41% 36% 36% 30% 26% 43% 25% 35% 46%Very conservative 17% 27% 5% 21% 45% 21% 4% 13% 20% 17% 19% 16% 22% 13%Not sure 26% 33% 12% 16% 14% 19% 12% 26% 32% 26% 20% 39% 17% 9%
Totals 100% 100% 100% 100% 100% 100% 100% 100% 100% 100% 100% 100% 100% 100%(Unweighted) (997) (367) (260) (296) (206) (357) (318) (174) (234) (379) (210) (376) (388) (139)
37

The Economist /YouGov PollJune 16-18, 2012
35. Obama’s sincerityDo you think Barack Obama...
Age Race Gender Education
Total 18-29 30-64 65+ White Black Hispanic Male Female HS or less Some college College graduate
Says what he believes 38% 40% 38% 35% 33% 69% 49% 37% 39% 35% 39% 42%Says what he thinkspeople want to hear 53% 49% 53% 58% 59% 17% 42% 56% 51% 55% 51% 52%Not sure 9% 11% 8% 6% 8% 14% 9% 7% 11% 10% 10% 5%
Totals 100% 100% 100% 100% 100% 100% 100% 100% 100% 100% 100% 100%(Unweighted) (995) (121) (710) (164) (795) (123) (77) (461) (534) (363) (329) (303)
Party ID Ideology Region Family Income
Total Dem Rep Ind Lib Mod Con Northeast Midwest South West Under 40 40-100 100+
Says what he believes 38% 72% 11% 32% 74% 51% 10% 49% 39% 29% 45% 36% 44% 35%Says what he thinkspeople want to hear 53% 23% 83% 60% 19% 43% 84% 49% 51% 60% 48% 54% 50% 63%Not sure 9% 5% 6% 7% 7% 6% 5% 3% 10% 11% 7% 10% 7% 2%
Totals 100% 100% 100% 100% 100% 100% 100% 100% 100% 100% 100% 100% 100% 100%(Unweighted) (995) (365) (259) (296) (206) (356) (316) (174) (232) (380) (209) (376) (386) (139)
38

The Economist /YouGov PollJune 16-18, 2012
36. Obama’s likeabilityRegardless of whether you agree with him, do you like Barack Obama as a person?
Age Race Gender Education
Total 18-29 30-64 65+ White Black Hispanic Male Female HS or less Some college College graduate
Like a lot 32% 32% 32% 30% 28% 55% 34% 29% 34% 24% 36% 39%Like somewhat 26% 30% 24% 27% 25% 26% 31% 28% 24% 30% 25% 19%Dislike 33% 26% 34% 40% 38% 9% 24% 37% 30% 36% 28% 35%Not sure 9% 12% 11% 3% 9% 10% 12% 6% 13% 10% 10% 8%
Totals 100% 100% 100% 100% 100% 100% 100% 100% 100% 100% 100% 100%(Unweighted) (997) (120) (712) (165) (798) (122) (77) (464) (533) (364) (329) (304)
Party ID Ideology Region Family Income
Total Dem Rep Ind Lib Mod Con Northeast Midwest South West Under 40 40-100 100+
Like a lot 32% 62% 5% 29% 72% 41% 6% 35% 32% 23% 44% 28% 34% 36%Like somewhat 26% 25% 26% 29% 20% 31% 19% 35% 26% 22% 23% 29% 26% 20%Dislike 33% 9% 62% 32% 6% 21% 63% 23% 29% 45% 26% 33% 32% 37%Not sure 9% 5% 7% 10% 2% 7% 11% 6% 13% 10% 7% 10% 7% 7%
Totals 100% 100% 100% 100% 100% 100% 100% 100% 100% 100% 100% 100% 100% 100%(Unweighted) (997) (367) (260) (295) (206) (356) (318) (174) (235) (378) (210) (377) (388) (139)
39

The Economist /YouGov PollJune 16-18, 2012
37. Romney’s sincerityDo you think Mitt Romney...
Age Race Gender Education
Total 18-29 30-64 65+ White Black Hispanic Male Female HS or less Some college College graduate
Says what he believes 22% 16% 20% 35% 24% 13% 11% 22% 22% 20% 23% 24%Says what he thinkspeople want to hear 59% 66% 60% 49% 59% 60% 61% 67% 52% 55% 59% 65%Not sure 19% 18% 20% 16% 17% 27% 28% 11% 26% 25% 18% 11%
Totals 100% 100% 100% 100% 100% 100% 100% 100% 100% 100% 100% 100%(Unweighted) (996) (121) (711) (164) (798) (121) (77) (462) (534) (362) (330) (304)
Party ID Ideology Region Family Income
Total Dem Rep Ind Lib Mod Con Northeast Midwest South West Under 40 40-100 100+
Says what he believes 22% 10% 42% 20% 8% 16% 38% 20% 21% 23% 23% 20% 23% 26%Says what he thinkspeople want to hear 59% 75% 40% 64% 79% 67% 46% 71% 55% 55% 61% 56% 63% 59%Not sure 19% 15% 17% 16% 13% 17% 16% 9% 24% 22% 16% 24% 13% 15%
Totals 100% 100% 100% 100% 100% 100% 100% 100% 100% 100% 100% 100% 100% 100%(Unweighted) (996) (366) (259) (296) (206) (356) (317) (174) (234) (379) (209) (375) (388) (140)
40

The Economist /YouGov PollJune 16-18, 2012
38. Romney’s likeabilityRegardless of whether you agree with him, do you like Mitt Romney as a person?
Age Race Gender Education
Total 18-29 30-64 65+ White Black Hispanic Male Female HS or less Some college College graduate
Like a lot 10% 13% 6% 19% 10% 8% 9% 10% 10% 10% 10% 11%Like somewhat 33% 25% 32% 45% 34% 15% 38% 35% 30% 33% 32% 33%Dislike 36% 37% 39% 27% 35% 46% 33% 38% 35% 28% 40% 44%Not sure 21% 26% 23% 10% 20% 30% 20% 17% 25% 29% 18% 13%
Totals 100% 100% 100% 100% 100% 100% 100% 100% 100% 100% 100% 100%(Unweighted) (996) (120) (711) (165) (799) (121) (76) (462) (534) (363) (330) (303)
Party ID Ideology Region Family Income
Total Dem Rep Ind Lib Mod Con Northeast Midwest South West Under 40 40-100 100+
Like a lot 10% 4% 20% 10% 0% 13% 17% 6% 6% 12% 14% 8% 11% 12%Like somewhat 33% 20% 56% 30% 12% 28% 53% 40% 26% 37% 25% 29% 36% 39%Dislike 36% 57% 10% 44% 73% 42% 12% 40% 41% 26% 44% 34% 37% 39%Not sure 21% 20% 14% 16% 15% 17% 17% 15% 27% 24% 16% 29% 16% 10%
Totals 100% 100% 100% 100% 100% 100% 100% 100% 100% 100% 100% 100% 100% 100%(Unweighted) (996) (366) (260) (295) (205) (356) (318) (174) (234) (378) (210) (375) (388) (139)
41

The Economist /YouGov PollJune 16-18, 2012
39. Which of these words to describe Barack ObamaWhich of these words would you use to describe Barack Obama?
Age Race Gender Education
Total 18-29 30-64 65+ White Black Hispanic Male Female HS or less Some college College graduate
Arrogant 40% 33% 41% 45% 44% 11% 32% 44% 36% 41% 34% 45%Bold 33% 43% 30% 32% 31% 44% 38% 33% 34% 35% 30% 34%Effective 23% 26% 23% 22% 20% 44% 31% 22% 24% 19% 28% 24%Exciting 18% 27% 16% 13% 13% 47% 32% 20% 16% 16% 19% 19%Experienced 20% 27% 20% 14% 17% 39% 27% 22% 19% 20% 23% 18%Honest 30% 32% 30% 28% 26% 53% 37% 30% 30% 24% 33% 36%Hypocritical 34% 23% 36% 37% 38% 4% 25% 36% 31% 34% 28% 38%Inspiring 33% 40% 33% 23% 29% 57% 36% 32% 34% 26% 38% 39%Intelligent 57% 60% 56% 53% 56% 67% 48% 54% 59% 50% 58% 65%Partisan 25% 15% 27% 31% 28% 10% 20% 33% 18% 18% 27% 35%Patriotic 29% 29% 29% 30% 27% 39% 34% 27% 31% 25% 32% 32%Religious 12% 11% 13% 12% 10% 27% 19% 13% 12% 14% 12% 9%Sincere 32% 37% 32% 27% 29% 47% 37% 29% 35% 25% 36% 39%Steady 29% 29% 29% 28% 27% 42% 31% 26% 31% 26% 31% 30%Strong 30% 34% 29% 27% 27% 51% 32% 25% 35% 26% 35% 31%
Totals (1,000) (121) (714) (165) (800) (123) (77) (464) (536) (365) (331) (304)
42

The Economist /YouGov PollJune 16-18, 2012
Party ID Ideology Region Family Income
Total Dem Rep Ind Lib Mod Con Northeast Midwest South West Under 40 40-100 100+
Arrogant 40% 11% 73% 42% 7% 29% 72% 36% 33% 48% 35% 34% 44% 51%Bold 33% 43% 24% 31% 47% 35% 24% 40% 30% 28% 40% 37% 32% 26%Effective 23% 43% 7% 21% 41% 31% 8% 30% 22% 17% 30% 21% 24% 27%Exciting 18% 34% 5% 13% 31% 23% 7% 24% 17% 12% 24% 17% 19% 15%Experienced 20% 38% 5% 19% 33% 29% 5% 29% 17% 18% 22% 18% 23% 19%Honest 30% 60% 4% 27% 65% 40% 6% 37% 32% 21% 37% 26% 34% 31%Hypocritical 34% 8% 61% 40% 7% 22% 65% 22% 32% 42% 31% 30% 37% 40%Inspiring 33% 57% 9% 29% 70% 39% 13% 36% 37% 23% 43% 31% 37% 31%Intelligent 57% 76% 39% 62% 85% 69% 39% 61% 62% 44% 70% 54% 59% 62%Partisan 25% 12% 42% 29% 12% 21% 47% 19% 20% 27% 34% 19% 31% 40%Patriotic 29% 52% 9% 24% 56% 37% 10% 33% 35% 19% 37% 28% 30% 35%Religious 12% 21% 5% 10% 15% 18% 4% 16% 13% 9% 13% 10% 15% 11%Sincere 32% 59% 8% 28% 66% 46% 7% 41% 35% 22% 40% 26% 35% 42%Steady 29% 49% 9% 29% 53% 39% 10% 29% 30% 24% 34% 27% 29% 37%Strong 30% 53% 9% 26% 49% 39% 13% 31% 32% 24% 37% 29% 32% 26%
Totals (1,000) (368) (260) (297) (207) (357) (318) (174) (235) (381) (210) (378) (388) (140)
43

The Economist /YouGov PollJune 16-18, 2012
40. Which of these words to describe Mitt RomneyWhich of these words would you use to describe Mitt Romney?
Age Race Gender Education
Total 18-29 30-64 65+ White Black Hispanic Male Female HS or less Some college College graduate
Arrogant 35% 28% 38% 31% 34% 40% 33% 36% 33% 28% 35% 44%Bold 17% 22% 15% 19% 17% 20% 16% 16% 18% 17% 20% 15%Effective 20% 16% 17% 31% 22% 7% 9% 23% 16% 20% 17% 22%Exciting 5% 5% 5% 6% 6% 2% 2% 6% 5% 4% 9% 3%Experienced 37% 29% 37% 47% 40% 18% 39% 41% 34% 36% 34% 44%Honest 19% 12% 17% 35% 21% 3% 18% 20% 18% 18% 18% 22%Hypocritical 32% 31% 34% 24% 31% 44% 26% 34% 30% 26% 31% 41%Inspiring 9% 8% 8% 13% 10% 6% 2% 8% 9% 8% 8% 10%Intelligent 43% 30% 43% 60% 47% 27% 28% 46% 40% 38% 41% 55%Partisan 23% 23% 23% 22% 24% 20% 16% 25% 21% 15% 21% 38%Patriotic 31% 28% 27% 45% 33% 20% 21% 34% 28% 25% 28% 43%Religious 43% 35% 44% 51% 48% 22% 26% 48% 38% 34% 42% 59%Sincere 18% 15% 15% 32% 20% 5% 12% 18% 18% 16% 19% 20%Steady 26% 31% 23% 30% 28% 15% 26% 27% 26% 25% 22% 33%Strong 20% 13% 20% 29% 22% 8% 18% 19% 21% 21% 18% 21%
Totals (1,000) (121) (714) (165) (800) (123) (77) (464) (536) (365) (331) (304)
44

The Economist /YouGov PollJune 16-18, 2012
Party ID Ideology Region Family Income
Total Dem Rep Ind Lib Mod Con Northeast Midwest South West Under 40 40-100 100+
Arrogant 35% 51% 15% 40% 66% 41% 15% 41% 37% 28% 39% 31% 40% 40%Bold 17% 14% 24% 18% 12% 17% 23% 23% 18% 15% 14% 18% 19% 17%Effective 20% 8% 40% 17% 3% 16% 37% 25% 11% 22% 20% 18% 21% 28%Exciting 5% 3% 10% 5% 2% 5% 8% 4% 4% 6% 6% 5% 7% 4%Experienced 37% 21% 62% 37% 19% 35% 61% 36% 31% 41% 39% 33% 41% 48%Honest 19% 7% 40% 18% 3% 16% 37% 15% 15% 23% 21% 16% 20% 26%Hypocritical 32% 49% 6% 39% 68% 38% 10% 35% 31% 27% 40% 28% 38% 32%Inspiring 9% 3% 17% 9% 1% 8% 15% 8% 7% 10% 8% 7% 11% 9%Intelligent 43% 28% 72% 43% 28% 39% 67% 49% 36% 42% 48% 35% 50% 60%Partisan 23% 31% 13% 27% 50% 29% 10% 24% 24% 17% 33% 17% 30% 28%Patriotic 31% 16% 59% 26% 15% 27% 52% 33% 26% 31% 34% 22% 35% 49%Religious 43% 38% 57% 43% 50% 42% 54% 54% 38% 36% 52% 32% 50% 63%Sincere 18% 7% 37% 17% 4% 15% 35% 13% 15% 23% 18% 14% 21% 29%Steady 26% 16% 43% 23% 11% 25% 44% 32% 20% 28% 24% 23% 25% 40%Strong 20% 10% 40% 19% 7% 17% 36% 19% 16% 23% 22% 17% 25% 20%
Totals (1,000) (368) (260) (297) (207) (357) (318) (174) (235) (381) (210) (378) (388) (140)
45

The Economist /YouGov PollJune 16-18, 2012
41. Trend of economyOverall, do you think the economy is getting better or worse?
Age Race Gender Education
Total 18-29 30-64 65+ White Black Hispanic Male Female HS or less Some college College graduate
Getting better 20% 24% 18% 20% 19% 30% 16% 22% 17% 16% 20% 24%About the same 40% 53% 39% 27% 40% 29% 55% 39% 40% 34% 44% 43%Getting worse 34% 12% 37% 48% 37% 18% 25% 34% 34% 39% 30% 30%Not sure 7% 11% 6% 4% 5% 23% 4% 5% 9% 10% 5% 3%
Totals 100% 100% 100% 100% 100% 100% 100% 100% 100% 100% 100% 100%(Unweighted) (993) (121) (708) (164) (794) (123) (76) (461) (532) (362) (330) (301)
Party ID Ideology Region Family Income
Total Dem Rep Ind Lib Mod Con Northeast Midwest South West Under 40 40-100 100+
Getting better 20% 32% 5% 21% 40% 24% 6% 28% 18% 15% 23% 18% 23% 20%About the same 40% 42% 42% 39% 42% 47% 37% 41% 42% 39% 38% 38% 35% 50%Getting worse 34% 16% 51% 37% 12% 24% 54% 29% 31% 38% 35% 35% 37% 29%Not sure 7% 10% 2% 3% 5% 4% 4% 2% 10% 9% 4% 10% 5% 1%
Totals 100% 100% 100% 100% 100% 100% 100% 100% 100% 100% 100% 100% 100% 100%(Unweighted) (993) (366) (257) (296) (206) (355) (315) (173) (232) (378) (210) (375) (384) (140)
46
The Economist /YouGov PollJune 16-18, 2012
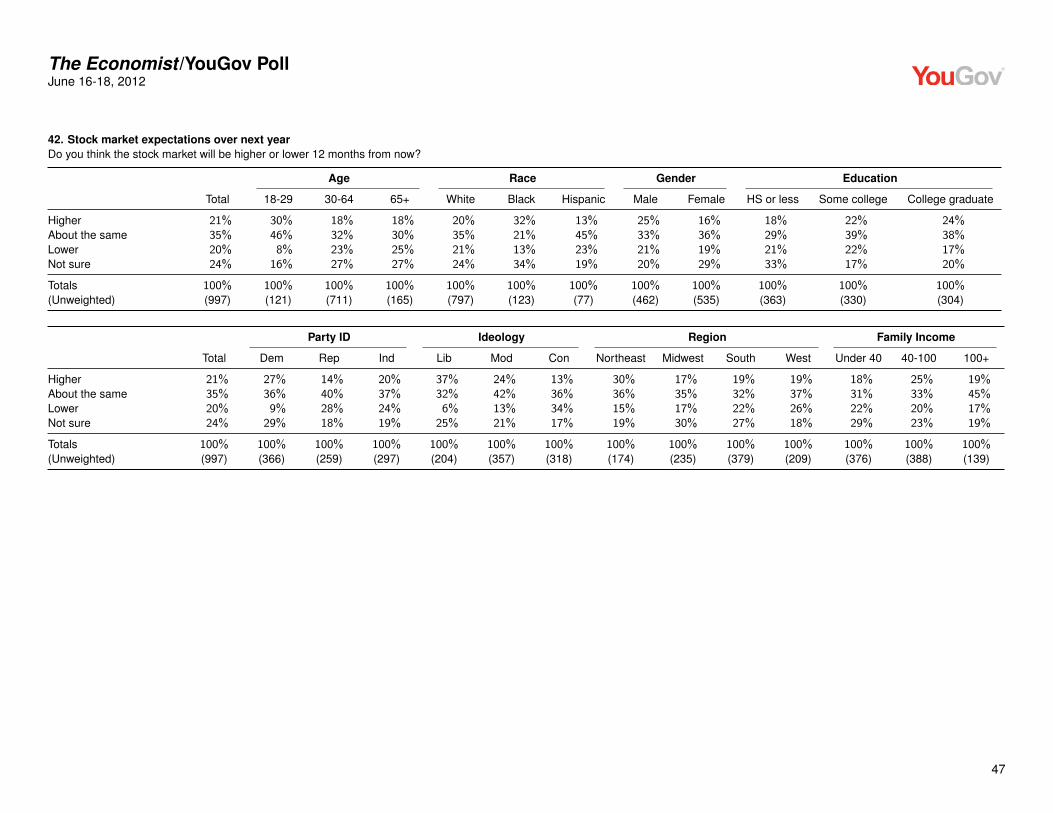
42. Stock market expectations over next yearDo you think the stock market will be higher or lower 12 months from now?
Age Race Gender Education
Total 18-29 30-64 65+ White Black Hispanic Male Female HS or less Some college College graduate
Higher 21% 30% 18% 18% 20% 32% 13% 25% 16% 18% 22% 24%About the same 35% 46% 32% 30% 35% 21% 45% 33% 36% 29% 39% 38%Lower 20% 8% 23% 25% 21% 13% 23% 21% 19% 21% 22% 17%Not sure 24% 16% 27% 27% 24% 34% 19% 20% 29% 33% 17% 20%
Totals 100% 100% 100% 100% 100% 100% 100% 100% 100% 100% 100% 100%(Unweighted) (997) (121) (711) (165) (797) (123) (77) (462) (535) (363) (330) (304)
Party ID Ideology Region Family Income
Total Dem Rep Ind Lib Mod Con Northeast Midwest South West Under 40 40-100 100+
Higher 21% 27% 14% 20% 37% 24% 13% 30% 17% 19% 19% 18% 25% 19%About the same 35% 36% 40% 37% 32% 42% 36% 36% 35% 32% 37% 31% 33% 45%Lower 20% 9% 28% 24% 6% 13% 34% 15% 17% 22% 26% 22% 20% 17%Not sure 24% 29% 18% 19% 25% 21% 17% 19% 30% 27% 18% 29% 23% 19%
Totals 100% 100% 100% 100% 100% 100% 100% 100% 100% 100% 100% 100% 100% 100%(Unweighted) (997) (366) (259) (297) (204) (357) (318) (174) (235) (379) (209) (376) (388) (139)
47

The Economist /YouGov PollJune 16-18, 2012
43. Change in personal finances over past yearWould you say that you and your family are...
Age Race Gender Education
Total 18-29 30-64 65+ White Black Hispanic Male Female HS or less Some college College graduate
Better off financially thanyou were a year ago 17% 28% 16% 7% 18% 21% 6% 22% 13% 12% 19% 23%About the samefinancially as you were ayear ago 45% 45% 46% 43% 45% 44% 52% 43% 47% 45% 44% 47%Worse off financially thanyou were a year ago 33% 18% 33% 48% 34% 18% 34% 31% 34% 36% 31% 29%Not sure 5% 9% 5% 1% 3% 17% 8% 4% 6% 7% 5% 1%
Totals 100% 100% 100% 100% 100% 100% 100% 100% 100% 100% 100% 100%(Unweighted) (995) (121) (709) (165) (797) (122) (76) (462) (533) (363) (331) (301)
Party ID Ideology Region Family Income
Total Dem Rep Ind Lib Mod Con Northeast Midwest South West Under 40 40-100 100+
Better off financially thanyou were a year ago 17% 23% 15% 15% 31% 17% 12% 22% 18% 10% 25% 12% 24% 25%About the samefinancially as you were ayear ago 45% 48% 44% 45% 42% 54% 43% 45% 45% 49% 40% 42% 45% 51%Worse off financially thanyou were a year ago 33% 25% 39% 36% 24% 25% 42% 32% 32% 33% 33% 39% 28% 24%Not sure 5% 4% 2% 5% 3% 3% 3% 1% 6% 8% 2% 7% 2% 0%
Totals 100% 100% 100% 100% 100% 100% 100% 100% 100% 100% 100% 100% 100% 100%(Unweighted) (995) (365) (260) (296) (206) (355) (316) (174) (234) (378) (209) (376) (387) (140)
48

The Economist /YouGov PollJune 16-18, 2012
Sponsorship The Economist
Fieldwork YouGov
Interviewing Dates June 16-18, 2012
Target population U.S. citizens, aged 18 and over.
Sampling method Respondents were selected from YouGov’s PollingPoint panel using samplematching. A random sample (stratified by age, gender, race, education, andregion) was selected from the 2005–2007 American Community Study. Voterregistration, turnout, religion, news interest, minor party identification, andnon-placement on an ideology scale, were imputed from the 2008 CurrentPopulation Survey Registration and Voting Supplement and the Pew Reli-gion in American Life Survey. Matching respondents were selected from thePollingPoint panel, an opt-in Internet panel.
Weighting The sample was weighted using propensity scores based on age, gender,race, education, news interest, voter registration, and non-placement on anideology scale. The weights range from 0.2 to 6.9, with a mean of one and astandard deviation of 0.98.
Number of respondents 1000
Margin of error ± 4.3% (adjusted for weighting)
Survey mode Web-based interviews
Questions not reported 30 questions not reported.
49