The Economics of Happiness Some Labour Market Applications Dr Mike Dockery Director, Centre for...
36
The Economics of Happiness Some Labour Market Applications Dr Mike Dockery Director, Centre for Labour Market Research Associate Professor, School of Economics & Finance, Curtin University
-
Upload
jaida-soutter -
Category
Documents
-
view
219 -
download
4
Transcript of The Economics of Happiness Some Labour Market Applications Dr Mike Dockery Director, Centre for...
The Economics ofHappiness
Some Labour Market Applications
Dr Mike DockeryDirector, Centre for Labour Market
ResearchAssociate Professor, School of Economics & Finance, Curtin
University

Presentation outline Happiness and the economic problem Meaning and measurement of happiness Income and happiness Policy implications Some labour market applications:
Is unemployment voluntary or involuntary? The labour supply curve Education and happiness - a paradox

The objective of economic policy?
It would generally be agreed that the ultimate objective of economics is to increase the general level of happiness or well-being of the population. However:
“In a survey done by Diener (1984) of well over 200 studies on the measurement and determinants of subjective well-being only two references appear to articles in economics journals.”
(Easterlin 1995: 44)

What do we mean by Happiness?
Alternative terms: happiness, life satisfaction, subjective wellbeing.
‘Cognitive’ measure arrived at following some process of evaluation as opposed go an ‘affective measure’ relating to current mood or emotions.
“The degree to which an individual judges the overall quality of their life-as-a-whole favourably” (Veenhoven 1991)

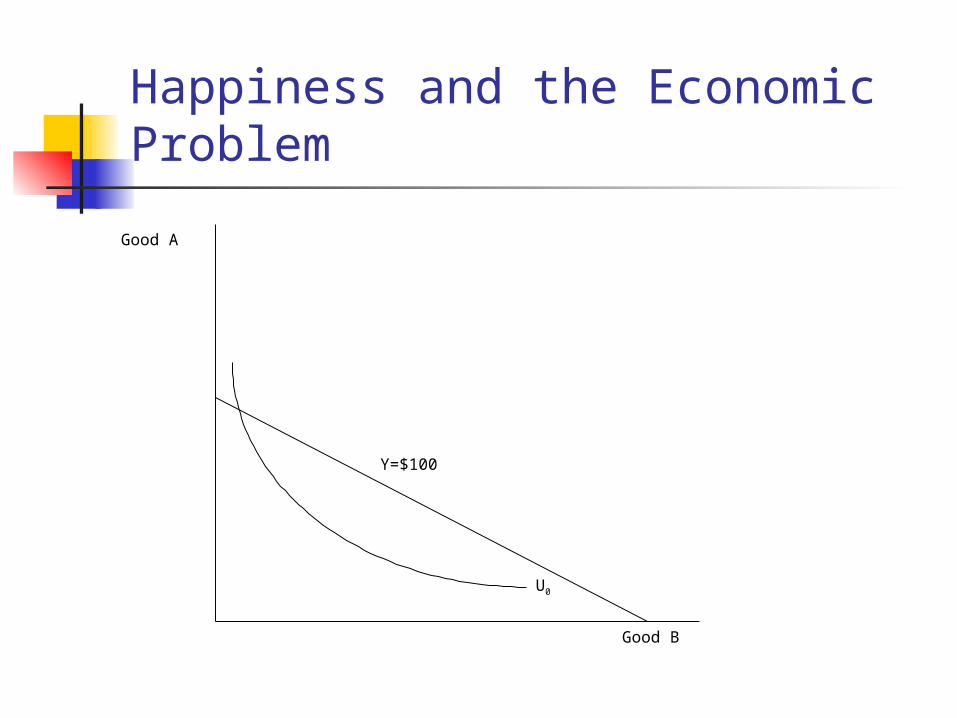
Happiness and the Economic Problem
Good A
U0
Good B

Happiness and the Economic Problem
Good A
U0
Good B
U1
U2
Happiness and the Economic Problem
Good A
U0
Good B
Y=$100

Happiness and the Economic Problem
Good A
U0
Good B
UMAX

Happiness and the Economic Problem
We never observe or attempt to measure utility directly.
What we observe is ‘revealed preference’. If you are observed to choose A over B then you are happier with A than with B.
Expanding the budget curve increases the choice set available to the consumer and therefore must increase their utility. From foundations of microeconomics, we can
prove axiomatically than money buys you happiness.
The (dubious) macroeconomic extension of this analysis is that increased economic growth and increased happiness are synonymous.

Measuring happiness
Typically through survey instruments involving self-assessment of happiness or life-satisfaction on some scale (ie. subjective).
Some examples are: HILDA Survey: “All things considered, how
satisfied are you with your life?” - scale from 0 (totally unsatisfied) to 10 (totally satisfied).
Longitudinal Surveys of Australian Youth: “How happy are you with your life as a whole?” – choose from very unhappy, fairly unhappy, fairly happy or very happy

Summary of major factors
associated with “wellbeing” economically prosperous country that respects freedom
and democracy; political stability; being part of a majority rather than a minority; being toward the top of the social ladder; being married and having good relationships with family
and friends; being mentally and physically healthy; being active and open minded; Being an extrovert; feeling in control of one’s life; having aspirations in social and moral matters rather
than money-making; being politically conservative.
(Veenhoven 1991 – review of 245 studies in 32 countries)

Validity of happiness measuresThere are a number of challenges to the validity of research based on such subjective measures of wellbeing: Are some people just simply happier (fixed
effects) or do circumstances change life satisfaction?
How transitory is the effect of various events? Absolute circumstance versus relativities? Very limited distribution of measurement variable
and general validity of survey instruments. Some validation of survey constructs from
physiological data.
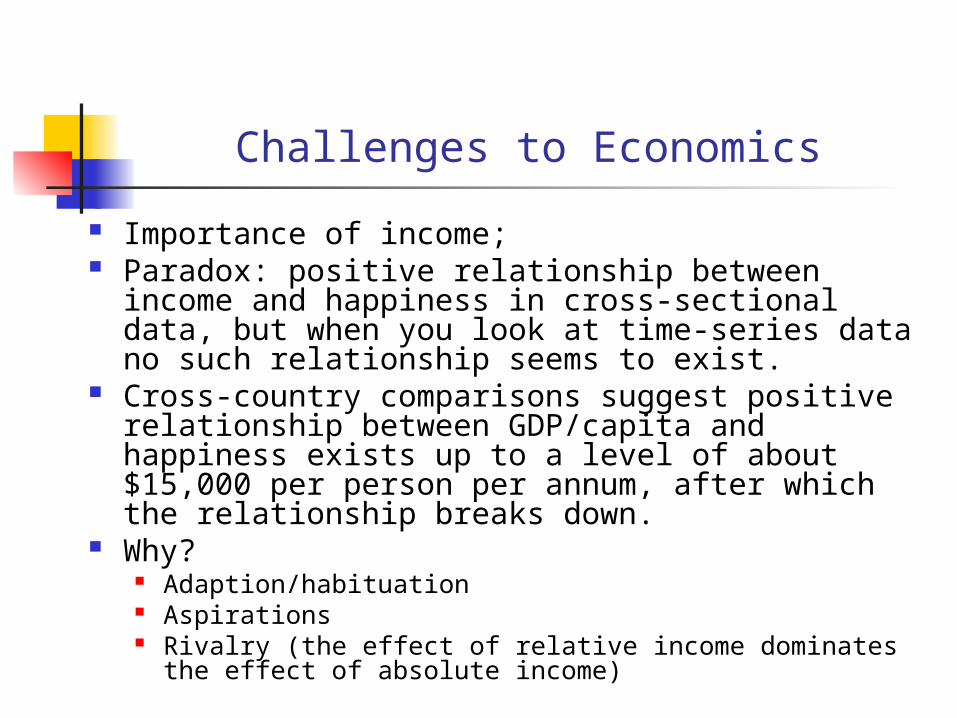
Challenges to Economics
Importance of income; Paradox: positive relationship between income
and happiness in cross-sectional data, but when you look at time-series data no such relationship seems to exist.
Cross-country comparisons suggest positive relationship between GDP/capita and happiness exists up to a level of about $15,000 per person per annum, after which the relationship breaks down.
Why? Adaption/habituation Aspirations Rivalry (the effect of relative income dominates the
effect of absolute income)

(Source: Frey & Stutzer 2002, p. 413)

(Source: Frey and Stutzer 2002, p. 417)

Source: “Polls, wealth and happiness: Where money seems to talk”, The Economist, July 12, 2007

(Source: Frey and Stutzer 2002, p. 415)

Karl Marx(Wage, labour and Capital,
1847)
“A house may be large or small; as long as the neighbouring houses are likewise small, it satisfies all social requirements for a residence. But let there arise next to the little house a palace, and the little house shrinks to a hut.”

Policy Implications In the scramble for economic growth, we may
have actually sacrificed many of the things that make us happy, such as a sense of community, economic security, quality of leisure time, relationships with family and friends.
If rivalry effects dominate then policy is completely ineffective!
Justification for taxation The ‘misery index’ – should we put so much
focus on controlling inflation rather than unemployment?
Equity vs. efficiency; Valuing the environment/public goods.
Labour market policy implications
Long work hours:“A wealthy man is a man who earns $100 a year more than his wife's sister's husband.”
HL Mencken, circa 1950s
Is unemployment voluntary or involuntary? (Clark and Oswald 1994).

Neo-classical model of labour supply and demand
Wage $
Persons
Supply
Demand
W1
D1 S1
W*

Happiness, work and unemployment Economics literature:
unemployment = loss of income.
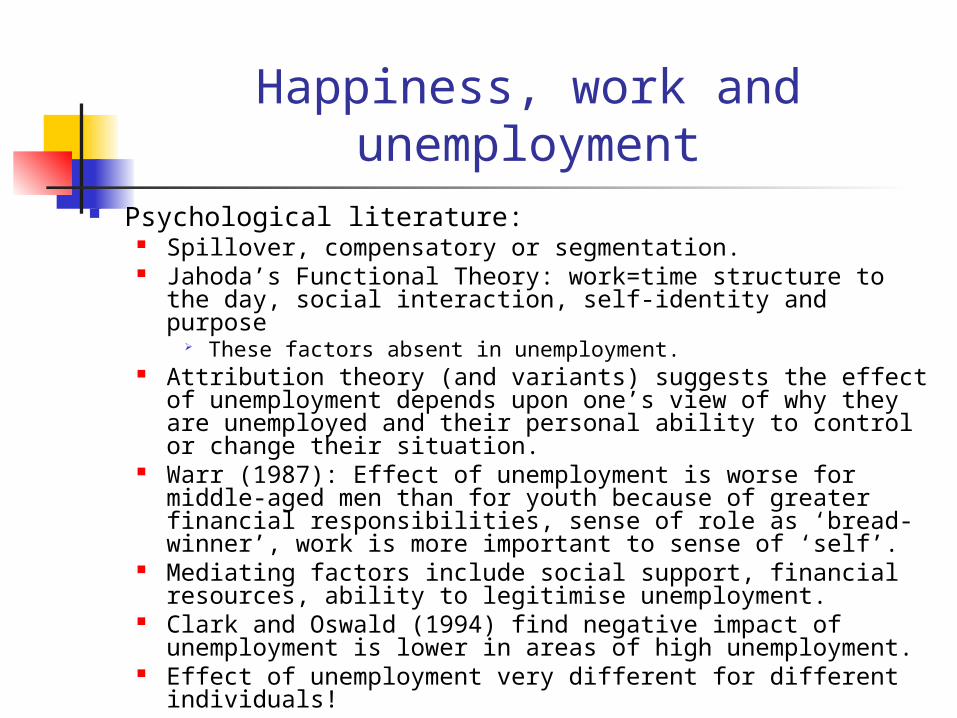
Happiness, work and unemployment
Psychological literature: Spillover, compensatory or segmentation. Jahoda’s Functional Theory: work=time structure to the day,
social interaction, self-identity and purpose These factors absent in unemployment.
Attribution theory (and variants) suggests the effect of unemployment depends upon one’s view of why they are unemployed and their personal ability to control or change their situation.
Warr (1987): Effect of unemployment is worse for middle-aged men than for youth because of greater financial responsibilities, sense of role as ‘bread-winner’, work is more important to sense of ‘self’.
Mediating factors include social support, financial resources, ability to legitimise unemployment.
Clark and Oswald (1994) find negative impact of unemployment is lower in areas of high unemployment.
Effect of unemployment very different for different individuals!

The transition from school to work: current activity by survey year; LSAY.
1996a
(Year 10)
1997
(Year 11)
1998
(Year 12)
1999
(Aged 18)
2000
(Aged 19)
2001
(Aged 20)
2002
(Aged 21)
Still at school (%) 94.9 86.1 79.4 3.8 0.4 0.0 0.0
Has left school and main current activity is (%):
Working 1.8 9.3 14.7 43.6 46.6 56.9 63.5
Study 0.3 1.8 1.1 44.2 40.5 33.0 25.1
Work and studyb 0.0 0.2 0.1 1.4 5.8 2.5 2.3
Looking for work 0.7 2.0 3.6 4.9 4.4 4.3 4.6
Other 0.2 0.6 0.9 1.4 2.3 2.9 3.9
Missing 2.0 0.1 0.3 0.7 0.1 0.4 0.5
Total Left School (%) 5.1 13.9 20.6 96.2 99.6 100.0 100.0
Total (%) 100.0 100.0 100.0 100.0 100.0 100.0 100.0
Sample number 9837 10307 9738 8783 7889 6876 6095
Sample survival rate 72.3% 75.7% 71.5% 64.5% 58.0% 50.5% 44.8%
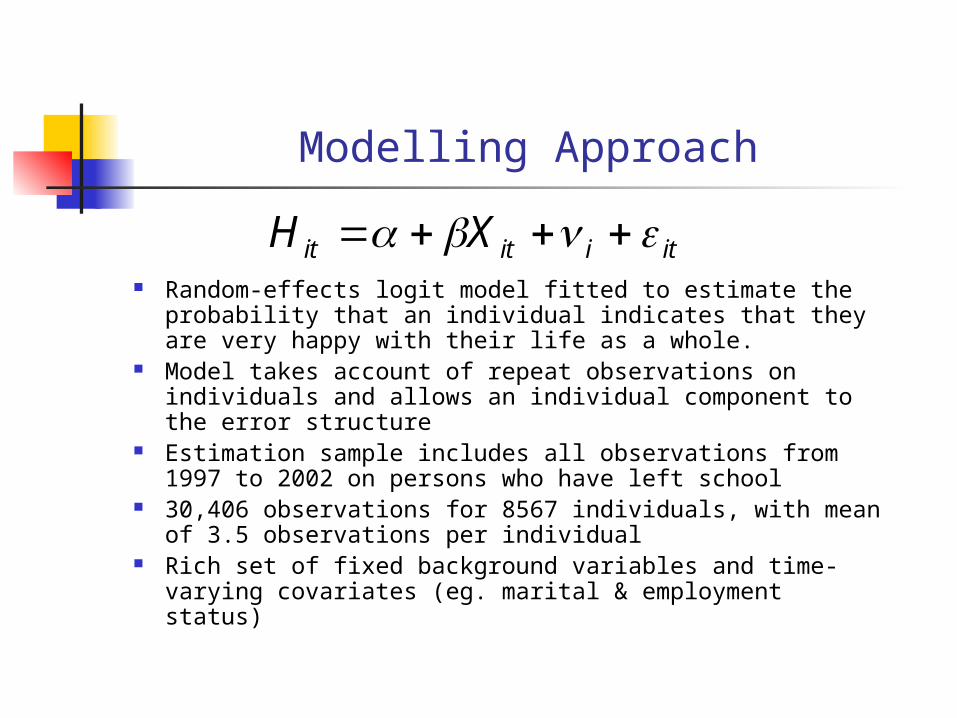
Modelling Approach
Random-effects logit model fitted to estimate the probability that an individual indicates that they are very happy with their life as a whole.
Model takes account of repeat observations on individuals and allows an individual component to the error structure
Estimation sample includes all observations from 1997 to 2002 on persons who have left school
30,406 observations for 8567 individuals, with mean of 3.5 observations per individual
Rich set of fixed background variables and time-varying covariates (eg. marital & employment status)
itiitit XH
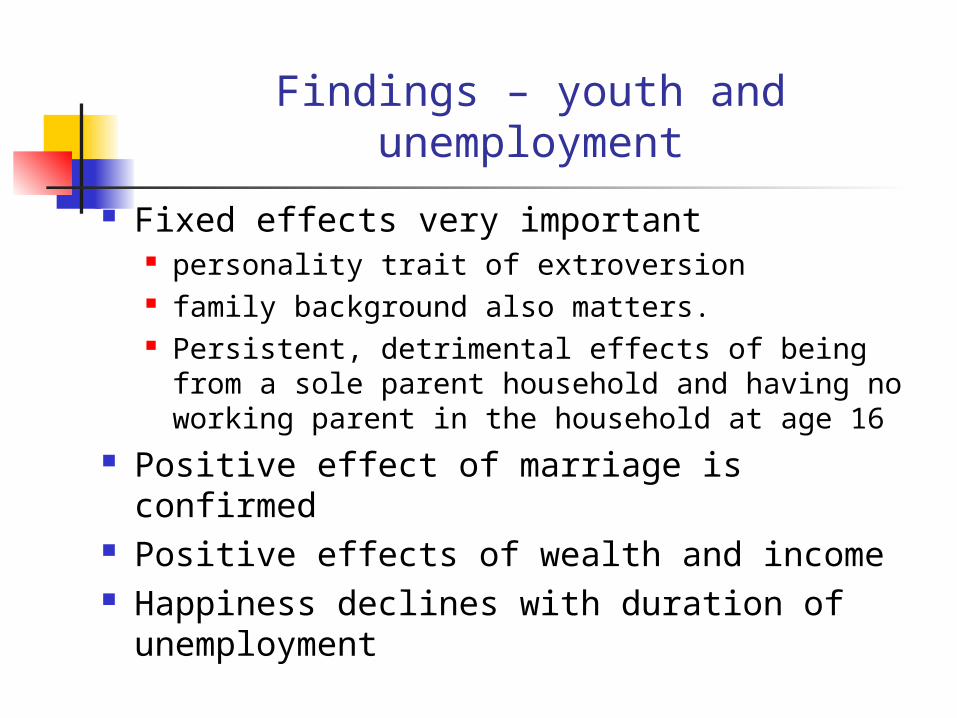
Findings – youth and unemployment
Fixed effects very important personality trait of extroversion family background also matters. Persistent, detrimental effects of being from a
sole parent household and having no working parent in the household at age 16
Positive effect of marriage is confirmed Positive effects of wealth and income Happiness declines with duration of
unemployment

Findings – youth and unemployment(continued)
It is critical to take into account the ‘quality’ of employment: Low job satisfaction on key job
attributes has an even greater detrimental effect on reported happiness than being in unemployment.
Young people are markedly happier if they have found a job which is the sort of job they would like to pursue as a career.

The Labour Supply curve
Goods & Services
U0
Leisure → ← Hours worked
A
B

The Labour Supply curve
Goods & Services
U0
Leisure → ← Hours worked
A
B
E
Traditional analysis of labour supply – some
issues Why do people work such long hours?
Many people report working more hours than they would like
This has a significant negative effect on life satisfaction (even for part-time workers!)
Real incomes have risen markedly, but people are working longer!
impact of increase in real wages on hours of labour supplied is ambiguous
substitution and income effects In some countries (eg. Japan) real incomes have tripled since
the 1950s, yet people are working more, not less! Limitations of standard analyses of labour supply
(and its elasticity wrt wages): Assumes individuals freely choose the number of hours
they work Do people accurately predict the number of hours to
work consistent with utility maximisation?

Why not directly estimate the utility curve?
)ln()ln( YLXU
)ln()112ln( hwYhXU u
hwY
w
hdhdU
u
)112(
222
2
)()112( hwY
w
hdhUd
u
Utility is maximized when 0dhdU
ie. when: )(
)112(*
w
Ywh u

Estimates for single males(HILDA data)
U=X+0.70ln(L)+0.30ln(Y) (0.026) (0.017)
Evaluated at means (w=$25.76 per hour, Yu=$69.27 per week) h* = 32 hrs/week Actual = 43 hours per week!
eSUPPLY=0.0006! Typical estimates range from 0.2 to 0.5

Degrees of Misery?Evidence from HILDA
7.607.657.707.757.807.857.907.958.008.058.10
University Post School High School Year 11 orBelow
Highest Education Level Achieved
Self-
Repo
rted
Happ
ines
s le
ve
Total Mean
Male Mean
Female Mean

Happiness relative to overall mean by educational attainment (LSAY)
(a) Lower educational attainment
categories
-0.20
-0.10
0.00
0.10
0.20
1997 1998 1999 2000 2001 2002 2003 2004 2005 2006
Year 10 Year 11 Year 12 Yr 12 +Cert

Happiness relative to overall mean by educational attainment (LSAY)
(b) Highest educational attainment
categories
-0.20
-0.10
0.00
0.10
0.20
1997 1998 1999 2000 2001 2002 2003 2004 2005 2006
Apprent Diploma Degree Post-grad

Selected references Clark, A. E. and Oswald, A. J. (1994), ‘Unhappiness and
unemployment’, Economic Journal, 104, 648-59. Dockery, A. M. (2010), Education and happiness in the school-to-work
transition, National Centre for Vocational Education Research, Adelaide.
Dockery, A. M. (2005) “The happiness of young Australians: empirical evidence on the role of labour market experience”, Economic Record, 81, 255, pp. 322-335.
Dockery, A. M. (2006), “Mental health and labour force status: panel estimates with four waves of HILDA”, CLMR Discussion Paper Series 06/1, Centre for Labour Market Research, Curtin Business School.
Frank, R. (1999), Luxury Fever, Princeton University Press, Princeton. Frey, B. S. and Stutzer, A. (2002), “What can economists learn from
happiness research?”, Journal of Economic Literature, 40, June, 403-435.
Neumark, D. and Postlewaite, A. (1998), “Relative income concerns and the rise in married women’s employment”, Journal of Public Economics, 70, pp. 157-183.
Schor, J. B. (1992), The overworked American: The unexpected
decline of leisure, Basic Books: New York.