The economics of flood prevention, A Dutch perspective
27
1 CPB Background Document / CPB Achtergronddocument Keynote address by Free Huizinga of a symposium in Houston on flood management. The symposium was organized by the governor of Texas, Texas A&M University, The Royal Netherlands Embassy and 'Bouwend Nederland'. Keynote lezing door Free Huizinga op een symposium in Houston over water veiligheid georganiseerd door de gouverneur van Texas, Texas A&M University, de Nederlandse ambassade en Bouwend Nederland. The economics of flood prevention, A Dutch perspective 1 Frederik Huizinga June 2012 1 This lecture was the keynote address at events hosted by the Flood Executive Committee in Norfolk, Virginia, on June 25, 2012, and by The Bay Area Houston Economic Partnership in Houston, Texas, on June 28, 2012. For correspondence write to: Frederik Huizinga, CPB Netherlands Bureau for Economic Policy Analysis, P.O. box 80510, The Hague, The Netherlands. Tel +31 70 3383 380. Web address www.cpb.nl
Transcript of The economics of flood prevention, A Dutch perspective
1
CPB Background Document / CPB Achtergronddocument
Keynote address by Free Huizinga of a symposium in Houston on flood management. The
symposium was organized by the governor of Texas, Texas A&M University, The Royal
Netherlands Embassy and 'Bouwend Nederland'.
Keynote lezing door Free Huizinga op een symposium in Houston over water veiligheid
georganiseerd door de gouverneur van Texas, Texas A&M University, de Nederlandse
ambassade en Bouwend Nederland.
The economics of flood prevention, A Dutch perspective1
Frederik Huizinga
June 2012
1 This lecture was the keynote address at events hosted by the Flood Executive Committee in Norfolk, Virginia, on June 25,
2012, and by The Bay Area Houston Economic Partnership in Houston, Texas, on June 28, 2012. For correspondence write to: Frederik Huizinga, CPB Netherlands Bureau for Economic Policy Analysis, P.O. box 80510, The Hague, The Netherlands. Tel +31 70 3383 380. Web address www.cpb.nl
2
1 Overview
Ladies and gentlemen, thank you very much for this invitation to talk to you about one of my
favorite subjects, namely water. I feel very honored to speak to such a distinguished
audience in this wonderful place right on the waterfront. In my talk I will tell you mostly
about the Dutch experience. In the discussion afterwards we may compare notes and see
how we both may benefit from each other’s experiences.
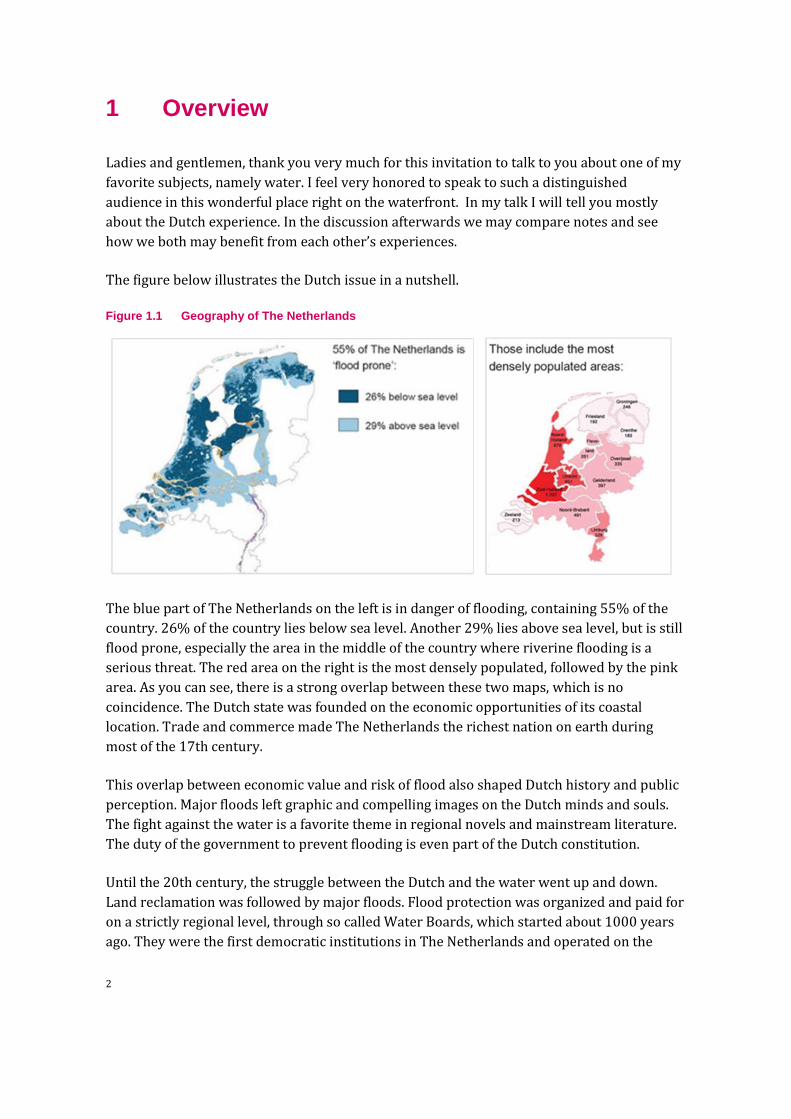
The figure below illustrates the Dutch issue in a nutshell.
Figure 1.1 Geography of The Netherlands
The blue part of The Netherlands on the left is in danger of flooding, containing 55% of the
country. 26% of the country lies below sea level. Another 29% lies above sea level, but is still
flood prone, especially the area in the middle of the country where riverine flooding is a
serious threat. The red area on the right is the most densely populated, followed by the pink
area. As you can see, there is a strong overlap between these two maps, which is no
coincidence. The Dutch state was founded on the economic opportunities of its coastal
location. Trade and commerce made The Netherlands the richest nation on earth during
most of the 17th century.
This overlap between economic value and risk of flood also shaped Dutch history and public
perception. Major floods left graphic and compelling images on the Dutch minds and souls.
The fight against the water is a favorite theme in regional novels and mainstream literature.
The duty of the government to prevent flooding is even part of the Dutch constitution.
Until the 20th century, the struggle between the Dutch and the water went up and down.
Land reclamation was followed by major floods. Flood protection was organized and paid for
on a strictly regional level, through so called Water Boards, which started about 1000 years
ago. They were the first democratic institutions in The Netherlands and operated on the
3
basis of “who pays, who decides”. They are still our main way of organizing water
management.
An increased role for the central government, technical advances and two major floods led to
a different approach with much higher protection levels. The 1916 flood led to the
construction of the Afsluitdijk in 1932, which transformed a major part of the sea into a fresh
water lake. The cost was 2% GDP, too much for the regional Water Boards to bear. In
addition, this dike was meant to protect the jurisdiction of so many Water Boards that having
them design, organize and pay for it themselves would have been very complicated. So, it
became a project of the national government.
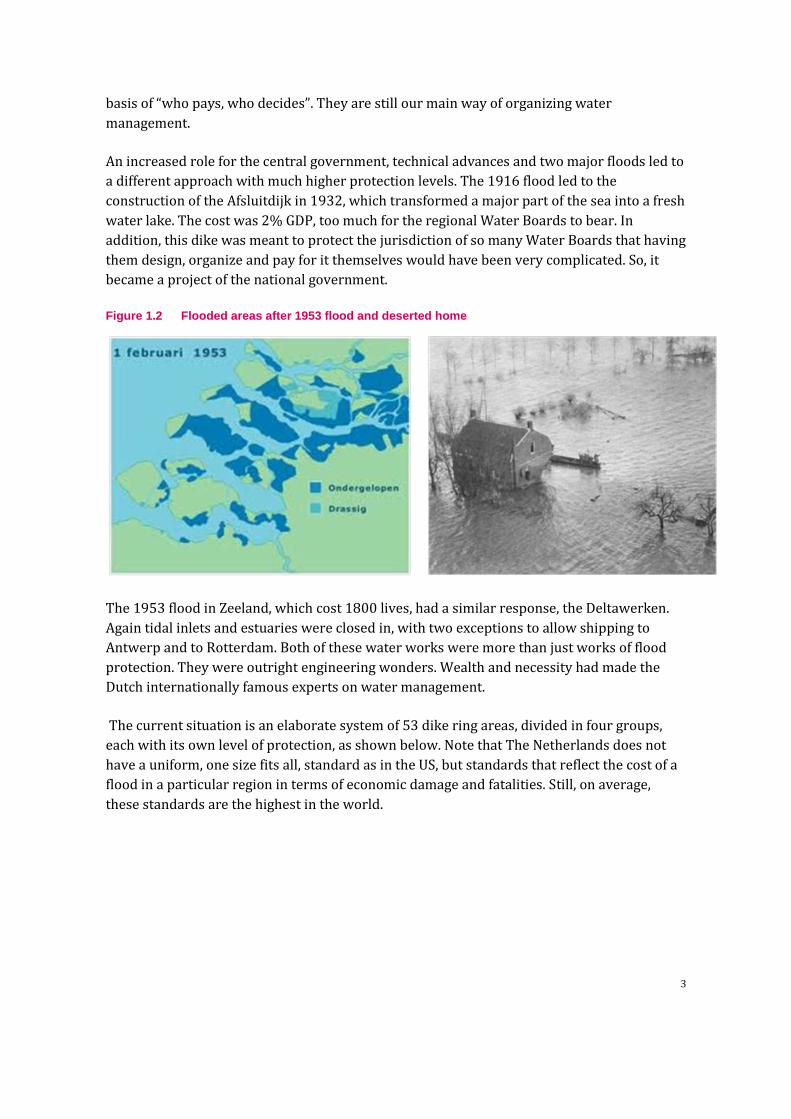
Figure 1.2 Flooded areas after 1953 flood and deserted home
The 1953 flood in Zeeland, which cost 1800 lives, had a similar response, the Deltawerken.
Again tidal inlets and estuaries were closed in, with two exceptions to allow shipping to
Antwerp and to Rotterdam. Both of these water works were more than just works of flood
protection. They were outright engineering wonders. Wealth and necessity had made the
Dutch internationally famous experts on water management.
The current situation is an elaborate system of 53 dike ring areas, divided in four groups,
each with its own level of protection, as shown below. Note that The Netherlands does not
have a uniform, one size fits all, standard as in the US, but standards that reflect the cost of a
flood in a particular region in terms of economic damage and fatalities. Still, on average,
these standards are the highest in the world.

4
Figure 1.3 Legal protection standards by area
Still, we are not done. Three main factors necessitate a further round of protection measures,
namely rising wealth, subsiding land and climate change.
Climate change raises sea levels, and therefore, adds to the flood problem. However climate
change also increases drought, especially in summers. This leads to another, and for The
Netherlands, relatively new issue, namely fresh water supply. Moreover, water safety and
water supply are related issues. Rivers and the IJsselmeer are major sources of flood danger
and of water supply. For instance, the Afsluitdijk now explicitly has two functions: to keep
sea water out and to keep fresh water in.
Several committees issued recommendations and proposed research on how to implement
this new round of safety measures. This research has changed the way we think about water
management. Heavy dikes are no longer the answer to all water problems. Now a range of
solutions is considered and already implemented, involving different types of protection
(multiple dikes, reserving land for temporary storage of flood water, giving up some land
altogether), multipurpose solutions (protection, water supply, nature, recreation, tourism),
and multiple layers of defense (protection, spatial planning and disaster management, like
evacuation).
All this research is combined in the current “Deltaprogramma”, in which CPB also
participates. It should lead to concrete project proposals for flood protection and water
supply as joint issues. These projects should keep The Netherlands dry and wet up to 2100.
This project, like many major government projects faces, roughly speaking, two types of
challenges:

5
1. Finding and planning the best solution, by combining engineering, economics and
climate change expertise.
2. How to get many stakeholders, many layers of government, and a rather tax averse
public to agree on that solution.
In this talk, I will deal with these two issues in the reverse order, which allows me to say
something about my background and my institution, the CPB.

6
2 Who is CPB?
The CPB Netherlands Bureau for Economic Policy Analysis, or CPB for short, is a publicly
financed, but independent, expert institute for very wide range of fiscal and economic policy.
These range from forecasting and budget analysis to the climate debate, and from studies on
specific markets, such as health, housing, finance, pensions, transport and infrastructure to
more general studies of institutional settings. CPB serves the Dutch government and the
political parties of the opposition in an equal manner. In addition, it serves trade unions and
employer’s organizations, and increasingly, the EU.
CBP was founded in 1945, with Tinbergen, the first Nobel Prize winner in economics, as its
first director. His academic and ethical authority gave CPB a high profile start, and it has a
solid reputation of quality and independence. It is widely known and well liked among the
Dutch public and cited nearly every day in the media as a high-quality and independent
source on a wide range of economic and fiscal issues. CPB’s overall academic quality and
policy relevance is checked by a two year cycle of outside, independent, and in the case of
academic quality, international review committees. Their reports are always published in
full.
Figure 2.1 Tinbergen
As an example of this reputation for quality and non-biasedness, CPB and its sister
organization, the PBL Netherlands Environmental Assessment Agency, have just been asked
by 10! political parties for a comprehensive economic analysis of effects of their election
platforms on issues like public finance, economic growth, real income by socio-economic
group, education, health care, housing, transport and infrastructure, environment and
climate. An important part of the analysis is that never contains any judgments about policies
being desirable in whatever way, and the effects are presented as just that. We are doing this
now for the 8th time.
The effect this analyses of the election platforms is generally seen as positive in three ways:
7
1. It results in better policy proposals, for instance by a check on the (un)intended
impact of the proposals and on their feasibility.
2. It provides a systematic overview of the parties’ platforms and their effects, and the
report helps to sharpen the debate just before the election.
3. After the elections, a coalition government needs to be formed. The process is helped
by the fact that the analysis has created a common understanding of the state of the
economy and of the impact of the various policy proposals. As a result, the coalition
talks focus almost solely on the political choices and trade-offs in these proposals.
According to IMF and OECD, this is close to how the policy process should work, and it is
considered “best practice” by these organizations.
Other CPB studies generally have a lower profile, but are meant to and often do serve the
same function: clarifying complex issues and informing all parties in a debate about the pro’s
and con’s of public policy. The Dutch are tax-averse like most people these days, and costly
policy initiatives, such as flood protection, increasingly meet a skeptical public. Clarifying the
costs and benefits in a non-biased way may thus help convince the public that a good project
is indeed worth the cost.

8
3 Cost benefit analysis
Modern CBA practice in The Netherlands started after the construction of a freight railroad
form Rotterdam to Germany turned out to be a financial disaster. In response, the Ministry of
Transportation proposed that CPB head up a research project with all other major economic
research institutes in the Netherlands to write guidelines for making a CBA, so that all future
project studies would use the same ground rules. These guidelines became the official
standard and a CBA based on these guidelines became mandatory for all major infrastructure
projects. Moreover, CPB can either make the CBA itself or perform a second opinion on it.
The impact of the guidelines has been substantial. All major projects with negative CPB
judgment, with total of 30 billion euro, were either cancelled or postponed. Some projects of
lesser size went ahead despite a negative CBA by CPB, but these were a minority. Projects
with a positive or neutral judgment were generally implemented. The latter is not surprising,
since the government had proposed the project in the first place. So, in practice, the net
result has been that a CBA functions as a major hurdle, but a positive judgment is not
required for implementation. It is just information; the final judgment is political.
CPB certainly did not accomplish this feat by itself. In fact, cooperation and consensus is
crucial to make such a system work. Still I think it is fair to say that CPB played a leading role.
In particular one colleague in my division played a major role in getting these CBA ground
rules established and in applying them to some innovative and major CBA’s on water
projects. For this work, the Queen awarded him a very high royal honor last year.
However, reputation, once established, is not to be taken for granted. It has to be re-earned
over and over again. Just before I became director of infrastructure and regional economics
division, review report was published calling CPB’s CBA practice a black box and CPB-
attitude arrogant. We concluded that this criticism was valid and important and decided on a
major overhaul of our communication strategy with respect to CBA’s. This paid off, and
maybe, just in time.
9
4 The economics of water management
4.1 Norms
Safety standards are generally expressed as a norm for the probability that a flood may occur
in a year. The US standard is 1/100, which means that the probability that a flood occurs in
any given year is 1%. This norm is more commonly called the 100 year flood, since on
average 1 flood will happen every 100 years.
In my experience, the concept of a 100 year flood leads to a lot of misunderstanding.
First, I think that stating a norm in this way, while correct form a statistical point of view,
may overstate the sense of safety to the general public. Let me given a simple example. A 1%
level of protection means that the probability of a flood in any given year is 1%. The
probability that there is no flood in a given year is therefore 99%. The probability that there
is no flood in two consecutive years is .99 x .99 = .98. The probability that there is on flood
over 30 years is .99 to the power 30 = .74. So, the probability that at least one flood (that is,
one or more!) will occur within a 30 year period is 1 - .74 = 26%. So, when you buy a new
home in a 1% flood area with a 30 year mortgage, the probability that the home will be
swept away before you paid it off is 26%! To me, this sounds far more threatening than
saying that on average a flood will occur once every 100 years.
Second, and more importantly, a 1% safety level only says the probability that a flood will
occur within a given year is 1%, but not how severe this flood will be if it occurs. The
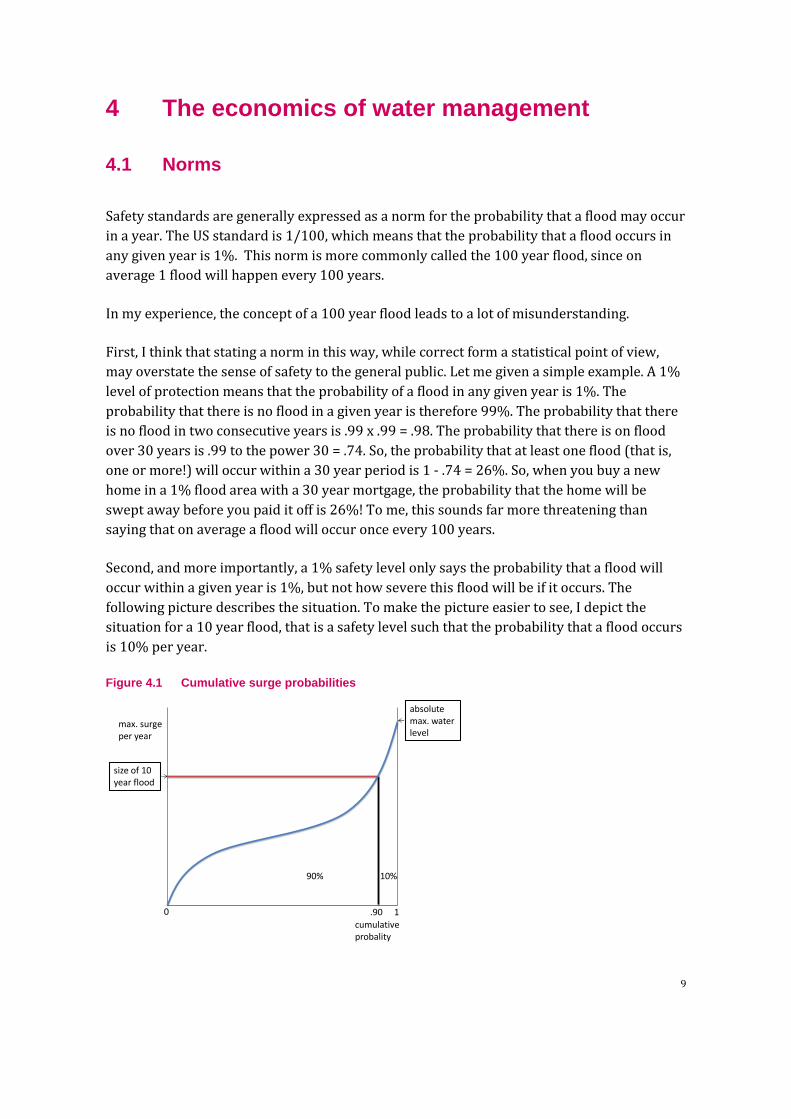
following picture describes the situation. To make the picture easier to see, I depict the
situation for a 10 year flood, that is a safety level such that the probability that a flood occurs
is 10% per year.
Figure 4.1 Cumulative surge probabilities
cumulativeprobality
10
absolute max. water level
max. surgeper year
90% 10%
.90
size of 10 year flood
10
The graph gives the cumulative distribution function of maximum storm surges per year. The
thick black line is drawn at the 90% level. This means that the probability that the water
surge in a given year will not exceed the level indicated by the thick red line is 90%. The
probability that there will be a surge higher than the red line is, therefore 10%. If a dike is
designed to withstand flood levels up to the red line, the probability that a flood will occur
within any given year is 10%. In popular language, this picture depicts the situation of a 10
year flood.
This picture is fully general and can be drawn for any flood risk situation in any region.
Clearly, the height of the red line in, say, meters depends on the region we apply this figure
to, and this number varies widely by location. For instance, on the banks of the central lake in
my home town, this height is quite low. On the Dutch coast, it is a lot higher, and in the Gulf of
Mexico it is a lot higher again.
The point I want to make here is that merely stating that the probability of a flood is 10% or
1% per year in a certain region tells only half the story about that region’s safety. The other
half is what this flood actually means in terms of destructive force. And that number varies
enormously by region.
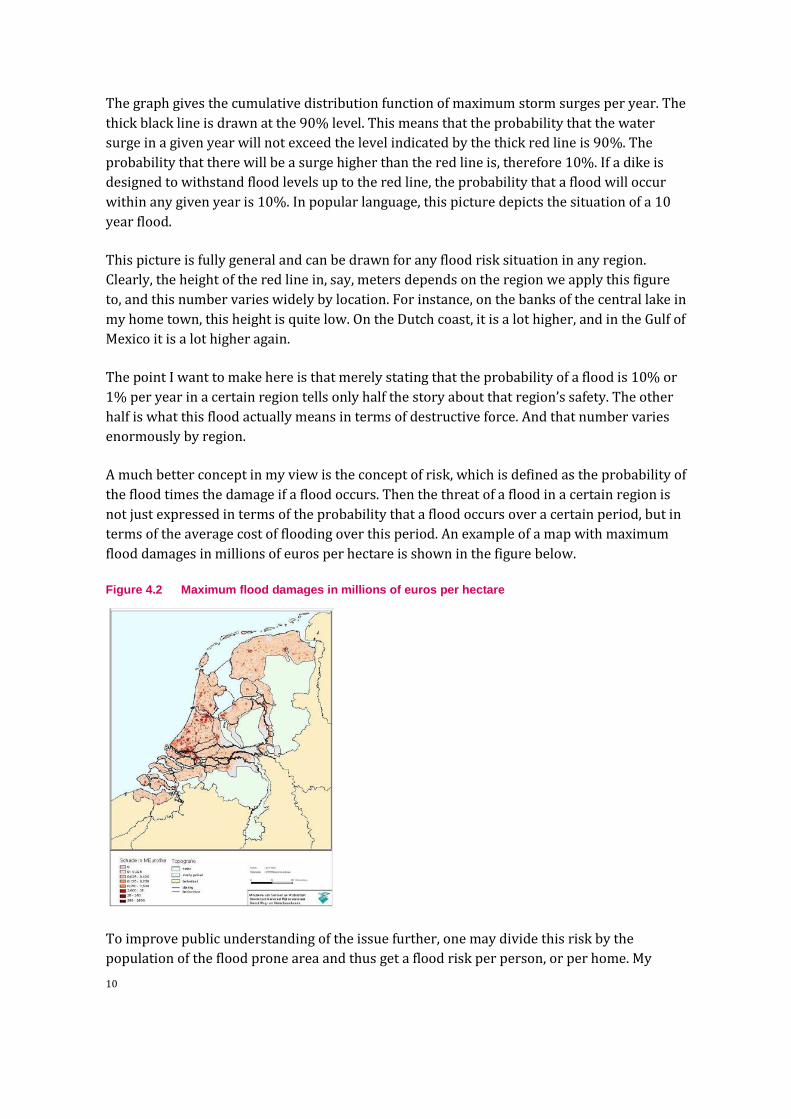
A much better concept in my view is the concept of risk, which is defined as the probability of
the flood times the damage if a flood occurs. Then the threat of a flood in a certain region is
not just expressed in terms of the probability that a flood occurs over a certain period, but in
terms of the average cost of flooding over this period. An example of a map with maximum
flood damages in millions of euros per hectare is shown in the figure below.
Figure 4.2 Maximum flood damages in millions of euros per hectare
To improve public understanding of the issue further, one may divide this risk by the
population of the flood prone area and thus get a flood risk per person, or per home. My
11
prediction is that expressing flood danger in terms of the average cost per home over the
course of a 30 year mortgage will generate more public understanding of flood dangers, and
hence more public acceptance of flood protection measures.
4.2 Optimal level of risk
The economics of the optimal safety norms is, in principle, very straightforward. First,
consider having no dikes at all. Then with certain regularity a flood will occur. Now, consider
building a small dike, say one meter. This will not cost much, and reduce the flood risk a lot.
So, that seems like a good idea. Now consider raising the dike a little more, say another
meter. This extra meter will cost more than the first meter, but decrease the flood risk less
than what was already achieved with the first meter. So, the net benefit of the second meter
is less than of the first meter, but it may still be positive, and if so, we build the extra meter.
Then consider a third meter. Again, the additional cost will be higher and the additional
benefit less than before. So the net benefit falls again. The general picture we get is that the
net benefit of raising the dike keeps falling as we raise it further. At some point, the net
benefit of raising the dike any further is zero and we stop. The dike is then at its optimal
height and the associated protection level is the optimal level from an economics point of
view. In principle, that’s all there is to it!
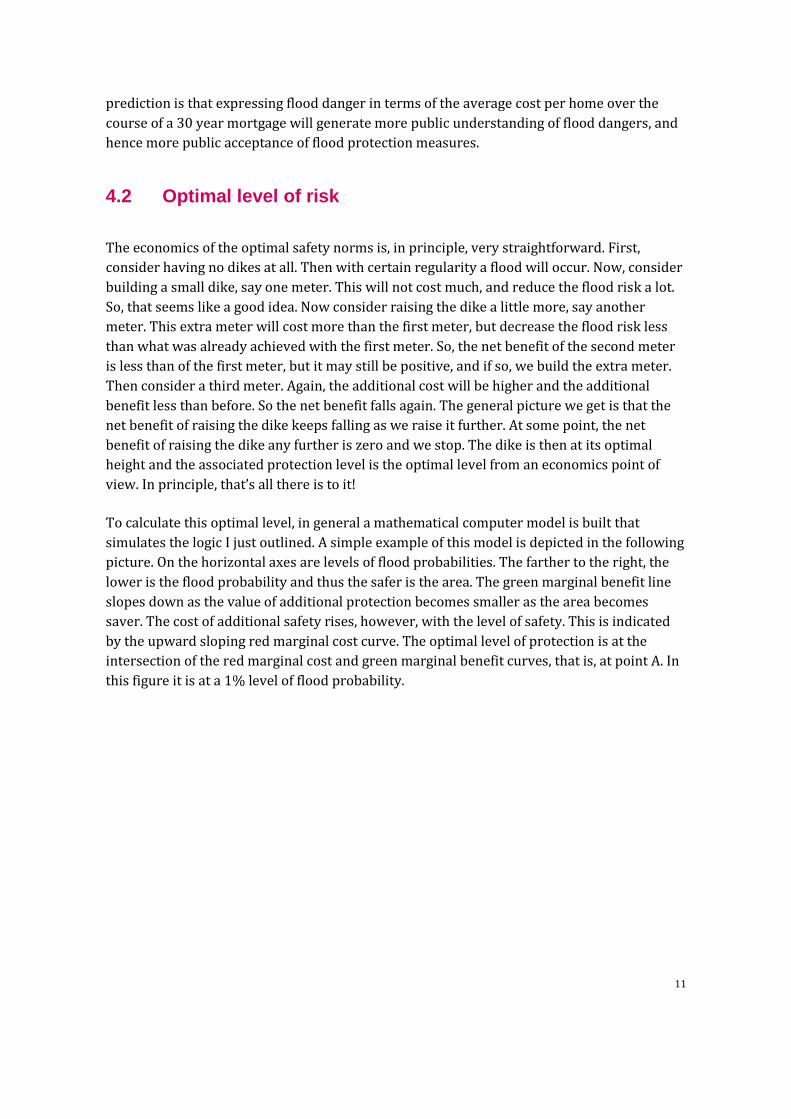
To calculate this optimal level, in general a mathematical computer model is built that
simulates the logic I just outlined. A simple example of this model is depicted in the following
picture. On the horizontal axes are levels of flood probabilities. The farther to the right, the
lower is the flood probability and thus the safer is the area. The green marginal benefit line
slopes down as the value of additional protection becomes smaller as the area becomes
saver. The cost of additional safety rises, however, with the level of safety. This is indicated
by the upward sloping red marginal cost curve. The optimal level of protection is at the
intersection of the red marginal cost and green marginal benefit curves, that is, at point A. In
this figure it is at a 1% level of flood probability.

12
Figure 4.3 Marginal benefit and cost of flood protection
The horizontal blue line gives the resulting marginal benefit of the dike. This marginal
benefit is the price people are willing to pay for a marginal increase in the dike, that is, for
the resulting reduction in the expected cost of flooding. Ceteris paribus, the more dangerous
an area is, the more people are willing to pay for a reduction in this danger and thus the
higher is the marginal benefit of raising the level of protection. The height of the blue line
may, therefore, be interpreted as an indication of the residual danger of flooding at point A.
This simple model already has some important implications. For instance, suppose that due
to say climate change, the average water level and storm severity rise. To keep the food
probability at 1%, the dike has to be raised, and the cost of flood protection rises. This is
depicted a rise in the red line. The intersection between the red and blue lines moves to
point B, and the optimal protections level falls, as shown below.
Figure 4.4 Increase in the (marginal) cost of protection, say due to worsening water conditions
probabilityof a flood
marginalcost and benefit of extra protection
.0001.001.01.11
marginal cost of extra protection
marginal benefit of extra protection
A
probabilityof a flood
.0001.001.01.11
marginalcost and benefit of extra protection
marginal cost of extra protection
marginal benefit of extra protection
A
B

13
This may at first seem to be a counterintuitive result, since we raised the dike, but the logic is
simple. The extra threat indeed leads to a higher dike, but the dike is not raised enough to
fully compensate for the increase in water threat, since that would be too expensive.
The (optimal!) probability of a flood rises, and the area becomes more risky. This can also be
seen by the rise in the marginal benefit of protection (the rise of the blue line). A higher
marginal benefit of protection means that additional protection has become more valuable,
which in turn implies that the expected cost of a flood has risen. That is, the risk has risen.
To be clear, this graph is a gross simplification of any real situation. For once, it is highly
unlikely that both curves actually are straight lines with the given slopes in any practical
application. However, I use this graph only for ease of exposition, and the qualitative
conclusion I drew from it only depend on the facts that the marginal cost curve is sloping
down and the marginal cost curve slopes up.
This analysis may also be useful when comparing flood protection levels in different regions
or countries. As I showed earlier, the protection levels on the Dutch coast vary between
1/4000 and 1/10000. The US level is a uniform 1/100, so a 40-100 fold difference. How can
this be explained?
The full explanation most likely involves many factors, such as different attitudes toward risk
and the fact that for The Netherlands the fight against water has been such a dominant part
of our history and mindset. In addition, about 2/3 of our GDP is produced in the area of the
country that is flood prone. Flood protection, therefore, is a national security issue for The
Netherlands.
A part of the story that this simple analysis can shed some light on is that water conditions
along the Gulf coast are far more dangerous than on the Dutch coast. Big and relatively
frequent hurricanes, together with the funnel-shaped bays at some of the major cities on the
Gulf coast, causes local water surges here that are unknown on the Dutch coast. The water
threat in the Gulf is, therefore, a lot higher than in The Netherlands. I have been told that this
difference in some locations may be a factor one hundred, in the sense that a 100 year storm
in these locations has about the same destructive force as a 10 000 year storm on the Dutch
coast.
In terms of our figure, the red line on the Gulf is a lot higher than on the Dutch coast. Ceteris
paribus, this implies that the optimal level of protection in the Gulf area should be (a lot)
lower than in The Netherlands. To determine how much lower, we need to know the exact
shapes of the marginal benefit and marginal cost curves. So, while I cannot tell you how
important this element is in the full story, it is part of the story, and one that in my
impression is not always given due attention.
14
4.3 Residual risk
Another result of the above model is that it is never optimal to reduce the threat of flooding
completely, since that would be way too expensive. The question then is: How do we cover
the remaining risk?
A natural first thought is to cover it through the private insurance market. In the case of
flooding, however, this is not easy. In general, insurance works well if the total amount of
damage does not vary much over time and if in any given year only a small fraction of the
insured suffer damage. In that case, in every year the total damage will be about the same
and can most of the time be financed by the total premium payments of that year. The
insurance company, and thus also the individual insured, suffer almost no risk anymore and
the risk problem has been solved.
In the case of flooding, however, neither condition is met. If a flood occurs, it does not affect
just a single home, but a whole city at the same time, and so the total damage will be very
high. Moreover, the occurrence of damage is spread out very unevenly over time, in the case
of a 100 year flood level of protection, on average only once every hundred years. So, on
average over a 100 year time period, 99 years nothing happens and the insurance only
collects premium income. Then in the year of the flood, the company suddenly has to pay out
the total amount of 100 years’ worth of premiums. To be solvent, the company always needs
to have this total amount as a buffer, also right after such a big payment has been made,
because the flood could happen any time again. Both in terms of finance and credibility, this
is virtually impossible for a private company.
Figure 4.5 How to insure homes that are identical in terms of flood incidence?
Having no insurance at all is however also a very undesirable outcome, since the damage of a
flood to the private individuals involved is so big, that many of them may not be able to bear
it.
15
So, it is natural to ask whether the government can solve this problem in a satisfactory way.
The answer is yes. First, the government has the means to keep up a buffer large enough to
pay out the claims after a flood. If necessary, it can even borrow to cover it. Second, the
government, in fact, provides insurance against all kinds of unforeseen events and
catastrophes, at least partly. Therefore, the government actually has a fairly well diversified
portfolio.
Apart from this straightforward economic insurance argument for government provided
insurance, there is also the principle of solidarity that points to the government as the
provider of insurance in this case.
Note that government insurance is not only natural in this case. It also greatly reduces the
total cost of a flood in economic and social terms as it prevents the total disruption of so
many individual lives.

16
5 Current research
The model above is very simple and abstract, and real life is complex, dangerous and very
costly. Hence more and advanced research on this topic is very important, and CPB
participates very actively in this at the highest levels, both in terms of economics and in
terms of protection design. A full overview will not be possible within this discourse, so I just
give you some of what I see as the some important current projects at CPB.
5.1 Measuring the benefits
A CBA should count all of the cost and all of the benefits to the nation as a whole. If the CBA is
positive, the nation’s welfare would increase, and the nation should implement the project.
The question as to which part of that nation, for instance the national government, a local
government, or the individuals in the flood prone area, is only a distributional issue. The CBA
may help suggest a fair division of payment, since it decomposes the costs and benefits by
type and thus indirectly also by beneficiary. However, distributional issues are not primarily
the domain of politics, not of economics. The Flood Control act of 1936 took this same stand
with its famous requirement that no flood control project could receive federal funds unless
its benefits, “to whomsoever they may accrue,” were projected to exceed its costs.
Stating that a CBA should count all of the cost and all of the benefits is, however, more easily
said than done. In terms of benefits, two questions arise. First, what are all of these benefits
and second, can we attach a dollar value to them all? Both questions are important areas of
research at CPB.
Globally speaking, there are three types of benefits:
1. The direct monetary benefits. These are economic benefit resulting from the project,
keeping all other things constant. In the case of flood defenses, this basically amount
to the dollar value of damage prevented.
2. The indirect monetary benefits. These are the economic benefits resulting from
changes in the economy caused by the project. In case of flooding, it could involve
changes in the level of economic activity in the flood prone area.
3. Non-monetary benefits. These are the benefits for which no market price is available,
mostly because the things involved are not traded commercially. In the case of flood
protection, the most important element in this category is the prevention of human
death and suffering. But also effects on natural environment, such as biodiversity fall
in this category.
The ultimate goal in CBA research is twofold: first, to create a complete list of the effects and
to design methods of assigning dollar amounts to all of them, and second, to get these
methods codified in the form of uniform guidelines of CBA accounting.

17
In many ways, this research agenda is very similar to that in the field of financial accounting,
where official accounting rules are well documented and universally applied. Moving
forward in this way will make a CBA not only a complete, but also a uniform, universally
accepted, and checkable way of determining the value of a project.
The Deltawerken
To give you an indication of the progress that has been made in the area of CBA accounting
and of the relative importance of the above three categories, I compare two CBA’s made by
CPB of the same project (or more accurately, a series of projects), namely the famous
Deltawerken.
Figure 5.1 Deltawerken
The first one was performed by our first director and Nobel Prize winner Tinbergen himself.
He made this CBA in 1961, so in the planning stage of the project. The second was done by
Don and Stolwijk in 2003. Don was the director of CPB at that time. So this second CBA
looked at the actual results and was de facto an exercise in checking whether the project had
lived up to its promise.
Comparing the two CBA’s, we see some remarkable similarities and differences. The most
important similarity is the conclusion. Both CBA’s conclude that the Deltawerken were a
good project with a positive CBA result.
However, the differences are just as interesting. The total cost of the Deltawerken turned out
to be dramatically higher than Tinbergen’s estimate, but this was not Tinbergen’s fault. Don
and Stolwijk conclude that if the program had been built according to its original design,
Tinbergen’s cost estimate probably would have been about right. However, this design
meant that whole tidal inlets would be cut off from the sea with dramatic consequences for
the local ecology. In the 1950’s this was not an issue, and Tinbergen did not even mention it.

18
Over time however, the environment became an increasing public concern worldwide, and
also in The Netherlands. While the Deltawerken were built piece by piece, pressure grew to
modify the design of the remaining part. In 1976, mostly due to pressure from the
environmental lobby, it was decided that the biggest estuary would not be cut off from the
sea by a fixed dam but by storm surge barrier that is open during normal conditions, but can
be closed when a severe storm is expected, the Oosterscheldekering.
Figure 5.2 Movable barriers in the Oosterscheldekering
Under normal circumstances, the flood barrier is raised, so that water can flow freely
underneath. In case of a severe flood danger, it is lowered into the water and blocks the
flood. Overall, this design change raised the total cost by about factor 6!
However, also the benefits of the Deltawerken turned out to be far higher than Tinbergen
thought. By far the biggest benefit in Tinbergen’s CBA was the direct benefit of prevention
physical damage. To his credit, he also mentioned several indirect benefits such as a
reduction of travel time (since a road would be built on top of the new dike) and several
benefits associated with creating huge new supplies of fresh water, to be used for
agriculture, drinking water, fisheries and recreation. But Tinbergen thought that these
benefits were all relatively small.
It turned out, however, that there benefits were huge and dwarfed the direct benefits. Until
the 1960’s, the region was mostly agricultural with little manufacturing. The strong
economic regions of Rotterdam and Antwerp were close by in meters as the crow flies, but
almost inaccessible in practice because of the long sea arms which effectively cut the region
off. As a result, economic growth had been lagging the country’s average for decades and the
population had been declining for a long time.

19
Figure 5.3 New road on the Oosterscheldekering
The new road straight down the outer coast changed all that. Agriculture, recreation and
manufacturing flourished. The region suddenly experienced a higher growth rate than the
country’s average and the population rose again. Don and Stolwijk say that even with
hindsight, it is impossible to put a euro amount on this benefit, because it was so pervasive
and because we do not know what would have happened to the region without the dam.
However they conclude that, also with hindsight, Tinbergen’s overall conclusion that the
Deltawerken was a good project was correct. With a little hand waving, one might interpret
this conclusion as saying that the benefits were also higher than originally estimated by
about a factor 6.
So, on net the 2 CBA’s had a similar net result, but underneath a lot had changed. Tinbergen’s
CBA was state-of-the-art. However, with such a long construction time and with an
enormous impact on the region’s infrastructure and environment, unexpected events are
almost sure to occur.
In a sense, this project illustrates both the strength and the weakness of CBA’s of big projects.
Tinbergen made the best possible overview of the costs and benefits at the time, thus giving
policy makers the best shot at a wise decision. However, he could not possibly have
predicted the change in public attitude towards the environment. Neither could he have
foreseen the impact of the new infrastructure on the regional development. A CBA is not a
fortune-teller.
5.2 Methods of protection
Back in the times when the Afsluitdijk was built, say the 1930’s, the Dutch thinking about
flood protection was very straightforward, and highly understandable given our history of
constant struggle with water. It basically said: build a dike so strong, so high and so wide that
20
we will never have this type of flood again. So there was a very strong feeling of “never
again”, which often garners strong and universal public support for a certain project. The fact
that it cost 2% of GDP was almost irrelevant.
The Afsluitdijk indeed was and still is a monumental construction, and a justified source of
national pride and international acclaim. It is, for instance, clearly visible from outer space.
However, the thinking about flood protection has evolved since then for a variety of reasons.
One is that such a mammoth outer dike has an enormous effect on the natural environment,
for better or worse. As insights about the value of these indirect effects change over time, one
might have opted for another solution with hindsight, but changing strategies after such a
dike has been built is so costly that it becomes almost impossible. This lack of flexibility is
now seen as a major disadvantage of the Afsluitdijk.
A second issue, which is more directly related to the issue of flood protection itself, is that
dikes may by not always be the best way to protect the land. In some circumstances, it may
actually worsen the flood if it occurs. Open bays, particularly funnel-shaped estuaries, tend to
increase the storm surge, resulting in higher water levels during a storm. Building a single
dike to protect such an area does two things. Most of the time, it stops the water as intended.
Obviously, the higher the dike, the higher the water level can become in front of the dike. At
some point, however, this creates a danger in itself. If a very high dike does break, a very high
wall of water will suddenly surge into the land, with enormous mass and destructive power.
Building a very high dike may thus be like bending a bow and releasing the arrow when the
bow is bent to the maximum degree. This will maximize the force of the arrow and inflict
maximum damage on the enemy. Except, in this case, the enemy is us!
Current research is working on several alternatives to a single dike solution. One is to build
two dikes, an outer dike and an inner dike. The first is a dam closing off the estuary from the
sea, effectively turning the estuary into a possibly huge lake. Since it is a dam dividing two
bodies of water, it will function as long as little overtopping occurs. With hind side, this is the
main contribution of the Afsluitdijk to water safety in the north of The Netherlands.

21
Figure 5.4 Zuiderzee before the Afsluitdijk (left) and IJsselmeer with dams (right)
This mechanism is shown in the following picture. The top half of the picture shows the
situation under normal circumstances. The IJsselmeer, the open sea and the land all are at
about the same level. There are two dikes, one turning the estuary into a lake and a second
directly in front of the land to be protected. Suppose that both dikes are equally tall. Now
suppose there is a storm that raises the sea level to the full height of the dikes. On the sea
side of the outer dike, the sea level reaches the top of the dike as shown in the picture. If the
local dike had been the only dike, the sea water would have reached the top of it. However,
because of the Afsluitdijk, the wind cannot bring additional water into the lake. It only brings
the water level inside the lake at a slant, as shown in the picture. The weight of the water at
the local dike provides a counterforce to the wind, moving the water back out, away from
that dike. As a result, the surge height at the local dike is lower than at the Afsluitdijk and
thus lower than it would have been without that dike.
Figure 5.5 How the Afsluitdijk works
While this picture seems straightforward, the problem of determining the optimal dike
height and strength becomes very hard. Now we have two dikes that provide safety as a pair,
Land IJsselmeerlocal dike Afsluitdijk Open sea
Land IJsselmeerlocal dike Afsluitdijk Open sea
22
and we need to determine the strengths and heights of these two dikes as a joint problem.
Until recently, models of water safety were not able to solve it, and engineers had to rely on
an educated guess. A natural first guess might be to make both dikes equally strong. Current
safety rules in The Netherlands are indeed based on this idea.
In what may be a breakthrough for this kind of problem, CPB has just developed a way to
solve this problem numerically for this combination of dikes. Surprisingly, the natural first
guess is not optimal at all. Instead, the new calculations indicate that it is optimal to allow the
outer dike to have a failure rate far higher than that of the local dike. I have to add at this
point that this result is still somewhat preliminary, in that the outside academic review has
not been completed. But the result seems robust enough that I can mention it here in a
qualitative way. If this result holds up, it may have a big impact on construction plans and
help to achieve the same level of protection at a far lower cost.
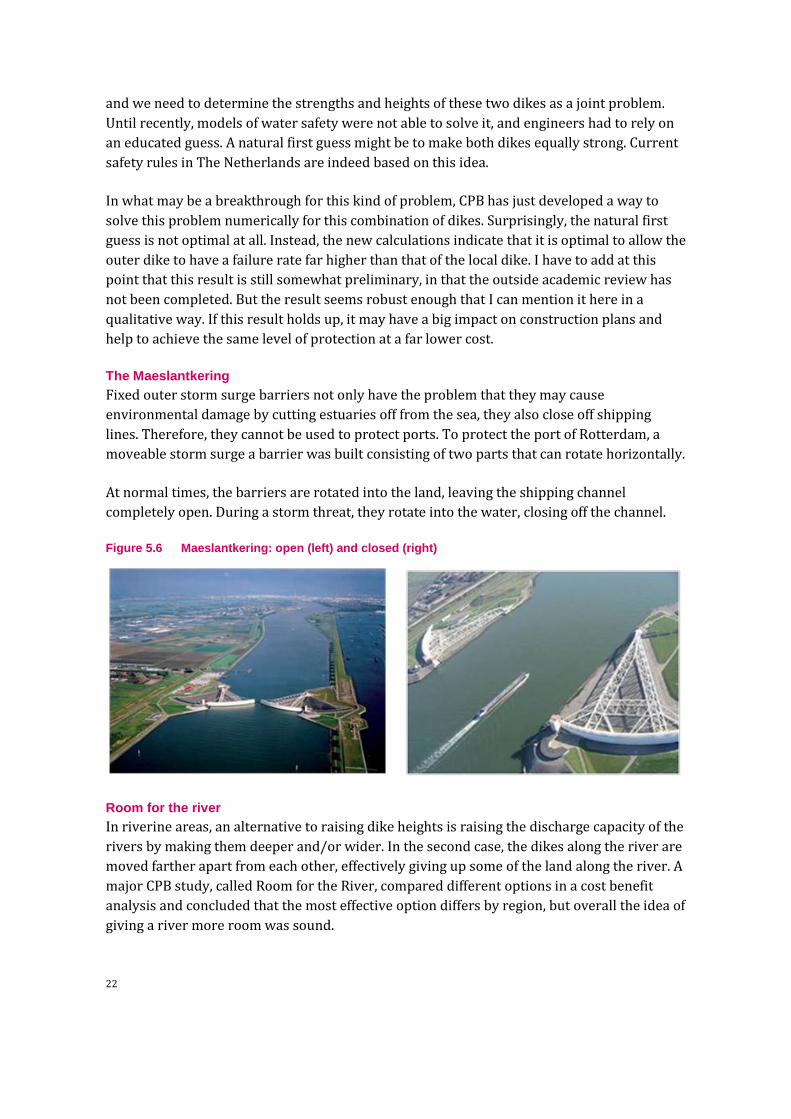
The Maeslantkering
Fixed outer storm surge barriers not only have the problem that they may cause
environmental damage by cutting estuaries off from the sea, they also close off shipping
lines. Therefore, they cannot be used to protect ports. To protect the port of Rotterdam, a
moveable storm surge a barrier was built consisting of two parts that can rotate horizontally.
At normal times, the barriers are rotated into the land, leaving the shipping channel
completely open. During a storm threat, they rotate into the water, closing off the channel.
Figure 5.6 Maeslantkering: open (left) and closed (right)
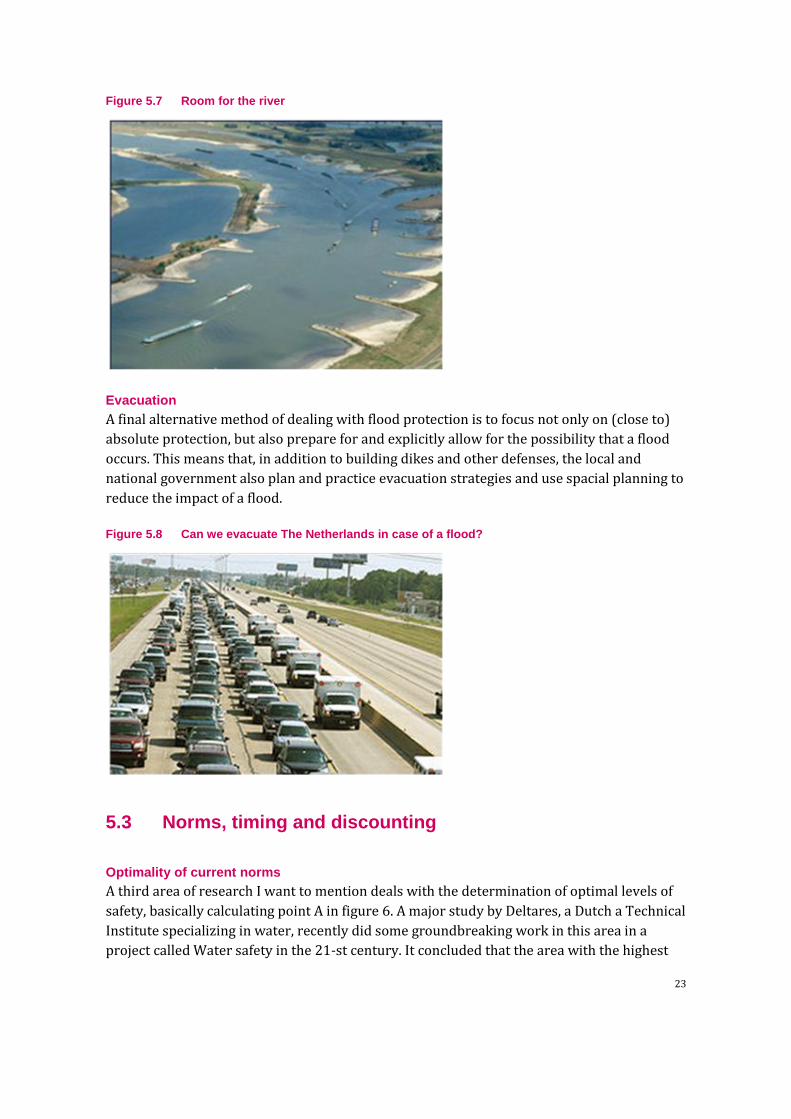
Room for the river
In riverine areas, an alternative to raising dike heights is raising the discharge capacity of the
rivers by making them deeper and/or wider. In the second case, the dikes along the river are
moved farther apart from each other, effectively giving up some of the land along the river. A
major CPB study, called Room for the River, compared different options in a cost benefit
analysis and concluded that the most effective option differs by region, but overall the idea of
giving a river more room was sound.
23
Figure 5.7 Room for the river
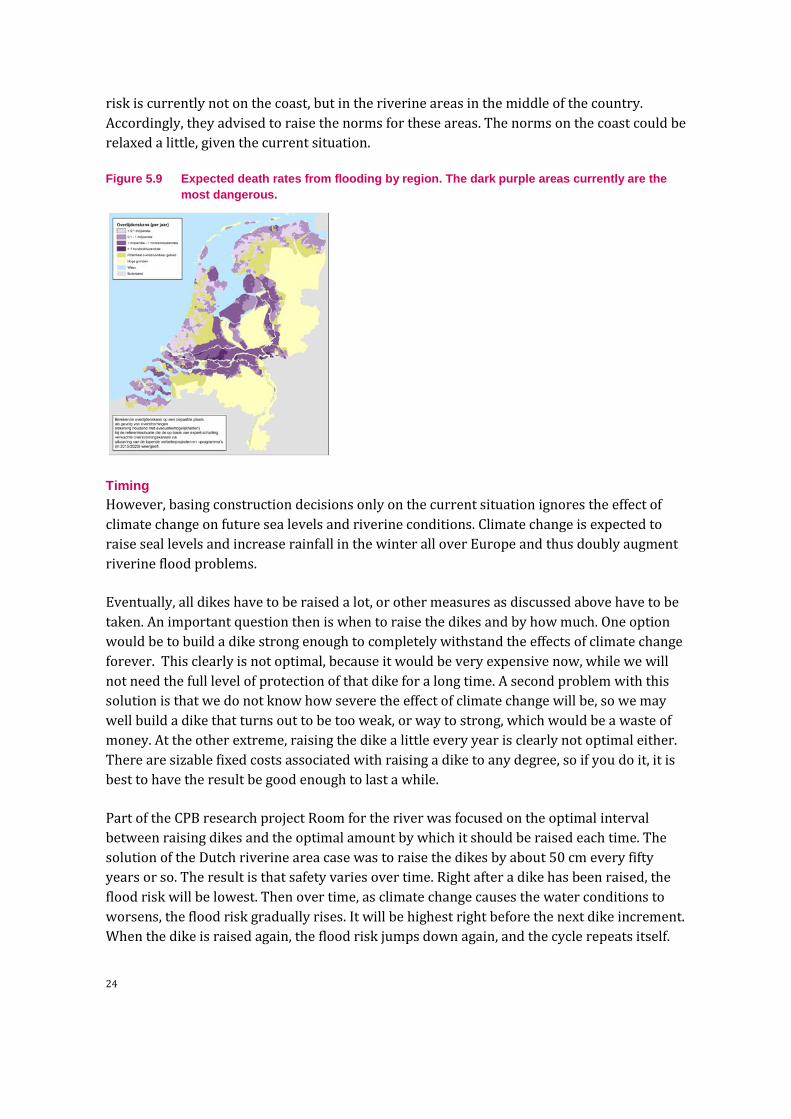
Evacuation
A final alternative method of dealing with flood protection is to focus not only on (close to)
absolute protection, but also prepare for and explicitly allow for the possibility that a flood
occurs. This means that, in addition to building dikes and other defenses, the local and
national government also plan and practice evacuation strategies and use spacial planning to
reduce the impact of a flood.
Figure 5.8 Can we evacuate The Netherlands in case of a flood?
5.3 Norms, timing and discounting
Optimality of current norms
A third area of research I want to mention deals with the determination of optimal levels of
safety, basically calculating point A in figure 6. A major study by Deltares, a Dutch a Technical
Institute specializing in water, recently did some groundbreaking work in this area in a
project called Water safety in the 21-st century. It concluded that the area with the highest
24
risk is currently not on the coast, but in the riverine areas in the middle of the country.
Accordingly, they advised to raise the norms for these areas. The norms on the coast could be
relaxed a little, given the current situation.
Figure 5.9 Expected death rates from flooding by region. The dark purple areas currently are the
most dangerous.
Timing
However, basing construction decisions only on the current situation ignores the effect of
climate change on future sea levels and riverine conditions. Climate change is expected to
raise seal levels and increase rainfall in the winter all over Europe and thus doubly augment
riverine flood problems.
Eventually, all dikes have to be raised a lot, or other measures as discussed above have to be
taken. An important question then is when to raise the dikes and by how much. One option
would be to build a dike strong enough to completely withstand the effects of climate change
forever. This clearly is not optimal, because it would be very expensive now, while we will
not need the full level of protection of that dike for a long time. A second problem with this
solution is that we do not know how severe the effect of climate change will be, so we may
well build a dike that turns out to be too weak, or way to strong, which would be a waste of
money. At the other extreme, raising the dike a little every year is clearly not optimal either.
There are sizable fixed costs associated with raising a dike to any degree, so if you do it, it is
best to have the result be good enough to last a while.
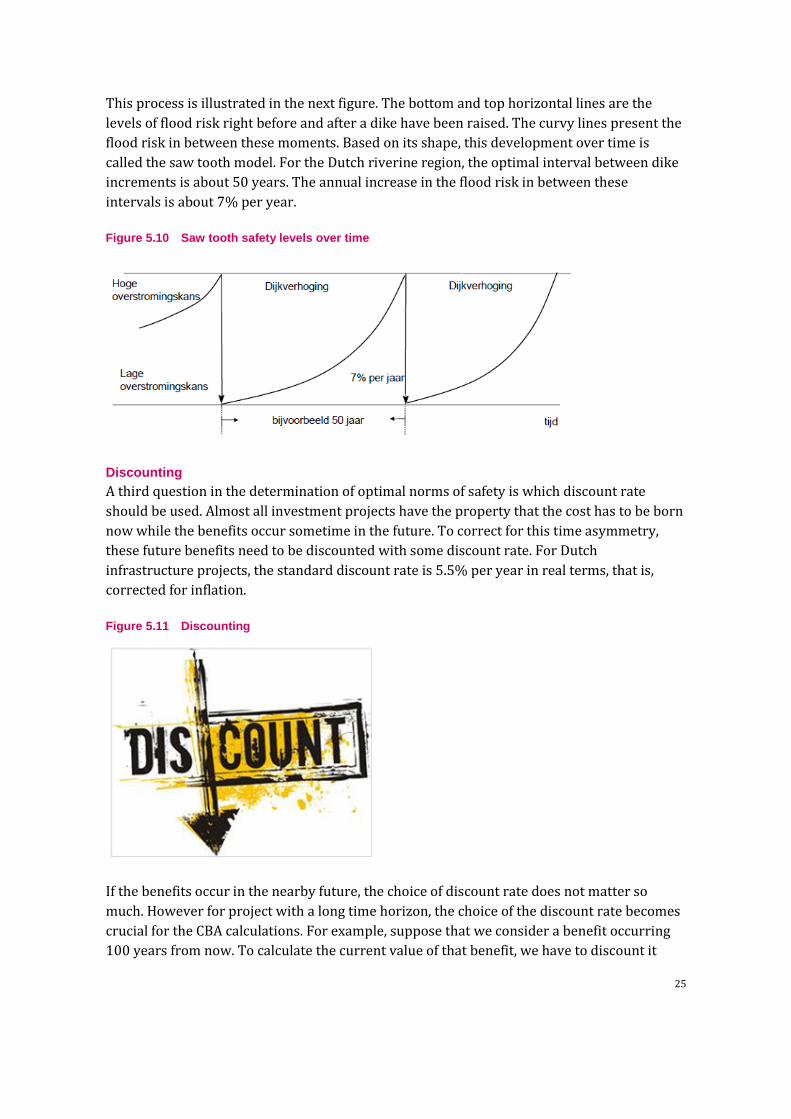
Part of the CPB research project Room for the river was focused on the optimal interval
between raising dikes and the optimal amount by which it should be raised each time. The
solution of the Dutch riverine area case was to raise the dikes by about 50 cm every fifty
years or so. The result is that safety varies over time. Right after a dike has been raised, the
flood risk will be lowest. Then over time, as climate change causes the water conditions to
worsens, the flood risk gradually rises. It will be highest right before the next dike increment.
When the dike is raised again, the flood risk jumps down again, and the cycle repeats itself.
25
This process is illustrated in the next figure. The bottom and top horizontal lines are the
levels of flood risk right before and after a dike have been raised. The curvy lines present the
flood risk in between these moments. Based on its shape, this development over time is
called the saw tooth model. For the Dutch riverine region, the optimal interval between dike
increments is about 50 years. The annual increase in the flood risk in between these
intervals is about 7% per year.
Figure 5.10 Saw tooth safety levels over time
Discounting
A third question in the determination of optimal norms of safety is which discount rate
should be used. Almost all investment projects have the property that the cost has to be born
now while the benefits occur sometime in the future. To correct for this time asymmetry,
these future benefits need to be discounted with some discount rate. For Dutch
infrastructure projects, the standard discount rate is 5.5% per year in real terms, that is,
corrected for inflation.
Figure 5.11 Discounting
If the benefits occur in the nearby future, the choice of discount rate does not matter so
much. However for project with a long time horizon, the choice of the discount rate becomes
crucial for the CBA calculations. For example, suppose that we consider a benefit occurring
100 years from now. To calculate the current value of that benefit, we have to discount it

26
over a period of 100 years. If the discount rate is 5.5% per year, we have to divide it by 1.055
to the power 100, that is, by 211. So, the benefit of 100 dollars 100 years in the future is
worth only 47 cents today. At a discount rate of 3% per year, that same 100 dollars is worth
5.2 dollars today. If we reduce the discount rate further to 1%, as some people suggest may
be appropriate for such projects, that 100 dollars in the future is suddenly worth 37 dollars
today, 79 times as much as when using the official 5.5% discount rate.
So, the discount rate matters. Fortunately, the debate about climate change has sparked a fair
amount of new research on the appropriate discount rate, also among top (Nobel Prize
winning) economists. CPB is also involved in this research. I do not have time here to discuss
this, but I would be happy to talk about it afterwards.

27
6 The way forward
Water has always been an important part of The Netherlands. Climate change poses new
challenges, and research on flood prevention systems is, therefore, very important for us.
Whatever measures we come up with, they will be expensive. Cost benefit analysis helps to
rationalize the discussion on how much money should be spent on these measures.
Therefore, research on and the application of cost benefit analysis is also very useful.
Flood prevention thus has a technological and an economic side, and they increasingly go
hand in hand. In The Netherlands, this is leading to more and better cooperation between the
disciplines of engineering and economics. CPB is strongly in favor of this. For instance, we
currently cooperate with Deltares, a Technical Institute specializing in water, subsoil and
infrastructure; Arcadis, a Dutch international engineering firm who is also very active in the
US; and the Royal Netherlands Meteorological Institute.
Climate change will cause similar problems in many countries. By necessity, The Netherlands
have had an early start in flood prevention research and projects. At this point, given
common challenges, increasing international cooperation seems a natural next step. There
already is fruitful cooperation in the New Orleans area. I believe that strengthening this kind
of cooperation will benefit both of us. Thank you very much for your attention.