The Economics of Building Tall · Contact James Barton Director – Cost Management D +44 (0)20...
27
The Economics of Building Tall James Barton 29 th May 2014
Transcript of The Economics of Building Tall · Contact James Barton Director – Cost Management D +44 (0)20...

The Economics of Building Tall
James Barton
29th May 2014

Contact
James Barton Director – Cost Management D +44 (0)20 7061 7292 [email protected] AECOM MidCity Place, 71 High Holborn, London WC1V 6QS T +44 (0)20 7061 7000 F +44 (0)870 048 6055 www.aecom.com
19 Years at AECOM Specialisms include: - • Tall Buildings • Private Residential • Mixed Use Development
Project Experience includes: • The Shard • One Blackfriars • The Tower, One St George Wharf • Decathlon, Canada Water • The Corniche • Paradise Street Liverpool • Principal Place • Battersea Power Station

− Background & Context
− Value and the effect of Location & Height
− The Financial Challenges of Tall
− Design Economics & the Efficiency Drive
AGENDA

− Residential Renaissance – increasing trend for residential towers
− Intensity in Residential Development dictated by:
− Lack of high quality Residential stock
− Increasing land values
− Unprecedented growth in sales
− Resistance to market volatility and price stagnation
− Extraordinary growth outside of traditionally strong areas
BACKGROUND & CONTEXT

BACKGROUND & CONTEXT - Residential

− Office Rentals – now weathered the storm
− Pre Recession – Upward trends and iconic architecture
− Post – Focus on Efficiency and simpler forms – Lipton
BACKGROUND & CONTEXT - Offices

SO WHAT?
SO WHAT?
INCREASING DEMAND ON LAND AND PARTMENTS……,
SPEED TO MARKET & INFLATIONARY PRESSURE
NEED TO FOCUS ON ALIGNMENT OF DESIGN AND REVENUE,
OPTIMIZATION OF DESIGN ECONOMICS AND MINIMIZATION
OF COSTS

VALUE & THE EFFECT OF LOCATION & HEIGHT
- London seen as a ‘Safety Deposit Box for International Investors’ – Peter Rees
- Location plays a fundamental role in sales and rental values Residential £700/sq.ft (Clapham) to £4,000 - £5,000/sq.ft (Super prime locations) Offices £35 – 45/sq.ft (Canary Wharf) to £ 60 – 70/sq.ft+ (City)
- The combination of tall building clusters provided by the GLA and location therefore has a significant viability relationship
- Tall Buildings do however add further value through increasing height
Residential – 1.5% per floor (2.2% including penthouses)
Offices – No formal report, but increased rents evidenced in current lettings at higher floors e.g. Walkie Talkie
The Financial Challenges of Building Tall

The Financial Challenges of Building Tall
− Towers inherently cost more to build (£/sf), take longer to construct and are less efficient (net to gross, wall to floor)
− Fundamental measures that underpin viability are cost, time and floor area efficiencies
− Ultimately, whilst the residual land value and development costs will be more, the additional density should result in significantly greater return on investment
− VALUE less COST = PROFIT
− Marked difference in value profiles , their costs reveal different profiles

HEIGHT AND COST

THE FINANCIAL CHALLENGES OF BUILDING TALL
Element Offices Residential
Low Rise (£/sf)
High Rise (£/sf)
Low Rise (£/sf)
High Rise (£/sf)
Substructures 13 20 10 13
Frame 28 50 25 30
Façade 35 45 38 45
Balconies / W/G - - 5 9
Walls & Finishes 14 22 10 13
Services 35 41 24 31
Lifts 10 18 5 8
On costs 40 50 28 41
Shell & Core 175 250 140 190
Typical Range 170 - 200 210 -275 130 – 150 170 – 210
% Increase for tall 25 to 40% 30 to 40%
Note: Notional shell & core costs only (excluding fit out). Costs will inevitably vary according to location, site, etc.

TALL BUILDINGS - COST DRIVERS
− Form, shape and technical complexity drive costs
− Iconic Architecture & Social Recognition - The ‘Hat & Boots’ effect
− Structure – The lateral and vertical loads require additional restraints (outriggers, external bracing, enhanced cores, etc)
− Facades – Slenderness ratios typically drive additional costs on towers, as well as additional performance requirements to deal with wind loadings, mitigation of solar gain, etc)
− Balconies (Resi) – At height balconies become less desirable, with more expensive solutions such as recessed balconies and winter gardens being used.
− Services – The need to boost water supplies and pressurization of heating and cooling solutions generate further cost, whilst also reducing efficiency due to additional intermediate plant floors
− Lifts – Likely additional numbers and speeds
− Logistics – Typically in desirable locations, with high land values and restricted sites which has a profound effect on logistics, working restrictions, labour productivity and health and safety measures

DESIGN ECONOMICS
HITTING THE SWEET SPOT A few key thoughts…….
DESIGN ECONOMICS

BIG IS BEAUTIFUL! Maximize floorplate size
Fundamental questions MAXIMISING FLOORPLATE DESIGN

OPTIMISING FLOORPLATE DESIGN
DESIRABLE LESS DESIRABLE
Note: Extract from a study conducted by Aedas Architects/Expedition Engineering/Davis Langdon
Cost
£/m² NSA
Efficiency
Net to Gross Ratio
Façade Area
Wall to Floor Ratio
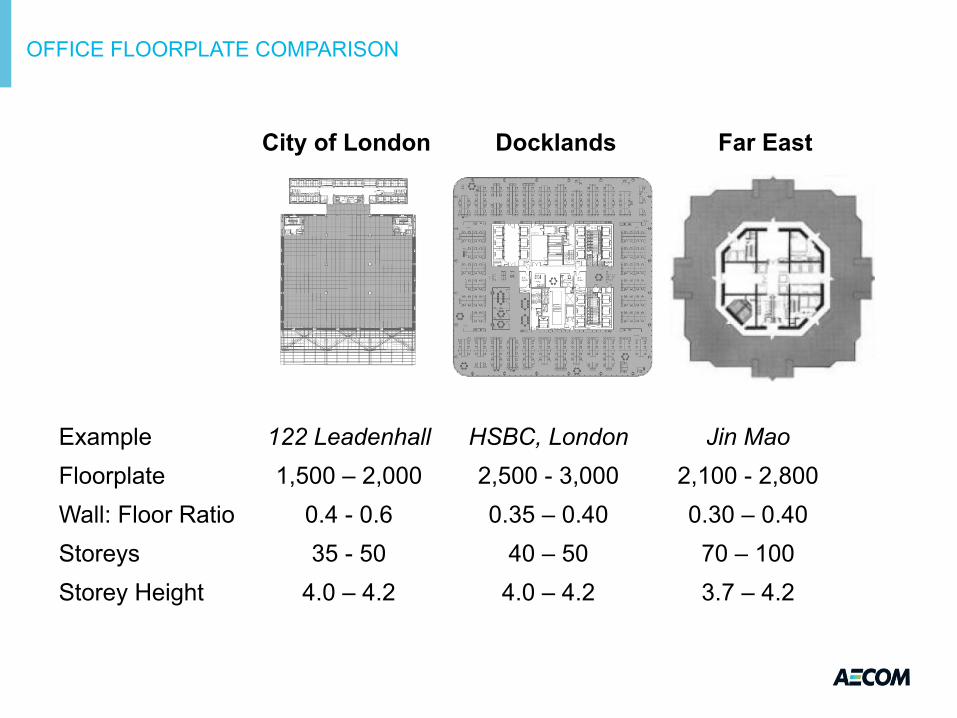
OFFICE FLOORPLATE COMPARISON
Example 122 Leadenhall HSBC, London Jin Mao Floorplate 1,500 – 2,000 2,500 - 3,000 2,100 - 2,800 Wall: Floor Ratio 0.4 - 0.6 0.35 – 0.40 0.30 – 0.40 Storeys 35 - 50 40 – 50 70 – 100 Storey Height 4.0 – 4.2 4.0 – 4.2 3.7 – 4.2
City of London Docklands Far East

RESIDENTIAL FLOORPLATE COMPARISON
UK Example Middle East Example
Optimum Floorplate size (m²) 650 - 750 1,500 - 2,500
Typical Floorplate Net to Gross (%) 79 - 84 79 – 83
Typical apartment size (m²) 50 - 75 70 - 130
Wall to Floor Ratio 0.40 – 0.6 0.40 – 0.65
Typical Storey Height (m) 2.90 – 3.20 3.0 - 3.6
Nr of Cores 1 2

OPTIMISING FLOORPLATE DESIGN
The Effect of £/m² GFA Based on £700/m² Average Façade Rate
£/m² GFA
% Uplift
£200/m²
-
Wall to Floor 0.29
£300/m²
+50%
0.43
£370/m²
+86%
0.53
£520/m²
+160%
0.74
Target Range 0.45 – 0.55

THE IMPACT OF BALCONIES & WINTERGARDENS
Gross Floor Area
Net to Gross Ratio
Wall to Floor Ratio
Cost Uplift per sqm net area
No Balconies
760m²
80%
0.45
-
External Balconies
760m²
80%
0.45
+ 9%
Winter Gardens
760m²
80%*
0.45
+ 30%
Recessed Balconies
700m²
78%
0.60
+ 26%

EAT AWAY AT THE CORE……to maximize net to gross
Fundamental questions MAXIMISING NET TO GROSS

The proportion of saleable space relative to space lost to circulation, structure, and services distribution
NET TO GROSS RATIO
Tall Buildings – Overall Typical Net to Gross Ratio Above Ground
Net to Gross Efficiency
Typical Tower Net : Gross
81% - 84%
0 – 10 Storeys
80% - 83%
11 – 20 Storeys
78% - 81%
21 – 30 Storeys
76% - 80%
31 – 40 Storeys
75% - 79%
41 – 50 Storeys Reduced Efficiency
Structural Solution
Vertical Circulation
Servicing Strategy
Refuse Strategy

questions
Understanding the next threshold and design within it e.g. when will an additional lift or intermediate plant floor need to be introduced
UNDERSTANDING THRESHOLD LEVELS

- Should Offices be designed for higher occupancy densities ?
QUESTION FUTURE FLEXIBILITY

SIMPLICITY & CONSISTENCY
FINAL THOUGHT !