
THE ECONOMICS BEHIND ELECTRIC VEHICLES: AN …docs.trb.org/prp/13-2019.pdf · 1 THE ECONOMICS...
21
Windisch 1 THE ECONOMICS BEHIND ELECTRIC VEHICLES: 1 AN ANALYSIS FROM THE PRIVATE USER’S PERSPECTIVE IN 2 FRANCE 3 4 Submission date : 31 st of July 2012 5 Re-submission date : 15 th of November 2012 6 7 Authors : 8 9 Elisabeth Windisch (Corresponding author) 10 City Mobility Transport Laboratory (LVMT), Ecole des Ponts ParisTech, University of East-Paris 11 6 et 8, avenue Blaise Pascal 12 Cité Descartes Champs-sur-Marne 13 F-77455 Marne-la-Vallée Cedex 2 14 T: +33 1 6415 2054 15 F: +33 1 6415 2140 16 [email protected] 17 18 TRB 2013 Annual Meeting Paper revised from original submittal.
Transcript of THE ECONOMICS BEHIND ELECTRIC VEHICLES: AN …docs.trb.org/prp/13-2019.pdf · 1 THE ECONOMICS...
Windisch
1
THE ECONOMICS BEHIND ELECTRIC VEHICLES: 1
AN ANALYSIS FROM THE PRIVATE USER’S PERSPECTIVE IN 2
FRANCE 3
4
Submission date: 31st of July 2012 5
Re-submission date: 15th of November 2012 6
7
Authors: 8
9
Elisabeth Windisch (Corresponding author) 10
City Mobility Transport Laboratory (LVMT), Ecole des Ponts ParisTech, University of East-Paris 11
6 et 8, avenue Blaise Pascal 12
Cité Descartes Champs-sur-Marne 13
F-77455 Marne-la-Vallée Cedex 2 14
T: +33 1 6415 2054 15
F: +33 1 6415 2140 16
18
TRB 2013 Annual Meeting Paper revised from original submittal.

Windisch
2
ABSTRACT 1
2
A holistic total costs of ownership (TCO) approach compares electric with conventional vehicles (EVs 3
with CVs). The impact of policy measures and market trends throughout time is studied; the inclusion 4
of vehicle user- and vehicle usage-characteristics in the set-up calculation model ensures a 5
disaggregate approach that allows for detailed EV-demand projections in future studies. Each vehicle 6
technology accommodated in the set-up TCO calculation model is represented by specific vehicle 7
models that are currently available on the French market. Their characteristics and costs serve as the 8
basis of TCO calculations. Results show that the underlying plug-in hybrid electric vehicle (PHEV) 9
model is, from a TCO perspective, not competitive with any other electric or conventional vehicle 10
underlying the analysis. This is valid for all developed scenarios and realistic vehicle usage patterns. 11
Assuming that the here selected vehicle models well represent the vehicle technologies in question, it 12
can be expected that the future demand of PHEVs having long electric ranges will fully rely on the 13
goodwill of selected users. The most competitive electric EV type appears to be the battery electric 14
vehicle with battery hire. The development of ‘financially reasoned’ demand for this vehicle and 15
business model seems therefore realistic. Generally, compact electric vehicles that are to replace petrol 16
vehicles appear to be more competitive with their conventional counterparts than sedan vehicles that 17
are to replace diesel-driven vehicles. All results refer to current and forecasted French framework 18
conditions and are subject to various necessary assumptions. 19
TRB 2013 Annual Meeting Paper revised from original submittal.

Windisch
3
INTRODUCTION 1
2
Context and Objective 3
4
While more and more consensus is found on the potential advantages of electric vehicles (EVs), EV 5
demand forecasts remain contested. As is the rule for new technologies, there are many uncertainties 6
that make predictions of prospective customers’ choices unreliable. One of them is the often 7
questioned financial advantage of an EV over its conventional counterpart (conventional vehicle – 8
CV) – a likely driving force behind successful EV uptake. Due to different cost structures of the 9
diverse vehicle types, such an analysis of an alleged financial advantage of EVs over CVs requires an 10
approach that takes account for both purchase and vehicle usage costs during the whole ownership 11
period of the vehicle. A so-called ‘total costs of ownership’ (TCO) calculation constitutes such a 12
holistic approach. EV-supportive stakeholders are trying to increase the sensitivity of prospective 13
private vehicle purchasers to the TCO of their possible vehicle choices. Assuming that these efforts 14
are fruitful, TCO will become an increasingly important vehicle purchase criterion. 15
In this paper, potential financial advantages or disadvantages of an EV purchase for a private user 16
are explored. We identify framework conditions under which a certain vehicle type is the most 17
competitive under current French framework conditions and specifically in the Paris region, which 18
allows for assessing the impact of regional and local characteristics. The conceived model 19
incorporates CVs and EVs. The latter are distinguished into battery electric vehicles (with a battery 20
purchase option (BEV) and a battery hire option (BEV-Hire)) and plug-in hybrid electric vehicles 21
(PHEVs). Vehicle characteristics and costs refer to specific vehicle models currently available on the 22
French market. They represent the different vehicle technologies. 23
24
Literature Review 25
26
In literature, the TCO approach has become the routine for comparing the costs of EVs and CVs for a 27
vehicle owner and user. However, not all applied approaches are seen as similarly reliable. A literature 28
review allowed establishing the following list of criteria by the means of which the informative value 29
of existing TCO studies can be verified: 30
31
1. Detailed TCO calculation. The study takes a comprehensive TCO approach. Besides vehicle 32
purchase costs and energy costs, also costs for maintenance and insurance are accounted for. 33
Parameter settings (in particular those of energy prices) are adjusted throughout the ownership 34
period of the vehicle. 35
2. Territorial approach. The study focuses on a sufficiently small geographic area that allows 36
incorporating locally specific parameters (such as parking costs), as well as for sufficient 37
precision (e.g. concerning fuel prices, taxes). 38
3. Disaggregate approach. The study acknowledges vehicle owner (and/or household) 39
specifications concerning mobility behaviour and vehicle usage (such as annual driving 40
distances or vehicle usage areas). 41
4. Scenario modelling. In order to account for the many uncertainties concerning TCO 42
influencing factors, the study explores various potential market development and policy 43
scenarios. 44
5. Sensitivity analysis. In order to analyse the impact of still uncertain cost components, 45
sensitivity analysis for most influential cost parameters is carried out. 46
6. Up-to-date. The study uses most recent cost information and EV specifications. 47
48
TRB 2013 Annual Meeting Paper revised from original submittal.

Windisch
4
A study that complies with the above set of criteria is seen to have potential to appropriately 1
predict the cost advantage or disadvantage of EVs over their conventional counterpart. They can then 2
serve as profound basis for subsequent EV demand projections. 3
Table 1 shows the reviewed studies in light of the list of criteria developed. The most frequent 4
deficiency of existing studies appears to be the lack of consideration of territorial characteristics. This 5
calls for analyses that are carried out on small geographic scales. Also, a disaggregate approach that 6
allows the incorporation of household (and vehicle user/usage) characteristics is hardly ever followed. 7
8
TABLE 1 Evaluation of reviewed studies 9
10
Evaluation Criteria
Reference Det
aile
d TC
O c
alcu
latio
nTe
rrito
rial a
ppro
ach
Dis
aggr
egat
e ap
proa
chS
cena
rio
mod
ellin
g
Sen
sitiv
ity a
naly
sis
Up
- to
-dat
e
Funk and Rabl (1999) [1] - - -Delucchi and Lipman (2001) [2] - - - -
Carlsson and Johansson-Stenman (2002) [3] - - - -
BCG (2009) [4] - - - -Becker (2009) [5] - -
Biere et al. (2009) [6] - -Deutsche Bank (2009) [7] - - -
EDF (2009) [8] - - - -Figliozzi et al. (2010) [9] - - -Prud'homme (2010) [10] -
Deutsche Bank (2011) [11] - - -CAS (2011) [12] - -
CE Delft (2011) [13] - -CDGG (2011) [14] - - - -
ITF (2012) [15] -partly complies with criterion fully complies with criterion 11
12
The methodology of the underlying study is to comply with the defined set of criteria in the most 13
appropriate way. 14
15
Outline of the paper 16
17
The paper is organised as follows: Part 2 (Methodology) gives an overview of the set-up TCO model 18
and explains its application by giving a very succinct synopsis of underlying data. Part 3 (Results) 19
shows then the results of a reference scenario, of scenario analyses and break-even analyses that were 20
carried out for selected parameters. Part 4 (Conclusions) summarizes main findings and concludes on 21
the financial performance of the different vehicle types for a private user under various explored 22
framework conditions. The taken TCO approach is regarded critically and an outlook on subsequent 23
studies based upon the set-up TCO model is given. 24
TRB 2013 Annual Meeting Paper revised from original submittal.

Windisch
5
1
METHODOLOGY 2
3
Model Overview 4
5
Figure 1 gives a comprehensive overview of the set-up TCO model. The figure reveals the 6
dependence of the model output (the TCO per vehicle type) on input attributes that can be categorized 7
into (i) vehicle/battery attributes, (ii) vehicle user attributes, (iii) vehicle usage attributes, (iv) 8
attributes describing the policy framework, and (v) attributes describing the expected development of 9
market trends. The broad scope of parameters that are taken into account becomes apparent. 10
All input information as shown on the left side of the graph serves for the calculation of the listed 11
cost items. Purchase costs, infrastructure installation costs and registration costs only occur in year 1 12
(which is set to be the year 2012). They make up the initial costs. All other cost items are reoccurring 13
costs. Most of them are assumed to stay the same for each year t of the total ownership period T (such 14
as parking costs or insurance costs). However, energy costs, being dependent on energy prices, 15
change over time according to assumed oil or electricity price development scenarios. Usage costs 16
comprise all cost items that are dependent on the usage of the vehicle (the annual driven distance of 17
the vehicle). Continuous costs are the sum of all reoccurring costs over time, being the usage costs, 18
parking costs and insurance costs. The differences of initial costs and continuous costs of different 19
vehicle types define possible interest gains. These are due to possible interest payments in case money 20
can be put aside when purchasing the financially more advantageous vehicle option. All reoccurring 21
costs (being mainly the continuous costs but also the interest gains) are discounted to year 1 of the 22
ownership period (which is assumed to be the year 2012). The sum of the initial costs and the 23
discounted reoccurring costs give the total costs of ownership (TCO). 24
TRB 2013 Annual Meeting Paper revised from original submittal.

Windisch
6
FIGURE 1 TCO Model Overview 1
2
TRB 2013 Annual Meeting Paper revised from original submittal.

Windisch
7
Model Application 1
2
The focus of this study is the Paris region (the Île-de-France, IDF, region). The region is divided into 3
the 3 residential zones Paris, the ‘Petite Couronne’ and the ‘Grande Couronne’. Differences between 4
these sub-regions are remarkable. Whereas Paris can be perceived as extremely dense urban area that 5
is very well served by public transport, the ‘Petite Couronne’ shows suburban characteristics of a 6
periphery. Accessibility is assured by suburban trains and bus services. The ‘Grande Couronne’ area 7
shows a mix of pre-urban and almost countryside-like characteristics. The public transport network is 8
much less dense and relies on buses and few connecting train lines. These different land use structures 9
cause quite diverse mobility needs of the sub-regions’ inhabitants, which make the IDF region t to an 10
interesting study area. The financial effects of EVs on diverse user groups can be explored. 11
Parameter settings refer specifically to the IDF region in case local specifications are to be taken 12
into account (as this is, for example, the case for parking costs or policies). Alternatively, they refer to 13
the framework conditions as they exist in the whole of France. Also vehicle specifications and prices 14
refer to vehicles that are available on the French market. As reference vehicles that represent the 15
different vehicle technologies serve 16 17
- Renault’s Clio (a compact diesel or petrol vehicle that is available for 16 654 or 17 450 18
Euros respectively), 19
- Renault’s ZOE Z.E. offered with a battery hire option (a compact BEV that is available 20
for 20 700 Euros), 21
- Renault’s Fluence (a sedan diesel vehicle that is available for 22 850), 22
- Renault’s Fluence Z.E. with a battery hire option (a sedan BEV that is available for 23
26 300 Euros), and 24
- Opel’s Ampera (a sedan-like PHEV that is available for 44 500 Euros including its 25
battery). 26 27
Prices are according to offers as in the year 20121. Fuel price developments are based on oil price 28
scenarios according to the Annual Energy Outlook 2011 of the U.S. Energy Information 29
Administration [16]. For France, the low, medium, and high oil price scenarios translate to petrol 30
(diesel) price increases of 2% (7%), 19% (33%) and 26% (42%) within a 10-year time frame. More 31
detailed information on parameter values can be found in the annex. 32
33
Methodological comments 34
35
With regards to the methodology, four important issues are to be highlighted. Firstly, the set-up TCO 36
model takes monetary costs into account exclusively. There is no attempt to quantify, e.g., possible 37
range anxiety (caused by the limited range of BEVs), time gains (thanks to the home recharging 38
possibility for EVs or preferential parking rights), or potential environmental benefits of new vehicle 39
technologies. Accounting for such factors in the TCO approach could potentially reflect cost (or 40
disadvantages) and benefits of these technologies in a more adequate way. However, such an approach 41
is not the objective of this study. 42
Secondly, attention is drawn to the fact that different vehicle technologies are represented by 43
distinct reference vehicles. When making a vehicle purchase decision, the decision maker is not only 44
confronted with even more different technologies, but with a portfolio of choice options within each 45
technology choice. Conclusions about the general financial advantage or disadvantage of certain 46
1 As advertised on http://www.renault.fr/gamme-renault/vehicules-particuliers/index.jsp (EVs + CVs) and http://www.opel.fr/flash.html (PHEV)., accessed in June 2012.
TRB 2013 Annual Meeting Paper revised from original submittal.
Windisch
8
vehicle technologies can not be made. However, valuable insight on the likely magnitude and 1
repartition of TCO, and the differences of these for various vehicle technologies is gained. The PHEV 2
technology is represented by a vehicle model (the Opel Ampera) that has a significant electric range 3
(of up to 80 kms) and comes with a comparatively high up-front purchase cost. Taking a PHEV with a 4
shorter electric range (as the Toyota Prius - currently the only other PHEV available for around 37,000 5
Euros on the French market) would give different results. When referring in the following to the 6
PHEV technology, this has to be kept in mind. 7
Thirdly, the underlying TCO model is based on the brusque assumption that compared vehicles of 8
different vehicle technologies attain the same residual value after the vehicle ownership period. In 9
none of the reviewed studies could a thorough approach for evaluating resale values of EVs be found. 10
Frequently, they are either ignored, or assumed to be the same for the vehicle technologies in question. 11
While assuming similar values might turn out to be a valid approach when comparing an EV with its 12
conventional counterpart, the assumption that an EV with a battery hire model attains a similar resale 13
value does not appear coherent. After a certain ownership period the EV user that disposes of the 14
battery in his vehicle should be able to achieve a higher resale value than the EV user that disposes of 15
the vehicle only. Following this reasoning, findings obtained by the underlying model underestimate 16
the TCO of the EV with the battery hire model compared to the EV with the battery purchase model. 17
Finally, the underlying model assumes that a vehicle purchase occurs in year 0 (the year 2012) of 18
the ownership period and all purchase related costs are covered instantly at this time. Different vehicle 19
financing models are not considered. The impact of such financing models offered by the vehicle 20
provider on the TCO difference of two compared vehicle technologies is assumed to be negligible. 21
22
RESULTS 23
The Reference Scenario 24
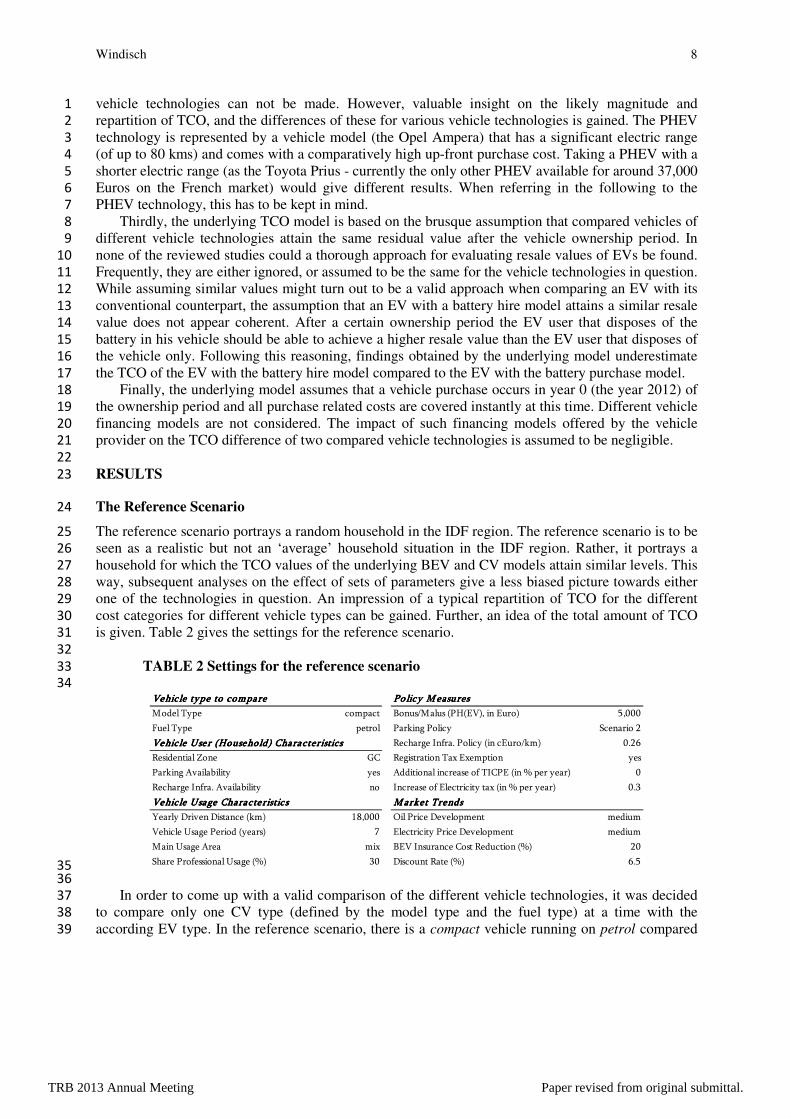
The reference scenario portrays a random household in the IDF region. The reference scenario is to be 25
seen as a realistic but not an ‘average’ household situation in the IDF region. Rather, it portrays a 26
household for which the TCO values of the underlying BEV and CV models attain similar levels. This 27
way, subsequent analyses on the effect of sets of parameters give a less biased picture towards either 28
one of the technologies in question. An impression of a typical repartition of TCO for the different 29
cost categories for different vehicle types can be gained. Further, an idea of the total amount of TCO 30
is given. Table 2 gives the settings for the reference scenario. 31
32
TABLE 2 Settings for the reference scenario 33
34
Vehicle type to compareVehicle type to compareVehicle type to compareVehicle type to compare Po licy M easuresPo licy M easuresPo licy M easuresPo licy M easures
Model Type compact Bonus/Malus (PH(EV), in Euro) 5,000
Fuel Type petrol Parking Policy Scenario 2
Vehicle User (Household) CharacteristicsVehicle User (Household) CharacteristicsVehicle User (Household) CharacteristicsVehicle User (Household) Characteristics Recharge Infra. Policy (in cEuro/km) 0.26
Residential Zone GC Registration Tax Exemption yes
Parking Availability yes Additional increase of TICPE (in % per year) 0
Recharge Infra. Availability no Increase of Electricity tax (in % per year) 0.3
Vehicle Usage CharacteristicsVehicle Usage CharacteristicsVehicle Usage CharacteristicsVehicle Usage Characteristics M arket TrendsM arket TrendsM arket TrendsM arket Trends
Yearly Driven Distance (km) 18,000 Oil Price Development medium
Vehicle Usage Period (years) 7 Electricity Price Development medium
Main Usage Area mix BEV Insurance Cost Reduction (%) 20
Share Professional Usage (%) 30 Discount Rate (%) 6.5 35
36
In order to come up with a valid comparison of the different vehicle technologies, it was decided 37
to compare only one CV type (defined by the model type and the fuel type) at a time with the 38
according EV type. In the reference scenario, there is a compact vehicle running on petrol compared 39
TRB 2013 Annual Meeting Paper revised from original submittal.

Windisch
9
to the available compact EV models. It was assumed that compact vehicles are more likely to be 1
replaced by EVs than sedan vehicles, which come with a higher weight and consequently with less 2
autonomy (or costlier and heavier batteries) in case they were to be replaced by an EV. 3
Vehicle user and vehicle usage characteristics refer to a typical household in the Grande Couronne 4
area: the household is equipped with private parking infrastructure but has not yet been equipped with 5
EV recharge infrastructure. The annual driven distance is in line with rather elevated but still realistic 6
values for that residential zone; the vehicle usage period lies 2 years above the French average 7
ownership period (INSEE, 2012 [17]), which appears to be realistic for a newly purchased vehicle. 8
The vehicle is used in urban and exterior-urban settings; it is partly used (to 30%) for professional 9
reasons. 10
Policy measure settings in the reference scenario refer to the actual French policy settings as in 11
2012. The parking policy scenario (‘Scenario 2’) assumes that EVs are treated preferentially compared 12
to CVs (no parking fees are applied to EVs on public parking spaces), reflecting the case of Paris and 13
various French communities in 2012. Although the EV will be predominantly recharged at home, 14
costs for the deployment of public recharge infrastructure are assumed to be passed on to the vehicle 15
user. This can happen in various forms, such as one-time network registration fees, annual fees, or 16
fees that are paid in relation with the actual public infrastructure usage. For simplicity, we lever public 17
infrastructure usage costs per driven kilometre on the vehicle (and public recharge infrastructure) user 18
(whether the vehicle is recharged at home or at public premises). The few identified studies that do 19
take such costs into account (e.g., Becker et al., 2009 [5]; EDF, 2009 [8]) follow the same approach. 20
The currently EV-supportive French policy gives reason to the assumed value that proves to be 21
comparatively moderate. The increase of energy taxes is assumed to be moderate. For the TICPE (the 22
French tax on oil products) only increases that are according to observations of the past are assumed 23
(there is no additional increase); the electricity taxes are assumed to increase by 0.3% per year which 24
is less than what has been observed for the past (it is assumed that projected high increases of 25
electricity prices will have this effect on the development of electricity taxes). 26
Settings defining market trends refer to the most likely developments from today’s point of view. 27
Energy prices follow a ‘medium’ forecast scenario; insurances are assumed to hold BEV-supportive 28
offers that are currently found on the French market over the ownership period of the vehicle; and the 29
discount rate takes the value of the market interest rate. 30
The results for the reference scenario are shown in figure 2. The upper part shows the repartition 31
of the TCO after 7 years for the CV and the different EV options. The lower part of the figure shows 32
the development of the TCO over time until an ownership period of 10 years. Interest gains are (for 33
presentation reasons) comprised in the usage costs of the vehicle. 34
TRB 2013 Annual Meeting Paper revised from original submittal.

Windisch
10
1
FIGURE 2 Results for the reference scenario 2 3
0
10,000
20,000
30,000
40,000
50,000
60,000
CV BEV BEV-Hire PHEV
Vehicle Type
in E
uro
Parking Costs
InsuranceCosts
Vehicle UsageCosts
Initial Costs
56% 79% 55% 75%
32%
15%
39%
20%
8%
6%6%
5%
4%
0
10,000
20,000
30,000
40,000
50,000
60,000
70,000
1 2 3 4 5 6 7 8 9 10
Year
Eu
ro
PHEV
BEV
BEV-Hire
CV
4
It becomes evident that initial costs constitute the largest cost component for the BEV and the 5
PHEV: they lie at 79% and 75% of the TCO. For the CV and the BEV-Hire they lie at around 55%. 6
Usage costs show the contrary tendency: they amount to 32% for the CV and to 39% for the BEV-7
Hire, but only to 15% for the BEV and to 20% for the PHEV. With increasingly high usage of the 8
vehicle (either due to a high annual driven distance or a long ownership/usage period of the vehicle) 9
the acquisition of a BEV or a PHEV becomes progressively more advantageous compared to a CV or 10
a BEV with a battery hire option. Looking at the whole TCO though, it becomes apparent that a cost 11
advantage of the underlying PHEV over any other vehicle type is difficult to reach. TCO of the PHEV 12
lie at around 54.000 Euros for the reference scenario. For the other three vehicle options they take a 13
value at around 30.000 Euros. The CV, the BEV, and BEV-Hire turn out to be very competitive 14
vehicle choice options from a financial point of view. 15
The cost development over time shows at which point in time the TCO of the different vehicle 16
types attain a similar level. For the BEV and the CV this is the case in year 10 of vehicle ownership 17
(assuming a constant vehicle usage over time). The BEV-Hire option is, however, competitive right 18
from the beginning: TCO for this vehicle option develop in almost the same way as for the CV. 19
As mentioned, the reference scenario only serves as demonstration as well as to show main 20
tendencies when comparing the vehicle purchase options with each other. In the following section, 21
different scenarios are developed that explore the effect of sets of parameters on the TCO. 22
TRB 2013 Annual Meeting Paper revised from original submittal.

Windisch
11
Scenario Analysis 1
This section develops scenarios that show the effect of (simultaneous) parameter changes on the TCO 2
of the various vehicle types. Parameter changes are carried out per parameter category (as shown in 3
figure 1). It is avoided to change more than those parameters belonging to the same category at a time. 4
This helps keeping TCO changes retraceable. Importance is given to carrying out only such parameter 5
changes that result in still realistic scenarios. For each parameter category one ‘EV+’ and one ‘CV+’ 6
scenario is developed. The first one gives financial advantage to the EV options, whereas the second 7
one does the same for the CV option. Table 3 gives the scenario settings for each of the developed 8
scenarios. Only values in bold are subject to change per scenario (however, not all of them necessarily 9
change!). Other parameter settings were kept to the same as in the reference scenario. Figure 3 gives 10
then the TCO results for the 4 defined vehicle types per scenario. Note that the setting with regards to 11
recharge infrastructure availability remains the same over all modelled scenarios. In 2012, the year of 12
the assumed vehicle purchase, the number of private persons that are already equipped with recharge 13
infrastructure is seen to be negligible. 14
15
TABLE 3 Definition of scenarios 16
17
Ref 1 2 3 4 5 6 7Vehicle User/Usage
ScenariosPolicy Scenarios Market Trend Scenarios
EV+ CV+ EV+ CV+ EV+ CV+Vehicle type to compareModel Type compact sedane compact compact compact compact compact compactFuel Type benzine diesel benzine benzine benzine benzine benzine benzineVehicle User (Household) CharacteristicsResidential Zone GC GC GC Paris GC GC GC GCParking Availability yes yes yes no yes yes yes yesRecharge Infra. Availability no no no no no no no noVehicle Usage CharacteristicsYearly Driven Distance (km) 18 000 18 000 20 000 12 000 18 000 18 000 18 000 18 000Vehicle Usage Period (years) 7 7 10 5 7 7 7 7Main Usage Area mix mix mix urban mix mix mix mixShare Professional Usage (%) 30 30 30 30 30 30 30 30Policy MeasuresBonus/Malus (PH(EV), in Euro) 5 000 5 000 5 000 5 000 5 000 0 5 000 5 000Parking Policy* Scenario 2 Scenario 2 Scenario 2 Scenario 2 Scenario 3 Scenario 1 Scenario 2 Scenario 2Recharge Infra. Policy (in cEuro/km) 0,26 0,26 0,26 0,26 0 0,26 0,26 0,26Registration Tax Exemption yes yes yes yes yes no yes yesAdditional increase of TICPE (in % per year) 0 0 0 0 2 0 0 0Increase of Electricity tax (in % per year) 0,3 0,3 0,3 0,3 0,3 1 0,3 0,3Market TrendsOil Price Development medium medium medium medium medium medium high lowElectricity Price Development medium medium medium medium medium medium medium highEV Insurance Cost Reduction (%) 20 20 20 20 20 20 20 0Discount Rate (%) 6,5 6,5 6,5 6,5 6,5 6,5 4,5 6,5
Reference Scenario
Vehicle Type
Scenario
18
19
TRB 2013 Annual Meeting Paper revised from original submittal.
Windisch
12
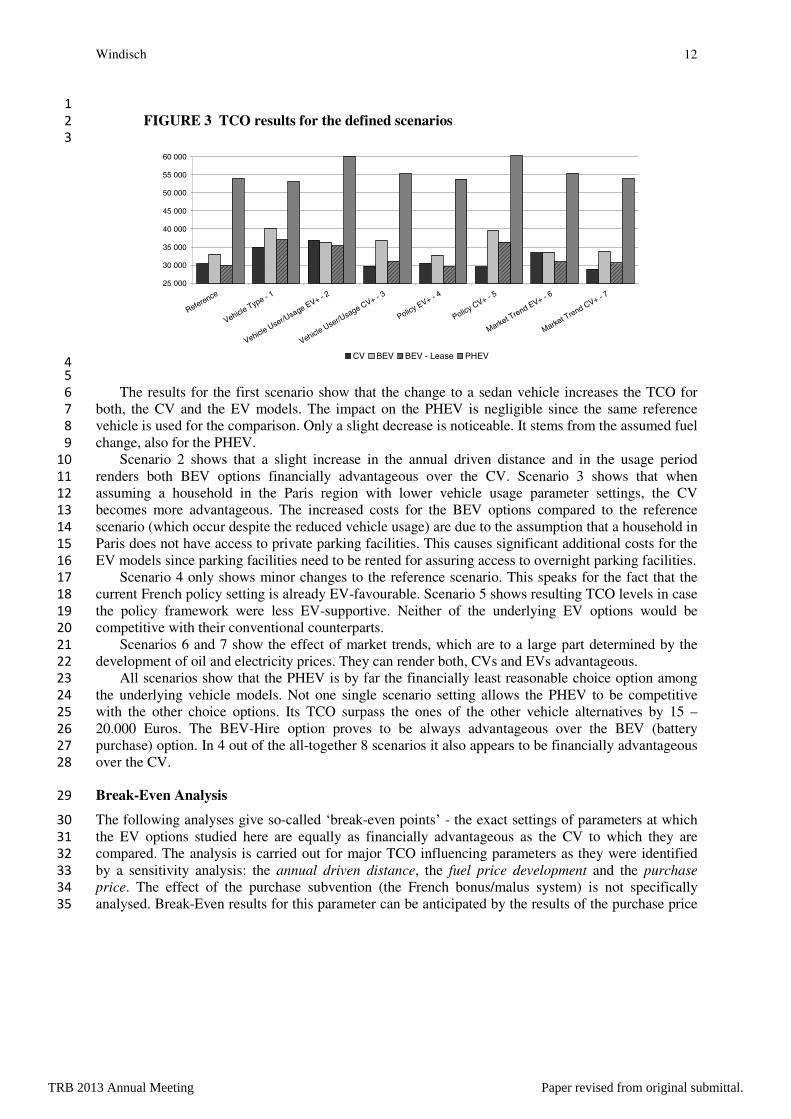
1
FIGURE 3 TCO results for the defined scenarios 2
3
25 000
30 000
35 000
40 000
45 000
50 000
55 000
60 000
Reference
Vehicle Type - 1
Vehicle User/Usage EV+ - 2
Vehicle User/Usage CV+ - 3
Policy EV+ - 4
Policy CV+ - 5
Market Trend EV+ - 6
Market Trend CV+ - 7
CV BEV BEV - Lease PHEV 4
5
The results for the first scenario show that the change to a sedan vehicle increases the TCO for 6
both, the CV and the EV models. The impact on the PHEV is negligible since the same reference 7
vehicle is used for the comparison. Only a slight decrease is noticeable. It stems from the assumed fuel 8
change, also for the PHEV. 9
Scenario 2 shows that a slight increase in the annual driven distance and in the usage period 10
renders both BEV options financially advantageous over the CV. Scenario 3 shows that when 11
assuming a household in the Paris region with lower vehicle usage parameter settings, the CV 12
becomes more advantageous. The increased costs for the BEV options compared to the reference 13
scenario (which occur despite the reduced vehicle usage) are due to the assumption that a household in 14
Paris does not have access to private parking facilities. This causes significant additional costs for the 15
EV models since parking facilities need to be rented for assuring access to overnight parking facilities. 16
Scenario 4 only shows minor changes to the reference scenario. This speaks for the fact that the 17
current French policy setting is already EV-favourable. Scenario 5 shows resulting TCO levels in case 18
the policy framework were less EV-supportive. Neither of the underlying EV options would be 19
competitive with their conventional counterparts. 20
Scenarios 6 and 7 show the effect of market trends, which are to a large part determined by the 21
development of oil and electricity prices. They can render both, CVs and EVs advantageous. 22
All scenarios show that the PHEV is by far the financially least reasonable choice option among 23
the underlying vehicle models. Not one single scenario setting allows the PHEV to be competitive 24
with the other choice options. Its TCO surpass the ones of the other vehicle alternatives by 15 – 25
20.000 Euros. The BEV-Hire option proves to be always advantageous over the BEV (battery 26
purchase) option. In 4 out of the all-together 8 scenarios it also appears to be financially advantageous 27
over the CV. 28
Break-Even Analysis 29
The following analyses give so-called ‘break-even points’ - the exact settings of parameters at which 30
the EV options studied here are equally as financially advantageous as the CV to which they are 31
compared. The analysis is carried out for major TCO influencing parameters as they were identified 32
by a sensitivity analysis: the annual driven distance, the fuel price development and the purchase 33
price. The effect of the purchase subvention (the French bonus/malus system) is not specifically 34
analysed. Break-Even results for this parameter can be anticipated by the results of the purchase price 35
TRB 2013 Annual Meeting Paper revised from original submittal.

Windisch
13
break-even analysis. The fuel price break-even analysis gives information on effects of possible tax in- 1
or decreases on petroleum products. 2
Table 4 gives the results of the break-even analyses. The first part shows the results when 3
comparing a compact petrol CV with the EV options. The second part compares the EV options to a 4
compact diesel CV. Analyses are carried out for the reference scenario and the policy and market 5
scenarios as defined in table 3. For the reference scenario the model and fuel type corresponds to the 6
CV vehicle type that is compared in the break-even analysis in question. Vehicle user/usage scenarios 7
are left aside since these do not analyse general framework conditions that could become applicable 8
for all households. All analysed scenarios therefore refer to a situation where the vehicle ownership 9
period increases to 7 years and the vehicle is used for 18 000 km/year. 10
11
TABLE 4 TCO results for the break-even analysis 12
13
Policy Scenarios Market ScenariosCompact Petrol CV EV+ CV+ EV+ CV+
(BE - Break-Even) vs BEVBEV
LeasePHEV BEV
BEV Lease
PHEV BEVBEV
LeasePHEV BEV
BEV Lease
PHEV BEVBEV
LeasePHEV
BE Yearly driven distance (km) 25600 14000 182600 24000 9000 2E+05 47600 54600 - 18000 7300 1E+05 37500 47000 -BE petrol price 2020* (Euro/l) 2.19 1.32 9.18 2.11 1.24 9.11 4.18 3.32 11.52 1.99 1.34 10.27 2.4 1.54 9.26
(% increase to 2012 prices** by) 36 -18 470 31 -23 466 160 106 616 24 -17 538 49 -4 475BE purchase price premium EV*** (%) 71 28 44 72 30 45 32 -11 6 84 38 54 59 16 36
BE ownership period (years) - 1+ - - 1+ - - - - 7+ 1+ - - 1-3 -
Policy Scenarios Market ScenariosEV+ CV+ EV+ CV+
Compact Diesel CV vs BEVBEV
LeasePHEV BEV
BEV Lease
PHEV BEVBEV
LeasePHEV BEV
BEV Lease
PHEV BEVBEV
LeasePHEV
BE Yearly driven distance (km) 43500 56800 - 39200 51200 - 87300 1E+05 - 23700 15400 - 1E+05 2E+05 -BE diesel price 2020* (Euro/l) 3.42 2.03 17.74 3.29 1.91 17.61 6.64 5.26 22.33 3.10 2.07 16.32 3.77 2.38 25.04
(% increase to 2012 prices** by) 144 45 1167 135 36 1158 374 276 1495 121 48 1066 169 70 1689BE purchase price premium EV*** (%) 53 12 28 55 14 29 16 -24 -8 67 23 38 -43 -100 -59
BE ownership period (years) - 1-4 - - 1-4 - - - - 9+ 1+ - - 1-2 -* after taxes, in nominal Euros **taking 1,61 Euro/l Petrol and 1,43 Euro/l Diesel as reference for 2012 after tax prices (ZAGAZ, 2012, [18])*** compared to the CV price; BEV and PHEV: including battery; BEV-Lease: vehicle only
Reference Scenario
Reference Scenario
14
15
Table 4 shows the break-even setting of each analysed parameter when keeping all other 16
parameters to their settings as defined by the scenario. Next to the fuel price break-even point, which 17
is given for the year 2020 (assuming a linear price increase from today’s values onwards), the 18
necessary price increase (as %) compared to today’s levels is given. The purchase price break-even 19
setting is used to calculate the maximal EV price premium compared to the underlying CV in order to 20
reach equal TCO for the two vehicle options that are compared. Further, the break-even ownership 21
period is also given in case it lies in the range of 1 to maximum 10 years. A ‘+’ here indicates that any 22
ownership period from this time period onwards results in lower TCO for the EV than for the CV. In 23
some cases the EV-advantageous ownership period lies between a minimum and a maximum number 24
of years. 25
26
Annual driven distance 27
Table 4 reveals that the underlying PHEV can not break even by the means of an elevated annual 28
driven distance in any scenario. In those cases where a BE (break-even) distance could be found, it 29
lies outside of the maximum battery lifetime (assumed here to be at 180.000 km at the most – an 30
optimistic value compared to what was found in literature (e.g. CAS (2011) [12]: 150.000 km, 31
Lidicker et al. (2011) [19]: 130.000 km)). Such scenarios would entail the costly acquisition of a new 32
battery, which would further worsen the PHEV’s financial competitiveness against the other vehicle 33
types. In case the framework conditions are favourable (such as in the reference scenario or the EV+ 34
scenarios) the BEV-Hire option breaks even with the petrol CV at a quite moderate annual distance: 35
For the reference scenario this distance lies at around 14.000 km/year, for the Policy EV+ scenario at 36
9.000 km/year and for the Market EV+ scenario at only 7.300 km/year. The BEV requires 37
TRB 2013 Annual Meeting Paper revised from original submittal.

Windisch
14
significantly higher distances for these scenarios (25.600, 24.000 and 18.000 km/year). In case the 1
framework conditions are CV friendly, the BE annual driven distances lie far above the distances that 2
can usually be observed among private vehicle owners – both, for the BEV and the BEV-Hire. For 3
breaking even with the compact diesel CV, generally much higher annual driven distances are needed. 4
This is due to lower running costs of the diesel compared to the petrol CV. 5
6
2020 fuel price 7
Looking at the 2020 petrol price break-even setting, it can be noted that the BEV-Hire option only 8
requires very moderate fuel price increases in order to break even - if at all. For some scenarios, even 9
a decrease of today’s prices would keep the BEV-Hire option profitable. The BEV breaks even with 10
the petrol CV at fuel prices that approximately conform to the high oil price scenario. The only 11
exception is the Policy CV+ scenario: here, the necessary 2020 fuel price lies well above all 12
forecasted fuel price scenarios. The PHEV would only break even with a fuel price change that is 13
hardly imaginable from today’s point of view. The same is the case for almost all scenarios and EV 14
options when comparing them to a diesel CV. Again, the lower running costs due to lower 15
consumption of this vehicle type keep the TCO, in comparison to the petrol CV, low and a break-even 16
point is difficult to reach. 17
18
Purchase price 19
The purchase price premium shows the maximal purchase price supplement of the EV compared to 20
the CV at which the TCO of the compared vehicle types are balanced. For the BEV and the PHEV the 21
battery price is included in this premium. In case of the BEV-Hire option only the price of the vehicle 22
is considered. In the EV-favourable scenarios this price premium can augment to 70-85% of the petrol 23
CV price. Current offers show a price supplement of 85%. However, for the CV-favourable scenarios 24
this price premium should only lie at 32% for the Policy CV+ scenario and at 59% for the Market 25
CV+ scenario. For the BEV-Hire option the price premium is lower due to the fact that the battery 26
costs are covered by continuous payments rather than by an up-front purchase. The maximal price 27
premium lies at 30-40% for the EV-favourable scenarios (which all already take the 5000 Euro 28
purchase subsidy into account!). For the CV favourable scenarios the price premium lies at -11% 29
(meaning that the vehicle price of the BEV-Hire option is 11% lower than the one of the petrol CV), 30
or 16% respectively. The maximal possible PHEV purchase premiums for achieving a TCO balance 31
lie between only 6% and 56% (including the battery!). Considering the current price premiums for 32
PHEVs that are approximately 170%, such price levels seem to be very difficult to reach in any near 33
future. Looking at the diesel CV – EV comparisons, all maximal price premiums are lower than the 34
one found for the petrol CV. In particular, the CV+ scenarios (for which these premiums are mostly 35
negative), show that appropriate price levels for balancing the TCO of the diesel CV with the EV 36
options will be difficult. 37
38
Ownership period 39
Most scenarios show that a break-even point cannot be reached for EV options with the CV within 10 40
years of vehicle ownership. The frequent exception is the BEV-Hire: here, the TCO are right from the 41
time of vehicle purchase lower than the ones of the CV. However, only for some EV-favourable 42
scenarios they remain at a lower level during the whole ownership period of the vehicle. For the other 43
scenarios the BEV-Hire TCO rise above the ones of the CV from year 3 or 4 onwards. This is due to 44
the fact that the sum of battery hire costs and other continuous costs surpass the continuous costs of 45
the CV from a certain ownership period onwards. 46
47
Break-even analyses show that EV options are much more easily (financially) outperformed by a 48
diesel CV than by a petrol CV. This is due to lower running costs of the diesel CV compared to a 49
petrol CV, while the higher up-front costs of the diesel CV are only marginal. However, also when 50
TRB 2013 Annual Meeting Paper revised from original submittal.
Windisch
15
comparing the petrol CV to the EV options, break-even points often entail very unlikely parameter 1
settings. This is especially the case for the PHEV, but also for the BEV. Reaching a TCO balance 2
between BEVs and PHEVs under realistic parameter settings most often necessitates the simultaneous 3
change of more than one of the regarded parameters. The BEV-Hire, on the other hand, can in most 4
cases compete with the petrol CV under realistic settings. 5
Break-even analyses for sedan vehicles show the same tendencies as the ones for the compact 6
vehicles. However, EV options turn out to be even less competitive when comparing them to compact 7
diesel CVs. This supports the assumption that compact vehicles are likelier to be replaced by EVs than 8
sedan vehicles. 9
SUMMARY AND CONCLUSIONS 10
Summary of Results 11
This study analyses the impact of vehicle user and usage characteristics, policy settings and market 12
trends on the total costs of ownership (TCO) of different vehicle types and purchase options. For this 13
purpose a TCO model is set up that explores their evolution within a timeframe of up to 10 years. The 14
model covers (1) a battery electric vehicle (BEV), (2) a BEV with a battery hire option (BEV-Hire), 15
(3) a plug-in hybrid electric vehicle (PHEV) and (4) a conventional vehicle (CV). These vehicle 16
technologies are represented by reference vehicles in the set-up model. These are Renault’s CLIO 17
(CV), ZOE (BEV) and FLUENCE (CV and BEV) models as well as the long electric range, rather 18
expensive, Opel Ampera (PHEV) as they are currently offered on the French market. All results and 19
conclusions based on the underlying model are therefore in reference to these specific models. The 20
fact that other vehicle models with different cost structures also exist is not accounted for. All 21
territorial characteristics that are taken into account refer to the Ile-de-France (IDF) region (Paris 22
region). 23
The analysis of a reference scenario showed the repartition of TCO across the different cost 24
categories. While the TCO of a CV are more equally repartitioned between initial costs (55%) and 25
continuous costs (32%), the TCO of a BEV and of a PHEV are dominated by the initial costs (79% for 26
the BEV, and 75% for PHEV respectively). The cost repartition of the BEV-Hire largely resembles 27
the one of the CV. The BEV-Hire and (under more specific settings) also a BEV appears to be 28
competitive with a compact petrol CV using realistic assumptions. The TCO of the BEV-Hire are 29
98% of the TCO of the petrol CV. For the BEV this percentage increases to 107%. The TCO 30
comparison of a PHEV with a compact petrol CV shows, on the other hand, an important financial 31
advantage for the CV for the private user: the TCO of the PHEV increase to 175% of the CV. 32
Scenario analysis shows the significant impact of many parameters taken into account. The often-33
neglected vehicle user and usage characteristics, such as the access to, and costs of, parking 34
infrastructure, are shown to be important. Also, policy settings and the development of market trends 35
have to be accurately taken into account. Different assumptions with regards to their settings and their 36
development have significant impact on TCO comparisons. 37
Break-even analysis explores the settings of main TCO influencing parameters at which a TCO 38
balance between EVs and the according CV is achieved. It shows that such a balance is difficult to 39
reach under realistic settings for (i) all scenarios when regarding the underlying PHEV, (ii) most 40
scenarios when regarding the underlying BEV. The BEV-Hire option requires parameter settings that 41
lie well within the range of realistic values. This option therefore appears to be the most financially 42
interesting one for future vehicle purchase considerations of private users. 43
44
TRB 2013 Annual Meeting Paper revised from original submittal.

Windisch
16
Discussion and Conclusions 1
Today’s discussions around the possible future potential for electric vehicles are surrounded by non-2
negligible scepticism. This scepticism largely stems from the expected lack of customer acceptance 3
due to higher purchase prices of these types of vehicles. The underlying study explores this assertion 4
for the French context. It is found that EVs can actually be justified from a financial standpoint. 5
Future private demand of these vehicles is therefore not expected to only rely on utopians, enthusiasts 6
or on the goodwill of vehicle purchasers. However, such “well-reasoned” demand remains subject to 7
several conditions and limitations. France appears to be an EV marketplace that profits from 8
comparatively significant supportive policy measures, moderate electricity prices, as well as from the 9
French car producer Renault’s adequate vehicle and business models. Indeed, analyses showed that 10
the battery hire business model especially favours the private client. Whether vehicle (and battery) 11
sales prices are intentionally kept at moderate levels remains a secret. It can certainly not be ruled out 12
that significant losses are accepted in the expectance of creating first vehicle demand that gets the 13
“EV-ball” rolling. Whatever the case may be, analyses show that current policy settings allow today’s 14
owners of Renault’s battery hire-EVs to already reach similar total cost of ownership levels as they 15
would with a comparable compact petrol vehicle. This observation is even largely independent from 16
assumptions on future market trends. However, the comparison of Renault’s models with diesel 17
vehicles, in particular sedan diesel vehicles, turns out to be significantly less promising for the EV. 18
Here, as well as when considering BEVs with battery purchase, similar TCO levels are much less 19
evident. EV-favourable market trends (especially concerning fuel price developments) and EV-20
favourable vehicle usage behaviour (such as long ownership periods and high vehicle usage) appear to 21
be necessary conditions to result in a financial advantage of BEVs over CVs. While results therefore 22
suggest that BEV demand can potentially evolve thanks to financial reasoning (under all mentioned 23
framework conditions and underlying assumptions), model applications suggest that demand for 24
PHEVs with long electric ranges will mainly rely on the goodwill of vehicle users who are not ready 25
to accept the autonomy limitations of BEVs. The high purchase price of such PHEV models is the 26
reason for that. Smaller (and less expensive) PHEV models with shorter electric ranges certainly 27
change this picture. Their availability on the French market is, for the time being, very limited. 28
Assuming a performance increase of BEV models with regards to autonomy issues – be it due to 29
developments in the battery technology or to increasingly dense recharge infrastructure networks – 30
will make reasoning behind the underlying expensive PHEV model even more difficult in the long 31
run. 32
In addition, for the BEV-Hire, limitations in autonomy and needs for recharge infrastructure are 33
not to be forgotten. Whether those customers, for whom the BEV(-Hire) makes financial sense, are 34
exactly those who are also willing to accept autonomy limitations and recharge infrastructure 35
requirements remains to be examined. 36
Shortcomings and Outlook 37
Methodological shortcomings and limitations of the underlying study mainly refer to (i) the brusque 38
definition of the resale value of different vehicle technologies (notably they are assumed to be the 39
same, i.e. also for the different business models of the BEV), which is likely to distort the results in 40
favour of the BEV-Hire option, and (ii) the fact that different vehicle technologies are represented by 41
specific single reference vehicles. This means that other possible vehicle cost structures and 42
magnitudes that could result from the purchase of other EV models than those underlying the set-up 43
model, are not taken into account. Out of the two PHEV models that are currently available on the 44
French market (the Toyota Prius and the Opel Ampera), the approximately 7 000 Euros more 45
expensive Opel Ampera that comes with a longer electric range has been chosen for all underlying 46
comparisons. This distorts the picture to the disadvantage of the PHEV technology. 47
TRB 2013 Annual Meeting Paper revised from original submittal.

Windisch
17
In subsequent studies the set-up TCO model will be used for forecasts on the EV potential. 1
Household-specific vehicle user and usage data is taken from survey results in order to continuously 2
work on a disaggregate level. 3
4
ACKNOWLEDGMENTS 5
This research was partly financed by the Renault group within the framework of the Sustainable 6
Mobility Institute in partnership with ParisTech. 7
TRB 2013 Annual Meeting Paper revised from original submittal.

Windisch
18
REFERENCES 1
2
1. Funk, K., Rabl, A., 1999. Electric versus conventional vehicles: social costs and benefits in 3
France, Transportation Research Part D 4 (1999) 397-411. 4
2. Delucchi, M., Lipman, T., 2001. An analysis of the retail and lifecycle cost of battery-powered 5
electric vehicles, Transportation Research Part D 6 (2001) 371-404. 6
3. Carlsson, F., Johansson-Stenman, O., 2002. Costs and Benefits of Electric Vehicles – A 2010 7
Perspective, Working Papers in Economics no. 73, Department of Economics, Goteborg 8
University. 9
4. BCG, 2009. BCG Focus: The Comeback of the Electric Car? – How Real, How Soon, and What 10
Must Happen Next. 11
5. Becker, T., Sidhu, I., Tenderich, B., 2009. Electric Vehicles in the United States: A New Model 12
with Forecasts to 2030, Technical Brief, Center for Entrepreneurship and Technology (CET), 13
University of California, Berkeley. 14
6. Biere, D., Dallinger, D., Wietschel, M., 2009. Oekonomische Analyse der Erstnutzer von 15
Elektrofahrzeugen, Zeitschrift fuer Energiewirtschaft, Volume 33, Number 2 (2009), 173-181, 16
DOI: 10.1007/s12398-009-0020-2. 17
7. Deutsche Bank, 2009. Global Market Research, Electric Cars: Plugged In - A mega theme gains 18
momentum, November 3. 19
8. EDF, 2009. Quelles perspectives pour les infrastructures de charge?, Presentation of the 20
chair ‘Développement durable’, 29 September. 21
9. Figliozzi, M., Boudart, J., Feng, W., 2011. Economic and environmental optimization of vehicle 22
fleets: A case study of the impacts of policy, market, utilization, and technological factors, 23
presented at the 90th Annual Transportation Research Board Meeting, Washington, DC, January 24
23-27. 25
10. Prud'homme, R., 2010. Electric Vehicles: A Tentative Economic and Environmental Evaluation, 26
OECD/ITF Joint Transport Research Centre Discussion Papers, No. 2010/22, OECD Publishing. 27
DOI: 10.1787/5kgghkp44nkg-en 28
11. Deutsche Bank, 2011. Electromobility – Falling costs are a must, October 19, online accessible 29
via www.dbresearch.com (accessed on 11/07/2012) 30
12. CAS, 2011. La voiture de demain – carburants et électricité, Centre d’analyse strategique, Rapport 31
de la mission présidée par Jean Syrota, France. 32
13. CE Delft, 2011. Impacts of Electric Vehicles – Deliverable 4: Economic analysis and business 33
models, April, Delft, NL, online accessible via www.cedelft.eu. 34
14. CDGG, 2011. Les véhicules électriques en perspective : Analyse coûts-avantages et demande 35
potentielle, Commissariat Général au Dévéloppement Durable, Etude N°41, Mai. 36
15. ITF, 2012. Electric Vehicles Revisited – Costs, Subsidies and Prospects, 37
Philippe Crist, International Transport Forum, Discussion Paper No. 2012-03, April 2012, online 38
accessible via http://www.internationaltransportforum.org/jtrc/DiscussionPapers/ jtrcpapers.html, 39
accessed on 11/07/2012 40
16. EIA, 2011. Annual Energy Outlook 2011, DOE/EIA-0383(2011), Washington, DC, online 41
accessible via www.eia.gov/forecasts/aeo/ or http://www.eia.gov/oiaf/aeo/tablebrowser/ (for a 42
tablebrowser), accessed on 12/05/2012. 43
17. INSEE, 2012. Tableaux de l’économie française, Edition 2012, Institut national de la statistique et 44
des études économiques, France, online accessible via http://www.insee.fr/fr 45
/ffc/tef/tef2012/tef2012.pdf, accessed on 11/07/2012. 46
18. ZAGAZ, 2012. Prix du carburant, statistiques et évolutions des prix du pétrole, online source : 47
http://www.zagaz.com/evolution-prix.php, accessed on 23/07/2012 48
TRB 2013 Annual Meeting Paper revised from original submittal.

Windisch
19
19. Lidicker, J., Lipman, T., Williams, B., 2011. Analysis of an electric vehicle subscription service 1
model that includes battery swapping for the San Francisco Bay Area market, presented at the 2
90th Annual Transportation Research Board Meeting, Washington, DC, January 23-27. 3
20. INSEE, 2009. Revenu salarial annuel moyen net de prélèvements par sexe, catégorie 4
socioprofessionnelle, http://www.insee.fr/fr/themes/ tableau.asp?reg_id=20&ref_id=revtc0413, 5
accessed on 28/02/2011 6
21. ADEME, 2012. Véhicules particuliers vendus en France - Consommations conventionnelles de 7
carburant et émissions de C02, http://www2.ademe.fr/servlet/getDoc?id=52820&ref=&nocache 8
=yes&p1=11, accessed on 18/07/2012 9
TRB 2013 Annual Meeting Paper revised from original submittal.

Windisch
20
ANNEX 1
2
TABLE A1 Vehicle type specific data 3 4
Vehicle/Battery Type OptionsVehicle/Battery Type OptionsVehicle/Battery Type OptionsVehicle/Battery Type Options
Engine Type - Model Type CV - Compact CV - Sedan EV - Compact EV - Sedan PHEV - Sedan
Fuel Type Petrol Diesel Diesel Electricity Electricity Electricity/Petrol
Battery Purchase Type - - - purchase/hire purchase/hire purchase
Renault ClioRenault ClioRenault ClioRenault Clio Renault ClioRenault ClioRenault ClioRenault Clio Renault FluenceRenault FluenceRenault FluenceRenault Fluence
Clio iii Live 3P
1.2 16V (75ch)
CLio iii 3P dCi
(90ch) eco2
FLUENCE dCi (110ch)
eco2
Vehicle/Battery Specifications
Engine Power (max. kW) (1) 55 65 81 65 70 111
CO2 Emissions (g/km) (1) 135 106 120 0 0 27*
Range (NEDC) (km) (2) 1375 1364 200 185610 (petrol)
56 (electr.)
Energy Consumption per vehicle usage area (in kWh/100km or l/100km) (3)
urban 7.6 4.9 5.6 13.9 14.3 16.9 / 5 / 90**
ex-urban 4.9 3.5 4.0 17.0 17.5 16.9 / 5 / 70**
mix 5.8 4.0 4.6 15.5 15.9 16.9 / 5 / 80**
Battery Capacity (in kWh) (4) - - - 22 22 16
*according to EU-approved UN ECE R101 carbon dioxide emission rating ** electr. / petrol / % of electricity mode usage (assumption)
Vehicle/Battery (+Registration) Costs
Vehicle Purchase (in Euro) (4) 16,650 17,450 22,850 20,700 26,300 37,300*
Battery Purchase* (in Euro) - - - 9,900 9,900 7,200
Bonus/Malus (in Euro) (5) 0 0 0 5,000 5,000 5,000
Registration Fees (in Euro) (6) 330 237 376 0 0 141
Battery Hire Costs (in cEuro/km) (7) - - - 6-10 6-10 -
*based on 450 Euro/kWh assumption (EVs only offered with battery lease / PHEV only offered with battery purchase)
Maintenance Costs (in cEuro/km) (8)
Total 4.3 4.3 5.6 4.0 5.4 6.6
Tire Costs 2.0 2.0 3.0 2.2 3.3 4.0
Service Costs 2.3 2.3 2.6 1.8 2.1 2.6
Insurance Costs per residential zone* (in Euro/year) (9)
Paris / Petite Couronne 536 548 548 429 438 658
Grande Couronne / Rest of France 430 460 460 344 368 552
* 13% decrease in case private parking available
Reference VehicleReference VehicleReference VehicleReference VehicleRenault ZOE Renault ZOE Renault ZOE Renault ZOE
Z.E.Z.E.Z.E.Z.E.
Renault Renault Renault Renault
Fluence Z.E.Fluence Z.E.Fluence Z.E.Fluence Z.E.Opel AmperaOpel AmperaOpel AmperaOpel Ampera
5 6
(1) Values for EV obtained from http://www.renault.fr/gamme-renault/vehicules-particuliers/index.jsp; values for CV and PHEV obtained 7
from ADEME (2012) [21]; CO2 emissions refer to tank-to-wheel emissions (sources accessed in June 2012) 8
(2) Values for CV and EV according to the New European Driving Cycle from http://www.renault.fr/gamme-renault/vehicules-9
particuliers/index.jsp, values for PHEV based on http://www.opel.fr/flash.html (sources accessed in June 2012) 10
(3) Values for CV and PHEV according to ADEME (2012) [21], values for EVs based on http://www.avem.fr/actualite-les-resultats-des-11
rallyes-du-challenge-bibendum-2011-a-berlin-2304.html (accessed June 2012) 12
(4) As advertised on http://www.renault.fr/gamme-renault/vehicules-particuliers/index.jsp (EVs + CVs) and http://www.opel.fr/flash.html 13
(PHEV). 14
(5) see http://www.service-public.fr/actualites/00694.html, ‘Bonus pour les véhicules propres’ and ‘Malus pour les véhicules polluants’ 15
(accessed June 2012) 16
(6) Including (i) regional fees as in the IDF region (46 Euros * ‘Puissance fiscale’ of the vehicle in case the vehicle emits tank-to-wheel 17
emissions), (ii) ‘frais de gestion’ and (iii) ‘frais de port’. 18
(7) Here shown prices are average value ranges of Renault’s tariffs that are dependent on the annual distance driven and the duration of the 19
hire contract. The underlying TCO model is based on Renault’s business model: Battery hire costs increase incrementally with an increasing 20
annual driven distance and an increasing vehicle ownership period. Values were obtained from http://www.renault.fr/gamme-21
renault/vehicules-electriques/fluence-ze/fluence-ze/ze-battery/ (accessed June 2012). Not yet advertised battery hire costs for the ZOE Z.E. 22
model are assumed to be the same as for the Fluence Z.E. model. 23
(8) Costs comprise service and car tyre costs. Service costs for CVs are based on a study recording the costs of over 5000 vehicles in France 24
(Carnet d’entretien en ligne, http://www.entretien-auto.com, accessed June 2012). Service costs for EVs are assumed to be 20 % less than for 25
CVs (according to discussions with Renault). Costs for PHEV assumed to be the same as for CV sedan model. Car tyre costs for CVs are 26
based on http://www.linternaute.com/auto/entretien-voiture/les-couts-moyens-d-entretien-automobile/changement-de-pneus.shtml (accessed 27
June 2012). Tyre costs for EVs (PHEV) assumed to be 110% (112%) of those of the comparable CV (the sedan model), due to increased 28
vehicle weight. 29
(9) Reference values for CV obtained by an online calculation template, see http://www.caradisiac.com/service/assurance-auto/ (accessed 30
June 2012), prices simulated for an all-risk insurance. 31
TRB 2013 Annual Meeting Paper revised from original submittal.

Windisch
21
TABLE A2 Vehicle-user-specific data 1
2
Vehicle User Categorization
Residential Area Paris Petite Couronne Grande Couronne Rest of France
Parking Availability yes no yes no yes no yes no
Parking Costs per parking policy scenario (in Euro/year) (1)
CV 902 221
EV
1 - No parking policy 902 2342 902 2342 221 1001 221 1001
2 - Free public parking 0 1440 0 1440 0 780 0 780
3 - Free public parking incl.
overnight infra. Availability0 0 0 0 0 0 0 0
Income (2) (3)
in Euro/year 25,643 23,854
Yearly Driven Distance (3) (4)
in kkm 12 - 19 11.5 - 19 15 - 20 15 - 20
Usage Purpose (all user categories) (3) Usage Period (T) (all user categories) (3)
0 - 100% professional usage 1-10 years 3 (1) Based on own estimates and parking tariffs in the ÎDF region 4
(2) Average salaries in the ÎDF region for the year 2008 [20]. 5
(3) Exact values to be defined by the model user, in accordance with characteristics of the household to be simulated 6
(4) Value ranges give indications on typical annual distances as found in the EGT (Enquête Globale de transport) 2001 7
in the ÎDF region 8
9
TABLE A3 Energy price forecasts per scenario 10
11
Energy Prices (1)Energy Prices (1)Energy Prices (1)Energy Prices (1)
Fuel Price (€/l) Electricity Price (c€/kWh)
Scenario Low Oil Price Medium Oil Price High Oil Price Medium High
Petrol Diesel Petrol Diesel Petrol Diesel (+4%/year) (+7%/year)
2013 1.22 1.00 1.40 1.30 1.66 1.73 15.14 16.02
2014 1.22 1.01 1.42 1.35 1.71 1.81 15.83 17.24
2015 1.22 1.01 1.45 1.39 1.74 1.88 16.55 18.55
2016 1.22 1.00 1.47 1.43 1.80 1.98 17.31 19.95
2017 1.22 1.01 1.51 1.48 1.85 2.06 18.10 21.47
2018 1.23 1.02 1.54 1.53 1.90 2.14 18.92 23.09
2019 1.24 1.03 1.57 1.58 1.95 2.22 19.79 24.84
2020 1.24 1.04 1.60 1.64 2.00 2.30 20.69 26.72
2021 1.25 1.05 1.63 1.69 2.05 2.38 21.63 28.75
2022 1.25 1.07 1.66 1.73 2.09 2.46 22.62 30.92
2023 1.26 1.08 1.68 1.78 2.14 2.53 23.64 33.26 12 (1) All shown values comprise energy tax forecasts of the reference scenario (as described in section 2.4) 13
14
TABLE 2: Other assumptions necessary for TCO calculations 15
16
OTHEROTHEROTHEROTHER
Infrastructure Usage Costs per scenario (EV) 0.26 cEuro / 0.0 cEuro (1 - No policy / 2 - Free infra. Use Scenario) (1)
Infrastructure Installation Costs (EV) 590 Euro (for 1 wall-box at the household)
Tax Allowance according to French barème kilométrique (DGFP, 2012)
Discount Rate Nominal: 6.5 % Real: 4.8 % (assumed constant inflation rate: 1.7% (2))
Depriciation Costs / Residual Value Not considered (3) 17 (1) Assumed to be constant over the vehicle ownership period 18
(2) Average inflation rate in France throughout the last 20 years 19
(3) In line with the assumption that the depreciation costs are the same for all vehicle types 20
21
22
TRB 2013 Annual Meeting Paper revised from original submittal.