The Economic Significance of Bicycle-Related Travel in … · The Economic Significance of...
55
The Economic Significance of Bicycle-Related Travel in Oregon Detailed State and Travel Region Estimates, 2012 April 2013 Prepared for Travel Oregon
-
Upload
truongcong -
Category
Documents
-
view
213 -
download
0
Transcript of The Economic Significance of Bicycle-Related Travel in … · The Economic Significance of...

The Economic Significance of
Bicycle-Related Travel in Oregon
Detailed State and Travel Region Estimates, 2012
April 2013
Prepared for
Travel Oregon
Phoenix, Arizona
The Economic Significance of
Bicycle-Related Travel in Oregon
Detailed State and Travel Region Estimates, 2012
April 2013
prepared for
Travel Oregon
Dean Runyan Associates
833 SW Eleventh Avenue, Suite 920
Portland, Oregon 97205
503/226-2973
www.deanrunyan.com

This page intentionally blank

Table of Contents
page
List of Tables ii
Preface iii
I. Introduction 1
II. Oregon Bicycle-Related Travel: Statewide Summary 5
III. Oregon Bicycle-Related Travel: Detailed Travel Region Impacts 11
Appendices:
A. Detailed Bicycle-Related Travel Expenditures A-1
B. Trip Characteristics by Type B-1
C. Demographics by Type C-1
Dean Runyan Associates Page i

List of Tables
page
Introduction
Average Party-Trip Expenditures for trips with Bicycle Activity in Oregon, 2012 3
Oregon Bicycle Related Travel: Statewide Summary
Oregon Bicycle-Related Travel: Party Trips by Type of Bicycle Activity, 2012 7
Oregon Bicycle-Related Travel: Party Trips by Travel Region, 2012 8
Oregon Bicycle-Related Travel Impacts, 2012 9
Oregon Bicycle-Related Travel: Travel Region Impacts
Oregon Bicycle-Related Travel Expenditures by Region 12
Oregon Bicycle-Related Travel: Detailed Travel Region Impacts, 2012 13
Coast Travel Region Bicycle-Related Impacts, 2012 14
Willamette Valley Travel Region Bicycle-Related Impacts, 2012 15
Portland Metro Travel Region Bicycle-Related Impacts, 2012 16
Southern Travel Region Bicycle-Related Impacts, 2012 17
Central Travel Region Bicycle-Related Impacts, 2012 18
Gorge/Mt. Hood Travel Region Bicycle-Related Impacts, 2012 19
Eastern Travel Region Bicycle-Related Impacts, 2012 20
Appendices
Oregon Bicycle-Related Travel Expenditures by Type, 2012 A-1
Oregon Bicycle-Related Travel Expenditures by Travel Region, 2012 A-2
Oregon Bicycle-Related Travel Characteristics by Type of Trip, 2012 B-1
Oregon Bicycle-Related Travel Characteristics by Type and Purpose of Trip, 2012 B-2
Oregon Bicycle-Related Travel Characteristics for Prepaid Guided Tours, 2012 B-3
Demographic Characteristics of Oregon Bicycle-Related Travelers, 2012 C-1
Demographic Characteristics of Oregon Bicycle-Related Travelers by Trip Purpose, 2012 C-2
Demographic Characteristics: Organized Non-competitive Group Rides, 2012 C-3
Demographic Characteristics: Sanctioned Bicycle Races, 2012 C-4
Demographic Characteristics: Organized Group Tours, 2012 C-5
Demographic Characteristics: Independent Bicycle Touring, 2012 C-6
Demographic Characteristics: Day Rode Rides, 2012 C-7
Demographic Characteristics: Day Mountain Bike Rides, 2012 C-8
Demographic Characteristics: As a Recreational Activity, 2012 C-9
Page ii Dean Runyan Associates

Preface
This study, prepared by Dean Runyan Associates for Travel Oregon, documents the economic
significance of bicycle-related travel throughout Oregon and each of the state’s travel regions in
2012.
Dean Runyan Associates has specialized in research and planning services for the travel,
tourism, and recreation industry since 1984. Dean Runyan Associates also has extensive
experience in project feasibility analysis, market evaluation, survey research, and travel and
recreation planning.
In preparing this report, we have received essential guidance and assistance from numerous
Travel Oregon staff, whom we thankfully acknowledge: Scott West, Chief Strategy Officer,
Michael Sturdevant, Senior Manager, Global Marketing Services, Kristin Dahl, Senior Manager,
Destination Development, Harry Dalgaard, Destination Development Specialist, as well as many
others who provided information and advice for this report.
With gratitude, we want to express our thanks for the cooperation to the many organizations
participating in the study, cycling tour operators, bicycle organizations, and bicycle shops
throughout the state, including Cycle Oregon, Oregon Bicycle Racing Association, International
Mountain Bicycling Association, Oregon Parks and Recreation Department, US Forest Service,
Bureau of Land Management, regional destination marketing organizations throughout the state,
and many community leaders. Also, individually, as well, to the over 5,000 participants who
voluntarily provided detailed information about their bicycle recreation and travel activity
throughout Oregon.
Finally, special thanks are due to Todd Davidson, Chief Executive Officer, of Travel Oregon.
Without his guidance and support, this project would not have been possible.
Dean Runyan Associates
833 SW 11th Ave., Suite 920
Portland, OR 97205
503.226.2397
www.deanrunyan.com
Dean Runyan Associates Page iii

I. Introduction
Travel to and throughout Oregon represents is an important component of the state’s economy
and participation in bicycling activities plays a significant role in terms of trip motivation,
destination choice, and the associated travel expenditures. This report describes the economic
significance of bicycle-related travel throughout Oregon, documenting the magnitude and
distribution of economic impacts to the state and its residents.
Based on results reported from a detailed questionnaire, our findings show that in 2012
travelers participated in a variety of bicycling activities while traveling throughout the state,
including both overnight and day trips. Travelers who participated in bicycle-related activities
while traveling in Oregon spent nearly $400 million in 2012 – representing about 4.4 percent of
the direct travel spending in the state (see Oregon Travel Impacts, 1991-2012p).
Detailed statewide information on trip characteristics and demographics for each bicycle activity
type is also included, providing details such as the purpose and length of the trips, distance
traveled, travel party size, as well as other demographic and associated trip-related
characteristics are shown in Appendices.
Objectives
This study represents a comprehensive effort by Travel Oregon to document the economic
significance of bicycle-related travel in Oregon. No other previous research provides economic
impacts for bicycle-related travel in Oregon at the state or regional level.
This study provides a detailed description of the magnitude of bicycling from a recreation travel
perspective, documenting the various ways that bicycles and bicycling provide economic
benefits to the state and its residents. The findings describe the primary bicycle and cycling
related economic aspects of travel for Oregon’s economy, including:
Travel and recreation, both by Oregon residents and out-of-state visitors, focusing on
sales, employment, earnings, and tax receipts
Distribution of impacts throughout the state (by travel region)
Page 1 Dean Runyan Associates
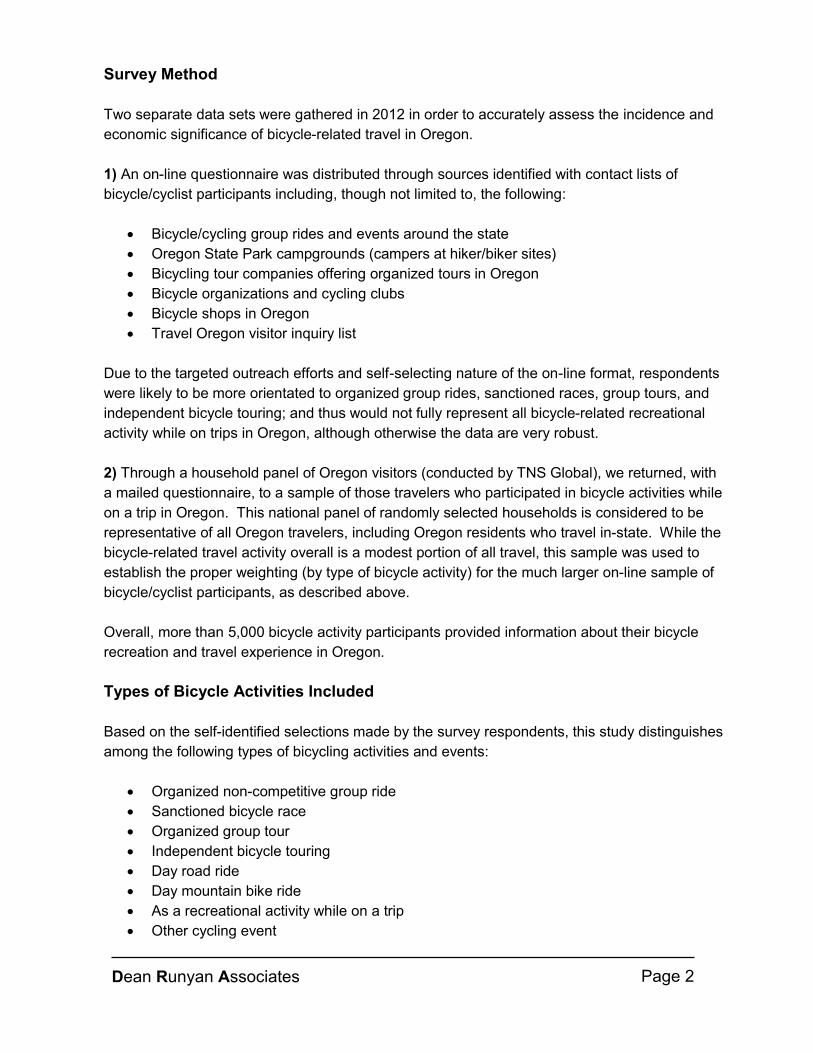
Survey Method
Two separate data sets were gathered in 2012 in order to accurately assess the incidence and
economic significance of bicycle-related travel in Oregon.
1) An on-line questionnaire was distributed through sources identified with contact lists of
bicycle/cyclist participants including, though not limited to, the following:
Bicycle/cycling group rides and events around the state
Oregon State Park campgrounds (campers at hiker/biker sites)
Bicycling tour companies offering organized tours in Oregon
Bicycle organizations and cycling clubs
Bicycle shops in Oregon
Travel Oregon visitor inquiry list
Due to the targeted outreach efforts and self-selecting nature of the on-line format, respondents
were likely to be more orientated to organized group rides, sanctioned races, group tours, and
independent bicycle touring; and thus would not fully represent all bicycle-related recreational
activity while on trips in Oregon, although otherwise the data are very robust.
2) Through a household panel of Oregon visitors (conducted by TNS Global), we returned, with
a mailed questionnaire, to a sample of those travelers who participated in bicycle activities while
on a trip in Oregon. This national panel of randomly selected households is considered to be
representative of all Oregon travelers, including Oregon residents who travel in-state. While the
bicycle-related travel activity overall is a modest portion of all travel, this sample was used to
establish the proper weighting (by type of bicycle activity) for the much larger on-line sample of
bicycle/cyclist participants, as described above.
Overall, more than 5,000 bicycle activity participants provided information about their bicycle
recreation and travel experience in Oregon.
Types of Bicycle Activities Included
Based on the self-identified selections made by the survey respondents, this study distinguishes
among the following types of bicycling activities and events:
Organized non-competitive group ride
Sanctioned bicycle race
Organized group tour
Independent bicycle touring
Day road ride
Day mountain bike ride
As a recreational activity while on a trip
Other cycling event
Dean Runyan Associates Page 2

Scope of Economic Impact Analysis
The scope of the economic impact analysis includes all of the travel expenditures for trips made
in Oregon where bicycling activity occurred on these trips as planned – either as the primary
reason, or one-of-several reasons for the trip. Expenditures include all lodging
accommodations, campground fees, restaurant and bars, groceries, fuel and other
transportation costs, bicycle repairs and related clothing and gear, event fees, recreation, other
retail, and airfare (if applicable) for trips made in Oregon. Travel made by Oregon residents and
nonresidents for both overnight and day trips (50 or more miles, one way) is included.
Travel expenditures, based on average expenditures per travel party per trip, are calculated for
each of the bicycle activity types, as shown in Table I-1 below.
Average Per Day Trip
Type of Bicycle Activity
Hotel
($/Trip)
Camp.
($/Trip)
Private
($/Trip)
All Types
($/Trip)
Length
(Nights)
Average Per Overnight Trip
$/Trip
Organized group tour $109 $900 4.5$1,151 $611 $574
As a recreational activity $131 $844 3.7$1,127 $583 $521
Sanctioned bicycle race $144 $794 2.6$962 $499 $467
Independent bicycle touring $144 $788 4.8$1,122 $530 $462
Day mountain bike ride $125 $732 3.4$1,073 $488 $409
Organized non-competitive group ride $168 $697 4.0$777 $756 $308
Day road ride $98 $606 2.8$818 $515 $306
Other cycling event $158 $552 2.7$574 $642 $305
Overall Bicycle Trip Average $116 $744 3.6$992 $556 $400
* All Oregon Travel expenditures based on Oregon Travel Impacts, 1998-2012p (statewide
preliminary estimates).
Notes: Hotel category includes all types of commercial lodging other than campgrounds (hotels,
motels, cabins, vacational rentals). Campground category inlcudes public and private campgrounds
and other types of accommodations (some event accommodations and casual camping). Private
category includes own accomodations or staying with friends or family. Day trips include travel with
bicycle activity 50 miles or more from home (one way). Average expenditures are based on trips
trips where bicycling activity was primary or one of the reasons for a trip. Expenditures information
was collected for the most significant day or overnight trip.
Source: Dean Runyan Associates.
All Oregon Travel* NA $883 NA $401 $620 3.3
Table I-1. Average Party Expenditures Per Trip for Travel with Bicycle Activity in Oregon, 2012
Page 3 Dean Runyan Associates

Economic Impact Categories
The specific categories of bicycle-related economic impacts included in this analysis are as
follows:
Economic Impacts Description
Travel Expenditures All spending on goods & services by visitors at the destination.
Total Earnings Earnings include wage and salary disbursements, other earned income or benefits, and proprietor income. Only the earnings attributable to travel expenditures are included.
Employment Industry employment (jobs) associated with travel-generated earnings. Includes both full-time and part-time positions, and salaried or self-employed individuals. Employment is reported as an average for the year.
Local Tax Receipts Lodging, sales and auto rental taxes imposed by cities, counties and other regional tax jurisdictions in Oregon. Property taxes are not included.
State Tax Receipts Lodging, motor fuel, and business and personal income taxes imposed by the state of Oregon.
Report Contents
Following this introductory section, Section II provides a statewide summary of Oregon bicycle-
related travel impacts. Section III provides detailed travel region impacts. Appendix A shows
detailed expenditure distributions by type of trip and business activity. Appendices B and C
show detailed trip characteristics by type, and demographics, including specific demographic
breakouts for each bicycle activity type.
Dean Runyan Associates Page 4

II. Oregon Bicycle-Related Travel:
Statewide Summary
OREGON
Page 5 Dean Runyan Associates
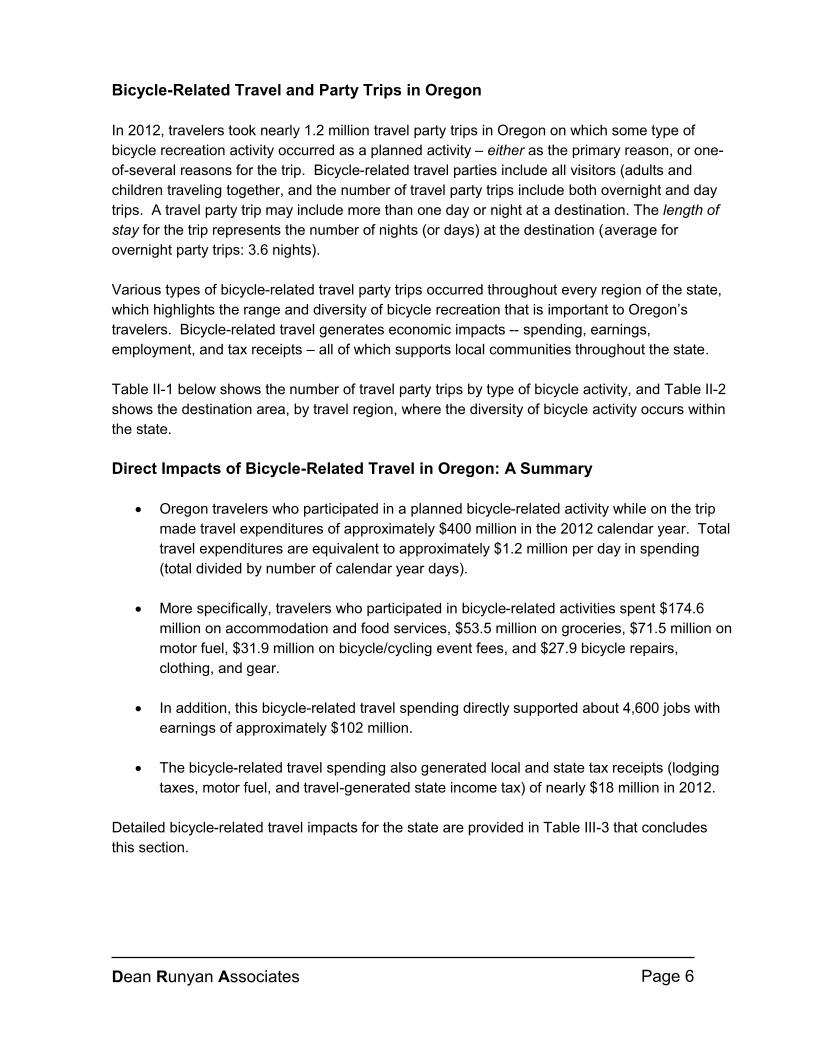
Bicycle-Related Travel and Party Trips in Oregon
In 2012, travelers took nearly 1.2 million travel party trips in Oregon on which some type of
bicycle recreation activity occurred as a planned activity – either as the primary reason, or one-
of-several reasons for the trip. Bicycle-related travel parties include all visitors (adults and
children traveling together, and the number of travel party trips include both overnight and day
trips. A travel party trip may include more than one day or night at a destination. The length of
stay for the trip represents the number of nights (or days) at the destination (average for
overnight party trips: 3.6 nights).
Various types of bicycle-related travel party trips occurred throughout every region of the state,
which highlights the range and diversity of bicycle recreation that is important to Oregon’s
travelers. Bicycle-related travel generates economic impacts -- spending, earnings,
employment, and tax receipts – all of which supports local communities throughout the state.
Table II-1 below shows the number of travel party trips by type of bicycle activity, and Table II-2
shows the destination area, by travel region, where the diversity of bicycle activity occurs within
the state.
Direct Impacts of Bicycle-Related Travel in Oregon: A Summary
Oregon travelers who participated in a planned bicycle-related activity while on the trip
made travel expenditures of approximately $400 million in the 2012 calendar year. Total
travel expenditures are equivalent to approximately $1.2 million per day in spending
(total divided by number of calendar year days).
More specifically, travelers who participated in bicycle-related activities spent $174.6
million on accommodation and food services, $53.5 million on groceries, $71.5 million on
motor fuel, $31.9 million on bicycle/cycling event fees, and $27.9 bicycle repairs,
clothing, and gear.
In addition, this bicycle-related travel spending directly supported about 4,600 jobs with
earnings of approximately $102 million.
The bicycle-related travel spending also generated local and state tax receipts (lodging
taxes, motor fuel, and travel-generated state income tax) of nearly $18 million in 2012.
Detailed bicycle-related travel impacts for the state are provided in Table III-3 that concludes
this section.
Dean Runyan Associates Page 6

Table II-1. Oregon Bicycle-Related Travel: Party-Trips by Type of Bicycle Activity, 2012
Trips by type of activity Total Overnight DayDay road ride 422,000 77,000 346,000
As a recreational activity 351,000 148,000 202,000
Organized non-competitive group ride 106,000 36,000 70,000
Sanctioned bicycle race 91,000 39,000 52,000
Day mountain bike ride 80,000 29,000 51,000
Independent bicycle touring 51,000 43,000 7,000
Organized group tour 39,000 28,000 11,000
Other cycling event 10,000 2,000 8,000
Total 748,000 403,000 1,151,000
Notes: Day trips include travel with bicycle activity 50 miles or more from home (one way). Trips
include only day and overnight trips where bicycling activity was primary or one of the reasons for
a trip.
Source: Dean Runyan Associates.
0 50 100 150 200 250 300 350 400 450
77
148
36
39
29
43
28
2
346
202
70
52
51
7
11
8
Day road ride
As a recreational activity
Organized non-competitive group ride
Sanctioned bicycle race
Day mountain bike ride
Independent bicycle touring
Organized group tour
Other cycling event
Overnight Party-Trips Day Party-Trips
Thousand Trips
Figure II-1. Bicycle-Related Party-Trips by Activity Type, 2012
Page 7 Dean Runyan Associates

Table II-2. Oregon Bicycle-Related Travel: Party-Trips by Travel Region, 2012
Trips by region Total Overnight DayPortland Metro 287,000 60,000 227,000
Willamette Valley 279,000 78,000 201,000
Gorge/Mt.Hood 187,000 41,000 146,000
Central 147,000 93,000 54,000
Coast 131,000 66,000 65,000
Southern 95,000 44,000 51,000
Eastern 25,000 20,000 5,000
Total 748,000 403,000 1,151,000
Notes: Day trips include travel with bicycle activity 50 miles or more from home (one way). Trips
include only day and overnight trips where bicycling activity was primary or one of the reasons for
a trip.
Source: Dean Runyan Associates.
0 40 80 120 160 200 240 280 320
60
78
41
93
66
44
20
227
201
146
54
65
51
5
Portland Metro
Willamette Valley
Gorge/Mt.Hood
Central
Coast
Southern
Eastern
Overnight Party-Trips Day Party-Trips
Thousand Trips
Figure II-2. Bicycle-Related Party-Trips by Travel Region, 2012
Dean Runyan Associates Page 8

Table II-3. Oregon Bicycle-Related Travel Impacts, 2012
Total Bicycle-Related Travel Expenditures $Million
$309.7Overnight
$89.9Day
$399.6Total
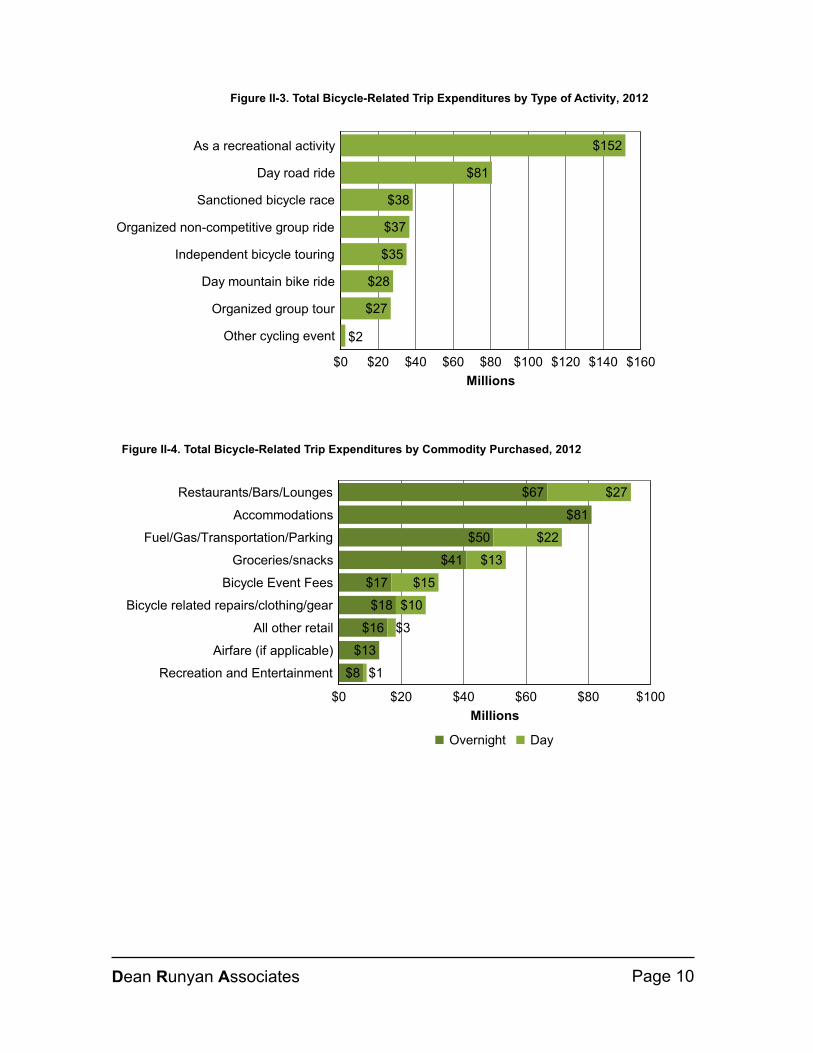
Bicycle-Related Travel Expenditures By Type of Activity $Million
$151.8As a recreational activity
$80.6Day road ride
$38.4Sanctioned bicycle race
$36.6Organized non-competitive group ride
$35.1Independent bicycle touring
$27.9Day mountain bike ride
$26.7Organized group tour
$2.5Other cycling event
$399.6Total
Bicycle-Related Travel Expenditures By Commodity Purchased $Million
$81.0Accommodations
$93.6Restaurants/Bars/Lounges
$53.5Groceries/snacks
$71.5Fuel/Gas/Transportation/Parking
$27.9Bicycle related repairs/clothing/gear
$31.9Bicycle Event Fees
$8.9Recreation and Entertainment
$18.3All other retail
$12.9Airfare (if applicable)
$399.6Total
Earnings Generated by Bicycle-Related Travel Expenditures $Million
$71.5Accommodation & Food Services
$14.6Arts, Entertainment & Recreation
$13.8Retail
$2.1Visitor Air Transportation
$102.0Total
Employment Generated by Bicycle-Related Travel Expenditures Number of Jobs
3,150Accommodation & Food Services
860Arts, Entertainment & Recreation
580Retail
30Visitor Air Transportation
4,630Total
Tax Receipts Generated by Bicycle-Related Travel Expenditures $Million
$5.7Local Tax Receipts
$12.2State Tax Receipts
$17.9Total
Notes: Day trips include travel with bicycle activity 50 miles or more from home (one way). Travel
Impacts are based on trips where bicycling activity was primary or one of the reasons for a trip.
Recreation and entertainment expenditures include bicycle rentals.
Source: Dean Runyan Associates.
Page 9 Dean Runyan Associates
$0 $20 $40 $60 $80 $100 $120 $140 $160
$152
$81
$38
$37
$35
$28
$27
$2
As a recreational activity
Day road ride
Sanctioned bicycle race
Organized non-competitive group ride
Independent bicycle touring
Day mountain bike ride
Organized group tour
Other cycling event
Millions
$0 $20 $40 $60 $80 $100
$67
$81
$50
$41
$17
$18
$16
$13
$8
$27
$22
$13
$15
$10
$3
$1
Restaurants/Bars/Lounges
Accommodations
Fuel/Gas/Transportation/Parking
Groceries/snacks
Bicycle Event Fees
Bicycle related repairs/clothing/gear
All other retail
Airfare (if applicable)
Recreation and Entertainment
Overnight Day
Millions
Figure II-3. Total Bicycle-Related Trip Expenditures by Type of Activity, 2012
Figure II-4. Total Bicycle-Related Trip Expenditures by Commodity Purchased, 2012
Dean Runyan Associates Page 10

MT.HOOD/GORGE
CENTRAL
COAST
EASTERN
SOUTHERN
WILLAMETTE VALLEY
PORTLAND METRO
Counties by Oregon Travel Region
Eastern
Baker
Gilliam
Grant
Harney
Malheur
Morrow
Sherman
Umatilla
Union
Wallowa
Wheeler
Southern
Douglas (East)
Jackson
Josephine
Klamath
Lake
Mt.Hood/Gorge
Clackamas (East)
Multnomah (East)
Hood River
Wasco (North)
Willamette Valley
Benton
Clackamas (South)
Lane (East)
Linn
Marion
Polk
Yamhill
Portland Metro
Clackamas (West)
Columbia
Multnomah (West)
Washington
Coast
Clatsop
Coos
Curry
Douglas (West)
Lane (West)
Lincoln
Tillamook
Central
Crook
Deschutes
Jefferson
Wasco (South)
III. Oregon Bicycle-Related Travel:
Detailed Travel Region Impacts
Page 11 Dean Runyan Associates

Bicycle-Related Travel Expenditures by Region
Throughout Oregon’s travel regions, travelers made expenditures for both overnight and day
trips. Figure III-1 below shows the composition of overnight and day and expenditures within
each travel region during 2012. Overall, the Portland Metro, Willamette Valley, and Central
regions had the highest amount of spending. It is notable that travel spending for day trips
made in the Portland Metro and the Willamette Valley regions expenditures is more significant
as compared to the Central region, which was much more oriented to overnight trips. For the
Coast, Southern, and Eastern regions, travel spending was largely driven by overnight trips,
while the Gorge/Mt. Hood is somewhat more oriented to day travel activity.
$0 $20 $40 $60 $80 $100
$56
$57
$70
$49
$30
$33
$15
$33
$22
$6
$8
$16
$6
$1
Portland Metro
Willamette Valley
Central
Coast
Gorge/Mt.Hood
Southern
Eastern
OvernightDay
Million
Figure III-1. Total Bicycle-Related Trip Expenditures by Region and Type of Trip, 2012
Figure III-2. Bicycle-Related Share of Total Travel Expenditures by Region In Oregon, 2012
10% +
4% to 10%
1% to 4%
EASTERN(4.6%)
CENTRAL (11.6%)
SOUTHERN(4.2%)
WILLAMETTE VALLEY (5.1%)
PORTLAND (2.3%)
COAST(3.6%)
GORGEMT.HOOD
(14.8%)
Dean Runyan Associates Page 12

Table III-1. Oregon Bicycle-Related Travel Impacts by Travel Region, 2012
State Total Impacts Southern
Expenditures ($Million) $400 Expenditures ($Million) $39
Earnings ($Million) $102.0 Earnings ($Million) $10.6
Employment (Jobs) 4,630 Employment (Jobs) 490
State & Local Tax Receipts ($Million) $17.9 State & Local Tax Receipts ($Million) $1.8
Share of Total Travel Expenditures 4.4% Share of Total Travel Expenditures 4.2%
Coast Central
Expenditures ($Million) $56 Expenditures ($Million) $76
Earnings ($Million) $15.2 Earnings ($Million) $20.2
Employment (Jobs) 670 Employment (Jobs) 920
State & Local Tax Receipts ($Million) $2.3 State & Local Tax Receipts ($Million) $3.4
Share of Total Travel Expenditures 3.6% Share of Total Travel Expenditures 11.6%
Willamette Valley Gorge/Mt.Hood
Expenditures ($Million) $78 Expenditures ($Million) $46
Earnings ($Million) $21.0 Earnings ($Million) $12.0
Employment (Jobs) 1,040 Employment (Jobs) 570
State & Local Tax Receipts ($Million) $3.7 State & Local Tax Receipts ($Million) $1.9
Share of Total Travel Expenditures 5.1% Share of Total Travel Expenditures 14.8%
Portland Metro Eastern
Expenditures ($Million) $89 Expenditures ($Million) $15
Earnings ($Million) $18.7 Earnings ($Million) $4.3
Employment (Jobs) 700 Employment (Jobs) 230
State & Local Tax Receipts ($Million) $4.1 State & Local Tax Receipts ($Million) $0.7
Share of Total Travel Expenditures 2.3% Share of Total Travel Expenditures 4.6%
Note: Travel Impacts based on trips where bicycle activity was the primary or one -of-several reasons for
the trip. Share of Total Travel Expenditures based on the Oregon Travel Impacts, 1998-2012p (statewide
preliminary estimates).
Source: Dean Runyan Associates.
Page 13 Dean Runyan Associates

Table III-2. Coast Travel Region Bicycle-Related Travel Impacts, 2012
Total Bicycle-Related Travel Expenditures $Million
$48.7Overnight
$7.6Day
$56.3Total
Bicycle-Related Travel Expenditures By Commodity Purchased $Million
$13.5Accommodations
$13.7Restaurants/Bars/Lounges
$7.8Groceries/snacks
$9.5Fuel/Gas/Transportation/Parking
$4.1Bicycle related repairs/clothing/gear
$3.4Bicycle Event Fees
$1.4Recreation and Entertainment
$2.9All other retail
$0.1Airfare (if applicable)
$56.3Total
Earnings Generated by Bicycle-Related Travel Expenditures $Million
$11.3Accommodation & Food Services
$1.7Arts, Entertainment & Recreation
$2.2Retail
$0.1Visitor Air Transportation
$15.2Total
Employment Generated by Bicycle-Related Travel Expenditures Number of Jobs
470Accommodation & Food Services
100Arts, Entertainment & Recreation
100Retail
0Visitor Air Transportation
670Total
Tax Receipts Generated by Bicycle-Related Travel Expenditures $Million
$0.8Local Tax Receipts
$1.5State Tax Receipts
$2.3Total
Notes: Day trips include travel with bicycle activity 50 miles or more from home (one way). Travel
Impacts are based on trips where bicycling activity was primary or one of the reasons for a trip.
Source: Dean Runyan Associates.
Dean Runyan Associates Page 14

Table III-3. Willamette Valley Travel Region Bicycle-Related Travel Impacts, 2012
Total Bicycle-Related Travel Expenditures $Million
$56.7Overnight
$21.8Day
$78.5Total
Bicycle-Related Travel Expenditures By Commodity Purchased $Million
$15.2Accommodations
$19.7Restaurants/Bars/Lounges
$10.1Groceries/snacks
$13.8Fuel/Gas/Transportation/Parking
$5.9Bicycle related repairs/clothing/gear
$7.8Bicycle Event Fees
$1.7Recreation and Entertainment
$3.6All other retail
$0.7Airfare (if applicable)
$78.5Total
Earnings Generated by Bicycle-Related Travel Expenditures $Million
$14.9Accommodation & Food Services
$3.5Arts, Entertainment & Recreation
$2.6Retail
$0.0Visitor Air Transportation
$21.0Total
Employment Generated by Bicycle-Related Travel Expenditures Number of Jobs
710Accommodation & Food Services
220Arts, Entertainment & Recreation
120Retail
0Visitor Air Transportation
1,040Total
Tax Receipts Generated by Bicycle-Related Travel Expenditures $Million
$1.0Local Tax Receipts
$2.7State Tax Receipts
$3.7Total
Notes: Day trips include travel with bicycle activity 50 miles or more from home (one way). Travel
Impacts are based on trips where bicycling activity was primary or one of the reasons for a trip.
Source: Dean Runyan Associates.
Page 15 Dean Runyan Associates
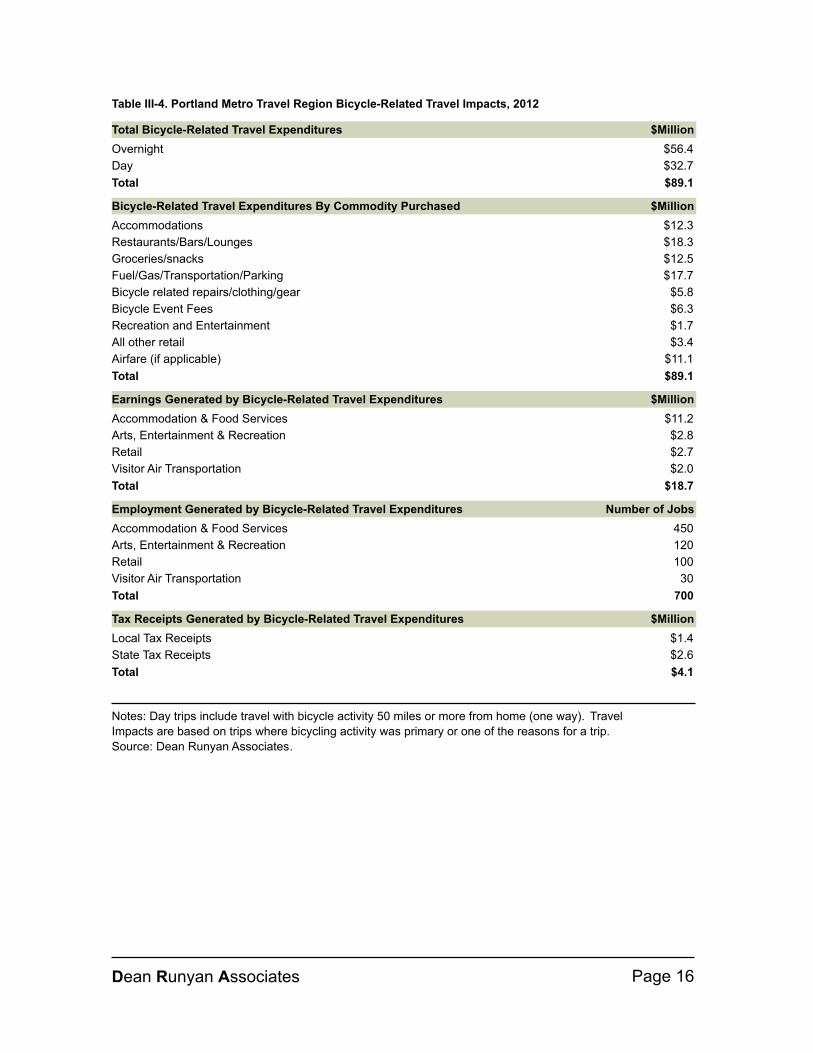
Table III-4. Portland Metro Travel Region Bicycle-Related Travel Impacts, 2012
Total Bicycle-Related Travel Expenditures $Million
$56.4Overnight
$32.7Day
$89.1Total
Bicycle-Related Travel Expenditures By Commodity Purchased $Million
$12.3Accommodations
$18.3Restaurants/Bars/Lounges
$12.5Groceries/snacks
$17.7Fuel/Gas/Transportation/Parking
$5.8Bicycle related repairs/clothing/gear
$6.3Bicycle Event Fees
$1.7Recreation and Entertainment
$3.4All other retail
$11.1Airfare (if applicable)
$89.1Total
Earnings Generated by Bicycle-Related Travel Expenditures $Million
$11.2Accommodation & Food Services
$2.8Arts, Entertainment & Recreation
$2.7Retail
$2.0Visitor Air Transportation
$18.7Total
Employment Generated by Bicycle-Related Travel Expenditures Number of Jobs
450Accommodation & Food Services
120Arts, Entertainment & Recreation
100Retail
30Visitor Air Transportation
700Total
Tax Receipts Generated by Bicycle-Related Travel Expenditures $Million
$1.4Local Tax Receipts
$2.6State Tax Receipts
$4.1Total
Notes: Day trips include travel with bicycle activity 50 miles or more from home (one way). Travel
Impacts are based on trips where bicycling activity was primary or one of the reasons for a trip.
Source: Dean Runyan Associates.
Dean Runyan Associates Page 16

Table III-5. Southern Travel Region Bicycle-Related Travel Impacts, 2012
Total Bicycle-Related Travel Expenditures $Million
$32.9Overnight
$5.8Day
$38.7Total
Bicycle-Related Travel Expenditures By Commodity Purchased $Million
$8.6Accommodations
$8.9Restaurants/Bars/Lounges
$5.1Groceries/snacks
$6.8Fuel/Gas/Transportation/Parking
$2.6Bicycle related repairs/clothing/gear
$3.3Bicycle Event Fees
$0.9Recreation and Entertainment
$1.9All other retail
$0.6Airfare (if applicable)
$38.7Total
Earnings Generated by Bicycle-Related Travel Expenditures $Million
$7.6Accommodation & Food Services
$1.5Arts, Entertainment & Recreation
$1.3Retail
$0.0Visitor Air Transportation
$10.6Total
Employment Generated by Bicycle-Related Travel Expenditures Number of Jobs
340Accommodation & Food Services
90Arts, Entertainment & Recreation
60Retail
0Visitor Air Transportation
490Total
Tax Receipts Generated by Bicycle-Related Travel Expenditures $Million
$0.6Local Tax Receipts
$1.3State Tax Receipts
$1.8Total
Notes: Day trips include travel with bicycle activity 50 miles or more from home (one way). Travel
Impacts are based on trips where bicycling activity was primary or one of the reasons for a trip.
Source: Dean Runyan Associates.
Page 17 Dean Runyan Associates

Table III-6. Central Travel Region Bicycle-Related Travel Impacts, 2012
Total Bicycle-Related Travel Expenditures $Million
$69.8Overnight
$5.9Day
$75.7Total
Bicycle-Related Travel Expenditures By Commodity Purchased $Million
$19.1Accommodations
$17.4Restaurants/Bars/Lounges
$10.1Groceries/snacks
$13.2Fuel/Gas/Transportation/Parking
$4.8Bicycle related repairs/clothing/gear
$5.3Bicycle Event Fees
$1.8Recreation and Entertainment
$3.6All other retail
$0.4Airfare (if applicable)
$75.7Total
Earnings Generated by Bicycle-Related Travel Expenditures $Million
$14.9Accommodation & Food Services
$2.6Arts, Entertainment & Recreation
$2.7Retail
$0.0Visitor Air Transportation
$20.2Total
Employment Generated by Bicycle-Related Travel Expenditures Number of Jobs
340Accommodation & Food Services
90Arts, Entertainment & Recreation
60Retail
0Visitor Air Transportation
920Total
Tax Receipts Generated by Bicycle-Related Travel Expenditures $Million
$1.1Local Tax Receipts
$2.2State Tax Receipts
$3.4Total
Notes: Day trips include travel with bicycle activity 50 miles or more from home (one way). Travel
Impacts are based on trips where bicycling activity was primary or one of the reasons for a trip.
Source: Dean Runyan Associates.
Dean Runyan Associates Page 18

Table III-7. Gorge/Mt.Hood Travel Region Bicycle-Related Travel Impacts, 2012
Total Bicycle-Related Travel Expenditures $Million
$30.3Overnight
$15.5Day
$45.8Total
Bicycle-Related Travel Expenditures By Commodity Purchased $Million
$8.2Accommodations
$12.1Restaurants/Bars/Lounges
$5.8Groceries/snacks
$8.0Fuel/Gas/Transportation/Parking
$3.8Bicycle related repairs/clothing/gear
$4.8Bicycle Event Fees
$1.0Recreation and Entertainment
$2.1All other retail
$0.0Airfare (if applicable)
$45.8Total
Earnings Generated by Bicycle-Related Travel Expenditures $Million
$8.2Accommodation & Food Services
$2.1Arts, Entertainment & Recreation
$1.7Retail
$0.0Visitor Air Transportation
$12.0Total
Employment Generated by Bicycle-Related Travel Expenditures Number of Jobs
380Accommodation & Food Services
120Arts, Entertainment & Recreation
70Retail
0Visitor Air Transportation
570Total
Tax Receipts Generated by Bicycle-Related Travel Expenditures $Million
$0.6Local Tax Receipts
$1.3State Tax Receipts
$1.9Total
Notes: Day trips include travel with bicycle activity 50 miles or more from home (one way). Travel
Impacts are based on trips where bicycling activity was primary or one of the reasons for a trip.
Source: Dean Runyan Associates.
Page 19 Dean Runyan Associates

Table III-8. Eastern Travel Region Bicycle-Related Travel Impacts, 2012
Total Bicycle-Related Travel Expenditures $Million
$14.8Overnight
$0.5Day
$15.3Total
Bicycle-Related Travel Expenditures By Commodity Purchased $Million
$4.1Accommodations
$3.5Restaurants/Bars/Lounges
$2.1Groceries/snacks
$2.5Fuel/Gas/Transportation/Parking
$1.0Bicycle related repairs/clothing/gear
$1.0Bicycle Event Fees
$0.4Recreation and Entertainment
$0.8All other retail
$0.0Airfare (if applicable)
$15.3Total
Earnings Generated by Bicycle-Related Travel Expenditures $Million
$3.3Accommodation & Food Services
$0.4Arts, Entertainment & Recreation
$0.6Retail
$0.0Visitor Air Transportation
$4.3Total
Employment Generated by Bicycle-Related Travel Expenditures Number of Jobs
170Accommodation & Food Services
40Arts, Entertainment & Recreation
30Retail
0Visitor Air Transportation
230Total
Tax Receipts Generated by Bicycle-Related Travel Expenditures $Million
$0.2Local Tax Receipts
$0.5State Tax Receipts
$0.7Total
Notes: Day trips include travel with bicycle activity 50 miles or more from home (one way). Travel
Impacts are based on trips where bicycling activity was primary or one of the reasons for a trip.
Source: Dean Runyan Associates.
Dean Runyan Associates Page 20

APPENDIX A
Detailed Oregon Bicycle-Related Travel Expenditures

This page intentionally blank

Table A-1. Oregon Bicycle-Related Travel Expenditures by Type, 2012
(in thousands of dollars)
Organized non-competitive group ride Overnight DayTotal
Accommodations $5,481 -$5,481
Restaurants/Bars/Lounges $4,318 $2,548$6,866
Groceries/snacks $2,414 $1,035$3,449
Fuel/Gas/Transportation/Parking $3,987 $2,561$6,548
Bicycle related repairs/clothing/gear $1,322 $1,220$2,542
Bicycle Event Fees $5,563 $3,952$9,515
Recreation and Entertainment $379 $70$449
All other retail $1,061 $405$1,466
Airfare (if applicable) $265 -$265
$36,581 $11,790$24,790Total
Sanctioned bicycle race Overnight DayTotal
Accommodations $8,957 -$8,957
Restaurants/Bars/Lounges $6,425 $1,846$8,271
Groceries/snacks $3,616 $945$4,560
Fuel/Gas/Transportation/Parking $4,956 $2,206$7,161
Bicycle related repairs/clothing/gear $1,411 $496$1,907
Bicycle Event Fees $3,886 $1,747$5,632
Recreation and Entertainment $493 $152$644
All other retail $997 $142$1,139
Airfare (if applicable) $153 -$153
$38,425 $7,532$30,893Total
Organized group tour Overnight DayTotal
Accommodations $7,429 -$7,429
Restaurants/Bars/Lounges $5,243 $340$5,583
Groceries/snacks $3,425 $106$3,530
Fuel/Gas/Transportation/Parking $2,949 $463$3,412
Bicycle related repairs/clothing/gear $1,396 $68$1,464
Bicycle Event Fees $1,825 $168$1,993
Recreation and Entertainment $497 $25$522
All other retail $1,185 $21$1,206
Airfare (if applicable) $1,548 -$1,548
$26,687 $1,191$25,496Total
Independent bicycle touring Overnight DayTotal
Accommodations $9,647 -$9,647
Restaurants/Bars/Lounges $8,309 $361$8,670
Groceries/snacks $5,039 $136$5,175
Fuel/Gas/Transportation/Parking $4,701 $299$4,999
Bicycle related repairs/clothing/gear $2,678 $117$2,794
Bicycle Event Fees $359 $36$395
Recreation and Entertainment $374 $4$378
All other retail $1,421 $95$1,516
Airfare (if applicable) $1,541 -$1,541
$35,115 $1,048$34,068Total
Dean Runyan Associates Page A-1

Table A-1. Oregon Bicycle-Related Travel Expenditures by Type, 2012
(in thousands of dollars) (continued)
Day road ride Overnight DayTotal
Accommodations $12,048 -$12,048
Restaurants/Bars/Lounges $11,422 $11,198$22,620
Groceries/snacks $5,780 $5,058$10,838
Fuel/Gas/Transportation/Parking $7,584 $8,938$16,523
Bicycle related repairs/clothing/gear $3,015 $3,386$6,401
Bicycle Event Fees $2,374 $3,970$6,344
Recreation and Entertainment $1,208 $339$1,547
All other retail $2,230 $1,137$3,366
Airfare (if applicable) $921 -$921
$80,608 $34,026$46,582Total
Day mountain bike ride Overnight DayTotal
Accommodations $5,590 -$5,590
Restaurants/Bars/Lounges $4,761 $2,235$6,996
Groceries/snacks $3,096 $793$3,889
Fuel/Gas/Transportation/Parking $3,986 $2,168$6,153
Bicycle related repairs/clothing/gear $1,727 $440$2,167
Bicycle Event Fees $716 $552$1,268
Recreation and Entertainment $462 $48$510
All other retail $922 $152$1,074
Airfare (if applicable) $289 -$289
$27,937 $6,388$21,549Total
As a recreational activity Overnight DayTotal
Accommodations $31,524 -$31,524
Restaurants/Bars/Lounges $26,136 $7,875$34,011
Groceries/snacks $17,374 $4,377$21,751
Fuel/Gas/Transportation/Parking $21,180 $5,130$26,311
Bicycle related repairs/clothing/gear $6,738 $3,596$10,333
Bicycle Event Fees $1,855 $4,574$6,428
Recreation and Entertainment $4,483 $326$4,809
All other retail $7,728 $692$8,421
Airfare (if applicable) $8,172 -$8,172
$151,760 $26,570$125,190Total
Other cycling event Overnight DayTotal
Accommodations $338 -$338
Restaurants/Bars/Lounges $220 $390$611
Groceries/snacks $70 $258$327
Fuel/Gas/Transportation/Parking $181 $235$416
Bicycle related repairs/clothing/gear $31 $230$262
Bicycle Event Fees $207 $136$343
Recreation and Entertainment $- $40$40
All other retail $16 $54$69
Airfare (if applicable) $48 -$48
$2,453 $1,342$1,111Total
Page A-2 Dean Runyan Associates

Table A-1. Oregon Bicycle-Related Travel Expenditures by Type, 2012
(in thousands of dollars) (continued)
Total Overnight DayTotal
Accommodations $81,013 -$81,013
Restaurants/Bars/Lounges $66,836 $26,792$93,628
Groceries/snacks $40,813 $12,707$53,520
Fuel/Gas/Transportation/Parking $49,523 $21,999$71,522
Bicycle related repairs/clothing/gear $18,317 $9,553$27,870
Bicycle Event Fees $16,785 $15,134$31,918
Recreation and Entertainment $7,896 $1,003$8,899
All other retail $15,559 $2,698$18,257
Airfare (if applicable) $12,938 -$12,938
$399,566 $89,886$309,680Total
Notes: Day trips include travel with bicycle activity 50 miles or more from home (one way).
Expenditures are based on trips where bicycling activity was primary or one of the reasons for a
trip. Source: Dean Runyan Associates.
Dean Runyan Associates Page A-3

Table A-2. Oregon Bicycle-Related Travel Expenditures by Travel Region, 2012
(in thousands of dollars)
Coast Overnight Day Total
Accommodations $13,454 - $13,454
Restaurants/Bars/Lounges $11,280 $2,385 $13,665
Groceries/snacks $6,943 $897 $7,840
Fuel/Gas/Transportation/Parking $8,036 $1,426 $9,462
Bicycle related repairs/clothing/gear $3,119 $969 $4,087
Bicycle Event Fees $1,839 $1,587 $3,426
Recreation and Entertainment $1,331 $90 $1,420
All other retail $2,663 $255 $2,918
Airfare (if applicable) $69 - $69
$56,342$7,608$48,734Total
Willamette Valley Overnight Day Total
Accommodations $15,197 - $15,197
Restaurants/Bars/Lounges $12,624 $7,063 $19,686
Groceries/snacks $7,547 $2,544 $10,091
Fuel/Gas/Transportation/Parking $9,121 $4,716 $13,837
Bicycle related repairs/clothing/gear $3,511 $2,396 $5,906
Bicycle Event Fees $3,729 $4,050 $7,779
Recreation and Entertainment $1,395 $256 $1,650
All other retail $2,861 $742 $3,603
Airfare (if applicable) $729 - $729
$78,480$21,766$56,713Total
Portland Metro Overnight Day Total
Accommodations $12,323 - $12,323
Restaurants/Bars/Lounges $10,218 $8,101 $18,319
Groceries/snacks $6,425 $6,026 $12,451
Fuel/Gas/Transportation/Parking $7,762 $9,966 $17,728
Bicycle related repairs/clothing/gear $2,734 $3,034 $5,767
Bicycle Event Fees $1,818 $4,450 $6,268
Recreation and Entertainment $1,400 $318 $1,719
All other retail $2,616 $802 $3,417
Airfare (if applicable) $11,129 - $11,129
$89,121$32,697$56,424Total
Southern Overnight Day Total
Accommodations $8,564 - $8,564
Restaurants/Bars/Lounges $7,086 $1,773 $8,859
Groceries/snacks $4,324 $812 $5,136
Fuel/Gas/Transportation/Parking $5,425 $1,404 $6,829
Bicycle related repairs/clothing/gear $1,967 $618 $2,586
Bicycle Event Fees $2,358 $972 $3,330
Recreation and Entertainment $864 $66 $930
All other retail $1,716 $175 $1,891
Airfare (if applicable) $619 - $619
$38,743$5,820$32,923Total
Page A-4 Dean Runyan Associates

Table A-2. Oregon Bicycle-Related Travel Expenditures by Travel Region, 2012
(in thousands of dollars) (continued)
Central Overnight Day Total
Accommodations $19,118 - $19,118
Restaurants/Bars/Lounges $15,447 $1,975 $17,422
Groceries/snacks $9,389 $737 $10,126
Fuel/Gas/Transportation/Parking $11,700 $1,451 $13,151
Bicycle related repairs/clothing/gear $4,174 $597 $4,771
Bicycle Event Fees $4,407 $901 $5,308
Recreation and Entertainment $1,753 $77 $1,830
All other retail $3,399 $186 $3,586
Airfare (if applicable) $392 - $392
$75,705$5,925$69,780Total
Gorge/Mt.Hood Overnight Day Total
Accommodations $8,249 - $8,249
Restaurants/Bars/Lounges $6,797 $5,333 $12,129
Groceries/snacks $4,158 $1,625 $5,784
Fuel/Gas/Transportation/Parking $5,105 $2,907 $8,012
Bicycle related repairs/clothing/gear $1,889 $1,882 $3,771
Bicycle Event Fees $1,772 $3,063 $4,835
Recreation and Entertainment $795 $191 $986
All other retail $1,563 $520 $2,083
Airfare (if applicable) $0 - $0
$45,849$15,520$30,329Total
Eastern Overnight Day Total
Accommodations $4,108 - $4,108
Restaurants/Bars/Lounges $3,384 $163 $3,547
Groceries/snacks $2,027 $66 $2,092
Fuel/Gas/Transportation/Parking $2,375 $128 $2,503
Bicycle related repairs/clothing/gear $924 $57 $981
Bicycle Event Fees $860 $111 $972
Recreation and Entertainment $358 $5 $363
All other retail $741 $19 $760
Airfare (if applicable) $0 - $0
$15,327$550$14,777Total
Dean Runyan Associates

Table A-2. Oregon Bicycle-Related Travel Expenditures by Travel Region, 2012
(in thousands of dollars) (continued)
Total Overnight Day Total
Accommodations $81,013 - $81,013
Restaurants/Bars/Lounges $66,836 $26,792 $93,628
Groceries/snacks $40,813 $12,707 $53,520
Fuel/Gas/Transportation/Parking $49,523 $21,999 $71,522
Bicycle related repairs/clothing/gear $18,317 $9,553 $27,870
Bicycle Event Fees $16,785 $15,134 $31,918
Recreation and Entertainment $7,896 $1,003 $8,899
All other retail $15,559 $2,698 $18,257
Airfare (if applicable) $12,938 - $12,938
$399,566$89,886$309,680Total
Notes: Day trips include travel with bicycle activity 50 miles or more from home (one way).
Expenditures are based on trips where bicycling activity was primary or one of the reasons for a
trip. Source: Dean Runyan Associates, Inc.
Dean Runyan Associates

APPENDIX B
Trip Characteristics by Type

This page intentionally blank

Table B-1. Oregon Bicycle-Related Travel Characteristics by Type of Trip, 2012
All Reasons for a Trip (n=3,270)
Purpose of Trip Total Overnight Day
Primary reason for trip 45.8% 51.7% 72.9%
One of several reasons for this trip 29.6% 26.5% 15.3%
A casual activity while on this trip 24.6% 21.8% 11.8%
Total 100.0% 100.0% 100.0%
Type(s) of Accommodation Total Overnight Day
Commercial Lodging 70.6% 70.6% 0.0%
Campgrounds/RV Park 43.0% 43.0% 0.0%
Friends/Relatives 18.9% 18.9% 0.0%
Second Home 3.4% 3.4% 0.0%
Other (event accommodations, etc) 7.4% 7.4% 0.0%
Total* 143.2% 143.2% 0.0%
Number of Nights Total Overnight Day
1 Night 16.0% 16.0% NA
2 Nights 24.3% 24.3% NA
3-4 Nights 27.1% 27.1% NA
5-6 Nights 12.2% 12.2% NA
7+ Nights 20.4% 20.4% NA
Total 100.0% 100.0% NA
Prepaid Guided Tour Total Overnight Day
Yes 6.2% 6.2% 0.0%
No 93.8% 93.8% 0.0%
Average Miles Traveled Total Overnight Day
Under 100 miles 27.6% 40.1% 84.5%
100-199 miles 30.2% 26.6% 13.6%
200-299 miles 13.9% 11.0% 0.8%
300 miles or more 28.3% 22.3% 1.1%
Total 100.0% 100.0% 100.0%
Type of Bicycle(s) Total Overnight Day
Road bike 46.6% 50.3% 64.8%
Mountain bike, cross-country 34.7% 33.0% 26.1%
Hybrid/cross bike 21.8% 21.4% 19.9%
Touring bike 16.1% 15.5% 13.1%
City bike 13.2% 12.7% 10.8%
Cruiser bike 7.4% 6.9% 4.7%
Mountain bike, downhill 7.3% 6.6% 3.8%
Tandem 4.7% 4.3% 2.5%
Recumbent 3.9% 3.7% 3.2%
Track bike 0.9% 1.0% 1.3%
Other 6.3% 6.1% 5.1%
Total* 163.0% 161.5% 155.3%
Dean Runyan Associates Page B-1

Table B-1. Oregon Bicycle-Related Travel Characteristics by Type of Trip, 2012
All Reasons for a Trip (n=3,270) (continued)
Average Party Size Total Overnight Day
Number of Adults 2.9 2.8 2.5
Number of Children 0.5 0.5 0.3
Travel Companions Total Overnight Day
Just Myself 11.7% 13.5% 20.1%
Significant Other 36.2% 33.9% 25.9%
Immediate Family Only 18.4% 16.8% 10.9%
Multiple Families 6.7% 5.6% 1.9%
Other Adult Friends 22.4% 25.4% 36.2%
Cycling support team/other 4.6% 4.7% 5.0%
Total 100.0% 100.0% 100.0%
All Bicycling Activities In Oregon (2011-2012) Total Overnight Day
As a recreational activity 75.0% 73.3% 67.4%
Day road ride 64.7% 69.6% 87.2%
Organized non-competitive group ride 37.7% 41.2% 53.4%
Day mountain bike ride 34.9% 33.6% 29.0%
Independent bicycle touring 35.0% 33.0% 25.8%
Sanctioned bicycle race 31.7% 32.3% 34.4%
Organized group tour 22.6% 23.2% 25.1%
Other cycling event 16.4% 17.6% 21.8%
Total* 318.0% 323.8% 344.1%
Other Activities Besides Bicycling (during the year) Total Overnight Day
Hiking 82.7% 82.8% 82.9%
Exploring the town 75.3% 74.5% 71.8%
Dining Out 71.1% 71.1% 71.0%
Visiting a farmers market 60.8% 62.1% 66.8%
Visiting microbrewery 59.7% 58.2% 53.0%
Visiting wineries 48.0% 47.9% 47.6%
Sightseeing by car 47.7% 45.9% 39.8%
Backpacking 37.1% 37.9% 40.8%
Wildlife watching 37.7% 35.6% 28.4%
Cross-country skiing 31.6% 30.8% 28.4%
Snowboarding/downhill skiing 27.0% 27.3% 28.1%
Flatwater kayaking 25.4% 24.5% 21.2%
Fishing/Crabbing 24.0% 23.1% 19.8%
Visiting a family 20.8% 22.5% 28.7%
Trail running 18.2% 18.6% 20.0%
Backcountry skiing 13.5% 13.3% 12.6%
Golfing 12.3% 12.8% 14.6%
Whitewater kayaking 6.8% 7.0% 7.8%
Other 20.3% 20.4% 20.6%
Total* 720.1% 716.4% 703.9%
Page B-2 Dean Runyan Associates

Table B-1. Oregon Bicycle-Related Travel Characteristics by Type of Trip, 2012
All Reasons for a Trip (n=3,270) (continued)
How did you learn about bicycling? Total Overnight Day
Internet search 83.2% 83.5% 84.8%
From friend/relative who lives in Oregon 40.9% 40.9% 40.6%
Other Cycling website 32.6% 33.0% 34.5%
Cycling Magazine Article 24.2% 23.1% 18.4%
TravelOregon.com 21.8% 21.2% 18.7%
RideOregonRide.com 19.6% 19.2% 17.4%
Social Media website 17.7% 18.0% 19.0%
Other Magazine/Newspaper Article 10.9% 11.5% 13.9%
From friend/relative who visited Oregon 13.3% 11.3% 2.9%
Travel Brochures/Guides 11.8% 10.9% 6.8%
Advertisement/Commercial 2.0% 1.8% 1.0%
Banner advertising 1.5% 1.6% 1.9%
Television Program 1.4% 1.5% 1.9%
Travel Agent 0.5% 0.4% 0.0%
Other Sources 14.7% 14.5% 13.5%
Total* 296.1% 292.2% 275.5%
*Detail may total more than 100% due to multiple responses.
Notes: Day trips include travel with bicycle activity 50 miles or more from home (one way).
Source: Dean Runyan Associates.
Dean Runyan Associates Page B-3
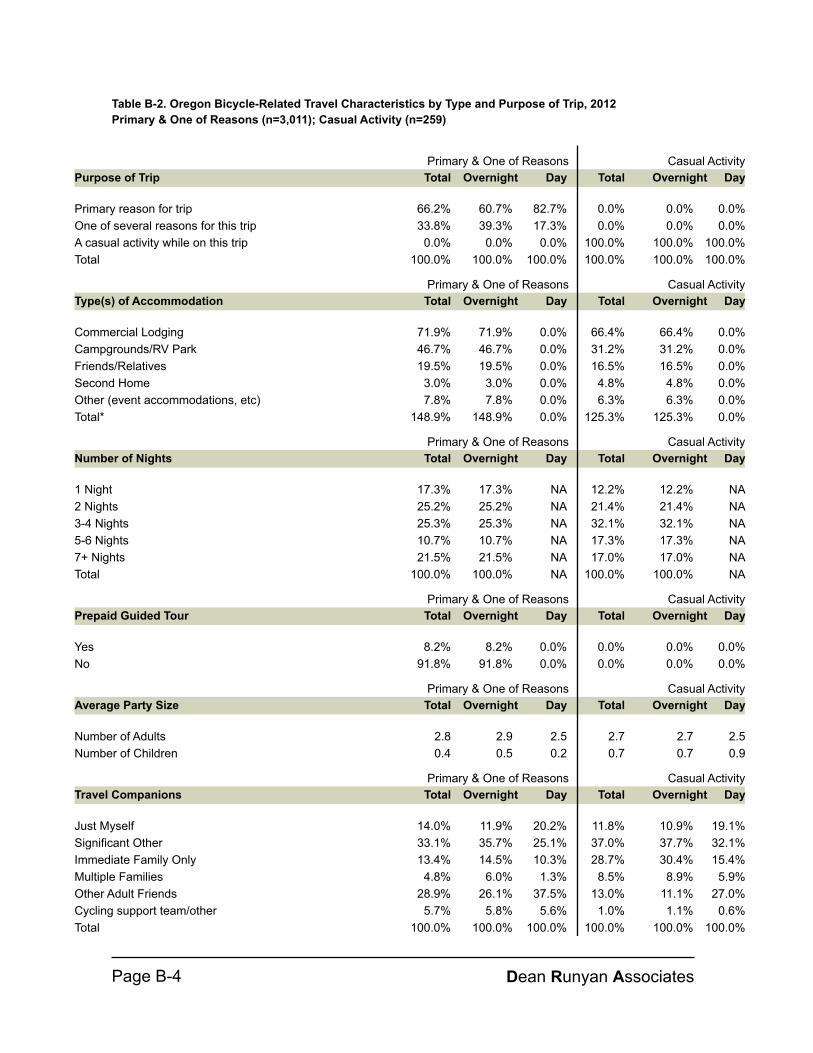
Table B-2. Oregon Bicycle-Related Travel Characteristics by Type and Purpose of Trip, 2012
Primary & One of Reasons (n=3,011); Casual Activity (n=259)
Purpose of Trip Total Overnight Day Total Overnight Day
Casual ActivityPrimary & One of Reasons
Primary reason for trip 60.7% 66.2% 82.7% 0.0% 0.0% 0.0%
One of several reasons for this trip 39.3% 33.8% 17.3% 0.0% 0.0% 0.0%
A casual activity while on this trip 0.0% 0.0% 0.0% 100.0% 100.0% 100.0%
Total 100.0% 100.0% 100.0% 100.0% 100.0% 100.0%
Type(s) of Accommodation Total Overnight Day Total Overnight Day
Casual ActivityPrimary & One of Reasons
Commercial Lodging 71.9% 71.9% 0.0% 66.4% 66.4% 0.0%
Campgrounds/RV Park 46.7% 46.7% 0.0% 31.2% 31.2% 0.0%
Friends/Relatives 19.5% 19.5% 0.0% 16.5% 16.5% 0.0%
Second Home 3.0% 3.0% 0.0% 4.8% 4.8% 0.0%
Other (event accommodations, etc) 7.8% 7.8% 0.0% 6.3% 6.3% 0.0%
Total* 148.9% 148.9% 0.0% 125.3% 125.3% 0.0%
Number of Nights Total Overnight Day Total Overnight Day
Casual ActivityPrimary & One of Reasons
1 Night 17.3% 17.3% NA 12.2% 12.2% NA
2 Nights 25.2% 25.2% NA 21.4% 21.4% NA
3-4 Nights 25.3% 25.3% NA 32.1% 32.1% NA
5-6 Nights 10.7% 10.7% NA 17.3% 17.3% NA
7+ Nights 21.5% 21.5% NA 17.0% 17.0% NA
Total 100.0% 100.0% NA 100.0% 100.0% NA
Prepaid Guided Tour Total Overnight Day Total Overnight Day
Casual ActivityPrimary & One of Reasons
Yes 8.2% 8.2% 0.0% 0.0% 0.0% 0.0%
No 91.8% 91.8% 0.0% 0.0% 0.0% 0.0%
Average Party Size Total Overnight Day Total Overnight Day
Casual ActivityPrimary & One of Reasons
Number of Adults 2.9 2.8 2.5 2.7 2.7 2.5
Number of Children 0.5 0.4 0.2 0.7 0.7 0.9
Travel Companions Total Overnight Day Total Overnight Day
Casual ActivityPrimary & One of Reasons
Just Myself 11.9% 14.0% 20.2% 11.8% 10.9% 19.1%
Significant Other 35.7% 33.1% 25.1% 37.0% 37.7% 32.1%
Immediate Family Only 14.5% 13.4% 10.3% 28.7% 30.4% 15.4%
Multiple Families 6.0% 4.8% 1.3% 8.5% 8.9% 5.9%
Other Adult Friends 26.1% 28.9% 37.5% 13.0% 11.1% 27.0%
Cycling support team/other 5.8% 5.7% 5.6% 1.0% 1.1% 0.6%
Total 100.0% 100.0% 100.0% 100.0% 100.0% 100.0%
Page B-4 Dean Runyan Associates
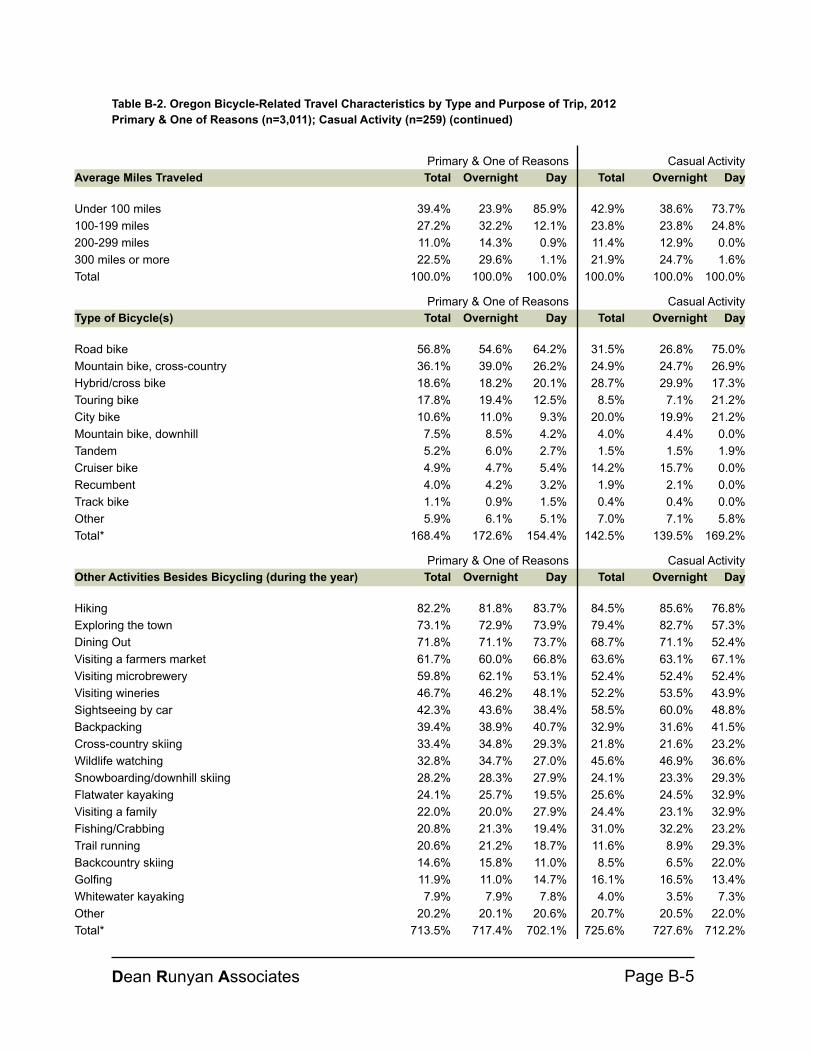
Table B-2. Oregon Bicycle-Related Travel Characteristics by Type and Purpose of Trip, 2012
Primary & One of Reasons (n=3,011); Casual Activity (n=259) (continued)
Average Miles Traveled Total Overnight Day Total Overnight Day
Casual ActivityPrimary & One of Reasons
Under 100 miles 23.9% 39.4% 85.9% 42.9% 38.6% 73.7%
100-199 miles 32.2% 27.2% 12.1% 23.8% 23.8% 24.8%
200-299 miles 14.3% 11.0% 0.9% 11.4% 12.9% 0.0%
300 miles or more 29.6% 22.5% 1.1% 21.9% 24.7% 1.6%
Total 100.0% 100.0% 100.0% 100.0% 100.0% 100.0%
Type of Bicycle(s) Total Overnight Day Total Overnight Day
Casual ActivityPrimary & One of Reasons
Road bike 54.6% 56.8% 64.2% 31.5% 26.8% 75.0%
Mountain bike, cross-country 39.0% 36.1% 26.2% 24.9% 24.7% 26.9%
Hybrid/cross bike 18.2% 18.6% 20.1% 28.7% 29.9% 17.3%
Touring bike 19.4% 17.8% 12.5% 8.5% 7.1% 21.2%
City bike 11.0% 10.6% 9.3% 20.0% 19.9% 21.2%
Mountain bike, downhill 8.5% 7.5% 4.2% 4.0% 4.4% 0.0%
Tandem 6.0% 5.2% 2.7% 1.5% 1.5% 1.9%
Cruiser bike 4.7% 4.9% 5.4% 14.2% 15.7% 0.0%
Recumbent 4.2% 4.0% 3.2% 1.9% 2.1% 0.0%
Track bike 0.9% 1.1% 1.5% 0.4% 0.4% 0.0%
Other 6.1% 5.9% 5.1% 7.0% 7.1% 5.8%
Total* 172.6% 168.4% 154.4% 142.5% 139.5% 169.2%
Other Activities Besides Bicycling (during the year) Total Overnight Day Total Overnight Day
Casual ActivityPrimary & One of Reasons
Hiking 81.8% 82.2% 83.7% 84.5% 85.6% 76.8%
Exploring the town 72.9% 73.1% 73.9% 79.4% 82.7% 57.3%
Dining Out 71.1% 71.8% 73.7% 68.7% 71.1% 52.4%
Visiting a farmers market 60.0% 61.7% 66.8% 63.6% 63.1% 67.1%
Visiting microbrewery 62.1% 59.8% 53.1% 52.4% 52.4% 52.4%
Visiting wineries 46.2% 46.7% 48.1% 52.2% 53.5% 43.9%
Sightseeing by car 43.6% 42.3% 38.4% 58.5% 60.0% 48.8%
Backpacking 38.9% 39.4% 40.7% 32.9% 31.6% 41.5%
Cross-country skiing 34.8% 33.4% 29.3% 21.8% 21.6% 23.2%
Wildlife watching 34.7% 32.8% 27.0% 45.6% 46.9% 36.6%
Snowboarding/downhill skiing 28.3% 28.2% 27.9% 24.1% 23.3% 29.3%
Flatwater kayaking 25.7% 24.1% 19.5% 25.6% 24.5% 32.9%
Visiting a family 20.0% 22.0% 27.9% 24.4% 23.1% 32.9%
Fishing/Crabbing 21.3% 20.8% 19.4% 31.0% 32.2% 23.2%
Trail running 21.2% 20.6% 18.7% 11.6% 8.9% 29.3%
Backcountry skiing 15.8% 14.6% 11.0% 8.5% 6.5% 22.0%
Golfing 11.0% 11.9% 14.7% 16.1% 16.5% 13.4%
Whitewater kayaking 7.9% 7.9% 7.8% 4.0% 3.5% 7.3%
Other 20.1% 20.2% 20.6% 20.7% 20.5% 22.0%
Total* 717.4% 713.5% 702.1% 725.6% 727.6% 712.2%
Dean Runyan Associates Page B-5
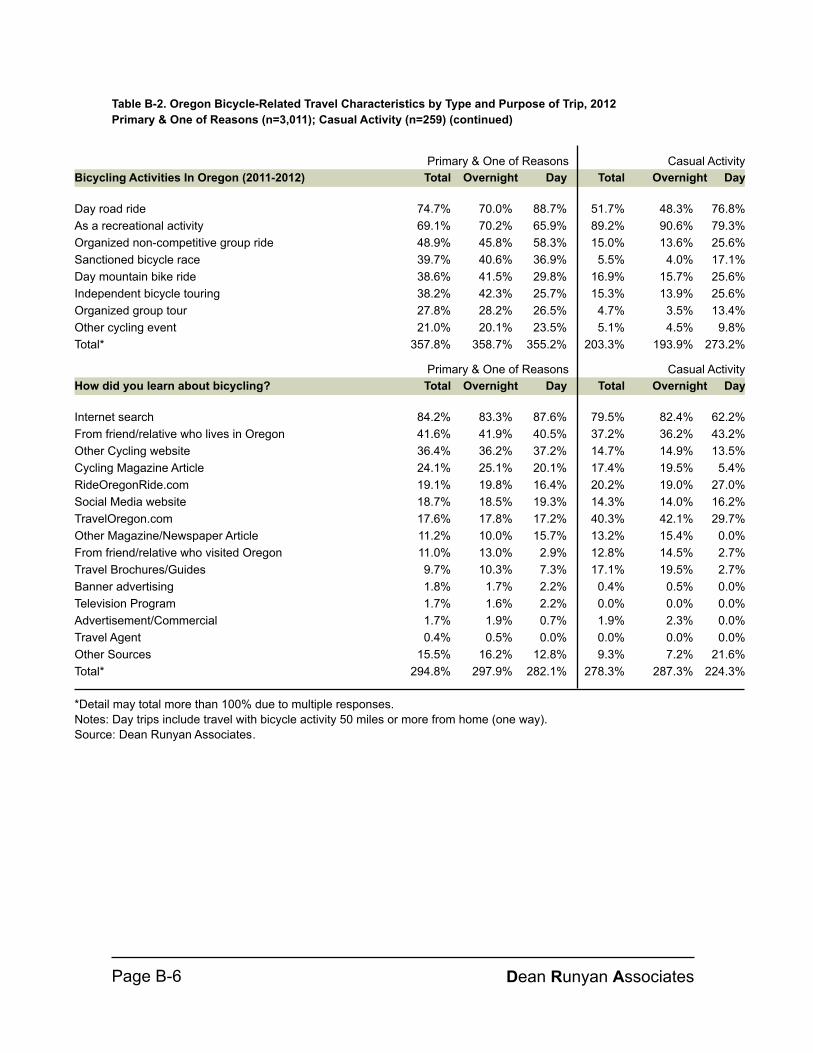
Table B-2. Oregon Bicycle-Related Travel Characteristics by Type and Purpose of Trip, 2012
Primary & One of Reasons (n=3,011); Casual Activity (n=259) (continued)
Bicycling Activities In Oregon (2011-2012) Total Overnight Day Total Overnight Day
Casual ActivityPrimary & One of Reasons
Day road ride 70.0% 74.7% 88.7% 51.7% 48.3% 76.8%
As a recreational activity 70.2% 69.1% 65.9% 89.2% 90.6% 79.3%
Organized non-competitive group ride 45.8% 48.9% 58.3% 15.0% 13.6% 25.6%
Sanctioned bicycle race 40.6% 39.7% 36.9% 5.5% 4.0% 17.1%
Day mountain bike ride 41.5% 38.6% 29.8% 16.9% 15.7% 25.6%
Independent bicycle touring 42.3% 38.2% 25.7% 15.3% 13.9% 25.6%
Organized group tour 28.2% 27.8% 26.5% 4.7% 3.5% 13.4%
Other cycling event 20.1% 21.0% 23.5% 5.1% 4.5% 9.8%
Total* 358.7% 357.8% 355.2% 203.3% 193.9% 273.2%
How did you learn about bicycling? Total Overnight Day Total Overnight Day
Casual ActivityPrimary & One of Reasons
Internet search 83.3% 84.2% 87.6% 79.5% 82.4% 62.2%
From friend/relative who lives in Oregon 41.9% 41.6% 40.5% 37.2% 36.2% 43.2%
Other Cycling website 36.2% 36.4% 37.2% 14.7% 14.9% 13.5%
Cycling Magazine Article 25.1% 24.1% 20.1% 17.4% 19.5% 5.4%
RideOregonRide.com 19.8% 19.1% 16.4% 20.2% 19.0% 27.0%
Social Media website 18.5% 18.7% 19.3% 14.3% 14.0% 16.2%
TravelOregon.com 17.8% 17.6% 17.2% 40.3% 42.1% 29.7%
Other Magazine/Newspaper Article 10.0% 11.2% 15.7% 13.2% 15.4% 0.0%
From friend/relative who visited Oregon 13.0% 11.0% 2.9% 12.8% 14.5% 2.7%
Travel Brochures/Guides 10.3% 9.7% 7.3% 17.1% 19.5% 2.7%
Banner advertising 1.7% 1.8% 2.2% 0.4% 0.5% 0.0%
Television Program 1.6% 1.7% 2.2% 0.0% 0.0% 0.0%
Advertisement/Commercial 1.9% 1.7% 0.7% 1.9% 2.3% 0.0%
Travel Agent 0.5% 0.4% 0.0% 0.0% 0.0% 0.0%
Other Sources 16.2% 15.5% 12.8% 9.3% 7.2% 21.6%
Total* 297.9% 294.8% 282.1% 278.3% 287.3% 224.3%
*Detail may total more than 100% due to multiple responses.
Notes: Day trips include travel with bicycle activity 50 miles or more from home (one way).
Source: Dean Runyan Associates.
Page B-6 Dean Runyan Associates

Table B-3. Oregon Bicycle-Related Travel Characteristics for Prepaid Guided Tours, 2012
(n=249)
Number of Tour Days All Weekend Weeklong
0.0% 2.3%1 0.0%
100.0% 31.1%2-3 0.0%
0.0% 5.3%4-5 0.0%
0.0% 50.0%6-7 100.0%
0.0% 11.4%8+ 0.0%
100.0% 100.0%Total 100.0%
Purpose of Trip All Weekend Weeklong
78.0% 88.8%Primary reason for trip 89.4%
22.0% 11.2%One of several reasons for this trip 10.6%
100.0% 100.0%Total 100.0%
Type of Bicycle Activity while on Prepaid Guided Tour All Weekend Weeklong
17.1% 32.9%Organized group tour 24.2%
14.6% 30.9%Organized non-competitive group ride 42.4%
34.1% 15.8%As a recreational activity 15.2%
19.5% 13.2%Day road ride 15.2%
14.6% 7.2%All Other Types 3.0%
100.0% 100.0%Total 100.0%
Type(s) of Accommodation All Weekend Weeklong
41.5% 58.6%Commercial Lodging 56.1%
48.8% 69.7%Campgrounds/RV Park 72.7%
9.8% 11.2%Friends/Relatives 12.1%
0.0% 1.3%Second Home 0.0%
17.1% 25.0%Other (event accommodations, etc) 34.8%
117.1% 165.8%Total* 175.8%
What did Prepaid Guided Tour include? All Weekend Weeklong
24.4% 38.6%Lodging (of any type) 45.5%
56.1% 53.8%Campground Fees 53.0%
58.5% 64.4%Catered meals/indoor dining 72.7%
61.0% 59.8%Tour guide/bike mechanic 62.1%
26.8% 14.4%Bicycle transportation 6.1%
4.9% 12.1%Other Expenses 18.2%
231.7% 243.2%Total* 257.6%
Type of Bicycle(s) All Weekend Weeklong
42.9% 72.1%Road bike 82.8%
57.1% 32.0%Mountain Bike 27.6%
14.3% 15.6%Touring Bike 12.1%
33.3% 22.1%All Other Types 20.7%
147.6% 141.8%Total* 143.1%
Dean Runyan Associates Page B-7

Table B-3. Oregon Bicycle-Related Travel Characteristics for Prepaid Guided Tours, 2012
(n=249) (continued)
All Bicycling Activities In Oregon (2011-2012) All Weekend Weeklong
70.7% 72.4%Organized non-competitive group ride 81.8%
46.3% 65.1%Organized group tour 66.7%
73.2% 64.5%Day road ride 68.2%
58.5% 47.4%As a recreational activity 45.5%
31.7% 34.2%Independent bicycle touring 39.4%
26.8% 27.0%Day mountain bike ride 27.3%
39.0% 19.1%Other cycling event 13.6%
26.8% 17.8%Sanctioned bicycle race 10.6%
373.2% 347.4%Total* 353.0%
How did you learn about bicycling? All Weekend Weeklong
81.3% 73.9%Internet search 67.4%
46.9% 44.3%From friend/relative who lives in Oregon 44.2%
46.9% 43.2%Other Cycling website 41.9%
28.1% 40.9%Cycling Magazine Article 51.2%
53.1% 35.2%RideOregonRide.com 27.9%
31.3% 21.6%TravelOregon.com 16.3%
15.6% 20.5%Other Magazine/Newspaper Article 25.6%
15.6% 14.8%Travel Brochures/Guides 16.3%
15.6% 12.5%Advertisement/Commercial 14.0%
3.1% 11.4%Fron friend/relative who visited Oregon 14.0%
3.1% 9.1%Social Media website 11.6%
15.6% 8.0%Banner advertising 4.7%
0.0% 1.1%Television Program 2.3%
3.1% 1.1%Travel Agent 0.0%
6.3% 10.2%Other Sources 11.6%
365.6% 347.7%Total* 348.8%
*Detail may total more than 100% due to multiple responses.
Note: All respondents who traveled on an overnight trip as part of a guided tour which
included prepaid travel expenses.
Source: Dean Runyan Associates, Inc.
Page B-8 Dean Runyan Associates

APPENDIX C
Demographics

This page intentionally blank

Table C-1. Demographic Characteristics of Oregon Bicycle-Related Travelers, 2012
All Reasons for a Trip (n=3,270)
Gender Total Overnight Day
Male 64.4% 64.8% 66.1%
Female 35.6% 35.2% 33.9%
Total 100.0% 100.0% 100.0%
Age Total Overnight Day
21 or younger 0.5% 0.5% 0.5%
21-24 1.5% 1.7% 2.4%
25-34 13.8% 14.0% 14.4%
35-44 19.7% 21.3% 26.8%
45-54 25.0% 24.8% 24.1%
55-64 27.3% 25.8% 20.5%
65-74 11.8% 11.4% 10.0%
75+ 0.3% 0.5% 1.3%
Total 100.0% 100.0% 100.0%
Education Total Overnight Day
Some high school or high school diploma 2.1% 2.1% 2.1%
Some college or two-year degree 21.3% 20.4% 17.0%
Bachelors degree 38.0% 39.7% 45.8%
Graduate degree 38.5% 37.8% 35.2%
Total 100.0% 100.0% 100.0%
Household Income Total Overnight Day
Under $25,000 6.0% 6.8% 9.4%
$25,000 - $49,999 14.3% 14.5% 15.5%
$50,000 - $74,999 19.6% 20.5% 23.4%
$75,000 - $99,999 22.4% 21.7% 19.0%
$100,000 - $199,999 28.4% 28.0% 26.4%
$200,000 or more 9.3% 8.6% 6.3%
Total 100.0% 100.0% 100.0%
Origin of Residence Total Overnight Day
Oregon 66.9% 72.9% 93.1%
Washington 9.4% 8.4% 5.0%
California 8.0% 6.3% 0.5%
Idaho 1.4% 1.1% 0.2%
Other US States 14.2% 11.3% 1.3%
Total 100.0% 100.0% 100.0%
*Detail may total more than 100% due to multiple responses.
Notes: Day trips include travel with bicycle activity 50 miles or more from home
(one way).
Source: Dean Runyan Associates, Inc.
Dean Runyan Associates Page C-1

Table C-2. Demographic Characteristics of Oregon Bicycle-Related Travelers by Trip Purpose, 2012
Primary & One of Reasons (n=3,011); Casual Activity (n=259)
Gender Total Overnight Day Total Overnight Day
Casual ActivityPrimary & One of Reasons
Male 69.5% 68.7% 66.4% 50.8% 48.9% 63.8%
Female 30.5% 31.3% 33.6% 49.2% 51.1% 36.3%
Total 100.0% 100.0% 100.0% 100.0% 100.0% 100.0%
Age Total Overnight Day Total Overnight Day
Casual ActivityPrimary & One of Reasons
21 or younger 0.7% 0.6% 0.5% 0.0% 0.0% 0.0%
21-24 1.5% 1.6% 2.0% 2.1% 1.7% 5.0%
25-34 13.6% 14.1% 15.7% 13.2% 14.2% 6.3%
35-44 21.6% 22.7% 26.2% 16.3% 14.0% 31.3%
45-54 22.8% 23.0% 23.5% 31.1% 31.6% 27.5%
55-64 27.4% 25.7% 20.6% 26.3% 27.3% 20.0%
65-74 12.0% 11.5% 10.0% 11.1% 11.2% 10.0%
75+ 0.4% 0.7% 1.5% 0.0% 0.0% 0.0%
Total 100.0% 100.0% 100.0% 100.0% 100.0% 100.0%
Education Total Overnight Day Total Overnight Day
Casual ActivityPrimary & One of Reasons
Some high school or high school diploma 1.6% 1.7% 2.2% 3.5% 3.8% 1.3%
Some college or two-year degree 19.2% 18.8% 17.6% 25.8% 27.7% 12.5%
Bachelors degree 39.5% 40.7% 44.4% 36.1% 33.4% 55.0%
Graduate degree 39.7% 38.7% 35.8% 34.6% 35.0% 31.3%
Total 100.0% 100.0% 100.0% 100.0% 100.0% 100.0%
Household Income Total Overnight Day Total Overnight Day
Casual ActivityPrimary & One of Reasons
Under $25,000 5.2% 5.9% 8.0% 9.7% 8.5% 18.1%
$25,000 - $49,999 13.9% 14.4% 16.2% 15.0% 15.4% 12.5%
$50,000 - $74,999 18.9% 19.9% 23.0% 22.2% 21.7% 26.4%
$75,000 - $99,999 22.9% 22.1% 19.8% 20.0% 20.9% 13.9%
$100,000 - $199,999 29.1% 28.4% 26.1% 26.4% 26.4% 26.4%
$200,000 or more 10.0% 9.3% 7.0% 6.7% 7.3% 2.8%
Total 100.0% 100.0% 100.0% 100.0% 100.0% 100.0%
Origin of Residence Total Overnight Day Total Overnight Day
Casual ActivityPrimary & One of Reasons
Oregon 69.1% 75.2% 92.7% 64.6% 60.0% 97.3%
Washington 8.9% 8.1% 5.6% 9.6% 11.0% 0.0%
California 7.9% 5.9% 0.2% 7.4% 8.3% 1.4%
Idaho 1.5% 1.2% 0.2% 0.8% 1.0% 0.0%
Other US States 12.6% 9.6% 1.3% 17.5% 19.8% 1.4%
Total 100.0% 100.0% 100.0% 100.0% 100.0% 100.0%
*Detail may total more than 100% due to multiple responses.
Source: Dean Runyan Associates, Inc.
Page C-2 Dean Runyan Associates

Table C-3. Demographic Characteristics of Oregon Bicycle-Related Travelers:
ORGANIZED NON-COMPETITIVE GROUP RIDES, 2012 (n=496)
Gender Total Overnight Day
Male 67.5% 68.8% 64.2%
Female 32.5% 31.3% 35.8%
Total 100.0% 100.0% 100.0%
Age Total Overnight Day
20 or younger 0.0% 0.0% 0.0%
21-24 0.0% 0.0% 0.0%
25-34 8.8% 7.7% 11.8%
35-44 15.5% 15.4% 15.7%
45-54 28.9% 28.0% 31.4%
55-64 33.0% 34.3% 29.4%
65-74 13.4% 14.0% 11.8%
75+ 0.5% 0.7% 0.0%
Total 100.0% 100.0% 100.0%
Education Total Overnight Day
Some high school or high school diploma 1.0% 1.4% 0.0%
Some college or two-year degree 15.2% 17.2% 9.4%
Bachelors degree 43.4% 43.4% 43.4%
Graduate degree 40.4% 37.9% 47.2%
Total 100.0% 100.0% 100.0%
Household Income Total Overnight Day
Under $25,000 2.8% 2.3% 4.2%
$25,000 - $49,999 8.9% 9.8% 6.3%
$50,000 - $74,999 17.2% 16.7% 18.8%
$75,000 - $99,999 20.0% 18.9% 22.9%
$100,000 - $199,999 37.2% 37.9% 35.4%
$200,000 or more 13.9% 14.4% 12.5%
Total 100.0% 100.0% 100.0%
Origin of Residence Total Overnight Day
Oregon 79.4% 73.7% 94.2%
Washington 9.5% 10.9% 5.8%
California 6.9% 9.5% 0.0%
Idaho 1.6% 2.2% 0.0%
Other US States 2.6% 3.6% 0.0%
Total 100.0% 100.0% 100.0%
Notes: Demographic characteristics are based on overnight and day trips where bicycling
activity was primary or one of the reasons for a trip. Day trips include travel with bicycle activity
50 miles or more from home (one way).
Source: Dean Runyan Associates.
Dean Runyan Associates Page C-3

Table C-4. Demographic Characteristics of Oregon Bicycle-Related Travelers:
SANCTIONED BICYCLE RACES, 2012 (n=449)
Gender Total Overnight Day
Male 79.6% 77.4% 89.2%
Female 20.4% 22.6% 10.8%
Total 100.0% 100.0% 100.0%
Age Total Overnight Day
20 or younger 1.5% 1.8% 2.6%
21-24 2.5% 2.4% 2.6%
25-34 23.2% 24.2% 18.4%
35-44 41.4% 42.4% 36.8%
45-54 21.2% 19.4% 28.9%
55-64 8.9% 8.5% 10.5%
65-74 1.0% 1.2% 0.0%
75+ 0.0% 0.0% 0.0%
Total 100.0% 100.0% 100.0%
Education Total Overnight Day
Some high school or high school diploma 3.9% 3.6% 5.3%
Some college or two-year degree 15.3% 14.5% 18.4%
Bachelors degree 47.8% 46.7% 52.6%
Graduate degree 33.0% 35.2% 23.7%
Total 100.0% 100.0% 100.0%
Household Income Total Overnight Day
Under $25,000 4.6% 4.3% 5.7%
$25,000 - $49,999 10.7% 9.9% 14.3%
$50,000 - $74,999 19.4% 18.6% 22.9%
$75,000 - $99,999 21.9% 22.4% 20.0%
$100,000 - $199,999 35.2% 35.4% 34.3%
$200,000 or more 8.2% 9.3% 2.9%
Total 100.0% 100.0% 100.0%
Origin of Residence Total Overnight Day
Oregon 88.9% 87.7% 94.6%
Washington 6.5% 6.8% 5.4%
California 3.0% 3.7% 0.0%
Idaho 1.0% 1.2% 0.0%
Other US States 0.5% 0.6% 0.0%
Total 100.0% 100.0% 100.0%
Notes: Demographic characteristics are based on overnight and day trips where bicycling
activity was primary or one of the reasons for a trip. Day trips include travel with bicycle activity
50 miles or more from home (one way).
Source: Dean Runyan Associates.
Page C-4 Dean Runyan Associates

Table C-5. Demographic Characteristics of Oregon Bicycle-Related Travelers:
ORGANIZED GROUP TOURS, 2012 (n=255)
Gender Total Overnight Day
Male 69.2% 70.0% 57.1%
Female 30.8% 30.0% 42.9%
Total 100.0% 100.0% 100.0%
Age Total Overnight Day
20 or younger 0.8% 0.9% 0.0%
21-24 1.7% 1.8% 0.0%
25-34 7.5% 7.1% 12.5%
35-44 20.0% 20.5% 12.5%
45-54 19.2% 19.6% 12.5%
55-64 34.2% 34.8% 25.0%
65-74 15.0% 14.3% 25.0%
75+ 1.7% 0.9% 12.5%
Total 100.0% 100.0% 100.0%
Education Total Overnight Day
Some high school or high school diploma 3.4% 3.7% 0.0%
Some college or two-year degree 14.5% 14.7% 12.5%
Bachelors degree 40.2% 41.3% 25.0%
Graduate degree 41.9% 40.4% 62.5%
Total 100.0% 100.0% 100.0%
Household Income Total Overnight Day
Under $25,000 4.5% 4.8% 0.0%
$25,000 - $49,999 11.6% 10.6% 25.0%
$50,000 - $74,999 19.6% 19.2% 25.0%
$75,000 - $99,999 20.5% 21.2% 12.5%
$100,000 - $199,999 34.8% 35.6% 25.0%
$200,000 or more 8.9% 8.7% 12.5%
Total 100.0% 100.0% 100.0%
Origin of Residence Total Overnight Day
Oregon 58.0% 55.9% 87.5%
Washington 8.4% 8.1% 12.5%
California 14.3% 15.3% 0.0%
Idaho 1.7% 1.8% 0.0%
Other US States 17.6% 18.9% 0.0%
Total 100.0% 100.0% 100.0%
Notes: Demographic characteristics are based on overnight and day trips where bicycling
activity was primary or one of the reasons for a trip. Day trips include travel with bicycle activity
50 miles or more from home (one way).
Source: Dean Runyan Associates.
Dean Runyan Associates Page C-5
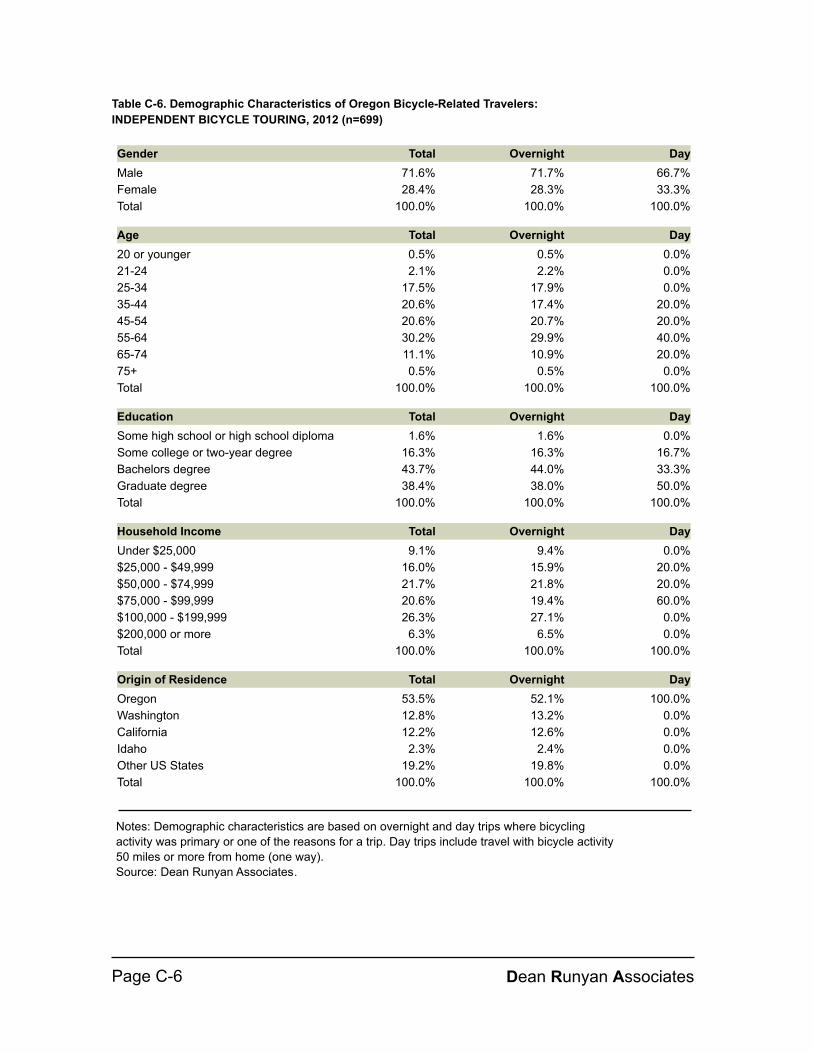
Table C-6. Demographic Characteristics of Oregon Bicycle-Related Travelers:
INDEPENDENT BICYCLE TOURING, 2012 (n=699)
Gender Total Overnight Day
Male 71.6% 71.7% 66.7%
Female 28.4% 28.3% 33.3%
Total 100.0% 100.0% 100.0%
Age Total Overnight Day
20 or younger 0.5% 0.5% 0.0%
21-24 2.1% 2.2% 0.0%
25-34 17.5% 17.9% 0.0%
35-44 20.6% 17.4% 20.0%
45-54 20.6% 20.7% 20.0%
55-64 30.2% 29.9% 40.0%
65-74 11.1% 10.9% 20.0%
75+ 0.5% 0.5% 0.0%
Total 100.0% 100.0% 100.0%
Education Total Overnight Day
Some high school or high school diploma 1.6% 1.6% 0.0%
Some college or two-year degree 16.3% 16.3% 16.7%
Bachelors degree 43.7% 44.0% 33.3%
Graduate degree 38.4% 38.0% 50.0%
Total 100.0% 100.0% 100.0%
Household Income Total Overnight Day
Under $25,000 9.1% 9.4% 0.0%
$25,000 - $49,999 16.0% 15.9% 20.0%
$50,000 - $74,999 21.7% 21.8% 20.0%
$75,000 - $99,999 20.6% 19.4% 60.0%
$100,000 - $199,999 26.3% 27.1% 0.0%
$200,000 or more 6.3% 6.5% 0.0%
Total 100.0% 100.0% 100.0%
Origin of Residence Total Overnight Day
Oregon 53.5% 52.1% 100.0%
Washington 12.8% 13.2% 0.0%
California 12.2% 12.6% 0.0%
Idaho 2.3% 2.4% 0.0%
Other US States 19.2% 19.8% 0.0%
Total 100.0% 100.0% 100.0%
Notes: Demographic characteristics are based on overnight and day trips where bicycling
activity was primary or one of the reasons for a trip. Day trips include travel with bicycle activity
50 miles or more from home (one way).
Source: Dean Runyan Associates.
Page C-6 Dean Runyan Associates

Table C-7. Demographic Characteristics of Oregon Bicycle-Related Travelers:
DAY ROAD RIDES, 2012 (n=500)
Gender Total Overnight Day
Male 64.6% 64.5% 64.6%
Female 35.4% 35.5% 35.4%
Total 100.0% 100.0% 100.0%
Age Total Overnight Day
20 or younger 0.4% 0.3% 0.4%
21-24 1.8% 1.3% 2.3%
25-34 13.2% 12.3% 14.2%
35-44 18.4% 17.5% 19.5%
45-54 22.8% 23.0% 22.6%
55-64 29.3% 29.8% 28.7%
65-74 13.0% 14.6% 11.1%
75+ 1.2% 1.3% 1.1%
Total 100.0% 100.0% 100.0%
Education Total Overnight Day
Some high school or high school diploma 1.9% 1.0% 3.1%
Some college or two-year degree 17.4% 21.4% 12.6%
Bachelors degree 43.3% 40.1% 47.1%
Graduate degree 37.4% 37.5% 37.2%
Total 100.0% 100.0% 100.0%
Household Income Total Overnight Day
Under $25,000 7.2% 6.4% 8.3%
$25,000 - $49,999 17.2% 15.2% 19.6%
$50,000 - $74,999 20.9% 21.6% 20.0%
$75,000 - $99,999 19.1% 19.9% 18.3%
$100,000 - $199,999 27.7% 27.3% 28.3%
$200,000 or more 7.8% 9.6% 5.7%
Total 100.0% 100.0% 100.0%
Origin of Residence Total Overnight Day
Oregon 85.5% 76.6% 95.8%
Washington 7.3% 10.9% 3.1%
California 2.5% 4.3% 0.4%
Idaho 0.4% 0.3% 0.4%
Other US States 4.4% 7.9% 0.4%
Total 100.0% 100.0% 100.0%
Notes: Demographic characteristics are based on overnight and day trips where bicycling
activity was primary or one of the reasons for a trip. Day trips include travel with bicycle activity
50 miles or more from home (one way).
Source: Dean Runyan Associates.
Dean Runyan Associates Page C-7

Table C-8. Demographic Characteristics of Oregon Bicycle-Related Travelers:
DAY MOUNTAIN BIKE RIDES, 2012 (n=389)
Gender Total Overnight Day
Male 77.6% 76.9% 80.0%
Female 22.4% 23.1% 20.0%
Total 100.0% 100.0% 100.0%
Age Total Overnight Day
20 or younger 0.0% 0.0% 0.0%
21-24 2.5% 0.8% 7.5%
25-34 18.0% 19.8% 12.5%
35-44 37.9% 37.2% 40.0%
45-54 30.4% 32.2% 25.0%
55-64 9.3% 8.3% 12.5%
65-74 1.9% 1.7% 2.5%
75+ 0.0% 0.0% 0.0%
Total 100.0% 100.0% 100.0%
Education Total Overnight Day
Some high school or high school diploma 3.7% 3.2% 5.0%
Some college or two-year degree 17.7% 16.9% 20.0%
Bachelors degree 45.1% 49.2% 32.5%
Graduate degree 33.5% 30.6% 42.5%
Total 100.0% 100.0% 100.0%
Household Income Total Overnight Day
Under $25,000 6.4% 6.7% 5.4%
$25,000 - $49,999 14.1% 13.4% 16.2%
$50,000 - $74,999 16.0% 15.1% 18.9%
$75,000 - $99,999 18.6% 19.3% 16.2%
$100,000 - $199,999 35.3% 36.1% 32.4%
$200,000 or more 9.6% 9.2% 10.8%
Total 100.0% 100.0% 100.0%
Origin of Residence Total Overnight Day
Oregon 76.5% 70.2% 94.9%
Washington 8.5% 9.6% 5.1%
California 12.4% 16.7% 0.0%
Idaho 1.3% 1.8% 0.0%
Other US States 1.3% 1.8% 0.0%
Total 100.0% 100.0% 100.0%
Notes: Demographic characteristics are based on overnight and day trips where bicycling
activity was primary or one of the reasons for a trip. Day trips include travel with bicycle activity
50 miles or more from home (one way).
Source: Dean Runyan Associates.
Page C-8 Dean Runyan Associates

Table C-9. Demographic Characteristics of Oregon Bicycle-Related Travelers:
AS A RECREATIONAL ACTIVITY, 2012 (n=178)
Gender Total Overnight Day
Male 66.2% 67.2% 61.9%
Female 33.8% 32.8% 38.1%
Total 100.0% 100.0% 100.0%
Age Total Overnight Day
20 or younger 0.7% 0.8% 0.0%
21-24 1.4% 1.7% 0.0%
25-34 13.1% 11.3% 20.7%
35-44 21.5% 17.7% 37.9%
45-54 21.5% 21.7% 20.7%
55-64 26.8% 31.5% 7.1%
65-74 14.3% 15.3% 10.0%
75+ 0.7% 0.0% 3.6%
Total 100.0% 100.0% 100.0%
Education Total Overnight Day
Some high school or high school diploma 0.7% 0.8% 0.0%
Some college or two-year degree 23.2% 22.0% 28.6%
Bachelors degree 34.1% 32.2% 42.9%
Graduate degree 42.0% 44.9% 28.6%
Total 100.0% 100.0% 100.0%
Household Income Total Overnight Day
Under $25,000 5.0% 3.6% 10.9%
$25,000 - $49,999 15.3% 15.4% 14.7%
$50,000 - $74,999 20.5% 18.3% 29.5%
$75,000 - $99,999 27.1% 28.2% 22.5%
$100,000 - $199,999 21.9% 23.6% 14.7%
$200,000 or more 10.2% 10.9% 7.8%
Total 100.0% 100.0% 100.0%
Origin of Residence Total Overnight Day
Oregon 70.7% 66.8% 86.3%
Washington 7.5% 6.8% 10.1%
California 4.7% 5.9% 0.0%
Idaho 1.4% 1.8% 0.0%
Other US States 15.6% 18.6% 3.6%
Total 100.0% 100.0% 100.0%
Notes: Demographic characteristics are based on overnight and day trips where bicycling
activity was primary or one of the reasons for a trip. Day trips include travel with bicycle activity
50 miles or more from home (one way).
Source: Dean Runyan Associates.
Dean Runyan Associates Page C-9