The Economic Progress of African Americans in Urban Areas: A … · 2017-05-05 · The Economic...
28
FEDERAL RESERVE BANK OF ST. LOUIS REVIEW SEPTEMBER / OCTOBER 2010 353 The Economic Progress of African Americans in Urban Areas: A Tale of 14 Cities Dan A. Black, Natalia A. Kolesnikova , and Lowell J. Taylor How significant was the economic progress of African Americans in the United States between 1970 and 2000? In this paper the authors examine this issue for black men 25 to 55 years of age who live in 14 large U.S. metropolitan areas. They present evidence that significant racial dispar- ities remain in education and labor market outcomes of black and white men, and they discuss changes in industrial composition, migration, and demography that might have contributed to the stagnation of economic progress of black men between 1970 and 2000. In addition, the authors show that there was no progress in the financial well-being of black children, relative to white children, between 1970 and 2000. (JEL J15, J31, J71, R23) Federal Reserve Bank of St. Louis Review, September/October 2010, 92(5), pp. 353-79. acquisition improve? Did the economic well-being of black children improve? Most of the previous research on these topics was done on a national level. 1 Such studies, at most, “control for” the geographic region (South, Northeast, Midwest, etc.) and/or whether a person resides in an urban/rural area. This paper, how- ever, examines and compares various aspects of African-American progress in labor markets between 1970 and 2000 across large U.S. cities. Analysis on a city rather than national level addresses two issues: First, cities in the United States vary widely in their characteristics, includ- ing labor market conditions and industrial struc- ture. Second, and more importantly, the history of the black population varies among the different regions of the country. These differences warrant a separate look at each city—Memphis and Detroit, H ow significant was the economic progress of African Americans in the United States between 1970 and 2000? The common perception is that inequality between races has decreased. In 1954, the Supreme Court’s decision in the famous Brown v. Board of Education case proclaimed racial segregation of public schools unconstitu- tional. It paved the way for the Civil Rights Act of 1964, which outlawed racial segregation in schools and the workplace, among other provi- sions. By making racial discrimination illegal, the Act opened doors to better education, including higher education, and offered greater employment opportunities to African Americans. This progress is undeniable, but questions remain: Did these societal changes translate into economic changes as well? Did earnings of blacks increase relative to earnings of whites? Did labor force attachment of blacks become more secure? How much did educational attainment and skill 1 A very good overview of existing studies is presented in Altonji and Blank (1999). Dan A. Black is a professor of economics and deputy dean at the Harris School of the University of Chicago and a senior fellow at the National Opinion Research Center. Natalia Kolesnikova is an economist at the Federal Reserve Bank of St. Louis. Lowell J. Taylor is a profes- sor of economics at Carnegie Mellon University and a senior fellow at the National Opinion Research Center. The authors thank Yang Liu for invaluable research assistance. © 2010, The Federal Reserve Bank of St. Louis. The views expressed in this article are those of the author(s) and do not necessarily reflect the views of the Federal Reserve System, the Board of Governors, or the regional Federal Reserve Banks. Articles may be reprinted, reproduced, published, distributed, displayed, and transmitted in their entirety if copyright notice, author name(s), and full citation are included. Abstracts, synopses, and other derivative works may be made only with prior written permission of the Federal Reserve Bank of St. Louis.
Transcript of The Economic Progress of African Americans in Urban Areas: A … · 2017-05-05 · The Economic...

FEDERAL RESERVE BANK OF ST. LOUIS REVIEW SEPTEMBER/OCTOBER 2010 353
The Economic Progress of African Americans in Urban Areas: A Tale of 14 Cities
Dan A. Black, Natalia A. Kolesnikova, and Lowell J. Taylor
How significant was the economic progress of African Americans in the United States between1970 and 2000? In this paper the authors examine this issue for black men 25 to 55 years of agewho live in 14 large U.S. metropolitan areas. They present evidence that significant racial dispar-ities remain in education and labor market outcomes of black and white men, and they discusschanges in industrial composition, migration, and demography that might have contributed to thestagnation of economic progress of black men between 1970 and 2000. In addition, the authorsshow that there was no progress in the financial well-being of black children, relative to whitechildren, between 1970 and 2000. (JEL J15, J31, J71, R23)
Federal Reserve Bank of St. Louis Review, September/October 2010, 92(5), pp. 353-79.
acquisition improve? Did the economic well-beingof black children improve?
Most of the previous research on these topicswas done on a national level.1 Such studies, atmost, “control for” the geographic region (South,Northeast, Midwest, etc.) and/or whether a personresides in an urban/rural area. This paper, how-ever, examines and compares various aspects ofAfrican-American progress in labor marketsbetween 1970 and 2000 across large U.S. cities.Analysis on a city rather than national leveladdresses two issues: First, cities in the UnitedStates vary widely in their characteristics, includ-ing labor market conditions and industrial struc-ture. Second, and more importantly, the historyof the black population varies among the differentregions of the country. These differences warranta separate look at each city—Memphis and Detroit,
H ow significant was the economicprogress of African Americans inthe United States between 1970 and2000? The common perception is
that inequality between races has decreased. In1954, the Supreme Court’s decision in the famousBrown v. Board of Education case proclaimedracial segregation of public schools unconstitu-tional. It paved the way for the Civil Rights Actof 1964, which outlawed racial segregation inschools and the workplace, among other provi-sions. By making racial discrimination illegal, theAct opened doors to better education, includinghigher education, and offered greater employmentopportunities to African Americans.
This progress is undeniable, but questionsremain: Did these societal changes translate intoeconomic changes as well? Did earnings of blacksincrease relative to earnings of whites? Did laborforce attachment of blacks become more secure?How much did educational attainment and skill
1 A very good overview of existing studies is presented in Altonjiand Blank (1999).
Dan A. Black is a professor of economics and deputy dean at the Harris School of the University of Chicago and a senior fellow at theNational Opinion Research Center. Natalia Kolesnikova is an economist at the Federal Reserve Bank of St. Louis. Lowell J. Taylor is a profes-sor of economics at Carnegie Mellon University and a senior fellow at the National Opinion Research Center. The authors thank Yang Liu forinvaluable research assistance.
© 2010, The Federal Reserve Bank of St. Louis. The views expressed in this article are those of the author(s) and do not necessarily reflect theviews of the Federal Reserve System, the Board of Governors, or the regional Federal Reserve Banks. Articles may be reprinted, reproduced,published, distributed, displayed, and transmitted in their entirety if copyright notice, author name(s), and full citation are included. Abstracts,synopses, and other derivative works may be made only with prior written permission of the Federal Reserve Bank of St. Louis.

for instance—to distinguish between them andthus better analyze changes in individual eco-nomic conditions of blacks.
Finally, a recent study by Black et al. (2009)demonstrates that it is important to take intoconsideration geographic location when study-ing racial differences. Performing analysis on anational level masks underlying trends in locallabor markets.2 The study shows, in particular,that a failure to account for city-specific differ-ences in black-white wage gaps results in a sig-nificant (about 50 percent) overestimation ofblack-white wage-gap conversion. In many locallabor markets, especially high-productivity, high-wage markets, the black-white wage gap essen-tially stayed the same over the years. But as moreand more black men moved into high-wage cities,the national black-white wage gap has decreaseddramatically even though there was little changein each particular market. The reason for the seem-ing black-white wage convergence was not onlya change in labor markets but simply a redistri -bution of black population from low-wage to high-wage markets—something that would not beapparent if looking only at national averages.
It seems reasonable, therefore, to documenteconomic progress of African Americans in thecontext of a specific labor market and then com-pare the progress across cities. Performing suchanalysis is the goal of this paper.3
DATA DESCRIPTIONIn particular, we study African-American
progress in 14 metropolitan statistical areas(MSAs; as defined by the Census Bureau4) from1970 to 2000. In what follows, we use “MSA” and“city” interchangeably. We use 1970 through 2000
decennial U.S. Census data provided by theIntegrated Public Use Microdata Series5 (IPUMS).The 14 cities in the sample were chosen basedon having at least 700 black respondents in theIPUMS 1970 Census data. They are the Atlanta,Baltimore, Chicago, Cleveland, Detroit, Houston,Los Angeles, Memphis, New Orleans, New York,Philadelphia, St. Louis, San Francisco, andWashington, D.C., MSAs.6,7
In this paper we restrict the analysis to blackand non-Hispanic white men of prime workingage—25 to 55 years old.8 For each respondent inthe sample, the data provide a wealth of infor-mation, including age, educational attainment,employment status, income, industry and occu-pation of employment, class of worker, and mari-tal status.9
An important concern with the Census datais that respondents occasionally choose not toanswer some questions. Those who did not answerquestions related to the issues of this study werenot included in the sample. Also, the respondentswho lived in institutions (such as correctionalfacilities) and non-institutional group quarters(such as military barracks) were not included.Thus, the final sample consists of black and whitemen of prime working age who were not in themilitary and not incarcerated. Increasing rates ofincarceration of black men is an alarming trend
Black, Kolesnikova, Taylor
354 SEPTEMBER/OCTOBER 2010 FEDERAL RESERVE BANK OF ST. LOUIS REVIEW
2 Black et al. (2009) also show that in the presence of location-specificwages and prices, a racial wage gap is the same across locations onlyin the case of very specific (and usually unrealistic) preferences.
3 In this paper we concentrate on documenting city-specific changesin various measures of economic and social conditions of AfricanAmericans, leaving the explanation of the observed changes anddifferences in the observed changes to our future research.
4 The general concept of an MSA is that of a central city and itsadjacent communities having a high degree of economic and socialintegration.
5 See Ruggles et al. (2010).
6 There are no MSA identifiers in the 1960 IPUMS Census data,which makes it impossible to extend this analysis to earlier years.The smallest geographic unit in the 1960 IPUMS Census data is astate.
7 In 1970 a quite large proportion, about 43 percent, of black menof prime working age, 25 to 55 years old, lived in these 14 MSAs.Nevertheless, it is worth pointing out that the results of this papershould not be taken as a picture of the economic progress of blackmen in the United States as a whole. Rather, the paper focuses oneconomic progress of black men in large urban areas.
8 A similar investigation of the economic progress of black womenis equally interesting but presents additional challenges. There hasbeen a significant change in the labor force participation of blackand white women over the period studied. In addition, women’sattachment to the labor force tends to be weaker than men’s becausewomen often exit the labor force for childbearing and child care.This makes a direct comparison of white and black women’s labormarket outcomes even more complicated. It is an important topicwe plan to pursue in future research.
9 A detailed description of the variables is provided in Appendix 1.

and a subject of many studies.10 It is not a focusof this paper, however.
CHANGES IN RELATIVE WAGESAND ANNUAL EARNINGS
Many studies concentrate on wages as a meas-ure of earnings. It is a logical approach becausea wage is a price that labor markets put on a unitof labor of a certain skill level. In this case, a
decrease in the black-white wage gap means labormarkets’ valuations of black and white labor con-verge. It also indicates the convergence of skilllevels of black and white workers.
However, differences in wages is only one ofthe labor market characteristics that potentiallycontribute to racial economic disparity. Otherimportant factors include labor force participa-tion, unemployment, and underemployment. Tobetter assess the economic progress of blacks, weconsider a different measure—annual earnings,which take into consideration both wages andlabor force attachment. Analyzing annual earningsinstead of wages allows a better assessment of anindividual’s overall economic well-being.
Table 1, adapted from Black et al. (2009),shows in percent form a ratio of the averageweekly wages of black men to those of white men.
Black, Kolesnikova, Taylor
FEDERAL RESERVE BANK OF ST. LOUIS REVIEW SEPTEMBER/OCTOBER 2010 355
10 See, for example, Western (2006) and Charles and Luoh (forth-coming). Charles and Luoh document an astonishing increase ofincarceration rates of black men 25 to 35 years old between 1970and 2000. For example, in 2000 almost 30 percent were incarcer-ated in New Mexico, 23 percent in Wisconsin and Minnesota, and22 percent in Arizona. In 2000, their lowest incarceration rate was7 percent, in Washington, D.C., whereas state incarceration ratesof white men ranged from 0.8 and 3.2 percent.
Table 1Black-White Weekly Wage Ratios for Men(percent)
MSA 1970 1980 1990 2000
South
Houston 65 76 74 72
Memphis 63 73 71 78
Atlanta 62 75 75 78
New Orleans 63 73 74 75
Washington, D.C. 72 80 81 83
East
New York 75 76 77 78
Philadelphia 79 77 77 77
Baltimore 71 78 76 79
Midwest
St. Louis 74 77 73 77
Cleveland 76 82 80 77
Chicago 75 75 74 74
Detroit 81 83 81 78
West
Los Angeles 74 77 81 80
San Francisco 78 79 82 80
NOTE: The table is adapted from Black et al. (2009). For con-venience, log differences of positive weekly wages of black andwhite men were converted into ratios.
Table 2Black-White Annual Earnings Ratios for Men(percent)
MSA 1970 1980 1990 2000
South
Houston 59 67 61 59
Memphis 52 60 56 66
Atlanta 56 64 66 66
New Orleans 57 63 60 65
Washington, D.C. 62 71 70 72
East
New York 68 64 60 58
Philadelphia 72 63 63 61
Baltimore 66 65 65 67
Midwest
St. Louis 66 63 59 62
Cleveland 70 70 62 63
Chicago 69 62 56 55
Detroit 71 66 60 63
West
Los Angeles 66 66 64 62
San Francisco 68 63 62 62
NOTE: Authors’ calculations. See Appendix 2 for details. Thecalculation includes individuals with zero earnings.

From 1970 to 2000, the relative weekly wages ofblack men increased in all but three cities(Philadelphia, Chicago, and Detroit). For example,in 1970 in Houston, black men earned on average65 percent of the weekly wages of white men.The ratio increased to 72 percent in 2000. Atlantaexperienced the largest increase, from 62 percentin 1970 to 78 percent in 2000—a 16-percentage-point increase. In Philadelphia, Chicago, andDetroit the relative wages of black men decreasedbetween 1970 and 2000, but only slightly: from79 percent to 77 percent in Philadelphia, from75 percent to 74 percent in Chicago, and from 81percent to 78 percent in Detroit.
Table 2 provides a summary of changes ofblack-white annual earnings ratios in the 14 citiesfrom 1970 to 2000.11 The picture of economicprogress of black men is much less bright whenwe consider their annual earnings. In contrast toweekly wages, relative annual earnings of blackmen declined in most cities. In southern citiesthat did experience an increase in relative annualearnings of black men, most of the progressoccurred between 1970 and 1980, with no signifi-cant changes after that.12 In Chicago, where theirrelative annual earnings fell the most (14 percent-age points), black men were earning 69 percentof white men’s annual income in 1970 but only55 percent in 2000. Most of midwestern and east-ern cities in the sample experienced a similardecline. Interestingly, the magnitude and timingof the declines vary across cities. In New York,for example, the overall decrease of 10 percentagepoints was spread somewhat equally over thethree decades. In Philadelphia, the almost 10-percentage-point drop between 1970 and 1980was followed by virtually no change after 1980.In Cleveland, the largest decrease occurredbetween 1980 and 1990. In Detroit and St. Louis,two decades of regress were followed by a 3-percentage-point increase between 1990 and 2000.In Baltimore and Los Angeles, in contrast, theratio remained fairly stable over the three decades.
CHANGES IN LABOR FORCEPARTICIPATION
The main reason for the discrepancy betweenthe two measures of economic progress of blackmen from 1970 to 2000 is the labor force attach-ment of black men. During that time, black menexperienced a significant decline in their averageannual weeks of work. (This, of course, affectedtheir average annual earnings.) Figure 1 illustratesthis fact and Table 3 reports corresponding num-bers.13 The average decreased in every city, insome cases by as much as 25 percent. In 2000,black men on average worked only 33 weeks peryear in San Francisco (down from 42 in 1970),34 weeks in Los Angeles and Chicago (down from43 and 45, respectively, in 1970), and 35 weeksin Detroit (down from 45 in 1970). In contrast, in2000, Atlanta and Washington, D.C., both expe-rienced the highest average number of weeksworked: 41. But even this number is not higherthan the average in any of the 14 cities in 1970.14
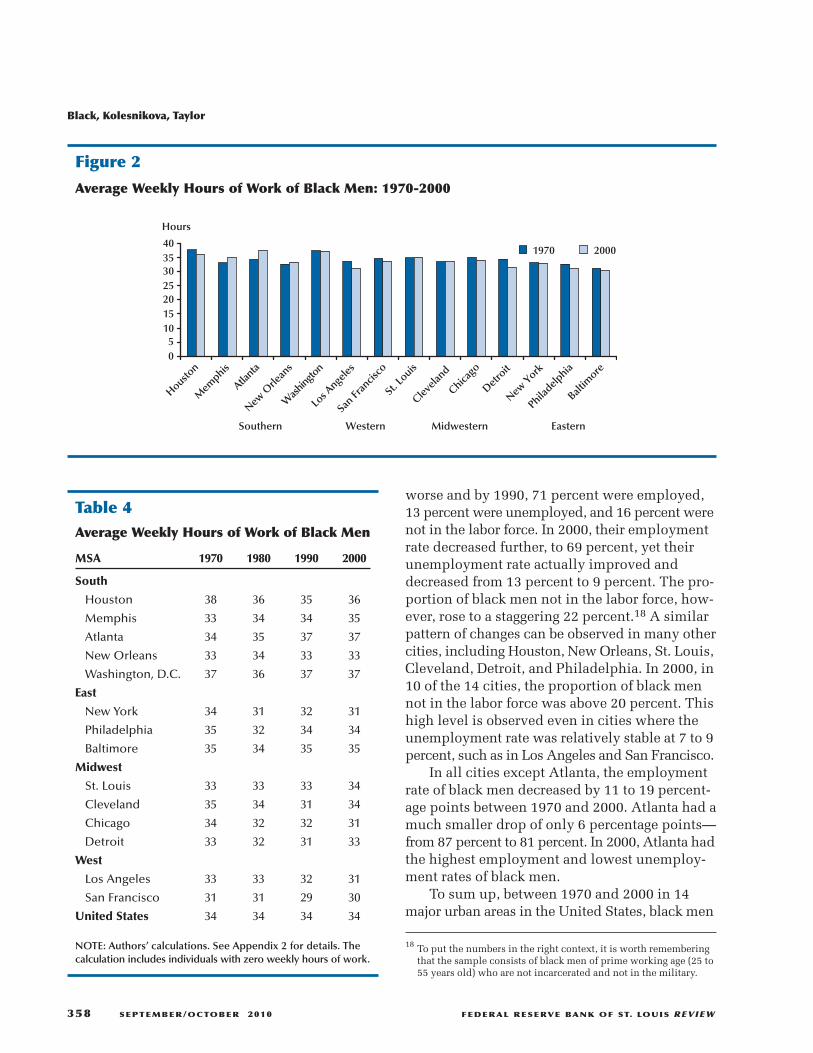
Figure 2 and Table 4 show that, in contrast,the weekly hours of work of black men stayedremarkably stable between 1970 and 2000, withrelatively small increases in some cities anddecreases in others.15,16 The low average in 2000implies not only underemployment for many blackmen but also that many did not work at all, whichdrives the average numbers down.
To better assess changes in the labor forceparticipation of black men between 1970 and2000, Table 5 reports the proportion of black menemployed, unemployed, or not in the labor force.
Black, Kolesnikova, Taylor
356 SEPTEMBER/OCTOBER 2010 FEDERAL RESERVE BANK OF ST. LOUIS REVIEW
11 See Appendix 2 for details of the estimation.
12 Memphis was an exception. There, the ratio declined by 4 percent-age points in 1980-90 but then increased by 10 percentage pointsin 1990-2000.
13 See Appendix 2 for details of the estimation. It describes, in par-ticular, an imputation technique for 1970 data.
14 In comparison, white men experienced only a small decline intheir average annual weeks of work over the same period in all 14cities: from 47 to 49 weeks in 1970 to 43 to 48 weeks in 2000.The largest declines, from 47 weeks in 1970 to 43 weeks in 2000,occurred in New York and Los Angeles. In the rest of the cities,white men worked on average 1 to 2 weeks less per year in 1970than in 2000. Detailed results are available from the authors uponrequest.
15 See Appendix 2 for details of the estimation. It describes, in par-ticular, an imputation technique for 1970 data.
16 Weekly hours of work of white men increased slightly over thesame period in all 14 cities: from 39 to 43 hours per week in 1970to 40 to 45 hours per week in 2000. Detailed results are availablefrom the authors upon request.

The table shows two main changes between 1970and 2000: decreases in the proportion of blackmen employed and increases in the proportionof black men not in the labor force. The tableshows also that in a number of cities, after theunemployment rate rose in 1980 and 1990, itdecreased in 2000 while the proportion of blackmen not in the labor force increased. This observedtrend seems consistent with a “discouraged work-ers” explanation: When the unemployment rateis high for a prolonged period, workers lookingfor jobs give up and opt out of the labor force andthus are not counted as unemployed.17 For exam-ple, consider Chicago in 1970: 88 percent of blackmen were employed, 4 percent were unemployed,and 8 percent were not in the labor force. By 1980,their employment dropped to 75 percent, theirunemployment rate rose to 10 percent, and 14 per-cent were not in the labor force. Things kept getting
Black, Kolesnikova, Taylor
FEDERAL RESERVE BANK OF ST. LOUIS REVIEW SEPTEMBER/OCTOBER 2010 357
Table 3Average Annual Weeks of Work of Black Men
MSA 1970 1980 1990 2000
South
Houston 46 41 38 39
Memphis 41 39 39 38
Atlanta 44 40 41 41
New Orleans 43 39 35 36
Washington, D.C. 46 41 42 41
East
New York 43 37 36 35
Philadelphia 45 36 37 37
Baltimore 45 39 39 39
Midwest
St. Louis 44 38 36 37
Cleveland 46 38 34 37
Chicago 45 37 35 34
Detroit 45 35 33 35
West
Los Angeles 43 37 35 34
San Francisco 42 35 32 33
United States 44 39 38 38
NOTE: Authors’ calculations. See Appendix 2 for details. Thecalculation includes individuals with zero weeks of work.
30323436384042444648
Houston
Mem
phis
Atlant
a
New O
rlean
s
Was
hingto
n
Los A
ngeles
San Fr
ancis
co
St. L
ouis
Clevela
nd
Chicago
Detro
it
New Y
ork
Philadelp
hia
Baltim
ore
1970 2000
Weeks
Southern Western Midwestern Eastern
Figure 1
Average Annual Weeks of Work of Black Men: 1970-2000
17 There is evidence that access to personal job-search networks isvery important. Holzer (1987) finds that “informal methods ofsearch…account for 87-90 percent of the difference in youthemployment probabilities between blacks and whites” (p. 451).Calvó-Armengol and Jackson (2004) use a similar social-networkingapproach to argue that the probability of obtaining a job decreaseswith the length of time one remains unemployed. They also exam-ine related inequality. In particular, they show that “if one groupstarts with worse employment status, then that group’s drop-outrate will be higher and their employment prospects will be persis -tently below that of the other group” (p. 426).
worse and by 1990, 71 percent were employed,13 percent were unemployed, and 16 percent werenot in the labor force. In 2000, their employmentrate decreased further, to 69 percent, yet theirunemployment rate actually improved anddecreased from 13 percent to 9 percent. The pro-portion of black men not in the labor force, how-ever, rose to a staggering 22 percent.18 A similarpattern of changes can be observed in many othercities, including Houston, New Orleans, St. Louis,Cleveland, Detroit, and Philadelphia. In 2000, in10 of the 14 cities, the proportion of black mennot in the labor force was above 20 percent. Thishigh level is observed even in cities where theunemployment rate was relatively stable at 7 to 9percent, such as in Los Angeles and San Francisco.
In all cities except Atlanta, the employmentrate of black men decreased by 11 to 19 percent-age points between 1970 and 2000. Atlanta had amuch smaller drop of only 6 percentage points—from 87 percent to 81 percent. In 2000, Atlanta hadthe highest employment and lowest unemploy-ment rates of black men.
To sum up, between 1970 and 2000 in 14major urban areas in the United States, black men
Black, Kolesnikova, Taylor
358 SEPTEMBER/OCTOBER 2010 FEDERAL RESERVE BANK OF ST. LOUIS REVIEW
05
10152025303540
Houston
Mem
phis
Atlant
a
New O
rlean
s
Was
hingto
n
Los A
ngeles
San Fr
ancis
co
St. L
ouis
Clevela
nd
Chicago
Detro
it
New Y
ork
Philadelp
hia
Baltim
ore
1970 2000
Hours
Southern Western Midwestern Eastern
Figure 2
Average Weekly Hours of Work of Black Men: 1970-2000
Table 4Average Weekly Hours of Work of Black Men
MSA 1970 1980 1990 2000
South
Houston 38 36 35 36
Memphis 33 34 34 35
Atlanta 34 35 37 37
New Orleans 33 34 33 33
Washington, D.C. 37 36 37 37
East
New York 34 31 32 31
Philadelphia 35 32 34 34
Baltimore 35 34 35 35
Midwest
St. Louis 33 33 33 34
Cleveland 35 34 31 34
Chicago 34 32 32 31
Detroit 33 32 31 33
West
Los Angeles 33 33 32 31
San Francisco 31 31 29 30
United States 34 34 34 34
NOTE: Authors’ calculations. See Appendix 2 for details. Thecalculation includes individuals with zero weekly hours of work.
18 To put the numbers in the right context, it is worth rememberingthat the sample consists of black men of prime working age (25 to55 years old) who are not incarcerated and not in the military.

Black, Kolesnikova, Taylor
FEDERAL RESERVE BANK OF ST. LOUIS REVIEW SEPTEMBER/OCTOBER 2010 359
Table 5Employment Status of Black Men (percent)
MSA 1970 1980 1990 2000 MSA 1970 1980 1990 2000
South Midwest
Houston St. Louis
Has a job 92 89 79 77 Has a job 83 74 71 72
Unemployed 2 3 10 6 Unemployed 8 13 13 7
Not in labor force 6 8 11 17 Not in labor force 10 13 16 21
Memphis Cleveland
Has a job 85 79 79 74 Has a job 85 75 68 72
Unemployed 3 9 7 6 Unemployed 6 11 13 8
Not in labor force 11 13 14 20 Not in labor force 9 14 18 20
Atlanta Chicago
Has a job 87 82 84 81 Has a job 88 75 71 69
Unemployed 3 7 7 4 Unemployed 4 10 13 9
Not in labor force 10 11 9 15 Not in labor force 8 14 16 22
New Orleans Detroit
Has a job 84 80 71 71 Has a job 86 65 66 69
Unemployed 4 6 10 6 Unemployed 7 19 15 8
Not in labor force 12 14 18 23 Not in labor force 7 16 19 23
Washington, D.C. West
Has a job 92 85 87 81 Los Angeles
Unemployed 1 5 5 5 Has a job 83 78 76 70
Not in labor force 7 9 8 14 Unemployed 7 8 9 9
East Not in labor force 10 14 15 21
New York San Francisco
Has a job 86 77 76 71 Has a job 83 76 73 71
Unemployed 3 8 9 7 Unemployed 7 9 7 7
Not in labor force 10 15 15 22 Not in labor force 11 15 21 22
Philadelphia United States
Has a job 86 74 76 72 Has a job 87 79 77 74
Unemployed 5 10 10 8 Unemployed 4 8 9 6
Not in labor force 9 16 14 21 Not in labor force 9 13 14 19
Baltimore
Has a job 87 78 78 74
Unemployed 4 8 8 7
Not in labor force 9 14 14 19
NOTE: Authors’ calculations. See Appendix 1 for details.

experienced significant decreases in their ratesof employment while their rates of unemploymentand the number of those opting out of the laborforce increased. As a result, their average annualweeks of work decreased dramatically, as did theirannual earnings relative to those for white men.
Why did this happen? What were the con-tributing factors? To begin answering these impor-tant questions we need to take a closer look atchanges in labor markets and the social structure.
CHANGES IN EDUCATIONALATTAINMENT
A big part of black-white economic conver-gence is attributed to a significant increase in edu-cational attainment levels of blacks over the pastcentury. As reported in Table 6, we consider fivemajor educational categories: less than high school,high school diploma (or General EducationalDevelopment [GED] certificate), some college butno bachelor’s degree, bachelor’s degree, higherthan a bachelor’s degree. (For comparison, Table 7provides similar statistics for white men.)
There are several main points worth noting.First, in 1970 in most cities, the majority of blackmen did not have a high school diploma. Thesituation was the worst in the South. In Memphis,77 percent of black men who were 25 to 55 yearsold in 1970 did not have a high school diploma,only 7 percent had some college experience, andonly 3 percent had a bachelor’s degree or higher.In New Orleans, 70 percent did not have a highschool diploma. The situation was much betterin the West: In Los Angeles and San Francisco,only 38 and 42 percent, respectively, did not havea high school diploma. Washington, D.C., alsohad a relatively small proportion of black menwithout a high school diploma in 1970: 47 percent.
Second, the educational attainment of blackmen progressed significantly between 1970 and2000. In 2000 in New Orleans, only 26 percent(down from 70 percent in 1970) did not have ahigh school diploma. This proportion is evensmaller in the other 13 cities. The proportion ofblack men who went to college significantlyincreased as well, although less than half of those
who pursued their education beyond high schoolreceived a bachelor’s degree or higher.
Third, despite their progress, black men stilllag far behind white men in educational attain-ment. Figure 3 illustrates this point for black menin the 14 cities in 1970 and 2000. The top panelshows the fractions with no high school diploma,the middle panel the fractions with a high schooldiploma (or GED certificate), and the bottom panelthe fractions with at least a bachelor’s degree.
Figure 3 makes it easy to see that the propor-tion of black men without a high school diplomadropped considerably between 1970 and 2000 inall cities. The progress was more significant inthe southern cities than in the midwestern andeastern cities. However, in all the cities exceptAtlanta, the rates of black men not completinghigh school are still at least double those of whitemen. In 2000, in all cities except New Orleans,less than 10 percent of white men did not have ahigh school diploma; in contrast, in 9 of the 14cities at least 19 percent of black men did not havea high school diploma.
Given a sharp rise in the demand for educatedlabor over the past several decades, it is particu-larly alarming that only a very small number ofblack men had a bachelor’s or higher degree evenby 2000. Washington, D.C., and Atlanta had thelargest proportions with at least a bachelor’sdegree: 26 and 23 percent, respectively. However,almost twice as many white men in these cities,58 and 44 percent, respectively, had at least abachelors’ degree. In Memphis, New Orleans, St. Louis, Cleveland, and Detroit, only 12 to 14percent of black men had graduated from college.In San Francisco, 62 percent of white men had atleast a bachelor’s degree, yet only 23 percent ofblack men did.
Tables 6 and 7 and Figure 3 demonstrate thatblack men, despite their important gains in edu-cational attainment between 1970 and 2000, stilldo not have levels of education anywhere nearthose of white men. Of additional concern is thequality of education that blacks receive, especiallyin inner-city schools in major urban areas. Progressin educational attainment in itself, though, is notas important as a resulting black-white conver-gence in skill levels. It has been shown that black-
Black, Kolesnikova, Taylor
360 SEPTEMBER/OCTOBER 2010 FEDERAL RESERVE BANK OF ST. LOUIS REVIEW

white skill convergence stopped in the late1980s.19
DE-INDUSTRIALIZATION ANDCHANGES IN INDUSTRIAL COMPOSITION
Industrial composition changed considerablybetween 1970 and 2000, especially in manufactur-ing cities. De-industrialization hurt both blacksand whites, but blacks were more affected. Onereason is that, as we discuss below, black menwere more likely to be employed in manufactur-ing industries. Another is that black men on aver-age have lower levels of educational attainment,which makes it harder for them to adapt to newlabor market conditions and find new jobs in adifferent industry. Also, as more and more jobsrequire training beyond high school, black menare worse off than white men because of theirrelatively low education levels.20
Table 8 shows the changes from 1970 to 2000in the distribution of all working men acrossindustries. (Table 9 reports similar statistics forblack men only.) The main story across the decadesis a decline in manufacturing employment and arise in service industry employment. The propor-tion of men employed in other industries changedvery little. With the exception of Washington, D.C.,where government jobs have historically domi-nated, employment of men in manufacturingdropped by at least 8 percentage points (as inNew Orleans). In cities that were predominantlyindustrial, such as St. Louis, Cleveland, Chicago,Detroit, Philadelphia, and Baltimore, manufactur-ing employment fell by 17 to 20 percentage points.In 1970 in Detroit, for instance, 51 percent of men
worked in manufacturing. That number declinedto 33 percent by 2000. Cleveland experienced asimilar decrease, from 45 percent in 1970 to 26percent in 2000.
As shown in Table 9, black men were morelikely to be employed in manufacturing in 1970and thus were more affected by de-industrializa-tion. In 1970, 56 percent of black men in Detroithad manufacturing jobs, 47 percent in Cleveland,and 37 percent in Chicago. By 2000, these num-bers had decreased by 30, 26, and 24 percentagepoints, respectively. More generally, in 1970 in10 of 14 cities, manufacturing employed thelargest proportion of black workers; by 2000, as aresult of de-industrialization, manufacturing lostits leading role in all cities except Detroit. Evenso, Detroit’s proportion of black men employedin manufacturing still decreased from 56 percentin 1970 to 26 percent in 2000.
Not surprisingly, labor market conditionsdeteriorated more significantly in cities with ahigh manufacturing concentration. In cities witha more-diverse industrial mix, the results of de-industrialization were less dire. As previouslynoted, labor force participation of black men didnot decrease nearly as dramatically in Atlantaand Washington, D.C., as in Chicago and Detroit.
THE ROLE OF MIGRATIONIt is impossible to talk about changes in the
local labor markets of these 14 cities withoutdiscussing underlying population changes. AsTable 10 shows, most southern cities, especiallyHouston and Atlanta, were growing between 1970and 2000. In contrast, eastern and midwesterncities were either declining or experiencing veryslow growth well below the overall U.S. rate.
Table 11 documents changes in black popu-lation in the 14 cities and the United States from1970 to 2000. It shows that the pattern of changesin these cities did not always follow the overallchanges in the United States. For example,between 1970 and 1980, when New York Citylost 9 percent of its population, black populationthere actually increased by 13 percent. Similarevents occurred in other cities with declining
Black, Kolesnikova, Taylor
FEDERAL RESERVE BANK OF ST. LOUIS REVIEW SEPTEMBER/OCTOBER 2010 361
19 See Neal (2006) for an excellent discussion of the topic.
20 Bound and Holzer (1993) show that the decline in manufacturingin the 1970s and 1980s reduced employment for both blacks andwhites. They also find that blacks generally had larger employmentdeclines than whites. Other studies (Bound and Freeman, 1992,for example) show similar results. Bound and Johnson (1992) findthat during the 1980s the labor demand shifted dramatically towardhigh-skilled labor, which was a major cause of a huge increase inrelative wages of highly educated workers.

Black, Kolesnikova, Taylor
362 SEPTEMBER/OCTOBER 2010 FEDERAL RESERVE BANK OF ST. LOUIS REVIEW
Table 6Educational Attainment of Black Men (percent)
MSA 1970 1980 1990 2000 MSA 1970 1980 1990 2000
South Midwest
Houston St. Louis
Less than high school 63 31 23 16 Less than high school 59 37 26 20
HSD/GED 22 35 31 30 HSD/GED 25 33 32 33
Some college, no degree 10 20 28 34 Some college, no degree 11 20 29 34
Bachelor’s degree 2 8 13 15 Bachelor’s degree 2 6 9 10
Above a bachelor’s 3 7 5 5 Above a bachelor’s 3 5 4 4
Memphis Cleveland
Less than high school 77 44 29 22 Less than high school 55 35 29 20
HSD/GED 15 34 34 36 HSD/GED 33 41 35 37
Some college, no degree 4 14 27 30 Some college, no degree 8 16 27 30
Bachelor’s degree 2 5 8 10 Bachelor’s degree 2 5 6 9
Above a bachelor’s 1 3 3 3 Above a bachelor’s 2 4 4 4
Atlanta Chicago
Less than high school 64 34 21 13 Less than high school 52 37 26 19
HSD/GED 26 38 32 29 HSD/GED 31 34 29 28
Some college, no degree 5 15 28 34 Some college, no degree 11 20 32 35
Bachelor’s degree 2 8 14 17 Bachelor’s degree 3 5 9 12
Above a bachelor’s 2 5 6 6 Above a bachelor’s 2 4 4 5
New Orleans Detroit
Less than high school 70 43 34 26 Less than high school 58 36 28 21
HSD/GED 19 32 28 33 HSD/GED 30 36 30 34
Some college, no degree 7 16 26 29 Some college, no degree 7 19 31 32
Bachelor’s degree 3 5 8 9 Bachelor’s degree 2 5 7 9
Above a bachelor’s 2 3 3 3 Above a bachelor’s 3 4 4 5
Washington, D.C. East
Less than high school 47 28 20 13 New York
HSD/GED 33 36 30 29 Less than high school 51 33 30 22
Some college, no degree 9 19 28 31 HSD/GED 35 38 29 29
Bachelor’s degree 6 8 14 17 Some college, no degree 8 17 27 30
Above a bachelor’s 6 9 8 9 Bachelor’s degree 3 6 10 13
West Above a bachelor’s 3 5 5 6
Los Angeles Philadelphia
Less than high school 38 21 18 15 Less than high school 56 36 28 19
HSD/GED 35 36 26 25 HSD/GED 31 41 36 38
Some college, no degree 19 29 38 40 Some college, no degree 7 13 23 28
Bachelor’s degree 4 7 13 14 Bachelor’s degree 3 5 9 11
Above a bachelor’s 4 7 6 6 Above a bachelor’s 3 5 4 5
San Francisco Baltimore
Less than high school 42 19 18 16 Less than high school 66 44 29 20
HSD/GED 32 34 23 24 HSD/GED 23 32 32 34
Some college, no degree 17 30 37 37 Some college, no degree 5 15 25 29
Bachelor’s degree 5 8 13 14 Bachelor’s degree 4 4 9 11
Above a bachelor’s 4 9 9 9 Above a bachelor’s 3 5 5 6
NOTE: Authors’ calculations. See Appendix 1 for details. HSD/GED, high school diploma or GED.

Black, Kolesnikova, Taylor
FEDERAL RESERVE BANK OF ST. LOUIS REVIEW SEPTEMBER/OCTOBER 2010 363
Table 7Educational Attainment of White Men (percent)
MSA 1970 1980 1990 2000 MSA 1970 1980 1990 2000
South Midwest
Houston St. Louis
Less than high school 32 13 9 7 Less than high school 37 18 11 8
HSD/GED 25 26 20 19 HSD/GED 35 35 27 25
Some college, no degree 17 23 30 30 Some college, no degree 10 19 30 32
Bachelor’s degree 14 21 27 30 Bachelor’s degree 10 14 21 23
Above a bachelor’s 11 18 14 14 Above a bachelor’s 8 14 11 12
Memphis Cleveland
Less than high school 29 14 8 7 Less than high school 32 18 11 8
HSD/GED 38 32 21 21 HSD/GED 36 37 30 30
Some college, no degree 13 22 34 33 Some college, no degree 13 18 28 31
Bachelor’s degree 11 16 24 26 Bachelor’s degree 10 15 19 21
Above a bachelor’s 9 15 13 13 Above a bachelor’s 8 13 11 11
Atlanta Chicago
Less than high school 31 16 9 8 Less than high school 30 15 9 6
HSD/GED 28 27 20 20 HSD/GED 33 32 22 20
Some college, no degree 17 21 28 27 Some college, no degree 16 20 29 29
Bachelor’s degree 14 20 29 30 Bachelor’s degree 12 17 25 29
Above a bachelor’s 9 16 14 14 Above a bachelor’s 10 16 15 17
New Orleans Detroit
Less than high school 36 17 11 13 Less than high school 35 19 12 9
HSD/GED 29 30 23 25 HSD/GED 34 35 27 26
Some college, no degree 14 19 29 29 Some college, no degree 13 21 34 34
Bachelor’s degree 11 16 22 21 Bachelor’s degree 9 12 17 20
Above a bachelor’s 10 17 15 12 Above a bachelor’s 9 13 9 11
Washington, D.C. East
Less than high school 20 9 6 5 New York
HSD/GED 27 21 16 15 Less than high school 32 17 10 7
Some college, no degree 15 16 23 22 HSD/GED 32 28 20 18
Bachelor’s degree 14 20 29 31 Some college, no degree 12 17 22 22
Above a bachelor’s 24 33 27 27 Bachelor’s degree 11 17 25 30
West Above a bachelor’s 13 22 22 24
Los Angeles Philadelphia
Less than high school 21 11 8 6 Less than high school 34 19 10 7
HSD/GED 33 27 17 15 HSD/GED 36 37 31 29
Some college, no degree 22 27 34 33 Some college, no degree 11 15 23 25
Bachelor’s degree 11 16 24 28 Bachelor’s degree 11 15 22 25
Above a bachelor’s 13 19 16 17 Above a bachelor’s 9 15 13 15
San Francisco Baltimore
Less than high school 19 8 5 3 Less than high school 41 23 12 9
HSD/GED 32 25 13 10 HSD/GED 30 32 26 24
Some college, no degree 20 25 30 25 Some college, no degree 11 16 26 28
Bachelor’s degree 14 18 30 37 Bachelor’s degree 10 14 21 24
Above a bachelor’s 15 24 23 25 Above a bachelor’s 8 15 14 16
NOTE: Authors’ calculations. See Appendix 1 for details. HSD/GED, high school diploma or GED.

Black, Kolesnikova, Taylor
364 SEPTEMBER/OCTOBER 2010 FEDERAL RESERVE BANK OF ST. LOUIS REVIEW
0
20
40
60
80
0
20
40
60
80
0
2040
6080
Houston
Mem
phis
Atlant
a
New O
rlean
s
Was
hingto
n
Los A
ngeles
San Fr
ancis
co
St. L
ouis
Clevela
nd
Chicago
Detro
it
New Y
ork
Philadelp
hia
Baltim
ore
Hours
Southern Western Midwestern Eastern
Houston
Mem
phis
Atlant
a
New O
rlean
s
Was
hingto
n
Los A
ngeles
San Fr
ancis
co
St. L
ouis
Clevela
nd
Chicago
Detro
it
New Y
ork
Philadelp
hia
Baltim
ore
Hours
Southern Western Midwestern Eastern
Houston
Mem
phis
Atlant
a
New O
rlean
s
Was
hingto
n
Los A
ngeles
San Fr
ancis
co
St. L
ouis
Clevela
nd
Chicago
Detro
it
New Y
ork
Philadelp
hia
Baltim
ore
Hours
Southern Western Midwestern Eastern
Less than a High School Diploma
High School Diploma or GED
Bachelor’s Degree or Higher
Black Men White Men
Figure 3
Educational Attainment of Black and White Men: 1970-2000
NOTE: The first set of bars shows data from 1970; the second shows data from 2000.

Black, Kolesnikova, Taylor
FEDERAL RESERVE BANK OF ST. LOUIS REVIEW SEPTEMBER/OCTOBER 2010 365
0102030405060708090
Houston
Mem
phis
Atlant
a
New O
rlean
s
Was
hingto
n
Los A
ngeles
San Fr
ancis
co
St. L
ouis
Clevela
nd
Chicago
Detro
it
New Y
ork
Philadelp
hia
Baltim
ore
1970 2000
Southern Western Midwestern Eastern
0102030405060708090
0102030405060708090
Houston
Mem
phis
Atlant
a
New O
rlean
s
Was
hingto
n
Los A
ngeles
San Fr
ancis
co
St. L
ouis
Clevela
nd
Chicago
Detro
it
New Y
ork
Philadelp
hia
Baltim
ore
Southern Western Midwestern Eastern
Houston
Mem
phis
Atlant
a
New O
rlean
s
Was
hingto
n
Los A
ngeles
San Fr
ancis
co
St. L
ouis
Clevela
nd
Chicago
Detro
it
New Y
ork
Philadelp
hia
Baltim
ore
Southern Western Midwestern Eastern
Percent
Percent
Percent
1970 2000
1970 2000
Married
Divorced, Separated, or Widowed
Never Married
Figure 4
Marital Status of Black Men: 1970-2000

Black, Kolesnikova, Taylor
366 SEPTEMBER/OCTOBER 2010 FEDERAL RESERVE BANK OF ST. LOUIS REVIEW
Table 8Employment Distribution of All Men by Industry (percent)
MSA 1970 1980 1990 2000 MSA 1970 1980 1990 2000
South MidwestHouston St. LouisConstruction 14 15 13 14 Construction 8 8 10 11Manufacturing 28 24 18 16 Manufacturing 37 32 26 20Transportation 11 10 10 10 Transportation 12 12 11 11Sales 18 17 20 18 Sales 16 15 17 16Finance 3 4 5 4 Finance 3 4 5 5Service 16 18 22 24 Service 13 17 20 25Public administration 3 3 3 3 Public administration 6 6 5 4Other 7 9 9 10 Other 5 6 6 7
Memphis ClevelandConstruction 7 8 9 9 Construction 8 8 8 10Manufacturing 25 22 16 13 Manufacturing 45 39 28 26Transportation 13 14 14 17 Transportation 10 10 10 8Sales 20 19 20 18 Sales 15 14 17 15Finance 4 5 5 4 Finance 4 4 5 5Service 17 18 22 24 Service 13 17 21 23Public administration 6 6 6 5 Public administration 4 4 4 5Other 8 7 9 9 Other 2 4 7 7
Atlanta ChicagoConstruction 10 9 11 12 Construction 8 8 8 10Manufacturing 26 20 15 14 Manufacturing 37 31 23 20Transportation 12 14 13 13 Transportation 12 12 11 11Sales 21 20 22 19 Sales 17 16 18 16Finance 6 6 7 6 Finance 4 6 7 7Service 16 20 23 25 Service 15 19 23 26Public administration 5 6 5 4 Public administration 4 5 4 4Other 4 5 4 6 Other 3 5 6 7
New Orleans DetroitConstruction 11 12 9 12 Construction 7 6 8 9Manufacturing 20 14 12 12 Manufacturing 51 45 35 33Transportation 16 15 12 11 Transportation 8 8 7 8Sales 18 18 19 17 Sales 13 13 16 15Finance 6 4 4 4 Finance 3 3 4 4Service 17 20 25 26 Service 13 15 19 21Public administration 5 6 5 5 Public administration 4 4 3 3Other 7 11 14 14 Other 2 4 6 7
Washington, D.C. EastConstruction 8 8 11 11 New YorkManufacturing 7 6 7 6 Construction 6 5 7 8Transportation 9 9 9 10 Manufacturing 20 17 11 8Sales 13 12 14 13 Transportation 16 13 12 12Finance 4 5 6 5 Sales 19 17 17 16Service 21 26 29 34 Finance 8 9 11 10Public administration 26 24 16 13 Service 22 26 29 31Other 12 9 8 8 Public administration 5 6 5 5
West Other 4 7 9 11Los Angeles PhiladelphiaConstruction 7 7 9 9 Construction 8 8 10 10Manufacturing 33 29 23 17 Manufacturing 36 28 21 16Transportation 10 9 8 9 Transportation 10 10 9 10Sales 17 17 18 19 Sales 16 16 18 17Finance 4 5 6 5 Finance 4 5 6 6Service 20 23 25 30 Service 15 20 23 28Public administration 4 4 3 3 Public administration 6 6 5 5Other 4 6 7 9 Other 5 6 7 8
San Francisco BaltimoreConstruction 9 8 8 8 Construction 9 10 12 11Manufacturing 20 17 11 10 Manufacturing 31 22 16 12Transportation 14 12 11 9 Transportation 11 11 10 10Sales 18 18 19 18 Sales 14 14 16 16Finance 6 7 8 8 Finance 4 4 5 6Service 21 25 30 38 Service 15 18 22 28Public administration 7 6 4 3 Public administration 9 13 11 9Other 5 6 7 6 Other 7 8 8 8
NOTE: Authors’ calculations. See Appendix 1 for details.

Black, Kolesnikova, Taylor
FEDERAL RESERVE BANK OF ST. LOUIS REVIEW SEPTEMBER/OCTOBER 2010 367
Table 9Employment Distribution of Black Men by Industry (percent)
MSA 1970 1980 1990 2000 MSA 1970 1980 1990 2000
South MidwestHouston St. LouisConstruction 14 12 8 7 Construction 7 6 5 6Manufacturing 24 25 16 12 Manufacturing 36 34 23 18Transportation 14 16 17 17 Transportation 13 14 13 16Sales 22 17 18 17 Sales 13 10 14 13Finance 3 2 3 3 Finance 1 2 3 3Service 17 15 22 25 Service 17 17 23 25Public administration 1 4 4 6 Public administration 8 7 6 5Other 6 8 12 13 Other 6 10 14 15
Memphis ClevelandConstruction 11 8 9 7 Construction 6 4 5 6Manufacturing 28 26 16 15 Manufacturing 47 40 22 21Transportation 13 17 17 20 Transportation 15 13 13 10Sales 17 17 17 16 Sales 12 11 12 14Finance 1 2 2 2 Finance 3 2 4 4Service 15 15 19 20 Service 12 16 22 25Public administration 3 7 7 5 Public administration 3 5 5 5Other 11 9 12 15 Other 3 9 18 13
Atlanta ChicagoConstruction 13 10 9 8 Construction 6 5 5 4Manufacturing 25 20 15 13 Manufacturing 37 29 17 13Transportation 14 17 16 19 Transportation 16 16 17 16Sales 20 16 19 17 Sales 16 12 14 12Finance 2 4 5 5 Finance 2 4 5 5Service 15 18 23 25 Service 15 17 22 25Public administration 5 7 7 5 Public administration 4 5 5 5Other 6 8 6 8 Other 4 12 15 18
New Orleans DetroitConstruction 14 13 9 11 Construction 6 4 5 5Manufacturing 21 15 10 12 Manufacturing 56 50 31 26Transportation 22 20 18 14 Transportation 9 8 8 9Sales 19 16 17 14 Sales 9 8 11 12Finance 3 2 3 3 Finance 2 2 3 3Service 15 17 21 22 Service 12 12 18 22Public administration 2 5 4 5 Public administration 3 6 6 4Other 5 12 18 20 Other 3 10 18 18
Washington, D.C. EastConstruction 11 9 10 8 New YorkManufacturing 7 6 5 5 Construction 5 5 7 7Transportation 15 15 15 16 Manufacturing 19 16 10 5Sales 17 12 14 13 Transportation 21 17 17 16Finance 3 4 5 5 Sales 17 12 12 11Service 22 25 28 32 Finance 7 7 8 7Public administration 22 23 17 13 Service 22 26 28 32Other 4 6 6 8 Public administration 4 6 6 6
West Other 6 11 12 16Los Angeles PhiladelphiaConstruction 7 5 6 5 Construction 8 7 8 6Manufacturing 28 25 16 9 Manufacturing 32 23 16 11Transportation 13 14 15 15 Transportation 15 13 13 12Sales 14 13 13 12 Sales 12 12 15 15Finance 3 4 6 5 Finance 2 3 4 5Service 24 24 26 33 Service 18 20 25 30Public administration 6 6 6 5 Public administration 8 9 8 7Other 4 9 13 16 Other 5 12 13 14
San Francisco BaltimoreConstruction 12 7 6 5 Construction 9 9 9 7Manufacturing 18 16 8 5 Manufacturing 32 23 15 11Transportation 21 18 16 14 Transportation 17 14 14 13Sales 10 12 12 15 Sales 12 12 14 15Finance 2 5 5 5 Finance 2 4 4 4Service 20 23 32 37 Service 16 18 22 27Public administration 14 9 5 5 Public administration 7 11 11 10Other 4 11 16 14 Other 5 10 11 13
NOTE: Authors’ calculations. See Appendix 1 for details.

populations as well.21 Thus, while manufacturingwas losing its importance and labor market con-ditions were deteriorating, black population inthose cities was increasing.
On the other hand, rapidly growing cities, suchas Houston and Atlanta, had large increases inblack population as well. What sets Atlanta apart,however, is that black population there was grow-ing even faster than the overall city population.
Tables 12 and 13 report changes in the popu-lation of black and white men, respectively, by
decades: 1970-80, 1980-90, and 1990-2000. Asexpected, changes in the population of black men(Table 12) are consistent with changes in blackpopulation in general (see Table 11). However,they vary widely with the changes in the popula-tion of white men. While the population of blackmen was increasing in the three decades in almostall cities, the population of white men was decreas-ing. For example, in New York in 1980-90, thepopulation of black men grew by 23 percent whilethe population of white men decreased by 31 per-cent. Other eastern and midwestern cities had asimilar experience. Even when the population ofwhite men grew, it did so at a lower rate than thepopulation of black men. The 1970-80 populationincrease in Los Angeles was 1 percent for whitemen and 24 percent for black men.
Table 14 offers a different way to look atmigration flows of blacks. It reports the propor-tion of black men who were “locals” in the 14
Black, Kolesnikova, Taylor
368 SEPTEMBER/OCTOBER 2010 FEDERAL RESERVE BANK OF ST. LOUIS REVIEW
Table 10Overall Population Changes by MSA (percent)
MSA 1970-80 1980-90 1990-2000
South
Houston 45 21 24
Memphis 10 7 12
Atlanta 27 33 35
New Orleans 14 –1 4
Washington, D.C. 9 21 15
East
New York –9 3 8
Philadelphia –2 3 3
Baltimore 5 8 7
Midwest
St. Louis –2 3 4
Cleveland –6 –3 2
Chicago 2 2 11
Detroit –2 –3 4
West
Los Angeles 6 19 6
San Francisco 0 8 8
United States 11 10 13
SOURCE: Metropolitan (MSA) Population Data: Populationand Household Data, U.S. Metropolitan Statistical Areas, MSA (1999 definition), 1970-present, Real Estate Center, Texas A&M University; http://recenter.tamu.edu/data/popm/.
Table 11Black Population Changes by MSA (percent)
MSA 1970-80 1980-90 1990-2000
South
Houston 37 18 22
Memphis 16 9 14
Atlanta 41 39 33
New Orleans 19 5 2
Washington, D.C. 15 20 11
East
New York 13 22 3
Philadelphia 5 6 4
Baltimore 13 10 13
Midwest
St. Louis 7 4 7
Cleveland 5 3 8
Chicago 17 0 7
Detroit 16 6 7
West
Los Angeles 24 9 1
San Francisco 1 –4 2
United States 17 13 16
SOURCE: Population Estimates Archives, U.S. Census Bureau.
21 It is tempting to explain these changes by recalling that one of themain demographic trends during the 1970s and 1980s was themigration of white population away from urban centers. Readersare reminded, however, that the unit of analysis in this paper is ametropolitan area that includes a central city together with adjacentcommunities (usually counties). Thus, the observed phenomenoncannot be explained only by white flight to the suburbs.

cities, meaning those born in the relevant stateor, for some cities, born in a specified neighbor-ing state. Ideally, we would like to know howmany men were born in the city they lived in,but the data do not offer this information. In 1970,the southern cities had a very high proportion ofblack men who were locals. In 1970, for example,in Memphis, 91 percent of black men were localsborn either in Tennessee or Mississippi; in Atlanta,86 percent were locals and born in Georgia. Thedifference between these two cities, however, isthat while the black population of Memphisstayed predominantly local throughout the threedecades, Atlanta had a steady inflow of migrantsfrom other parts of the country. In Atlanta, by1980 the proportion of locals declined to 73 per-cent, by 1990 to 55 percent, and by 2000 to only43 percent. This “churning” of the populationcontributed to Atlanta having one of the highest
average educational attainments of black men.Recall also that in 2000 black men in Atlantahad the highest employment rate and lowestunemployment rate.
Table 14 shows that in the midwestern citiesthe population dynamic was the opposite of thatin Atlanta. In 1970, most black men living in thesecities were born elsewhere. This was, of course,a result of the Great Migration in the earlier partof the century that moved blacks northward. In1970, only 28 percent of black men in Detroit wereborn in Michigan; in Cleveland, Chicago, andSt. Louis the proportions of locals were, respec-tively, 34, 36, and 37 percent. In the followingthree decades, however, the inflow significantlydecreased: By 2000, the proportion of black menin Detroit who were born in Michigan reached69 percent. The other midwestern cities experi-enced similar increases.
Black, Kolesnikova, Taylor
FEDERAL RESERVE BANK OF ST. LOUIS REVIEW SEPTEMBER/OCTOBER 2010 369
Table 12Black Male Population Changes by MSA(percent)
MSA 1970-80 1980-90 1990-2000
South
Houston 37 18 21
Memphis 15 8 14
Atlanta 41 41 33
New Orleans 18 3 2
Washington, D.C. 13 19 11
East
New York 11 23 4
Philadelphia 4 6 4
Baltimore 11 10 12
Midwest
St. Louis 6 3 7
Cleveland 3 2 9
Chicago 15 0 7
Detroit 14 4 7
West
Los Angeles 24 9 0
San Francisco 2 –2 2
SOURCE: Population Estimates Archives, U.S. Census Bureau.
Table 13White Male Population Changes by MSA(percent)
MSA 1970-80 1980-90 1990-2000
South
Houston 48 –15 9
Memphis 4 5 5
Atlanta 22 26 24
New Orleans 11 –12 –1
Washington, D.C. –1 11 6
East
New York –17 –31 –9
Philadelphia –5 –3 –3
Baltimore 1 5 0
Midwest
St. Louis –4 2 2
Cleveland –8 –8 –2
Chicago –3 –14 2
Detroit –8 –8 3
West
Los Angeles 1 –40 –14
San Francisco –6 –18 –9
SOURCE: Population Estimates Archives, U.S. Census Bureau.

The picture of migration is somewhat simi-lar, though less dramatic, in Philadelphia andBaltimore. In New York, the proportion of localsstayed pretty stable in the 30 to 40 percent range.In 1970 in the western cities, San Francisco andLos Angeles, only a small proportion of black menwere locals (15 and 13 percent, respectively). By2000, the proportions increased to 45 percent inSan Francisco and 47 percent in Los Angeles.
Differences in migration are clearly related todifferences in the economic well-being of blackmen across cities. Cities that are doing well, suchas Atlanta, attract more educated workers lookingfor good job opportunities. Struggling cities havedifficulty raising their levels of human capitalbecause they cannot attract talented, educatedworkers from other places and are losing theirown educated population.
CHANGES IN FAMILY STRUCTUREStable families are important indicators of
healthy communities. Table 15 shows the distri-bution of the marital status of black men in eachcity in 1970, 1980, 1990, and 2000 in these cate-gories: married, divorced/separated/widowed,and never married. Figure 4 compares changesin these distributions between 1970 and 2000.The most striking finding is that marriage rates ofblack men decreased dramatically between 1970and 2000.
In 1970 across the cities, the rates variedfrom 71 percent (in Baltimore and Philadelphia)to 83 percent (in Houston). By 2000, the ratesvaried from only 31 to 54 percent22 and were
Black, Kolesnikova, Taylor
370 SEPTEMBER/OCTOBER 2010 FEDERAL RESERVE BANK OF ST. LOUIS REVIEW
Table 14Non-Migrant Black Men by MSA (percent)
MSA 1970 1980 1990 2000
South
Live in Houston, born in TX 74 65 61 61
Live in Memphis, born in TN or MS 91 91 88 84
Live in Atlanta, born in GA 86 73 55 43
Live in New Orleans, born in LA 82 81 84 86
Live in DC, born in MD, VA, or DC 56 50 52 52
East
Live in New York, born in NY 38 30 35 40
Live in Philadelphia, born in PA or NJ 54 59 69 73
Live in Baltimore, born in MD 54 58 65 66
Midwest
Live in St. Louis, born in MO 37 44 58 64
Live in Cleveland, born in OH 34 41 57 72
Live in Chicago, born in IL 36 38 56 67
Live in Detroit, born in MI 28 39 58 69
West
Live in Los Angeles, born in CA 13 21 34 47
Live in San Francisco, born in CA 15 25 37 45
NOTE: Authors’ calculations. See Appendix 1 for details.
22 Table 16 presents the statistics for white men based on the samecategories and shows their marriage rates declined as well but notas dramatically. In 1970, 78 to 89 percent of white men were mar-ried. By 2000, the proportion had declined to 47 to 69 percent.

Black, Kolesnikova, Taylor
FEDERAL RESERVE BANK OF ST. LOUIS REVIEW SEPTEMBER/OCTOBER 2010 371
Table 15Marital Status of Black Men by MSA (percent)
MSA 1970 1980 1990 2000 MSA 1970 1980 1990 2000
South Midwest
Houston St. Louis
Married 83 67 54 54 Married 75 59 47 45
D/S/W 11 17 21 18 D/S/W 15 23 20 21
Never married 6 16 26 28 Never married 10 18 33 34
Memphis Cleveland
Married 75 58 49 48 Married 78 60 47 43
D/S/W 19 22 21 20 D/S/W 15 21 25 22
Never married 6 20 30 32 Never married 7 19 28 35
Atlanta Chicago
Married 74 61 53 53 Married 76 57 44 44
D/S/W 16 19 18 16 D/S/W 14 21 21 19
Never married 10 20 29 31 Never married 10 21 36 38
New Orleans Detroit
Married 75 61 50 50 Married 73 55 43 42
D/S/W 13 20 20 20 D/S/W 16 24 23 18
Never married 12 18 30 30 Never married 11 21 34 39
Washington, D.C. East
Married 72 56 49 51 New York
D/S/W 14 22 17 16 Married 74 57 49 46
Never married 14 23 34 33 D/S/W 12 19 17 15
West Never married 13 24 35 39
Los Angeles Philadelphia
Married 72 55 46 44 Married 71 54 45 44
D/S/W 17 23 21 18 D/S/W 15 23 20 16
Never married 11 22 34 38 Never married 14 23 35 39
San Francisco Baltimore
Married 73 51 39 31 Married 71 52 44 46
D/S/W 15 23 21 20 D/S/W 15 24 20 18
Never married 12 26 40 49 Never married 14 24 36 36
NOTE: Authors’ calculations. See Appendix 1 for details. D/S/W, divorced/separated/widowed.

Black, Kolesnikova, Taylor
372 SEPTEMBER/OCTOBER 2010 FEDERAL RESERVE BANK OF ST. LOUIS REVIEW
Table 16Marital Status of White Men by MSA (percent)
MSA 1970 1980 1990 2000 MSA 1970 1980 1990 2000
South Midwest
Houston St. Louis
Married 88 76 70 69 Married 88 81 72 69
D/S/W 6 12 13 14 D/S/W 5 9 11 13
Never married 6 12 17 17 Never married 7 11 17 18
Memphis Cleveland
Married 89 79 72 69 Married 86 77 69 66
D/S/W 4 11 11 15 D/S/W 5 8 11 13
Never married 7 11 16 16 Never married 9 14 20 21
Atlanta Chicago
Married 88 77 71 69 Married 84 75 66 67
D/S/W 5 11 11 12 D/S/W 5 9 10 10
Never married 7 12 18 19 Never married 11 16 24 23
New Orleans Detroit
Married 85 74 66 63 Married 87 78 71 67
D/S/W 6 11 13 14 D/S/W 5 10 11 12
Never married 10 15 21 22 Never married 9 13 18 21
Washington, D.C. East
Married 85 71 65 66 New York
D/S/W 5 11 10 11 Married 78 67 59 58
Never married 10 19 24 23 D/S/W 5 9 9 9
West Never married 17 25 33 34
Los Angeles Philadelphia
Married 79 63 56 54 Married 85 76 70 68
D/S/W 9 15 14 13 D/S/W 5 9 9 10
Never married 12 22 30 33 Never married 10 15 21 22
San Francisco Baltimore
Married 79 62 50 47 Married 86 76 70 67
D/S/W 8 14 13 11 D/S/W 6 11 12 13
Never married 14 24 37 42 Never married 8 14 19 20
NOTE: Authors’ calculations. See Appendix 1 for details. D/S/W, divorced/separated/widowed.

particularly low in the western and midwesterncities: Only 31 percent of black men were marriedin San Francisco, 44 percent in Los Angeles, andonly 42 to 45 percent in the midwestern citiesoverall. Houston still had the highest proportionof married black men in 2000, but it was downto 54 percent. Atlanta had the second highest—53 percent. Overall, as shown in Table 15, thelargest decline in marriage rates occurred between1970 and 1980, followed by a somewhat smallerdecline between 1980 and 1990. The rates thenstayed essentially the same between 1990 and 2000.
Remarkably, as easily seen in Figure 4, divorcerates for black men from 1970 to 2000 did notchange much in most cities. Instead, the propor-tion who have never married increased dramati-cally—in some cities by more than five times. In1970 in Memphis, for instance, only 6 percent ofblack men had never married and in San Franciscoonly 12 percent (see Table 15). In 2000, the pro-portion reached 32 percent in Memphis and 49percent in San Francisco. In midwestern cities,the proportion increased from 7 to 11 percent in1970 to 34 to 39 percent in 2000.
This trend describes significant demographicchanges in the black community.23 One directconsequence is more single mothers and, thus,more children who grow up in single-parenthouseholds.
THE WELL-BEING OF BLACKCHILDREN
The paper thus far has documented mainlynegative developments in economic and socialconditions of blacks between 1970 and 2000:increased rates of unemployment and those not
in the labor force, decreased relative annualincomes, insufficient progress in educationalattainment, and decreased marriage rates. Onequestion that seems very important is how thesechanges affect the well-being of the children.Has there been any progress in their welfare? Toaddress this question in the most straightfor-ward way, we compare the income distributionsof white and black families with children 8 to 12years old.24 Comparison of family incomes allowsus to summarize how decreased marriage rates,increased single-mother households, and changesin labor force participation and wages affect chil-dren; it also allows us to capture the economicprogress of women.25
First we compute an annual income distribu-tion of white children’s families. Then we calcu-late the 75th percentile, the median, and the 25thpercentile of annual income distribution of blackchildren’s families. Finally, we determine whereeach of these quartiles of black family incomedistribution falls in the white family income dis-tribution. The results are reported in Table 17.
Consider Houston in 1970, for instance. Asthe table shows, the median family income ofblack children corresponds to the 12th percentileof white children, which means that only 12 per-cent of white children had family income belowthe median family income of black children. Putanother way, half of black children have familyincome that was less than that of 88 percent ofwhite children.
Black, Kolesnikova, Taylor
FEDERAL RESERVE BANK OF ST. LOUIS REVIEW SEPTEMBER/OCTOBER 2010 373
23 There is a literature that suggests that the structure of welfarepayments discourages marriage (e.g., Duncan and Hoffman, 1990,and Lichter, LeClere, and McLaughlin, 1991). Moffit (1997), how-ever, reviews this literature and concludes that “considerable uncer-tainty surrounds this consensus because a significant minority ofthe studies find no effect at all, because the magnitudes of the esti-mated effects vary widely, and because puzzling and unexplaineddifferences exist across the studies by race and methodologicalapproach” (p. 1). Black, McKinnish, and Sanders (2003) find thatwhen low-skilled workers have high-wage jobs (as did miners dur-ing the coal boom), welfare expenditure decreases partly becauseof the decline in single-parent households.
Charles and Luoh (forthcoming) present evidence that anincrease in incarceration rates of black men negatively affected themarriage market for black women. It led to a shift of gains from mar-riage from women toward men. Our sample, however, does notinclude men in prison at the time of the survey. Thus, the estimatedmarriage rates are likely to be even lower if one includes incarcer-ated men.
24 For this exercise, the income measurement we use includes annualpre-tax family income from all sources, including Social Securityand welfare payments, as well as veterans’ payments, unemploy-ment compensation, child support, and alimony. Incomes wererecorded for all persons in a family who were 15 years old andolder (14 years old and older in 1970 data).
25 We do not study economic progress of black women in this paper,leaving this important topic to future research. Stagnation of theeconomic progress of black men is likely to have behavioralresponses from women. Charles and Luoh (forthcoming) find, forexample, that black women who face marriage markets with reducedquality of potential spouses increase their schooling and laborsupply.

Black, Kolesnikova, Taylor
374 SEPTEMBER/OCTOBER 2010 FEDERAL RESERVE BANK OF ST. LOUIS REVIEW
Table 17Well-Being of Black Children Compared with White Children Based on Place in Family IncomeDistribution of White Children (Percentile)
MSA 1970 1980 1990 2000 MSA 1970 1980 1990 2000
South Midwest
Houston St. Louis
75th percentile 27 38 39 38 75th percentile 37 37 39 33
Median 12 14 15 16 Median 12 12 13 12
25th percentile 4 4 4 6 25th percentile 4 4 4 4
Ratio of medians 0.5 0.5 0.5 0.4 Ratio of medians 0.5 0.4 0.4 0.4
Memphis Cleveland
75th percentile 20 34 32 33 75th percentile 35 43 44 39
Median 8 14 10 12 Median 10 12 15 14
25th percentile 4 5 3 3 25th percentile 4 4 4 5
Ratio of medians 0.4 0.4 0.4 0.4 Ratio of medians 0.5 0.5 0.5 0.4
Atlanta Chicago
75th percentile 27 32 39 40 75th percentile 33 37 37 34
Median 12 15 13 17 Median 11 11 11 11
25th percentile 6 3 10 7 25th percentile 4 4 3 3
Ratio of medians 0.5 0.5 0.5 0.5 Ratio of medians 0.6 0.4 0.4 0.4
New Orleans Detroit
75th percentile 26 35 32 35 75th percentile 45 45 41 42
Median 10 13 9 14 Median 14 18 14 16
25th percentile 4 4 3 4 25th Percentile 4 7 5 6
Ratio of medians 0.5 0.4 0.3 0.4 Ratio of medians 0.6 0.6 0.4 0.5
Washington, D.C. East
75th percentile 33 44 47 40 New York
Median 13 17 17 17 75th percentile 40 40 46 43
25th percentile 6 6 5 4 Median 15 16 21 23
Ratio of medians 0.5 0.6 0.6 0.5 25th percentile 6 6 7 7
West Ratio of medians 0.5 0.5 0.5 0.5
Los Angeles Philadelphia
75th percentile 36 44 51 39 75th percentile 44 41 46 40
Median 15 20 18 17 Median 14 15 14 13
25th percentile 6 8 7 6 25th percentile 5 5 5 4
Ratio of medians 0.5 0.5 0.5 0.4 Ratio of medians 0.6 0.5 0.5 0.5
San Francisco Baltimore
75th percentile 46 41 37 36 75th percentile 46 41 43 41
Median 16 17 17 11 Median 16 15 15 16
25th percentile 7 6 4 4 25th percentile 6 3 6 4
Ratio of medians 0.6 0.5 0.5 0.3 Ratio of medians 0.6 0.5 0.5 0.5
NOTE: Authors’ calculations. See Appendix 1 for details.

Similarly, the 25th percentile of the “blackdistribution” corresponds to the 4th percentileof the “white distribution,” which means that 25percent of black children’s families were as pooras the bottom 4 percent of white children’s fami-lies. The 75th percentile of the black distributioncorresponds to the 27th percentile of the whitedistribution, which means that 73 percent ofwhite children’s families were at least as wealthyas the top 25 percent of black children’s families.
In addition, Table 17 reports a ratio of medianincomes of black and white families. For example,in 1970 in Houston the median income of blackchildren’s families was only half the medianincome of white children’s families. The picture issimilarly bleak across all the cities and decades—the median annual income of black children’sfamilies is only about one half the median annualincome of white children’s families. What is more,this ratio did not increase in any of the 14 citiesover the 1970-2000 period.26 In fact, in 10 of the 14 cities the ratio decreased, meaning thatthe median income of black children’s familiesdecreased relative to the median income ofwhite children’s families. From 1970 to 2000, in San Francisco it decreased from 0.6 to 0.3 and in Chicago from 0.6 to 0.4.
Where does the median income of black chil-dren’s families fit into the income distribution ofwhite children’s families? In 2000, the situationwas the “best” in New York, where the medianof the black distribution corresponds to the 23rdpercentile of the white distribution. Thus, inNew York in 2000, 50 percent of black children’sfamilies had incomes below those of 77 percentof white children’s families. The situation in 2000was even worse in the rest of the cities—themedian black distributions fell within only the 11thto the 17th percentiles of the white distributions.
For black children’s families, the situation atthe top and bottom quartiles of the income dis-tribution is no better than in the middle. In 2000,the 75th percentile of the black distribution stillcorresponds to only the 33rd to the 43rd percentileof the white distribution. Perhaps even more sig-
nificant is that 25 percent of black children’s fam-ilies have incomes as low as those of the poorest3 to 7 percent of white children’s families. Tosum up, there was no progress in the financialwell-being of black children, relative to whitechildren, between 1970 and 2000.
CONCLUDING REMARKSMore than 35 years after the Civil Rights Act,
the economic status of black men is still muchworse than that of white men. What is more, thereappears to be virtually no progress of black menin the labor markets between 1970 and 2000.Some important indicators, such as the rate ofthose not in the labor force and relative annualearnings, have actually become worse. The socialand family structure of the black population alsoexperience negative changes.
This paper does not attempt to determinewhy there was stagnation, and even a reversal,of the economic progress of African Americansbetween 1970 and 2000.27 Instead, the main goalof this paper was to describe changes in variouseconomic conditions of black men and their fam-ilies at a city level. The second goal was to com-pare those changes across cities.
Although the overall picture is rather bleak,there are clear differences among the 14 citiesstudied. Industrial cities in the Midwest (Chicago,Detroit, Cleveland, and St. Louis) experiencedmore serious deterioration of their labor marketsprecisely because they used to be predominantlymanufacturing cities. With the decline of theimportance of manufacturing and a move to high-tech and service industries, the black labor force,which was generally less educated, faced toughlabor market conditions that resulted in high levelsof unemployment. In addition, growing numbersof black men became discouraged about their jobprospects and dropped out of the labor force com-pletely. Family structure was disrupted as wellas more and more black men chose not to marry.As a result, more black children are growing upin single-mother households and the economic
Black, Kolesnikova, Taylor
FEDERAL RESERVE BANK OF ST. LOUIS REVIEW SEPTEMBER/OCTOBER 2010 375
26 We also looked at ratios of various other percentiles of the twodistributions. The results were the same—there is no change inratios over the years.
27 Neal (2008) presents a short summary of possible explanationsand a discussion of several related studies.

well-being of black children has not improvedsince 1970.
Most eastern and western cities in the studyshowed declines similar to those in midwesterncities but of a somewhat lesser degree. Southerncities, on the other hand, did see some economicprogress of black men, mostly between 1970 and1980. These improvements, together with thereversal of economic progress in the Midwest,resulted in more uniform conditions for blackmen in 2000 than in 1970. Educational attain-ment of black men in the South, in particular, hasincreased dramatically compared with 1970.
Atlanta and Washington, D.C., stand out on anumber of characteristics. In 2000, black men inthose cities had the highest employment rates, aswell as low rates of unemployment and those notin the labor force. They also had the highest pro-portions of those who went to college and those
who had a bachelor’s degree or higher. One of thereasons these two cities fared better is their indus-trial structure. Atlanta has a very vibrant mix ofindustries and never relied heavily on manufac-turing. Washington, D.C., has a high proportionof service and stable government jobs. As a result,these cities have been able to attract high-skillededucated workers from other parts of the country.
Despite remarkable changes in society whenit comes to racial acceptance and equality, theevidence presented in this paper reveals that sig-nificant racial disparities remain in educationand labor market outcomes. A better understand-ing of underlying causes of the observed economicstagnation and a design of policies that wouldhelp improve the social and economic status ofAfrican Americans is an important topic for futureresearch.
Black, Kolesnikova, Taylor
376 SEPTEMBER/OCTOBER 2010 FEDERAL RESERVE BANK OF ST. LOUIS REVIEW

REFERENCESAltonji, Joseph G. and Blank, Rebecca M. “Race and Gender in the Labor Market,” in Orley C. Ashenfelter andDavid Card, eds., Handbook of Labor Economics. Volume 3C. Chap. 48. Amsterdam: North Holland, 1999;pp. 3143-259.
Bound, John and Freeman, Richard B. “What Went Wrong? The Erosion of Relative Earnings and Employmentamong Young Black Men in the 1980s.” Quarterly Journal of Economics, February 1992, 107(1), pp. 201-32.
Bound, John and Holzer, Harry J. “Industrial Shifts, Skill Levels, and the Labor Market for White and BlackMales.” Review of Economics and Statistics, August 1993, 75(3), pp. 387-96.
Bound, John and Johnson, George. “Changes in the Structure of Wages in the 1980’s: An Evaluation of AlternativeExplanations.” American Economic Review, June 1992, 82(3), pp. 371-92.
Black, Dan A.; Kolesnikova, Natalia; Sanders, Seth and Taylor, Lowell J. “The Role of Location in EvaluatingRacial Wage Disparity.” Working Paper 2009-043B, Federal Reserve Bank of St. Louis, September 2009,revised July 2010; http://research.stlouisfed.org/wp/2009/2009-043.pdf.
Black, Dan A.; McKinnish, Terra G. and Sanders, Seth G. “Does the Availability of High-Wage Jobs for Low-Skilled Men Affect Welfare Expenditures? Evidence from Shocks to the Steel and Coal Industries.” Journal ofPublic Economics, September 2003, 87(9-10), pp. 1921-42.
Calvó-Armengol, Antoni and Jackson, Matthew O. “The Effects of Social Networks on Employment andInequality.” American Economic Review, June 2004, 94(3), pp. 426-54.
Charles, Kerwin Kofi and Luoh, Ming Ching. “Male Incarceration, the Marriage Market and Female Outcomes.”Forthcoming in Review of Economics and Statistics.
Duncan, Greg J. and Hoffman, Saul D. “Welfare Benefits, Economic Opportunities, and Out-of- Wedlock Birthsamong Black Teenage Girls.” Demography, November 1990, 27(4), pp. 519-35.
Holzer, Harry J. “Informal Job Search and Black Youth Unemployment.” American Economic Review, June 1987,77(3), pp. 446-52.
Lichter, Daniel T.; LeClere, Felicia B. and McLaughlin, Diane K. “Local Marriage Markets and the MaritalBehavior of Black and White Women.” American Journal of Sociology, January 1991, 96(4), pp. 843-67.
Moffitt, Robert A. “The Effect of Welfare on Marriage and Fertility: What Do We Know and What Do We Needto Know?” Discussion Paper No. 1153-97, Institute for Research on Poverty, December 1997;www.irp.wisc.edu/publications/dps/pdfs/dp115397.pdf.
Neal, Derek. “Why Has Black-White Skill Convergence Stopped?” in Eric Hanushek and Finis Welch, eds.,Handbook of the Economics of Education. Volume 1. Chap. 9. New York: Elsevier, 2006, pp. 511-78.
Neal, Derek. “Black-White Labour Market Inequality in the United States,” in Steven N. Durlauf and Lawrence E.Blume, eds., New Palgrave Dictionary of Economics. Second Edition. Hampshire, UK: Palgrave Macmillan, 2008.
Real Estate Center, Texas A&M University. Metropolitan Population Data: Population and Household Data, U.S.Metropolitan Statistical Areas, MSA (1999 definition), 1970-present; http://recenter.tamu.edu/data/popm/.
Ruggles, Steven; Alexander, J. Trent; Genadek, Katie; Goeken, Ronald; Schroeder, Matthew B. and Sobek,Matthew. Integrated Public Use Microdata Series: Version 5.0 [Machine-readable database]. Minneapolis:University of Minnesota, 2010.
U.S. Census Bureau. Population Estimates Archives; www.census.gov/popest/archives/.
Western, Bruce. Punishment and Inequality in America. New York: Russell Sage Foundation, 2006.
Black, Kolesnikova, Taylor
FEDERAL RESERVE BANK OF ST. LOUIS REVIEW SEPTEMBER/OCTOBER 2010 377

APPENDIX 1: DATA AND VARIABLES DESCRIPTION
Individual-level U.S. Census data were provided by the Integrated Public Use Microdata Series (IPUMS).See Ruggles et al. (2010).
Educational Attainment
The five education categories are did not finish high school; high school diploma (or GED); some collegebut no bachelor’s degree; bachelor’s degree; and higher than a bachelor’s degree.
Employment Status
The three employment status categories are has a job, unemployed, and not in the labor force.
Industry Variables
Because of the relatively small size of the sample, it was necessary to combine Census-defined industriesand occupations into larger groups. For consistency, the 1990 Census Bureau industrial classificationscheme is used for all years. First, 11 industry categories were generated according to the Departmentof Labor’s Standard Industrial Classification code: agriculture, forestry, and fishing; mining; construc-tion; manufacturing; transportation, communications, and utility; wholesale trade; retail trade; finance,insurance, and real estate; service; public administration; and other. “Other” represents military per-sonnel, temporary unemployed workers, and people with missing information. Then, wholesale tradeand retail trade were combined into a category called “sales.” Since only a very small fraction of peopleliving in urban areas are employed in either agriculture, forestry, and fishing or mining, these two cate-gories were combined with the “other” category. In the end, there are eight industrial categories.
Marital Status
The three marital status categories are married; separated, divorced, or widowed; and never married.
Non-Migrant Indicator
The non-migrant indicator variable was set equal to 1 if a person satisfied one of the following: bornin Georgia and lives in Atlanta; born in Maryland and lives in Baltimore; born in Illinois and lives inChicago; born in Ohio and lives in Cleveland; born in Michigan and lives in Detroit; born in Texas andlives in Houston; born in California and lives in Los Angeles; born in Tennessee and lives in Memphis;born in Mississippi and lives in Memphis; born in Louisiana and lives in New Orleans; born in New Yorkand lives in New York; born in Pennsylvania and lives in Philadelphia; born in New Jersey and livesin Philadelphia; born in Missouri and lives in St. Louis; born in California and lives in San Francisco;born in Washington, D.C., and lives in Washington, D.C.; born in Maryland and lives in Washington, D.C.;and born in Virginia and lives in Washington, D.C. The indicator was set to 0 for all other persons.
MSA Population
MSA population data for 1970, 1980, 1990, and 1999 were downloaded from the Population database,Real Estate Center at Texas A&M University and calculated based on U.S. Census data (http://recenter.tamu.edu/data/popm/). For consistency, the 1999 definition of MSAs was used.
MSA Black Population
County-level black population data for 1970, 1980, 1990, and 2000 were downloaded from thePopulation Estimates Archives, U.S. Census Bureau and aggregated into MSA-level data according to1999 MSA definitions (www.census.gov/popest/archives/).
Black, Kolesnikova, Taylor
378 SEPTEMBER/OCTOBER 2010 FEDERAL RESERVE BANK OF ST. LOUIS REVIEW

APPENDIX 2: ESTIMATION
Black-White Annual Earnings Gap
A simple matching estimator was used to calculate for each metropolitan area j the black-to-whiteratio of annual earnings. Intuitively, black men were “matched” with white men based on their age andeducation. More precisely, let b index black individuals and wwhite individuals, and let xi be the age-education combination of individual i—for example, “31-year-old man with a high school diploma.”Let yi be the annual earnings of individual i, and E�y{b,i} �x� the expected value of the annual earningsof that (black) individual given that his age-education combination is x. There are four education cate-gories (see Appendix 1) and six age intervals: 25 to 30, 31 to 35, 36 to 40, 41 to 45, 46 to 50, and 51 to55 years old.
Our interest then is in
where fb�x� is the p.d.f. of age-education combinations among black workers in all cities. The equationis then directly estimated for each city by calculating the conditional means at each point in the distri-bution of covariates and then taking a weighted average. Observations with zero values are includedin the calculations.
Average Annual Weeks and Average Weekly Hours of Work
One of the limitations of the data is that the 1970 Census asked respondents to select only amongintervals of weeks and hours of work. Black et al. (2009) compute the average weeks and hours of workfor those in the corresponding interval using 1980 Census data. In this paper, the values from Black et al.(2009) were used to make imputations for nonzero categories as follows:
Then, for each city, the weighted-average annual weeks and weekly hours of work were calculatedconditional on age and education. The distribution of the age-education combinations across all citieswas used for weighting. Observations with zero values are included in the calculations.
RatioE y x
E y xj x
j b i
j w i
= =( )( )
={ }
{ }∑ 25
55 ,
,
ffb x( ),
Black, Kolesnikova, Taylor
FEDERAL RESERVE BANK OF ST. LOUIS REVIEW SEPTEMBER/OCTOBER 2010 379
Interval Imputed weeks Interval Imputed hours
1-13 weeks 1.1 1-14 hours 8.57
14-26 weeks 21.4 15-29 hours 21.95
27-39 weeks 33.3 30-34 hours 30.64
40-47 weeks 43.4 35-39 36.35
48-49 weeks 48.3 40 hours 40
50-52 weeks 51.8 41-48 hours 45.46
49-59 hours 51.41
60 or more hours 67.02

380 SEPTEMBER/OCTOBER 2010 FEDERAL RESERVE BANK OF ST. LOUIS REVIEW