The Economic Impact of Tourism in Wisconsin
29
April 2012 The Economic Impact of Tourism in Wisconsin
Transcript of The Economic Impact of Tourism in Wisconsin

April 2012
The Economic Impact of Tourism in Wisconsin

State Overview

3
Key themes for 2011
The Wisconsin tourism recovery accelerated in 2011 with a
7.6% rise in visitor spending after a 7.9% increase in 2010.
■ Visitor volumes rose for a second straight year, 95.4 million
people visited Wisconsin in 2011.
■ Growth in overnight visitation remains strong. Domestic overnight
visitation grew 3.7% buoyed by strong room demand growth of
3.6% in 2011.
■ Per trip spending rose as gas prices rose and other tourism
providers start to recoup recessionary price cuts.
Visitor spending of $10 billion generated $16 billion in total
business sales in 2011 as tourism dollars flowed through the
Wisconsin economy.

4
Key results
The visitor economy represents a significant source of
business sales, employment, and taxes in Wisconsin.
Total tourism business sales of $16.0 billion in 2011
sustained 181,000 jobs, both directly and indirectly.
These jobs represent 7.8% of total employment in Wisconsin;
1 in every 13 jobs in the state is sustained by tourism activity.
Including indirect and induced impacts, tourism in Wisconsin
generated $1.3 billion in state and local taxes and $950
million in Federal taxes last year.
In the absence of the state and local taxes generated by
tourism, each Wisconsin household would need to pay $565
to maintain the current level of government services.

Visitor Spending

6
A recovery in visitor spending
Wisconsin visitor
spending reached
$10 billion in 2011,
posting 7.6%
growth after a 7.9%
increase in 2010.
More overnight
stays along with
higher prices
pushed
accommodations
spending up 7.8%
in 2011.
Sector 2009 2010 2011 % Change
Lodging $2,147 $2,380 $2,564 7.8%
Other Transport $834 $957 $1,057 10.4%
Air $384 $388 $405 4.3%
Food & bev. $2,146 $2,252 $2,447 8.7%
Retail $1,850 $2,065 $2,200 6.5%
Recreation $1,162 $1,155 $1,225 6.1%
TOTAL $8,522 $9,197 $9,898 7.6%
Visitor Spending (US$ Million)
$8.5
$9.2
$9.9
$7.5
$8.0
$8.5
$9.0
$9.5
$10.0
$10.5
2009 2010 2011
Visitor Spending
US$ Billions

7
Visitor spending by sector
Visitors spent $2.4 billion
on food & beverages and
$1.9 billion in the lodging
sector last year. The retail
sector received $2.2 billion
from visitors.
In 2011, visitor spending
increased 8.7% on food
and beverage, 6.5% on
shopping, and 7.8% on
lodging.
2,447
2,200
1,184
1,461
569
1,995
0
500
1,000
1,500
2,000
2,500
3,000
Lodgin
g
2nd H
om
e
Renta
l
Food &
bev.
Reta
il
Recre
ation
Tra
nsport
ation
2010 2011
$ Million, 2011 values shown

8
Visitor spending by sector
Strong growth in overnight
stays along with increasing
room rates increased the
share of spending on
accommodations to 26%.
Food & beverage spending
ranks second, capturing a
quarter of visitor spending.,
followed by retail at 22%.
Higher gas prices in 2011
increased the transportation
share of tourism spending
up to 11%.
Other
Transport
11%
Air
4%
Retail
22%
Recreation
12%
Food & bev.
25%
Lodging
26%
Visitor Spending by Sector

9
Visitor spending by sector
$2.1 $2.4 $2.6
$0.8$1.0 $1.1$0.4$0.4
$0.4$2.1
$2.3$2.4
$1.8$2.1
$2.2$1.2
$1.2$1.2
$0
$2
$4
$6
$8
$10
$12
2009 2010 2011
Recreation
Retail
Food & bev.
Air
Other Transport
Lodging
Wisconsin's Visitor Spending by Year, Billions of $
Wisconsin’s
robust recovery
continued in 2011
across all tourism
sub-sectors.
Lodging sales
have increased
18% from the low
seen in 2009.

10
Visitor spending by market segment
Leisure tourism represents 88% of visitor spending in Wisconsin.
Overnight visitors spend $6.9 billion in Wisconsin, 70% of the total.
International visitors to Wisconsin spent $0.6 billion in 2011, 6% of all visitor
spending.
Business $1.2 Day $3.0 Domestic $9.3
Leisure $8.7 Overnight $6.9 Overseas $0.5
Canada $0.1
Total $9.9 Total $9.9 Total $9.9
Business 12.1% Day 30.1% Domestic 94.1%
Leisure 87.9% Overnight 69.9% Overseas 5.2%
Canada 0.7%
Stay Market
Share
Purpose Stay Market
Visitor Spending in 2011(US$ Billion)
Purpose

11
Visitor spending by market segment
30.1%
94.1%
87.9%
69.9%
5.2%
12.1%
0.7%
0%
10%
20%
30%
40%
50%
60%
70%
80%
90%
100%
Purpose Stay Market
Pe
rce
nta
ge
dis
trib
utio
n
Leisure
Day
Overnight
Overseas
Domestic
Business
Canada
Source : Tourism Economics

State Tourism Impacts

13
How visitor spending generates impact
• Lastly, the induced impact is
generated when employees
whose incomes are generated
either directly or indirectly by
tourism, spend those incomes
in the state economy.
• Travelers create direct economic value within a discreet group of sectors (e.g. recreation,
transportation). This supports a relative proportion of jobs, wages, taxes, and GDP within each
sector.
• Each directly affected sector also purchases goods and services as inputs (e.g. food
wholesalers, utilities) into production. These impacts are called indirect impacts.

14
Tourism sales by industry
Business Day
Direct Indirect Induced Total
Agriculture, Fishing, Mining - 29.6 22.6 52.2
Construction and Utilities - 244.4 91.1 335.5
Manufacturing - 419.2 222.0 641.3
Wholesale Trade - 92.5 139.2 231.6
Air Transport 404.6 3.5 5.7 413.7
Other Transport 367.6 133 54 554.3
Retail Trade 2,200.0 14.0 258.7 2,472.7
Gasoline Stations 689.3 1.2 17.8 708.2
Communications - 227.6 112.1 339.7
Finance, Insurance and Real Estate 569.3 628.3 1,004.3 2,201.8
Business Services 61.3 666.0 208.1 935.3
Education and Health Care - 5.3 643.2 648.5
Recreation and Entertainment 1,004.5 54.8 36.1 1,095.4
Lodging 1,995.0 2.4 2.0 1,999.4
Food & Beverage 2,447.2 112.6 211.0 2,770.8
Personal Services 159.3 106.5 153.3 419.1
Government - 128.4 73.2 201.6
TOTAL 9,897.8 2,869.5 3,253.9 16,021.2
Tourism Sales
(US$ Million)
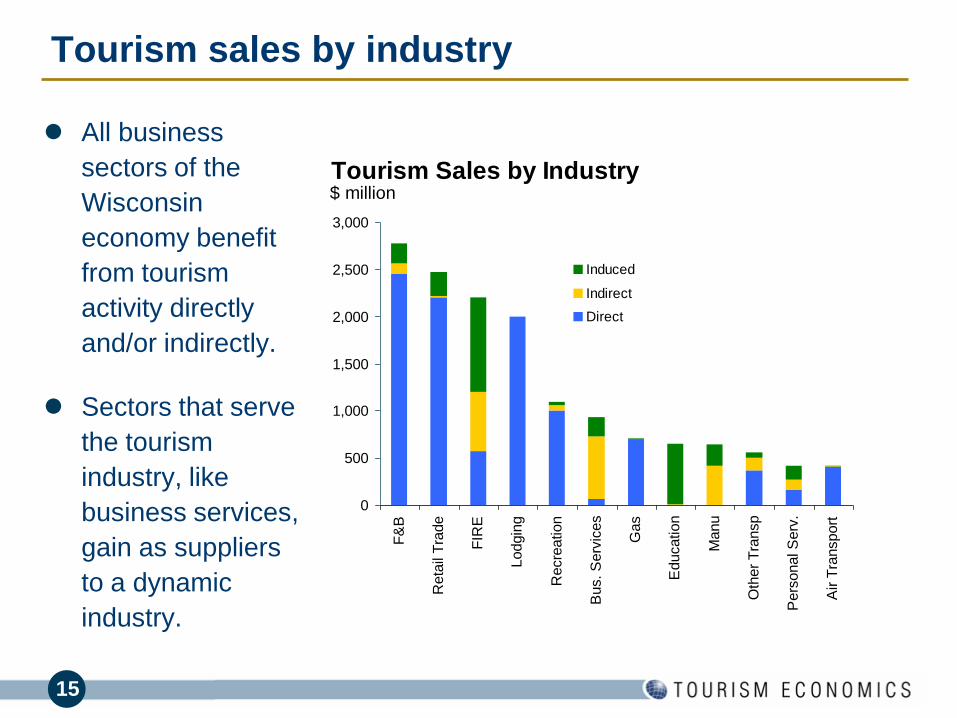
15
All business
sectors of the
Wisconsin
economy benefit
from tourism
activity directly
and/or indirectly.
Sectors that serve
the tourism
industry, like
business services,
gain as suppliers
to a dynamic
industry.
Tourism sales by industry
0
500
1,000
1,500
2,000
2,500
3,000
F&
B
Reta
il T
rade
FIR
E
Lodgin
g
Recre
ation
Bus. S
erv
ices
Gas
Education
Manu
Oth
er
Tra
nsp
Pers
onal S
erv
.
Air T
ransport
Induced
Indirect
Direct
Tourism Sales by Industry$ million

16
Total tourism employment
The tourism sector directly and indirectly supported 181,374 jobs, or 7.8% of all
employment in Wisconsin last year.
Direct Indirect Induced Total
Agriculture, Fishing, Mining - 283 198 481
Construction and Utilities - 921 311 1,233
Manufacturing - 1,247 522 1,769
Wholesale Trade - 592 892 1,484
Air Transport 1,812 16 26 1,855
Other Transport 2,194 1,485 611 4,290
Retail Trade 15,473 226 4,249 19,947
Gasoline Stations 1,591 20 292 1,903
Communications - 1,013 422 1,435
Finance, Insurance and Real Estate 3,392 4,135 4,008 11,536
Business Services 436 7,758 2,511 10,705
Education and Health Care - 82 6,962 7,044
Recreation and Entertainment 23,532 1,234 881 25,648
Lodging 31,865 43 37 31,945
Food & Beverage 45,946 2,375 4,423 52,743
Personal Services 2,353 1,316 2,397 6,066
Government - 925 366 1,291
TOTAL 128,594 23,672 29,108 181,374
Tourism Employment

17
Total tourism employment
Tourism is an
employment
intensive industry
with particularly
high job creation
in the restaurant,
hotel, and
recreation sectors.
Secondary
benefits are
realized across
the entire
economy through
the supply chain
and incomes as
they are spent.
Day 0
10
20
30
40
50
60
F&
B
Lodgin
g
Recre
ation
Reta
il T
rade
FIR
E
Bus. S
erv
ices
Education
Pers
onal S
erv
.
Oth
er
Tra
nsp
Gas
Air T
ransport
Manu
Th
ou
san
ds
Induced
Indirect
Direct
Tourism Employment by Industry
Significant indirect and induced benefits

18
Tourism employment intensity
Business Day
Tourism is a significant part of several industries – 92% of lodging, 35% of
recreation, and 22% of food & beverage employment is supported by tourism
spending.
22%
10%
35%
15%
4%
92%
0% 20% 40% 60% 80% 100%
Total
Food & bev.
Retail
Recreation
Transportation
Lodging
Tourism Employment Intensity by Industry

19
Tourism personal income
Business Day
Direct Indirect Induced Total
Agriculture, Fishing, Mining - 3.6 3.1 6.7
Construction and Utilities - 66.1 23.7 89.7
Manufacturing - 71.0 30.0 101.0
Wholesale Trade - 39.8 59.9 99.7
Air Transport 91.2 0.8 1.3 93.4
Other Transport 104.8 69.1 27.2 201.1
Retail Trade 322.7 6.2 112.6 441.5
Gasoline Stations 38.9 0.5 7.2 46.6
Communications - 51.1 23.2 74.2
Finance, Insurance and Real Estate 58.2 138.1 137.8 334.1
Business Services 19.4 342.5 110.8 472.8
Education and Health Care - 2.8 349.1 352.0
Recreation and Entertainment 400.1 22.9 14.7 437.7
Lodging 560.8 0.6 0.5 562.0
Food & Beverage 698.0 35.9 75.5 809.4
Personal Services 74.9 55.3 68.7 198.8
Government - 72.0 25.7 97.7
TOTAL 2,369.1 978.4 1,071.1 4,418.5
Tourism Labor Income (Compensation)
(US$ Million)

20
Tourism personal income
The larger
employment
numbers in F&B and
recreations support
significant labor
income in those
industries.
Business services
and the FIRE
(finance, insurance
and real estate)
sectors depend on
tourism activity as
suppliers to tourism
companies and their
employees.
Day 0
100
200
300
400
500
600
700
800
900
F&
B
Lo
dg
ing
Bu
s.
Se
rvic
es
Re
tail
Tra
de
Re
cre
atio
n
Ed
uca
tio
n
FIR
E
Oth
er
Tra
nsp
Pe
rso
na
l S
erv
.
Ma
nu
Wh
ole
sa
le T
r.
Go
v.
Induced
Indirect
Direct
Tourism Labor Income by Industry$ million
Significant indirect and induced benefits

21
Tourism tax generation
Taxes of $2.2 billion were
directly and indirectly
generated by tourism in
2011.
State and local taxes
alone tallied $1.3 billion.
Each household in
Wisconsin would need to
be taxed an additional
$565 per year to replace
the tourism taxes received
by state and local
governments.
Business Day
Tax Type 2010 2011
Federal Taxes Subtotal 917.6 951.7
Corporate 81.9 87.4
Indirect Business 104.8 112.0
Personal Income 212.6 218.9
Social Security 518.2 533.5
State and Local Taxes Subtotal 1,202.1 1,270.9
Corporate 113.2 120.9
Personal Income 101.9 104.9
Sales 425.3 453.1
Bed 72.7 77.3
Property 370.9 391.7
Excise and Fees 108.5 113.1
State Unemployment 9.6 9.9
TOTAL 2,119.6 2,222.6
Traveler Generated Taxes
(US$ Million)

Methodology and Background

23
By monitoring tourism’s economic impact, policy makers
can make informed decisions regarding the funding and
prioritization of tourism development.
It can also carefully monitor its successes and future
needs.
In order to do this, tourism must be measured in the
same categories as other economic sectors – i.e. tax
generation, employment, wages, and gross domestic
product.
Why quantify the tourism economy?

24
Why is this a challenge?
Most economic sectors such as financial services,
insurance, or construction are easily defined within a
country’s national accounts statistics.
Tourism is not so easily measured because it is not a
single industry. It is a demand-side activity which affects
multiple sectors to various degrees.
Tourism spans nearly a dozen sectors including lodging,
recreation, retail, real estate, air passenger transport, food
& beverage, car rental, taxi services, travel agents…

25
• Domestic visitor expenditure estimates are provided by Longwoods International’s
representative survey of US travelers. These are broken out by sectors (lodging,
transport at destination, food & beverage, retail, and recreation), by purpose
(business and leisure), and by length of stay (day and overnight).
• Tourism Economics then adjusts these levels of spending based on a range of
known measures of tourism activity:
• Overseas visitor spending (source: OTTI, TE)
• Canada visitor spending (source: Statistics Canada, TE)
• Bed tax receipts
• Spending on air travel which accrues to all airports and locally-based airlines
• Gasoline purchases by visitors (source: TE calculation)
• Smith Travel Research data on hotel revenues
• Construction Value by McGraw-Hill Construction
• Industry data on employment, wages, GDP, and sales (source: BEA, BLS,
Census)
Methods and data sources

26
• An IMPLAN model was compiled for the State of Wisconsin. This traces
the flow of visitor-related expenditures through the local economy and
their effects on employment, wages, and taxes. IMPLAN also quantifies
the indirect (supplier) and induced (income) impacts of tourism.
• All results are benchmarked and cross-checked and adjusted based on
the following:
• US Bureau of Labor Statistics and Bureau of Economic Analysis
(employment and wages by industry)
• US Census (business sales by industry)
• The source of the employment and wage data is the Regional Economic
Information System (REIS), Bureau of Economic Analysis, U.S.
Department of Commerce. All employment rankings are based on Bureau
of Labor Statistics (ES202/QCEW) data.
Methods and data sources

27
Selected recent economic impact clients
Cities
Baltimore, MD
Columbus, OH
Kansas City, MO
London, United Kingdom
New York City
Omaha, NE
Orlando, FL
Philadelphia, PA
Pittsburgh, PA
Rockford, IL
Countries / Provinces
Bahamas
Bermuda
Cayman Islands
Dubai
Ontario Canada
St. Lucia
United Kingdom
Associations / Companies
Center for Exhibition Industry
Research (Economic Impact
of Visa Restrictions)
DMAI (Event Impact
Calculator for 80 CVBs)
US Travel Association (Impact
of travel promotion)
InterContinental Hotels
States
California
Georgia
Maryland
New York
North Carolina
Ohio
Pennsylvania
Wisconsin

28
About Tourism Economics
Tourism Economics, headquartered in Philadelphia, is an Oxford Economics
company dedicated to providing high value, robust, and relevant analyses of the
tourism sector that reflects the dynamics of local and global economies. By
combining quantitative methods with industry knowledge, Tourism Economics
designs custom market strategies, project feasibility analysis, tourism forecasting
models, tourism policy analysis, and economic impact studies.
Our staff have worked with over 100 destinations to quantify the economic value
of tourism, forecast demand, guide strategy, or evaluate tourism policies.
Oxford Economics is one of the world’s leading providers of economic analysis,
forecasts and consulting advice. Founded in 1981 as a joint venture with Oxford
University’s business college, Oxford Economics is founded on a reputation for
high quality, quantitative analysis and evidence-based advice. For this, it draws
on its own staff of 40 highly-experienced professional economists; a dedicated
data analysis team; global modeling tools; close links with Oxford University, and
a range of partner institutions in Europe, the US and in the United Nations
Project Link.
For more information: [email protected].

29
For more information:
Adam Sacks, President
Christopher Pike, Senior Economist