The Economic Impact of the Trans-Adriatic Pipeline on Albania · PDF fileThe Economic Impact...
28
The Economic Impact of the Trans-Adriatic Pipeline on Albania A report for TAP AG A report TAP AG
-
Upload
doannguyet -
Category
Documents
-
view
221 -
download
4
Transcript of The Economic Impact of the Trans-Adriatic Pipeline on Albania · PDF fileThe Economic Impact...
The Economic Impact of the Trans-Adriatic Pipeline on Albania
A report for TAP AG
A report TAP AG
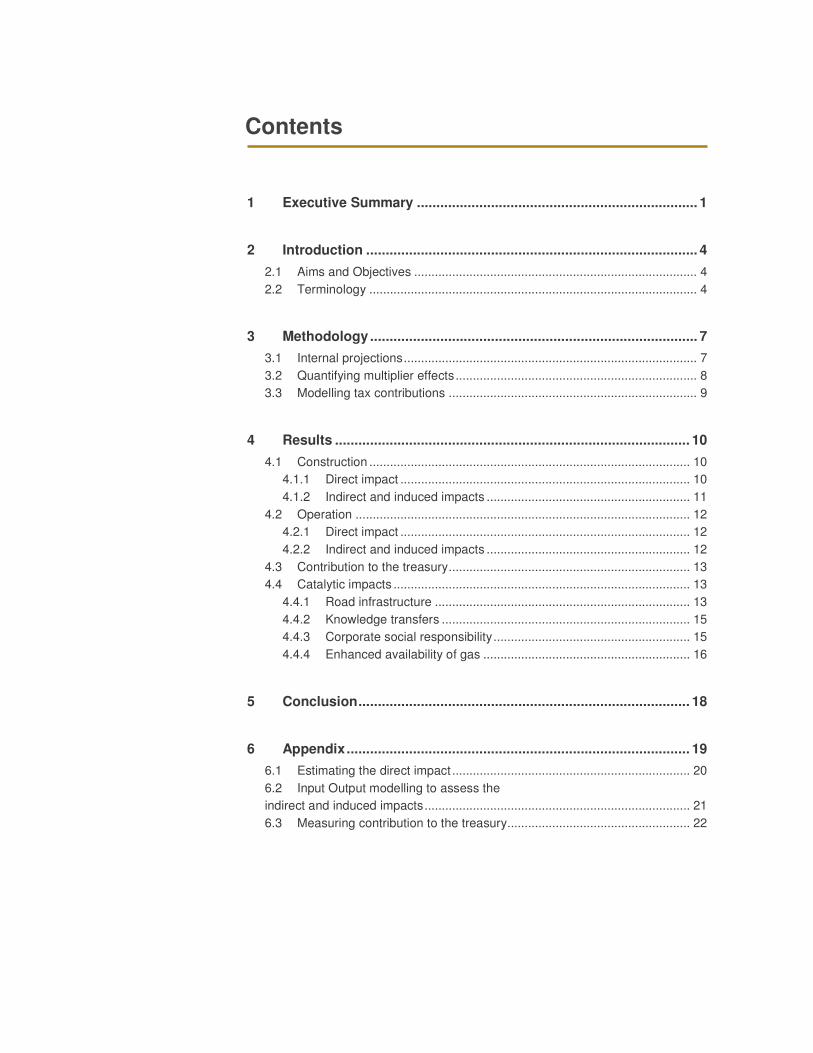
Contents
1 Executive Summary ........................................................................ 1
2 Introduction ..................................................................................... 4
2.1 Aims and Objectives .................................................................................. 4 2.2 Terminology ............................................................................................... 4
3 Methodology .................................................................................... 7
3.1 Internal projections ..................................................................................... 7 3.2 Quantifying multiplier effects ...................................................................... 8 3.3 Modelling tax contributions ........................................................................ 9
4 Results ........................................................................................... 10
4.1 Construction ............................................................................................. 10 4.1.1 Direct impact .................................................................................... 10 4.1.2 Indirect and induced impacts ........................................................... 11
4.2 Operation ................................................................................................. 12 4.2.1 Direct impact .................................................................................... 12 4.2.2 Indirect and induced impacts ........................................................... 12
4.3 Contribution to the treasury ...................................................................... 13 4.4 Catalytic impacts ...................................................................................... 13
4.4.1 Road infrastructure .......................................................................... 13 4.4.2 Knowledge transfers ........................................................................ 15 4.4.3 Corporate social responsibility ......................................................... 15 4.4.4 Enhanced availability of gas ............................................................ 16
5 Conclusion ..................................................................................... 18
6 Appendix ........................................................................................ 19
6.1 Estimating the direct impact ..................................................................... 20 6.2 Input Output modelling to assess the
indirect and induced impacts ............................................................................. 21 6.3 Measuring contribution to the treasury ..................................................... 22
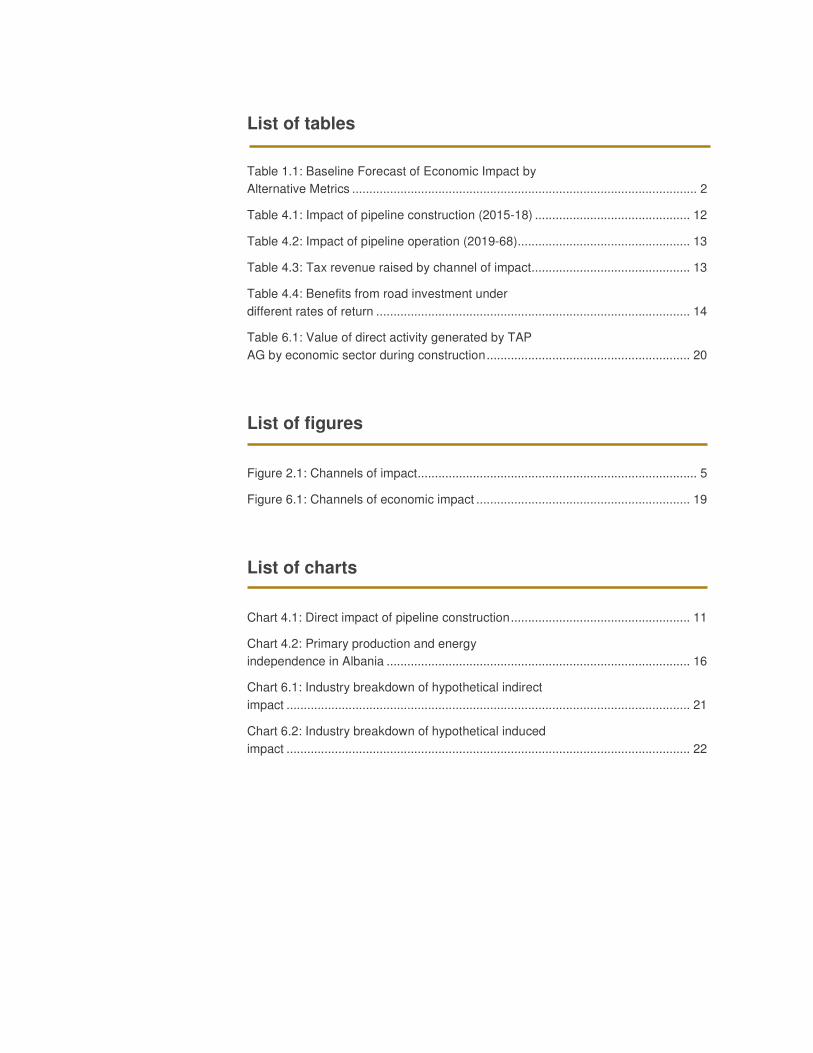
List of tables
Table 1.1: Baseline Forecast of Economic Impact by
Alternative Metrics .................................................................................................... 2
Table 4.1: Impact of pipeline construction (2015-18) ............................................. 12
Table 4.2: Impact of pipeline operation (2019-68).................................................. 13
Table 4.3: Tax revenue raised by channel of impact .............................................. 13
Table 4.4: Benefits from road investment under
different rates of return ........................................................................................... 14
Table 6.1: Value of direct activity generated by TAP
AG by economic sector during construction ........................................................... 20
List of figures
Figure 2.1: Channels of impact ................................................................................. 5
Figure 6.1: Channels of economic impact .............................................................. 19
List of charts
Chart 4.1: Direct impact of pipeline construction .................................................... 11
Chart 4.2: Primary production and energy
independence in Albania ........................................................................................ 16
Chart 6.1: Industry breakdown of hypothetical indirect
impact ..................................................................................................................... 21
Chart 6.2: Industry breakdown of hypothetical induced
impact ..................................................................................................................... 22

The Economic Impact of the Trans Adriatic Pipeline on Albania A report for TAP AG
1
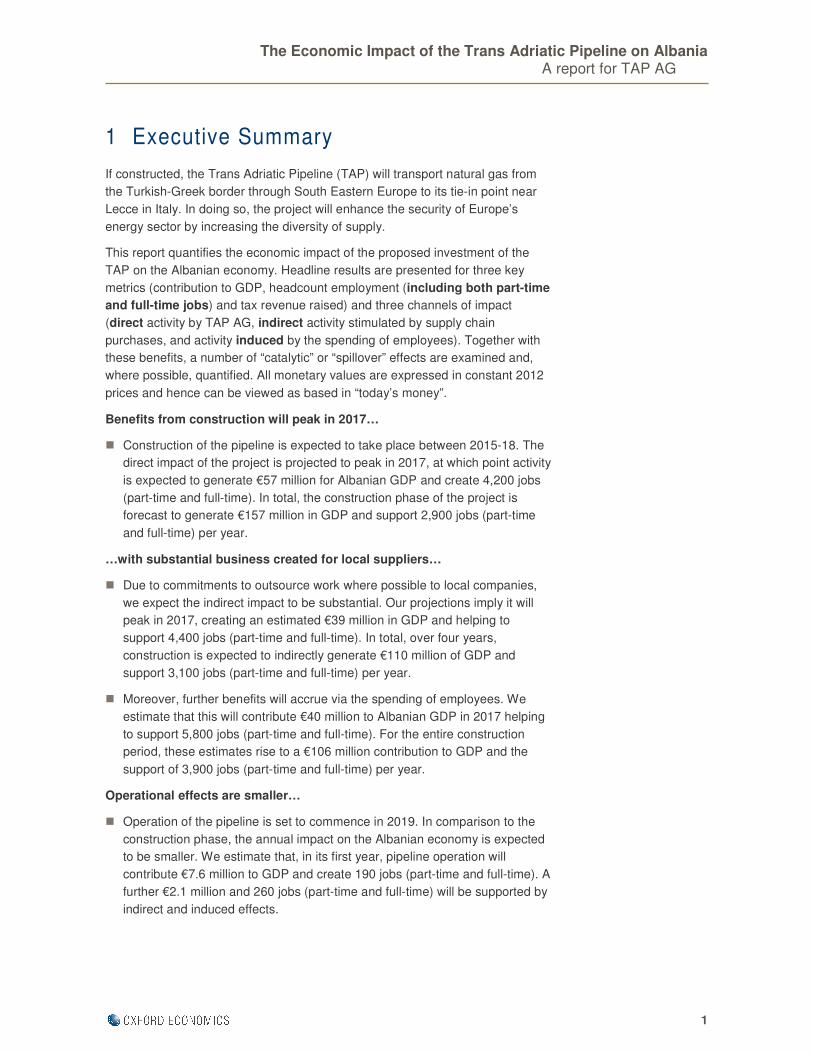
1 Executive Summary
If constructed, the Trans Adriatic Pipeline (TAP) will transport natural gas from
the Turkish-Greek border through South Eastern Europe to its tie-in point near
Lecce in Italy. In doing so, the project will enhance the security of Europe’s
energy sector by increasing the diversity of supply.
This report quantifies the economic impact of the proposed investment of the
TAP on the Albanian economy. Headline results are presented for three key
metrics (contribution to GDP, headcount employment (including both part-time
and full-time jobs) and tax revenue raised) and three channels of impact
(direct activity by TAP AG, indirect activity stimulated by supply chain
purchases, and activity induced by the spending of employees). Together with
these benefits, a number of “catalytic” or “spillover” effects are examined and,
where possible, quantified. All monetary values are expressed in constant 2012
prices and hence can be viewed as based in “today’s money”.
Benefits from construction will peak in 2017…
� Construction of the pipeline is expected to take place between 2015-18. The
direct impact of the project is projected to peak in 2017, at which point activity
is expected to generate €57 million for Albanian GDP and create 4,200 jobs
(part-time and full-time). In total, the construction phase of the project is
forecast to generate €157 million in GDP and support 2,900 jobs (part-time
and full-time) per year.
…with substantial business created for local suppliers…
� Due to commitments to outsource work where possible to local companies,
we expect the indirect impact to be substantial. Our projections imply it will
peak in 2017, creating an estimated €39 million in GDP and helping to
support 4,400 jobs (part-time and full-time). In total, over four years,
construction is expected to indirectly generate €110 million of GDP and
support 3,100 jobs (part-time and full-time) per year.
� Moreover, further benefits will accrue via the spending of employees. We
estimate that this will contribute €40 million to Albanian GDP in 2017 helping
to support 5,800 jobs (part-time and full-time). For the entire construction
period, these estimates rise to a €106 million contribution to GDP and the
support of 3,900 jobs (part-time and full-time) per year.
Operational effects are smaller…
� Operation of the pipeline is set to commence in 2019. In comparison to the
construction phase, the annual impact on the Albanian economy is expected
to be smaller. We estimate that, in its first year, pipeline operation will
contribute €7.6 million to GDP and create 190 jobs (part-time and full-time). A
further €2.1 million and 260 jobs (part-time and full-time) will be supported by
indirect and induced effects.
The Economic Impact of the Trans Adriatic Pipeline on Albania A report for TAP AG
2
…but will persist for 50 years
� These operational effects are scheduled to continue for 50 years, providing a
consistent boost to Albanian economic activity. In total, we estimate that the
project’s operational direct impact will contribute a cumulative €500 million to
Albanian GDP over the operational horizon. An additional €243 million and
will be supported via indirect and induced effects.
All this activity will boost the Albanian treasury
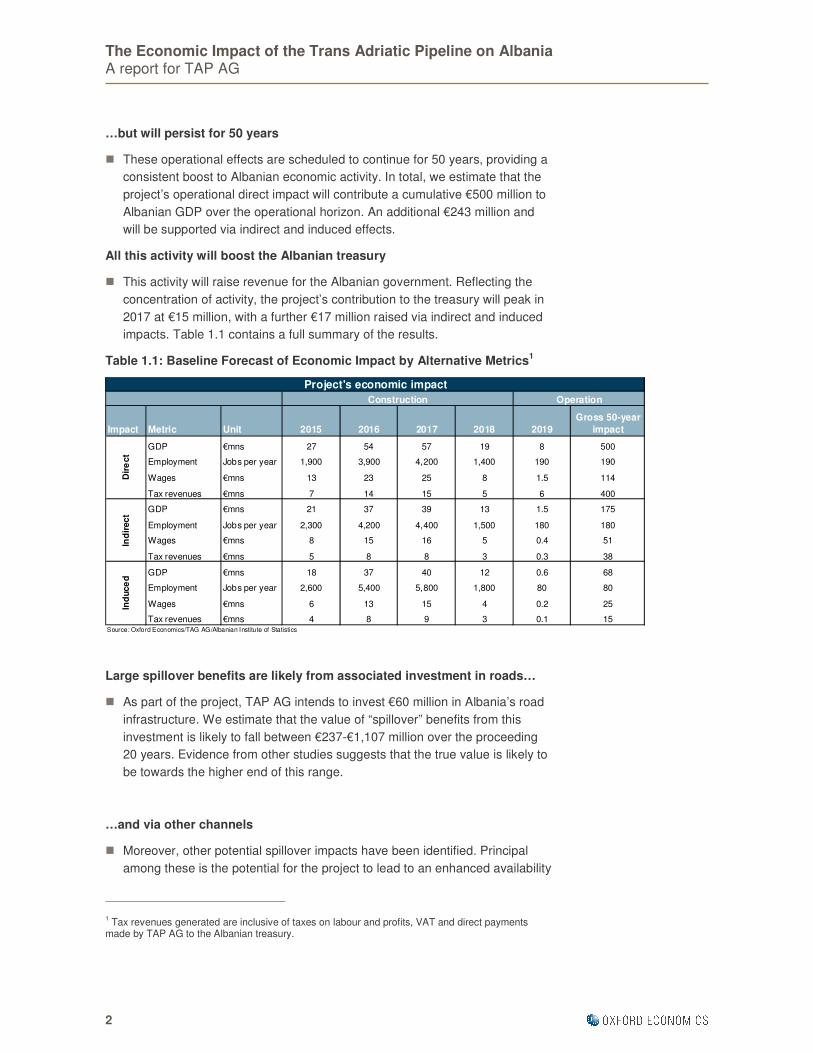
� This activity will raise revenue for the Albanian government. Reflecting the
concentration of activity, the project’s contribution to the treasury will peak in
2017 at €15 million, with a further €17 million raised via indirect and induced
impacts. Table 1.1 contains a full summary of the results.
Table 1.1: Baseline Forecast of Economic Impact by Alternative Metrics1
Large spillover benefits are likely from associated investment in roads…
� As part of the project, TAP AG intends to invest €60 million in Albania’s road
infrastructure. We estimate that the value of “spillover” benefits from this
investment is likely to fall between €237-€1,107 million over the proceeding
20 years. Evidence from other studies suggests that the true value is likely to
be towards the higher end of this range.
…and via other channels
� Moreover, other potential spillover impacts have been identified. Principal
among these is the potential for the project to lead to an enhanced availability
1 Tax revenues generated are inclusive of taxes on labour and profits, VAT and direct payments
made by TAP AG to the Albanian treasury.
Impact Metric Unit 2015 2016 2017 2018 2019
Gross 50-year
impact
GDP €mns 27 54 57 19 8 500
Employment Jobs per year 1,900 3,900 4,200 1,400 190 190
Wages €mns 13 23 25 8 1.5 114
Tax revenues €mns 7 14 15 5 6 400
GDP €mns 21 37 39 13 1.5 175
Employment Jobs per year 2,300 4,200 4,400 1,500 180 180
Wages €mns 8 15 16 5 0.4 51
Tax revenues €mns 5 8 8 3 0.3 38
GDP €mns 18 37 40 12 0.6 68
Employment Jobs per year 2,600 5,400 5,800 1,800 80 80
Wages €mns 6 13 15 4 0.2 25
Tax revenues €mns 4 8 9 3 0.1 15Source: Oxford Economics/TAG AG/Albanian Institute of Statistics
Project's economic impact
Dir
ect
Ind
irec
tIn
du
ce
d
OperationConstruction

The Economic Impact of the Trans Adriatic Pipeline on Albania A report for TAP AG
3
of natural gas, which could help to ease the projected future increase in
energy demand. Although, we have not attempted to formally quantify this
benefit, there are solid grounds for believing that it will be substantial.
The Economic Impact of the Trans Adriatic Pipeline on Albania A report for TAP AG
4
2 Introduction
This chapter will outline the aims and objectives of this report and define key
terms that are used throughout the study. This should provide the reader with an
indication of the framework of analysis, with additional detail, on the
methodology, data sources and assumptions used, provided in later chapters.
2.1 Aims and Objectives
The aim of this report is to provide a robust assessment of the overall economic
impact of the construction and operation of the TAP on the Albanian economy.
Construction of the pipeline is expected to occur between 2015-18, with impacts
estimated for each individual year. Operational activity is projected to continue
for the subsequent 50 years (2019-68). Estimates presented in the paper rely on
a combination of projected expenditure figures provided by TAP AG, quantified
in September 2012, and the deployment of official data. The quantitative results
of the impact study are all estimates and are not a confirmation of the final
figures that TAP’s investment will generate when in operation. For further details
on the methodological approach, see chapter 3 of this report, with additional
technical references provided in the Appendix (chapter 6).
2.2 Terminology
When reporting the results, the focus will be on three key metrics: contribution to
GDP, jobs created; and contribution to the treasury. More detail on each is
provided below:
� Contribution to GDP: captures the contribution to economy-wide output.
Technically, this study quantifies this impact in terms of firms’ Gross Value
Added (GVA)2. The GVA of a firm is approximately equal to the sum of its
gross wage bill and earnings before interest, tax and depreciation (EBITDA).
We use the terms interchangeably in the remainder of the report.
� Jobs (part-time and full-time): refers to jobs created as a result of the
economic activity analysed in this report. The number of jobs reported is on a
“headcount” basis and therefore includes both full-time and part-time roles.
When referring to employment impacts over a multi-year period, results are
presented on a per year basis.
� Contribution to the treasury: refers to revenue raised for the government
as a result of the economic activity analysed in this report. A range of taxes
2 Technically GVA is equal to GDP less taxes (net of subsidies) on products. In practice, the
discrepancy between the two is very small.
The Economic Impact of the Trans Adriatic Pipeline on Albania A report for TAP AG
5
are modelled including employee income tax liabilities, employee/employer
national insurance contributions, corporate tax receipts and VAT raised as a
result of purchases by consumers.
All monetary figures presented are in Euros at constant 2012 prices and
exchange rates. Hence they can viewed as based in “today’s money”.
Adjustments to account for both inflation and exchange rate movements are
based on in-house forecasts for the Albanian economy.
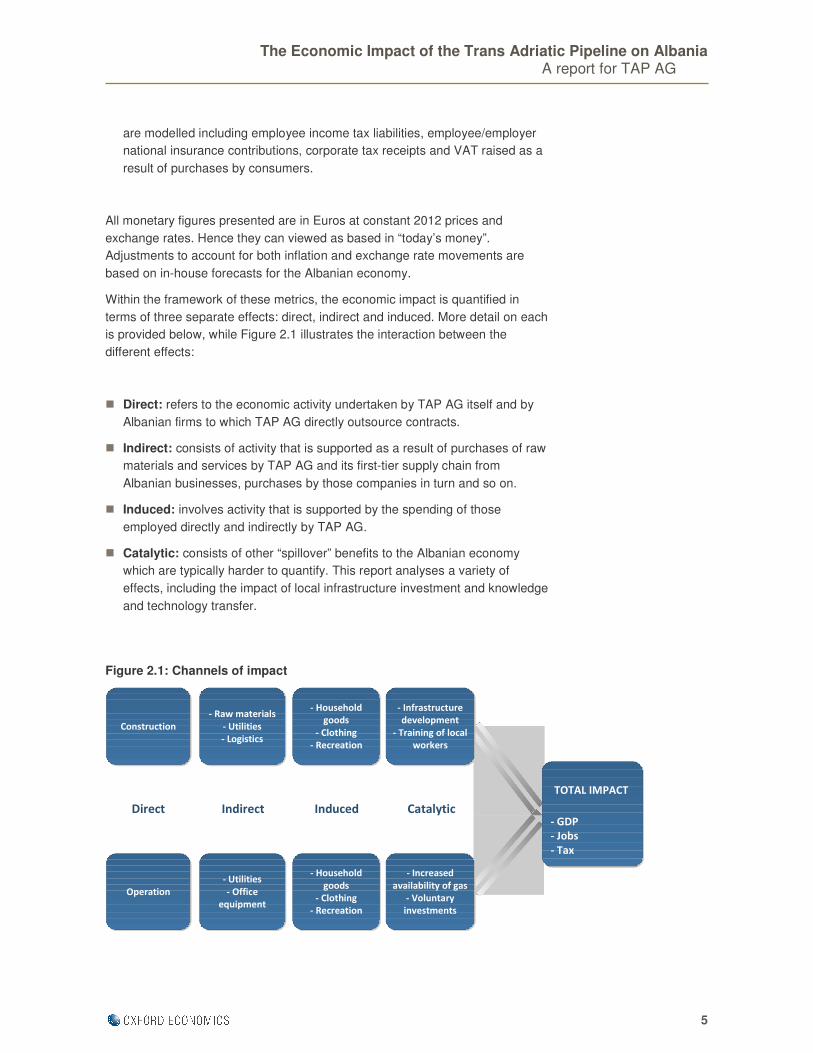
Within the framework of these metrics, the economic impact is quantified in
terms of three separate effects: direct, indirect and induced. More detail on each
is provided below, while Figure 2.1 illustrates the interaction between the
different effects:
� Direct: refers to the economic activity undertaken by TAP AG itself and by
Albanian firms to which TAP AG directly outsource contracts.
� Indirect: consists of activity that is supported as a result of purchases of raw
materials and services by TAP AG and its first-tier supply chain from
Albanian businesses, purchases by those companies in turn and so on.
� Induced: involves activity that is supported by the spending of those
employed directly and indirectly by TAP AG.
� Catalytic: consists of other “spillover” benefits to the Albanian economy
which are typically harder to quantify. This report analyses a variety of
effects, including the impact of local infrastructure investment and knowledge
and technology transfer.
Figure 2.1: Channels of impact
Direct Indirect Induced Catalytic
TOTAL IMPACT
- GDP
- Jobs
- Tax
Construction
- Raw materials
- Utilities
- Logistics
- Household
goods
- Clothing
- Recreation
Operation
- Household
goods
- Clothing
- Recreation
- Infrastructure
development
- Training of local
workers
- Increased
availability of gas
- Voluntary
investments
- Utilities
- Office
equipment
The Economic Impact of the Trans Adriatic Pipeline on Albania A report for TAP AG
6
The remainder of this report is structured as follows:
� Chapter 3 provides an overview of the methodology
� Chapter 4 quantifies the economic impact
� Chapter 5 concludes
� Chapter 6 contains an appendix, with additional more technical information
on the methodology
The Economic Impact of the Trans Adriatic Pipeline on Albania A report for TAP AG
7
3 Methodology
� The starting point for the analysis was to develop estimates of the direct
impact based on expenditure and employment projections supplied by
TAP AG. As the profits from the project will be repatriated abroad, they
were not included in our estimate of direct GDP. Monetary figures
supplied by TAP AG were in 2011 prices. Therefore, as impacts were
reported in constant 2012 prices, these figures were inflated using
forecasts for Albania from the Oxford Economics Global Macroeconomic
Model.
� In order to estimate the multiplier impacts (indirect and induced effects)
an Albanian input-output table was manipulated, based on data supplied
by the Global Trade Analysis Project (GTAP). Adjustments were made to
account for “leakage” i.e. the fact that TAP is planning to procure some
goods and services from foreign companies, activity which will not
contribute to Albanian GDP.
� When estimating the number of jobs (part-time and full-time) generated
by indirect and induced activity, adjustments were made to account for
productivity growth. This was based on economy-wide productivity growth
forecasts compiled by Oxford Economics.
� Other than direct payments to the government by TAP AG (which were
based on internal projections) all other tax modeling was based on ratios
of tax incidence and estimates of gross wages and profits derived as part
of the main analysis.
This chapter provides a methodological overview with detail provided on data
sources, assumptions used, modelling techniques etc. Further detail on selected
issues can be found in the Appendix.
3.1 Internal projections
The starting point for the analysis was to develop estimates of the direct impact
based on expenditure and employment forecasts supplied by TAP AG. For the
construction phase of the project it is estimated that total expenditure will
amount to around €1 billion, of which just under €400 million is expected to be
spent on procuring locally-produced goods and services and employing locally-
based workers. Construction is expected to occur over a four-year period (2015-
18) with the split of expenditure by year as follows: 2015 (12.5%); 2016 (36%);
2017 (41%); 2018 (10.5%)3. For the operational phase of the project, we have
3 The exceptions to this were for the €28 million of direct operational expenditure by TAP AG which
was assumed to be split according to the following pattern over the 2015-18 period (15%, 30%, 30%, 25%) and the road infrastructure spending which was more front loaded (50%, 25%, 12.5%, 12.5%).
The Economic Impact of the Trans Adriatic Pipeline on Albania A report for TAP AG
8
assumed that profits from the project are repatriated outside of Albania and
hence the direct contribution to Albanian GDP amounted to the gross wages of
employees.
3.2 Quantifying multiplier effects
An input output (IO) table for 2000, sourced from the GTAP4, was used to
quantify the multiplier impacts (indirect and induced effects). An IO table
contains data on inter-sectoral purchases in an economy. In essence, it
quantifies who buys what and from whom. By appropriately manipulating the IO
table it is possible to estimate the extent to which a given purchase will generate
demand for other sectors. As the IO table also incorporates the household
sector, it is also possible to quantify the induced impact. When doing so,
estimates were scaled down based on the fact that households do not spend
100% of their gross income on average (as is implicitly assumed by the IO
table). Part of household income is taxed, thereby generating revenue for the
Exchequer, and some of it is saved. Without this adjustment, the results
presented in this report would overestimate the likely induced impact.
We “shocked”5 the IO table using the level of locally outsourced expenditure
(that part of outsourcing which generated business for Albanian firms).
Expenditure was allocated to different sectors of the input output table according
to the nature of the purchase e.g. spending on legal, accountancy and
consulting services was allocated to the business services sector6. In doing so,
we were able to quantify the total demand that would be created for the Albanian
economy as a result of TAP AG’s outsourcing. We then estimated the level of
GVA that would be generated as a result, using sectoral ratios of GVA to gross
output (sourced from the IO table).
Finally, the number of jobs (part-time and full-time), supported by this activity,
was calculated by applying relevant estimates of sectoral labour productivity7.
This process was repeated for each year8. Adjustment was made to account for
productivity growth over time. Due to technological progress and capital
investment a given level of GDP tends to support fewer jobs (part-time and full-
4 The GTAP is a network of researchers and policy makers conducting quantitative analysis of
international policy issues, coordinated in Purdue University’s Department of Agricultural Economics. The IO table itself was developed by Mark Horridge, and we are grateful for his assistance in obtaining the data.
5 “Shocking” the IO model simulates the effect of a given level of purchases in a specific sector on
the wider economy. It is used to calculate the indirect and induced impacts.
6 A full breakdown of the allocation of expenditure to different sectors is provided in Table 6.1.
7 Sectoral productivity data were sourced from “Results on Structural Survey of Economic
Enterprises”, 2010, Albania Institute of Statistics
8 In doing so we are implicitly assuming that the structure of the Albanian economy remains
unchanged over the forecast horizon. Clearly, this will not hold in practice. However, it is very difficult to forecast such structural change with any degree of precision.
The Economic Impact of the Trans Adriatic Pipeline on Albania A report for TAP AG
9
time) over time. Therefore, we grew forward current levels of labour productivity
using own in-house forecast for the Albanian economy.
3.3 Modelling tax contributions
Such activity raises revenue for the government which is used to fund spending
on public services, welfare and other functions. In this report, this effect was
modelled in terms of four distinct channels: income tax raised on employee’s
earnings; corporation tax levied on companies’ profits; social security
contributions of both employers and employees; and VAT revenues raised as a
result of the spending of employees.
Methodologically, estimates of revenue generated were quantified by applying
economy-wide ratios of tax incidence to our estimates of gross profits and
wages. The exception to this was for direct payments to the Albanian treasury by
TAP AG, where we used internal projections. In all the remaining instances the
former approach was used.
For income tax we assumed that 10% of employees’ gross earnings would be
collected by Exchequer9. We applied this rate to our estimates of gross earnings.
The social insurance rate paid by employees is 11.2% (in addition to 21.7% by
employers) on secured income between ALL10
18,295 and ALL 91,475. As the
average wage was higher than ALL 94,475, we assumed that each employee
would generate social security revenues of ALL 24,076. For corporation tax11
,
we assumed that 10% of gross profits (outside of those generated directly by
TAP AG) would be levied in corporation tax. Finally, it was assumed that VAT
revenues generated were 10.1%12
of GVA.
9 Albania operates a flat rate of personal income tax of 10% for all those earning over ALL 30,000
(those on less than ALL 30,000, pay 10% on amounts over ALL 10,000). As the estimated average wage was above ALL 30,000, for simplicity, we assumed that no workers would qualify for the tax free personal allowance.
10 ALL is the standard acronym used to reference the Albanian official currency, the Lek
11 In Albanian law this is referred to as “profit tax”.
12 This was based on the ratio of VAT revenues to nominal GVA at the economy-wide level in 2011.
Data on VAT receipts were sourced from the Albanian Ministry of Finance’s Fiscal Bulletin, while data on nominal GVA was obtained from the Albanian Institute of Statistics.
The Economic Impact of the Trans Adriatic Pipeline on Albania A report for TAP AG
10
4 Results
� The direct impact of the construction of the pipeline is expected to peak in
2017, making an estimated value-added contribution to GDP of €57
million and creating 4,200 jobs (part-time and full-time). In total, direct
activities are forecast to contribute €157 million to Albanian GDP and
support 2,900 jobs (part-time and full-time) per year on average. On
average, the jobs will be relatively productive, with GDP per worker
around 15% higher than the forecast economy-wide average.
� Due to TAP AG’s commitment to outsource work to local suppliers where
possible, the indirect impact is set to be considerable. Our modeling
indicates that the indirect impact is likely to peak in 2017, with supply-
chain purchases and associated spin-off work contributing an estimated
€39 million to Albanian GDP and supporting 4,400 jobs (part-time and
full-time). Over the whole construction phase, these figures rise to €110
million and 3,100 jobs (part-time and full-time) per year.
� Construction of the pipeline will create further benefits for the Albanian
economy via the spending of employees (induced effect). Our modeling
implies that this effect will create an estimated €106 million for Albanian
GDP and help to support 3,900 jobs (part-time and full-time) per year
between 2015-2018.
� Operational impacts are expected to commence in 2019 and last for 50
years. In total, inclusive of direct, indirect and induced effects, operational
activity is expected to generate €780 million in GDP and support 460 jobs
(part-time and full-time) per year.
� All this activity will generate revenue for the Albanian Exchequer. We
estimate that the project will directly raise €40 million during the
construction phase and €420 million during the 50 years of operation.
Meanwhile, via indirect and induced channels, pipeline construction is
expected to generate €47 million and a cumulative €53 million during
operation.
� We also expect the project to create other “catalytic” benefits for the
Albanian economy. We estimate that the gross discounted benefits of
TAP AG’s investment in roads to be worth between €237-€1,107 million
over 20 years. Further benefits will also accrue through knowledge
spillovers, CSR policies and the boost to energy supply.
4.1 Construction
4.1.1 Direct impact
The direct impact of the construction of the pipeline is expected to be relatively
even across the proposed project timeframe (2015-18). In total, direct activities
will contribute an estimated €157 million to Albanian GDP and support 2,900
The Economic Impact of the Trans Adriatic Pipeline on Albania A report for TAP AG
11
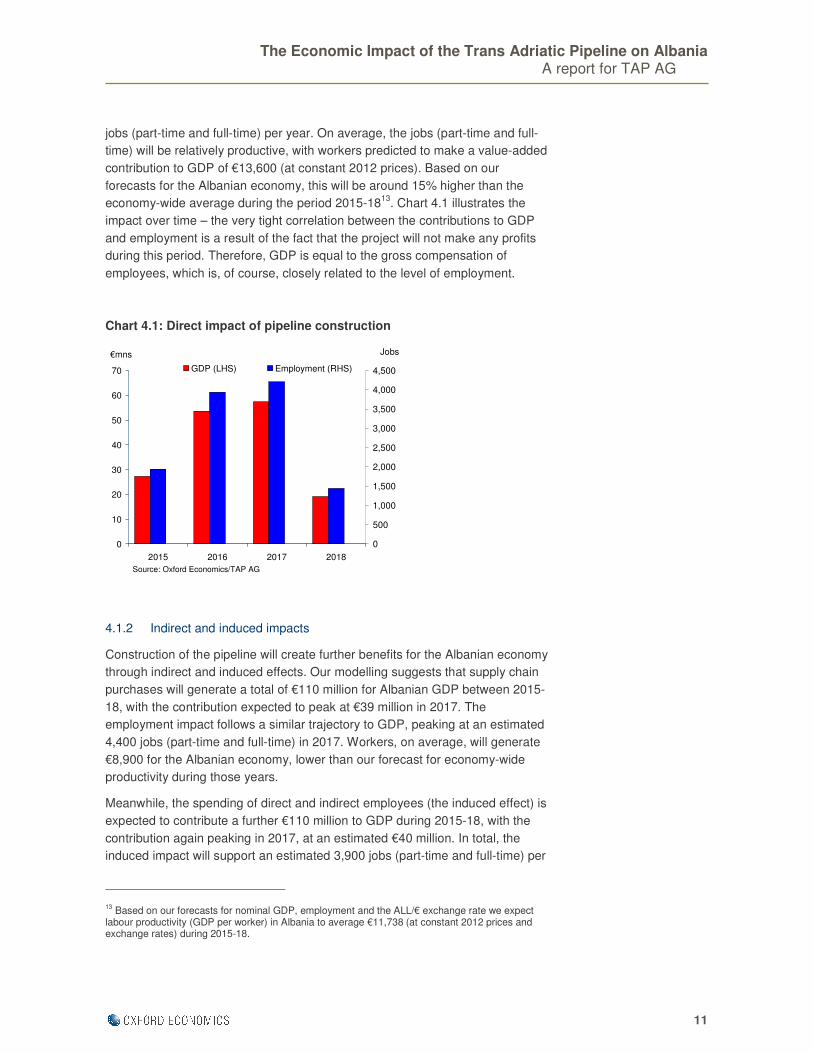
jobs (part-time and full-time) per year. On average, the jobs (part-time and full-
time) will be relatively productive, with workers predicted to make a value-added
contribution to GDP of €13,600 (at constant 2012 prices). Based on our
forecasts for the Albanian economy, this will be around 15% higher than the
economy-wide average during the period 2015-1813
. Chart 4.1 illustrates the
impact over time – the very tight correlation between the contributions to GDP
and employment is a result of the fact that the project will not make any profits
during this period. Therefore, GDP is equal to the gross compensation of
employees, which is, of course, closely related to the level of employment.
Chart 4.1: Direct impact of pipeline construction
4.1.2 Indirect and induced impacts
Construction of the pipeline will create further benefits for the Albanian economy
through indirect and induced effects. Our modelling suggests that supply chain
purchases will generate a total of €110 million for Albanian GDP between 2015-
18, with the contribution expected to peak at €39 million in 2017. The
employment impact follows a similar trajectory to GDP, peaking at an estimated
4,400 jobs (part-time and full-time) in 2017. Workers, on average, will generate
€8,900 for the Albanian economy, lower than our forecast for economy-wide
productivity during those years.
Meanwhile, the spending of direct and indirect employees (the induced effect) is
expected to contribute a further €110 million to GDP during 2015-18, with the
contribution again peaking in 2017, at an estimated €40 million. In total, the
induced impact will support an estimated 3,900 jobs (part-time and full-time) per
13 Based on our forecasts for nominal GDP, employment and the ALL/€ exchange rate we expect
labour productivity (GDP per worker) in Albania to average €11,738 (at constant 2012 prices and exchange rates) during 2015-18.
0
10
20
30
40
50
60
70
2015 2016 2017 2018
0
500
1,000
1,500
2,000
2,500
3,000
3,500
4,000
4,500GDP (LHS) Employment (RHS)
€mns
Source: Oxford Economics/TAP AG
Jobs
The Economic Impact of the Trans Adriatic Pipeline on Albania A report for TAP AG
12
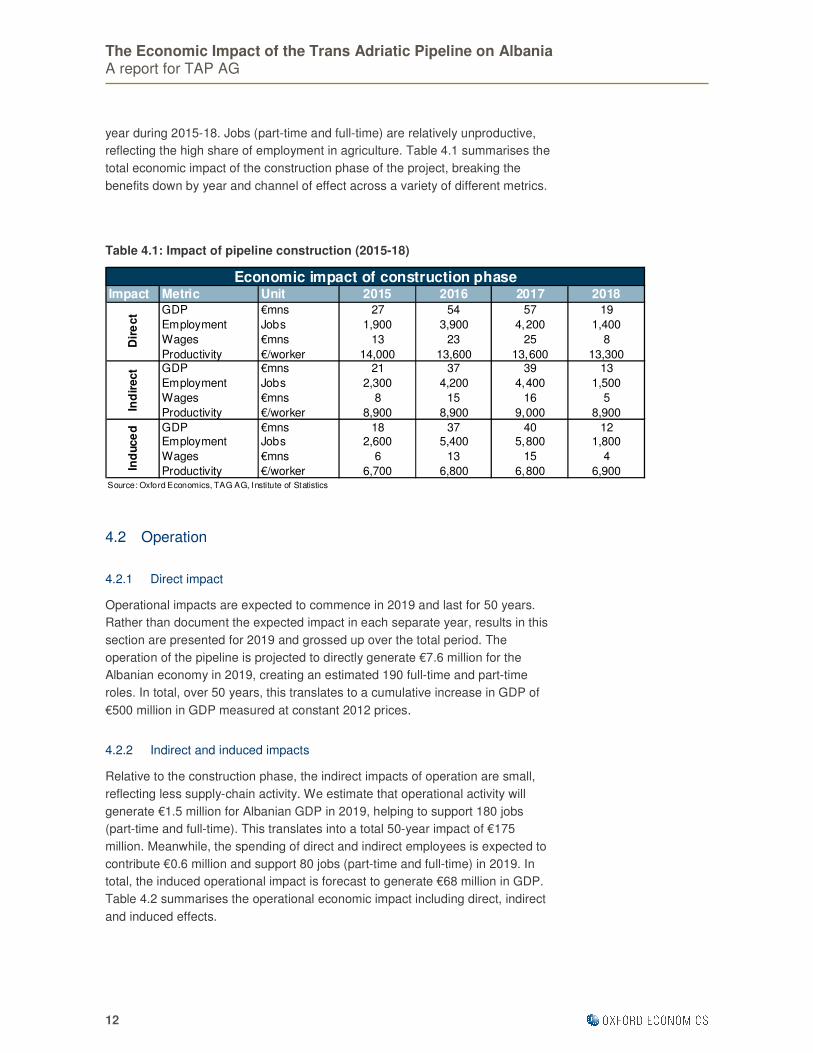
year during 2015-18. Jobs (part-time and full-time) are relatively unproductive,
reflecting the high share of employment in agriculture. Table 4.1 summarises the
total economic impact of the construction phase of the project, breaking the
benefits down by year and channel of effect across a variety of different metrics.
Table 4.1: Impact of pipeline construction (2015-18)
4.2 Operation
4.2.1 Direct impact
Operational impacts are expected to commence in 2019 and last for 50 years.
Rather than document the expected impact in each separate year, results in this
section are presented for 2019 and grossed up over the total period. The
operation of the pipeline is projected to directly generate €7.6 million for the
Albanian economy in 2019, creating an estimated 190 full-time and part-time
roles. In total, over 50 years, this translates to a cumulative increase in GDP of
€500 million in GDP measured at constant 2012 prices.
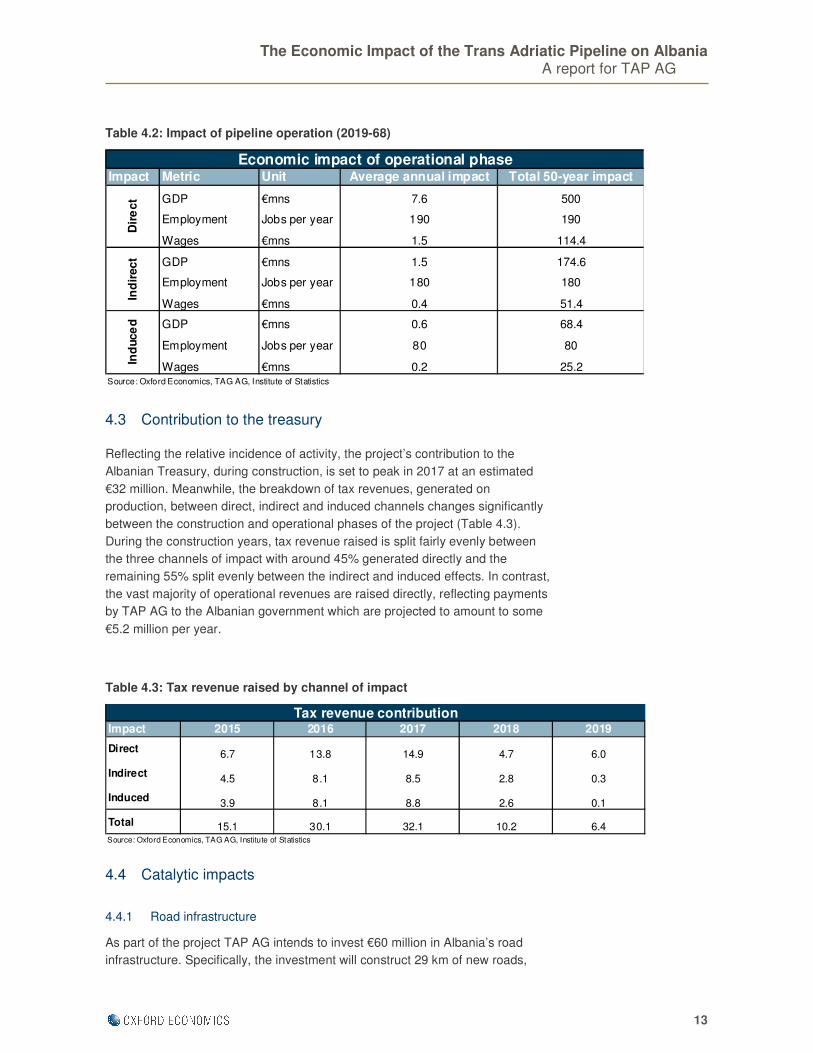
4.2.2 Indirect and induced impacts
Relative to the construction phase, the indirect impacts of operation are small,
reflecting less supply-chain activity. We estimate that operational activity will
generate €1.5 million for Albanian GDP in 2019, helping to support 180 jobs
(part-time and full-time). This translates into a total 50-year impact of €175
million. Meanwhile, the spending of direct and indirect employees is expected to
contribute €0.6 million and support 80 jobs (part-time and full-time) in 2019. In
total, the induced operational impact is forecast to generate €68 million in GDP.
Table 4.2 summarises the operational economic impact including direct, indirect
and induced effects.
Impact Metric Unit 2015 2016 2017 2018
GDP €mns 27 54 57 19
Employment Jobs 1,900 3,900 4,200 1,400
Wages €mns 13 23 25 8
Productivity €/worker 14,000 13,600 13,600 13,300GDP €mns 21 37 39 13
Employment Jobs 2,300 4,200 4,400 1,500
Wages €mns 8 15 16 5
Productivity €/worker 8,900 8,900 9,000 8,900
GDP €mns 18 37 40 12Employment Jobs 2,600 5,400 5,800 1,800
Wages €mns 6 13 15 4
Productivity €/worker 6,700 6,800 6,800 6,900Source: Oxford Economics, TAG AG, Institute of Statistics
Dir
ect
Ind
irect
Ind
uce
d
Economic impact of construction phase
The Economic Impact of the Trans Adriatic Pipeline on Albania A report for TAP AG
13
Table 4.2: Impact of pipeline operation (2019-68)
4.3 Contribution to the treasury
Reflecting the relative incidence of activity, the project’s contribution to the
Albanian Treasury, during construction, is set to peak in 2017 at an estimated
€32 million. Meanwhile, the breakdown of tax revenues, generated on
production, between direct, indirect and induced channels changes significantly
between the construction and operational phases of the project (Table 4.3).
During the construction years, tax revenue raised is split fairly evenly between
the three channels of impact with around 45% generated directly and the
remaining 55% split evenly between the indirect and induced effects. In contrast,
the vast majority of operational revenues are raised directly, reflecting payments
by TAP AG to the Albanian government which are projected to amount to some
€5.2 million per year.
Table 4.3: Tax revenue raised by channel of impact
4.4 Catalytic impacts
4.4.1 Road infrastructure
As part of the project TAP AG intends to invest €60 million in Albania’s road
infrastructure. Specifically, the investment will construct 29 km of new roads,
Impact 2015 2016 2017 2018 2019
Direct6.7 13.8 14.9 4.7 6.0
Indirect4.5 8.1 8.5 2.8 0.3
Induced3.9 8.1 8.8 2.6 0.1
Total 15.1 30.1 32.1 10.2 6.4Source: Oxford Economics, TAG AG, Institute of Statistics
Tax revenue contribution
Impact Metric Unit Average annual impact Total 50-year impact
GDP €mns 7.6 500
Employment Jobs per year 190 190
Wages €mns 1.5 114.4
GDP €mns 1.5 174.6
Employment Jobs per year 180 180
Wages €mns 0.4 51.4
GDP €mns 0.6 68.4
Employment Jobs per year 80 80
Wages €mns 0.2 25.2Source: Oxford Economics, TAG AG, Institute of Statistics
Economic impact of operational phase
Dir
ec
tIn
dir
ec
tIn
duce
d
The Economic Impact of the Trans Adriatic Pipeline on Albania A report for TAP AG
14
improve 79 km of current simple earth tracks to roads, rehabilitate 59 km of
existing roads and establish 6-10 work camps with associated infrastructure.
Investment in road infrastructure generates economic benefits through a number
of channels: a reduction in time travel for road-users as average speeds
increase; an associated reduction in vehicle operating costs; and a reduction in
accidents due to the improvement in the quality of the roads. Here, we produce
a range of estimates of the value of these benefits using alternative rates of
return from Albanian road infrastructure investments in the literature. However, it
is important to note that these monetary values are not equivalent to GDP
figures referenced earlier in this chapter.
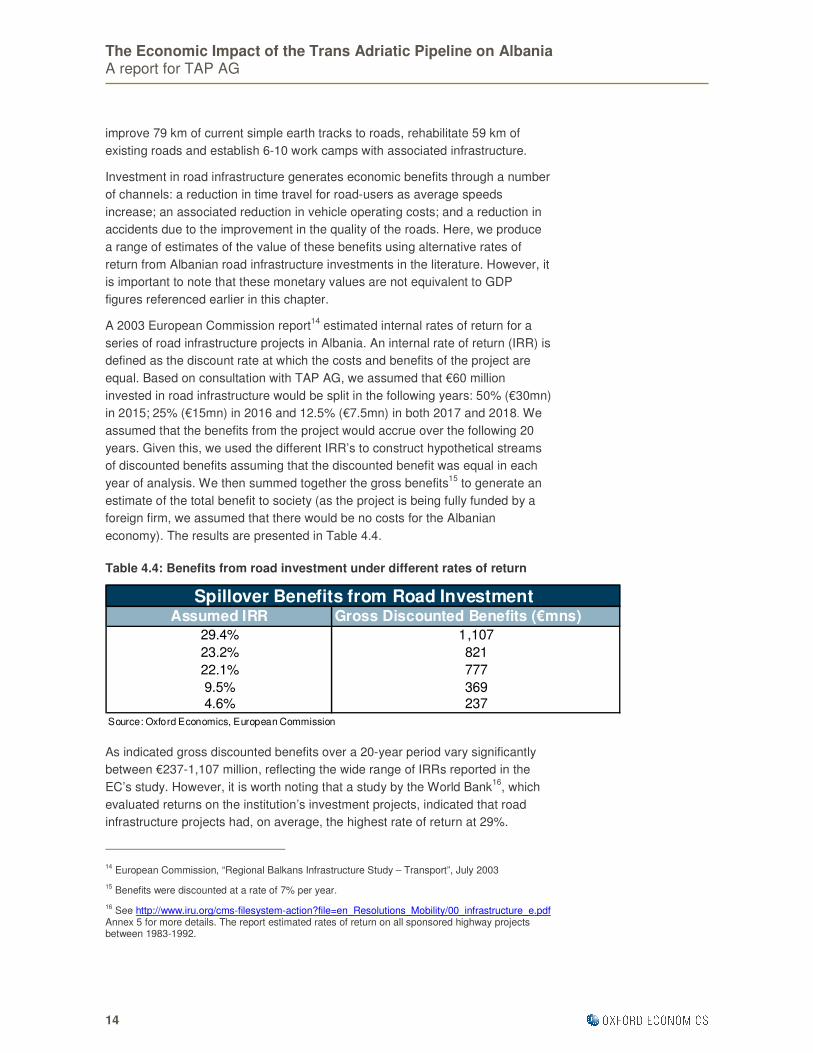
A 2003 European Commission report14
estimated internal rates of return for a
series of road infrastructure projects in Albania. An internal rate of return (IRR) is
defined as the discount rate at which the costs and benefits of the project are
equal. Based on consultation with TAP AG, we assumed that €60 million
invested in road infrastructure would be split in the following years: 50% (€30mn)
in 2015; 25% (€15mn) in 2016 and 12.5% (€7.5mn) in both 2017 and 2018. We
assumed that the benefits from the project would accrue over the following 20
years. Given this, we used the different IRR’s to construct hypothetical streams
of discounted benefits assuming that the discounted benefit was equal in each
year of analysis. We then summed together the gross benefits15
to generate an
estimate of the total benefit to society (as the project is being fully funded by a
foreign firm, we assumed that there would be no costs for the Albanian
economy). The results are presented in Table 4.4.
Table 4.4: Benefits from road investment under different rates of return
As indicated gross discounted benefits over a 20-year period vary significantly
between €237-1,107 million, reflecting the wide range of IRRs reported in the
EC’s study. However, it is worth noting that a study by the World Bank16
, which
evaluated returns on the institution’s investment projects, indicated that road
infrastructure projects had, on average, the highest rate of return at 29%.
14 European Commission, “Regional Balkans Infrastructure Study – Transport”, July 2003
15 Benefits were discounted at a rate of 7% per year.
16 See http://www.iru.org/cms-filesystem-action?file=en_Resolutions_Mobility/00_infrastructure_e.pdf
Annex 5 for more details. The report estimated rates of return on all sponsored highway projects between 1983-1992.
Assumed IRR Gross Discounted Benefits (€mns)
29.4% 1,107
23.2% 821
22.1% 777
9.5% 3694.6% 237
Source: Oxford Economics, European Commission
Spillover Benefits from Road Investment
The Economic Impact of the Trans Adriatic Pipeline on Albania A report for TAP AG
15
Therefore, in our view, it is likely that the value of benefits generated by the
investment will be towards the top end of the range.
4.4.2 Knowledge transfers
In the economics literature, one of the key benefits often cited of foreign direct
investment (FDI) is knowledge transfers imparted by more technologically
advanced foreign firms17
. The scope for these gains is typically greater in less
developed countries such as Albania, with domestic firms, on average, less
technologically advanced than in mature economies.
Although a formal quantitative estimate of the value of this effect is beyond the
scope of this paper, analysis of the characteristics of the TAP AG investment is
informative in identifying the likely channels of impact. As the project does not
involve the take-over or investment in a domestic firm, there will be no direct
efficiency gains via technology/knowledge transfers. However, as emphasised
by Djurovic (2008)18
these benefits can still occur indirectly via transfers to other
local firms. Indeed, Gorodnichenko, Svejnar and Terrell’s (2007)19
analysis of
emerging markets indicates that backward linkages (via the foreign firm’s supply
chain) generate the largest spillover benefits. Clearly, backward linkages in this
project are significant in the construction phase (given the scale of direct
outsourcing and the size of the indirect impact) suggesting that gains may be
material.
Moreover, as TAP would represent the largest foreign investment (in value
terms) in Albania’s history, it has the potential to attract further major
investments by foreign multinationals. For example, the experience the
government will gain in handling a contract of this scale should enhance the
credibility of Albania as a host country for FDI.
4.4.3 Corporate social responsibility
As part of its activities in Albania, TAP AG is planning to invest €4 million in a
capability enhancement fund. Together with other regional donors, the aim is to
generate a total resource pool of around €10 million. The scheme will be
targeted at domestic enterprises, with participants gaining additional
qualifications, expertise and experience, which should facilitate the expansion of
local businesses in international markets.
17 The literature on the impact of FDI on host economies is vast and although empirical evidence is
mixed, our survey suggested that the consensus is that inward FDI does generally generate economic benefits for the host economy via knowledge and technology transfers.
18 Djurovic (2008), “FDI and Human Capital Formation in South-Eastern Europe Focusing on
Republic of Macedonia”, Economic Journal of the Institute of Economics in Republic of Macedonia, June 2008
19 Gorodnichenko, Svejnar and Terrell (2007), “When Does FDI Have Positive Spillovers? Evidence
from 17 Emerging Market Economies”, Ross School of Business Working Paper Series No.1101, October 2007
The Economic Impact of the Trans Adriatic Pipeline on Albania A report for TAP AG
16
In addition, TAP AG has committed to “enhancing through social and
environmental investments living conditions in neighbouring communities and
biodiversity and forest cover in and around critical habitats”. Around €15 million
has been earmarked for these activities, with the focus on developing and
sustaining good relations with local communities. Although details on the
breakdown of spending are not yet available some of the likely investments
include: providing support to schools and other training and education services;
rehabilitating communal buildings; funding environmental projects; and
supporting the enhancement of local income opportunities and value chains.
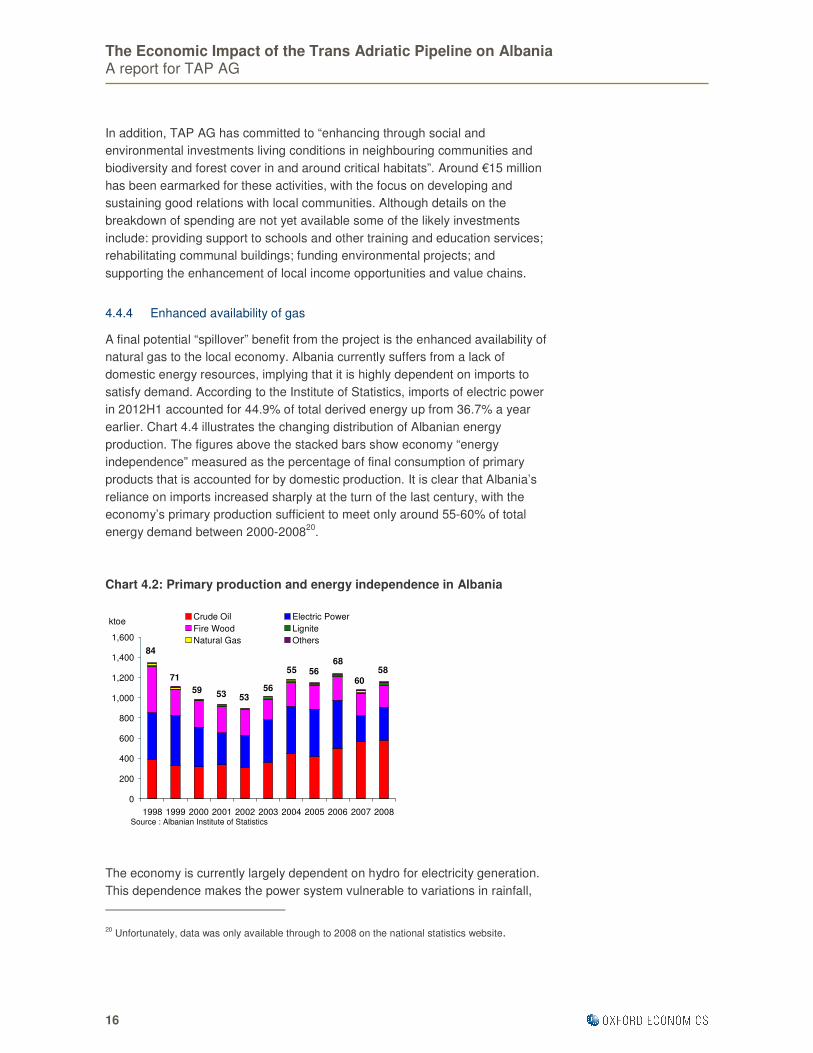
4.4.4 Enhanced availability of gas
A final potential “spillover” benefit from the project is the enhanced availability of
natural gas to the local economy. Albania currently suffers from a lack of
domestic energy resources, implying that it is highly dependent on imports to
satisfy demand. According to the Institute of Statistics, imports of electric power
in 2012H1 accounted for 44.9% of total derived energy up from 36.7% a year
earlier. Chart 4.4 illustrates the changing distribution of Albanian energy
production. The figures above the stacked bars show economy “energy
independence” measured as the percentage of final consumption of primary
products that is accounted for by domestic production. It is clear that Albania’s
reliance on imports increased sharply at the turn of the last century, with the
economy’s primary production sufficient to meet only around 55-60% of total
energy demand between 2000-200820
.
Chart 4.2: Primary production and energy independence in Albania
The economy is currently largely dependent on hydro for electricity generation.
This dependence makes the power system vulnerable to variations in rainfall,
20 Unfortunately, data was only available through to 2008 on the national statistics website.
0
200
400
600
800
1,000
1,200
1,400
1,600
1998 1999 2000 2001 2002 2003 2004 2005 2006 2007 2008
Crude Oil Electric Power
Fire Wood Lignite
Natural Gas Others
ktoe
Source : Albanian Institute of Statistics
71
84
59 53 5356
55 5668
60
58
The Economic Impact of the Trans Adriatic Pipeline on Albania A report for TAP AG
17
with periodic electricity crises occurring during 2000-2010. Given the current
deficiencies and the expected increase in energy demand the Ministry of Energy
and Industry has devised a National Energy Strategy (NES) 2006-20. Among the
key objectives of the strategy are boosting supply security by increasing the
diversification of energy sources and the construction of new generation plants
and inter-connection lines. To this end, the report projects an increase in
demand for natural gas of up to 1.8 billion cubic meters (bcm) by 2020.
According to a recent report by the Oxford Institute for Energy Studies21
, such a
target is ambitious. It depends on the timely gasification of the country through
international pipeline projects, the relatively rapid expansion of the Albanian gas-
fired power generation sector and the upgrading of the country’s pipeline
infrastructure. In this light, the successful completion of TAP can be seen as
absolutely fundamental to meeting this objective. Indeed, indications from TAP
AG suggest that the project may make between 1-2 bcm of gas available at
commercial rates from 2018 onwards, which would provide a considerable boost
in reaching the economy’s strategic targets.
Moreover, an alternative of importing Liquefied Natural Gas (LNG) by
constructing terminals on the Adriatic coast is beset by difficulties, as described
by the Oxford Institute for Energy Studies report. Not only is there fierce regional
competition for such projects, but the low-price environment in Albania risks
undermining profitability.
There is also the possibility that, given its strategically advantageous position,
TAP could enable Albania to connect gas to other neighbouring countries, by
interconnecting with the Ionian Adriatic Pipeline (IAP). Doing so would enable
regional economies access to the abundant energy resources in the Caspian
basin. Other benefits may derive from the fact that enhanced availability of gas
could increase the supply of energy resources e.g. it has the potential to improve
oil recovery rates from existing fields. Meanwhile, both cement production and
steel production may become more efficient, which in turn would generate
benefits for sectors reliant on these raw materials.
Finally, the increased availability of gas may provide the opportunity to enhance
oil and gas exploration and production from incumbent energy resources. For
example, gas can be used to improve oil recovery rates from existing fields.
Other possible applications include the more efficient production of both steel
and cement. This in turn would generate external benefits for other Albanian
industries that are reliant on these raw materials.
21 “Natural Gas in Greece and Albania: Supply and Demand Prospects to 2015”, Anastasios
Giamouridis, December 2009
The Economic Impact of the Trans Adriatic Pipeline on Albania A report for TAP AG
18
5 Conclusion
The objective of this report has been to provide a robust assessment of the
economic impact of the planned development of the TAP on the Albanian
economy, during both the construction and operational phases. Our results show
that the direct impact of the construction phase of the project is likely to peak in
2017 when it will make an estimated value added contribution to GDP of €57
million and create 4,200 jobs (part-time and full-time). Further benefits will then
accrue via domestic supply chain purchases of firms which have been
outsourced work directly by TAP AG. We expect that the indirect impact will
peak in 2017, generating an estimated €39 million in GDP, activity that will
support 4,400 jobs (part-time and full-time). These figures rise to €110 million
and 3,100 jobs (part-time and full-time) per year over the total construction
horizon. In addition, the spending of direct and indirect employees will create
economic benefits elsewhere. In total, we estimate that this channel will
generate an estimated further €106 million in GDP and 3,900 jobs (part-time and
full-time) per year between 2015-18.
On top of this the project will generate persistent operational benefits. Over the
50-year operating horizon, we estimate that these will amount to a €740 million
total contribution to GDP with this activity supporting 450 jobs (part-time and full-
time) per year on average.
Therefore, in its own right, the project will generate significant benefits for the
Albanian economy. However, this report has also drawn attention to a number of
possible “spillover” effects which, although impossible to quantify with the same
precision, are likely to be even more significant. These include the value of
associated road infrastructure investment, knowledge and technology spillovers
to local firms, CSR initiatives undertaken by TAP AG and increased availability
of natural gas to help meet the expected future increase in energy demand.
The Economic Impact of the Trans Adriatic Pipeline on Albania A report for TAP AG
19
6 Appendix
This appendix provides further methodological detail on the report. The
approach to modelling the economic impact of the pipeline followed traditional
methods well established within the economics literature. Input-output modelling
is used to quantify how an injection of spending (in this case outsourced contract
work by TAP AG) flows through an economy, as activity is further stimulated by
the procurement of goods and services by directly affected firms and the
spending of employees whose jobs (part-time and full-time) are supported by the
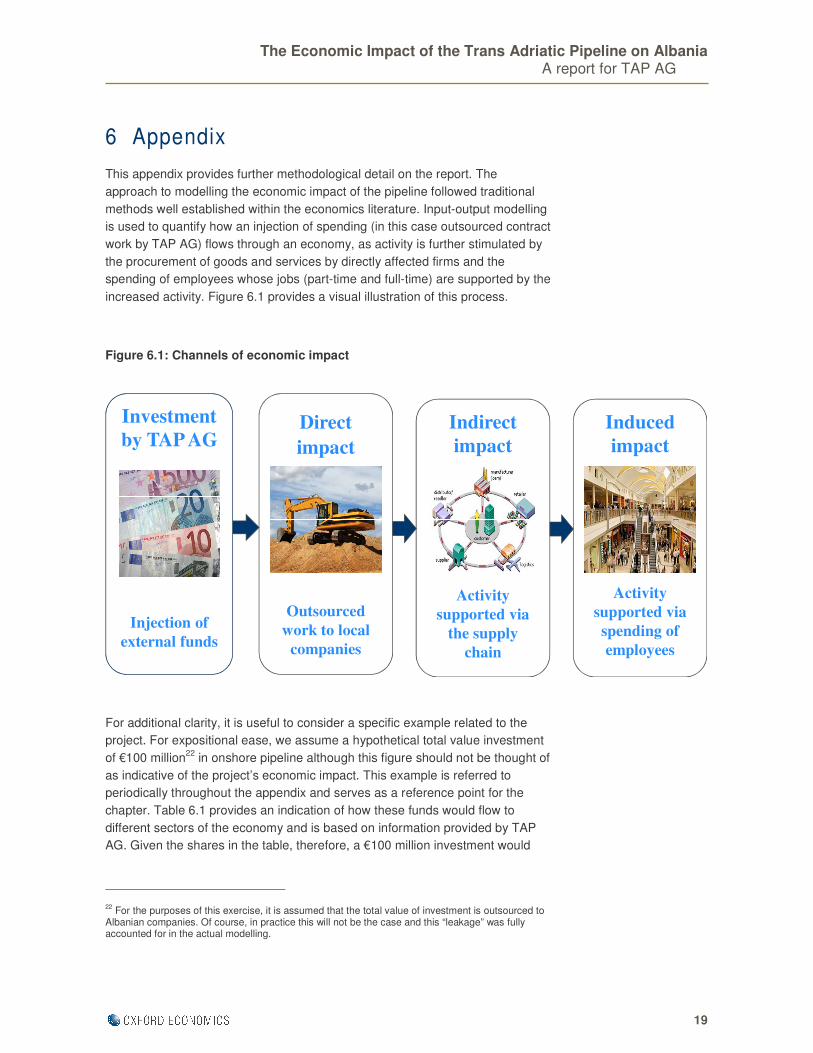
increased activity. Figure 6.1 provides a visual illustration of this process.
Figure 6.1: Channels of economic impact
For additional clarity, it is useful to consider a specific example related to the
project. For expositional ease, we assume a hypothetical total value investment
of €100 million22
in onshore pipeline although this figure should not be thought of
as indicative of the project’s economic impact. This example is referred to
periodically throughout the appendix and serves as a reference point for the
chapter. Table 6.1 provides an indication of how these funds would flow to
different sectors of the economy and is based on information provided by TAP
AG. Given the shares in the table, therefore, a €100 million investment would
22 For the purposes of this exercise, it is assumed that the total value of investment is outsourced to
Albanian companies. Of course, in practice this will not be the case and this “leakage” was fully accounted for in the actual modelling.
Investment
by TAP AG
Injection of
external funds
Direct
impact
Outsourced
work to local
companies
Indirect
impact
Activity
supported via
the supply
chain
Induced
impact
Activity
supported via
spending of
employees
The Economic Impact of the Trans Adriatic Pipeline on Albania A report for TAP AG
20
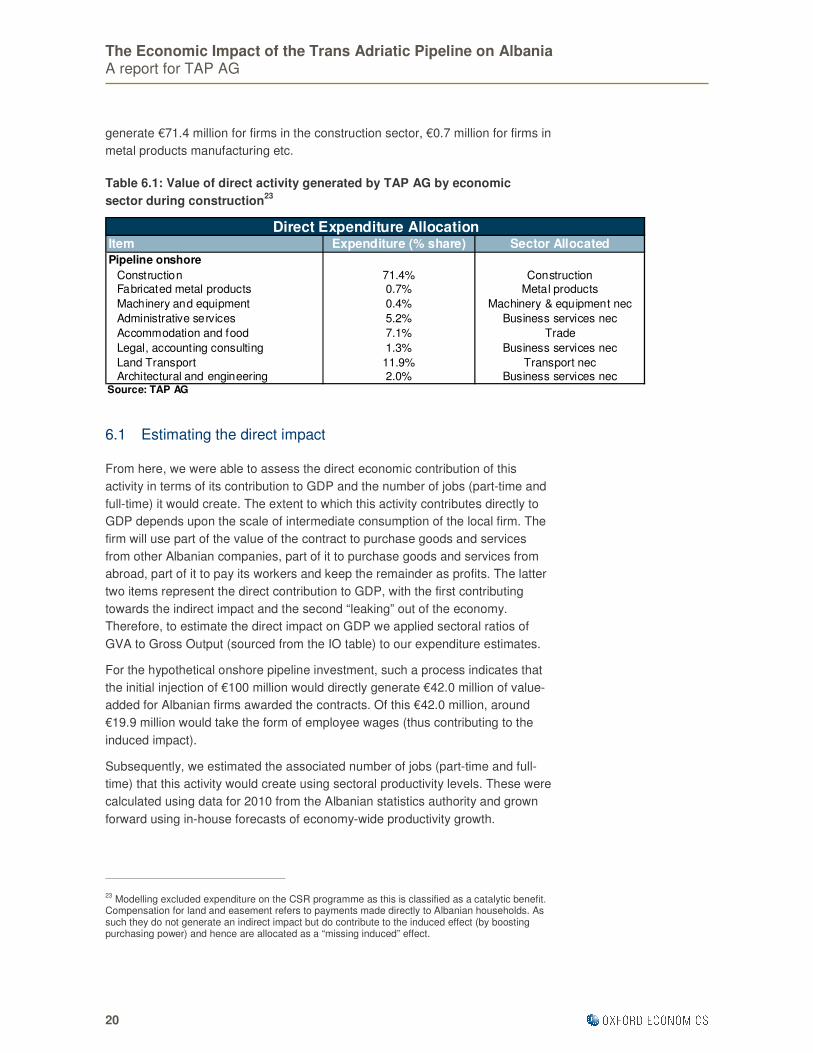
generate €71.4 million for firms in the construction sector, €0.7 million for firms in
metal products manufacturing etc.
Table 6.1: Value of direct activity generated by TAP AG by economic
sector during construction23
6.1 Estimating the direct impact
From here, we were able to assess the direct economic contribution of this
activity in terms of its contribution to GDP and the number of jobs (part-time and
full-time) it would create. The extent to which this activity contributes directly to
GDP depends upon the scale of intermediate consumption of the local firm. The
firm will use part of the value of the contract to purchase goods and services
from other Albanian companies, part of it to purchase goods and services from
abroad, part of it to pay its workers and keep the remainder as profits. The latter
two items represent the direct contribution to GDP, with the first contributing
towards the indirect impact and the second “leaking” out of the economy.
Therefore, to estimate the direct impact on GDP we applied sectoral ratios of
GVA to Gross Output (sourced from the IO table) to our expenditure estimates.
For the hypothetical onshore pipeline investment, such a process indicates that
the initial injection of €100 million would directly generate €42.0 million of value-
added for Albanian firms awarded the contracts. Of this €42.0 million, around
€19.9 million would take the form of employee wages (thus contributing to the
induced impact).
Subsequently, we estimated the associated number of jobs (part-time and full-
time) that this activity would create using sectoral productivity levels. These were
calculated using data for 2010 from the Albanian statistics authority and grown
forward using in-house forecasts of economy-wide productivity growth.
23 Modelling excluded expenditure on the CSR programme as this is classified as a catalytic benefit.
Compensation for land and easement refers to payments made directly to Albanian households. As such they do not generate an indirect impact but do contribute to the induced effect (by boosting purchasing power) and hence are allocated as a “missing induced” effect.
Item Expenditure (% share) Sector Allocated
Pipeline onshore
Construction 71.4% ConstructionFabricated metal products 0.7% Metal products
Machinery and equipment 0.4% Machinery & equipment nec
Administrative services 5.2% Business services nec
Accommodation and food 7.1% Trade
Legal, accounting consulting 1.3% Business services nec
Land Transport 11.9% Transport necArchitectural and engineering 2.0% Business services nec
Source: TAP AG
Direct Expenditure Allocation
The Economic Impact of the Trans Adriatic Pipeline on Albania A report for TAP AG
21
6.2 Input Output modelling to assess the indirect and induced
impacts
The expenditure values provided by TAP AG also provided the basis for the
input-output modelling used to calculate the indirect and induced impacts. A 57-
sector IO model was sourced from GTAP. An IO table quantifies economic
relationships between sectors i.e. the extent to which sectors buy and sell goods
and services between each other. When manipulating the IO table, an
adjustment was made to the compensation of employees coefficient to reflect
the fact that part of the wage income earned by households will be taxed and
therefore will not be spent. Not adjusting for this factor would otherwise lead to
an overestimation of the induced effect.
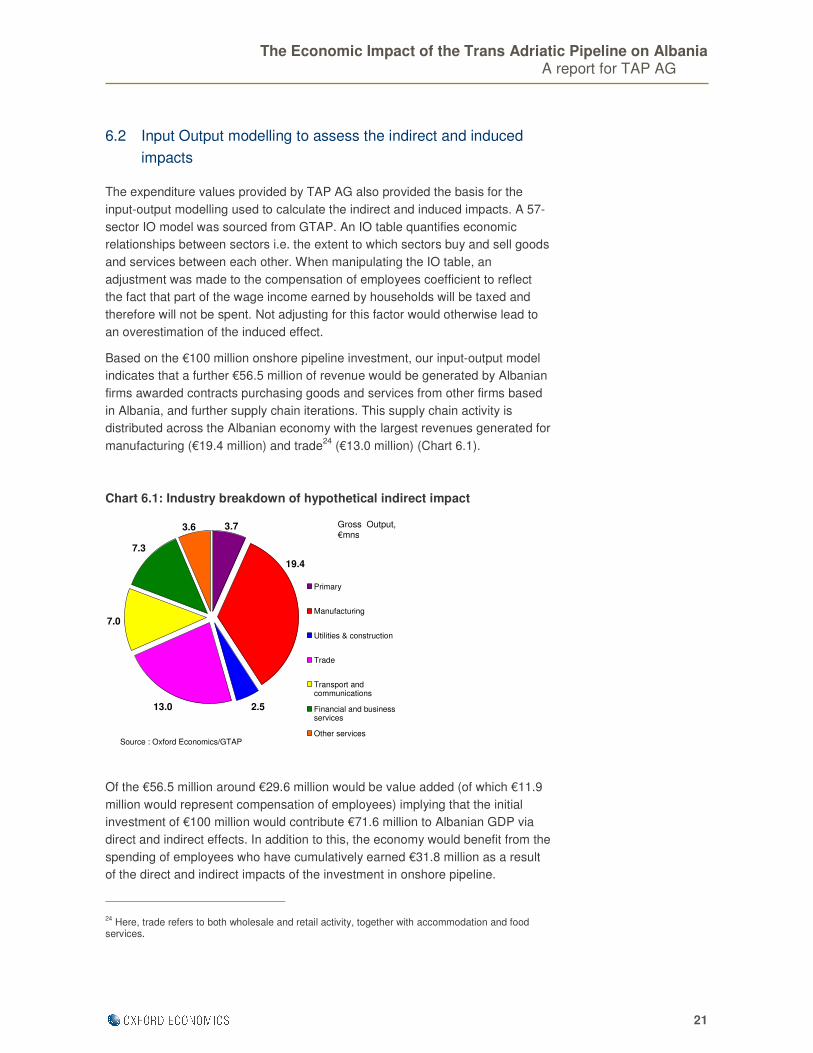
Based on the €100 million onshore pipeline investment, our input-output model
indicates that a further €56.5 million of revenue would be generated by Albanian
firms awarded contracts purchasing goods and services from other firms based
in Albania, and further supply chain iterations. This supply chain activity is
distributed across the Albanian economy with the largest revenues generated for
manufacturing (€19.4 million) and trade24
(€13.0 million) (Chart 6.1).
Chart 6.1: Industry breakdown of hypothetical indirect impact
Of the €56.5 million around €29.6 million would be value added (of which €11.9
million would represent compensation of employees) implying that the initial
investment of €100 million would contribute €71.6 million to Albanian GDP via
direct and indirect effects. In addition to this, the economy would benefit from the
spending of employees who have cumulatively earned €31.8 million as a result
of the direct and indirect impacts of the investment in onshore pipeline.
24 Here, trade refers to both wholesale and retail activity, together with accommodation and food
services.
2.513.0
7.0
7.3
19.4
3.6 3.7
Primary
Manufacturing
Utilities & construction
Trade
Transport andcommunications
Financial and businessservices
Other services
Gross Output, €mns
Source : Oxford Economics/GTAP
The Economic Impact of the Trans Adriatic Pipeline on Albania A report for TAP AG
22
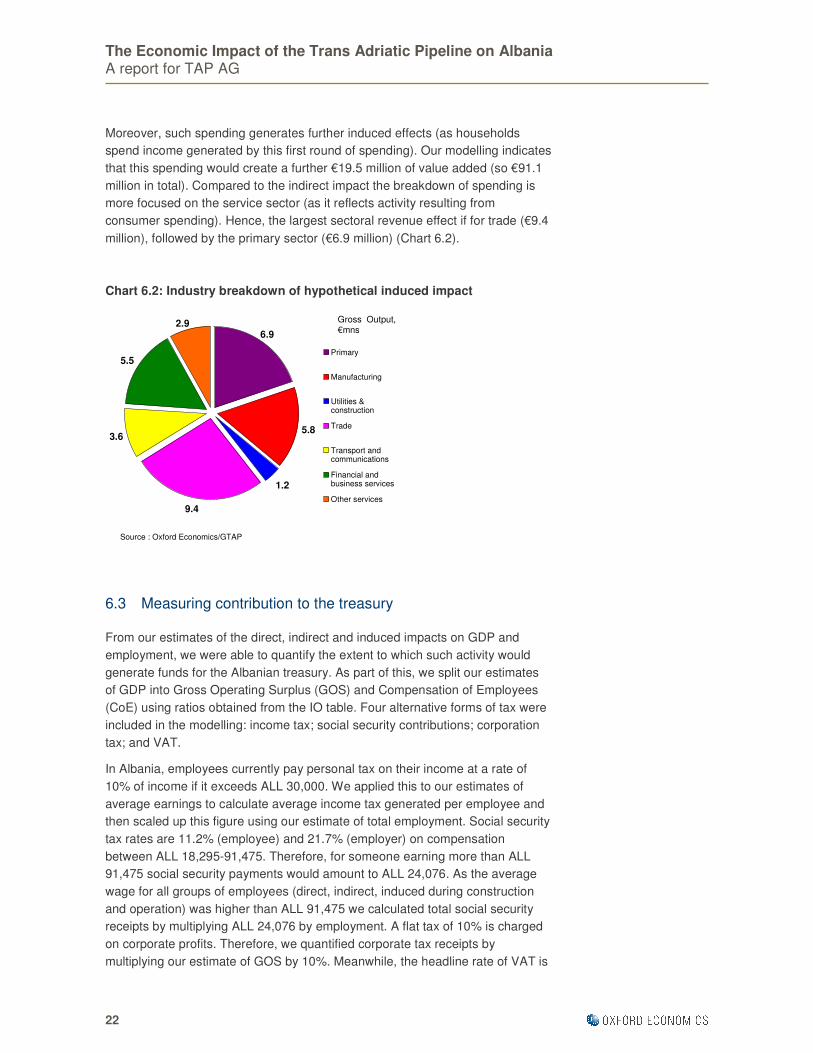
Moreover, such spending generates further induced effects (as households
spend income generated by this first round of spending). Our modelling indicates
that this spending would create a further €19.5 million of value added (so €91.1
million in total). Compared to the indirect impact the breakdown of spending is
more focused on the service sector (as it reflects activity resulting from
consumer spending). Hence, the largest sectoral revenue effect if for trade (€9.4
million), followed by the primary sector (€6.9 million) (Chart 6.2).
Chart 6.2: Industry breakdown of hypothetical induced impact
6.3 Measuring contribution to the treasury
From our estimates of the direct, indirect and induced impacts on GDP and
employment, we were able to quantify the extent to which such activity would
generate funds for the Albanian treasury. As part of this, we split our estimates
of GDP into Gross Operating Surplus (GOS) and Compensation of Employees
(CoE) using ratios obtained from the IO table. Four alternative forms of tax were
included in the modelling: income tax; social security contributions; corporation
tax; and VAT.
In Albania, employees currently pay personal tax on their income at a rate of
10% of income if it exceeds ALL 30,000. We applied this to our estimates of
average earnings to calculate average income tax generated per employee and
then scaled up this figure using our estimate of total employment. Social security
tax rates are 11.2% (employee) and 21.7% (employer) on compensation
between ALL 18,295-91,475. Therefore, for someone earning more than ALL
91,475 social security payments would amount to ALL 24,076. As the average
wage for all groups of employees (direct, indirect, induced during construction
and operation) was higher than ALL 91,475 we calculated total social security
receipts by multiplying ALL 24,076 by employment. A flat tax of 10% is charged
on corporate profits. Therefore, we quantified corporate tax receipts by
multiplying our estimate of GOS by 10%. Meanwhile, the headline rate of VAT is
1.2
9.4
3.6
5.5
5.8
2.96.9
Primary
Manufacturing
Utilities &construction
Trade
Transport andcommunications
Financial andbusiness services
Other services
Gross Output, €mns
Source : Oxford Economics/GTAP
The Economic Impact of the Trans Adriatic Pipeline on Albania A report for TAP AG
23
20% but as this is not applicable to all goods and services, and firms are only
liable to pay VAT on value-added and can reclaim payments made on
intermediate consumption. Therefore, we calculated the economy-wide ratio of
VAT revenue25
to GDP (10.07%) and applied this to our estimates of GDP.
25 This figure, for 2011, was sourced from the Albanian Ministry of Finance’s Fiscal Bulletin.
OXFORD
Abbey House, 121 St Aldates
Oxford, OX1 1HB, UK
Tel: +44 1865 268900
LONDON
Broadwall House, 21 Broadwall
London, SE1 9PL, UK
Tel: +44 207 803 1400
BELFAST
Lagan House, Sackville Street
Lisburn, BT27 4AB, UK
Tel: +44 28 9266 0669
NEW YORK
817 Broadway, 10th Floor
New York, NY 10003, USA
Tel: +1 646 786 1863
PHILADELPHIA
303 Lancaster Avenue, Suite 1b
Wayne PA 19087, USA
Tel: +1 610 995 9600
SINGAPORE
No.1 North Bridge Road
High Street TAP AGntre #22-07
Singapore 179094
Tel: +65 6338 1235
PARIS
9 rue Huysmans
75006 Paris, FranTAP AG
Tel: + 33 6 79 900 846
email: [email protected]
www.oxfordeconomics.com