The Economic Impact of the Equine Industry in Massachusetts
33
The Economic Impact of the Equine Industry in Massachusetts 2016 Prepared for: Massachusetts Farm Bureau Federation Inc. Prepared by: Farm Credit East 785 Hartford Pike Dayville, CT 06241
Transcript of The Economic Impact of the Equine Industry in Massachusetts
The Economic Impact of the Equine Industry in
Massachusetts 2016
Prepared for: Massachusetts Farm Bureau Federation Inc.
Prepared by: Farm Credit East 785 Hartford Pike Dayville, CT 06241

2
Table of Contents Page
1. Executive Summary 3
2. Introduction 5
3. Survey Methodology 7
4. US Equine Industry Overview 10
5. Massachusetts Equine Industry Overview 11
6. Economic Impact of the Equine Industry 13
7. Fiscal Impact of the Equine Industry 18
8. The Equine Industry’s Impact on Land Use 19
9. Economic Impact of the Mass Horse Racing Industry 20
10. Issues in the Mass Equine Industry 22
11. Survey Results 23
Appendix #1 – Copy of Cover Letter and Equine Survey 28
Appendix #2 – Mass Equine Organizations 30
Appendix #3 – State Agricultural Fair Schedule for 2016 31
Appendix #4 – References Used in This Report 33
3
1. Executive Summary The Economic Impacts of the Massachusetts Equine Industry
The purpose of this report is to examine and detail the economic impact of the equine industry in
Massachusetts.
The equine industry is defined here as all activities involved in breeding, raising, selling and
using horses for commercial and recreational purposes. This includes pleasure horse owners,
racing horse owners, working horse owners, boarding facilities, rehabilitation facilities,
therapeutic riding facilities, vets, farriers, racetracks, showing events and other horse shows
as well as riders who do not own their own horses but are involved in the industry.
The Massachusetts Equine Industry consists of roughly 26,000 horses, located on about 2,300
farms located throughout the state. Supporting the equine industry are a number of related
businesses, horse racing facilities, local and state fairs (for public horse shows) and colleges that
provide equine related education.
The total economic impact is made up of three components: the direct effects, the indirect effects
and the induced effects.
The direct effects are the sales, income and employment created by the equine related purchases
in the state. The indirect effects are the purchases by businesses up and down the supply chain
resulting from the direct impact businesses. For example indirect effects can include the
purchase and installation of horseshoes by the farrier.
The induced effects are the purchases made by employees of both the direct impact business and
indirect impact businesses. These can be purchases made by employees at grocery stores,
restaurants, hardware stores, etc.
Direct Spending $193,329,709 Fiscal benefits $0.00 Potential Leakages $0.00 Multiplier Effect X 2.0 Total Economic Impact $386,659,418
The fiscal impacts of the Massachusetts Equine Industry
The economic activity from the horse industry creates tax revenue for the state and local
governments. These yearly taxes are reflected in the table below
Property Tax $14,987,126 Sales Tax $ 2,865,263 Total Tax Revenue Impact $17,852,389

4
Jobs Provided by the Massachusetts Equine Industry
Massachusetts horse farms currently employ 7,149 people in a combination of full-time and part-
time employment.
The Equine Industry’s Impact on Land Use in Massachusetts
The equine industry uses about 8,638 acres of land for horse pastures and 4,836 acres in hay
land. When including farmstead and woodland areas, it is estimated that the equine industry uses
about 40,786 acres of agricultural land in Massachusetts.

5
2. Introduction
There are currently about 26,000 horses in Massachusetts. These animals are used for recreation,
trail riding, rehabilitation and therapy, racing and as work horses. The public gets to see and
enjoy horses at local horse shows, state fairs and at thoroughbred racing facility Suffolk Downs
and harness racing facility Plainridge Racing.
There are an estimated 2,300 horse farms in the state, ranging from single stall personal use
farms to farms with over 50 horses. Included in this total are more than 600 boarding stables and
60 thoroughbred breeding stables.
In Massachusetts, these horses graze on pastures, utilize hay and grain grown in Massachusetts
(and elsewhere), and are treated by large animal vets, farriers, horse trainers and other equine
specialists.
The purpose of this report is to examine and detail the economic impact of the equine industry in
Massachusetts.
The equine industry is defined here as all activities involved in breeding, raising, selling and
using horses for commercial and recreational purposes. This includes pleasure horse owners,
racing horse owners, working horse owners, boarding facilities, rehabilitation facilities,
therapeutic riding facilities, vets, farriers, racetracks, showing events and other horse shows
as well as riders who do not own their own horses but are involved in the industry.
The economic impact in this report includes business sales, jobs, personal income and state and
local tax revenues generated as a result of the equine industry.
The scope of this report goes beyond that of the study completed by Christiansen Capital
Advisors LLC, dated October 22, 2013 for the Sterling Suffolk Racecourse, LLC entitled “The
Economic Impact of the Massachusetts Thoroughbred Equine Industry” which looked only at the
racing industry. This report looks at racing as well as other aspects of the Massachusetts Equine
industry such as pleasure horses and boarding stables.
In addition to estimating the economic impact of the equine industry in Massachusetts this report
also looks at patterns of land use. As open space in Massachusetts is increasingly pressured by
development, the stewardship of land by the equine industry is becoming more important.
An article entitled “Strength in Numbers: How Economic Impact Studies Shape the Horse
World”, published in the January 2007 edition of Equus magazine explains how economic
impact studies not only demonstrate the economic importance of the equine industry on a
regional or state level, but also influence public policy. According to the article, economic
impact studies “…may influence whether [horse owners] will be able to ride on …public trails…
and/or whether a horse park in [the horse owner’s] area will receive government funds”.
It is the hope that this study will play such a role in Massachusetts, both describing the industry
and highlighting the public policy issues involved.

6
Layout of the Report
This report is laid out into the following sections:
Survey Methodology – Outlines how data was collected and interpreted, including an
explanation of the survey of Massachusetts horse owners conducted for this study.
US Equine Industry Overview – Describes the breadth and scope of the US equine industry
Massachusetts Equine Industry Overview – Describes the breadth and scope of the
Massachusetts equine industry.
Economic Impact of the Equine Industry – Displays the total economic impact of the equine
industry in Massachusetts.
Tax Impact of the Equine Industry – Presents the tax impacts of the equine industry.
The Equine Industry’s Impact on Land Use – Outlines how the equine industry affects land
use in Massachusetts. The data in this section is based on the results of survey data.
Economic Impact of the Mass Horse Racing Industry – Discusses the racing history and
future of Suffolk Downs and Plainridge Park. Also presents purses paid out to racing horse
owners.
Issues in the Mass Equine Industry – Provides a discussion and listing of the issues and
challenges facing Massachusetts horse owners and commercial equine operations.
Survey Results – Displays the total responses to each of the questions in the Equine Survey.
The data presented in this section are not extrapolated to the entire horse population in
Massachusetts.

7
3. Survey Methodology This study is based upon data collected from three sources: 1) a survey administered to
Massachusetts horse owners (see Appendix #1 for copy of the survey), 2) personal interviews
with operators of equine facilities and equine related businesses, and 3) data from federal and
state organizations, equine publications and internet research.
This study looks at the equine industry, ranging from personal use only to boarding, training,
shows, lessons, recreation, racing, breeding, therapeutic riding and other aspects of the industry.
Surveys
The primary method for data gathering was through the administration of a mail- and web-based
survey.
There is no statewide mailing list of horse owners, nor of equine business operations. Therefore,
in order to find Massachusetts based horse owners and induce them to complete the survey a
number of equine-related organizations were contacted, extensive internet research was
conducted and $1,000 in prizes (such as gift certificates to Smart Pak – A store that sells equine
equipment like saddles, riding clothes, etc.) were offered.
Potential respondents were solicited through the following sources:
Web Search - Internet research to develop a list of all horse boarding operations
(approximately 600) in Massachusetts – Using this list, request letters and the survey
were sent out in December 2015 and again in January 2016. Follow up phone calls were
made to over 300 of these operations that had not responded as of April 2016.
MA Horse Magazine - Center spread publication of a request letter and survey in the MA
Horse equine magazine in both the Dec 2015/Jan 2016 and Feb 2016/March 2016. The
survey was also featured on the MA Horse Magazine Facebook site with an appeal to fill
out and return the survey.
Request letter to 25 Massachusetts Equine Organizations (Appendix #2 for a list of these
organizations) to solicit their members to complete the survey
Request for assistance to the Equine Committee of Massachusetts Farm Bureau
Federation Inc.
Featured on several websites including MA Farm Bureau, the MA Department of
Agricultural Resources and Farm Credit East.
In all, 85 surveys were mailed back and 209 participants completed the online survey for a total
of 294 submitted surveys.
Interviews
Phone and in-person interviews were conducted with a wide range of direct and indirect
participants of the equine industry, including boarding stable owners, equine publications editor,
veterinarians, state and local officials, and others. The purpose of these interviews was twofold:
1) to get a better sense of the scope of the equine industry and 2) to estimate the amount of direct

8
employment at these establishments to be able to identify their sources of revenue and
expenditures.
Other Data Use
Data were also taken from a wide variety of reports and publications, several of which are noted
in Appendix #4.
IMPLAN
IMPLAN (IMpact Analysis for PLANning) is a computer program used to estimate the
economic and fiscal impacts of the equine industry in Massachusetts. IMPLAN is a computer
input-output modeling program originally developed by the US Department of Agriculture
Forest Service for resource management planning. It contains a mathematical representation of
the purchasing patterns that take place between sectors of an economy. A sector is a grouping of
industries in an economy and is based on NAICS (North American Industry Classification
System) codes as used by the US Federal Government. IMPLAN uses 509 sectors in its model.
Built into the IMPLAN data files are all of the industry sales, employment and income data for
each sector of the Massachusetts economy. IMPLAN uses the state data along with national
purchasing patterns (national input-output matrices) to create regional models.
Total Horse Population Estimates
In order to extrapolate the survey results in this report to the entire state, a base population of
horses was estimated.
This estimate is initially based on the 2012 Agricultural Census from the USDA National
Agricultural Statistics Service (NASS) which reported 1,804 farms containing 20,337 horses.
From there we looked at state report which summarized data, selecting the latest figures provided
within the last 4 years once for each potential location (within the state), but excluding the three
largest gathering locations such as Suffolk Downs or Fairs that might result in double counting
or the inclusion of animals from out of state. It is our best estimate that there are currently
around 25,950 horses residing in Massachusetts.
As a caution, this is an estimate for discussion and evaluation purposes only and any planning
based on these figures should be made judiciously and contain caveats that the above figure was
taken over an extended period of time and may contain significant inaccuracies: at least a portion
of intra-state transfers may be double counted or the animal involved may not be counted at all;
no import/export figures or birth/mortality rates were considered, no closures of facilities were
incorporated, animals temporarily housed elsewhere when a facility was examined were not
included, and there may be other imperfections in the count. However, we believe that our
estimate is a reasonable approximation of the horse population in Massachusetts.

9
This figure is not contextualized within long-term trends of equine population changes where it
might be useful in contributing to those trend illustrations but rather is a snapshot of the current
population.

10
4. US Equine Industry Overview The United States Horse Industry is a large and economically diverse industry that is a key
contributor to the overall fabric of the U.S. economy. Horse owners and industry suppliers,
racetracks and off-track betting operations, horse shows and other industry segments all generate
separate, and significant, economic activity contributing to the vibrancy of the overall industry.
The spending generated within the equine industry, and the subsequent spending between related
industries contributes thousands of jobs and billions of dollars to the economy on an annual
basis.
A 2005 equine study commissioned by the American Horse Council Foundation found that the
equine industry contributes roughly $39 billion on an annual basis to the U.S. economy through
direct spending. This refers to purchases made by individuals involved in the equine industry for
goods and services linked specifically to the industry and day-to-day operations.
This contribution is only a small part to the overall economic value of the equine industry. When
looking at an overall contribution to the US economy, including indirect expenses (purchases
made by industry suppliers and their suppliers associated with the finished product, such as
saddles, or services, such as veterinary clinics), and induced expenses (purchases made by
individuals employed by the US horse industry or the corresponding suppliers) the equine
industry generates approximately $102 billion in economic activity across the country.
A comprehensive breakdown shows that $32.0 billion comes from recreation, $28.8 billion from
horse shows, $26.1 billion from horse racing, and approximately $14.7 billion derived from other
industry segments.
This 2005 study showed that there were over 9.2 million horses in the US, with 3.9 million
involved in recreation and 2.7 million participating in horse shows.
Approximately 1.8 million people own horses, with another 2 million people involved as
volunteers or through a family affiliation.
Employment is another key factor when assessing the economic impact on a national level.
Overall, the horse industry provided 460,000 direct jobs and 960,000 indirectly associated jobs
for a combined total of slightly over 1.4 million jobs.
The horse industry pays roughly $1.9 billion in taxes on an annual basis to all levels of
government.

11
5. Massachusetts Equine Industry Overview
There are currently about 26,000 horses in Massachusetts. These animals are used for recreation,
trail riding, rehabilitation and therapy, racing and as work horses.
In the 2012 Agricultural Census, conducted by the USDA National Agricultural Statistics
Service, Massachusetts ranked 42nd
in the country based on the number of horses.
However, the equine industry in a metropolitan state like Massachusetts is very different than in
a more rural state. This is based on the type and diversity of equine operations and the
importance of maintaining open space and a rural landscape.
This is most evident as the residents of Massachusetts get to see and enjoy horses at a large
number of private and public events including the following disciplines:
Hunter Jumpers
Trail Riding
Dressage
Western
Saddle Seat
Carriage Driving
Polo
Eventing
These disciplines can be seen at the following public events:
Eastern States Exposition/Big E – The Eastern States Exposition is located in West Springfield
and hosts activities year round. It is the regional fair for New England. The highlight of the year
is “The Big E” (Open September 16 – October 2nd 2016), which set an attendance record in
2014 with just under 1.5 million visitors in a 17 day period. Part of the public attraction of the
Big E is the horse shows and exhibitions that are a daily part of the program.
On May 15, 2014 Eugene Cassidy, president and CEO of Eastern States Exposition stated that
the Big E has a $479 million impact and accounts for 3,000 Hampden County jobs.
It is impossible to accurately determine what percentage of these totals can be attributed to the
equine industry. If a figure as low as 10 percent is used, this would amount to a $48 million
impact and 300 jobs for Hampden County.
Massachusetts Agricultural Fairs – In 2016 there will be 45 agricultural fairs held in
Massachusetts (See Appendix #3 for listing of fairs and dates held).
In addition to Eastern States Exposition, both the Tri-County Fairgrounds in Northampton and
the Topsfield Fairgrounds in Topsfield host many regional horse shows annually during the
“offseason”. These horse shows likely generate a great deal of hotel and restaurant business.
No specific economic data was available on either fairground making an analysis of their
actual impact impossible to accurately calculate.

12
Equine Businesses
There are several equine businesses based in Massachusetts. Here is some information on four
of them:
Smart Pak Equine LLC – This privately held company was established in 1999 and is based in
Plymouth MA. It currently employs 190 people and it had revenue of $75.1 million in the most
recently reported period.
Kingston Trailers – This company was established over 50 years ago and is based in Kingston,
MA. It is a privately held company that sells primarily horse trailers through three dealerships in
Massachusetts and 11 dealerships in other states.
EquiFit – This company was established 15 years ago and is based in Dedham, MA. It is a
privately held company that specializes in a variety of products for top equestrian riders.
Tack Shops – In Massachusetts there are 22 tack shops listed online. They carry a significant
level of inventory which generates millions of dollars of revenue annually.
Colleges with Equestrian Programs
There are a number of colleges in Massachusetts that have equestrian programs. Here are some
of them:
Becker College
Cummings School of Veterinary Medicine at Tufts University
Johnson and Wales
Mount Holyoke College
Stockbridge School of Agriculture
Smith College
University of Massachusetts, Amherst
Financial Note: The fairs and Massachusetts businesses detailed above are presented to
illustrate the dynamic and public face of the equine industry. From a financial perspective the
value of their financial impact is included as part of the “indirect” financial impact of the
equine industry.

13
6. Economic Impact of the Massachusetts Equine Industry The direct impact of Massachusetts’s equine industry on the state’s economy was measured
based on gross business revenue, jobs and payroll created by the industry, and horse-farm related
expenditures made within Massachusetts. This information was gathered from the equine
industry survey outlined in Section 3 of this report. The results of this survey are summarized in
Section 11 of this report.
According to Michael Gold, the Equine Director of the Massachusetts Department of
Agricultural Resources, there are currently an estimated 25,950 horses in Massachusetts. This
number was used to calculate the economic impact of the equine industry in Massachusetts.
The survey of the Massachusetts equine industry included 294 responses representing 2,487
horses or 9.6 percent of the state’s total horse population of 25,950 horses. Of the 294 responses,
75, or 26 percent reported farm revenue. These respondents were considered to be commercial
enterprises, and the remaining 219 respondents showing no revenue were considered to be
personal horse owners with no commercial business activity.
These results were compared to statistics generated by a separate internet-based search of horse
owners in the Commonwealth of Massachusetts that revealed 2,302 total horse farms, 600 of
which (26 percent) marketed and/or offered commercial services. Both the equine survey results
and the search of the entire equine industry in Massachusetts indicated that roughly 26 percent of
the horse properties in Massachusetts are commercial enterprises (generating revenue) whereas
the remaining 74 percent are personal use only with no revenue generated.
To summarize, the 294 respondents to the equine survey break down as follows between
commercial enterprises and personal-use horse owners:
Respondents Percent Horses Percent
Commercial (with income) 75 26% 1,251 50% Personal Use Only (no income) 219 74% 1,236 50%
Total Respondents 294 100% 2,487 100%
14
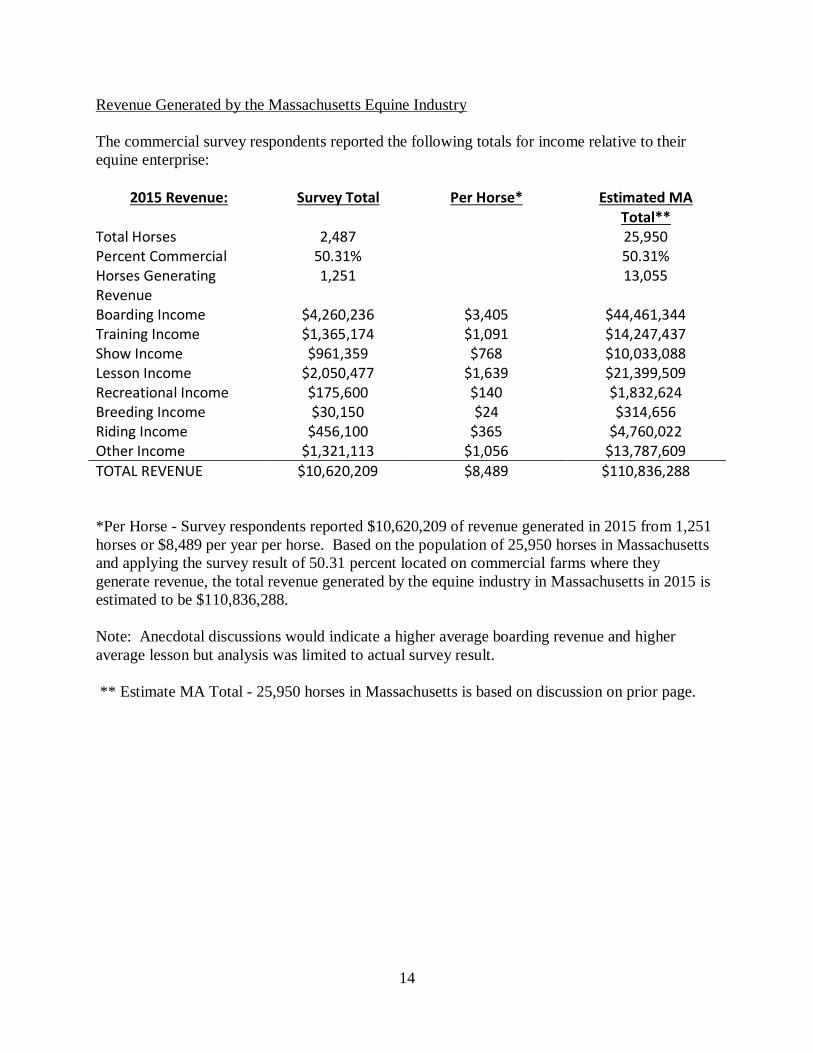
Revenue Generated by the Massachusetts Equine Industry
The commercial survey respondents reported the following totals for income relative to their
equine enterprise:
2015 Revenue: Survey Total Per Horse* Estimated MA Total**
Total Horses 2,487 25,950 Percent Commercial 50.31% 50.31% Horses Generating Revenue
1,251 13,055
Boarding Income $4,260,236 $3,405 $44,461,344 Training Income $1,365,174 $1,091 $14,247,437 Show Income $961,359 $768 $10,033,088 Lesson Income $2,050,477 $1,639 $21,399,509 Recreational Income $175,600 $140 $1,832,624 Breeding Income $30,150 $24 $314,656 Riding Income $456,100 $365 $4,760,022 Other Income $1,321,113 $1,056 $13,787,609
TOTAL REVENUE $10,620,209 $8,489 $110,836,288
*Per Horse - Survey respondents reported $10,620,209 of revenue generated in 2015 from 1,251
horses or $8,489 per year per horse. Based on the population of 25,950 horses in Massachusetts
and applying the survey result of 50.31 percent located on commercial farms where they
generate revenue, the total revenue generated by the equine industry in Massachusetts in 2015 is
estimated to be $110,836,288.
Note: Anecdotal discussions would indicate a higher average boarding revenue and higher
average lesson but analysis was limited to actual survey result.
** Estimate MA Total - 25,950 horses in Massachusetts is based on discussion on prior page.

15
Expenditures Generated by the Massachusetts Equine Industry
Of the respondents that were personal use (no income) some reported expenses and some did not.
These broke down as follows:
Respondents Percent Horses Percent
Personal Use (with expenses reported) 99 33% 501 20% Personal Use (with no expenses reported)
120 41% 735 30%
From this data, a “cost per horse” was calculated and used to apply to the entire horse population
in Massachusetts. With the exception of labor costs, the cost per personal horse and cost per
horse on a commercial farm were considered to be the same, and those costs were calculated
based on the 174 total respondents that reported expenses. However, while personal use horse
owners have comparable horse related expenses (for items like grain, hay, bedding, vet, supplies,
insurance, tack, clothing, etc.) there was a significant differential observed for payroll cost.
Personal horse owners tend to care for their own animals and do not incur a cost for payroll.
There are some exceptions, where some do hire assistance in caring for their horses. By
analyzing the commercial respondents versus the personal respondents the following differential
was noted for payroll cost:
Payroll Cost Per Horse
Commercial Farms $1,737 Personal Use Owners $172
Of the 294 survey respondents, 174 or 59 percent reported expenditures. These respondents
represented 1,752 or 70 percent of the horses represented in the survey results. The following is a
summary of these expenditures with the above differential* factored in for payroll costs between
the commercial and personal farms:
2015 Expenditures Survey Total Per Horse Within 25 Miles $6,570,507 $3,751 Within Massachusetts $8,719,824 $4,978 Payroll (Commercial) $3,041,923 $1,737 Real Estate Taxes $1,011,559 $578
TOTAL EXPENSES $12,773,306 $7,293 Capital Purchases $1,637,430 $935
TOTAL OUTLAY $14,410,736 $8,228
Labor (on personal horses) $86,102 $172
The above per horse costs were applied to the Massachusetts horse population to arrive at the
total direct economic impact of the equine industry in Massachusetts with the lower labor cost
applied to the personal horses as compared to the commercially located horses. These
calculations are summarized in the table below:

16
2015 Expenditures On Commercial Farms On Personal Farms Estimated MA Total Percent of Total Horses
50.31% 49.69% 100%
Estimated Total Horses
13,055 12,895 25,950
Expenditures within MA
$64,998,569 $64,193,231 $129,191,800
Payroll* Cost $22,674,843 $2,215,987 $24,890,829 Real Estate Taxes $7,540,276 $7,446,851 $14,987,126
TOTAL EXPENSES $95,213,687 $73,856,068 $169,069,756 Capital Purchases $12,205,363 $12,054,363 $24,259,953
TOTAL OUTLAY $107,419,278 $85,910,431 $193,329,709
Jobs Provided by the Massachusetts Equine Industry
The total Massachusetts equine workforce was calculated using the survey results, which
represented 9.6 percent of the horses in Massachusetts and projecting that out over the entire
horse population in Massachusetts. The following table summarizes these results:
Workforce: Survey Total Per Farm MA Total
Owners 229 0.78 2,390 Unpaid Family 147 0.50 1,534 Full Time Employees 94 0.32 981 Part Time Employees 143 0.49 1,492 Seasonal Employees 72 0.24 751
TOTAL WORKERS 685 2.33 7,149
Based on this analysis, the Massachusetts equine industry employs a total workforce of about
7,149 people including owners, family, and full-time, part-time, and seasonal employees.
Note: This total does not include indirect jobs in the equine industry as there was no way to
accurately estimate this total.

17
Overview of Total Economic Impact
To arrive at the overall economic impact, the following rationale was followed:
Direct Spending - The starting point is the calculation of the direct spending of the equine industry in Massachusetts as extracted from the equine industry survey and presented in the above table.
$193,329,709
Fiscal benefits are then considered such as job creation and government revenues (taxes and or fees). With the exception of income taxes, all fees, sales, and property taxes, and jobs (wages) are assumed to be included in the amount calculated in #1 above. Commercial businesses are the sole source of income tax generation. The estimated gross income from the commercial horse farms in Massachusetts is estimated at $110,836,288, with offsetting expenses of $107,419,278 leaving a potential taxable income of $3,417,010 or 3.1% of revenue. However, since the expenditures do not include any funds spent outside of Massachusetts it is considered reasonable to conclude that at least 3% additional was spent which would result in zero taxable income, therefore zero additional fiscal benefits (outside those already included in #1 above) are estimated.
$0.00
Potential Leakages – This includes any funds that exit the state such as outside taxes or spending outside of the state. Since the survey requested only expenditures paid within the state and no federal income taxes were included (some of which would exit the state), no “economic leakage” is considered to exist.
$0.00
Multiplier Effect – Direct spending actually has a multiplier effect in its economic impact. This is because spending from one source results in re-spending within the region by employees and vendors that receive payment from the industry. Recognized multiplier factors for agriculture is typically in the range of 1.6 to 2.2. The multiplier is driven by the degree monies are re-spent locally. If for example, a business primary purchases a raw material that is imported from outside the region, this would drive the multiplier down. No exact multipliers exist for the equine industry but since most services and employees of small horse farms and personally owned pleasure horses are local in nature a multiplier of 2.0, at the higher end of this range, has been chosen.
2.0
Multiplier Effect
Total Economic Impact $386,659,418
The current total direct and indirect economic impact of the Massachusetts equine industry is
estimated at $386,659,418 per year.

18
7. Fiscal (Tax) Impact of the Massachusetts Equine Industry
The fiscal impact of the equine industry is the tax revenue it generates for state and municipal
government. This includes income, property, sales, fuel, licensing fees, etc.
Income Taxes – As discussed in the economic impact section of this report, it is assumed there is no taxable income generated by the equine industry as indicated by the income and expenses which suggest a breakeven industry at best.
$0.00
Property Taxes – as outlined in the economic impact section of this report, the equine industry is estimated to contribute property taxes to local municipalities
$14,987,126
Sales Taxes - Massachusetts 6.25% sales tax applies to a portion of the expenditures of horse farms. Some items are not taxable, such as feed, seed, and fertilizer used for agricultural production. Additional items are exempt if the farm obtains farm sales and use tax exemption certificate with the Massachusetts Department of Revenue (items including tools, fuel, farm machinery, etc.) Data is not available on how much sales tax is paid by the equine industry but has been estimated as follows:
Commercial farms likely holding a sales and use tax exemption are estimated to pay sales tax on 10% of total expenditures: $77,204160 X 10% taxable X 6.25% tax = $482,526
Personal horse owners typically would not hold an exemption and are estimated to pay sales tax on 50% of expenditures: $76,247,594 X 50% taxable X 6.25% tax = $2,382,737
$2,865,263
Fuel and other taxes unable to estimate.
Total Fiscal Impact $17,852,389
Based on this analysis, the fiscal impact of the equine industry in Massachusetts is based on
taxes paid to state and local municipalities totals at least $17,852,389 per year.

19
8. Massachusetts Equine Industries Impact on Land Use
The equine survey gathered information on land used by the survey participants. This
represented 9.6 percent of the horses in the commonwealth so those results were used to project
the overall impact of equine industries land use in the Massachusetts. These results are
summarized in the following table:
Land Use Survey Acres
Percent Acres Per Farm
Acres Per Horse
MA Total Acres
Farmstead 1,102 28% 3.7 0.44 11,499 Tillable (farmed)
463 12% 1.6 0.19 4,836
Pasture 828 21% 2.8 0.33 8,638 Woodland 1,515 39% 5.2 0.61 15,813
TOTAL OWNED 3,908 100% 13.3 1.57 40,786 Rented Land 890 21% 3.0 0.36 9,291
The Massachusetts equine industry utilizes an estimated 40,786 acres of owned land plus an
additional 9,291 acres of rented land. This provides benefits to Massachusetts residents:
Contributes to maintaining open space and scenic areas in the region that contributes to a
higher quality of life and enhanced opportunity for tourism.
Several studies have been done that support that residential homes generate an excess in
service costs to the community compared to what they generate in tax revenues whereas
agricultural and open space land costs local towns significantly less in services that they
generate in property tax revenue. Therefore, this acreage being dedicated to the equine
industry rather than being developed into residential home sites provides a fiscal benefit
to towns in Massachusetts.
20
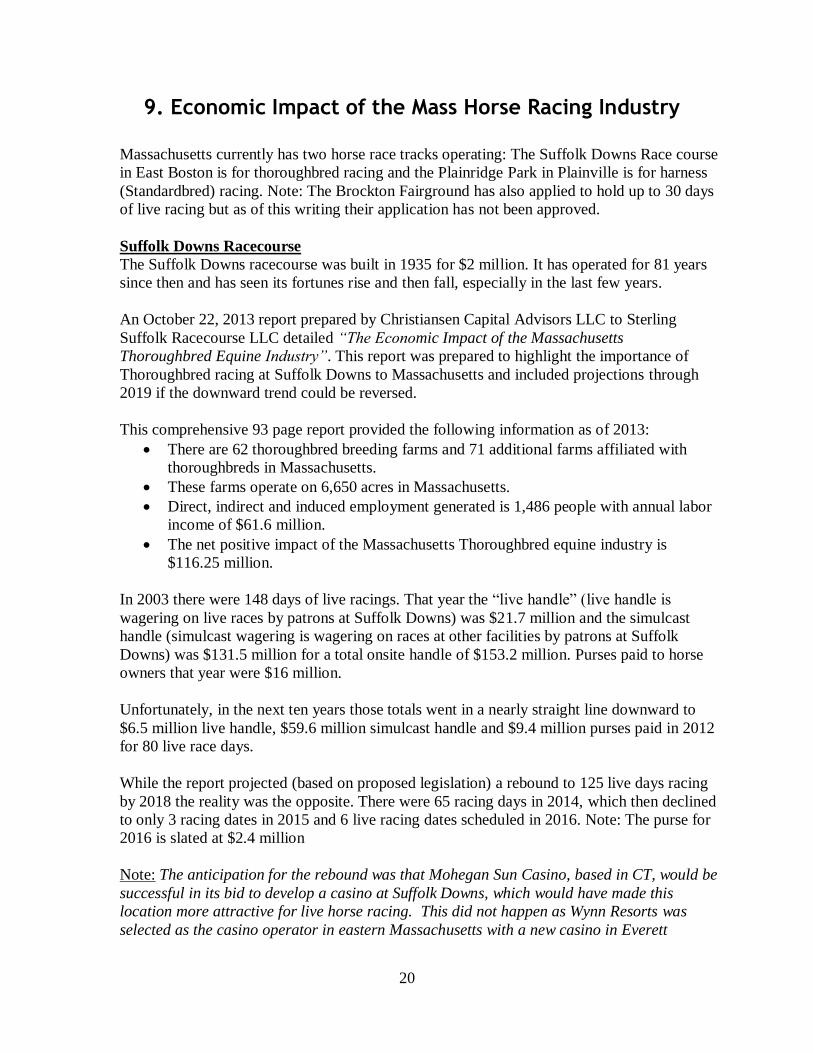
9. Economic Impact of the Mass Horse Racing Industry
Massachusetts currently has two horse race tracks operating: The Suffolk Downs Race course
in East Boston is for thoroughbred racing and the Plainridge Park in Plainville is for harness
(Standardbred) racing. Note: The Brockton Fairground has also applied to hold up to 30 days
of live racing but as of this writing their application has not been approved.
Suffolk Downs Racecourse
The Suffolk Downs racecourse was built in 1935 for $2 million. It has operated for 81 years
since then and has seen its fortunes rise and then fall, especially in the last few years.
An October 22, 2013 report prepared by Christiansen Capital Advisors LLC to Sterling
Suffolk Racecourse LLC detailed “The Economic Impact of the Massachusetts
Thoroughbred Equine Industry”. This report was prepared to highlight the importance of
Thoroughbred racing at Suffolk Downs to Massachusetts and included projections through
2019 if the downward trend could be reversed.
This comprehensive 93 page report provided the following information as of 2013:
There are 62 thoroughbred breeding farms and 71 additional farms affiliated with
thoroughbreds in Massachusetts.
These farms operate on 6,650 acres in Massachusetts.
Direct, indirect and induced employment generated is 1,486 people with annual labor
income of $61.6 million.
The net positive impact of the Massachusetts Thoroughbred equine industry is
$116.25 million.
In 2003 there were 148 days of live racings. That year the “live handle” (live handle is
wagering on live races by patrons at Suffolk Downs) was $21.7 million and the simulcast
handle (simulcast wagering is wagering on races at other facilities by patrons at Suffolk
Downs) was $131.5 million for a total onsite handle of $153.2 million. Purses paid to horse
owners that year were $16 million.
Unfortunately, in the next ten years those totals went in a nearly straight line downward to
$6.5 million live handle, $59.6 million simulcast handle and $9.4 million purses paid in 2012
for 80 live race days.
While the report projected (based on proposed legislation) a rebound to 125 live days racing
by 2018 the reality was the opposite. There were 65 racing days in 2014, which then declined
to only 3 racing dates in 2015 and 6 live racing dates scheduled in 2016. Note: The purse for
2016 is slated at $2.4 million
Note: The anticipation for the rebound was that Mohegan Sun Casino, based in CT, would be
successful in its bid to develop a casino at Suffolk Downs, which would have made this
location more attractive for live horse racing. This did not happen as Wynn Resorts was
selected as the casino operator in eastern Massachusetts with a new casino in Everett

21
scheduled to open in late 2017. This will likely limit live racing at Suffolk Downs to special
events, as in 2015 and 2016.
Plainridge Park
Plainridge Park was opened in 1999 in Plainville. While it is generating more than $200
million annually at its Casino the horse racing side has been more modest.
Live racing days has grown to 114 in 2016. However, live handle declined from $2.4 million
in 2007 to $1.5 million in 2011. Purses also declined from $3.1 million to $2.5 million. No
more recent information is available.
Net Result
Horse racing, while still important to Massachusetts is much more of a niche market
compared to the information provided above. The net positive impact to Massachusetts in
2015 is well below the $116.25 million reported in 2012, though the exact amount can’t be
calculated without significant additional information.

22
10. Issues in the Mass Equine Industry Survey Question #15
As part of the survey we asked survey participants in question #15 (see Appendix #1) to “Please
rank the following, in order of priority, in which they pose a problem or concern to you relative
to the operation of your farm from the #1 most concern through #10 least concern.
Here are the rankings from the 294 survey participants:
Category Ranking
Liability 3.07
Availability of feed 3.57
Neighbor complaints re farm operation 4.21
Hiring help 5.11
Regulations affecting farm operation 5.12
Trespassing/vandalism 5.22
Availability of machinery/parts 5.31
Availability of vet and farrier services 5.37
Marketing your farm operation 6.07
Availability of technical assistance 6.50
Survey Question #16
The final question (#16) asked for your comments and thoughts. We stated “Please provide your
thoughts about what’s important to the equine industry in Massachusetts. If we receive a
significant number of similar answers in a particular category they may be included in the study”
There were two items that stood out.
Need more trail riding options available, especially on state land – this was by far the
most common comment.
Land is too expensive and not easy to find due to residential pressure.

23
11. Survey Results
A summary of the results of the equine survey are attached in the following table. Several
areas of the survey have been discussed in other sections of this report. The following
topics addressed in the survey provide additional insights and understanding into the
present and future impact of the equine industry in Massachusetts:
Size of Enterprise:
Average enterprise size is very small. The following table summarizes the enterprises by
size:
Size Percent of Enterprises Under 25 horses 89.46% 25 to 49 horses 9.86% 50 to 99 horses 0.34% Over 100 horses 0.34%
Description of Massachusetts Equine Enterprises:
Massachusetts equine enterprises are diverse in their offerings. 36 percent offer
boarding, 29 percent offer recreational riding, 24 percent offer training, 23 percent offer
lessons, and 18 percent offer horse show activities. Less than 10% of the enterprises offer
racing, therapeutic riding, breeding and/or other services.
It is recognized that some double counting of horses may exist in the equine survey, as a
personal horse owner may have reported on their horse that may also be counted by the
boarding enterprise. However, it could be likely as well that some horses were missed in
the survey. This is not considered to have a significant statistical impact on the survey.
While the primary type of enterprise was described as personal, the most common
commercial activity on the equine enterprises in Massachusetts is boarding horses for
horse owners that do not have the capacity or interest to house their animals.
Recreational riding and lesson facilities are the 2nd
and 3rd
most common type of
enterprise in Massachusetts.
The average age of owners of equine enterprises is 54 years with 22 percent reporting
they have a next generation in place to carry on with the business. 22 percent of the
industry reported planning to be in business for more than 20 more years and only 3
percent indicated they would likely be in business for less than 5 more years. 20 percent
indicated that they have plans to expand or diversify.

24
The top 5 challenges or concerns of the equine owners were ranked as follows:
1. Liability
2. Availability of feed (primarily hay)
3. Neighbor complaints
4. Hiring help
5. Regulations affecting the business
2015 Massachusetts Equine Study
Summary of Survey Results
Land Use: Acres Percent Per Farm Per Horse MA Total
Farmstead 1102 28% 3.7 0.44 11499
Tillable 463 12% 1.6 0.19 4836
Pasture 828 21% 2.8 0.33 8638
Wooded 1515 39% 5.2 0.61 15813
TOTAL OWNED 3908 100% 13.3 1.57 40786
RENTED ACRES 890 21% 3.0 0.36 9291
TOTAL FARMED 4177
14.2 1.68 43589
Horse Ownership: Horses Percent Per Farm
Personal 873 35% 3.0
Business 483 19% 1.6
Owned by Others 1131 45% 3.8
TOTAL 2487 100% 8.5
Total Horses in MA 25950 9.6%
Farms with: Number Percent
Under 25 horses 263 89.46%
25 to 49 horses 29 9.86%
50 to 99 horses 1 0.34%
100 or more horses 1 0.34%
Total 294 100.00%

25
Services offered on Farm:
Personal 135 46%
Boarding 106 36%
Training 71 24%
Shows 52 18%
Lessons 69 23%
Recreation 85 29%
Racing 9 3%
Breeding 25 9%
Therapeutic Riding 11 4%
Other 25 9%
TOTAL 294 100%
Primary Type of Farm:
Personal 64 22%
Boarding 29 10%
Lessons 14 5%
Recreation 26 9%
Breeding 3 1%
Riding 9 3%
Other 12 4%
Not Stated 137 47%
TOTAL 294 100%
Survey
Per Farm
Per Horse
2015 Revenue: Total Per Farm w/revenue MA Total w/Revenue
Boarding $ 4,260,236 $ 14,491 $ 56,803 $ 44,461,344 $ 3,405
Training $ 1,365,174 $ 4,643 $ 18,202 $ 14,247,437 $ 1,091
Shows $ 961,359 $ 3,270 $ 12,818 $ 10,033,088 $ 768
Lessons $ 2,050,477 $ 6,974 $ 27,340 $ 21,399,509 $ 1,639
Recreation $ 175,600 $ 597 $ 2,341 $ 1,832,624 $ 140
Breeding $ 30,150 $ 103 $ 402 $ 314,656 $ 24
Riding $ 456,100 $ 1,551 $ 6,081 $ 4,760,022 $ 365
Other $ 1,321,113 $ 4,494 $ 17,615 $ 13,787,609 $ 1,056
TOTAL $ 10,620,209 $ 36,123 $ 141,603 $ 110,836,288 $ 8,489
26
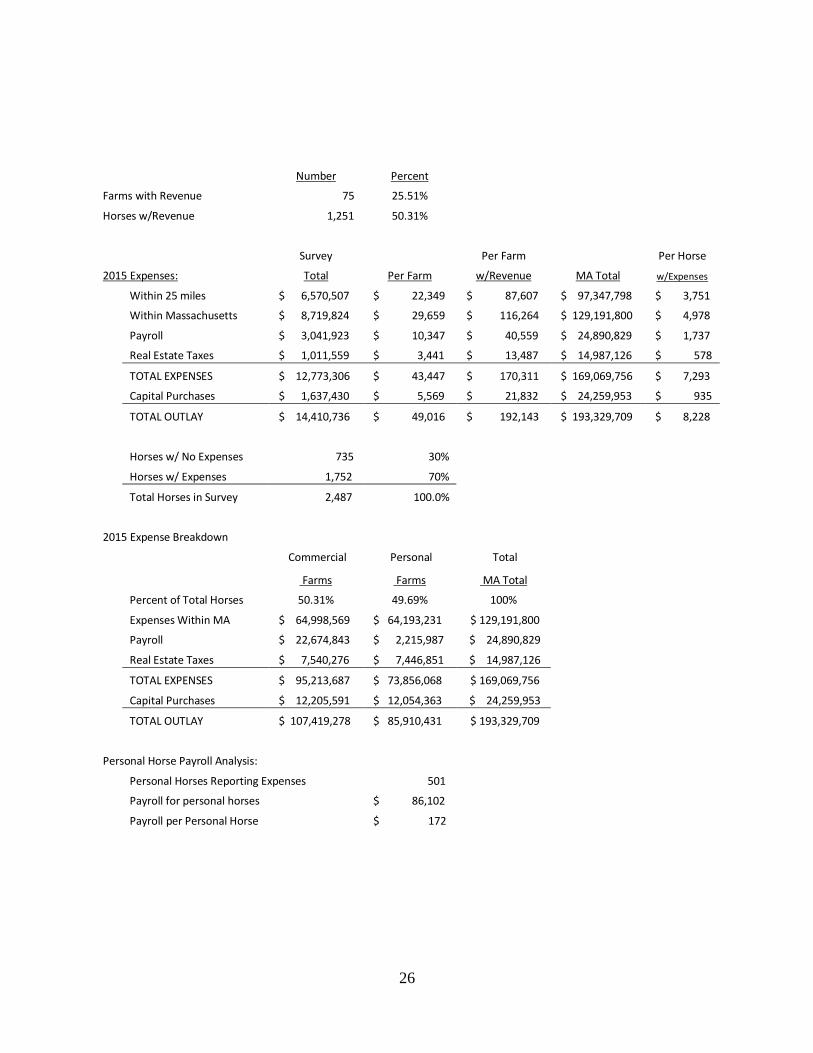
Number Percent
Farms with Revenue 75 25.51% Horses w/Revenue 1,251 50.31%
Survey
Per Farm
Per Horse
2015 Expenses: Total Per Farm w/Revenue MA Total w/Expenses
Within 25 miles $ 6,570,507 $ 22,349 $ 87,607 $ 97,347,798 $ 3,751
Within Massachusetts $ 8,719,824 $ 29,659 $ 116,264 $ 129,191,800 $ 4,978
Payroll $ 3,041,923 $ 10,347 $ 40,559 $ 24,890,829 $ 1,737
Real Estate Taxes $ 1,011,559 $ 3,441 $ 13,487 $ 14,987,126 $ 578
TOTAL EXPENSES $ 12,773,306 $ 43,447 $ 170,311 $ 169,069,756 $ 7,293
Capital Purchases $ 1,637,430 $ 5,569 $ 21,832 $ 24,259,953 $ 935
TOTAL OUTLAY $ 14,410,736 $ 49,016 $ 192,143 $ 193,329,709 $ 8,228
Horses w/ No Expenses 735 30%
Horses w/ Expenses 1,752 70%
Total Horses in Survey 2,487 100.0%
2015 Expense Breakdown
Commercial Personal Total
Farms Farms MA Total
Percent of Total Horses 50.31% 49.69% 100%
Expenses Within MA $ 64,998,569 $ 64,193,231 $ 129,191,800
Payroll $ 22,674,843 $ 2,215,987 $ 24,890,829
Real Estate Taxes $ 7,540,276 $ 7,446,851 $ 14,987,126
TOTAL EXPENSES $ 95,213,687 $ 73,856,068 $ 169,069,756
Capital Purchases $ 12,205,591 $ 12,054,363 $ 24,259,953
TOTAL OUTLAY $ 107,419,278 $ 85,910,431 $ 193,329,709
Personal Horse Payroll Analysis:
Personal Horses Reporting Expenses 501
Payroll for personal horses $ 86,102
Payroll per Personal Horse $ 172

27
Survey
Workforce: Total Per Farm MA Total
Owners 229 0.78 2390
Unpaid Family 147 0.50 1534
Full Time Employees 94 0.32 981
Part Time Employees 143 0.49 1492
Seasonal Employees 72 0.24 751
TOTAL 685 2.33 7149
Average
Age of Primary Owner 54 Next Generation? 22% How Long to Stay Farming?
Don't Know 41%
Less than 5 years 3%
5 to 10 years 14%
10 to 20 years 20%
More than 20 years 22%
Plans to Diversify/Expand? 20%
Ranking of Concerns/Challenges: 1 Liability 3.07 2 Availability of Feed 3.57 3 Neighbor Complaints 4.21 4 Hiring Help 5.11 5 Regulations 5.12 6 Trespassing/Vandalism 5.22 7 Availability of Parts 5.31 8 Availability of Vet 5.37 9 Marketing 6.07
10 Availability of Tech Assistance 6.50

28
Appendix #1 – Copy of Cover Letter and Equine Survey

29

30
Appendix #2 – List of Massachusetts Equine Organizations
Barre Riding and Driving Club. www.barreridinganddrivingclub.com
Bay State Trail Riders Association. www.bstra.org
Charles River Dressage Association. www.crdressage.org
Belchertown Equine Organization. www.belchertownequineorg.com
Colonial Carriage and Driving Society. www.colonialcarriage.org
Cape Cod Dressage Association. www.capecoddressage.org
Connecticut River Valley Arabian
Association. www.orgsites.com/ct/connecticutriverarabian
Granby Regional Horse Council. www.granbyregionalhorse.org
Hampshire County Riding Club. www.hampshirecountyridingclub.org
Hanover Hunt and Riding Club. www.briggsstable.com
Hanson Riding Club . www.hansonridingclub.org
Massachusetts Horse Council. www.mahorsecouncil.com
Massachusetts Morgan Horse Association. www.massmorgan.com
Massachusetts Quarter Horse Association. www.massqha.com
Myopia Hunt. www.myopiahunt.org
Nashoba Valley Hunt. www.nashobavalleyhunt.org
Myopia Driving Club. www.themyopiadrivingclub.com
New England Equestrian Center of Athol. www.neeca.org
North Atlantic Buckskin Association
North Shore Horsemen’s Association. www.northshorehorsemens.org
Old North Bridge Hounds. www.oldnorthbridgehounds.org
Pepperell Horse Owners Association . www.phoa.info
South County Riders
Southeast Hunter Association. www.southeasthunter.com
South Shore Horsemen's Council. www.sshconline.com
Western Massachusetts Appaloosa Association. www.westernmaaap.homestead.com
Western New England Professional Horsemen's Association. www.wnepha.com
Westfield Riding Club. www.westfieldridingclub.org
West Newbury Riding and Driving Club. www.wnrdc.com

31
Appendix #3 – List of 2016 Massachusetts State Agricultural Fairs

32

33
Appendix #4 – List of Key References Used
The Economic Impact of the Equine Industry in Maine, September 20, 2007, prepared by
Planning Decisions Inc. for The Maine Harness Racing Promotion Board and the Maine
Farm Bureau Horse Council.
Tennessee’s Equine Industry: Overview and Estimated Economic Impacts dated April,
2010, prepared by the Institute of Agriculture, Department of Agricultural Economics.
The Economic Impact of the Massachusetts Thoroughbred Equine Industry, dated
October 22, 2013, prepared by Christiansen Capital Advisors, LLC for the Sterling
Suffolk Racecourse, LLC.
Most Comprehensive Horse Study Ever Reveals a Nearly $40 Billion Impact on the US
Economy, dated June 28, 2015 by the American Horse Council.
2016 Massachusetts Agricultural Fairs directory
2012 NASS Equine Statistics taken from the NASS website.
MA Horse Magazine, its editor, Stephanie Sanders, plus its website and Facebook site.
Country Folks “Mane Stream” publication.
The Equestrian Channel Website – US Horse Industry Statistics
Suffolk Downs Website
PlainRidge Park Website
Michael Gold, Equine Program Coordinator in the Massachusetts Energy and
Environmental Affairs.
Doug Gillespie, Executive Director, Massachusetts Farm Bureau Federation, Inc.
Multiple other website sources for specific equine industry specific information.
Interviews with numerous horse farm owners, tax shop owners, vets and others involved
in the equine industry.
Prepared by: Jon Jaffe and Richard Hermonot, Farm Credit East. June 2016