The Economic Impact of Premature Adult Mortality: Panel ... may augero ravindranath.pdf · the...
21
1 The Economic Impact of Premature Adult Mortality: Panel Data Evidence from KwaZulu-Natal, South Africa Michael R Carter, Julian May, Jorge Agüero and Sonya Ravindranath 1 Paper submitted to a Special Edition of AIDS. 20/04/07 Running Head: Economic Impact of Adult Mortality Word count: 4317 including footnotes. 1 / Respectively: Professor, Dpt. of Applied and Agricultural Economics, University of Wisconsin-Madison; Associate Professor, School of Development Studies, University of KwaZulu-Natal; Assistant Professor, University of California-Riverside, and Graduate student, University of Wisconsin-Madison. The work reported here is an outcome of a collaborative project between researchers at the University of KwaZulu- Natal, the University of Wisconsin-Madison, the London School of Hygiene & Tropical Medicine, the Norwegian Institute of Urban and Regional Studies, the International Food Policy Research Institute (IFPRI) and the South African Department of Social Development. In addition to these institutions, financial support was provided by: Department for International Development (DFID); the United States Agency for International Development (USAID); the Mellon Foundation; and a National Research Foundation/Norwegian Research Council grant to the University of KwaZulu-Natal. The authors have no conflicts of interest, including financial, consultant, institutional and other relationships that might lead to bias or a conflict of interest. Contact details: [email protected] ;
-
Upload
truongthien -
Category
Documents
-
view
213 -
download
0
Transcript of The Economic Impact of Premature Adult Mortality: Panel ... may augero ravindranath.pdf · the...

1
The Economic Impact of Premature Adult Mortality: Panel Data Evidence from KwaZulu-Natal, South Africa
Michael R Carter, Julian May, Jorge Agüero and Sonya Ravindranath1
Paper submitted to a Special Edition of AIDS. 20/04/07
Running Head: Economic Impact of Adult Mortality
Word count: 4317 including footnotes.
1/ Respectively: Professor, Dpt. of Applied and Agricultural Economics, University of Wisconsin-Madison; Associate Professor, School of Development Studies, University of KwaZulu-Natal; Assistant Professor, University of California-Riverside, and Graduate student, University of Wisconsin-Madison. The work reported here is an outcome of a collaborative project between researchers at the University of KwaZulu-Natal, the University of Wisconsin-Madison, the London School of Hygiene & Tropical Medicine, the Norwegian Institute of Urban and Regional Studies, the International Food Policy Research Institute (IFPRI) and the South African Department of Social Development. In addition to these institutions, financial support was provided by: Department for International Development (DFID); the United States Agency for International Development (USAID); the Mellon Foundation; and a National Research Foundation/Norwegian Research Council grant to the University of KwaZulu-Natal. The authors have no conflicts of interest, including financial, consultant, institutional and other relationships that might lead to bias or a conflict of interest. Contact details: [email protected];

1
The Economic Impact of Premature Adult Mortality: Panel Data Evidence from KwaZulu-Natal, South Africa
1 Introduction At the end of 2003, 5.3 million people were estimated to be living with HIV in South
Africa, the highest number of any country in the world. Further, HIV prevalence among
adults 15-49 years of age in South Africa is estimated at 21.5%, compared to 7.5% in
sub-Saharan Africa and 1.1% globally. As the epidemic moves from infection into
impact, premature adult mortality rates are increasing rapidly with an estimated 370,000
South Africans dying of AIDS-related illness in 2003, making the disease the leading
cause of death in almost all South African provinces (MRC, 2004). Moreover, while it is
thought that HIV prevalence in South Africa may be approaching its plateau, the majority
of AIDS-related deaths have yet to happen (MRC, 2004).
An increasing number of studies are focusing on the measurement of the economic
impact of AIDS-related deaths at the level of the household (Gertler et al, 2004; Naidu
and Harris, 2005; Yamano and Jayne, 2003; Yamano et al, 2004), and most conclude that
this impact is likely to be significant. A limitation of some studies is the tendency to treat
those affected as a homogenous group with similar trajectories prior to the shock that is
induced by the AIDS-related death. As a result, the impact measured is for the ‘average’
household observed at a single moment in time. As UNECA (2003:5) have commented,
economic models of the impact of AIDS-related illness and death have thus yet to capture
the immiseration impact at the household level.
Some studies do make use of panel data to delve into the dynamics of poverty status and
the impact that premature deaths have on successful pathways from poverty (Chapoto and
Jayne, 2005; Grimm, 2006; Jayne et al. 2006). Using such data, in an unpublished paper,

2
Dercon, Beegle and de Weerdt describe the possibility of recovery from the shock that
may vary according to wealth and the time that has elapsed since the death event. Using
similar data from South Africa, we break down the impact of the premature death of
adults from illness according to the initial conditions of the households in which these
deaths have occurred.
2 The Economic Impact of HIV/AIDS: Medical Approaches and Impact Assessments
In countries in which there has been high HIV prevalence, death is preceded by a
comparatively lengthy episode of illness that presents households with a protracted shock
episode characterized by a series of events that occur as the illness progresses. This is
recognized in public health studies of other diseases which have noted events such as
increasingly frequent bouts of illness, withdrawal from the labour market, high economic
and social costs of the illness that increase over time, and eventually, the death itself.
Moreover, in many cultures, this is not necessarily an event that signals the end of the
episode since funeral celebrations are required that necessitate further expenditure and
possible indebtedness (Stover and Bollinger, 1999). Even these may extend over several
years if there are annual celebrations or customs that are observed.
In this context, illness resulting from HIV infection, and the death that may follow, can
be conceptualized as a ‘dosage’ which varies in its duration and severity. Likewise, in the
language of vulnerability analysis, households may be thought of as social units with
varying ability to cope with the shock (Moser, 1998). Davies (1996) offers useful insights
from an anthropological perspective that shows how a poverty trap situation can emerge
for resource-poor households. The living standards of vulnerable households that face
3
multiple shocks over time may ratchet down over time to the point at which they
eventually become trapped in a situation of structural poverty.
In this context of high HIV prevalence, these ideas of repeated shocks have an important
resonance. However as already mentioned there are some key features that distinguish
premature adult mortality from the economic shocks described by Davies. First,
morbidity diminishes labour capacity over the duration of illness, whereas a death results
in the permanent loss of an individual. This implies that households will need to adjust to
the long-term loss of this individual's labour and related income, in addition to the loss of
management and caring skills and acquired human capital investments. Second, in the
case of higher mortality due to AIDS-related illness, the deaths are preceded by severe
debilitating illness resulting in limitations in activities of daily living. Moreover, these
deaths are concentrated among younger adults, who are typically the most economically
productive household members. Finally, adult mortality due to illness may be anticipated
to some extent by the household. Thus, households may adopt ex ante strategies to cope
with an impending adult death, alternatively thought of as ex post illness response
(Beegle, 2003).
Some of these changes are not necessarily unique to the HIV epidemic. Discussing the
impact of malaria, Sachs and Malaney (2002:3) note the costs associated with changes in
the behaviour of household members concerning decisions such as schooling, child-
bearing, savings and work-seeking are often overlooked when measuring the economic
impact of disease. Correspondingly, some of the changes adopted in the case of AIDS-
related illness or death may well be similar. In Tanzania, for example, it has been shown

4
that children may marry earlier, drop out of school to help support the family, and take on
informal labor schemes (Ainsworth and Semali, 2000).
Delving further into the sequencing of these changes, notions of ‘episodes of illness’ and
‘episodes of care’ have been used in other health analyses to show how time matters
when measuring the impact of illness and death (Hornbrook et al, 1985). In the case of
AIDS related deaths, Beegle (2003) reports that the average length of debilitating illness
preceding death in Tanzania was 12 months, while another Tanzanian study shows that
on average, an adult experiences 17 different episodes of illness prior to dying (Bollinger
et al, 1999:5). Each of these is likely to be accompanied by episodes of care which
become more costly as death approaches.
While these studies are revealing in terms of the hardship experienced by those who are
living with HIV, and those who are providing care, the approach also offers new clues as
to how the full economic impact of the disease can be assessed at the household level.
Notions of dosage and episode are similar to ideas used in the impact assessment
literature, more usually concerned with identifying the changes that can be ascribed to
specific interventions whether in health care as first applied, or more recently in social
policy. In turn, impact assessment has shown the particular usefulness of panel data when
analyzing the economic impact of the death.
3 The KwaZulu-Natal Income Dynamics Study The KwaZulu-Natal Income Dynamics Study (KIDS) opens a window of analysis on to a
pre-HIV era, as well as the period leading up to the mortality rates noted earlier. The data
collected for this study were initially part of the Project for Statistics on Living Standards
and Development (PSLSD) undertaken in second half of 1993: the first nationally

5
representative household survey in South African to investigate poverty, inequality and
socio-economic dynamics (PSLSD 1994).
African and Indian households visited by the PSLSD were re-surveyed in the KwaZulu-
Natal province in 1998 and again in 2004 to form the KIDS panel data. May et al, (2000)
and (2007) provide full details of the resurvey and its limitations. For this purposes of
this paper we should note that households for eligible for resurvey were those in which
key decision-makers resided, termed ‘Core’ persons as is documented by May et al
(2000). Households where cores spilt during this period were followed up wherever
feasible, along with the adult children of core household members who had established
their own households and who had children of their own.2 On completion of fieldwork in
2004, data had been collected from 865 households containing core members from 760 of
the 1354 eligible households first interviewed in 1993. For 180 of these 760 ‘dynasties’,
information was also collected on one or more next generation households that had split
off from them. Information is thus available from 2004 for 74% of the dynasties
contacted in 1998 and 62% of the eligible households interviewed in 1993.
As May et al, (2007:12) report, the KIDS data show that at ages 20-44, the proportion of
people dying between the second and third waves was nearly three times the proportion
dying between the first two waves. The implication is that mortality in these age groups
has more than doubled. The age-specific mortality patterns within these age groups reveal
patterns similar to those found elsewhere in African populations with a high HIV
prevalence, a pattern found to be attributable to deaths from AIDS-related illness in
KwaZulu-Natal (Hosegood et al., 2004). 2/ Signed informed consent was obtained before interviews were undertaken. Ethical approval was obtained through the Ethical Committees of the University of Natal and Wisconsin-Madison.

6
The third wave of KIDS reported the deaths of 309 people between 1998 and 2004 who
were 20-50 years of age when they died; of which 74 were cases in which the person died
of an injury. Since we are interested in the impact of death associated with illness, we
have chosen to exclude this group and designate the remaining 235 deaths as Premature
Adult Mortality (PAM).3
4 Methodology Evaluating the impacts of a PAM on the economic status of a family is difficult because
we cannot observe what the family’s status would have been (counterfactually) in the
absence of the death. The economic status of other families, unaffected by an adult
death, may be a very bad proxy for the counterfactual status of those affected by a death,
especially in the case of the HIV epidemic where specific behaviours and situations are
known to make infection and death more likely.
Our solution to this problem is to observe the families’ economic trajectories (their
growth in well-being) in the period prior to the onset of the epidemic. Using this
information, and a few modest statistical assumptions, we can use fixed effects statistical
methods to reliably predict what the affected family’s economic status would have been
in the absence of a premature adult death. Effectively, this procedure allows each
family’s past experience to shape or inform the counterfactual that is used to judge the
impact of a premature adult death.
Our use of fixed effects methods parallels the work of Grimm (2006) and Yamano and
Jayne (2005). Propensity score and matching methods (as used by Gertler, Levine and 3/ Premature mortality refers to death occurring before some standard age. We have used South African life expectancy in 2004 (51.4 years) as a guideline for this standard (Stats SA, 2004:11). Other authors have used 50 years as the separation point between prime-age adults (15-50), the approximate group most at risk of HIV infection, and the beginning of old age (cf. Ainsworth & Dayton 2003).

7
Ames, 2004) provide an alternative approach. However, these methods can only control
for observable differences between affected and unaffected households, whereas the fixed
effect approach controls for all time invariant characteristics of the household.
The KIDS data described above contains measures of household economic well-being at
three points in time, 1993, 1998 and 2004. We denote the economic well-being of
household i in time period t as, yit.4 In turn, we define the growth rate of household well-
being between period t-1 and t as: 1
1
−
−−=
it
ititit y
yyg . Under our data structure, we observe
itg twice: once for t=1998, measuring the growth (positive or negative) in well-being
between 1993 and 1998, and once in 2004 (measuring the growth since 1998). We begin
with the following fixed effects regression model for this growth in economic wellbeing
measure:
ittiitititit yShg ελυδδβ +++++= − )][ln( 1211 ,
where hit is a binary indicator variable which takes a value of 1 when family i
experienced a premature adult death between times t-1 and t, and is 0 otherwise. In other
words, hit is our PAM indicator. The variable Sit signifies other unfavourable events that
struck the household between times t-1 and t, including crop loss, theft, spousal
abandonment, death of an elderly household member. The terms ,, ti λυ the δ and β are
all parameters to be estimated, and itε is a random error term that we assume is unrelated
to the included variables. Consistently estimating the coefficient β1, which gives the
impact of an adult death on the growth in well-being, is of course our primary interest.
4/ Economic well-being is measured as total household expenditures per-capita.

8
Note that this specification assumes that the impact of a premature adult death on
wellbeing is the same for all households. We will later relax this assumption.
This “homogenous effect” regression model (which restricts the effect of a PAM to be the
same for all households) thus says that growth in household well-being over time depends
on a household-specific growth factor that does not change over time ( iυ ), as well as on a
time-specific intercept ( 0498, ortt =λ ) that is assumed to be the same for all
households.
Our ability to us fixed effects panel data methods control for the household specific effect
is key to our effort to identify the impact of a prime age adult mortality on economic
wellbeing. Note that the iυ will capture time invariant observable and unobservable
factors that influence the growth in household well-being. It is precisely these
unobservable differences between households that make it difficult to estimate the impact
of premature adult death. Once we control for the fact that households with adult deaths
are likely to grow more slowly (or, perhaps more rapidly) than the typical household, we
be more confident in our estimate of β1.5 Given that the performance of the South
African economy improved over the 1998 to 2004 period, a change which is reflected in
the profile of poverty of the KIDS sample, we would expect 9804 λλ > .6
5/ More formally, failing to control for the household-specific fixed effect would tend to exaggerate the impact of a premature death if households that suffer such deaths tend on average to experience lower growth even in the absence of the death. 6 Note, however, that our methodology does not account for the spillover effects of premature death. In an analysis of Zambia, Jayne et al. (2006) estimate that local economic growth is negatively influenced by high concentrations of AIDS-related deaths. While such macro effects may occur in South Africa, the urbanized and well-integrated nature of the South African economy makes it less likely these effects can be picked up at the local community level.

9
As does Grimm (2006), we control for other shocks that potentially affect the growth rate
of household economic well-being. As measures of these shocks, we simply employ
binary indicator variables as to whether the household experienced the shock. Grimm
also controls for changes in household demographic composition. We choose explicitly
not to control for demographic changes as we suspect that such changes are themselves
coping strategies employed by families that suffer a PAM. Statistically, demographic
changes would be directly related to the error term itε in (1) and including would yield
biased estimates of the effect of a PAM. While it would be possible to employ
simultaneous equation methods to address the statistical endogeneity of demographic
changes, we prefer here to estimate reduced form models like (1). The parameter
estimates we obtain thus give us the full or bottom line effect of a PAM on household
well-being after the household has utilized available coping strategies (including
demographic changes). Note also that model 1 does not condition on the characteristics
of the adult who has died (as Yamano and Jayne 2004 do). While we have no doubt that
these characteristics matter (as they do in the Yamano and Jayne analysis of agricultural
decisions and productivity), we are here interested in identifying the average or typical
effect of PAM in our South Africa data.
Finally, the basic regression model includes a term that allows the expected growth in
economic well-being to be different depending on the household’s initial level of well-
being (measured as the natural logarithm of household’s level of well-being at the
beginning of the period, yit-1). Conventional economic theory predicts that δ < 0,
indicating that initially less well-off households experience more rapid growth. Other
theory, suggests the opposite (see Carter and Barrett, 2006). For purposes here, we are

10
simply concerned to control for the impact of initial levels of well-being on subsequent
changes.
Table 1
Fixed Effects Estimates of the Impact of Premature Adult Mortality on the Growth Rate of Economic Well-being
Explanatory Variables
Homogenous Effects Model
Heterogeneous Effects Model
Impact Persistence Model
PAM Impact
Common Effect, β1 -0.21 1.8* 5.4** Differential Effect, β2 -- -0.37* -0.96**
Persistence of PAM Effect Common Effect, β3 -- -- -0.10* Differential Effect, β4 -- -- 0.02
Convergence, δ -1.8** -1.8** -1.8**
Time Effects 1998 Intercept, λ98 10.8** 10.4** 10.4** 2004 Intercept, λ04 11.3** 10.9** 10.9**
Other Shocks Illness 0.15 0.16 0.16 Job Loss -0.05 -0.05 -0.05 Lose Remittances -0.12 -0.12 -0.17 Lose Grant -0.02 -0.02 -0.01 Abandonment -0.34 -0.27 -0.24 Theft 0.02 0.01 0.02 Crop Loss -0.27 -0.26 -0.25 Elderly Death 0.33 0.32 0.32
Household Fixed Effects, υi Included Included Included R2 within 0.34 0.34 0.35
* Statistically significant at the 10% level ** Statistically significant at the 5% level
Table 1 displays the fixed effects estimates for the homogenous effects model. The
estimated coefficient of the PAM variable is negative, but, surprisingly, it is not
statistically significant. Its value (-0.21) means that a household experiencing a PAM has
a 21 percentage points lower than it would be, controlling for the unobserved time-
invariant factors that influence each household’s growth rate ( iυ ) and other variables.
11
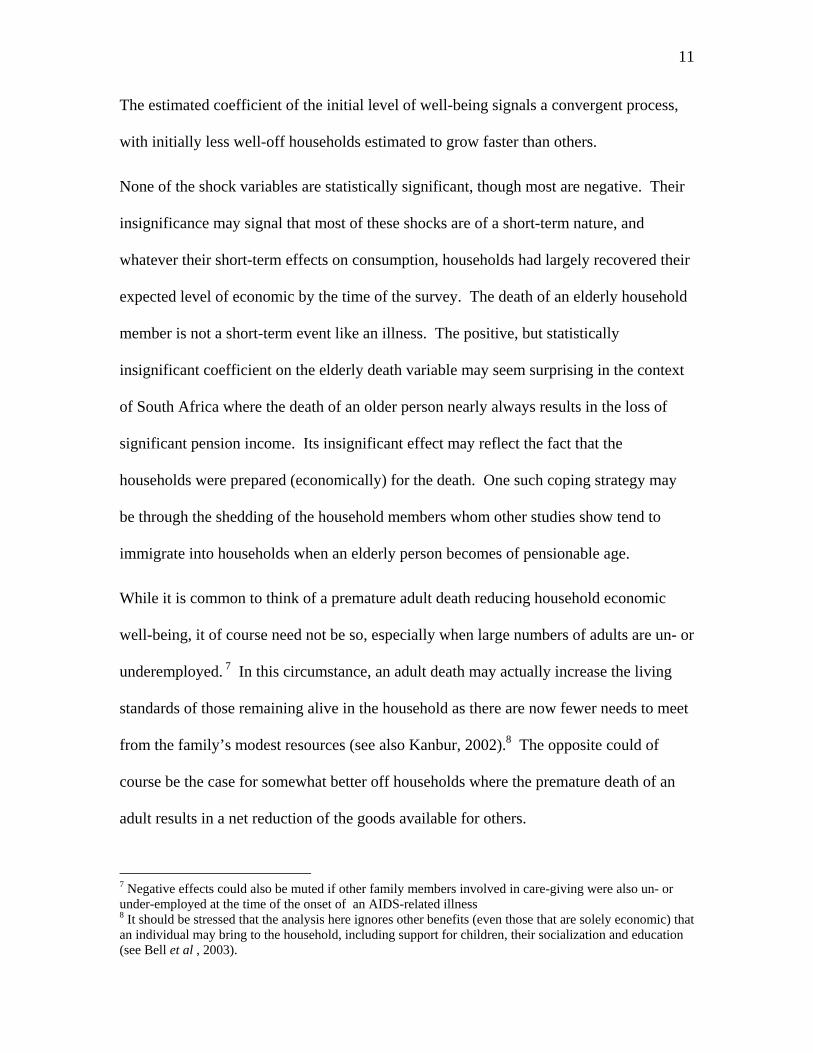
The estimated coefficient of the initial level of well-being signals a convergent process,
with initially less well-off households estimated to grow faster than others.
None of the shock variables are statistically significant, though most are negative. Their
insignificance may signal that most of these shocks are of a short-term nature, and
whatever their short-term effects on consumption, households had largely recovered their
expected level of economic by the time of the survey. The death of an elderly household
member is not a short-term event like an illness. The positive, but statistically
insignificant coefficient on the elderly death variable may seem surprising in the context
of South Africa where the death of an older person nearly always results in the loss of
significant pension income. Its insignificant effect may reflect the fact that the
households were prepared (economically) for the death. One such coping strategy may
be through the shedding of the household members whom other studies show tend to
immigrate into households when an elderly person becomes of pensionable age.
While it is common to think of a premature adult death reducing household economic
well-being, it of course need not be so, especially when large numbers of adults are un- or
underemployed. 7 In this circumstance, an adult death may actually increase the living
standards of those remaining alive in the household as there are now fewer needs to meet
from the family’s modest resources (see also Kanbur, 2002).8 The opposite could of
course be the case for somewhat better off households where the premature death of an
adult results in a net reduction of the goods available for others.
7 Negative effects could also be muted if other family members involved in care-giving were also un- or under-employed at the time of the onset of an AIDS-related illness 8 It should be stressed that the analysis here ignores other benefits (even those that are solely economic) that an individual may bring to the household, including support for children, their socialization and education (see Bell et al , 2003).

12
From a statistical perspective, these observations suggest that our basic regression model
above mixes together two different regimes—one where the immediate livelihood effects
of a PAM are negative, and another where they may be positive. The average effect
estimated in Table 1 would, in this case, be a data-weighted average of the two
underlying regimes or regression relationships. From this perspective, we see that this
data-weighted average effect is negative, but not surprisingly, it is insignificant.
In an effort to pull these two regimes apart, and allow for heterogeneous PAM effects, we
modify the basic fixed effect regression equation as follows:
ittiitititititit ySyhhg ελυδδββ ++++++= −− )][ln()]ln([ 121121 ,
where the new coefficient β2 allows the impact of a premature adult mortality to change
with the household’s level of initial economic well-being. As discussed above, we might
expect β2<0, and β1>0.
The second column in Table 1 shows the results of this expanded, heterogeneous effects
model. All the estimated PAM coefficients are now significant, and the impact
coefficients have the anticipated signs.9 The estimated impacts of the other shock
variables are qualitatively identical to those in the homogenous effect model. The impact
of a PAM is now harder to infer as it depends on the initial income level of the
household. However as can be seen, the pattern of the coefficients are such that the
immediate well-being impacts of a PAM will be positive for a poor enough household,
and become negative for a better-off household.
9/ We have varied the age cutoff to the mid-40’s and find that the estimated coefficients remain largely the same, but become statistically significant at the 5% level. If we increase the age towards 60, the coefficients remain stable, but begin to lose statistical significance. This pattern is consistent with the notion that the earning power of adults begin to fall off as they enter their 50’s. In addition, households presumably become better prepared for an adult death as that death becomes (statistically) more likely.

13
In order to better extract the meaning of these regression estimates, we used them to
calculate the impact of a PAM on the livelihood trajectories for three typical households:
one that began in the 20th percentile of the initial well-being distribution, another at the
50th and a third at the 80th percentile. For each of these typical household, we took the
average of the fixed effect terms (the iυ ) for economically similar households.10 Using
this estimate, plus the household’s initial level of well being (yi93) we then calculated the
predicted growth that would be expected for such a household over the 1993 to 1998
period, the period prior to the onset of significant AIDS-related deaths. Using this
predicted growth, we then calculated the household’s predicted standard of living for
1998. To make this value more easily interpretable, we have divided it by the poverty
line such that a standard of living of 1 would imply a living standard exactly equal to the
poverty line, 2 a living standard double the poverty line, and so forth. Figure 1 shows
these pre-PAM estimate for each of the three typical households.
In order to assess the predicted impact of a PAM, we then performed the same exercise
for the 1998 to 2004 period for the three typical households.11 For each household a
growth rate (and resulting living standard level) was calculated both with and without a
premature adult death. As can be seen, the predicted impact of a PAM on the household
that began at the 20th percentile are slightly negative, but imperceptibly so. They grow
larger for the 50th percentile household, and are quite significant for 80th percentile
household. Regarding the latter, these figures indicate that without a PAM, the
household would have grown to a living standard in excess of 225% of the poverty line. 10/ For example, for the 20th percentile household, we took the average fixed effect estimates for all households between the 15th and the 25th percentile. A similar band was used for the other two household estimates. 11 The starting point for each household was their predicted level of well-being for 1998, as described above.

14
With the PAM, the household’s well-being is only 175% of the poverty line. This 50%
drop is correctly interpreted as the impact of a PAM on initially better-off households.
Figure 1
1992 1994 1996 1998 2000 2002 2004Year
0
50
100
150
200
Perc
ent o
f Pov
erty
Lin
e
Impact of Premature Adult Mortality on Livelihood Trajectories
Poverty Line
50th Percentile Household
80th Percentile Household
20th Percentile Household
Without PAM
Finally, our data permit us to explore whether these estimated PAM impacts tend to
dissipate over time. To do this, we modify the model by including an additional variable
that indicates the number months between the premature death and the date of the survey.
This same variable was also interacted with initial expenditures to give the following
‘impact persistence model’:
ittiititititititititit ySyppyhhg ελυδδββββ ++++++++= −−− )][ln()]ln([)]ln([ 121143121 ,
15
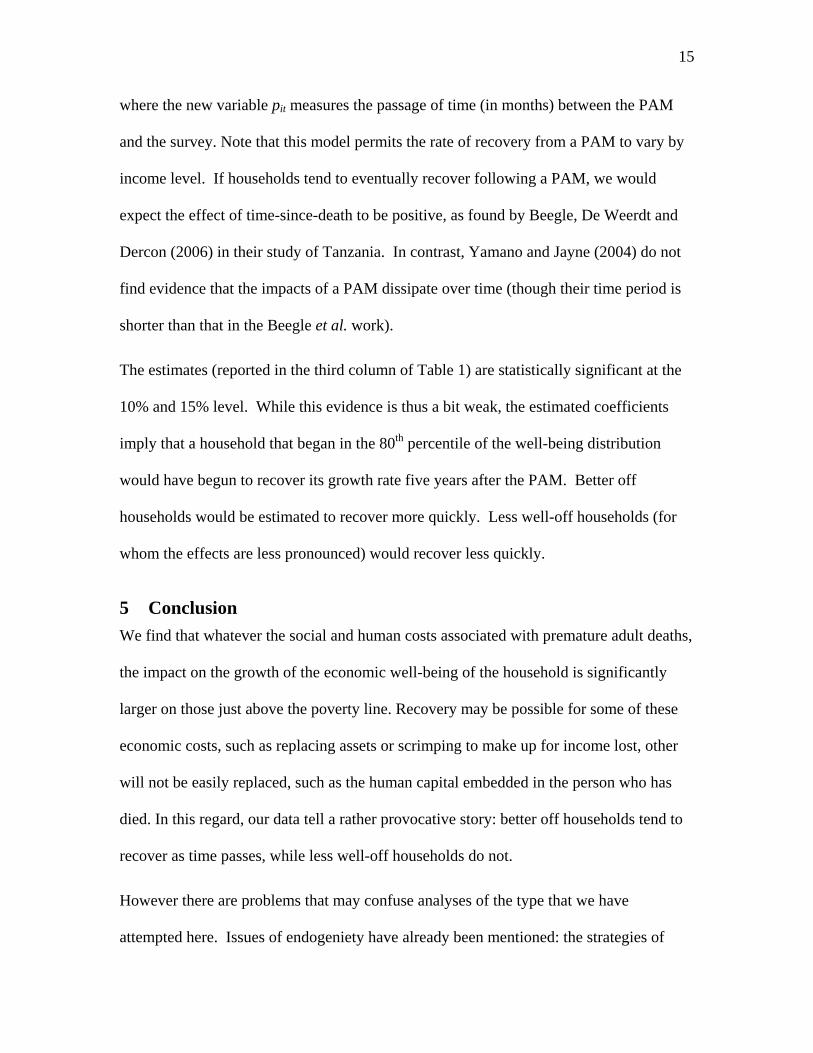
where the new variable pit measures the passage of time (in months) between the PAM
and the survey. Note that this model permits the rate of recovery from a PAM to vary by
income level. If households tend to eventually recover following a PAM, we would
expect the effect of time-since-death to be positive, as found by Beegle, De Weerdt and
Dercon (2006) in their study of Tanzania. In contrast, Yamano and Jayne (2004) do not
find evidence that the impacts of a PAM dissipate over time (though their time period is
shorter than that in the Beegle et al. work).
The estimates (reported in the third column of Table 1) are statistically significant at the
10% and 15% level. While this evidence is thus a bit weak, the estimated coefficients
imply that a household that began in the 80th percentile of the well-being distribution
would have begun to recover its growth rate five years after the PAM. Better off
households would be estimated to recover more quickly. Less well-off households (for
whom the effects are less pronounced) would recover less quickly.
5 Conclusion We find that whatever the social and human costs associated with premature adult deaths,
the impact on the growth of the economic well-being of the household is significantly
larger on those just above the poverty line. Recovery may be possible for some of these
economic costs, such as replacing assets or scrimping to make up for income lost, other
will not be easily replaced, such as the human capital embedded in the person who has
died. In this regard, our data tell a rather provocative story: better off households tend to
recover as time passes, while less well-off households do not.
However there are problems that may confuse analyses of the type that we have
attempted here. Issues of endogeniety have already been mentioned: the strategies of

16
both those living with HIV and the households in which they are located may impact on
the outcomes that we are trying to measure. Ill people may join households seeking care;
shocked households may fragment in order to survive. The PAM itself may affect our
analysis simply by its demographic impact of reducing the size of the household over
which the same resources might stretch. Finally, it is possible that our time frame is too
short to permit recovery to be visible. Nonetheless, these results stand as a stark reminder
that the effects of an AIDS-related death can be not only large, but also perhaps but long-
lasting and self-reinforcing.
17
6 References Ainsworth, M. and Dayton, J., (2003), “The Impact of the AIDS Epidemic on the Health of Older
Persons in Northwestern Tanzania.” World Development, Vol. 31, No. 1, pp. 131-148.
Ainsworth, M. and Semali, I., (2000), The Impact of Adult Deaths on Children's Health in North-
Western Tanzania Policy Research Working Paper 2266, World Bank, Washington, D.C.
Ardington, EM., 1995. Return to Nkandla: The third survey in a longitudinal study of a rural
community in KwaZulu-Natal. CSDS Working Paper No. 7, Centre for Social and
Development Studies, Durban: University of Natal.
Bachmann, M.O, and FLR Booysen, (2002), Health and economic impact of HIV/AIDS on South
African households: a cohort study, BMC Public Health 2003, 3:14.
Beegle, Kathleen (2003) “Labor Effects of Adult Mortality in Tanzanian Households.” World
Bank Policy Research Working Paper 3062.
Beegle, Kathleen, Joachim De Weerdt, and Stefan Dercon (2006) “Adult Mortality and Economic
Growth in the Age of HIV/AIDS.” World Bank Working Paper Series: Draft.
Bell, C., Shantayanan D. and Gersbach, H., (2003) “The long-run economic costs of AIDS:
Theory and an application to South Africa”, working paper, University of Heidelberg.
Bollinger, L., Stover, J., and P. Riwa (1999) The Economic Impact of AIDS in Tanzania,
POLICY Working Paper, downloaded from
http://www.policyproject.com/pubs/SEImpact/tanzania.pdf on 22/05/06.
Booysen, F.l.R. 2004, "Income and Poverty Dynamics in HIV/AIDS-Affected Households in the
Free State Province of South Africa", South African Journal of Economics, vol. 72, no. 3,
pp. 522-545.
Carter, M. and C. Barrett (2006) "The economics of poverty traps and persistent poverty: An

18
asset-based approach," The Journal of Development Studies, 42(2): 178-199, February.
Chapoto A. and T.S. Jayne, 2005. Socio-Economic Characteristics of Individuals Afflicted by
Aids-related Prime-Age Mortality In Zambia, paper prepared for the IFPRI/Renewal
Conference on HIV/AIDS and Food and Nutrition Security, held in Durban South Africa, 14-
16, April, 2005.
Davies, S., 1996. Adaptable Livelihoods: Coping with Food Insecurity in the Malian Sahel,
MacMillan Press, London.
Gertler, Paul, David Levine and Minnie Ames (2004). “Schooling and Parental Death,”
Review of Economics and Statistics 86(1): 211-225.
Grimm, Michael (2006). “Mortality and Survivors’ Consumption,” German Institute for
Economic Research Discussion Paper 611.
Hornbrook MC, Murtado RV, Johnson RE., (1985) Health care episodes: definition,
measurement, and use. Medical Care Research Review; 42: 163-218.
Hosegood, V, Vanneste, A-M & Timæus, IM, 2004. Levels and causes of adult mortality in rural
South Africa. Aids, 18(4): 663-671.
Jayne, Thomas S., Antony Chapoto, Elizabeth Byron, Mukelabai Ndiyoi, Petan
Hamazakaza, Suneetha Kadiyala, and Stuart Gillespie (2006) “Community-Level Impacts
of AIDS-Related Mortality: Panel Survey Evidence from Zambia.” Review of
Agricultural Economics 28(3): 440-457.
Kanbur, R. (2002) “Conceptual Challenges in Poverty and Inequality: One Development
Economist’s Perspective,” downloaded from:
http://www.chronicpoverty.org/pdfs/conferencepapers/kanbur.pdf, on 12/05/06.
Mailick , M., (1980) The Impact of Severe Illness on the Individual and Family, Social Work

19
in Health Care, The Haworth Press, Inc.
Maluccio, JA, 2000. Attrition in the KwaZulu-Natal Income Dynamics Study 1993-1998. Food
Consumption and Nutrition Division Discussion Paper No. 95. Washington D.C.: International
Food Policy Research Institute.
May, J., Agüero, J., Carter, MR. and Timæus, I., (forthcoming) The KwaZulu-Natal Income
Dynamics Study (KIDS) 3rd wave: methods, first findings and an agenda for future research,)
accepted by Development Southern Africa.
May, J., Carter, M.R., Haddad, L. and Maluccio, J., 2000. KwaZulu-Natal Income Dynamics
Study (KIDS) 1993-1998: A longitudinal household data set for South African policy analysis,
Development Southern Africa, 17(4): 567-581.
Medical Research Council, (2004), South African National Burden of Disease Study 2000:
Provincial Estimates of Mortality.
Moser, CON., 1998a. The asset vulnerability framework: Reassessing urban poverty reduction
strategies. World Development 26(1): 1-19.
Naidu, Veni and Geoff Harris (2005) “The Impact of HIV/AIDS Morbidity and Mortality on
Households—A Review of Household Studies.” South African Journal of Economics 73:
533-544.
PSLSD, 1994. Project for statistics on living standards and development: South Africans rich and
poor: Baseline household statistics. Cape Town, South Africa: South African Labour and
Development Research Unit, University of Cape Town.
Sachs, J., and P. Malaney, (2002), Insight review article: The economic and social burden of
malaria, Nature, 415: 7 downloaded from http://www.earthinstitute.columbia.
edu/about/director/pubs/sachsmalariafeb02.pdf, on 22/05/06.
20
Stats South Africa, (2006), Mid-Year Population Estimates, Statistical Release, P302, Statistics
South Africa, Pretoria.
Stover, J. and Bollinger, L., (1999), The Economic Impact of AIDS, Futures Group, Washington,
D.C.
UNECA (2003), Africa: The Socio-Economic Impact of HIV/AIDS, CHG Commission on
HIV/AIDS and Governance in Africa, Index No. CHGA-B-I1-0003, downloaded from
http://www.uneca.org/CHGA/doc/SOCIO_ECO_IMPACT.pdf on 24 May, 2006.
Woolard, I. and Leibbrandt,M., 2006. Planning for the South African National Income Dynamics
Study (NIDS): lessons from the international experience, unpublished SALDRU report,
University of Cape Town, Cape Tow.
Yamano, Takashi and T.S. Jayne (2003) “Measuring the Impacts of Working-Age Adult
Mortality on Small-Scale Farm Households in Kenya.” World Development 32(1): 91-119.
Yamano, Takashi and Thomas Jayne (2004). “Measuring the impact of Working Age
Adult Mortality on Small-scale Farm Households in Kenya,” World Development 32(1):
91-119.