The Economic Impact of Kentucky’s Equine Industry · The Economic Impact of Kentucky’s Equine...
23
The Economic Impact of Kentucky’s Equine Industry Dr. C. Jill Stowe Department of Agricultural Economics University of Kentucky
Transcript of The Economic Impact of Kentucky’s Equine Industry · The Economic Impact of Kentucky’s Equine...
TheEconomicImpactofKentucky’sEquineIndustry
Dr.C.JillStoweDepartmentofAgriculturalEconomics
UniversityofKentucky

KentuckyisSynonymouswithHorses
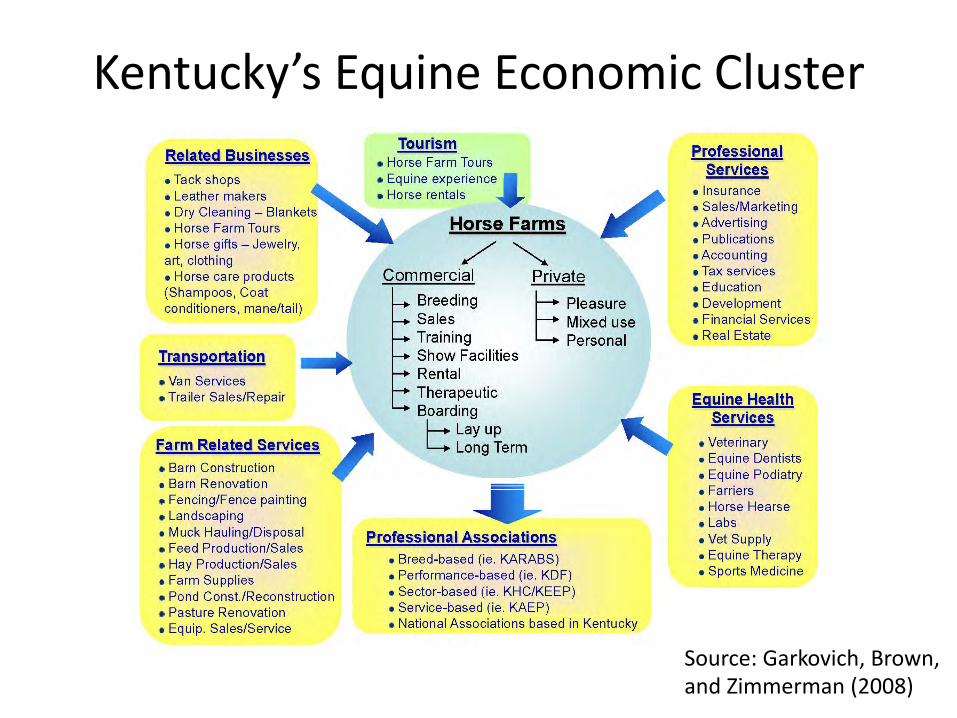
Kentucky’sEquineEconomicCluster
Source:Garkovich,Brown,andZimmerman(2008)
Kentucky’sEquineIndustry:AnEconomicContributor
• 2012KentuckyEquineSurvey– Cooperationbetweenuniversities,governmentorganizations,andindustry
– LastcomprehensivestudyonKentucky’sequineindustryoccurredin1977
• KentuckyHorseRacingCommission– Revenuegeneratedbyracetracks
2012KentuckyEquineSurvey
• Threecomponents– EquineOperationInventory(NASS)– EconomicImpact– Non-MarketValuationSurvey
KentuckyOperationInventory
• 35,000equineoperations• 242,400equine• 1.1millionacresdevotedtoequineuse• Valueofequineandequine-relatedassets:$23.4billion• Equine-relatedsalesandincomefor2011:$1.1billion• Equine-relatedexpendituresfor2011:$1.2billion
EconomicImpact
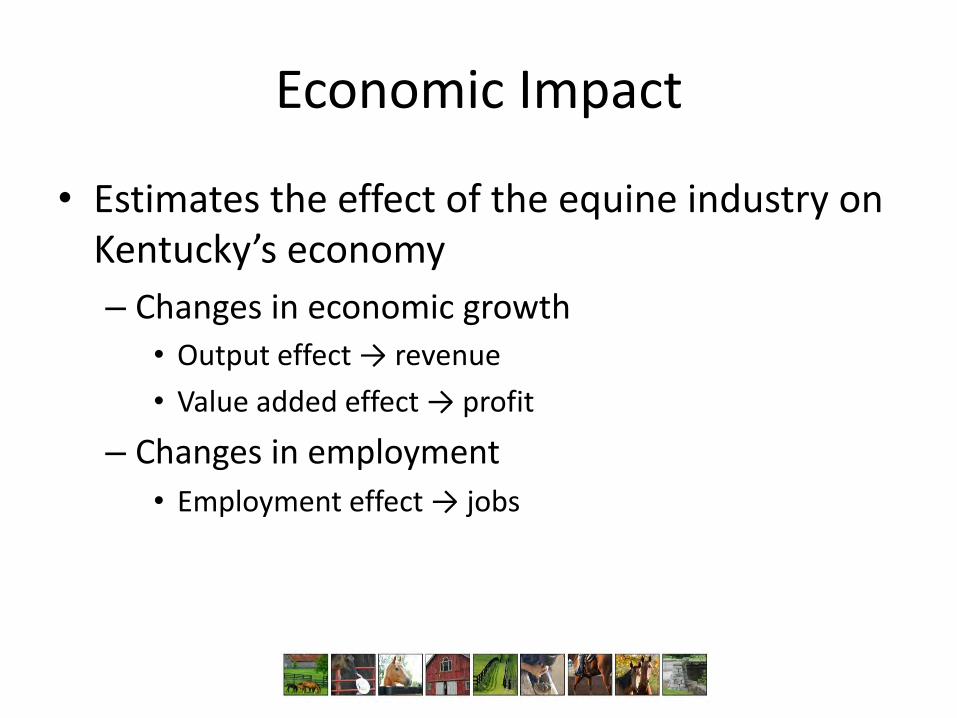
• EstimatestheeffectoftheequineindustryonKentucky’seconomy– Changesineconomicgrowth• Outputeffect→revenue• Valueaddedeffect→profit
– Changesinemployment• Employmenteffect→jobs
EconomicImpact
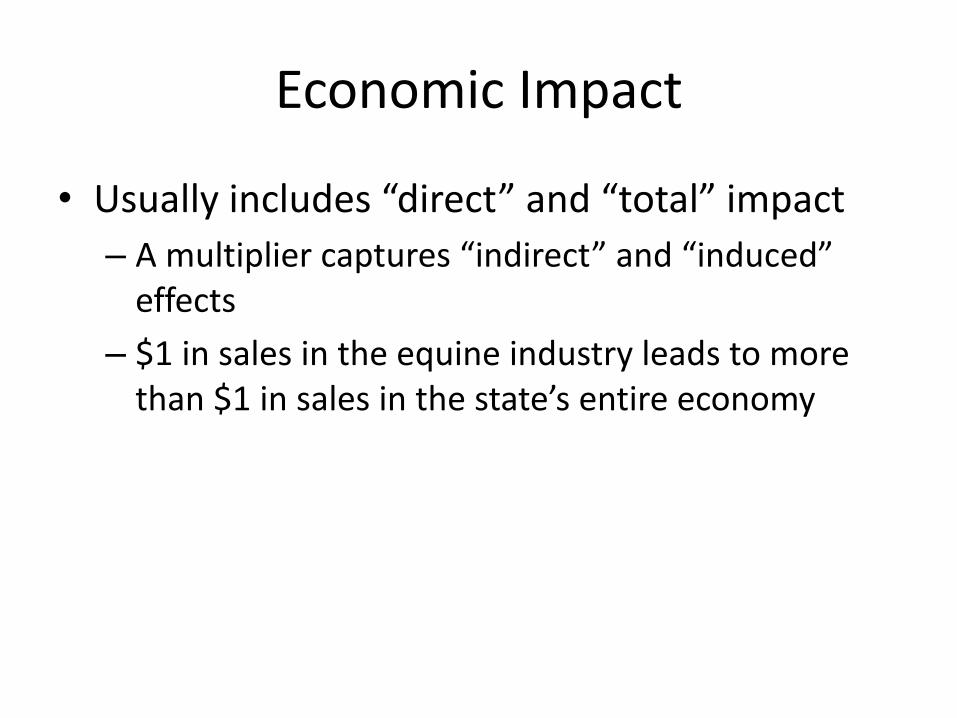
• Usuallyincludes“direct”and“total”impact– Amultipliercaptures“indirect”and“induced”effects
– $1insalesintheequineindustryleadstomorethan$1insalesinthestate’sentireeconomy
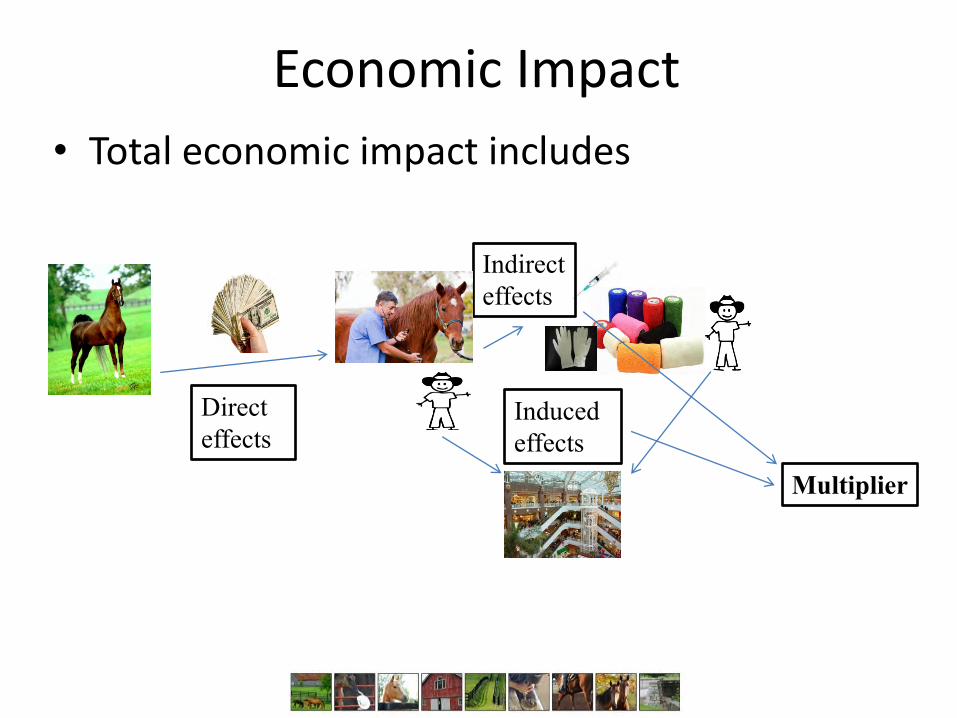
EconomicImpact• Totaleconomicimpactincludes
Direct effects
Indirect effects
Induced effects
Multiplier
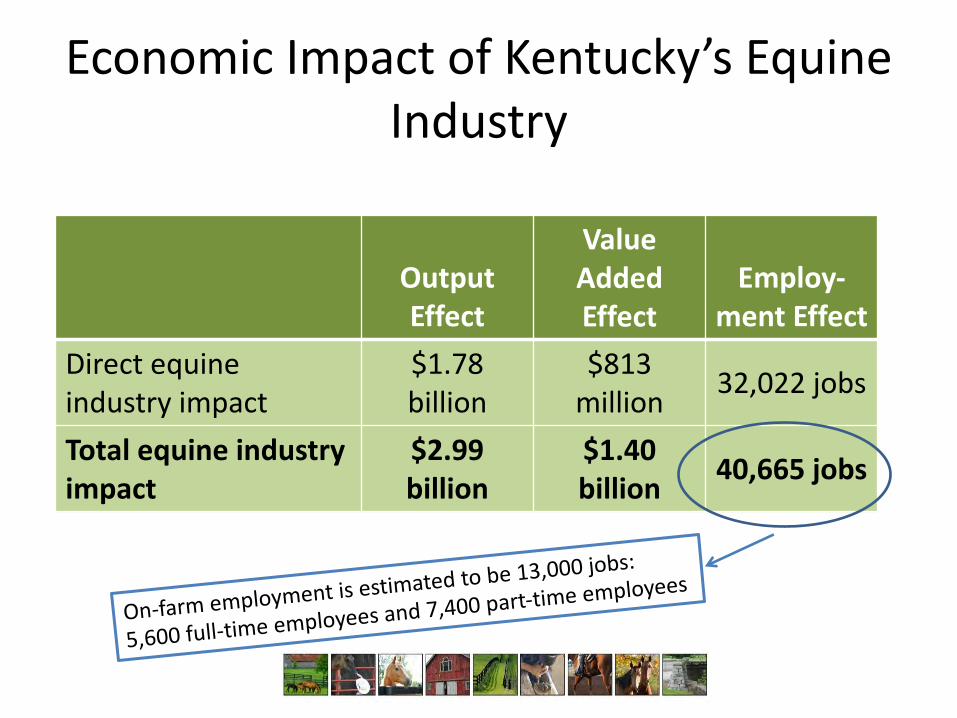
EconomicImpactofKentucky’sEquineIndustry
OutputEffect
ValueAddedEffect
Employ-ment Effect
Directequineindustry impact
$1.78billion
$813million 32,022jobs
Totalequineindustryimpact
$2.99billion
$1.40billion 40,665jobs
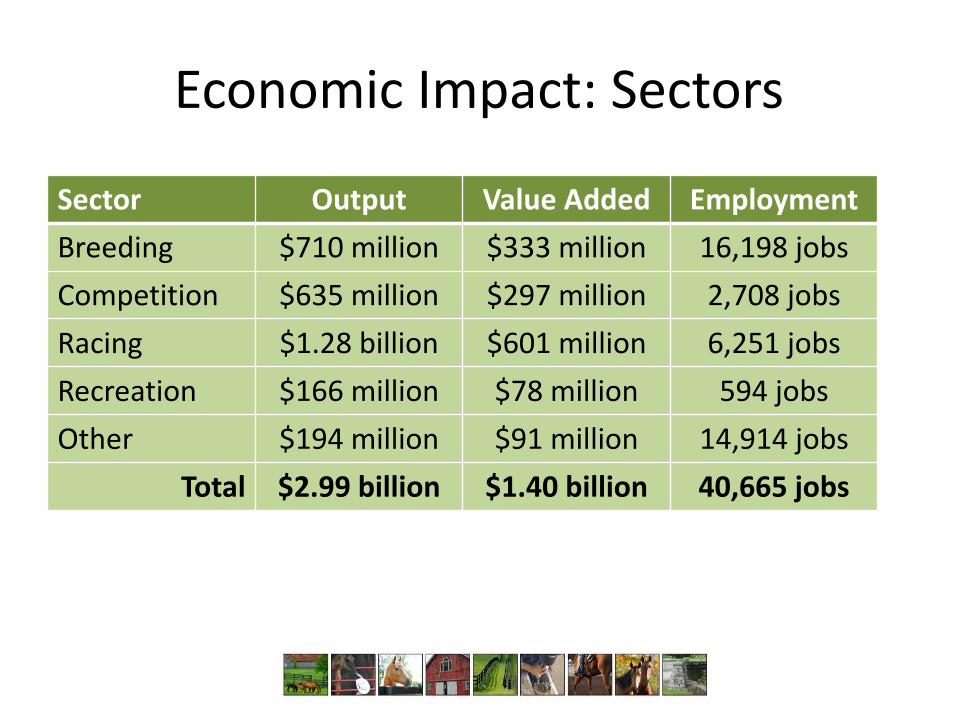
EconomicImpact:Sectors
Sector Output ValueAdded EmploymentBreeding $710million $333million 16,198jobsCompetition $635million $297million 2,708jobsRacing $1.28 billion $601million 6,251jobsRecreation $166million $78million 594jobsOther $194million $91million 14,914jobs
Total $2.99billion $1.40billion 40,665jobs
TaxImpact
• Taxcontributionwasapproximately$134million– Stateincometax– Salestax
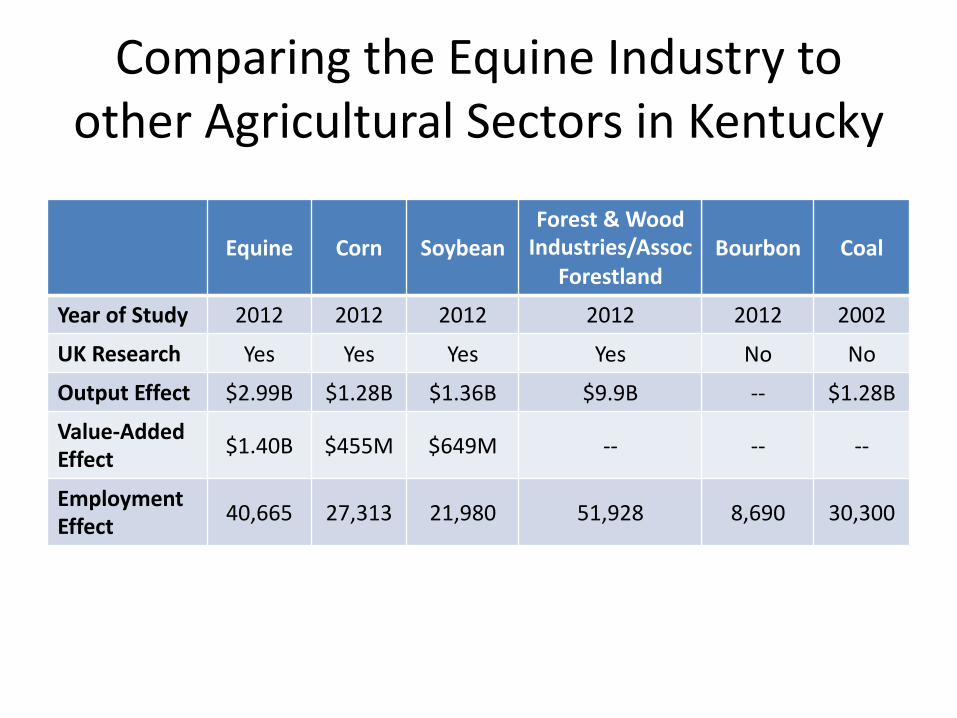
ComparingtheEquineIndustrytootherAgriculturalSectorsinKentucky
Equine Corn SoybeanForest &WoodIndustries/Assoc
ForestlandBourbon Coal
YearofStudy 2012 2012 2012 2012 2012 2002
UKResearch Yes Yes Yes Yes No No
OutputEffect $2.99B $1.28B $1.36B $9.9B -- $1.28B
Value-AddedEffect $1.40B $455M $649M -- -- --
EmploymentEffect 40,665 27,313 21,980 51,928 8,690 30,300
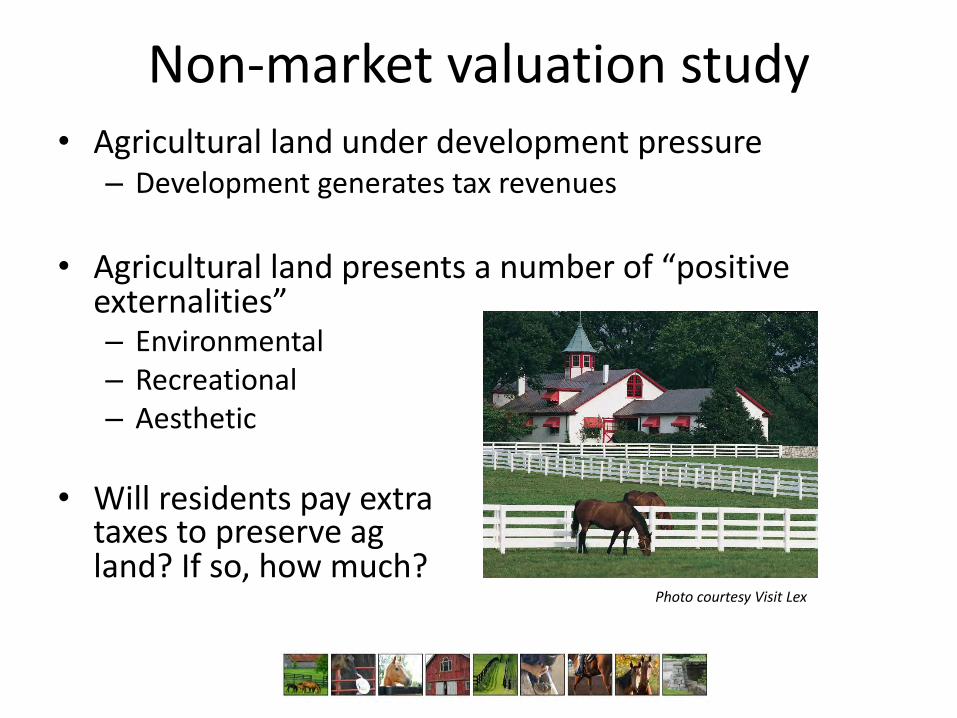
Non-marketvaluationstudy• Agriculturallandunderdevelopmentpressure– Developmentgeneratestaxrevenues
• Agriculturallandpresentsanumberof“positiveexternalities”– Environmental– Recreational– Aesthetic
• Willresidentspayextrataxestopreserveagland?Ifso,howmuch?
PhotocourtesyVisitLex
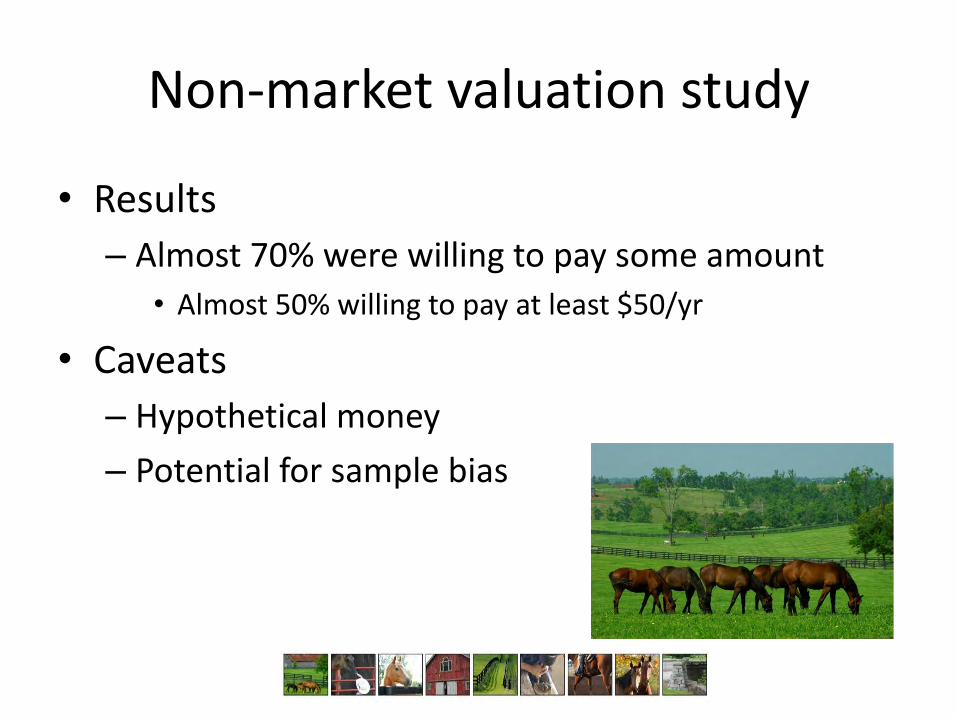
Non-marketvaluationstudy
• Results– Almost70%werewillingtopaysomeamount• Almost50%willingtopayatleast$50/yr
• Caveats– Hypotheticalmoney– Potentialforsamplebias
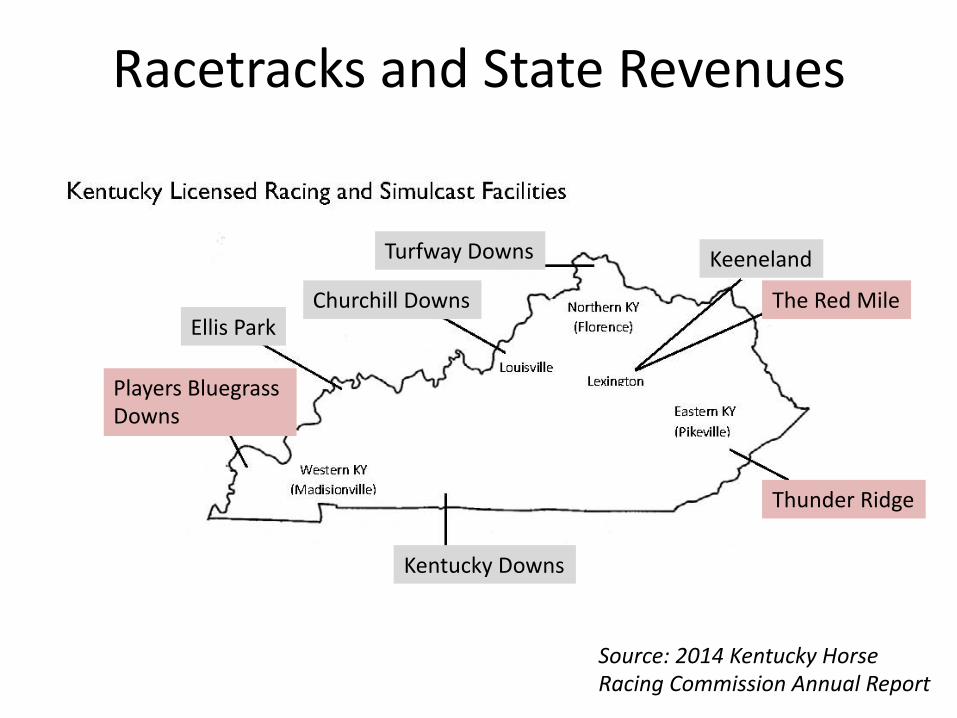
RacetracksandStateRevenues
Turfway Downs Keeneland
TheRedMile
ThunderRidge
KentuckyDowns
PlayersBluegrassDowns
EllisParkChurchillDowns
Source:2014KentuckyHorseRacingCommissionAnnualReport
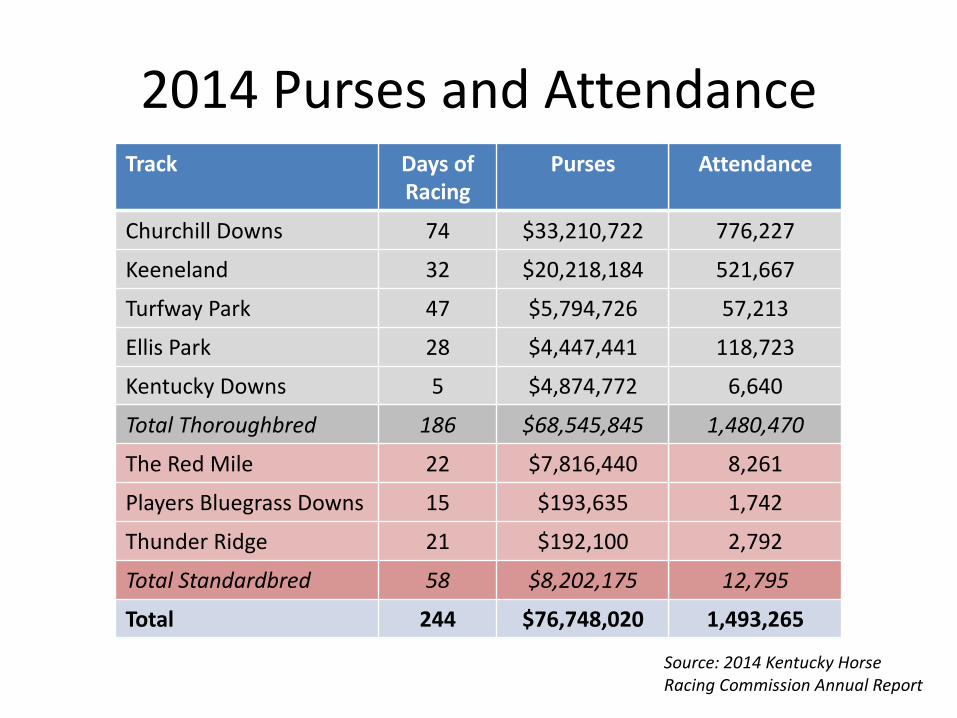
2014PursesandAttendanceTrack Daysof
RacingPurses Attendance
Churchill Downs 74 $33,210,722 776,227
Keeneland 32 $20,218,184 521,667
Turfway Park 47 $5,794,726 57,213
EllisPark 28 $4,447,441 118,723
KentuckyDowns 5 $4,874,772 6,640
TotalThoroughbred 186 $68,545,845 1,480,470
TheRedMile 22 $7,816,440 8,261
PlayersBluegrass Downs 15 $193,635 1,742
ThunderRidge 21 $192,100 2,792
TotalStandardbred 58 $8,202,175 12,795
Total 244 $76,748,020 1,493,265
Source:2014KentuckyHorseRacingCommissionAnnualReport
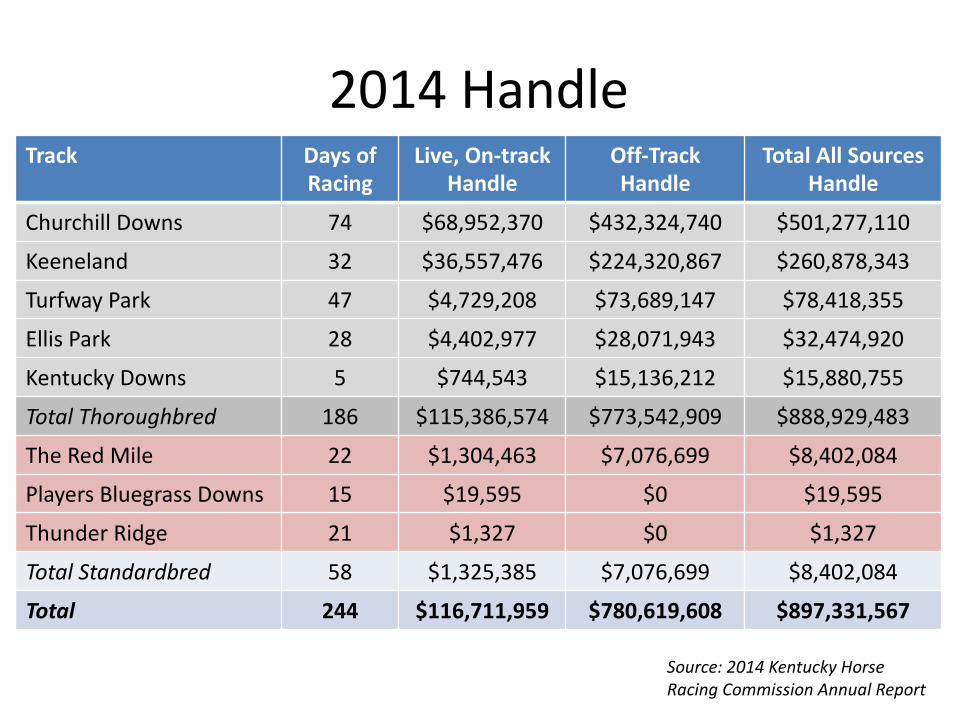
2014HandleTrack Daysof
RacingLive,On-track
HandleOff-TrackHandle
TotalAllSourcesHandle
Churchill Downs 74 $68,952,370 $432,324,740 $501,277,110
Keeneland 32 $36,557,476 $224,320,867 $260,878,343
Turfway Park 47 $4,729,208 $73,689,147 $78,418,355
EllisPark 28 $4,402,977 $28,071,943 $32,474,920
KentuckyDowns 5 $744,543 $15,136,212 $15,880,755
TotalThoroughbred 186 $115,386,574 $773,542,909 $888,929,483
TheRedMile 22 $1,304,463 $7,076,699 $8,402,084
PlayersBluegrass Downs 15 $19,595 $0 $19,595
ThunderRidge 21 $1,327 $0 $1,327
TotalStandardbred 58 $1,325,385 $7,076,699 $8,402,084
Total 244 $116,711,959 $780,619,608 $897,331,567
Source:2014KentuckyHorseRacingCommissionAnnualReport
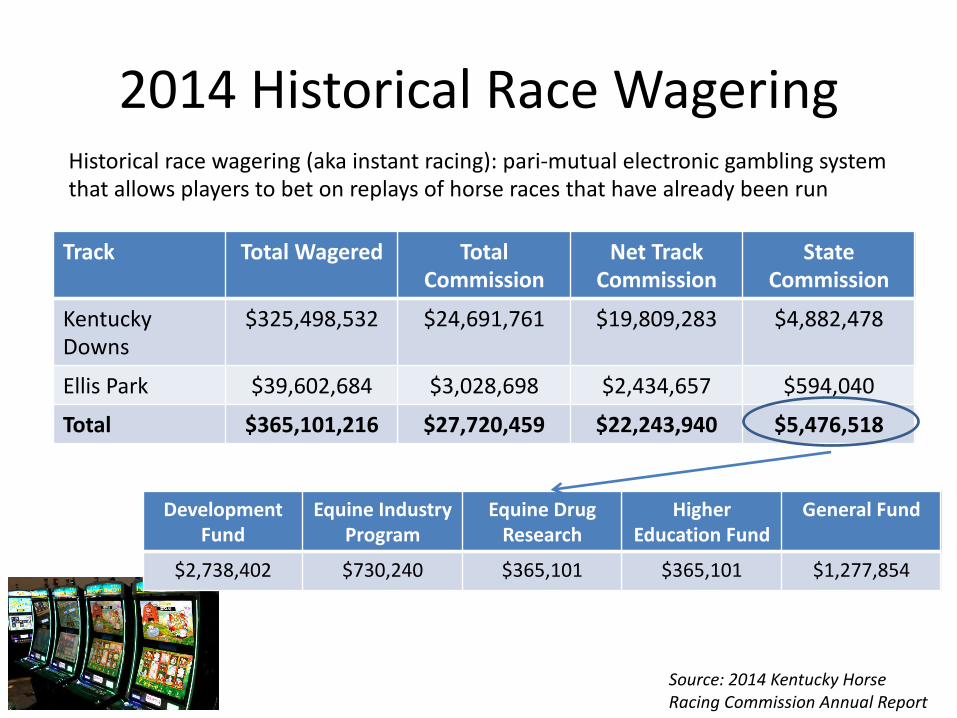
2014HistoricalRaceWagering
Track TotalWagered TotalCommission
NetTrackCommission
StateCommission
KentuckyDowns
$325,498,532 $24,691,761 $19,809,283 $4,882,478
EllisPark $39,602,684 $3,028,698 $2,434,657 $594,040
Total $365,101,216 $27,720,459 $22,243,940 $5,476,518
DevelopmentFund
EquineIndustryProgram
EquineDrugResearch
HigherEducationFund
GeneralFund
$2,738,402 $730,240 $365,101 $365,101 $1,277,854
Source:2014KentuckyHorseRacingCommissionAnnualReport
Historicalracewagering(akainstantracing):pari-mutualelectronicgamblingsystemthatallowsplayerstobetonreplaysofhorseracesthathavealreadybeenrun
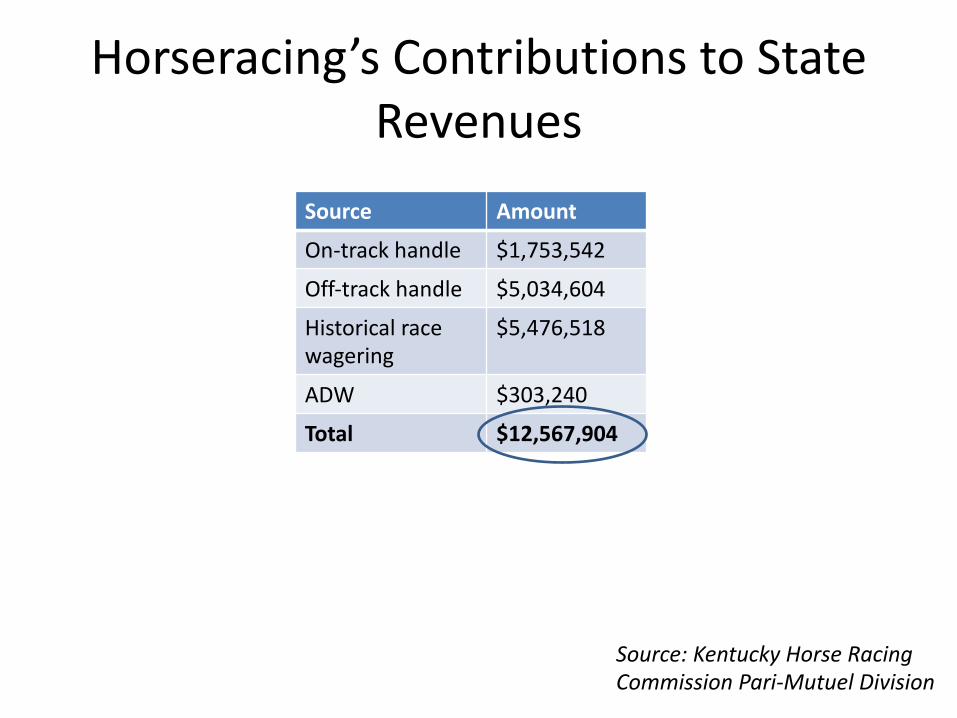
Horseracing’sContributionstoStateRevenues
Source Amount
On-trackhandle $1,753,542
Off-trackhandle $5,034,604
Historicalracewagering
$5,476,518
ADW $303,240
Total $12,567,904
Source:KentuckyHorseRacingCommissionPari-MutuelDivision
Summary
• Kentucky’sequineindustrycontributessignificantlytothestateinmanyways– Economically– Culturally– Aesthetically
Thankyou!Questions?
Sources:• Garkovich,Lori,Brown,KimberlyandZimmerman,JulieN.(2008)'“We'renothorsing
around:”ConceptualizingtheKentuckyHorseIndustryasanEconomicCluster',CommunityDevelopment,39:3,93— 113
• 2012KentuckyEquineSurvey– https://equine.ca.uky.edu/kyequinesurvey• 2014KHRCAnnualReport– http://khrc.ky.gov/reports/Annual%20Report%202014.pdf• KentuckyHorseRacingCommission,Pari-MutuelDivison